the Creative Commons Attribution 4.0 License.
the Creative Commons Attribution 4.0 License.
 | 21 Jul 2025
Effect of rotor induction and peak shaving on energy performance and cost of stationary unmoored floating offshore wind turbines
Aurélien Babarit
Maximilien André
Vincent Leroy
This paper investigates the effect of rotor induction and peak shaving on energy performance and cost of a stationary unmoored floating offshore wind turbine (SUFOWT). A SUFOWT is a floating offshore wind turbine (FOWT) for which a dynamic positioning (DP) system is used in lieu of a mooring system for station-keeping. It is particularly well suited for deployment in the far-offshore.
Previous studies have shown that positive net power production can be achieved with SUFOWTs depending on the number and size of thrusters and on wind turbine characteristics. However, they did not consider the effect of rotor induction or peak shaving. This gap is addressed in the present paper. The study is based on a physical engineering model, the wind turbine rotor design being modelled using the actuator disc theory.
Results show that the rotor induction which maximizes net power production (which takes into account the thrusters' power consumption) is smaller than the value of which maximizes wind turbine power production. However, the increase in the annual energy production or capacity factor brought by rotor induction optimization is rather small, of the order of a few percent. The effect of peak shaving was also found to be small with respect to energy production and capacity factor. Both rotor induction and peak shaving were found to be able to significantly reduce the power ratio (the ratio of the thrusters' nominal power to the wind turbine rated power), which can be expected to be beneficial for the cost of energy.
- Article
(2492 KB) - Full-text XML
- BibTeX
- EndNote


Unmoored floating offshore wind turbines (UFOWTs) have been proposed as alternatives to conventional floating offshore wind turbines (FOWTs) (Tsujimoto et al., 2009; Xu et al., 2021) or as a solution to harness far-offshore wind energy (which is inaccessible for conventional FOWTs) (Alwan et al., 2021; Raisanen et al., 2022; Annan et al., 2023; Santarromana et al., 2024). The key difference between conventional FOWTs and UFOWTs is that UFOWTs use thrusters in lieu of mooring systems for position control. In addition, UFOWTs may be equipped with on-board energy storage systems (e.g. batteries, hydrogen, etc.) to avoid grid-connection. Examples of UFOWT conceptual designs are shown in Fig. 1.
UFOWTs may further be classified as mobile unmoored floating offshore wind turbines (MUFOWTs) or stationary unmoored floating offshore wind turbines (SUFOWTs) depending on whether they are allowed to move in the ocean space. Note that in the case of SUFOWTs, the thrusters and control system is de facto a dynamic positioning (DP) system.
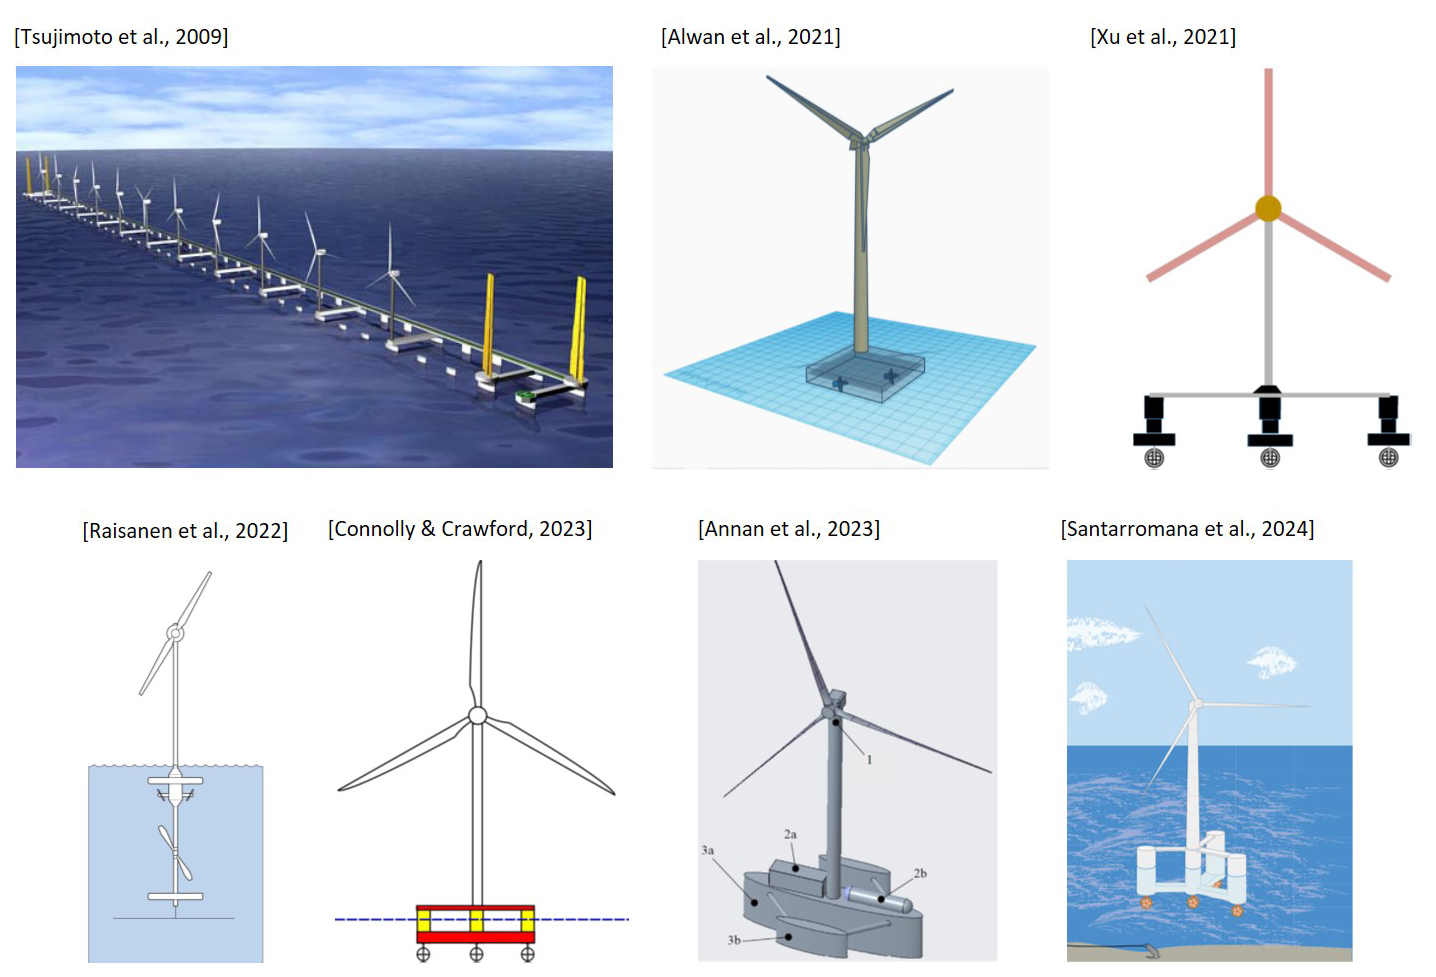
Figure 1Examples of UFOWT conceptual designs.
Obviously, the energy consumed by the thrusters must be smaller than the energy generated by the wind turbine for the UFOWT concept to make sense. Fortunately, previous studies have shown that it can be the case both for MUFOWTs and SUFOWTs. In Xu et al. (2021), a SUFOWT design consisting of the 5 MW NREL wind turbine (Jonkman et al., 2009) mounted on a four-column semi-submersible floater equipped with four 3.6 m diameter thrusters was considered. The thrusters' power was found to be slightly less than 50 % of the power generated by the wind turbine at rated wind speed. Moreover, the power ratio (the ratio of the thrusters' power consumption to the wind turbine generated power) was shown to decrease with increasing thruster diameter and decreasing wind turbine diameter. Using the same SUFOWT design, Connolly and Crawford (2023) found that rated wind speed is the worst-case for the power ratio, because in region II (i.e. from cut-in wind speed to rated wind speed), the aerodynamic thrust increases with the square of the wind speed. In contrast, in region III (between rated wind speed and cut-out wind speed), Connolly and Crawford (2023) found that the power ratio decreases with increasing wind speed, due to the aerodynamic thrust decreasing with increasing wind speed (resulting in the thrusters consuming less power) while the generated power is constant. Alwan et al. (2021) considered a SUFOWT design consisting of a 2 MW wind turbine mounted on a square barge equipped with two 6 m diameter thrusters. Similar results to Connolly and Crawford (2023) were found in region II and the first part of region III, except that the power ratio was found to be of the order of 70 %. The greater power ratio may be explained by the fact that Alwan et al. (2021) used propellers designed for ships (Wageningen B-series screw propellers, Bernitsas et al., 1981) for the thrusters, whereas Xu et al. (2021) used thrusters optimized for dynamic positioning. Moreover, Alwan et al. (2021) found that the power ratio re-increases in the second part of region III because of increasing mean drift forces due to wave action. This effect was not observed in Connolly and Crawford (2023) because their floater design (a semi-sub) is much more transparent to the waves than the barge used by Alwan et al. (2021).
To date, MUFOWT energy performance has been investigated in Tsujimoto et al. (2009), Annan et al. (2023), and Connolly and Crawford (2023). In the latter study, the authors showed that the UFOWT design of Xu et al. (2021) can generate 25 % more energy when allowed to move (MUFOWT) than when it is kept stationary (SUFOWT). However, it is uncertain that this energy gain translates in a similar increase in capacity factor. Indeed, as a MUFOWT's average position changes with time, it can be expected that it would have to be relocated from time to time. The required energy consumption and the energy production loss during relocation is currently unknown, but it could be significant. As mentioned in Connolly and Crawford (2023), the capacity factor optimization of a MUFOWT would require the implementation of a weather-routing algorithm.
A SUFOWT was also considered in Santarromana et al. (2024). The design consisted of a 5, 8, 10, or 15 MW wind turbine mounted on the UMaine VolturnUS-S reference platform (which is a semi-submersible platform) equipped with 1 to 30 DP thrusters. It is shown that the percentage of annual expected turbine energy output that is consumed by the thrusters can be reduced to less than 20 % by increasing the number and diameter of the thrusters. Also, that study pointed out the fact that thruster power consumption in region IV (above cut-out wind speed) is non-zero, mainly because of drag forces on the wind turbine mast and rotor.
From the previous literature, it can be concluded that the energy efficiency of stationary unmoored floating offshore wind turbines depends significantly on
-
the floater design – it should be transparent to the waves to minimize drift forces,
-
the DP system design – it should include as many large diameter thrusters as practicable to maximize their thrust generation efficiency. Note that practicable corresponds essentially to the feasibility of incorporation on the floating platform.
The rotor induction was also identified as a design parameter by Connolly and Crawford (2023) but its effect was not investigated in their study. Moreover, previous studies (Blackford, 1985; Gaunaa et al., 2009) on flow-driven vehicles using rotors for energy conversion have shown that “the rotor design for the these kinds of applications is generally different from the rotor design for maximization of power output for a conventional stationary wind turbine which is close to in order to have a high CP. (Gaunaa et al., 2009)”. A similar conclusion was found for the rotors of the water turbines of energy ships (Babarit et al., 2020). Those works indicate that it is worth investigating the effect of rotor induction on energy efficiency of SUFOWTs, which was the initial aim of the present study. Following a reviewer's comment on a previous version of this paper, this initial objective is complemented by an investigation of the effect of peak shaving as it also corresponds to a knowledge gap.
The remainder of this paper is structured as follows. In Sect. 2, the UFOWT model used in this study is presented. Section 3 focuses on the effect of rotor induction and peak shaving on energy performance, while its effect on the levelized cost of energy is investigated in Sect. 4. Conclusions are summarized in Sect. 5.
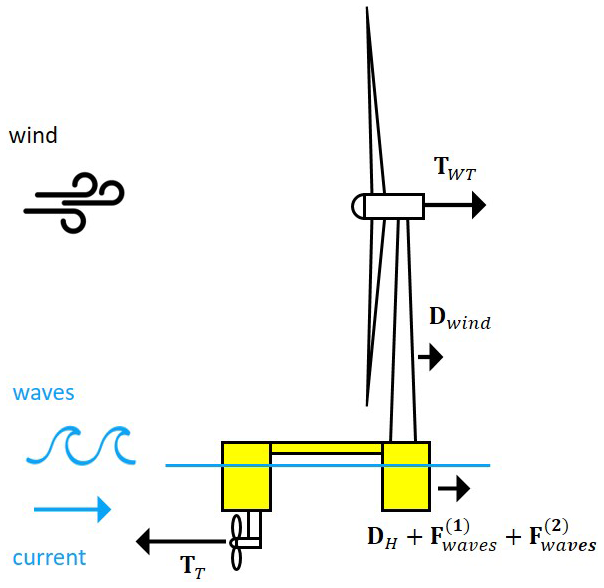
In the most general situation, the forces applying to a SUFOWT (Fig. 2) are
-
the thrust force generated by the rotor of the wind turbine, denoted TWT;
-
the aerodynamic drag force due to wind action on the turbine mast and floater superstructure (emerged part of the floater), denoted Dwind;
-
the thrust force generated by the thrusters of the DP system, denoted TT;
-
a hydrodynamic drag force due to current and floater velocity, denoted DH;
-
wave-induced hydrodynamic forces due to wave action on the submerged part of the floater, denoted Fwaves.
The wave-induced force Fwaves is usually modelled using potential flow theory as the sum of a first-order component and a second-order component :
The first-order component is a time-dependent force whose frequency spectrum is the same as the incident wave. Its time average is zero. The second-order component includes a non-zero component which is the mean drift force and a time-dependent force whose spectrum includes the sum and difference frequencies of the incident wave spectrum. As shown in Alwan et al. (2021), the mean drift force may impact significantly the energy performance of a UFOWT (depending on the platform design and environmental conditions).
The total hydrodynamic force applying to the platform is , as depicted in Fig. 2.
In this study, the aim is to understand the effect of rotor induction and peak shaving on the efficiency of SUFOWTs. Therefore, the following simplifying assumptions are made.
-
The DP system is controlled such that first-order wave forces, first-order platform motion and time-dependent second-order wave forces are not compensated, avoiding having to take them into account. This is typically achieved using wave frequency filtering of the position and velocity measurements (Fossen, 2012).
-
The hydrodynamic drag force and the drift forces are neglected. In practice, the surface current is about 3 % of the wind speed at 10 m height for winds between 5 and 30 m s−1 (Weber, 1983), thus the force due to current is expected to be small. For the drift forces, it is expected that a highly transparent floater is used (e.g. a semi-submersible platform with a reduced water plane area).
-
The aerodynamic drag force is neglected, which is quite acceptable in regions II and III (Santarromana et al., 2024).
-
The wind turbine rotor thrust force and the thrusters' thrust force are perfectly aligned.
-
The UFOWT pitch motion is neglected.
-
The wind is uniform.
Under those assumptions, the thrusters of the DP system have only to counteract the wind turbine rotor thrust force:
2.1 Wind turbine model
The wind turbine is modelled using the actuator disc theory (Manwell et al., 2009). Thus, the wind turbine rotor thrust force and the generated power can be written
where ρa is the air density, A is the turbine swept area, W is the true wind velocity, is the thrust coefficient where a is the rotor induction, and is the theoretical aerodynamic power coefficient from Froude-Rankine actuator disc theory. ηWT is the wind turbine efficiency defined as the ratio of the electrical power generated by the turbine to the theoretical aerodynamic power. It accounts for aerodynamic losses (finite number of blades, drag, tip losses, etc.), mechanical losses (drivetrain efficiency), and conversion losses (generator efficiency). In this study, we used ηWT=75 %, which is a conservative estimate for the efficiency of reference offshore turbines (Jonkman et al., 2009; Allen et al., 2020; Bortolotti et al., 2019; Bredmose et al., 2020).
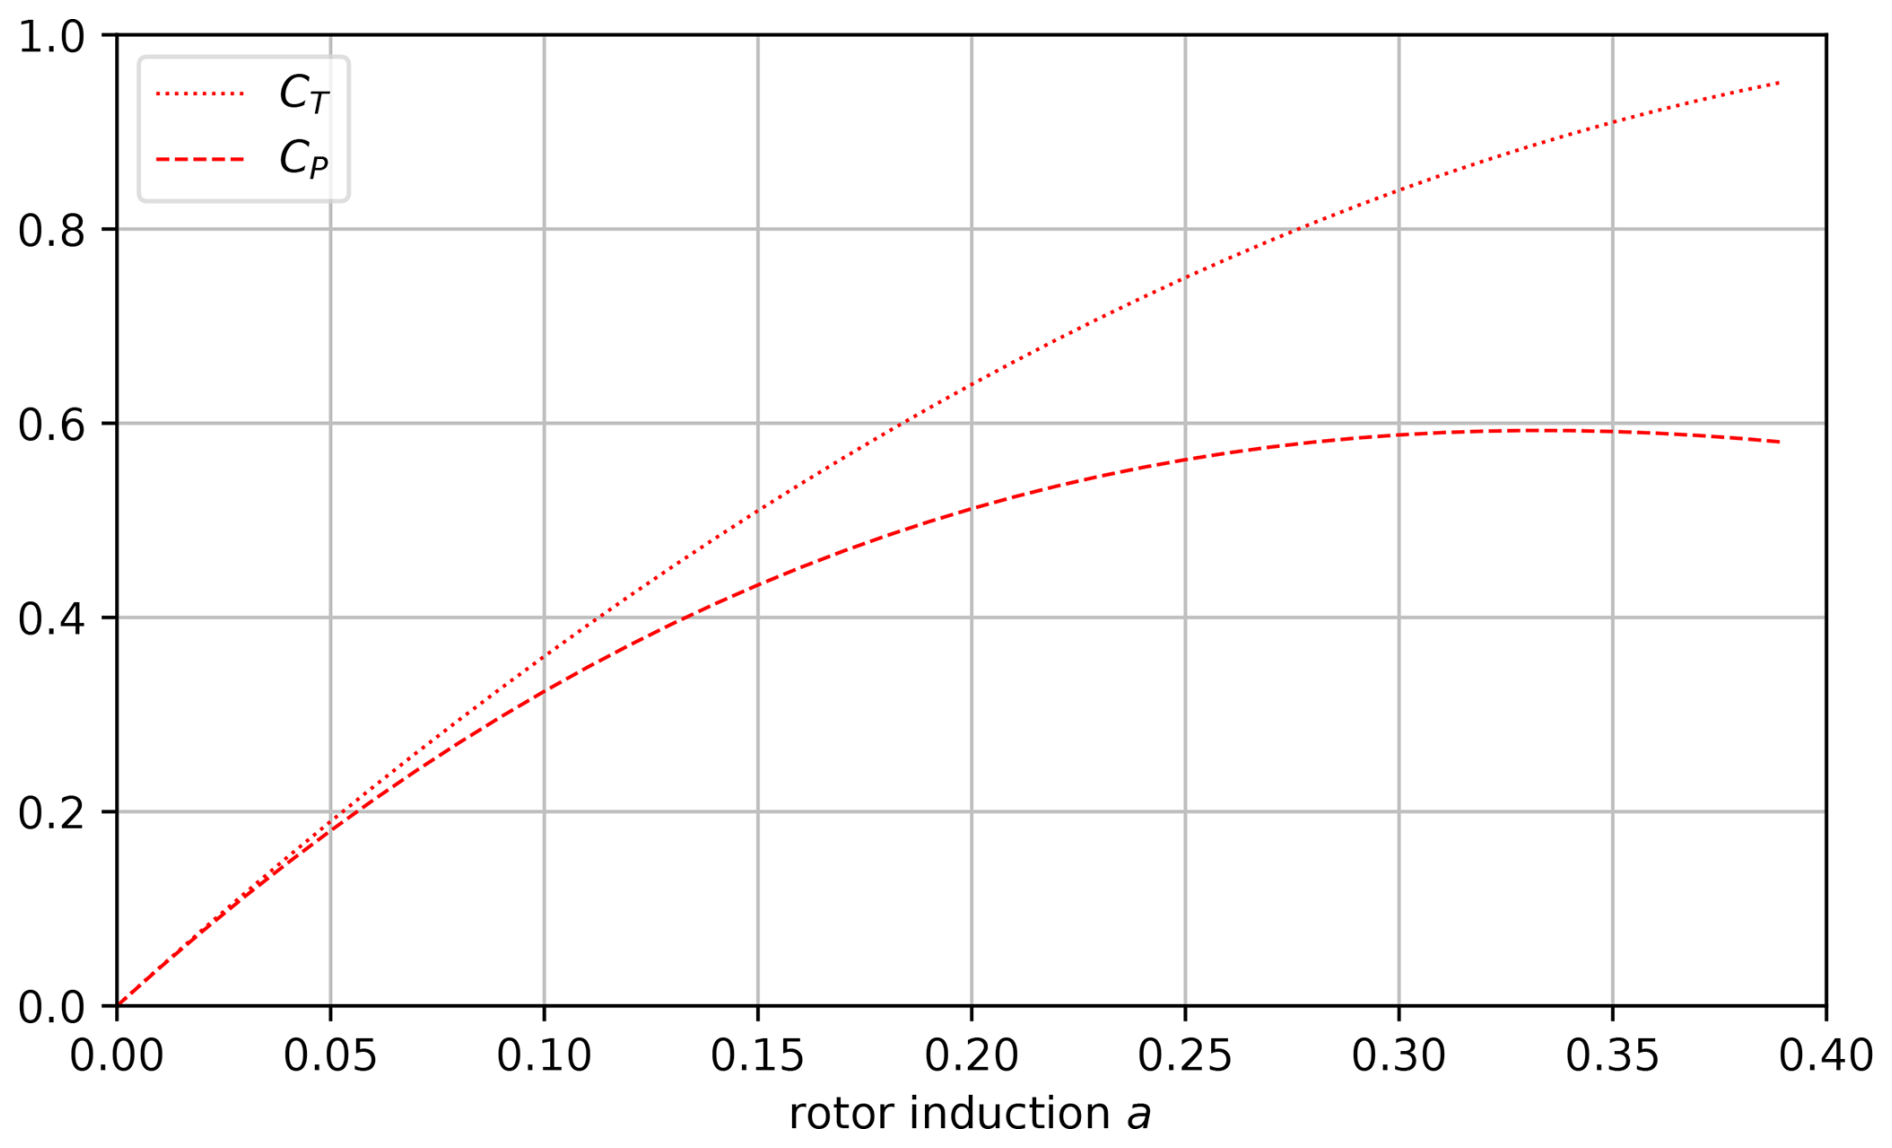
Figure 3Trust and power coefficient as functions of rotor induction of an ideal wind turbine rotor (ηWT=100 %).
It is well known that the theoretical maximum power coefficient of a wind turbine is (Betz's limit). It is achieved for induction . Maximum power coefficient comes at cost of high thrust coefficient, as can be seen in Fig. 3. While it is not a critical challenge when station-keeping does not consume power (as for onshore, bottom-fixed or moored floating offshore wind turbines), the situation is different for UFOWTs, as will be shown in what follows.
For induction above ≈ 0.38, the actuator disc theory is invalid (the thrust coefficient increases with induction) (Glauert, 1926). Therefore, in the present study, rotor induction is limited to the range [0, 0.4].
2.2 Thrusters model
The thrusters model follows the approach used in Santarromana et al. (2024). According to ABS (2024), the thrust T0 (in N) of a ducted propeller can be related to its power consumption P0 (in W) using
where D is the diameter of the thruster propeller (in m) and K is a constant equal to 12.5 kg m−1.
Assuming that the SUFOWT is equipped with N identical thrusters and that they all deliver the same thrust, one can show that the thrusters' total power consumption PT is
3.1 Net power generation and net power coefficient
Equating the wind turbine rotor thrust (Eq. 3) and the thruster-delivered thrust in Eq. (6), the thrusters' power consumption can be written
in which we recognize the wind-generated power divided by the wind turbine efficiency (Eq. 4). Inserting that equation in Eq. (7), one can show
where δ is the surface ratio between the swept areas of the thrusters and the wind turbine rotor:
Note that the term in Eq. (8) corresponds to the power ratio (that is, the ratio of the thrusters' power consumption to the wind turbine generated power).
The net power generation Pnet is the difference between the power generated by the wind turbine and the thrusters' power consumption. Thus, combining Eqs. (4) and (8), the net power generation reads
This last equation complies with the observations in previous studies that the net power generation increases when reducing the wind turbine diameter/surface area A or increasing the diameter D and/or number of thrusters N (Alwan et al., 2021; Xu et al., 2021; Santarromana et al., 2024). Indeed, both lead to an increase of the surface ratio δ and thus a reduction of power self-consumption in Eq. (10).
Now let us consider the net power coefficient CP,net. It reads
The maximum of CP,net is not as easy to determine as for a conventional wind turbine. Moreover, it depends on the surface ratio δ and the wind turbine efficiency ηWT. Table (1) shows the surface ratio corresponding to designs that have been investigated in the literature. One can see that its order of magnitude varies in the range 0.001–0.1.
Alwan et al. (2021)Xu et al. (2021)Santarromana et al. (2024)Table 1Characteristics of SUFOWT designs considered in the literature.
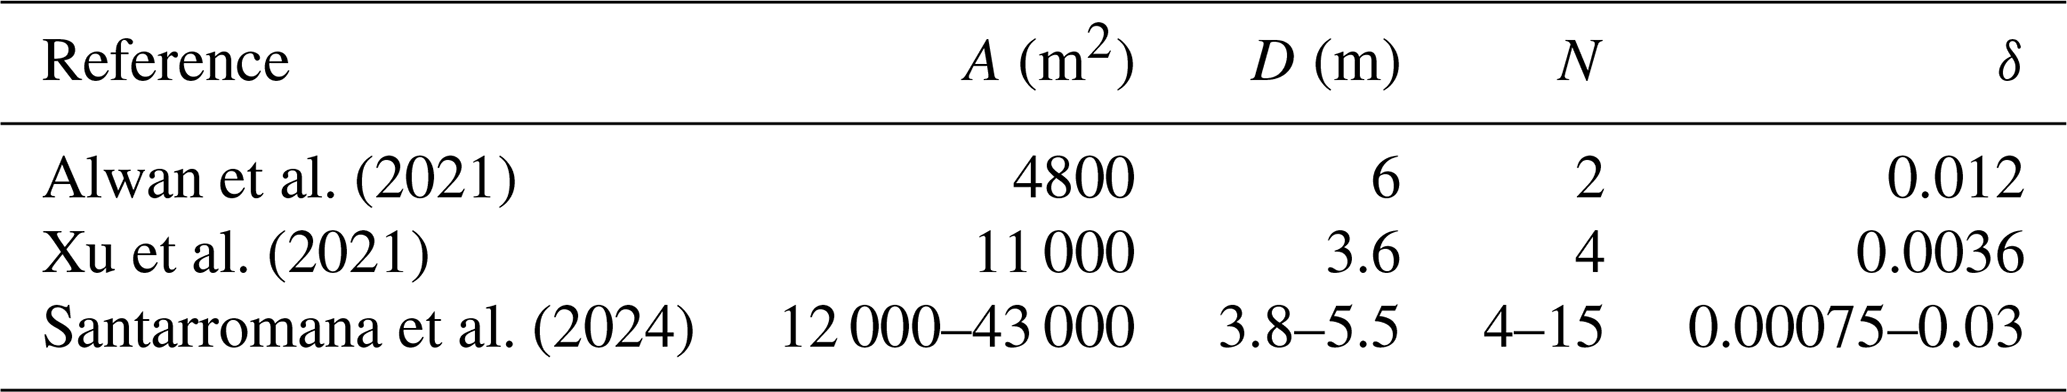
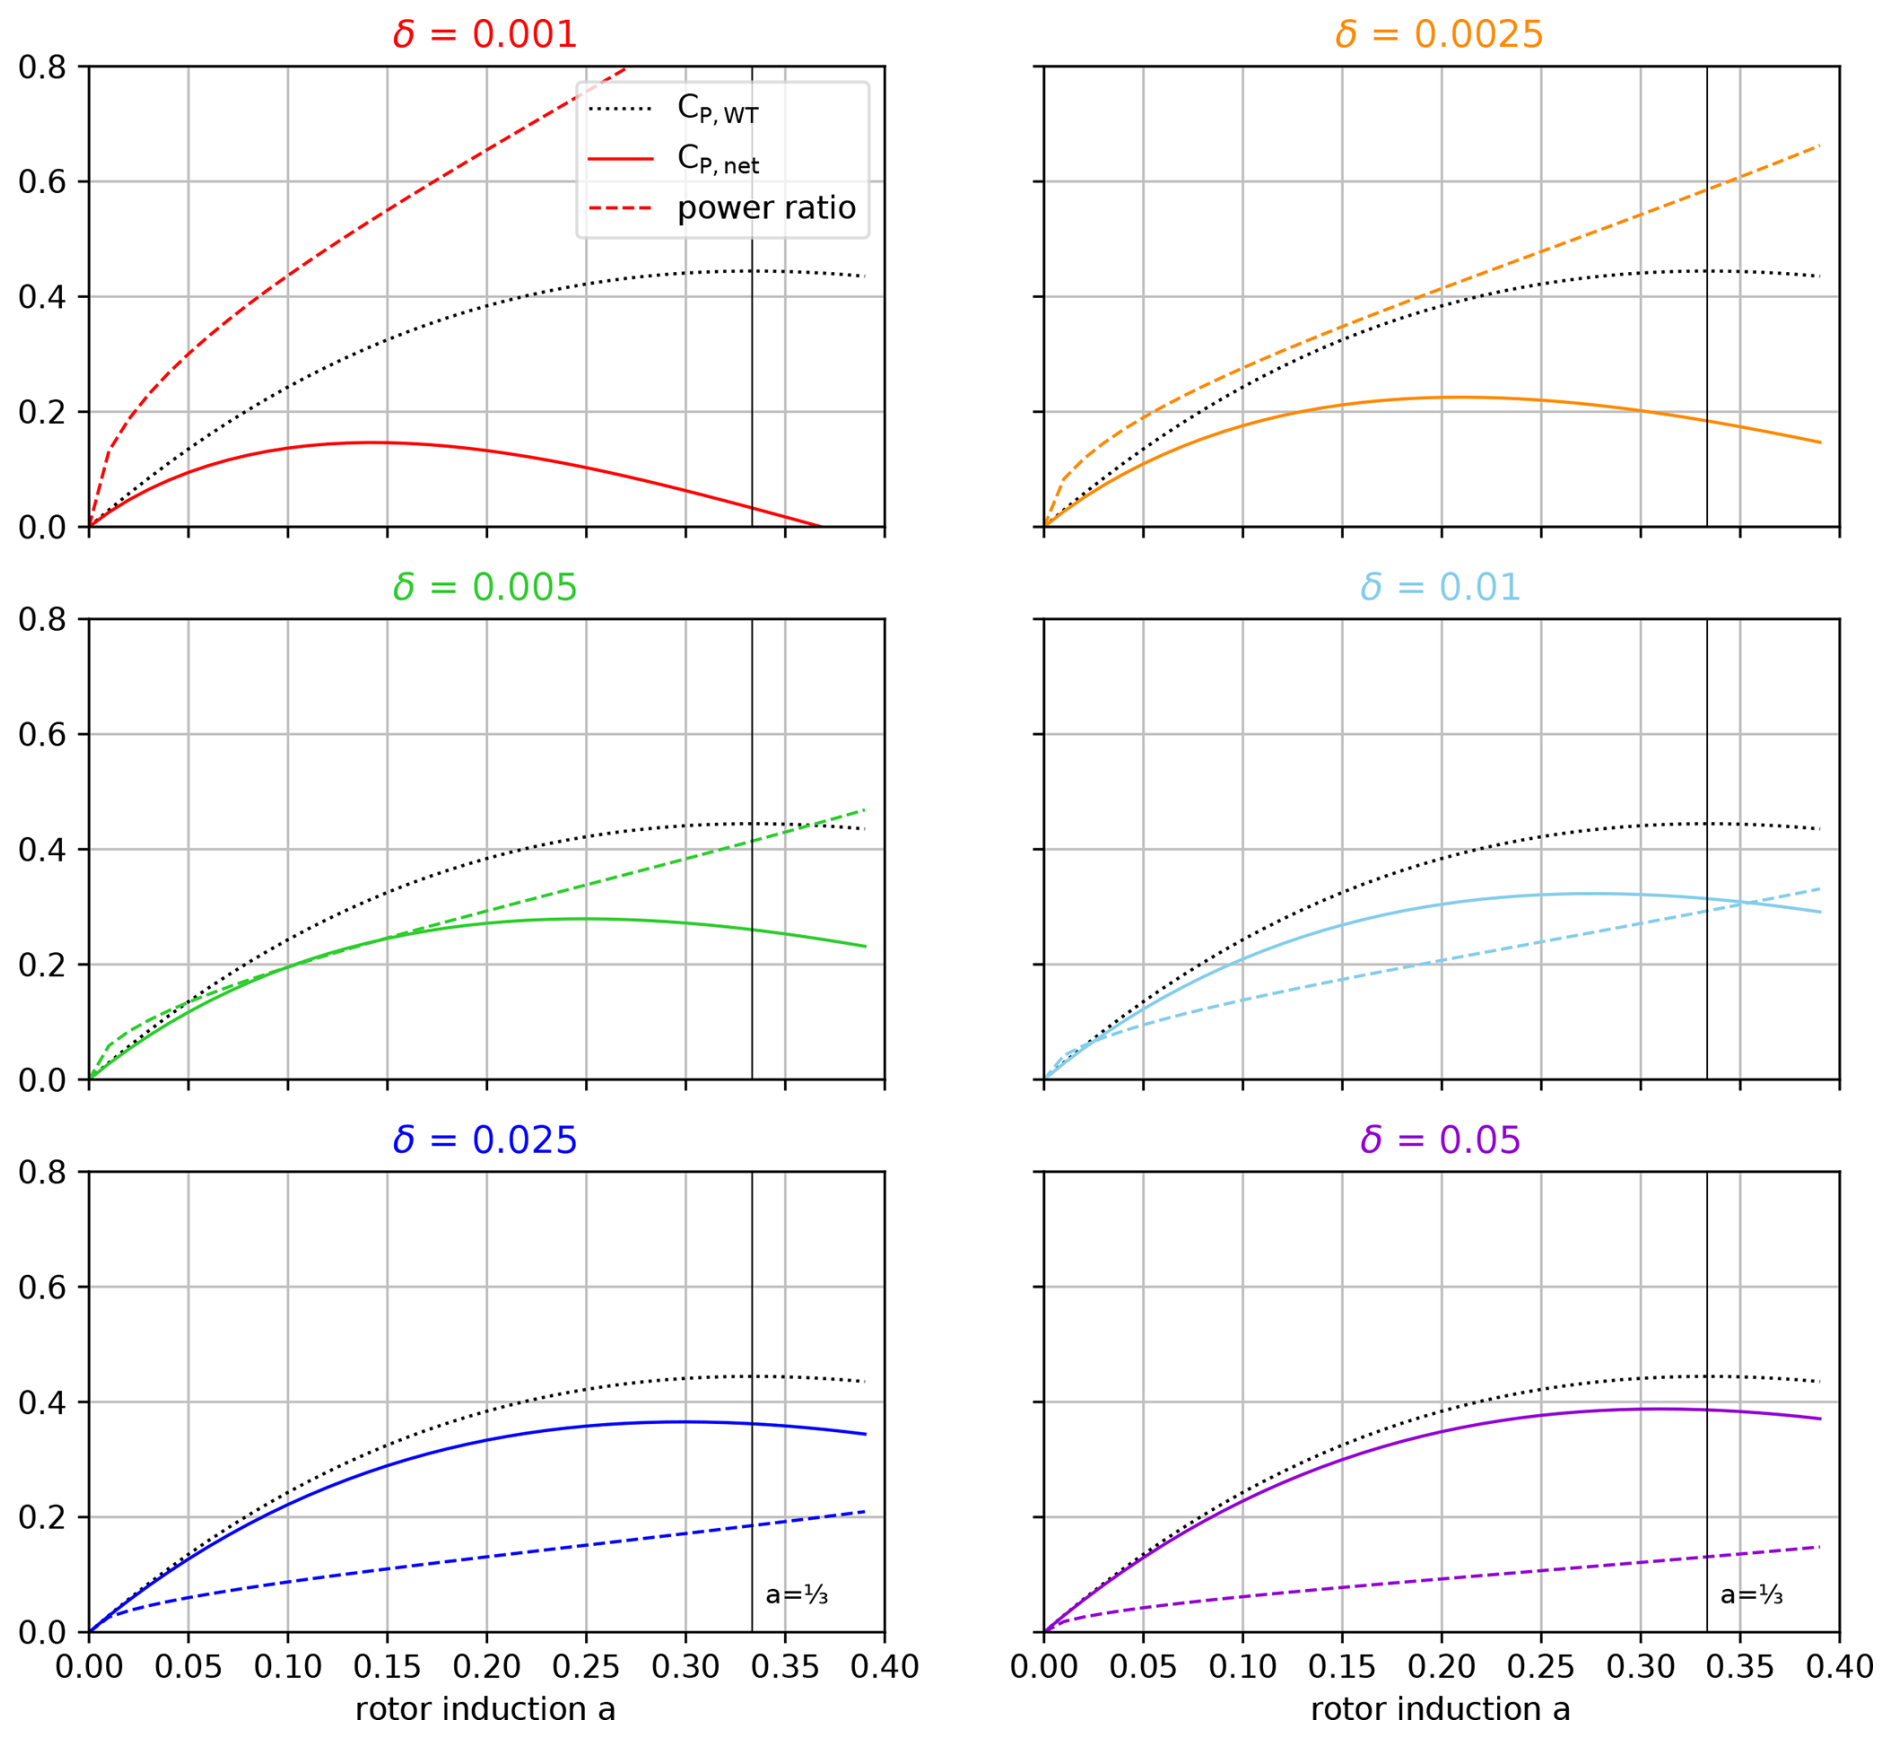
Figure 4Net power coefficient (solid line) and power ratio (dashed line) of a stationary unmoored floating offshore wind turbine as functions of rotor induction and surface ratio. The dotted black line is the power coefficient of the wind turbine.
Figure 4 shows the net power coefficient and power ratio as a function of the rotor induction for various surface ratios δ in the range 0.001 to 0.05. One can see that whatever the surface ratio is, the induction that maximizes the power coefficient is smaller than . For δ=0.05, the optimal induction is approximately 0.31, for which the net power coefficient is approximately 0.388. This is, however, little different to the net power coefficient for , which is 0.387 (−0.3 %). The difference is more significant for smaller surface ratios. For δ=0.01, the optimal net power coefficient is 0.323, whereas the net power coefficient at induction is 0.315 (−2.5 %). For δ=0.0025, the optimal net power coefficient is reached at a=0.21 and is 21 % greater than the power coefficient at induction .
Figure 4 shows that another advantage of optimizing the rotor induction is that the power ratio also reduces. For δ=0.05, the power ratio for the optimized induction is 4.5 % smaller than that for . For δ=0.01, it is 11 %. For δ=0.0025, it is 27 %. Thus, optimizing rotor induction for the SUFOWT application becomes increasingly beneficial for the power ratio as the surface ratio decreases. This is important because the power ratio reflects the power requirement from the thrusters, which relates to their cost.
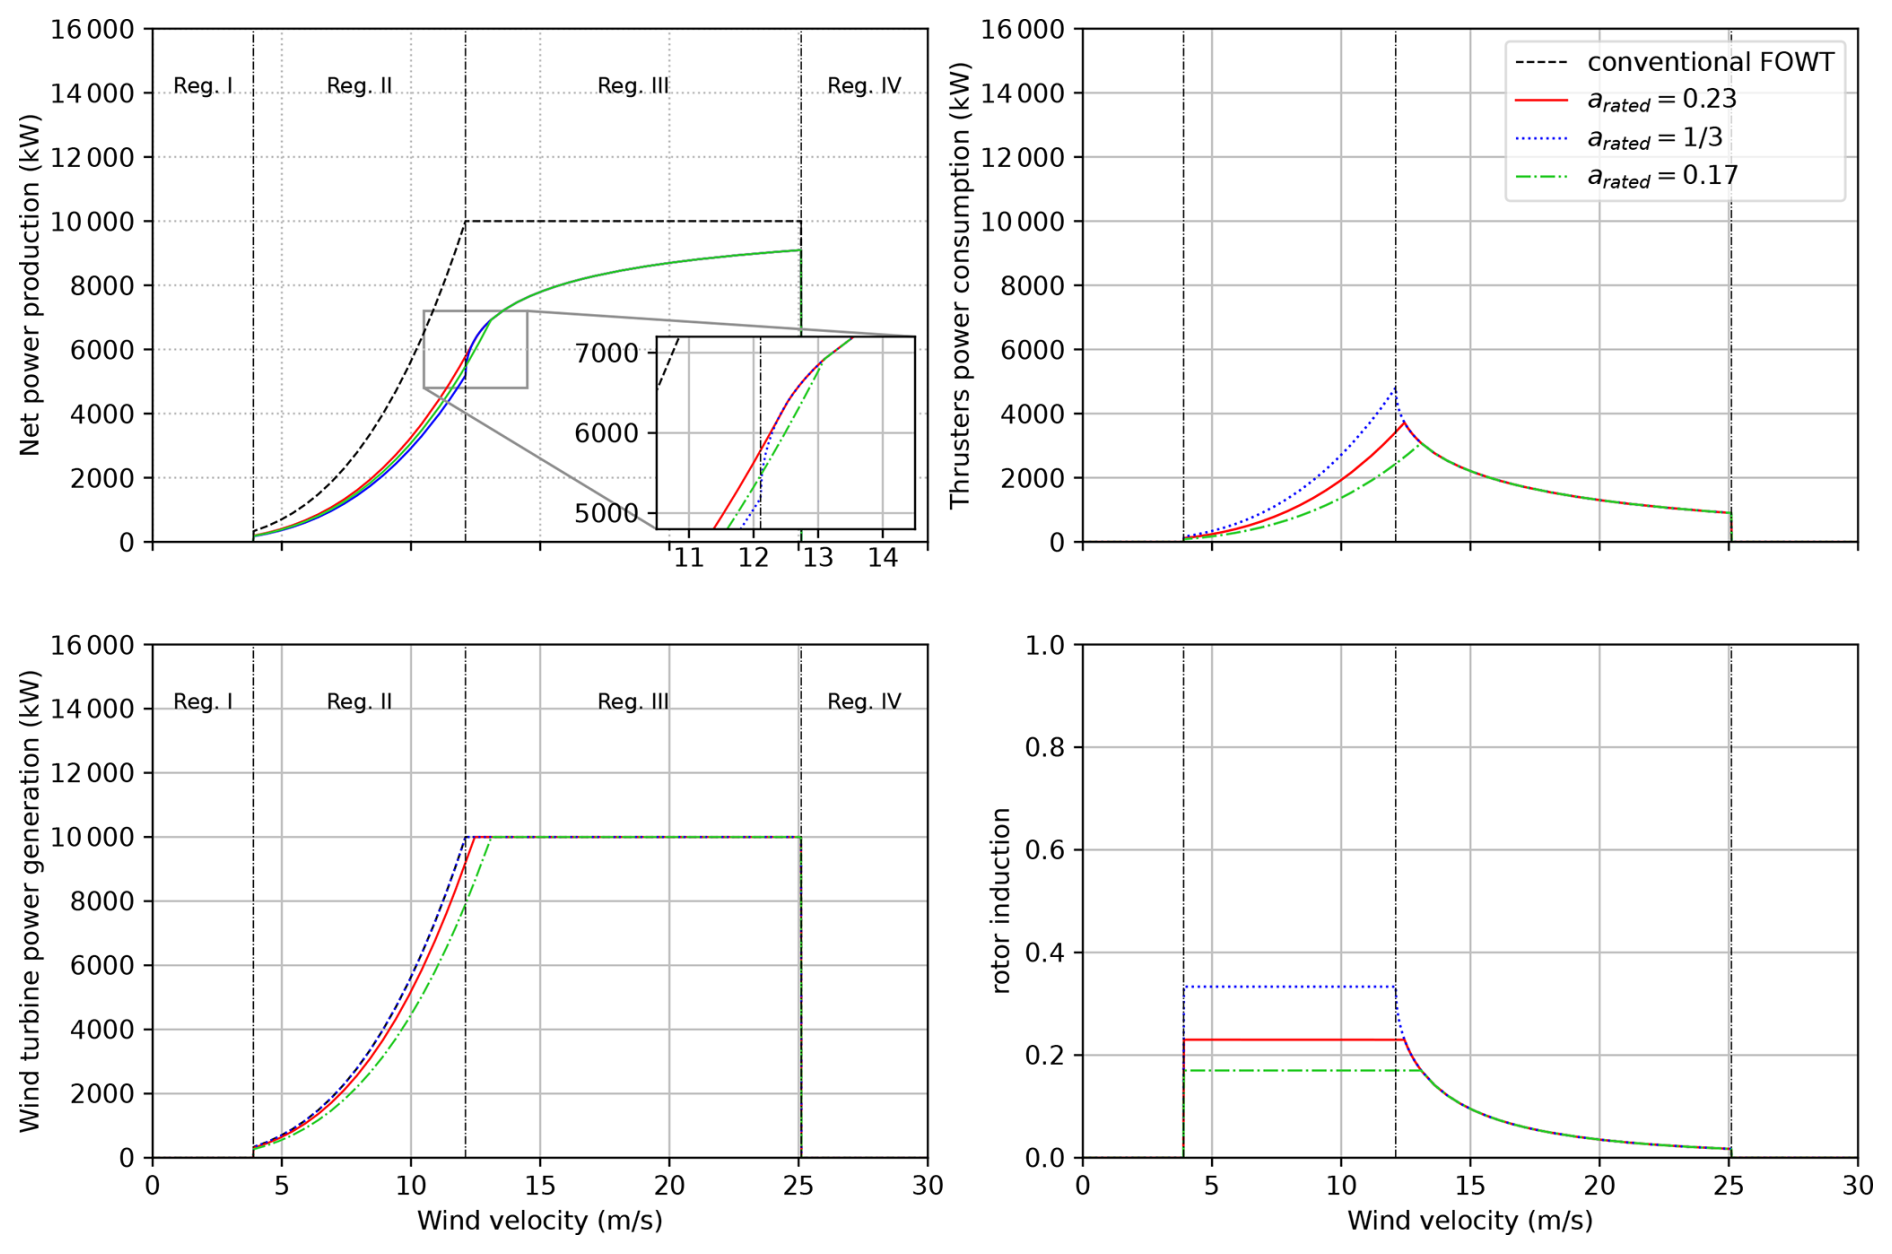
Figure 5Power performance curves of an example SUFOWT as functions of wind velocity and rotor induction (arated). The regions of operation in the top left corner are for the conventional FOWT. No peak shaving is applied.
3.2 UFOWT power curves
A wind turbine power curve represents the power that it can produce as a function of a stationary hub-height wind speed. It is split into four main regions and two transition regions.
Region I corresponds to wind speed below the cut-in wind speed Wcut-in. In that region, the wind turbine does not operate. Thus, the rotor induction is 0. In Region II (between the cut-in wind speed and the rated wind speed Wrated, for which the wind turbine power reaches its rated power PWT,rated), the wind turbine controller seeks to maximize power production. Thus, the rotor induction is equal to the rated rotor induction arated. The rated wind speed Wrated is the solution of
Note that the rated wind speed depends on the rated rotor induction arated in Eq. (12).
Region III corresponds to wind speeds between the rated wind speed and the cut-out wind speed Wcut-out. In this region, the wind turbine controller aims at keeping the generated power constant and equal to the rated power. Thus, the rotor induction reduces with increasing wind speed. Above the cut-out wind speed Wcut-out (Region IV), the wind turbine does not operate. Thus, the rotor induction is 0, as in Region I.
In addition to those four main regions, the power curves of modern wind turbines feature two transition regions in order to reduce power and load fluctuations during the switching of control regions. Region II- corresponds to wind speeds near the rated wind speed. In this region, peak shaving is applied to avoid the sharp apex in thrust which occurs near the rated wind speed. The effect on rotor induction is that it is reduced in comparison to what it would be without peak shaving applied.
Region I- corresponds to wind speeds near the cut-in wind speed, for which the wind turbine operation is constrained by the minimum rotational velocity of the rotor. Region I- is not taken into account in the present study.
For the SUFOWT concept considered in this study, the power curve is given by Eq. (10). Following the discussion above on the behaviour of rotor induction as a function of operating region, the induction in Eq. (10) can be written
where
-
WII is the solution of
where TII-1/2 is the limit thrust force above which peak shaving is applied;
-
a*(W) is the solution of
-
WIII (and a*(WIII)) are the solutions of
-
is the solution of
The limit thrust force is taken as a percentage of the aerodynamic thrust force for rotor induction :
where is the peak shaving coefficient and is the rated velocity for induction . Note that κ=1 corresponds to the case where there is no peak shaving applied.
Figures 5 and 6 show examples of power curves calculated using Eq. (13). In both examples, the wind turbine diameter is 164 m, corresponding to a rotor disc area A≈ 21 000 m2. The efficiency is ηWT=75 %. The rated power is kW, the cut-in wind speed is Wcut-in=4 m s−1, and the cut-out wind speed is Wcut-out=25 m s−1. The surface ratio is taken equal to δ=0.0037 to match that of the cost-optimal design of Santarromana et al. (2024). Three rated rotor induction arated have been considered: 0.17, 0.23, . The corresponding rated wind speeds are 13.1, 12.4, and 12.1 m s−1. arated=0.23 corresponds approximately to the value that maximizes the net power coefficient according to Eq. (11). Results for arated=0.17 are also plotted for the sake of comparison. The difference between Figs. 5 and 6 is that in Fig. 5, no peak shaving is applied (κ=1), whereas peak shaving is applied in Fig. 6. The peak shaving coefficient κ was taken equal to 0.8 in Fig. 6, which corresponds to the default value of the ROSCO controller (Abbas et al., 2022).
As expected, the net power production is greatest for arated=0.23 in Region II in both examples. However, in Region III (Region II-1/2 when peak shaving is applied), one can see that the net power production increases very rapidly with increasing wind velocity for , eventually leading to the net power production being the same as for arated=0.23 as soon as the wind velocity is greater than 12.4 m s−1 without peak shaving (11.8 m s−1 when peak shaving applied).
For arated=0.17, one can see that the net power is greater than that for for all wind speeds in Region II in both examples. However, contrary to arated=0.23, the net power is smaller than that for in the beginning of Region III or Region II- depending on peak shaving. Above 13.1 m s−1, the net power is the same.
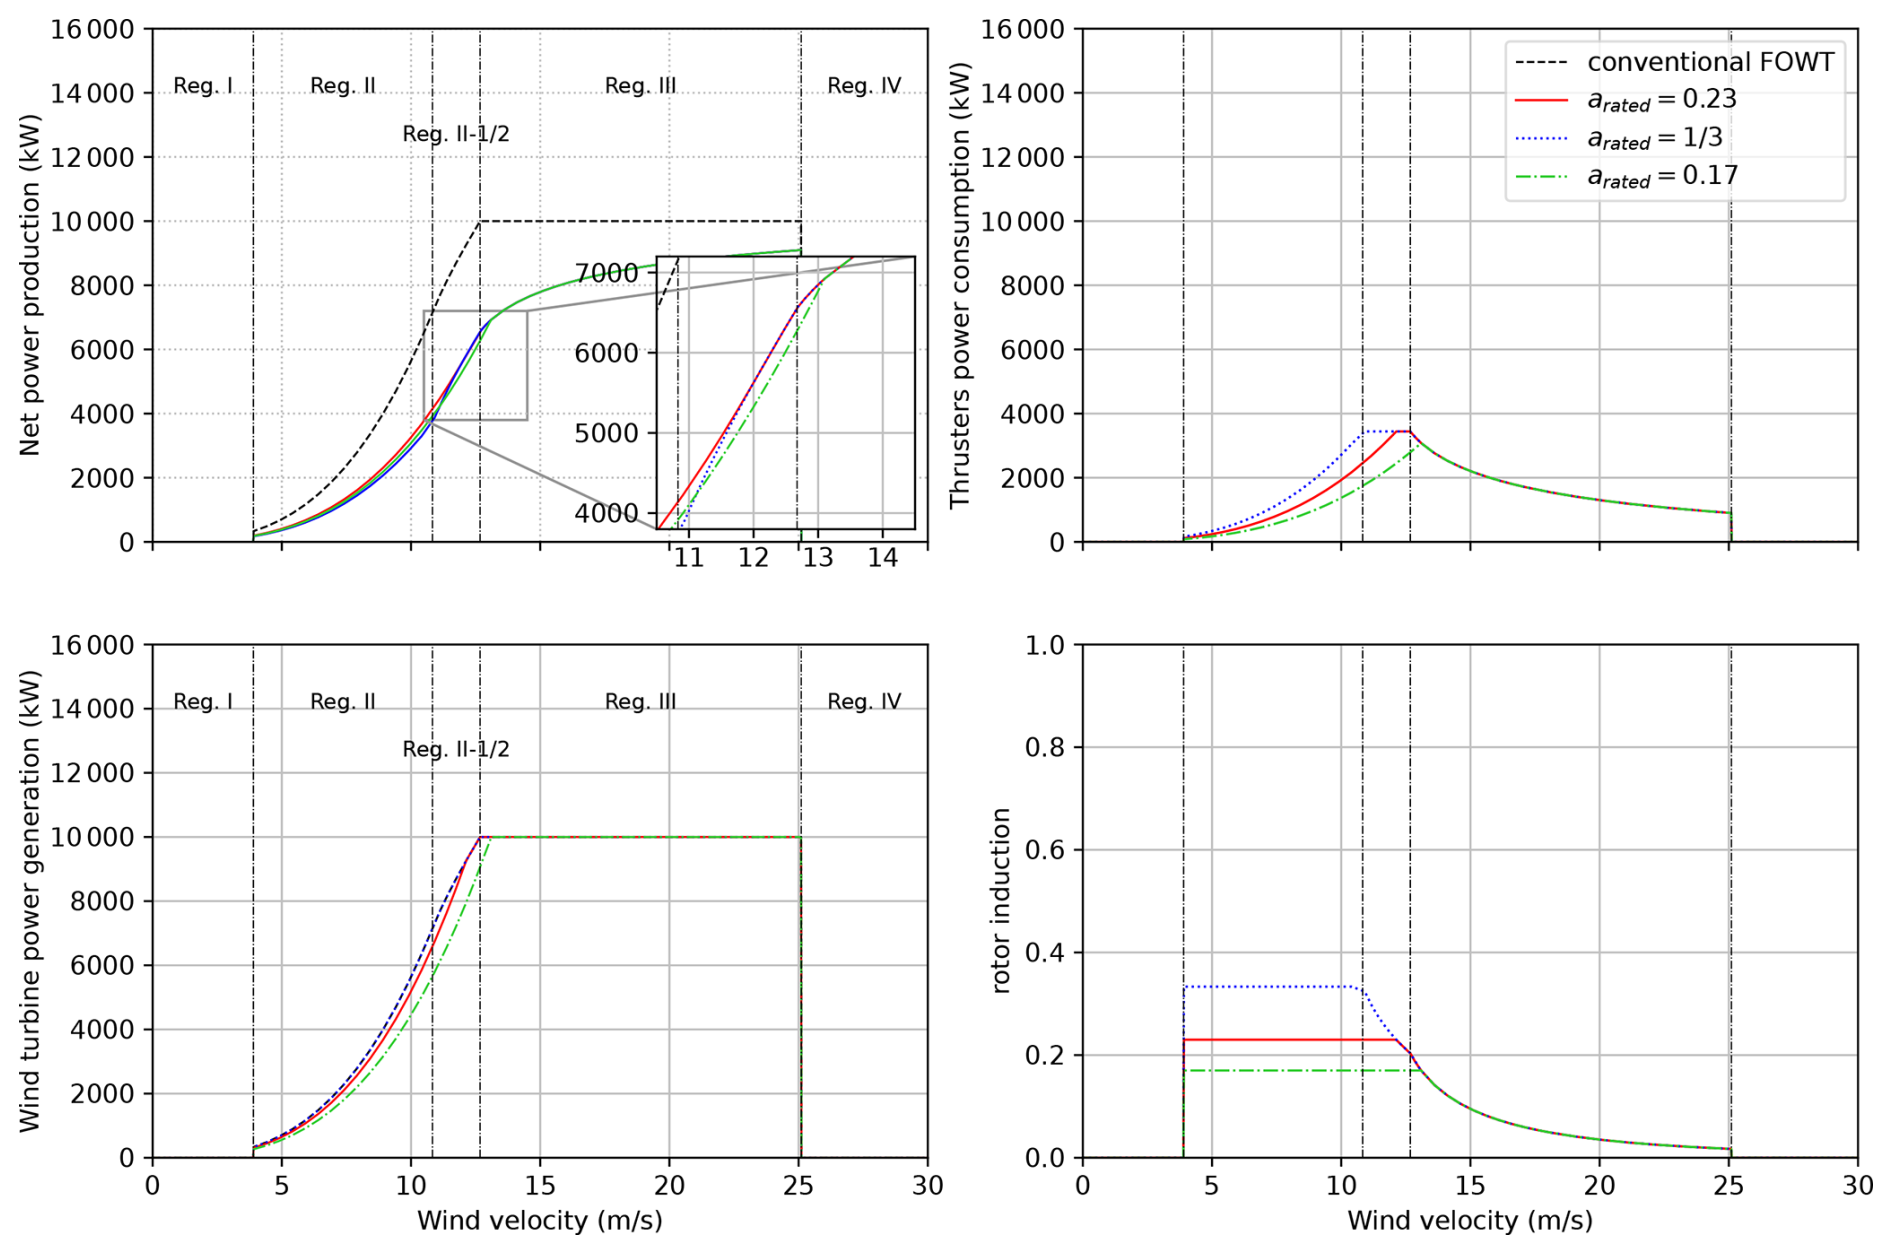
Figure 6Power performance curves of an example SUFOWT as functions of wind velocity and rotor induction (arated). The regions of operation in the top left corner are for the conventional FOWT. Peak shaving is applied with peak shaving coefficient κ=0.8.
3.3 Net annual expected energy production
The net annual expected energy production Enet is estimated according to
where we count 8760 h in a year, f is the wind probability density function, and Pnet is the UFOWT power curve.
In this study, a site with class 8 wind resource is considered (NREL, 2024). The probability density function follows a Weibull distribution. The mean wind speed is 9.41 m s−1.
The net capacity factor is derived from the net annual expected energy production using
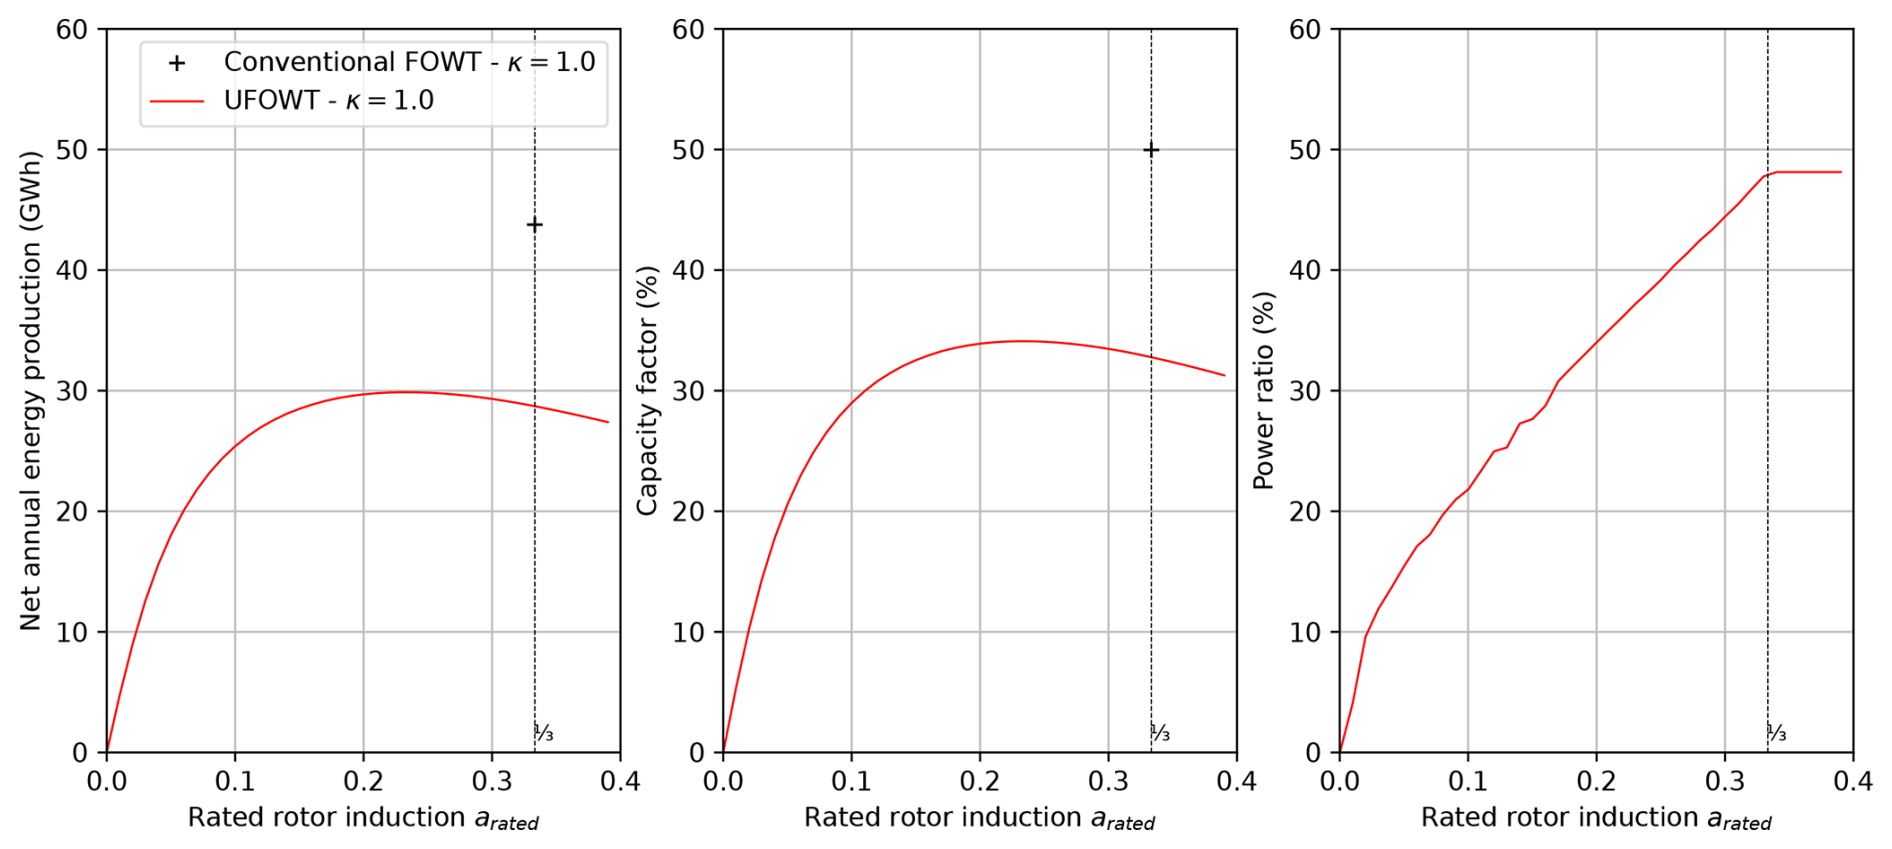
Figure 7Net annual expected energy production, capacity factor, and power ratio as functions of the rotor induction (arated). The surface ratio is δ=0.0037. No peak shaving is applied.
Figure 7 shows the net annual expected energy production, capacity factor and power ratio as a function of the rated rotor induction arated for the same example SUFOWT as in the previous section. No peak shaving is applied (κ=1). One can see that is not optimal for the energy production. Indeed, the maximum annual energy production of 29.9 GW h is obtained for rated rotor induction arated=0.23. In comparison, the annual energy production at is 28.8 GW h (−3.7 %). Note that the annual energy production is 32 % smaller than that of a conventional FOWT based on the same wind turbine as the SUFOWT (43.8 GW h).
The SUFOWT maximum capacity factor is 34.1 %. It is reached for arated=0.23. In comparison, the capacity factor for is 32.9 % (−3.5 %). That of the conventional FOWT is 50.0 % (+46.7 %).
In addition to increasing energy production, another positive aspect of optimizing rotor induction of SUFOWTs is that it reduces the power ratio. It is shown in the right panel in Fig. 7, where it can be seen that the power ratio for is 47.8 %, while it reduces to 37.8 % (−22 %) for arated=0.23.
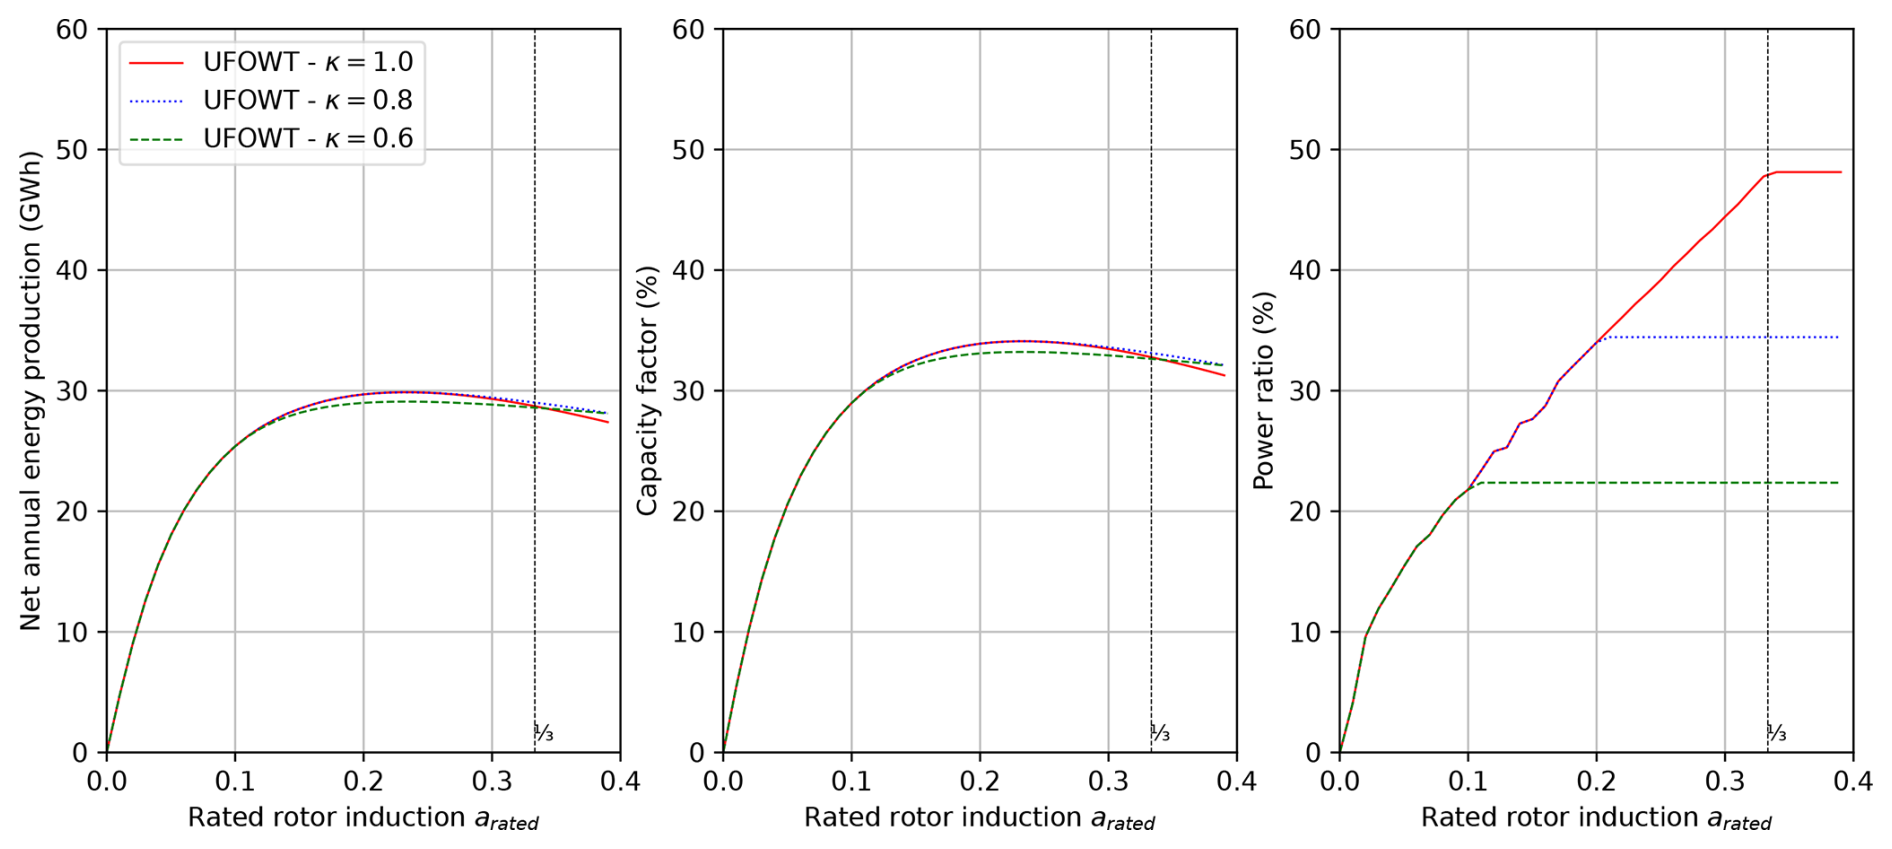
Figure 8Net annual expected energy production, capacity factor, and power ratio as functions of the rotor induction (arated) and peak shaving coefficient. The surface ratio is δ=0.0037.
Figure 8 shows the net annual expected energy production, capacity factor and power ratio as a function of the rated rotor induction arated and peak shaving coefficient. One can see that the effect of peak shaving on energy production and capacity factor is small. is not optimal for energy production for any peak shaving coefficient among those which were considered. Near the optimal rated rotor induction (arated≈0.23), the net annual energy production and capacity factor without peak shaving (κ=1) and with peak shaving with coefficient κ=0.8 are almost the same (< 0.02 % difference). It can be explained by the very limited effect of peak shaving on the thrusters' power consumption (as can be seen by comparing the top right panels in Figs. 5 and 6). Thus, for arated≈0.23, the power ratios (right panel in Fig. 8) are almost the same for κ=0.8 and κ=1. Note that for κ=0.6, the power ratio for arated≈0.23 is reduced by 35 %, while the net annual energy production and capacity factor only reduce by 2.6 %.
The effect of peak shaving with κ=0.8 is much more significant for . Indeed, the power ratio is reduced by 28 %, while in the meantime the energy production increases slightly (+1 %) (28.8 GW h for κ=1 vs. 29.1 GW h for κ=0.8). Thus, peak shaving with κ=0.8 reduces the already small difference in energy production between optimal rated induction (arated≈0.23) and wind turbine maximizing power coefficient . Moreover, results for κ=0.6 show that the power ratio can be reduced even further with minimal impact on net energy production. Indeed, the power ratio for κ=0.6 for is 53 % smaller than for κ=1, while energy production is only 0.6 % smaller.
In the previous section, we showed that it is possible for a SUFOWT to achieve power performance close to that of a conventional FOWT provided that the surface ratio is sufficiently large (Fig. 4). However, maximizing the surface ratio does not necessarily lead to the lowest levelized cost of energy (LCOE), because the increase in energy production may not pay off for the increase in capital and operational expenditures resulting of an increase in the number of thrusters or the thrusters' diameter. This is exemplified in Santarromana et al. (2024), in which the number of thrusters, their diameter, and the wind turbine size of a SUFOWT were optimized with respect to LCOE. Their best configuration is an 8 MW wind turbine with four 5 m diameter thrusters even though up to thirty 5.5 m diameter thrusters were possible in the optimization.
In the previous section, we also investigated the effect of rated rotor induction and peak shaving on energy production. The effect on annual energy production was found to be small (a few percent) for rotor induction in the range [0.2–]. However, the effect was found to be much greater for the power ratio: reducing rated rotor induction from to 0.23 or reducing peak thrust by 20 % (κ=0.8) reduced the power ratio by approximately 30 %. Power ratio being related to thruster cost, reducing rated rotor induction or peak thrust may be expected to be beneficial for the cost of energy (depending on how thrusters cost scales with nominal input power).
Therefore, one may wonder whether the LCOE optimization method described in Santarromana et al. (2024) may lead to different optimal configurations if changing the rated rotor induction or if applying peak shaving. All other things being equal, it would not be the case, because the DP thrusters that they considered are actually way oversized in terms of nominal power. Indeed, the maximum thrust of the 8 MW wind turbine is 1060 kN. Thus, each of the four 5 m diameter thrusters of their optimal configuration has to deliver 215 kN to keep the platform stationary. It corresponds to 450 kW maximum power consumption according to Eq. (5). It is 10 times smaller than the 4500 kW nominal input power of those 5 m diameter thrusters (see Table 4 in Santarromana et al., 2024). Other thrusters with a similar diameter but lower nominal input power, which should be cheaper, could not be selected in their optimization because they were not included in the optimization space. Therefore, reducing rated rotor induction or applying peak shaving, which would only result in lower power consumption, would not change the optimal configuration result of Santarromana et al. (2024).
This analysis indicates that the development of thrusters of large diameter and low nominal input power is needed for LCOE optimization of SUFOWTs. Indeed, should such thrusters be significantly cheaper than existing DP thrusters, they could reduce LCOE through either reduced thruster cost or a greater number of thrusters for the same cost. The latter option may actually be the most favourable as it would increase the net power coefficient (thanks to a greater surface ratio, see Fig. 4). Moreover, reducing rated rotor induction or applying peak shaving could allow even cheaper lower nominal input power thrusters to be used, thus further improving LCOE through the mechanisms aforementioned. Nevertheless, this depends on the cost of such thrusters. With the current lack of data or a cost model for these, it is unfortunately not possible to assess precisely how much it could reduce LCOE.
In this study, we investigated the effect of wind turbine rotor induction, peak shaving, and thruster configuration (diameter and number) on the energy performance and cost of energy of a stationary unmoored floating offshore wind turbine (SUFOWT). The approach is based on an engineering model.
Mathematical relationships for energy performance were developed. They show that
-
a key parameter of SUFOWT energy performance is the surface ratio (ratio of the thrusters propellers swept area to the turbine swept area),
-
the energy performance of SUFOWTs tends to that of conventional FOWTs when the surface ratio is large.
However, a large surface ratio requires a large number of thrusters and/or thrusters with a large diameter, which can lead to a sub-optimal SUFOWT design from the cost of energy perspective. For realistic surface ratios, our results show that the rotor induction which maximizes the net power coefficient (which takes into account the thrusters' power consumption) is significantly smaller than the value of which maximizes the wind turbine power coefficient. However, the increase in annual energy production or capacity factor brought by rated rotor induction optimization is rather small, of the order of a few percent. Another positive and perhaps more important aspect of optimizing rotor induction of SUFOWTs is that the power ratio (the ratio of the thrusters' nominal power to the wind turbine rated power) is reduced by −22 % for optimal rotor induction in comparison to rotor induction.
The effect of peak shaving on energy production was also investigated. This effect was also found to be small for energy production, capacity factor, and optimal rotor induction. However, the effect on the power ratio is much more noticeable, as, for example, a peak shaving coefficient of 80 % reduces the power ratio up to 28 % depending on the rated rotor induction.
Power ratio and thruster cost being related, optimizing rated rotor induction and/or applying peak shaving may be expected to be beneficial for the cost of energy (as they would reduce the thrusters' maximum power requirement). However, this benefit cannot be exploited with existing thrusters as their nominal power is 10 times greater than what is needed for SUFOWTs. Therefore, a perspective for SUFOWT cost of energy reduction is the development of dedicated thrusters.
Code and data will be made available on request.
AB: conceptualization, methodology, software, investigation, formal analysis, writing – original draft, writing – review and editing, visualization, funding acquisition. MA: methodology, writing – review and editing. VL: methodology, writing – review and editing.
The contact author has declared that none of the authors has any competing interests.
Publisher’s note: Copernicus Publications remains neutral with regard to jurisdictional claims made in the text, published maps, institutional affiliations, or any other geographical representation in this paper. While Copernicus Publications makes every effort to include appropriate place names, the final responsibility lies with the authors.
The authors would like to thank the anonymous reviewers for their helpful comments and feedback, which greatly strengthened the section of the paper about the cost of energy.
This research has been supported by the Conseil Régional des Pays de la Loire.
This paper was edited by Maurizio Collu and reviewed by two anonymous referees.
Abbas, N. J., Zalkind, D. S., Pao, L., and Wright, A.: A reference open-source controller for fixed and floating offshore wind turbines, Wind Energ. Sci., 7, 53–73, https://doi.org/10.5194/wes-7-53-2022, 2022. a
ABS: Guide for Dynamic Positioning Systems, Tech. Rep., American Bureau of Shipping, Spring, Texas, USA, https://ww2.eagle.org/content/dam/eagle/rules-and-guides/ (last access: 18 July 2025) 2024. a
Allen, C., Viselli, A., Dagher, H., Goupee, A., Gaertner, E., Abbas, N., Hall, M., and Barter, G.: Definition of the UMaine VolturnUS-S Reference Platform Developed for the IEA Wind 15-Megawatt Offshore Reference Wind Turbine, Tech. Rep. NREL/TP-5000-76773, National Renewable Energy Laboratory, Golden, CO, USA, https://www.nrel.gov/docs/fy20osti/76773.pdf (last access: 18 July 2025), 2020. a
Alwan, R., Babarit, A., and Gilloteaux, J.-C.: Investigation of a Dynamically Positioned Floating Offshore Wind Turbine Concept, J. Phys. Conf. Ser., 2018, 012001, https://doi.org/10.1088/1742-6596/2018/1/012001, 2021. a, b, c, d, e, f, g, h
Annan, A. M., Lackner, M. A., and Manwell, J. F.: Multi-objective Optimization for an Autonomous Unmoored Offshore Wind Energy System Substructure, Appl. Energ., 344, 121264, https://doi.org/10.1016/j.apenergy.2023.121264, 2023. a, b
Babarit, A., Clodic, G., Delvoye, S., and Gilloteaux, J.-C.: Exploitation of the Far-Offshore Wind Energy Resource by Fleets of Energy Ships – Part 1: Energy Ship Design and Performance, Wind Energ. Sci., 5, 839–853, https://doi.org/10.5194/wes-5-839-2020, 2020. a
Bernitsas, M. M., Ray, D., and Kinley, P.: KT KQ and Efficiency Curves for the Wageningen B-Series Propellers, Tech. Rep., University of Michigan, Ann Arbor, MI, USA, https://deepblue.lib.umich.edu/bitstream/ (last access: 18 July 2025) 1981. a
Blackford, B.: Optimal Blade Design for Windmill Boats and Vehicles, J. Ship Res., 29, 139–147, 1985. a
Bortolotti, P., Canet Tarres, H., Dykes, K., Merz, K., Sethuraman, L., Verelst, D., and Zahle, F.: IEA Wind TCP Task 37: Systems Engineering in Wind Energy-WP2.1 Reference Wind Turbines, Tech. Rep., National Renewable Energy Laboratory, https://doi.org/10.2172/1529216, 2019. a
Bredmose, H., Rinker, J., Skrzypinski, W., Zahle, F., Meng, F., Dykes, K., Gaertner., E., Barter, G., Bertolotti, P., Sethuraman, L., and Shields, M.: D1.1 Definition of the 15 MW Reference Wind Turbine, Deliverable d1.1 of the horizon 2020 european projet corewind, Danish Technical University (DTU) and National Renewable Energy Laboratory (NREL), https://doi.org/10.2172/1529216, 2020. a
Connolly, P. and Crawford, C.: Comparison of Optimal Power Production and Operation of Unmoored Floating Offshore Wind Turbines and Energy Ships, Wind Energ. Sci., 8, 725–746, https://doi.org/10.5194/wes-8-725-2023, 2023. a, b, c, d, e, f, g
Fossen, T. I.: Marine craft hydrodynamics and motion control, John Wiley & Sons, ISBN:9781119991496, https://doi.org/10.1002/9781119994138, 2012. a
Gaunaa, M., Øye, S., and Mikkelsen, R.: Theory and Design of Flow Driven Vehicles Using Rotors for Energy Conversion, in: Proceedings of the European Wind Energy Conference and Exhibition, 16–19 March 2009, Marseille, France, European Wind Energy Association, 2009. a, b
Glauert, H.: The Analysis of Experimental Results in the Windmill Brake and Vortex Ring States of an Airscrew, Aeronautical Research Committee, 1026, 1926. a
Jonkman, J., Butterfield, S., Musial, W., and Scott, G.: Definition of a 5-MW reference wind turbine for offshore system development, Tech. Rep. NREL/TP-500-38060, National Renewable Energy Laboratory, Golden, CO, USA, https://docs.nrel.gov/docs/fy09osti/38060.pdf (last access: 18 July 2025), 2009. a, b
Manwell, J. F., McGowan, J. G., and Rogers, A. L.: Wind Energy Explained: Theory, Design and Application, Second Edition, John Wiley & Sons, The Atrium, Southern Gate, Chichester, West Sussex, PO19 8SQ, United Kingdom, John Wiley & Sons, ISBN: 9780470015001, https://doi.org/10.1002/9781119994367, 2009. a
NREL: 2024 Annual Technology Baseline, https://data.openei.org/files/6006/2024 v2 Annual Technology Baseline Workbook Errata 7-19-2024.xlsx (last access: 18 July 2025), 2024. a
Raisanen, J. H., Sundman, S., and Raisanen, T.: Unmoored: a free-floating wind turbine invention and autonomous open-ocean wind farm concept, J. Phys. Conf. Ser., 2362, 012032, https://doi.org/10.1088/1742-6596/2362/1/012032, 2022. a
Santarromana, R., Abdulla, A., Mendonça, J., Morgan, M. G., Russo, M., and Haakonsen, R.: Assessing the Costs and Benefits of Dynamically Positioned Floating Wind Turbines to Enable Expanded Deployment, Energ. Convers. Manage., 306, 118301, https://doi.org/10.1016/j.enconman.2024.118301, 2024. a, b, c, d, e, f, g, h, i, j, k
Tsujimoto, M., Uehiro, T., Esaki, H., Kinoshita, T., Takahi, K., Tanaka, S., Yamaguchi, H., Okamura, H., Satou, M., and Minami, Y.: Optimum Routing of a Sailing Wind Farm, J. Mar. Sci. Technol., 14, 89–103, https://doi.org/10.1007/s00773-008-0034-1, 2009. a, b
Weber, J. E.: Steady Wind- and Wave-Induced Currents in the Open Ocean, J. Phys. Oceanogr., 13, 524–530, 1983. a
Xu, S., Murai, M., Wang, X., and Takahashi, K.: A Novel Conceptual Design of a Dynamically Positioned Floating Wind Turbine, Ocean Eng., 221, 108528, https://doi.org/10.1016/j.oceaneng.2020.108528, 2021. a, b, c, d, e, f