the Creative Commons Attribution 4.0 License.
the Creative Commons Attribution 4.0 License.
 | 08 Sep 2025
The impact of far-reaching offshore cluster wakes on wind turbine fatigue loads
Arjun Anantharaman
Jörge Schneemann
Frauke Theuer
Laurent Beaudet
Valentin Bernard
Paul Deglaire
Martin Kühn
With the number of commissioned and planned wind farms increasing rapidly, analysing wind farm cluster wakes becomes essential for resource assessment and lifetime considerations. Cluster wakes influence wind turbine power in downstream wind farms in certain meteorological situations. Our objective is to ascertain whether far-reaching cluster wakes (15 to 21 km) impact individual turbine loading in a downstream wind farm, considering the influence of atmospheric stratification. We utilized supervisory control and data acquisition (SCADA) data from an offshore wind farm and accelerometer measurements as the load proxy in the absence of load measurements to check short-term fatigue loading effects. We compared the absolute values of relevant SCADA variables of turbines in and out of the cluster wake. We found that while cluster wakes increase fluctuations of rotor speed and power, the load effects were lower than from turbines in the free wind, primarily due to lower wind speeds. We developed a new methodology to quantify loads of turbines affected by the cluster wake while separating the dependency of loads on the inflow wind speed. The turbines within the cluster wake showed a small increase in the load effects (≈2.5 %) when compared to turbines in free wind, but lower than loads of turbines within the wind farm affected by inner-farm wakes (both at the same local inflow wind speeds). We also found atmospheric stratification and the inflow wind speed to have no impact on the magnitude of loads within the cluster wake. Additionally, we found no additional blade mode excitations due to the presence of the cluster wake from the analysis of load spectra. We conclude that wind turbines affected by cluster wakes have a marginal increase in loads when compared to reference conditions in undisturbed inflow. The absolute load effects in the cluster wake are lower due to the lower wind speeds. We propose the use of additional data from load sensors to further determine possible lifetime fatigue effects of cluster wakes on offshore wind turbines. These new insights can potentially add to the design standards of future wind farm clusters.
- Article
(4922 KB) - Full-text XML
- BibTeX
- EndNote


In wind farms, single wind turbine wakes combine and form a wind farm or cluster wake downstream (Porté-Agel et al., 2020). Such cluster wakes can last several tens of kilometres and can influence downstream wind farms. While the impact on downstream wind farm power has become the focus of research in recent years, the influence on loads is rather unexplored. Both effects should be understood and modelled for better resource assessment, maintenance planning, and lifetime considerations.
With the increase in offshore wind farm capacity and the commissioning of more wind farms to achieve climate targets (IEA, 2021), the wakes of entire wind farms or wind farm clusters (known as cluster wakes) are receiving more attention from wind energy industry and research. These cluster wakes have been measured through various sensing techniques, such as Doppler lidar (Schneemann et al., 2020), Doppler radar (Nygaard and Christian Newcombe, 2018), satellite synthetic aperture radar (SAR) (Hasager et al., 2015), and research aircraft (Platis et al., 2018). These wakes have also been observed using wind farm power from the supervisory control and data acquisition (SCADA) systems, which are present in all operational wind farms. There are also several numerical studies on modelling cluster wakes with the focus on accurate estimation of production losses and wake deficit estimation. A state-of-the art review of numerical studies on offshore cluster wake modelling can be found in Ouro et al. (2025). The wind speed deficits due to these cluster wakes can be as high as 40 % of the freestream velocity 20 km downstream of the cluster from which it originated (Schneemann et al., 2020). Cluster wakes travel longer in stable atmospheric stratification, while in unstable stratification, they dissipate faster due to higher ambient turbulence intensities (Platis et al., 2021). This points to the importance of understanding the potential effect of large-scale wakes not only on power but also on the turbine loads, as the disturbed flow downstream of a wind farm impacts several others.
SCADA data provide the unique opportunity to extensively assess these wake effects for every individual turbine in a wind farm over a longer period, subverting the necessity for long in situ measurement campaigns. It has been primarily used to assess the power performance and wake effects of individual turbines (Gonzalez et al., 2019). Vera-Tudela and Kühn (2017) used existing SCADA signals to evaluate lifetime fatigue and found that with an error lower than 1.5 %, a good prediction of fatigue loads was possible for the blade-root flap-wise and edgewise bending moments. They did, however, note that the predictions were worse in waked conditions, though only marginally. SCADA data have also been utilized in data-driven machine learning models to predict fatigue behaviour of turbines within a wind farm. These studies show promising results that SCADA and acceleration data can be used to estimate long-term fatigue damage (de N Santos et al., 2023, 2024) with potential for lifetime-based decision-making for future wind farms.
The standard method of storing data from wind farms is 10 min averages, but the data from the sensors mounted on the turbines are usually sampled at higher frequencies, which has been used successfully in wind power and wind farm flow forecasting (Rott et al., 2020; Lin and Liu, 2020). Mittelmeier et al. (2017) analysed turbine power from high-frequency SCADA data to estimate the atmospheric stability using the normalized power fluctuations, similar to the well-known turbulence intensity (TI). High-frequency data are necessary to estimate the damage equivalent loads (DELs) and for spectral analysis, wherein the excited modes and fundamental frequencies can be analysed. Noppe et al. (2016) used 1 s SCADA and accelerometer data to model the thrust loads and obtained a good match between measured and predicted loads. Recent studies (Pettas et al., 2021) used meteorological data from the FINO1 met mast and SCADA data to determine that the turbines in the Alpha Ventus wind farm experienced increased loading due to the operation of neighbouring wind farms. The tower bottom load variations were found to be impacted by inter-farm interactions, with the load effects decreasing as the distance from the other wind farms increased. They also found that the standard deviations of the pitch angle and generator speed of the turbine showed increased values due to the wakes from the surrounding wind farms (maximum distance of 6.5 km away), while the DEL at the tower base had no significant changes. As the study took annual averages as a point of comparison, the atmospheric stability, which is a key driver of cluster wakes' persistence in the atmospheric boundary layer, was not considered. According to IEC 61400-1 (2019) the possible load effects of neighbouring wind turbines have to be taken into consideration by an increased turbulence intensity or dynamic wake model (no wind speed reductions necessary) for upstream distances of up to 10 D, where D is the upstream turbine rotor diameter.
Several studies have shown that atmospheric stability and increased turbulence intensity impact the fatigue loads on turbines due to single turbine wakes (Sathe et al., 2013; Churchfield et al., 2012). Holtslag et al. (2016) state that atmospheric stability has to be carefully considered in the analysis of fatigue loads since there are relatively higher fatigue effects for unstable atmospheric stratification. Even though Pettas et al. (2021) analyse load effects at inter-farm distances of up to 7 km from the generating cluster, the cluster wakes have already been shown to persist as long as 55 km in weakly unstable stratification and even longer in stable atmospheric conditions (Schneemann et al., 2020). The first step in analysing potential cluster-wake-induced load effects is to determine if there are short-term fatigue loads (10 min) which are adversely impacted. It is thus essential to investigate the effects of cluster wakes on wind turbine loads for far-reaching cluster wakes (>15 km) and determine if (and how much) the atmospheric stratification affects turbine loading.
Our objective is to determine if far-reaching cluster wakes impact individual downstream wind turbine short-term fatigue loading dependent on the atmospheric conditions. We aim to address this objective with the following methodology:
-
Firstly, classifying cluster wake situations by quantifying the caused power deficit based on SCADA data of a pair of wind farm clusters in the German North Sea
-
Secondly, assessing possible load impacts of the cluster wakes on individual turbines by developing a new methodology to compare load effects in the same wind speed conditions
-
And finally, determining if the prevalent atmospheric stability can affect the magnitude of turbine load effects caused by cluster wakes
It is beyond the scope of the paper to investigate long-term lifetime fatigue effects, which are heavily dependent on various wind farm and site-specific influences. We use the standard deviation of several operational parameters and represent all the standard deviations of variables as follows: u′ is the standard deviation of the wind speed u for ease of reading unless specifically mentioned otherwise. The paper is structured as follows: Sect. 2 introduces the considered wind farms in the German Bight (affected by the cluster wake), the wind farm and atmospheric data used in the analysis, and the steps involved in choosing a cluster wake case. Section 3 showcases a new methodology to specifically quantify the fatigue load effects caused by the cluster wake, which involves the selection of a load proxy from SCADA and the metrics to analyse the effect of the cluster wake on wind turbine loads in all the analysed cases. Section 4 contains the results quantifying cluster wake effects on loads using SCADA data. Section 5 discusses the implications of the results and whether they could influence wind farm planning. Section 6 presents the conclusions of the study, with recommendations for further research.
In this section, we describe the data set used from the cluster wake situation in between the N-6 and N-8 wind farm clusters in the German Bight. Additionally, we also detail how a cluster wake situation is selected and the steps involved in choosing a case, based not only on the wind farm parameters but also the atmospheric stability estimates.
2.1 Wind farms and operational data
An increase in the number of erected and planned offshore wind farms in areas such as the German Bight causes wind farms to be situated close to each other, as in Fig. 1. We analyse the wake generated by the N-6 cluster hitting the N-8 cluster in the German Bight area (see Fig. 1 and Table 1). The wake generated by the N-6 cluster for frequently occurring southwesterly winds directly affects the inflow of the N-8 cluster, measured previously using lidar (Schneemann et al., 2020). A cluster wake is a wake generated by a large number of wind turbines from one or more neighbouring wind farms (Platis et al., 2018; Schneemann et al., 2020). We use operational SCADA data from the sister wind farms Albatros and Hohe See in the N-8 cluster (see Fig. 2a) in the period from 10 January 2021 to 17 March 2022 to analyse turbine loads affected by the N-6 cluster wake. Albatros and Hohe See utilize the same wind turbines of type SWT 7.0-154. Both farms will together be referred to as A/HS in the following. For the spectral analysis in Sect. 4.4 we used 10 Hz SCADA data of the turbines in the A/HS wind farm. For all other analyses, we utilized 10 min statistics (mean and standard deviation) computed by the SCADA system.
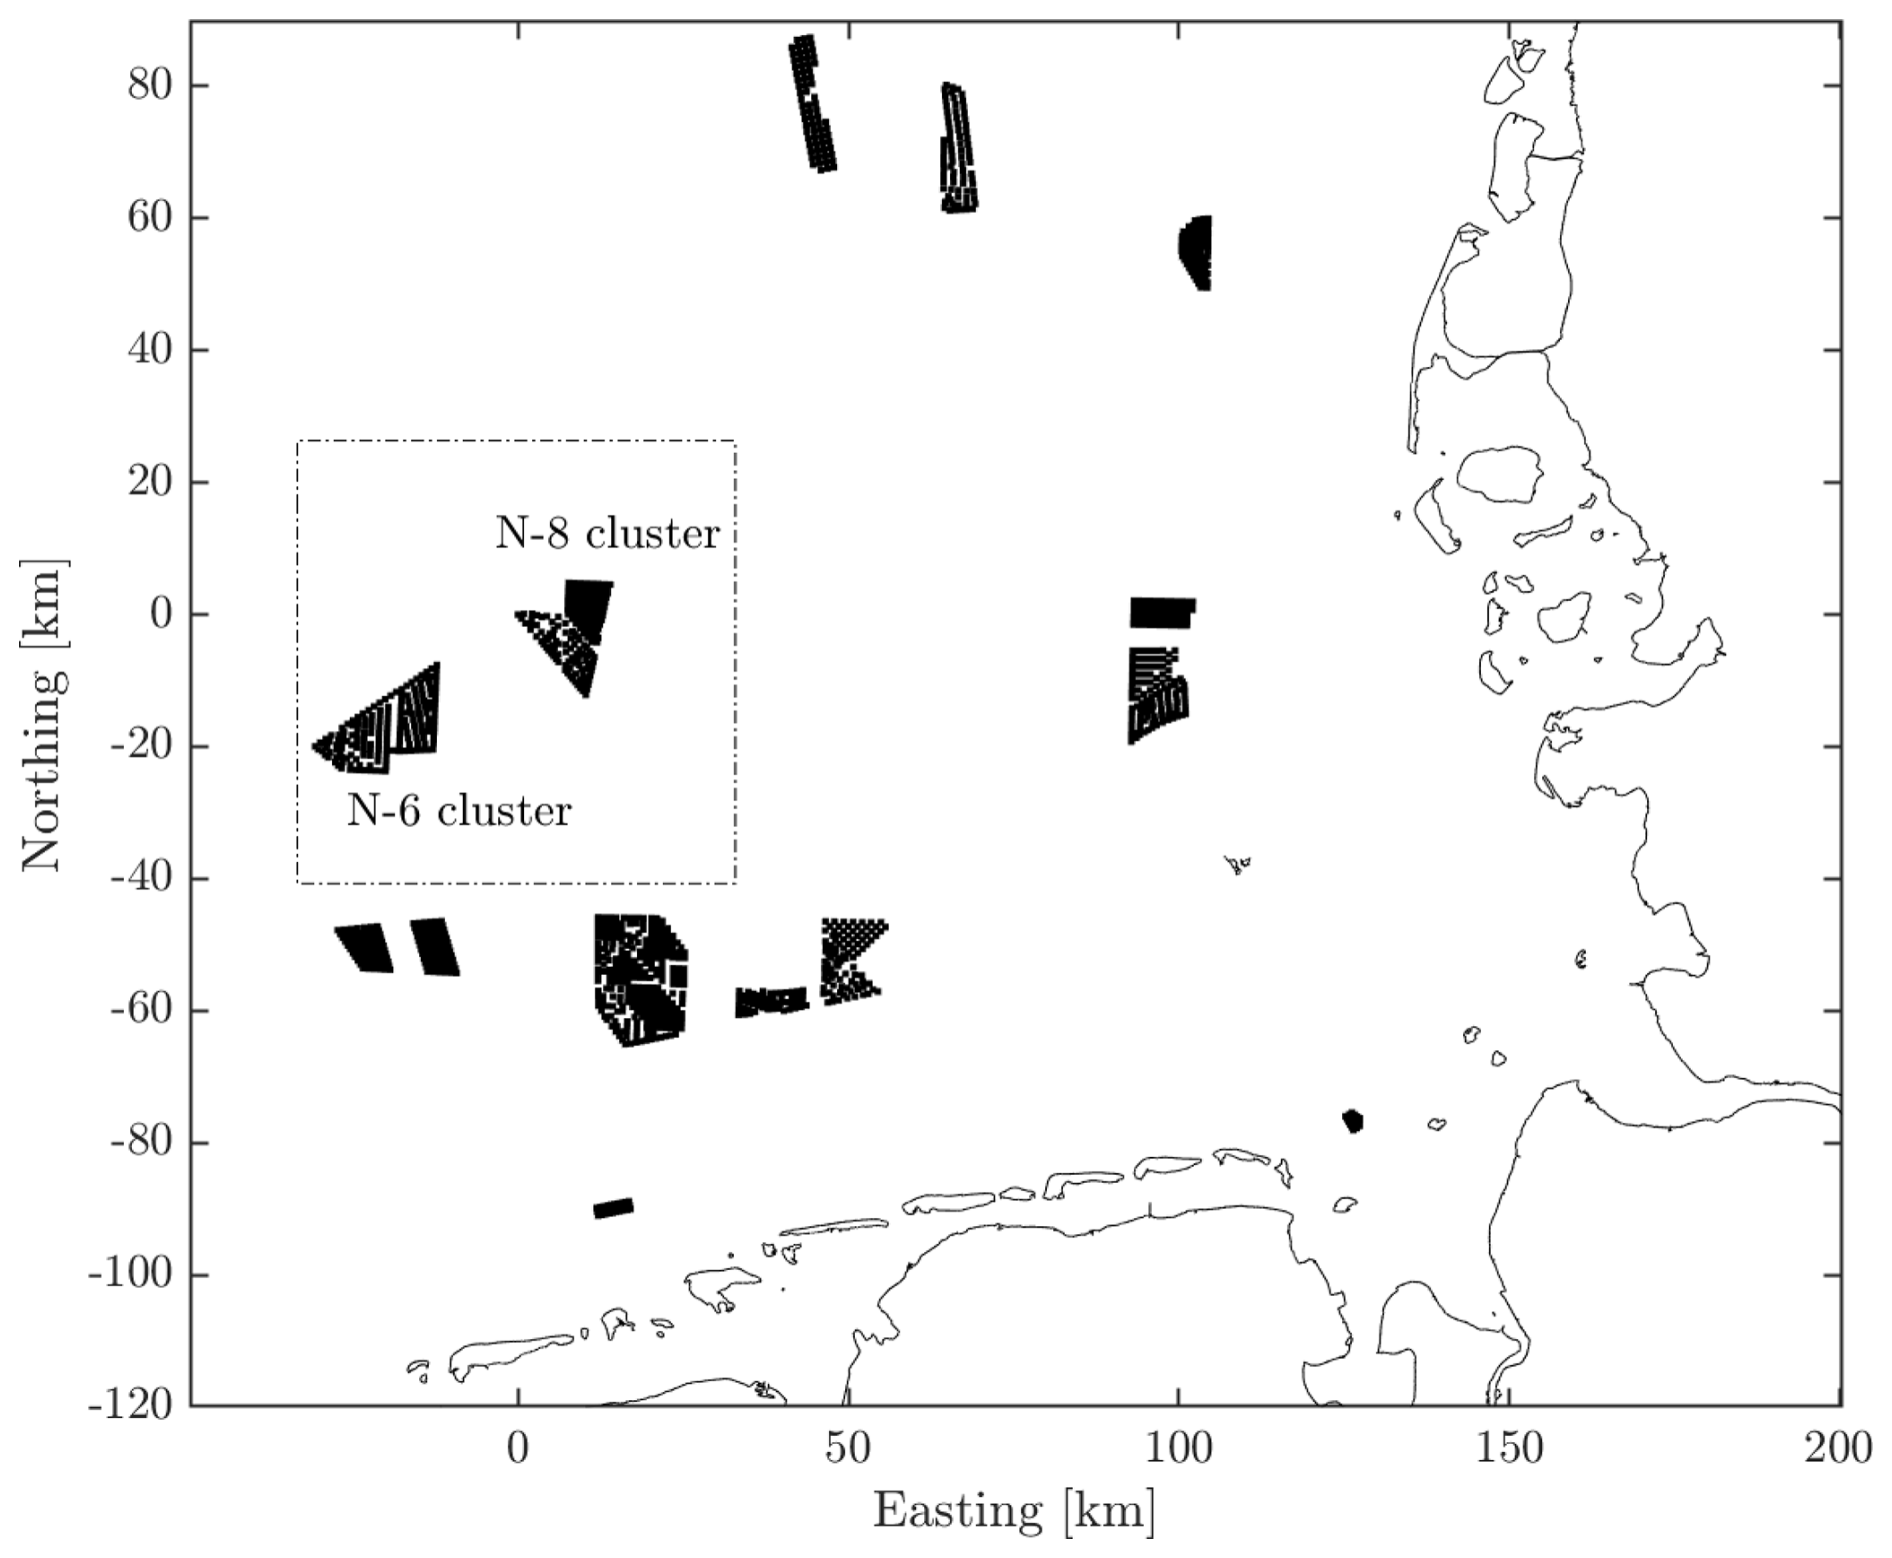
Figure 1Map of operational wind farms in the German North Sea at the time of analysis (January 2021–March 2022). The N-6 and N-8 clusters are labelled and highlighted by a dashed box. The origin is defined as the turbine on the northwestern edge of the N-8 cluster.
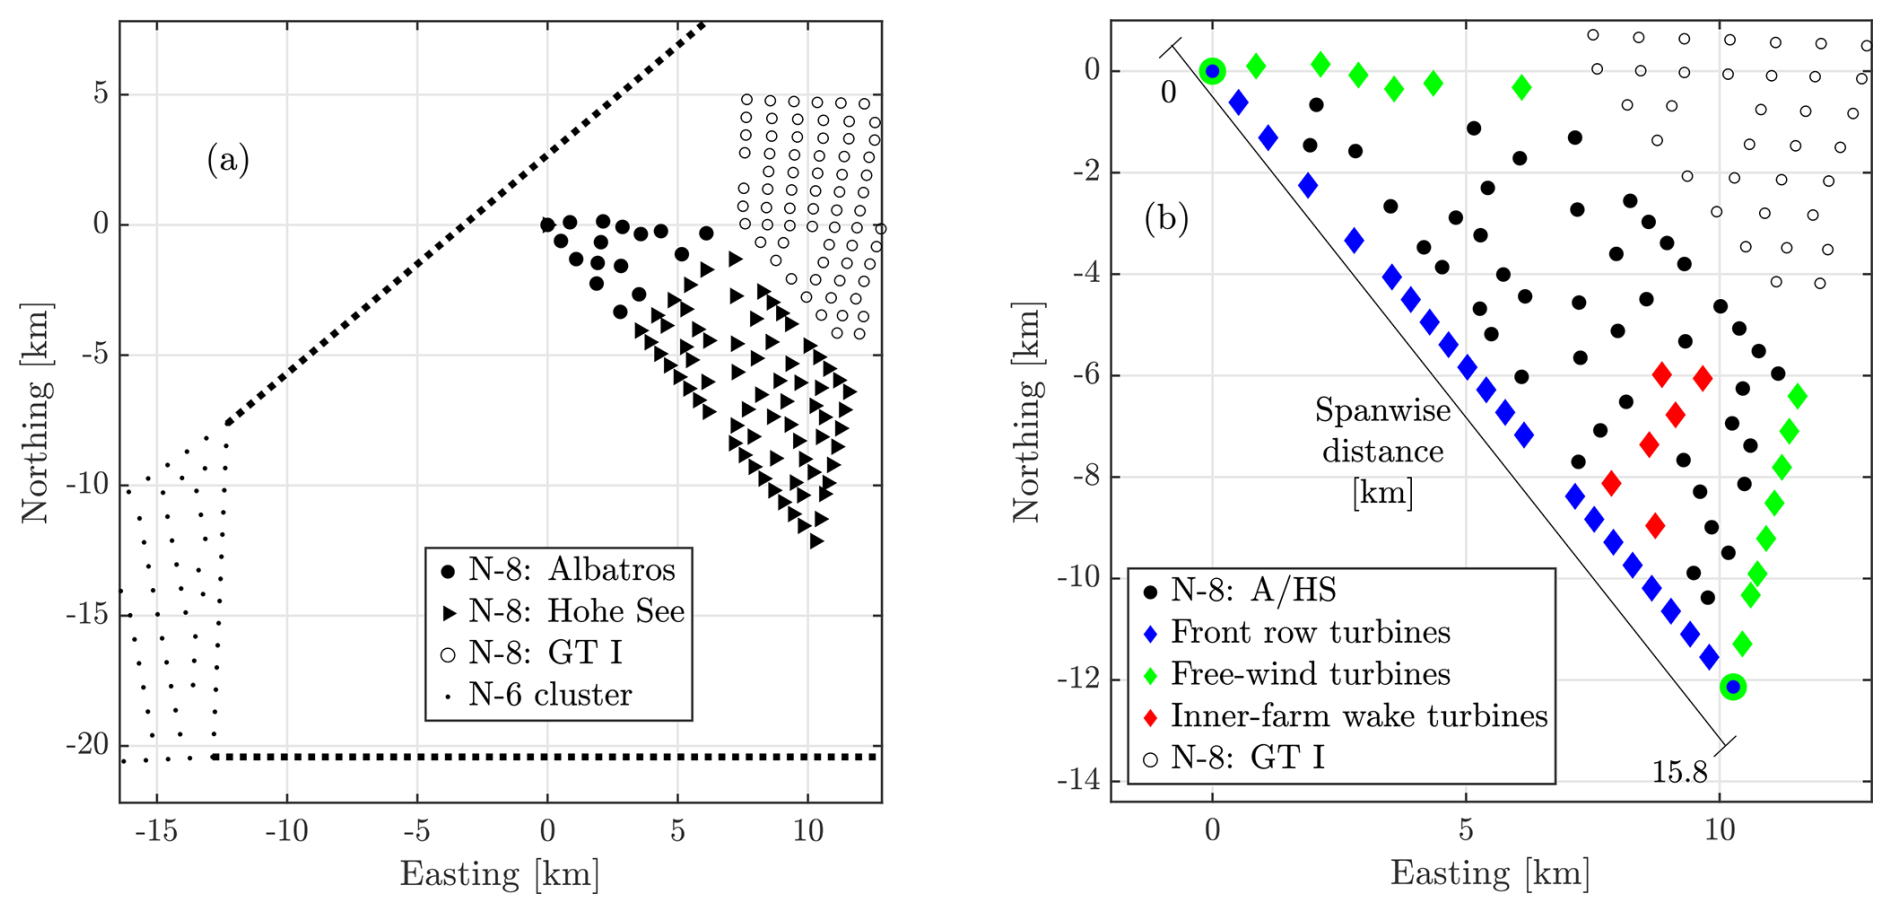
Figure 2(a) Region of the N-6 cluster (dots) and the N-8 cluster (filled circles, filled triangles, and empty circles). The distinction between the Albatros and Hohe See wind farms in the N-8 cluster is only shown in this figure for clarification. The wind direction sector considered for N-6 cluster wake analysis spanning from 230 to 270° is indicated by dashed lines. (b) A/HS wind farm in the N-8 cluster with highlighted turbines for analysis: front-row turbines to the southwest (blue diamonds), reference turbines in free inflow (green diamonds), and turbines in inner-farm wake conditions (red diamonds). The origin of the coordinate system is the front-row turbine in the northwestern corner. The spanwise distance along the front row of turbines is also indicated, starting from the northeast corner at [0,0] until the turbine at the southern corner, 15.8 km away from it.
Table 1Wind farm specifications of the N-6 and N-8 clusters, detailing the names of the wind farms within each cluster, the turbine type, the rotor diameter D, the turbine's hub heights, the rated powers of both the turbine Pturb and the entire wind farm Pfarm, and the number of turbines in each wind farm.
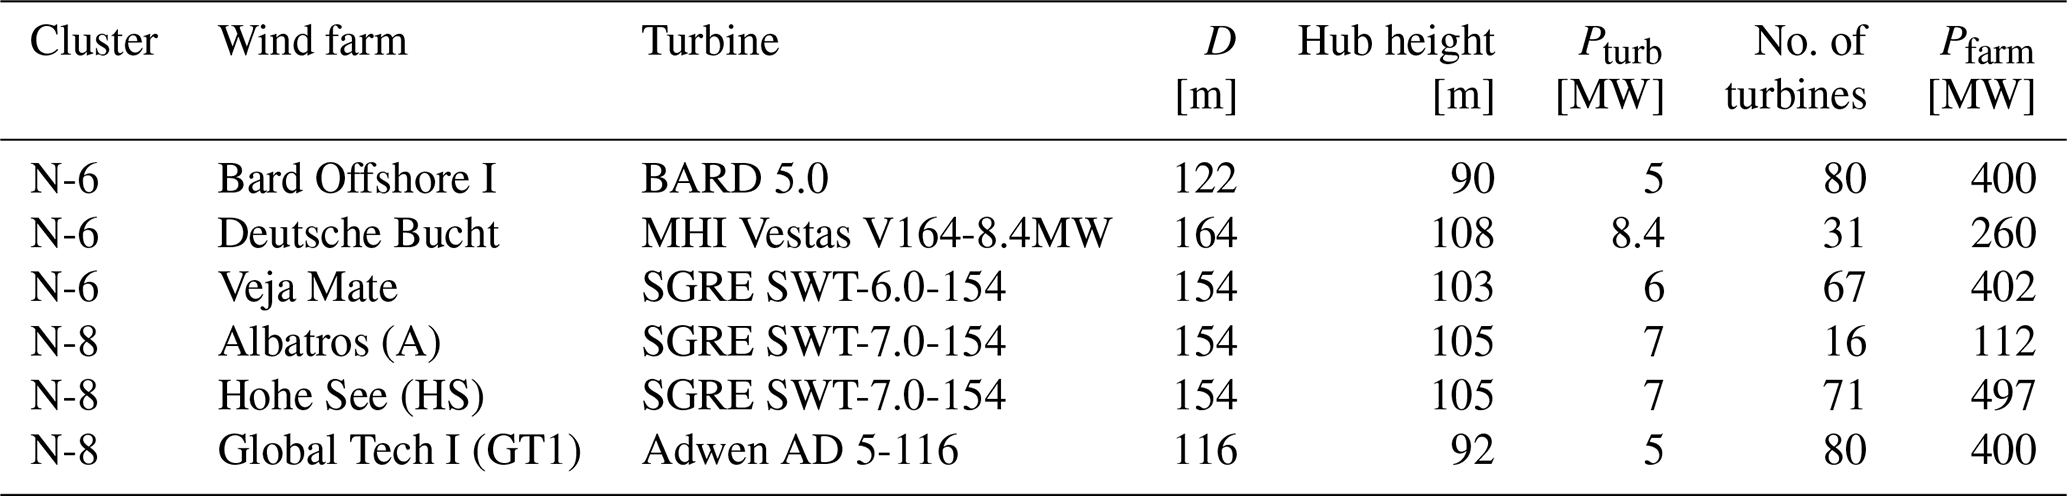
Figure 2a shows the N-8 cluster and the region to the southwest down to the N-6 cluster. A wind direction sector from 230 to 270° was chosen for the N-6 cluster wake analysis. This sector was specifically selected such that approximately half the turbines in the front row of A/HS would be within the wake and the other half in free-wind conditions to better understand the difference in turbine behaviour due to the wake. The front row of A/HS is defined for this work as the 22 turbines which are directly impacted by the N-6 cluster wake, highlighted blue in Fig. 2b. To simultaneously compare the cluster-wake-affected turbines to turbines both in free wind and inside the wind farm, we fixed these turbines for the cluster wake wind direction sector. These are referred to as free-wind and inner-farm wake turbines (green and red markers, respectively, in Fig. 2b) for the same 230 to 270° wind direction sector. The wind direction was derived from the 10 min mean nacelle positions of the front-row turbines, and the resulting distributions for the nacelle positions for normally operating turbines in A/HS (front row) across the 15-month analysis period are shown in Fig. 3. All nacelle positions were corrected for any positional errors or offsets in values, e.g. due to calibration issues, and the wind direction sector chosen for cluster wake cases was also observed to be frequent.
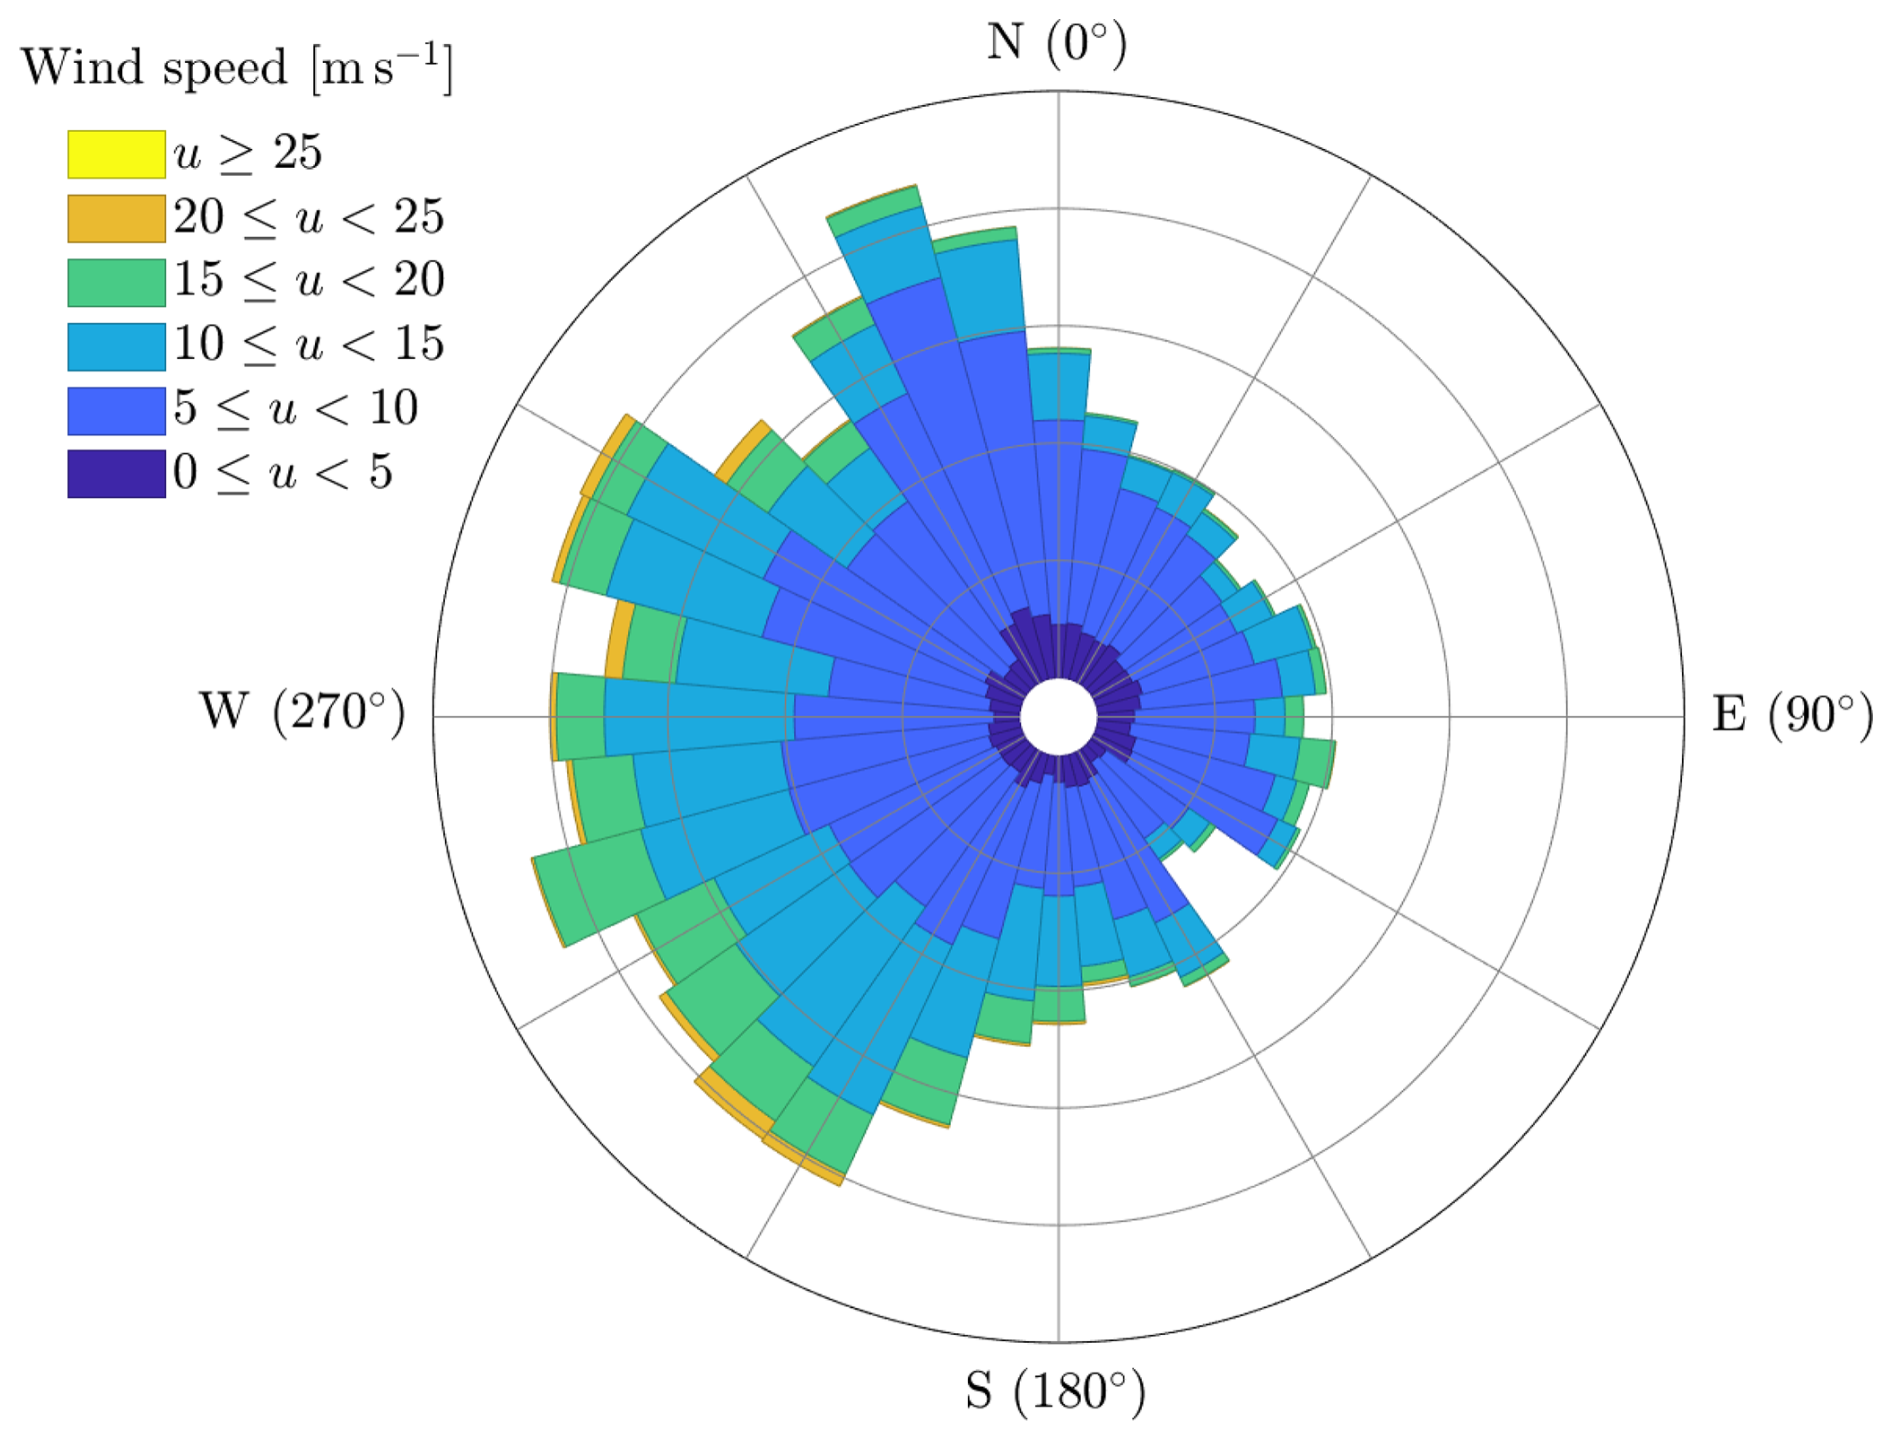
Figure 3Polar plot showing the 10 min mean nacelle positions of all the front-row turbines in A/HS from 10 January 2021 to 17 March 2022. The plot differs slightly from the 10-year mean wind rose (not shown here) due to the period of analysis.
2.2 Selection of cluster wake cases
We obtained cases of cluster wakes approaching A/HS by choosing an appropriate wind direction sector (230 to 270°) where at least eight A/HS turbines would be within the wake region, assuming a straight-line advection of the cluster wake velocity deficit. To limit our analysis to cases with turbines in normal operation we filtered out the data in situations of curtailment, turbine maintenance, shutdown, and wind speeds below cut-in and above-rated. We also consider a cluster wake case to be valid only when the turbines within the cluster wake are operating in below-rated wind speeds, although a few turbines in free wind might be above-rated. This is because we require all the analysed cluster-wake-affected turbines to be in normal operation in below-rated wind speeds.
Next, we considered situations only when the averaged nacelle position remained almost constant (±5°) for at least 60 min for two reasons. Firstly, as we did not have measurements of the wind direction or the nacelle positions of the upstream N-6 cluster, we assumed that the cluster wake travels with approximately the same wind direction as estimated from the nacelle position of front-row turbines of the A/HS wind farm. The lowest wind speed considered for a cluster wake is 6 m s−1, and we estimated the duration for the cluster wake to propagate between the wind farms as 1 h (). Secondly, fixing the wind direction for at least 1 h avoids situations with significant wind direction changes due to large-scale weather phenomena. Figure 4a displays a wind field derived from a satellite SAR snapshot (ESA, 2021) shortly before the cluster wake situation. Figure 4b shows the time series of the nacelle position and wind speed for the exact exemplary wake situation. The wind direction in the SAR snapshot is 270°, and even though this exact time is not considered for the selection of a case (since the wind direction has not yet stabilized), the cluster wake is visibly impacting the A/HS turbines. The bounds for the wind direction where the cluster wake is relevant are shown with black dashed lines, and the shaded box shows the 80 min period (06:40 to 08:00 UTC) where the nacelle position (ergo wind direction) is suitable for further analysis.
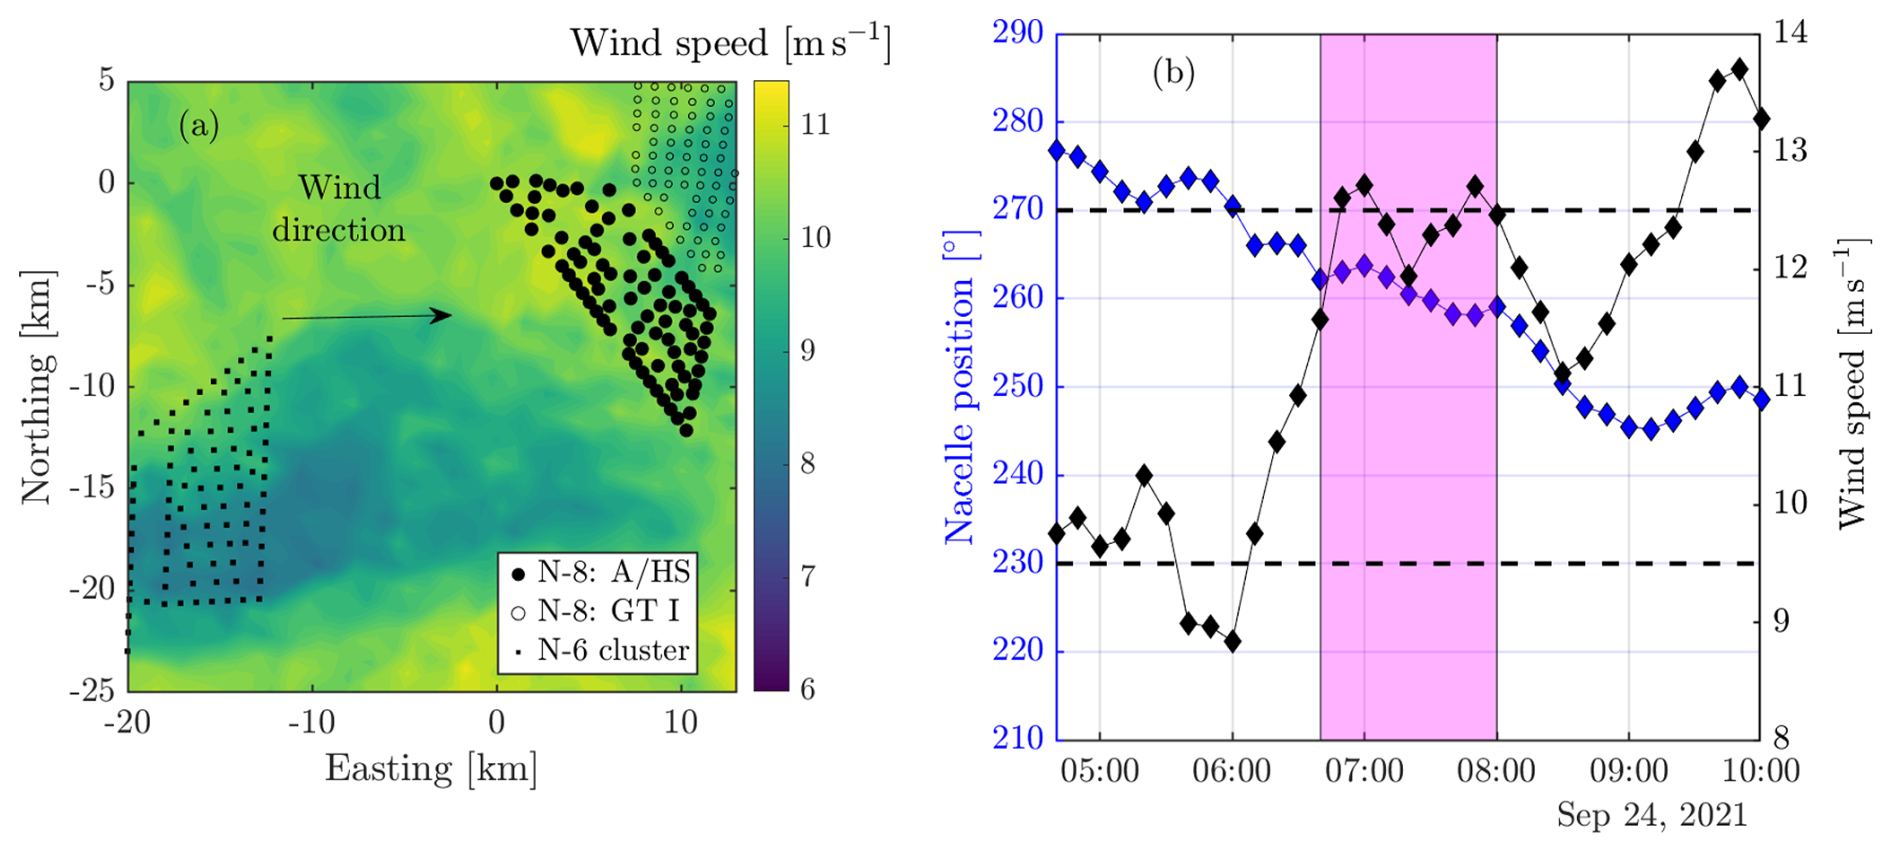
Figure 4(a) SAR snapshot of the N-6 cluster wake impacting the N-8 cluster on 24 September 2021 at 05:57:43 (ESA, 2021). (b) Time series of the averaged nacelle position (left y axis) and the corresponding wind speed (right y axis) of the front-row turbines for the same situation in (a). A suitable time period for a cluster wake case is highlighted in pink, with a nearly constant wind direction. The dashed lines represent the 230 to 270° wind direction sector considered for cluster wake scenarios.
After selecting periods with the desired wind direction, we apply a rigid set of filters to ensure that each chosen case corresponds to a cluster wake with normal wind farm operation. The different steps are outlined in Fig. 5. We only had access to the Veja Mate wind farm SCADA data from the N-6 cluster, so cases were only classified as cluster wake when Veja Mate was producing power. Further, we checked the difference in power of the front row of the N-8 cluster (A/HS) by computing the power deficit ΔP as the difference in power between the maximum and minimum power-producing turbines. Only cases where the magnitude of the power deficit caused by the cluster wake in the front row, ΔP, was higher than 0.5 MW (7 % of the rated turbine power) were considered for further analysis. We manually checked each selected case to verify that the power across the front row had the expected range of values and if at least half (11 out of 22 turbines) of the front-row turbines were producing power. We ended up with 96 cases of interest where at least 17 out of 22 turbines were in normal operation, though the more conservative criterion of at least 11 (half of the total) operating turbines for the consideration of a case was surpassed (see Fig. 5).
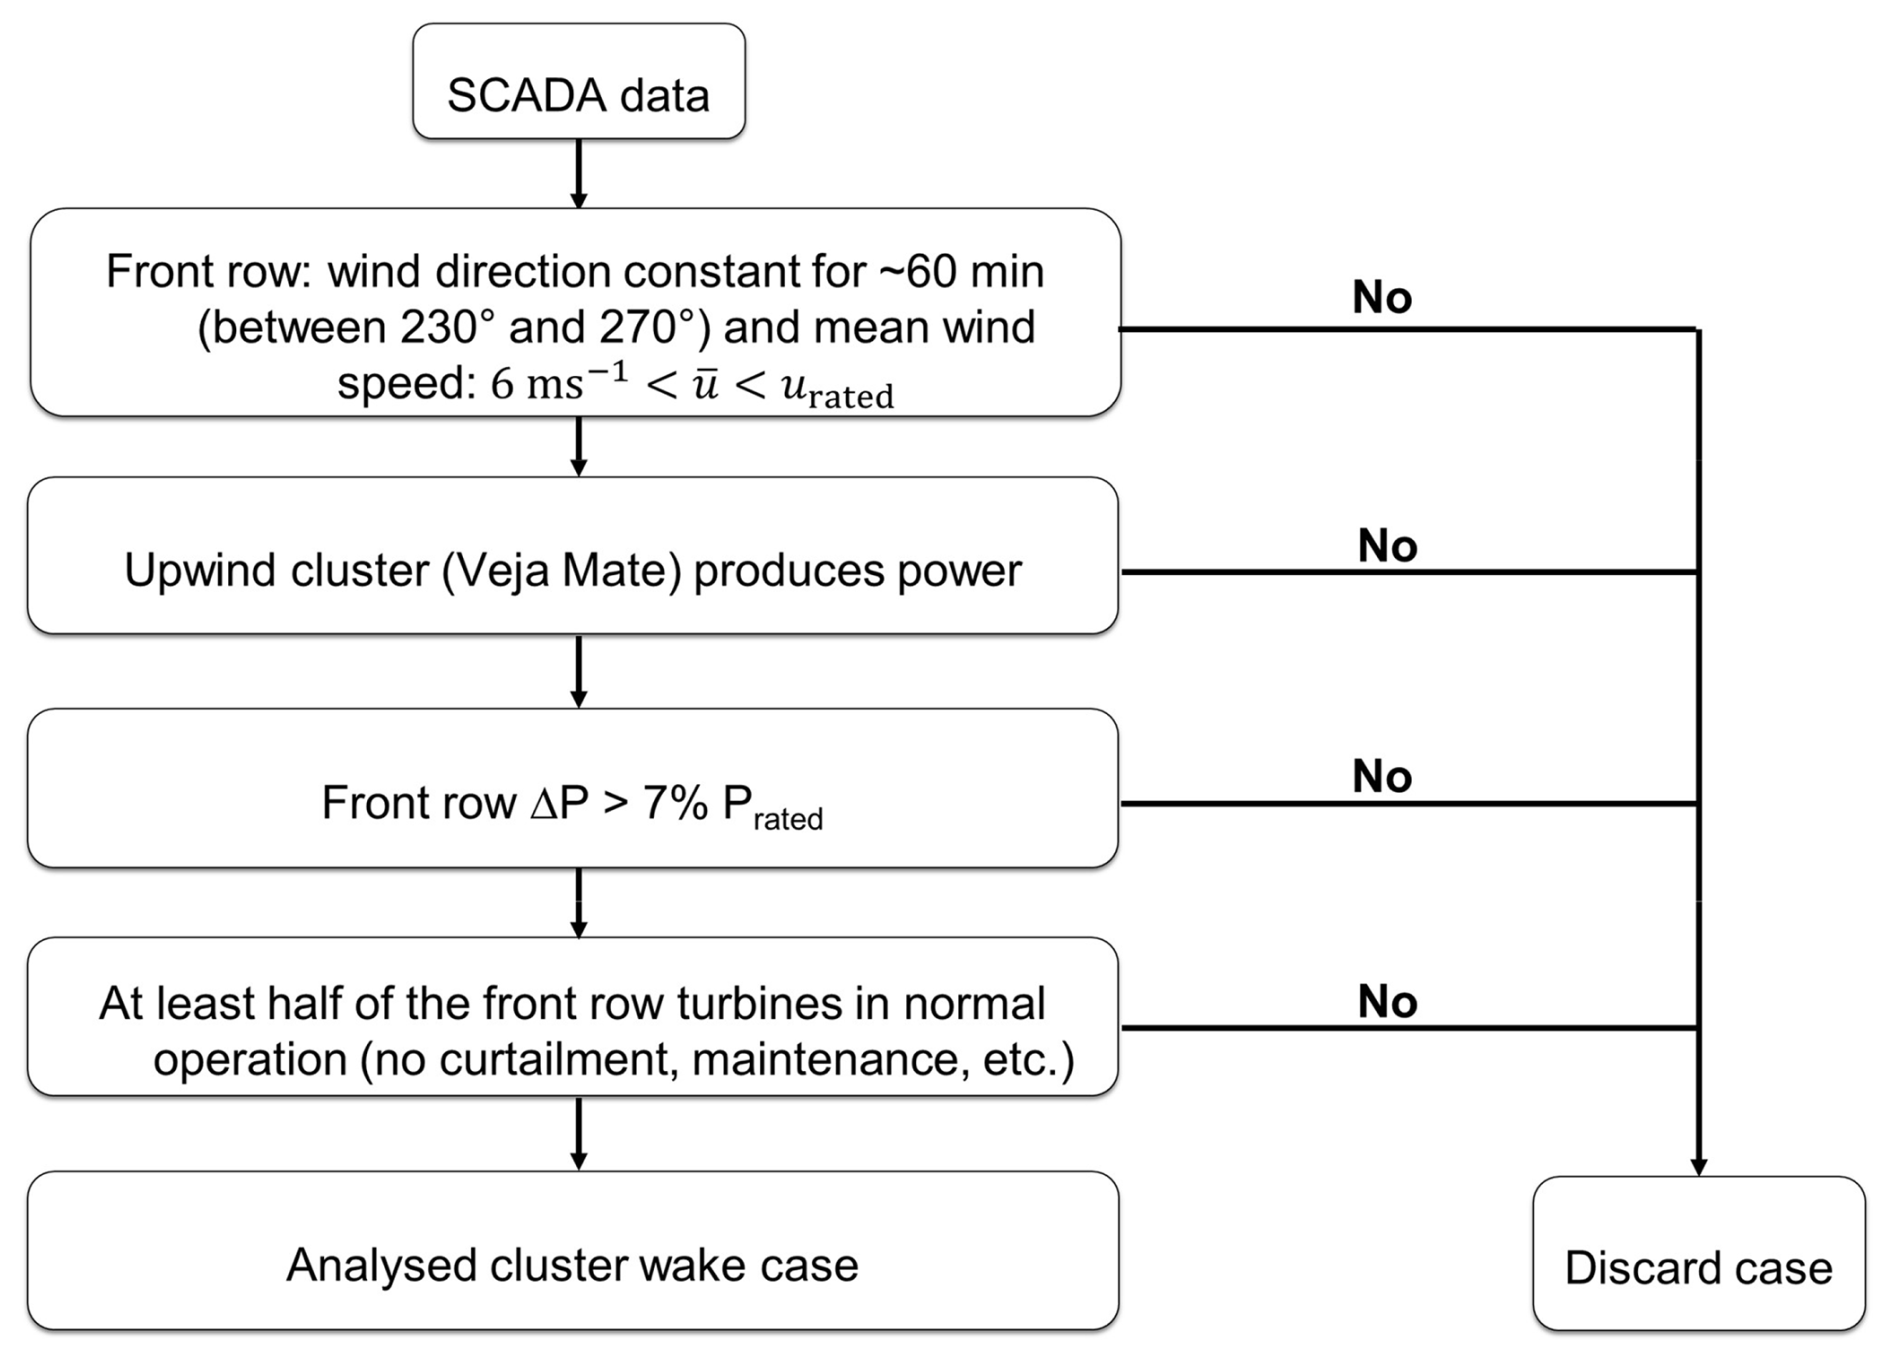
Figure 5Flowchart depicting the series of steps used to select a case to be considered “cluster wake” for load analysis.
2.3 Atmospheric stability estimates
The recovery of wakes is highly dependent on the atmospheric stability. Cluster wakes in particular have a stability dependence, persisting longer in the atmospheric boundary layer (ABL) for stable stratification and dissipating faster in unstable conditions. There are several methods to estimate the atmospheric stability in field campaigns, and it is particularly difficult to get comprehensive measurement data in front of wind farms without met masts. We follow the classification of stability regimes as in Sathe et al. (2013), but with a reduced number of regimes to simplify the analysis. Table 2 shows the regimes used along with the number of analysed cluster wake cases.
Table 2Stability regimes' classification and the number of analysed cluster wake cases.
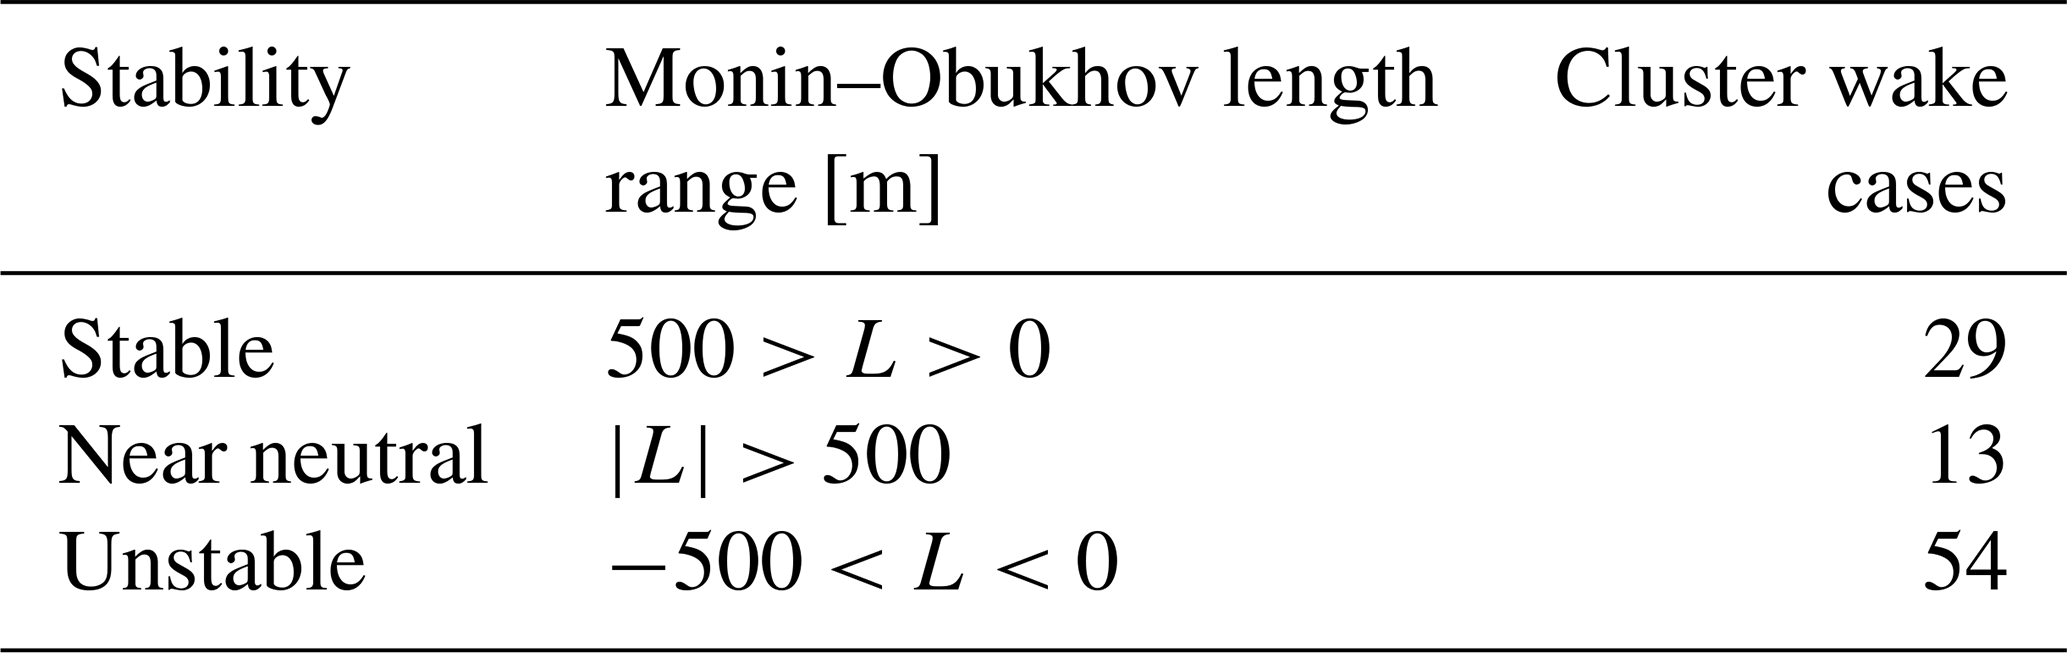
We use the Monin–Obukhov length L to estimate atmospheric stability from simulations with the Weather Research and Forecasting model (WRF, version 4.2.1) (Skamarock et al., 2019) on a grid point between the N-6 and N-8 clusters. Simulations used the Fitch wind farm parameterization (Fitch et al., 2012) and included all operating wind farms in the German Bight. We compared WRF stability values obtained from simulations carried out using the setup of the New European Wind Atlas (NEWA) (Dörenkämper et al., 2020) against atmospheric measurements, where the atmospheric stability was estimated using temperature differences between the sea surface and 25 m above the sea surface at the Global Tech I wind farm in the N-8 cluster (Schneemann et al., 2020), and found a good match. Since such atmospheric measurements were unavailable for the period of the current study, the WRF simulation data (Cañadillas et al., 2022) were used.
For cluster wake situations, quantifying the potential fatigue load effects by directly comparing turbine loads within the cluster wake to turbine loads in undisturbed inflow is not possible due to the different wind speeds at the turbines. Reference loads are thus required to remove the dependency on wind speed and atmospheric conditions (turbulence intensity, atmospheric stability). This makes a new approach necessary to differentiate the load effects in cluster wake situations from those from turbines which are in free-inflow situations or affected by inner-farm wakes. Wind turbine fatigue loads are typically compared by load spectra or damage equivalent loads (DELs) derived from rain-flow counting of load time series. These load calculations are performed according to IEC 61400-1 (2019) for different site and operational conditions. This comparison is done for either short-term fatigue loads (10 min) or long-term fatigue loads, which are extrapolated to design lifetime based on the frequency of occurrence of certain load situations. We limit the comparison to the analysis of short-term load fatigue loads in different atmospheric conditions. In this section we first introduce the load variable utilized from the available SCADA data, then detail the methodology to compare and quantify cluster-wake-caused turbine loading to reference loads in non-cluster wake situations. Finally, we also introduce a performance parameter to conveniently represent the magnitude of the cluster-wake-caused loads.
3.1 Selection of load proxy in SCADA
Quantitative highly resolved data are needed from all the wind turbines in the farm to analyse the potential load effects of cluster wakes. This is only possible through SCADA. As the turbines in A/HS were not equipped with load sensors, we turned to the available SCADA measurements that could act as a proxy for fatigue loads. Environmental and wind turbine variables which are sensitive to fatigue loads are the inflow turbulence intensity and the standard deviations of the nacelle accelerations a, pitch angle β, rotor speed Ωrotor, and turbine power P (Cosack, 2010; Mittelmeier et al., 2017; Pettas et al., 2021). Nacelle accelerations are measured in the fore–aft (fa) and side–side (ss) directions and their standard deviations are written as and , respectively, in this paper. When comparing these potential load proxies against the mean wind speed, only the nacelle accelerations had both a reasonably low and uniform spread of values and an approximately linear relation to the below-rated wind speed. Additionally, we conducted an independence study to confirm if the load proxies mentioned above were consistent regardless of the choice of turbine and found that only was sufficiently independent of turbine choice in the A/HS wind farm. One explanation could be the fact that since the sensors are located on the nacelle, the primary driver of loads is in the fore–aft direction due to thrust and so is dominant. Therefore, we proceeded to use only the fore–aft nacelle accelerations as a proxy for wind turbine fatigue loading.
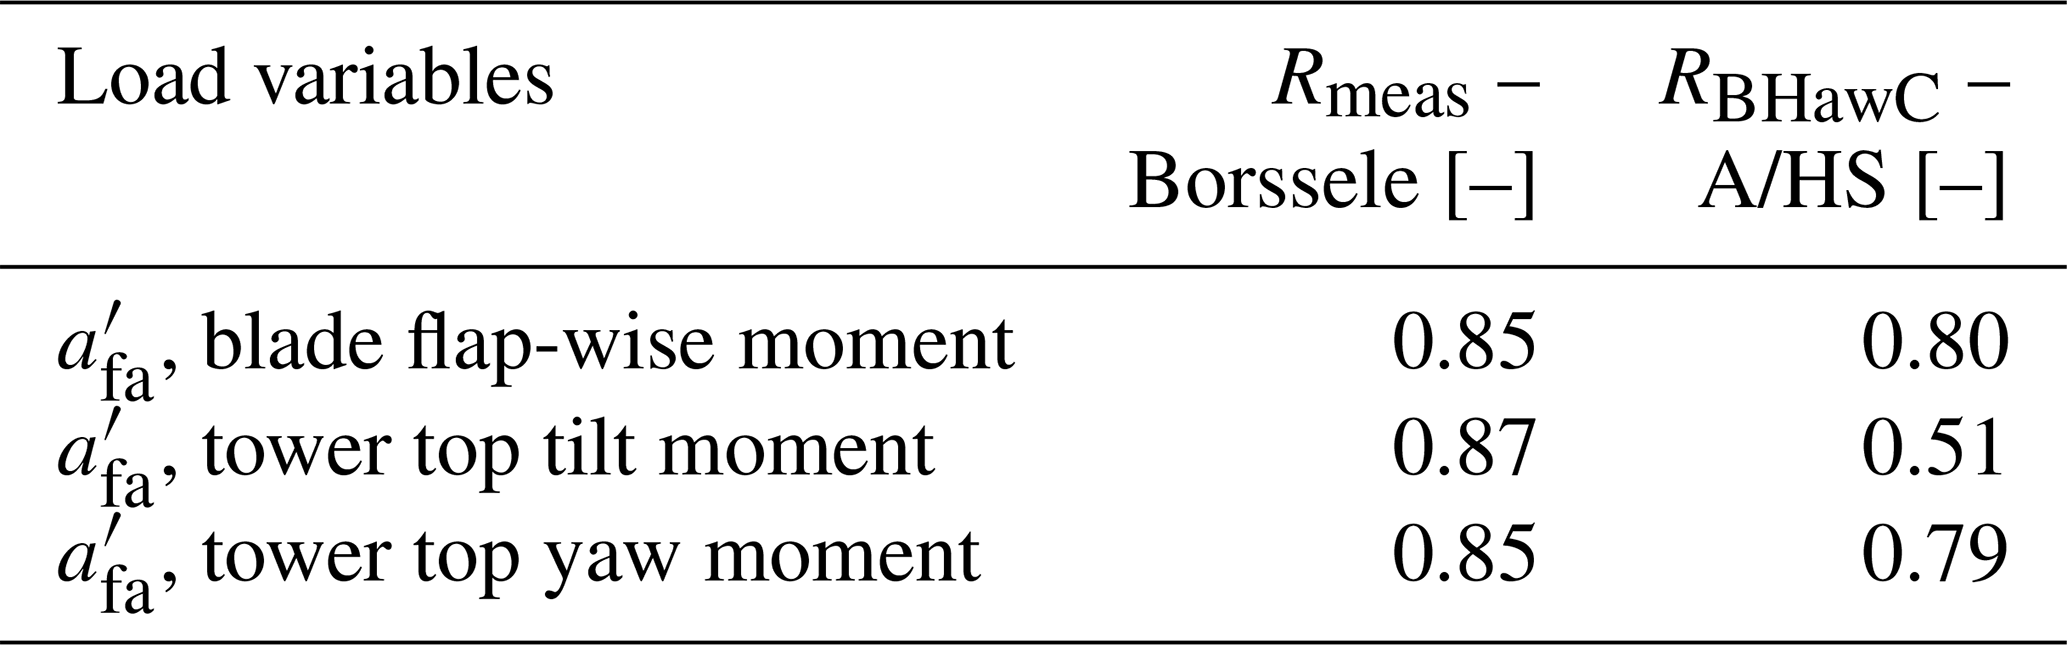
Table 3 shows the correlations of the load proxy against calculated fatigue quantities such as the damage equivalent flap-wise blade-root bending moment and the tilt and yaw moments of the tower top from both load measurements (Rmeas) and simulations (RBHawC). The Rmeas values were derived from the DEL calculated from strain gauge measurements of the turbines in the Borssele wind farm, also located in the North Sea. Around 7 months of measurement data (1 January 2021 to 5 August 2021) were used to derive these correlations. Although the turbines in the Borssele wind farm have a different rated power, they have the same rotor diameter and the comparison only serves to confirm the choice of the load proxy where load measurements are available. is very well correlated with the DEL of the flap-wise blade-root bending moment and the yaw and tilt moments of the tower top. Additionally, we also used simulation data from the highly resolved Siemens Gamesa in-house aeroelastic model BHawC (Rubak and Petersen, 2005; Muller et al., 2024) for the same turbine type as in the A/HS farm to compute correlations (RBHawC) between the and DEL variables. It is to be noted that the simulations were taken from an onshore setup and exclude any potential hydrodynamic effects on the loads. There is also no stratification input in the simulations. The measurements and simulations show good agreement in that is well correlated with DEL quantities of the blade and tower top. This is also consistent with the findings of Cosack (2010), wherein the nacelle accelerations' fluctuations and other SCADA signals were correlated with the magnitude of wind turbine DELs via neural networks. Further studies (Vera-Tudela and Kühn, 2017; Pérez-Campuzano and Gallego-Castillo, 2018) also support the choice of the standard deviation of the nacelle accelerations as a good indicator for the DEL experienced by the turbine.
Table 3Pearson's correlation coefficient R between the load proxy and the damage equivalent loads (DELs) for the blade and tower, calculated from measurements from the Borssele offshore wind farm in North Sea and BHawC simulations for the A/HS wind farm. The DEL was calculated from rain-flow counting of load measurements on the turbines.
3.2 Reference wind turbine loads in non-cluster wake scenarios
In the partial load range, fatigue loads are approximately proportional to the wind speed and turbulence intensity (Pettas et al., 2021). Cluster wakes are defined as situations with significant wind speed reductions which might be associated with increased wake turbulence. Hence, any assessment of cluster-wake-induced fatigue loads should try to separate these two effects. When using the selected load proxy to quantify fatigue load effects due to the cluster wake, it is essential to have a reference free from the influence of the cluster or inner-farm wakes. For this purpose, we created a look-up table of standard loads (SLs) for the in both free-wind (no wake effects, referred to as SL-free) and inner-farm wakes (when a turbine is directly influenced by one or more upstream turbines within a farm, referred to as SL-inner) situations. For both scenarios, appropriate wind direction sectors were chosen, with 16 turbines used for free-wind and six turbines for inner-farm wake cases, shown in Fig. 2b with green and blue markers, respectively. The SL tables were created from more than 2.5 years of SCADA data, from 1 January 2020 to 31 July 2022. The wind direction sectors chosen were 60 to 80, 100 to 120, and 300 to 360° due to the absence of any offshore wind farms upstream in a range of 80 km (see Fig. 1). In the utilized sectors, the nearest coastline is more than 100 km away, so we assume no coastal influence. There could be larger-scale phenomena arising from the land–sea transition (Schulz-Stellenfleth et al., 2022), but these are neglected in the current study. The SL-inner table was created by considering the six turbines within the N-8 cluster (see Fig. 2b) for the same wind direction sector as SL-free.
Figure 6 shows the correlation between the of the selected SL-free and SL-inner turbines with the other measured variables in SCADA data (β is the turbine pitch and Ωrotor is the rotor speed). The mean wind speeds in the whole analysis refer to the 10 min measurements from the anemometers on the turbine nacelle, which includes a correction function to account for the placement of the nacelle anemometer behind the rotor. We found that the turbulence intensity (TI) calculated from the nacelle anemometer wind speeds was not well correlated with , one reason possibly being the positioning of the anemometer behind the rotor. This means that while is correlated with u′, it is poorly correlated with the nacelle-anemometer-based TI. We also included a variable called “power-normalized TI” (POTI), defined by Mittelmeier et al. (2017) as the standard deviation of the turbine power normalized by the mean turbine power for 10 min averages. This was found to be an indicator of atmospheric stability from SCADA parameters, which also is a key driver of cluster wakes. Additionally, POTI was found to also be a better indicator of turbulence than the nacelle-anemometer-based TI (Barthelmie et al., 2007). However, both the nacelle anemometer TI and POTI were not found to be well correlated with . In the end, we considered only two parameters to construct the SL table: u, to account for the wind speed range of the turbine operation, and u′, which was consistently a highly correlated parameter with across scenarios both of free-wind and inner-farm wakes. We also found a similar correlation of the power fluctuations P′ as u′, but we did not utilize that for the SL tables since the spread of values was inconsistent across wind speeds. This could be attributed to the high sensitivity of the power fluctuations' correlations to the flow conditions (Seifert et al., 2021).
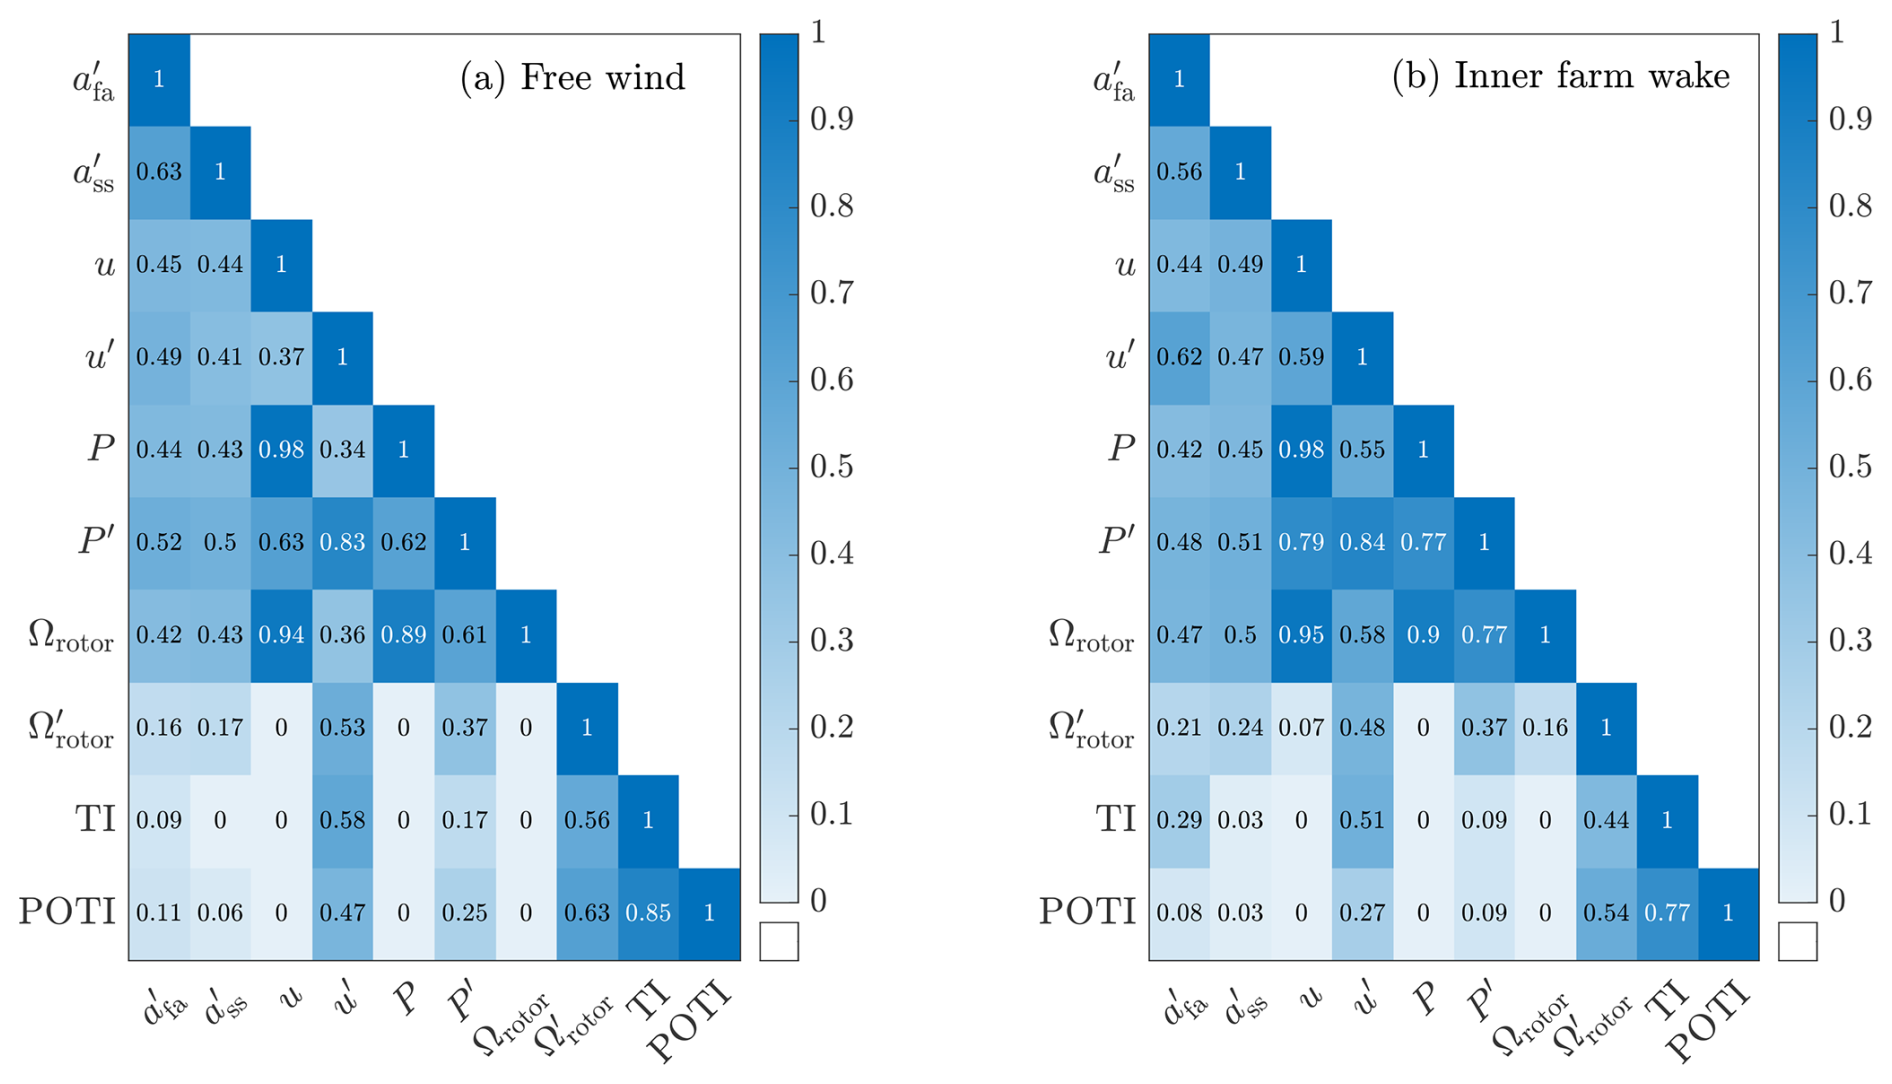
Figure 6Pearson correlation coefficients R of the measured and derived SCADA quantities with the load proxy in free-wind (a) and inner-farm wake (b) conditions for below-rated wind speeds. The standard load (SL) tables were built for as a function of u and u′ due to their R values in both (a) and (b).
A two-dimensional SL table was created by binning in 1 m s−1 steps of u and 0.1 m s−1 steps of u′. Figure 7a shows the SL tables for in free-wind conditions (named SL-free). Figure 7b shows the standard error of the mean, SEM = , where is the standard deviation of and N is the number of samples in a particular bin of values. This gives an idea of how the uncertainties are distributed, and most of the data are located where the SEM is low. Although the anemometers behind the rotor are subject to more fluctuations, there are enough data in each bin so that the SEM is low for most of the main wind speed values of interest. Any bin with fewer than 100 values was discarded to avoid biasing the SL table with low-confidence bins. We also created the SL-inner table (not shown) for inner-farm wake conditions and found that the SEM was significantly higher than SL-free due to lower data and more complex flow dynamics due to inner-farm wakes in each u and u′ bin.
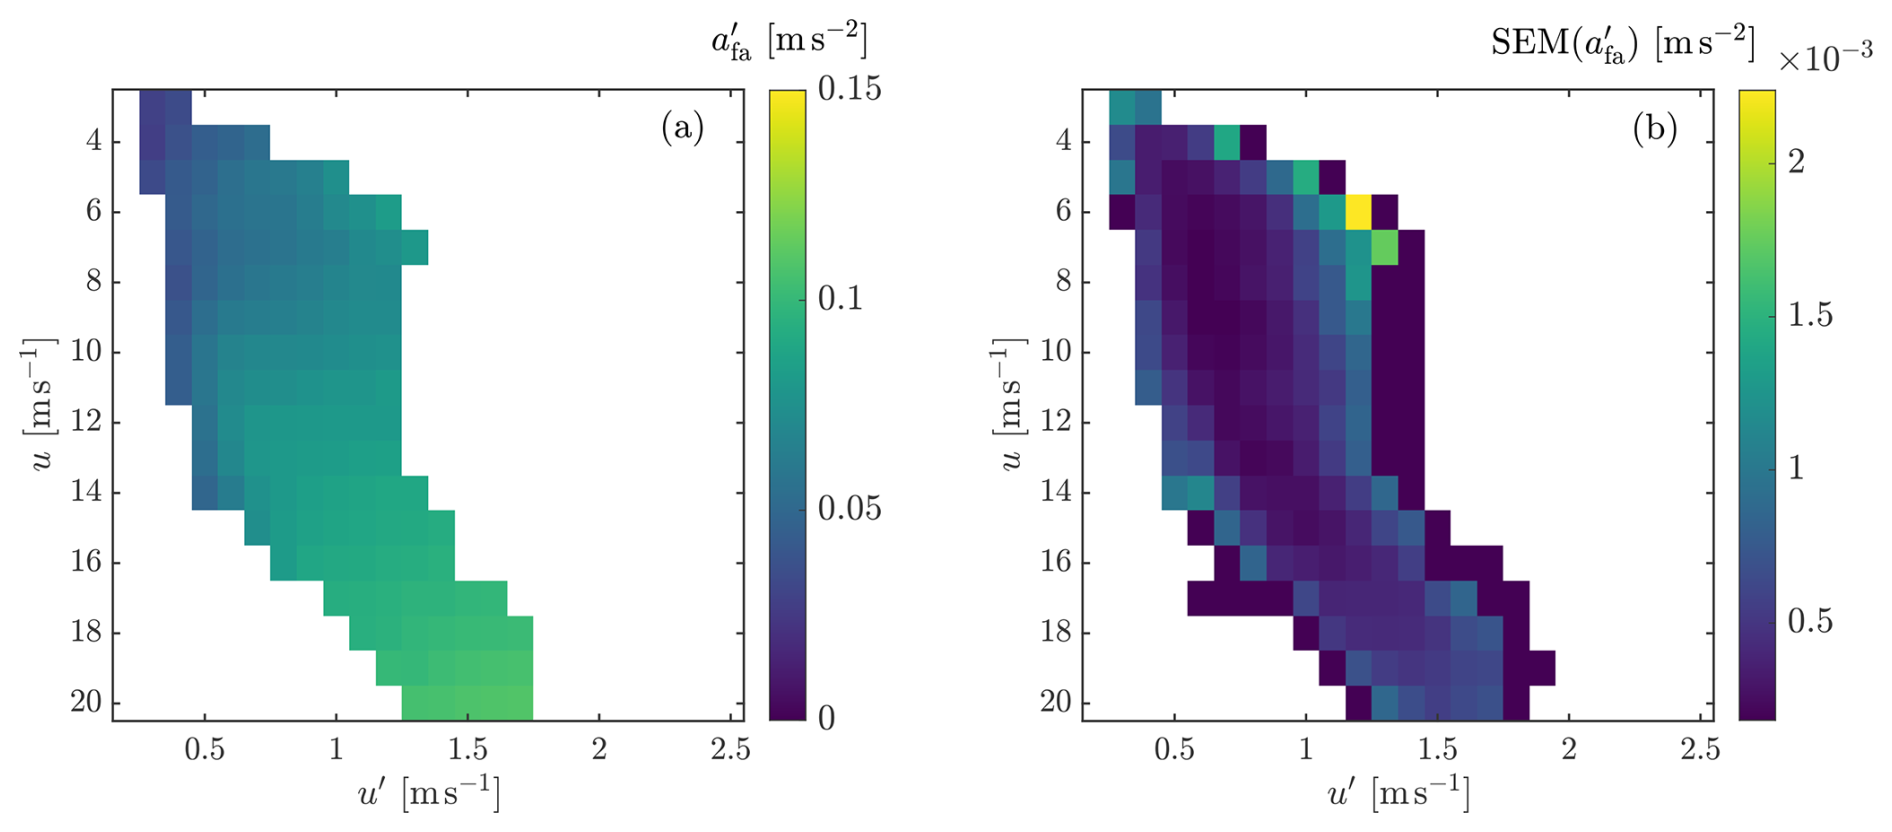
Figure 7(a) Standard load (SL) matrix for in free wind and (b) the corresponding standard error of the mean (SEM), both dependent on u and u′.
3.3 Performance indicators to quantify cluster-wake-caused load effects
We created SL tables in Sect. 3.2 to compare load effects independent of the wind speed reduction in the wake. We defined two performance indicators, ζfree and ζinner, to represent how much the deviates from the SL-free and SL-inner standard load cases, respectively. These parameters indicate how much the for a turbine in the cluster wake quantitatively differs from the for the same u and u′ values in the SL tables, making it easier to interpret the quantitative effects of the cluster-wake-caused fatigue loading.
The results are presented in three subsections: firstly, we show an exemplary cluster wake situation and the subsequent analysis using absolute turbine parameters and the standard load tables. Secondly, we also compare nacelle acceleration spectra to determine if any structural modes are excited at turbines in the cluster wake. Finally, we show the broader results for all the cases and analyse the role of atmospheric stability.
4.1 Exemplary wake case
We show the results from one exemplary cluster wake case for the effect on the turbine load proxy (24 September 2021 from 06:40 to 08:00), shown in Fig. 4. The wind direction is 261°, and the average wind speed across all the wind turbines in the front row is 12.3 m s−1. The atmospheric stability during that period was very unstable, with . The satellite synthetic aperture radar (SAR) image for the same day (ESA, 2021) at 05:57:43 is shown in Fig. 4a. Even though the SAR image is a snapshot earlier than the period considered, it still serves to confirm the existence of the N-6 cluster wake.
Figure 8a shows the wind speed, power , and corresponding standard deviation of wind speed in the front row of turbines in A/HS due to the N-6 cluster wake influencing the farm. All three variables are normalized with their respective average of the three maximum values in the front row. Wind speed and turbine power are expected to be maximum when the turbines are not affected by wakes, as is the case for the first half of the front row (spanwise distances from 0 km to about 8 km, first 10 of 22 front-row turbines). The more the cluster wake impacts the turbines, the reduction in wind speed and power is also accompanied by a reduction in the . The u′ has some fluctuations but marginally increases when the other three variables are reduced due to the presence of the cluster wake, around 5 km spanwise distance onward. Figure 8b compares the across the front row (blue line and markers, measurements) in the cluster wake case to the reference situations of free-wind (green markers and blue line, SL table) and inner-farm wakes (red markers and blue line, SL table) per turbine for the same u and u′. Each is normalized by the average of the three maximum values of in the cluster wake case such that the blue dotted lines in Figs. 8a and 8b are the same for . The for the exemplary wake case is overall much lower and there is a reduction of for the turbines in the cluster wake (8 to 15 km spanwise distance). Some missing values in the values from SL-inner are due to the fact that not enough measurements were present in that bin of u and u′ (N<100, see Sect. 3.2).
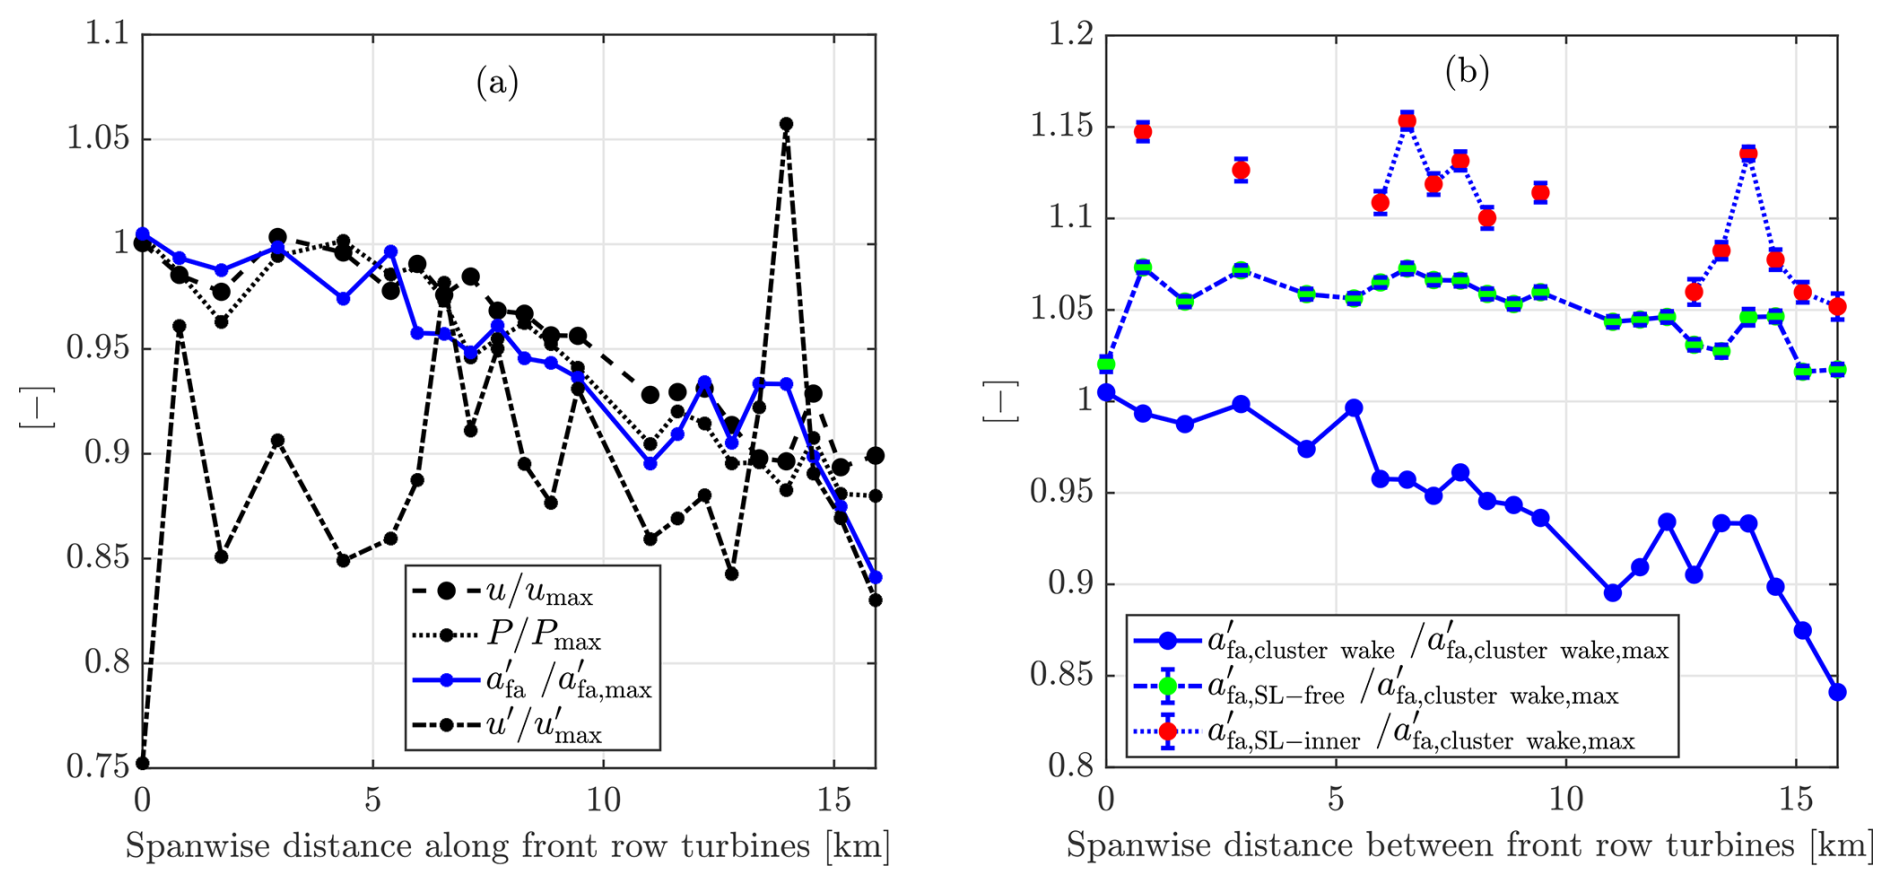
Figure 8(a) Variation of u, P, (blue line), and u′ across the front row for the exemplary case as a function of the spanwise distance. Each variable is normalized by the average of the three maximum values in the front row. (b) Comparison of in the exemplary cluster wake case (blue line, same as in a) to the in reference situations of free-wind (SL-free, blue line and green markers) and inner-farm wake conditions (SL-inner, blue line and red markers) for the same local u and u′. Error bars indicate the SEM of (for the SL tables only), and all the variables are normalized by the average of three maximum values in the front row of in the cluster wake case.
The influence of the cluster wake is present in the front row beyond approximately 8 km spanwise distance (see Fig. 8a), as observed from the reduction in turbine power. The accelerations from the SL tables remain approximately constant despite wind speed reductions, while the cluster wake case does not follow the same trend. One potential reason for the overestimation of by the SL tables could be due to the highly unstable atmospheric stratification and could point to more data required in specific stability conditions. For this case study, the cluster wake does not have any adverse load effects and even has lower than the free-wind turbines (it is not constant along the row like the SL tables), pointing to an overestimation bias of the SL tables. This will be explained further in Sect. 4.3.
Finally, we computed the power spectrum of the nacelle accelerations using 10 Hz SCADA data. This was done by computing the power spectrum of the raw 10 Hz time series and then converting the units of the power spectrum to decibels. The power spectra of the nacelle accelerations were compared to observe if any modes showed additional excitations by the cluster wake or if any other non-standard behaviour was present. Figure 9 shows the power spectrum over the normalized frequency for three turbines of the front row. To simplify the analysis, we considered only three representative front-row turbines for analysing this cluster wake case: one turbine in free wind with maximum power (green), one turbine within the cluster wake with minimum power (blue), and one turbine in the transition region between cluster wake and free wind (cyan). In all the spectra, the peak with the highest amplitude is the eigenfrequency of the tower (ftower), as seen in the peak at (red dashed line in Fig. 9) and its subsequent multiples. This case study does not show additional excitations for specific modes by the cluster wake, as all the spectra overlap, also due to all the turbines having the same rotor speed. Additionally, we also show the spectrum obtained from the standard DLC 1.2 (normal turbine operation) aeroelastic simulation in BHawC for the same wind speed (black). The wind speed of the simulation spectrum is the same as the wind speed of the turbine in the cluster wake centre and the nacelle TI is also matched to be the same, at 6.5 %. Despite a small mismatch in amplitudes, the peaks of the spectrum occur at the same frequencies.
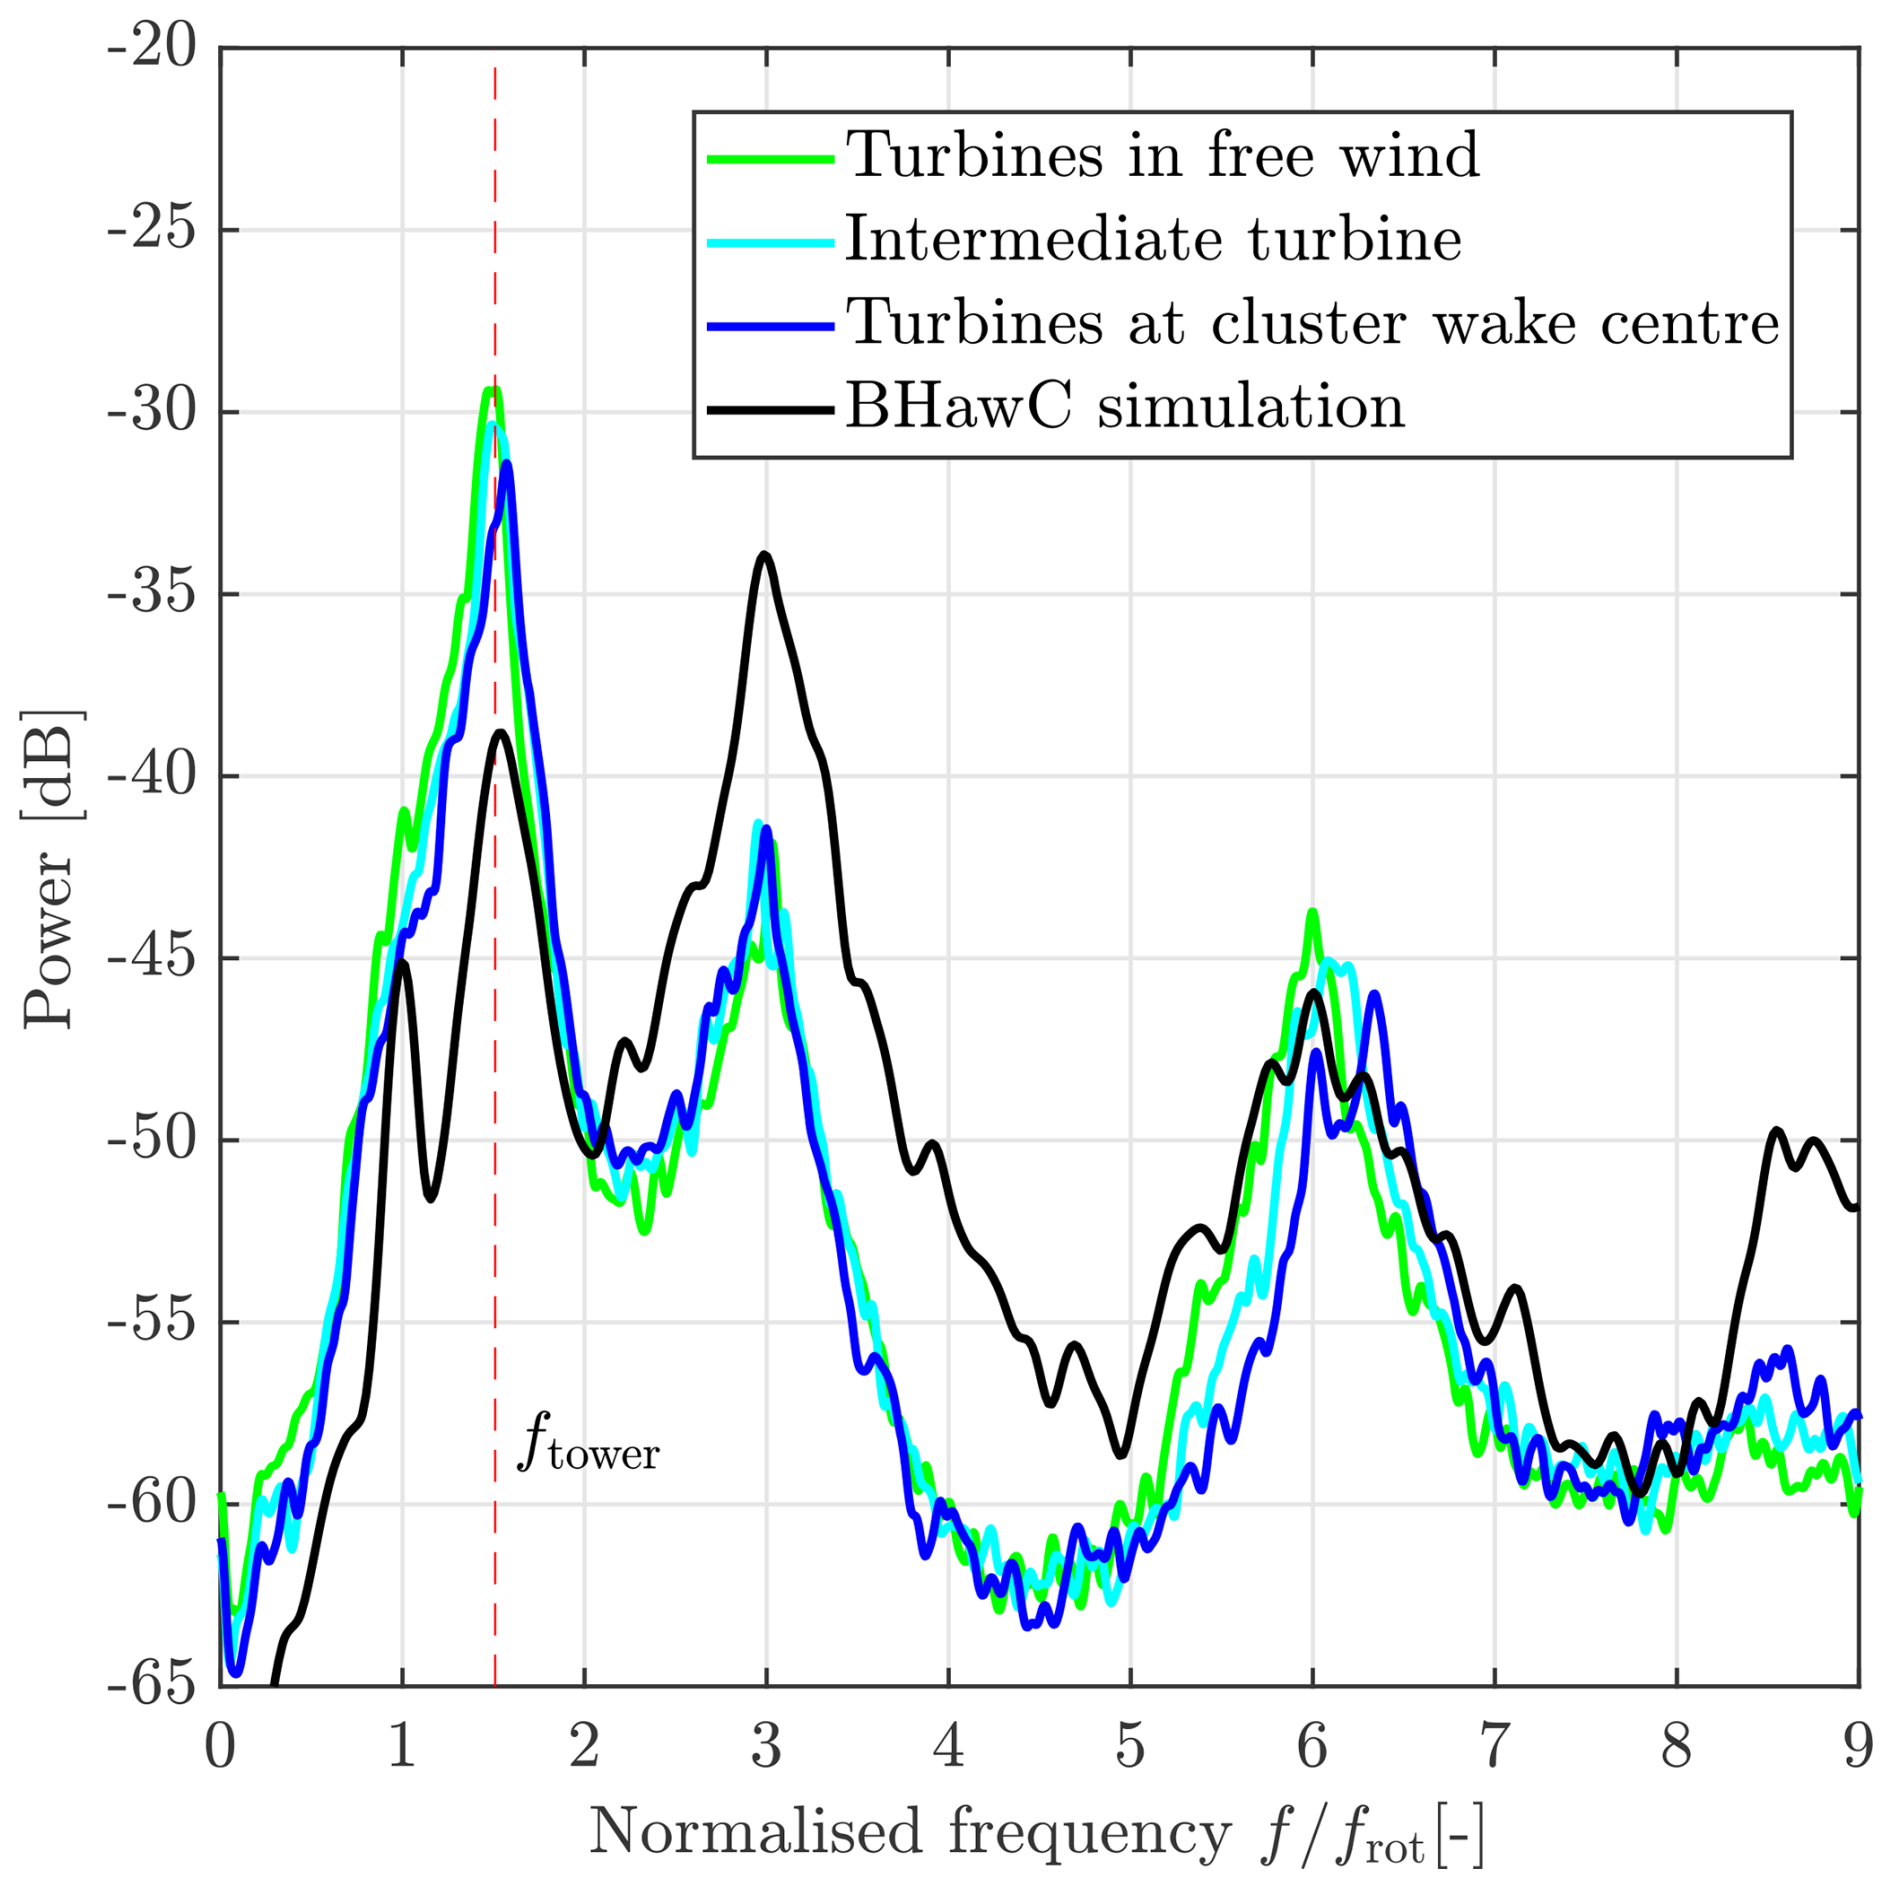
Figure 9Power spectrum (afa) of three turbines in the front row for the exemplary cluster wake situation: free wind (green), turbine at an intermediate location between maximum and minimum power deficit (cyan), and the turbine at the cluster wake centre (blue) plotted against the normalized frequency (with the rotational frequency) with the corresponding aeroelastic simulation from BHawC for the same wind speed of the turbine at the cluster wake centre. The first tower mode is marked with a red dashed vertical line.
4.2 Cluster wake effects on absolute turbine variables
Each cluster wake situation is classified by the magnitude of the maximum power deficit (ΔP) it causes, defined by the difference between the maximum and minimum turbine power along the front row. Figure 10a defines four sets of turbines (colours correspond to the same turbines in subsequent figures) to determine potential load effects caused by cluster wakes.
-
Free-wind turbines (green): turbines in freestream, and these include all turbines whose power ranges from the maximum in the front row to 10 % of the maximum power deficit is reached, .
-
Cluster wake turbines (blue): turbines directly affected by the cluster wake and centred around the turbine in the front row with the lowest power, including those turbines that continue to experience at least 50 % of the maximum power deficit, .
-
Inner-farm wake turbines (red): to get an estimate of the effect of inner-farm wakes, the same turbines that were used to create the SL-inner table are considered for the analysis of cluster wakes.
-
Last-row turbines (magenta): these were chosen to further analyse inner-farm effects as they contain the superposition of wakes of all turbine rows of the A/HS wind farm.
Figure 10b shows the absolute values normalized with the mean of the free-wind turbines across all 96 cases in the form of a box plot. The box plot displays the statistics across all the analysed cluster wake cases: the box edges represent the upper and lower quartiles, the line in the box middle is the median, the whiskers represent the minima and maxima that are not outliers, and the outliers are the circular markers. We clearly see that the inner-farm and last-row turbines experience higher accelerations, while the turbines in the cluster wake are subject to marginally lower nacelle accelerations than the free-wind turbines. The SL tables (Fig. 7a) show lower if the wind speed is reduced, which occurs at all the turbines affected by the cluster wake.
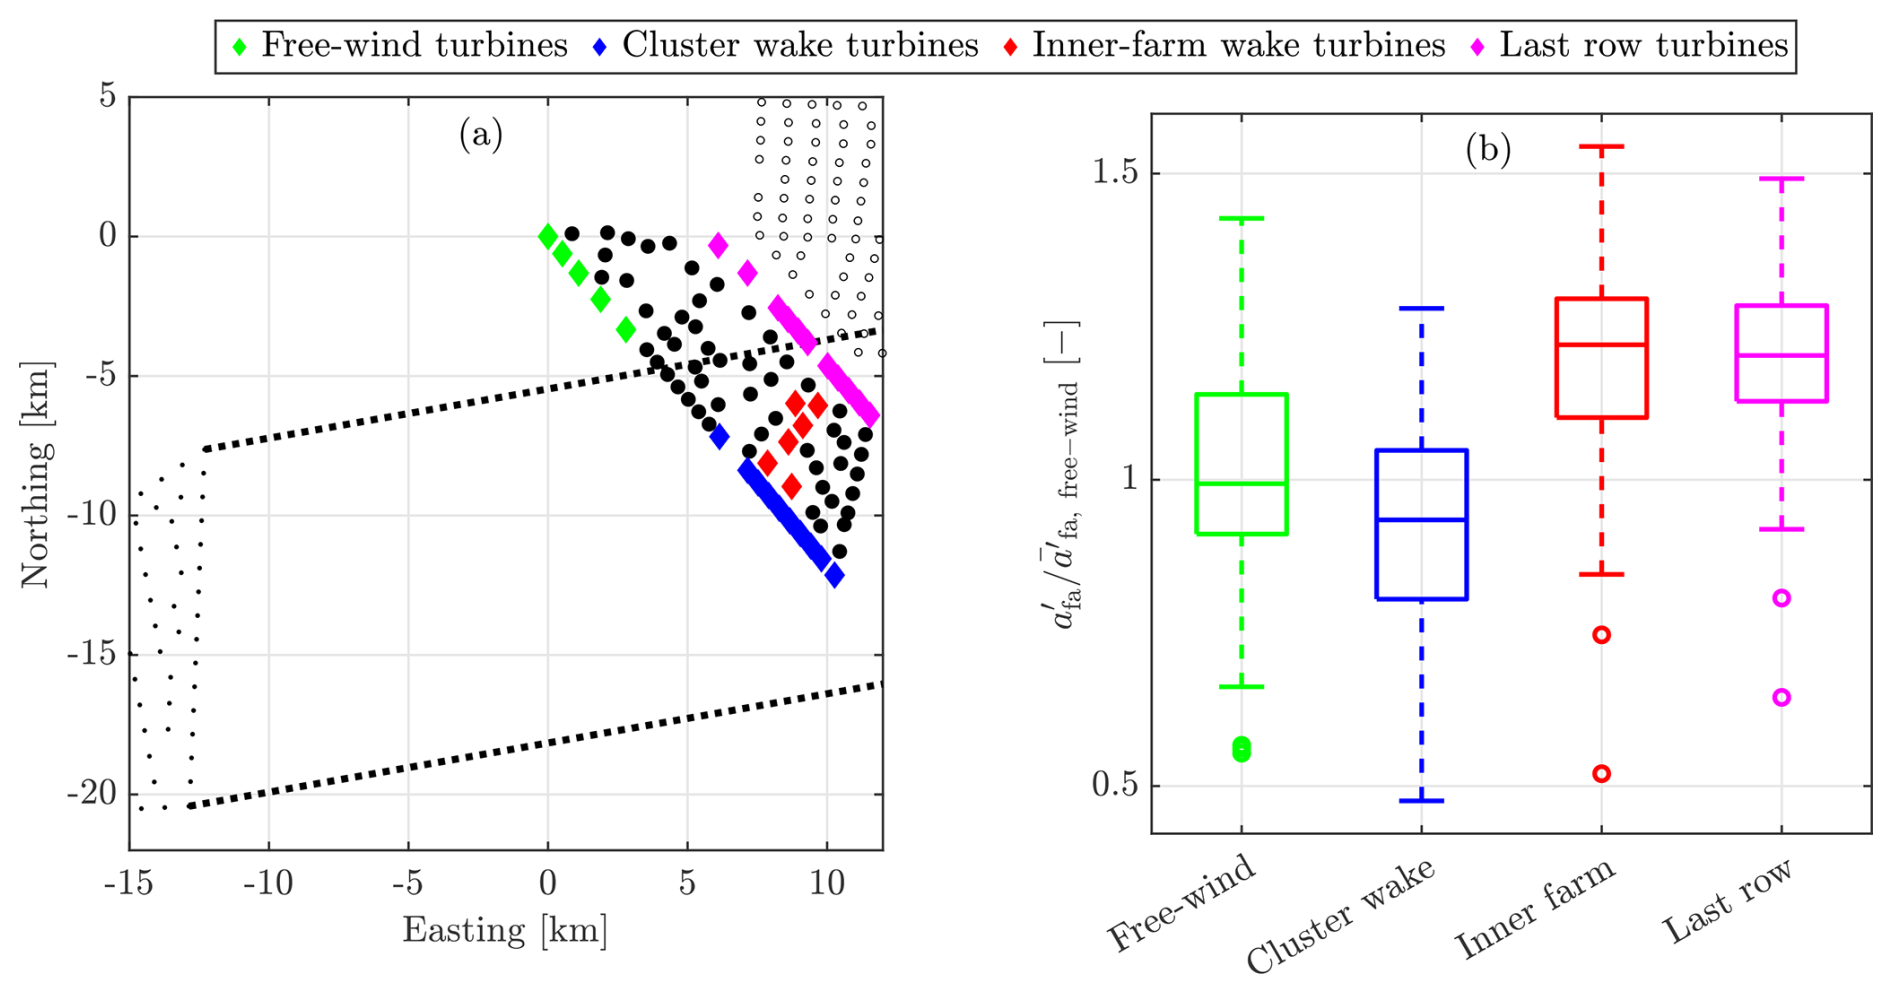
Figure 10(a) Top view of N-6 (black dots) and the A/HS wind farm for 260° wind direction. In A/HS, the free turbines (green), cluster wake turbines (blue), inner-farm turbines (red), and last-row turbines (magenta) are marked as turbine types for analysing load effects. (b) Absolute values normalized with the mean of free-wind turbines for all four turbine types (same colours as in a) across all the analysed cases, showing a significant increase in for turbines inside the wind farm and the last row, both experiencing the effects of inner-farm wakes. The scatter points outside the whiskers of the box plot are outliers.
Figure 11 shows the variation of the 10 min mean wind speed u and normalized wind speed fluctuations for all the cases. Since we use wind speeds from the nacelle anemometers, we do not refer to as the TI, but rather as the nacelle TI. It is evident that the inner-farm and last-row turbines experience both lower wind speeds and simultaneously much higher nacelle TI. Turbines within the cluster wake also have much lower wind speeds but slightly higher nacelle TI. Table 4 shows the summary of the average values of the four turbine types for all the variables of interest. The values represent the deviation on average from the free-wind turbines, so we observe that the cluster wake turbines have 15.5 % lower wind speeds but 16.3 % higher nacelle TI compared to the same cases of free-wind turbines. There is a 16.3 % increase in nacelle TI for the cluster-wake-affected turbines compared to a 80 % to 90 % increase in the nacelle TI for the inner-farm and last-row turbines. This marginal increase could be due to an increase in the atmospheric TI due to the cluster wake, but it could also be attributed to the uncertainties in using nacelle anemometers as a reference metric, which we discuss further in Sect. 5. We also show the effects on the last row of turbines, which are impacted by the aggregation of all upstream turbine wakes, and the qualitative results match the inner-farm turbines, which would experience only the wakes of a few turbines. We also made a comparison of the turbines in the last row for SSW wind directions and found no increase in when splitting the last row into halves: one containing only inner-farm wakes and one containing the additional cluster-wake-caused velocity deficits. Though the turbine layout affects the propagation of inner-farm wakes, the similar effects on the inner-farm and last-row turbines in Table 4 indicate no combined effects of the cluster wake on inner-farm turbines.
Table 4Effects of the cluster wake on the three turbine types, expressed as percentage differences from the free-wind turbines. The values were obtained by grouping the turbine types and averaging over all the 10 min data.
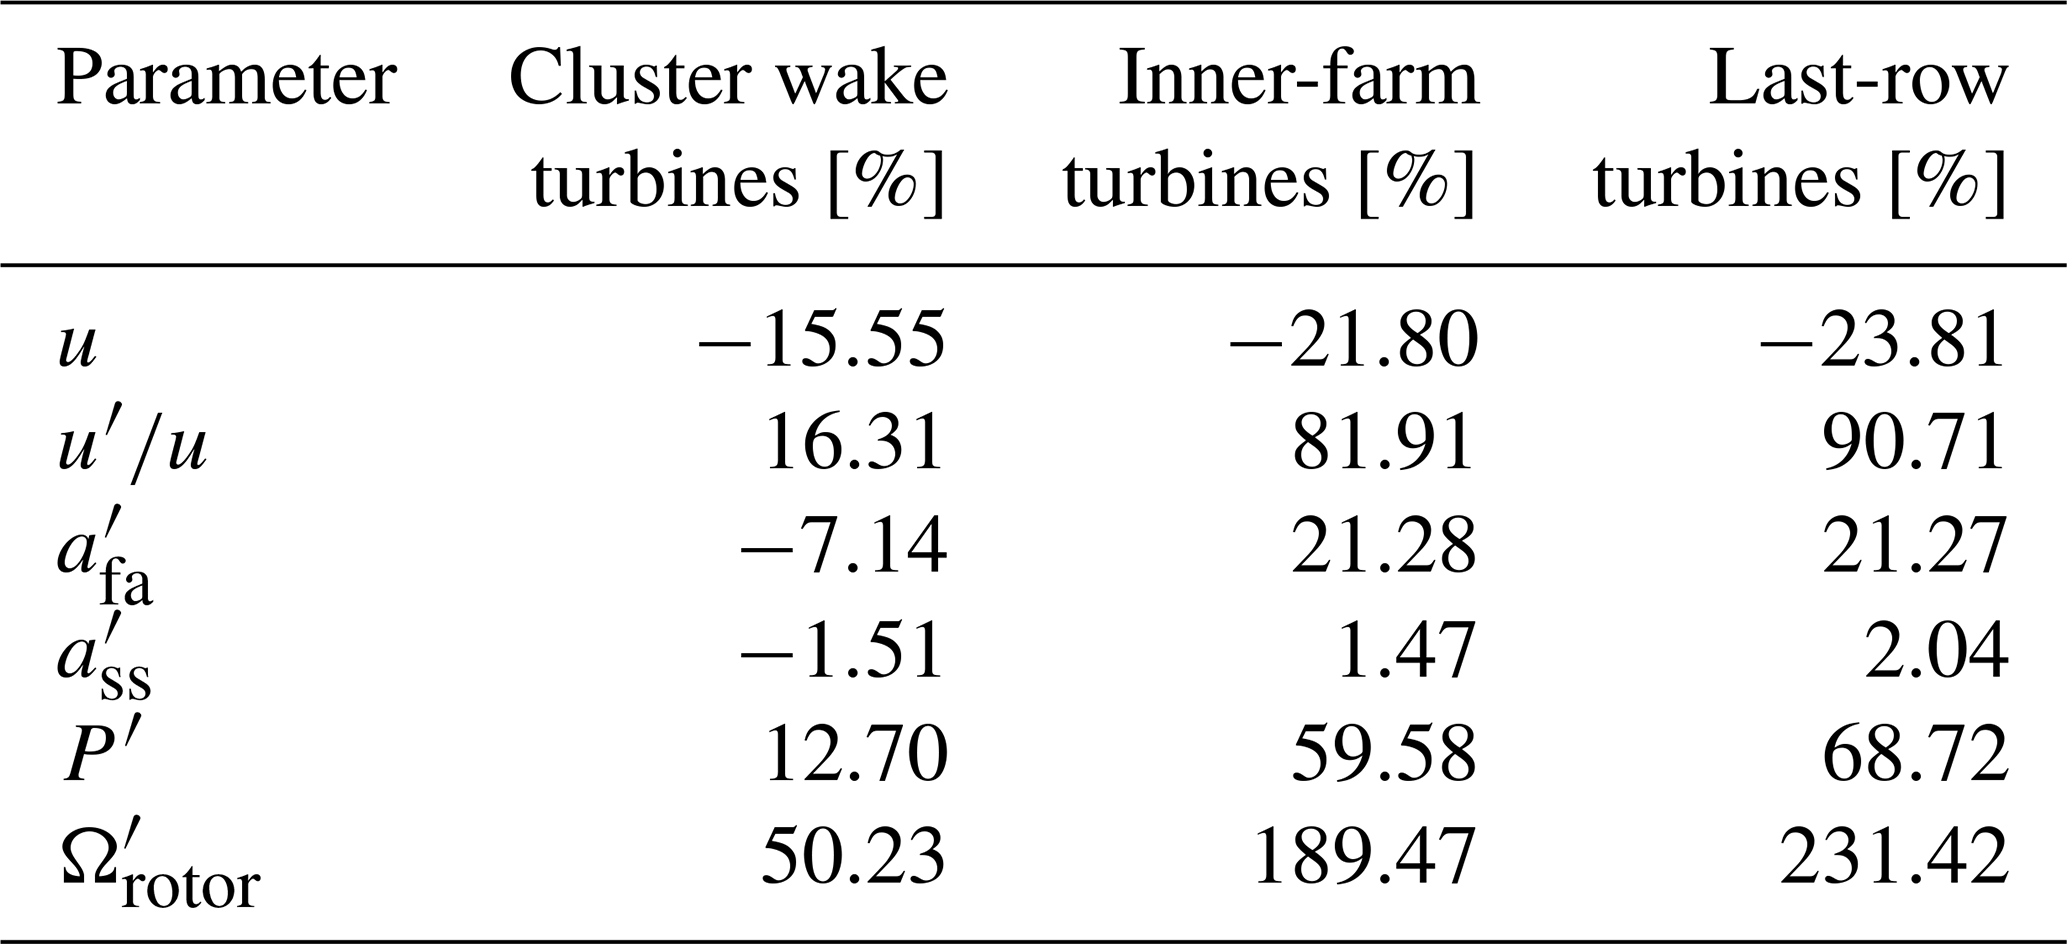
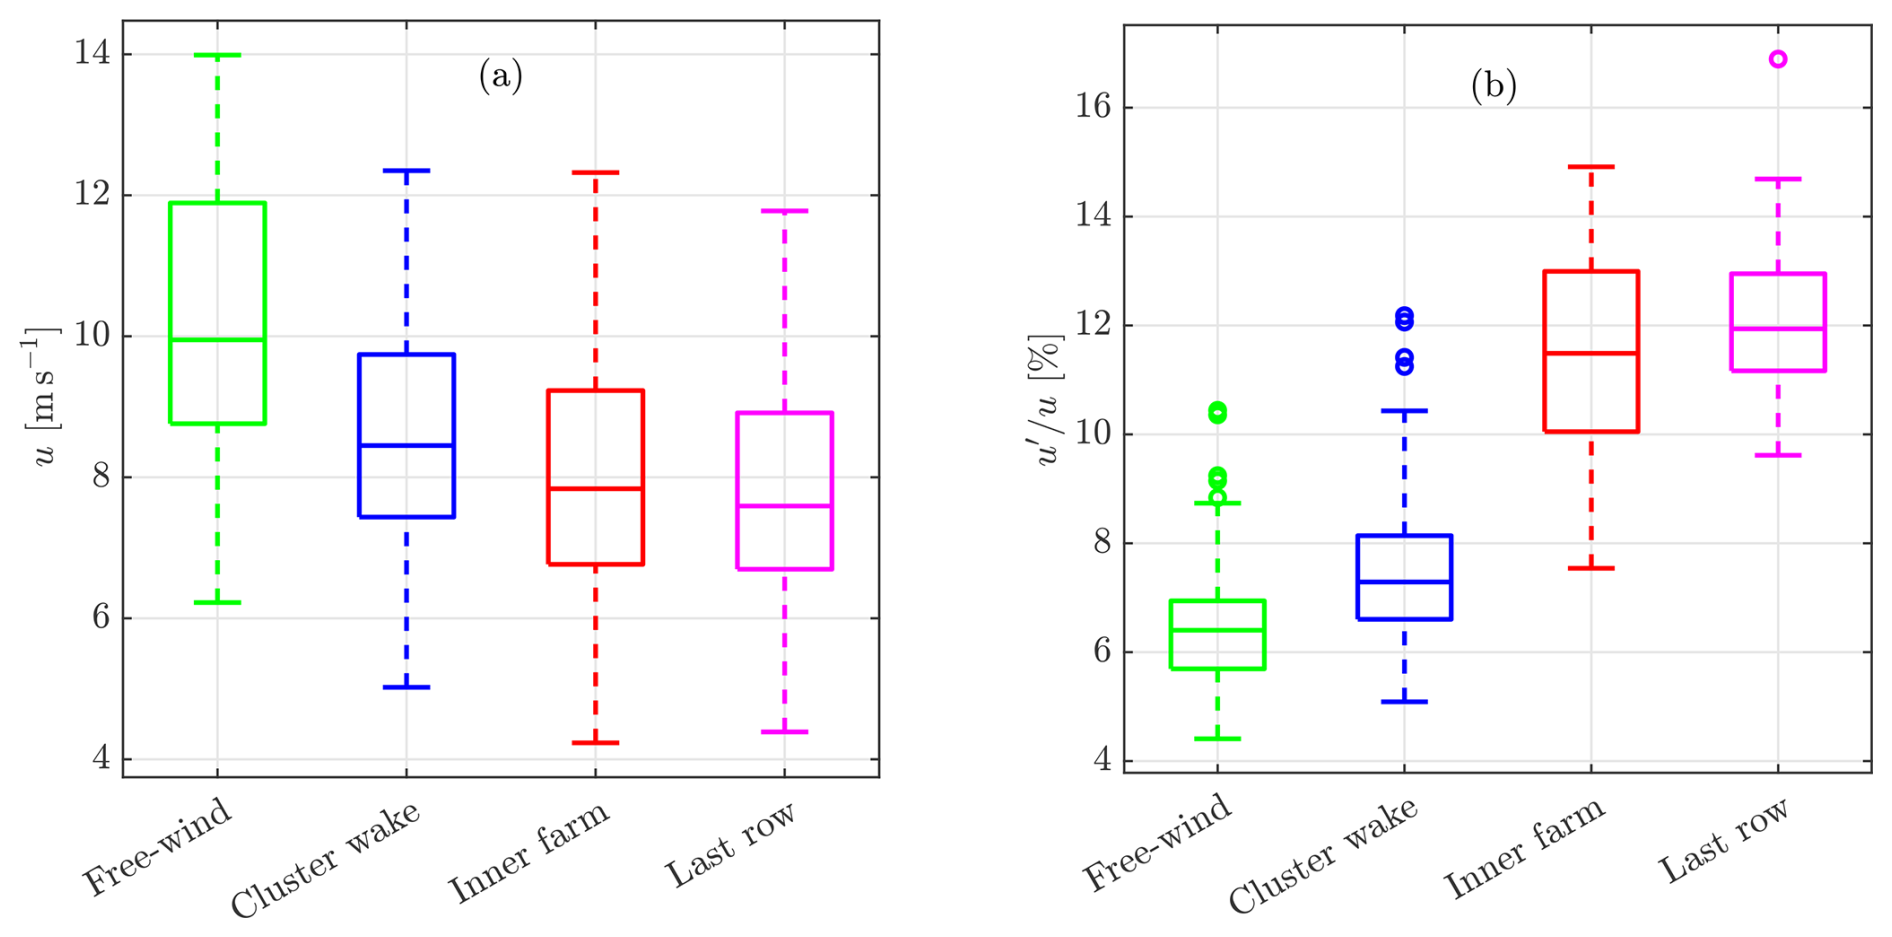
Figure 11(a) Distribution of absolute wind speed u and (b) normalized wind speed fluctuations for all cases. The wake-affected turbines (blue, red, and magenta) have lower u and higher compared to the free-wind turbines (green). The colour coding follows Fig. 10.
In general, the values of both fore–aft and side–side (not shown) accelerations are lower for cluster-wake-affected turbines, but all the other variables show an increase. On the one hand, the wind speed is lower in the cluster wake, but the wind speed fluctuations are higher, causing potentially higher fatigue loads. These two phenomena counterbalance each other, but we have to analyse this further, as absolute value increases are not significant if there is no reference for comparison and the magnitude of load effects is also much smaller than for the turbines inside the wind farm. The power and the rotor speed fluctuations are also uncertain parameters to draw conclusions as we found their performance to not be consistent as a function of wind speed and chosen turbine types. There could be biases in the data or other weather phenomena that could also affect the values for the free-wind turbines, leading to much lower fluctuations.
4.3 Cluster wake effects quantified using reference loads
In the previous section we found that, on average, the cluster wakes do not increase the nacelle accelerations and even cause a reduction in loads due to the lower wind speeds within the wake region. We created reference load tables in Sect. 3.2 to compare load effects independent of the wind speed and defined two performance indicators, ζfree and ζinner, in Sect. 3.3 to conveniently quantify fatigue load effects caused by the cluster wake using the SL tables in free-wind and inner-farm wake situations.
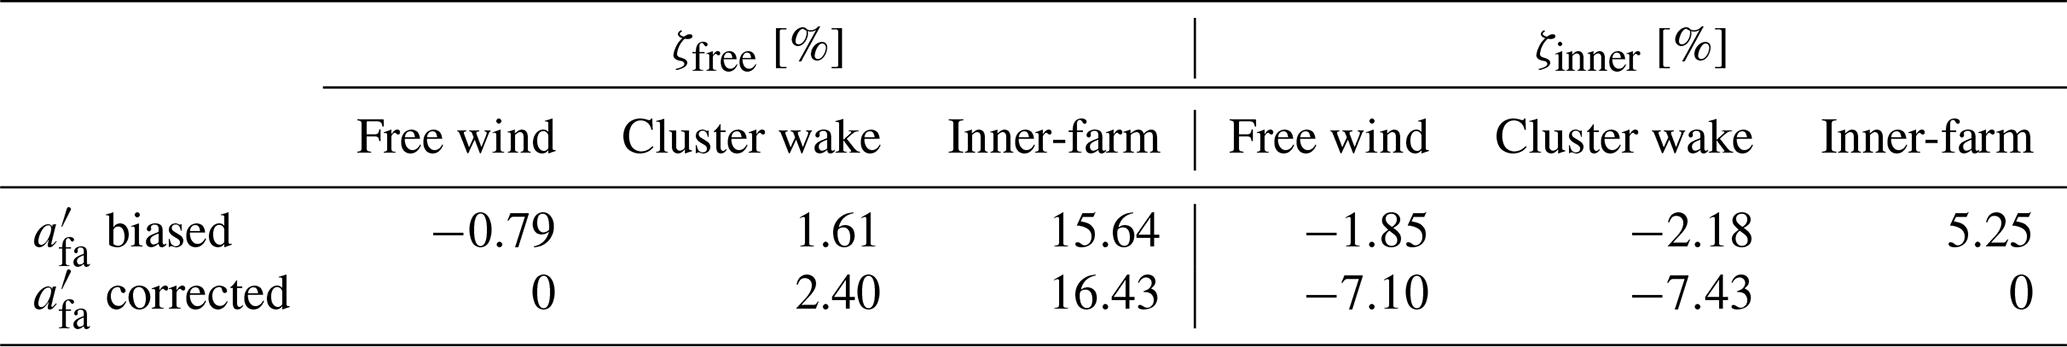
Figure 12 displays the averages of ζfree and ζinner as a function of u, , and in each bin along with the standard deviations of each bin as error bars. We do not show the last-row turbines in Figs. 12 to 14 as their load effects are similar to the inner-farm turbines. The distributions of both ζfree and ζinner for cluster wake turbines (blue) significantly differ from inner-farm turbines and are quite close to those of the free-wind turbines. There is also no dependency of the cluster wake turbine loads on u and u′. This can be observed from the near-zero lines for the free-wind and cluster-wake-affected turbines in Fig. 12a, b, d, and e. Figure 12c and f show the performance indicators ζ as a function of the normalized cluster wake power deficit. An increasing magnitude of the (normalized) cluster wake power deficit seems to marginally cause higher loads. It is to be noted that the power deficit in these two plots differs for each turbine, as opposed to one uniform power deficit for the 1 h cluster wake situation shown in Sect. 4.1. This is evident from the free turbine lines (green) which do not proceed beyond zero, as they are the turbines that do not see a power deficit in the front row. Qualitatively, there is no effect of the cluster wake on loads dependent on these three parameters. To quantify the effect, we calculated the mean of the entire distribution of points, and the results are summarized in Table 5. The uncertainty in the SL tables is also evident from these results, as for free-wind turbines and ζinner=5.25 % for inner-farm turbines, which should be zero in the ideal case. Despite these biases, the cluster wake turbines are significantly lower in load effects than the inner-farm wake turbines. In the second row of Table 5 the values are corrected by these biases. Considering this correction, the cluster wake turbines have 2.4 % higher loads when considering ζfree (second table row, correcting for the bias), not accounting for any atmospheric effects. The ζinner shows almost similar values for turbines in the cluster wake and free-wind turbines.
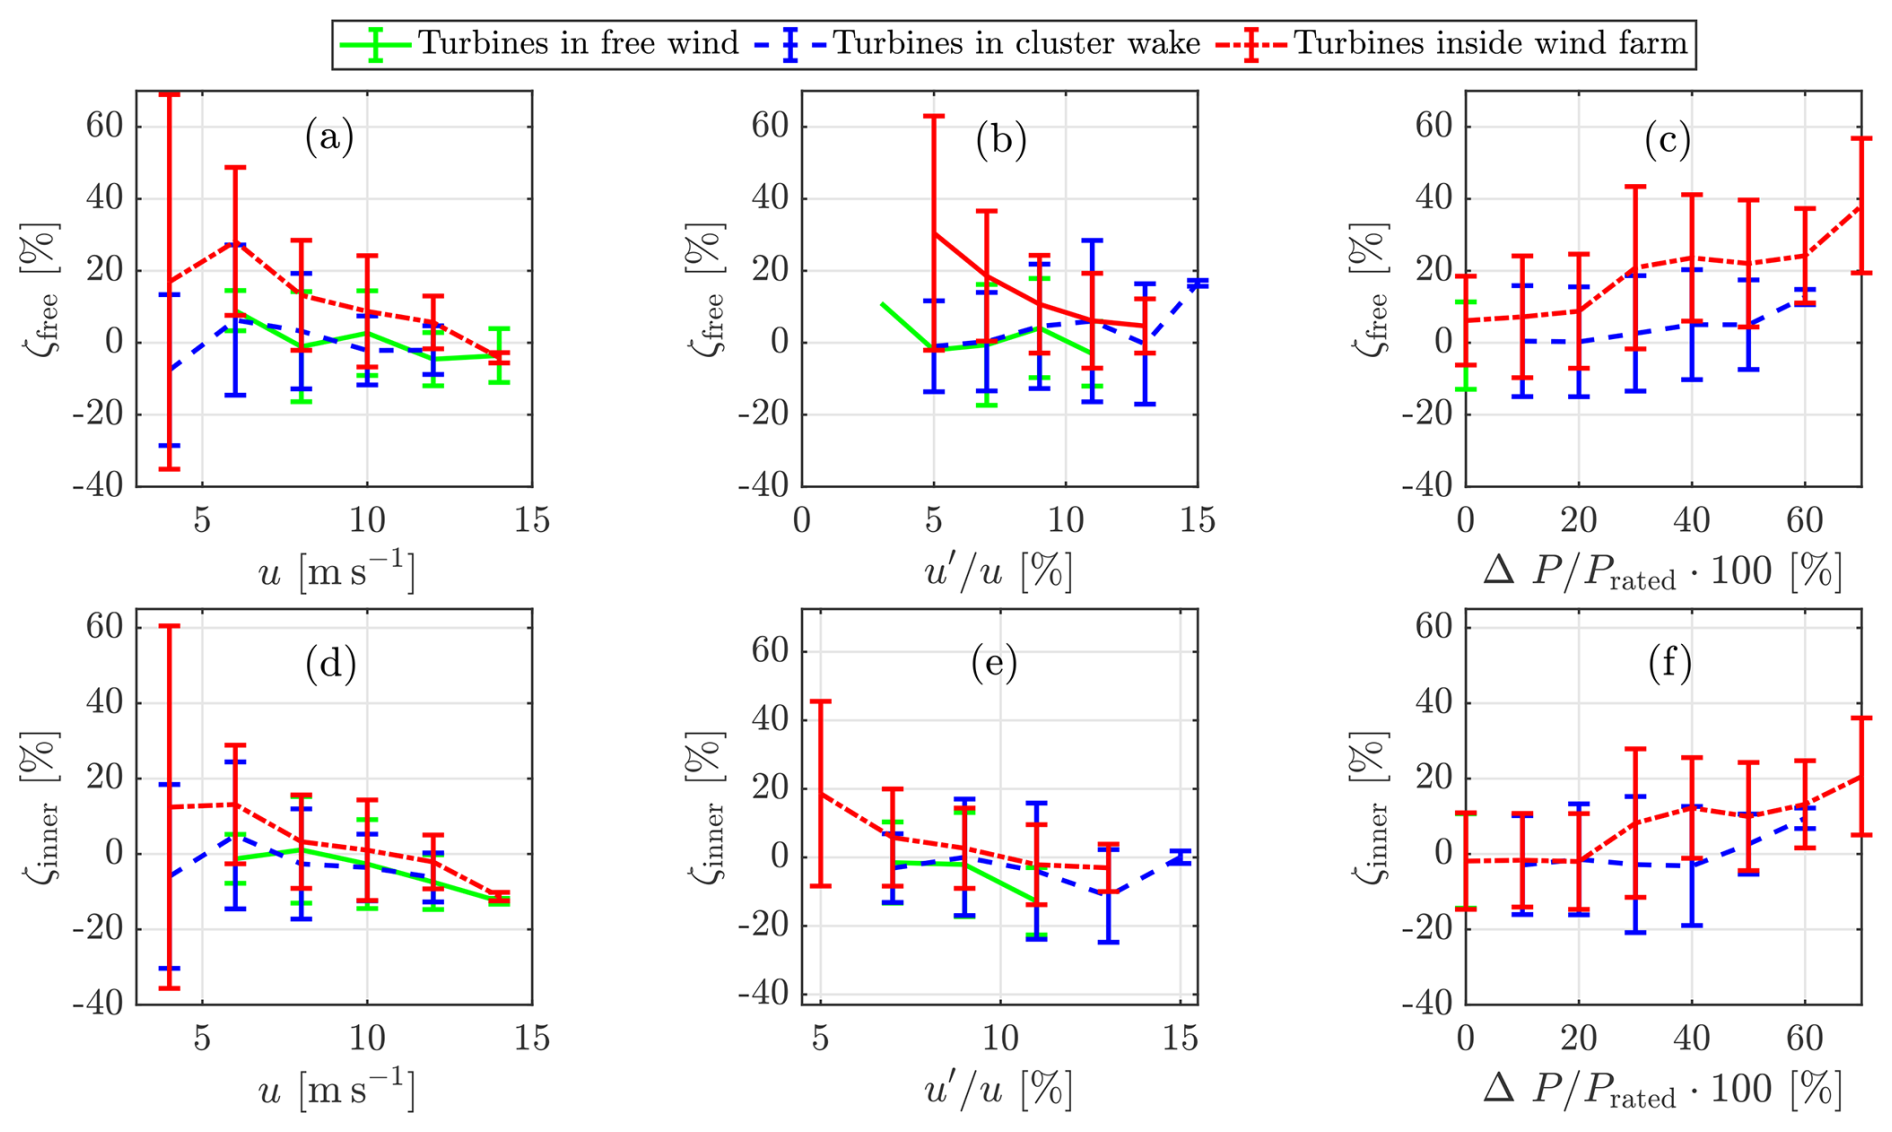
Figure 12Binned averages of the performance indicators ζfree and ζinner as a function of u (a, d), normalized fluctuations of the wind speed (b, e), and the magnitude of a turbine's power difference from freestream turbine power, expressed as a percentage of rated power (c, f). The error bars are the standard deviations of ζfree and ζinner for each bin.
Table 5Cluster wake effects on , expressed as deviations from the SL tables.
Atmospheric stability is an important parameter that affects the wake recovery of single turbine wakes and also cluster wakes. We compared the performance parameters as a function of atmospheric stability, shown by the bar graph in Fig. 13. The uncertainties are slightly higher for neutral and stable stratification than unstable stratification. This is directly related to the number of cluster wake cases in each stability class, as seen in Table 2. We also tried finer classifications of atmospheric stability and did not find any noticeable differences compared to the more coarse classification presented here. The deviation from the SL tables for inner-farm turbines is still much higher than the other two turbine sets, but the differences between the free turbines and cluster wake turbines are once again marginal. In all the cases, wind turbines affected by the cluster wake experience slightly higher loads (≈2.5 %) than the turbines in free-wind conditions when the lower wind speeds in the cluster wake are accounted for using performance indicators.
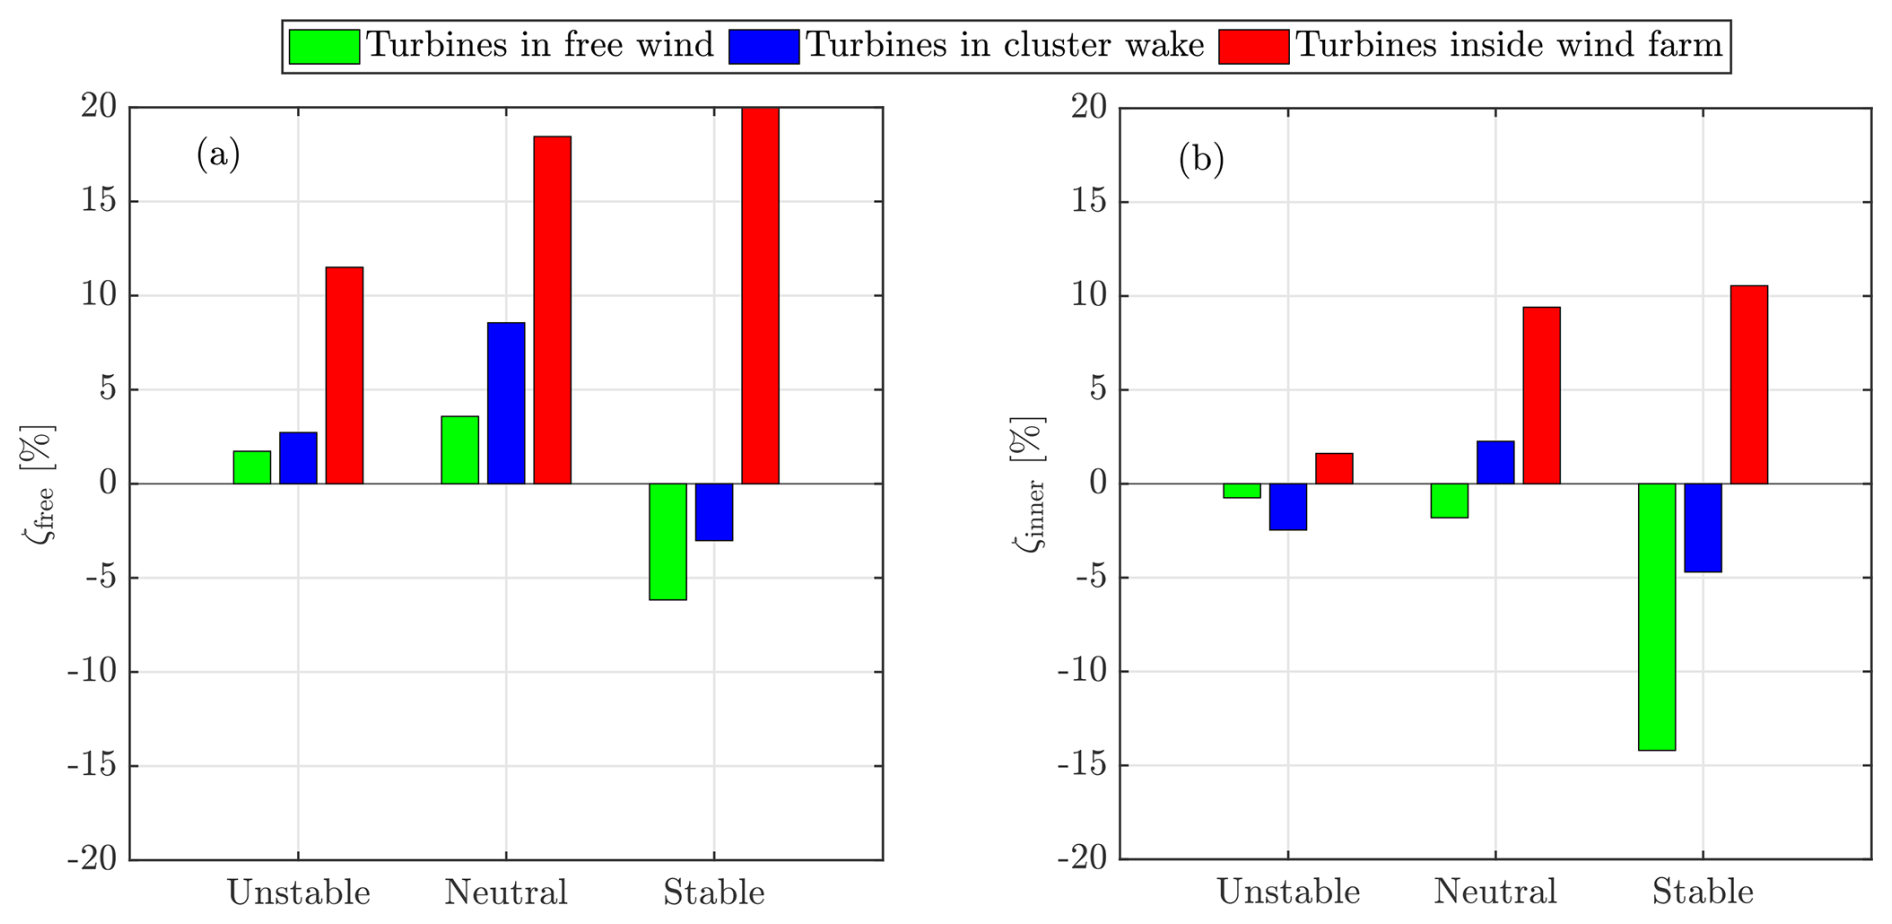
Figure 13Bar graphs showing the performance indicators averaged over all turbines in a set for different atmospheric stability regimes, (a) ζfree and (b) ζinner.
4.4 Spectral analysis
We used the 10 Hz nacelle fore–aft acceleration data to obtain the power spectrum for the different turbine types with the aim of quantifying the dynamic response of the turbines to the cluster wake. We considered the same three turbines as in the exemplary cluster wake situation (see Sect. 4.1): two turbines with maximum and minimum power and one lying in the intermediate section, all in the front row. Since cluster wakes do not usually have a well-defined boundary, the intermediate turbine is taken as a representation of the transition between the freestream and maximum cluster-wake-caused velocity deficit. We then averaged the spectra for these turbines across all 56 cases with high-frequency data, and the result is shown in Fig. 14a. Since the spectra for the different turbines across all cases are at different rotor speeds, the spectra are plotted against the frequency normalized by the first tower eigenfrequency. All the spectra overlap, and there are no modes excited at turbines either inside the cluster wake or close to the wake boundary. This is across all the wind speeds and atmospheric conditions, so excited frequencies in certain conditions could be averaged out. We thus quantified the 10 highest peaks in each spectrum. The histograms of the excited frequencies are shown in Fig. 14b. The amplitudes of the usual mode peaks are not significantly changed across the turbines affected by the cluster wake (cyan and blue spectra in Fig. 14).
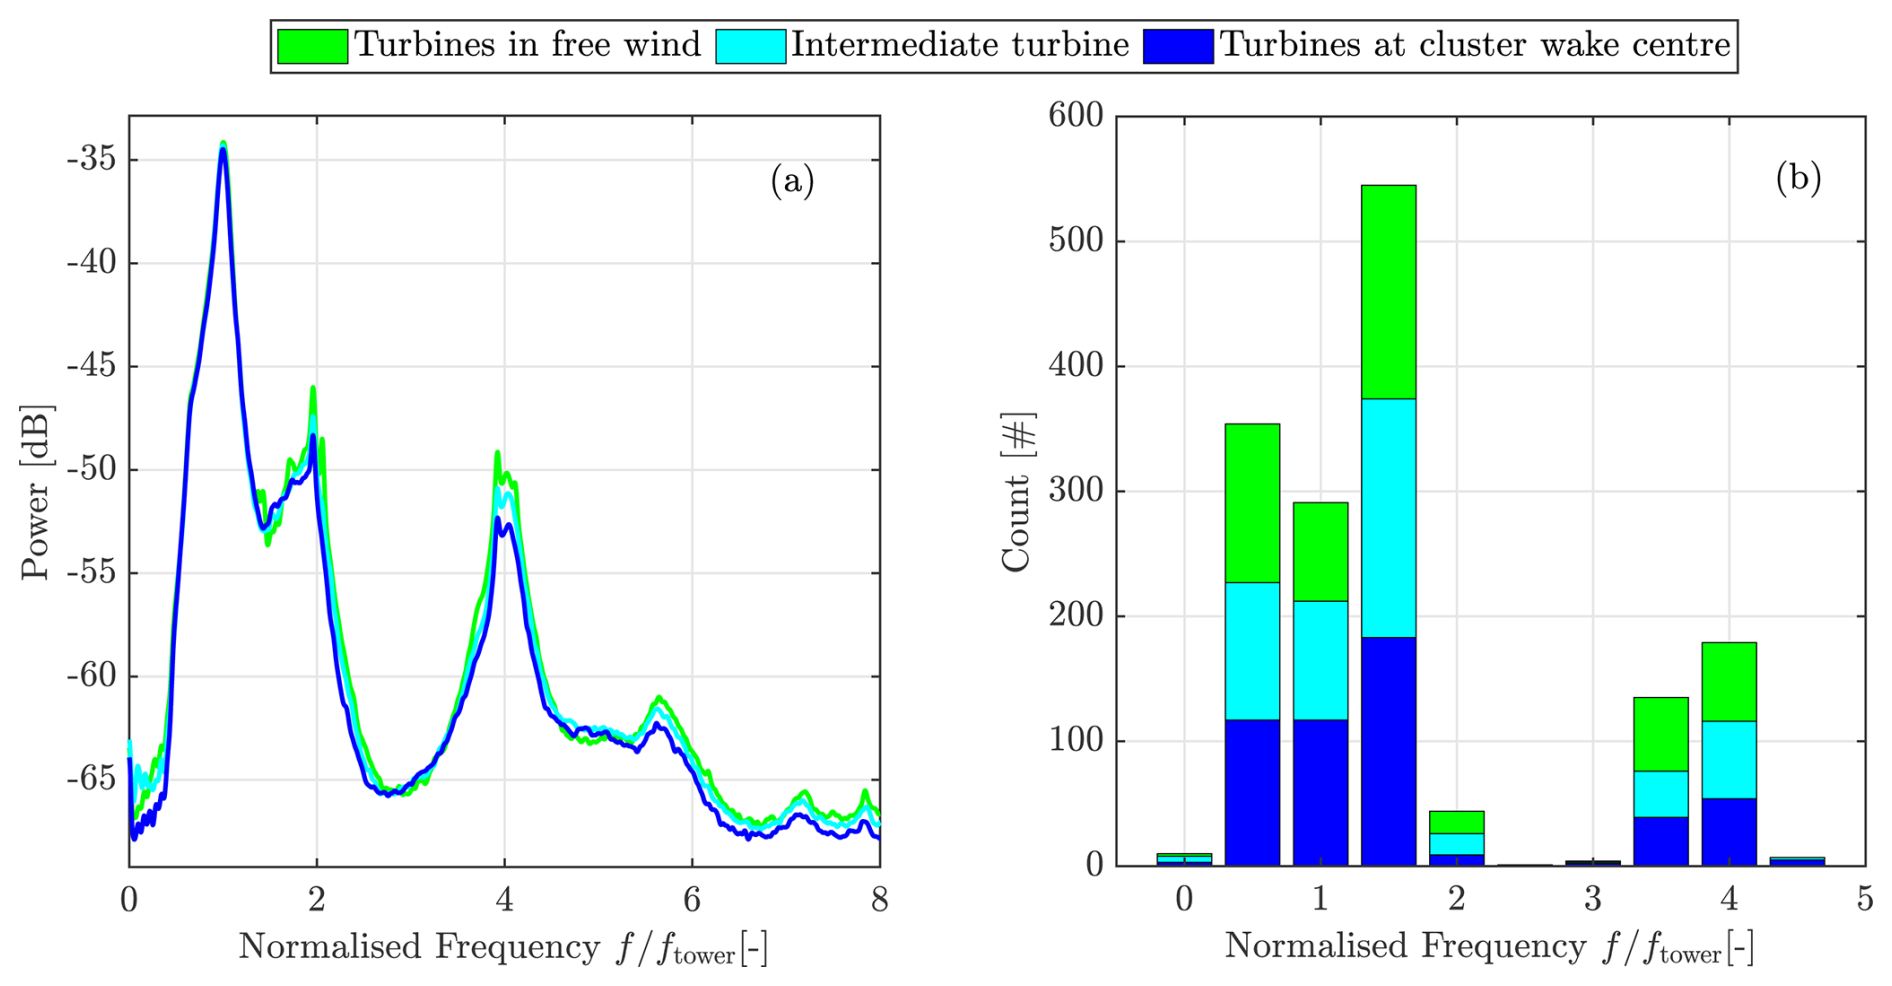
Figure 14(a) Averaged spectra of the three turbine types as in Fig. 9. The spectra across all the cases are averaged and peaks overlap at the same frequencies, normalized with the first tower fundamental frequency. (b) Histogram showing the distribution of the 10 highest-amplitude peaks excited for all the cases and turbine types, again showing no additional excited modes due to the cluster wake. The bar–histogram plots are stacked on top of each other to represent all the peaks of each turbine type.
This is, however, insufficient to conclude on frequency excitation as there could be single situations with additional mode excitations. We manually went through all the cases where the spectra were available (56 out of the 96 cases) and determined only two situations where the spectra differed. The first was when the rotor speed differed significantly between the three turbine types, causing shifted peaks at the harmonics. The second situation when the spectra did not match was close to cut-in, when several factors could affect turbine performance (such as pitching). Nevertheless, only three cluster wake cases out of 56 presented mismatched spectra, and we did not analyse these in further detail as the cluster wake turbine did not present additional frequency excitations.
We used SCADA data to determine if cluster wakes affect a short-term fatigue load proxy of offshore wind turbine response and also classified the effect based on atmospheric conditions. The load proxy was found to be lower in cluster-wake-affected turbines due to the lower wind speed but marginally higher when compared to reference situations of turbines in free-wind conditions. We also analysed the nacelle acceleration spectra and found no increased response amplitudes at certain frequencies at the cluster-wake-affected turbines below-rated wind speeds. We discuss the implications of these findings, along with the validity of using said load proxies and the limitations of the current analysis.
Pettas et al. (2021) found the maximum distance that the wakes from neighbouring wind farms impacted SCADA signals was 6.5 km. The upstream wind farm in their study (Trianel Borkum 1) had 40 turbines and a total wind farm rated power of 200 MW. We only considered this situation as a point of comparison as further cluster wake scenarios in their study had low inter-farm distances (<3 km). They found that the DEL did not show any significant changes at 6.5 km downstream distances, and the only parameters that showed increased values due to the cluster wake were the blade pitch and the generator speed.
Comparatively, the upstream wind farm cluster in our study has a total rated power of 1062 MW. We found a small increase in the nacelle TI for the turbines in the cluster wake more than 15 km downstream, shown in Table 4. This increase in the absolute value of nacelle TI is far lower than the corresponding increase due to inner-farm wakes. Additionally, we also found that the fluctuations of the generator speed and turbine power increased in cluster-wake-affected turbines, but the magnitude of the increase was much lower than for the turbines inside the wind farm. We consider the smaller increases in nacelle TI, generator speed fluctuations, and turbine power fluctuations to be partially affected by signal uncertainties. We recommend more data over longer periods be analysed to definitely conclude on a potential effect in these variables for cluster-wake-affected turbines. Our load proxy () shows a reduction in absolute values. The lower wind speeds due to the cluster wake seem to be the primary contributors to load reduction overshadowing the effect of the increased fluctuations in wind speed. This is, however, different when the reductions in the wind speed are taken into account and the loads are compared to a reference at local wind conditions. For this purpose, we introduced two performance parameters ζfree and ζinner. We found a 2.4 % increase in these parameters caused by the cluster wake. We further confirm that despite very large power differences (up to 50 % of rated power) caused by the cluster wake, the load proxy is not impacted, even when compared to reference turbines in free-wind conditions. There is a marginal increase in the performance parameters used to analyse loads with an increase in the power deficit, but Fig. 12c and f also have much higher deviations in values, as seen by the wide error bars. In all the cases considered, the cluster-wake-affected turbines seem to be marginally affected by the cluster wake, though not as significantly as the inner-farm wake-affected turbines when reduction in wind speeds are accounted for within the cluster wake region. The marginal load increase could be attributed to the increased fluctuations of the wind speed within the wake, but further analysis from load sensors and more cluster wake situations are needed to quantify these load effects.
5.1 Nacelle accelerations as a load proxy and comparison of spectra
Nacelle accelerations have been shown to be a very good proxy for loads since they are significantly impacted by the turbulence intensity (Cosack, 2010). We also performed correlation studies with load measurements from two offshore wind farms and determined that the fore–aft nacelle accelerations were an appropriate choice to analyse load effects due to cluster wakes. The load proxy also does not perform well when the wind speed fluctuations are higher, which occurs when there is increased atmospheric turbulence due to inner-farm wakes. This is apparent from the higher biases in the ζinner parameter and also in the SL-inner tables (not shown), which has higher SEM values compared to SL-free.
We compared nacelle acceleration spectra from aeroelastic simulations with BHawC to spectra from load signals and found that the nacelle acceleration spectra are most similar to the tower base and tower top fore–aft bending moment spectra. However, these are simulations for onshore turbines and do not take into consideration hydrodynamics or any potential yaw misalignments which could affect the spectrum. Despite the minor offset in spectral power between simulations and measurements, the peaks in the simulated spectrum are the same when compared to high-frequency nacelle accelerations from SCADA. When there are rotor speed differences, the spectral peaks consist of the fundamental tower mode, along with harmonics of the blade passing frequencies, which are clearly distinguishable, except close to cut-in wind speeds. The difference in the wind speeds due to the cluster wake does not impact the shape of the spectra or excited frequencies, and possible regions where an effect could occur are closer to cut-in wind speeds. This is also where pitching affects turbine operation and is not taken into account in either the generation of the SL tables or in the analysis of the spectra. There could also be startup effects of the turbine, so analysing this wind speed region becomes complex and requires a large amount of data. Most of the cases we analysed in load spectra were in unstable atmospheric stratification (10 Hz data available for 56 out of 96 cases), so we were unable to distinguish the spectral peaks between different atmospheric stratifications.
5.2 Data limitations and scope for further research
The reference loads (SL tables) were created from more than 2.5 years of SCADA, classified in bins of u and u′. Each bin was only considered valid when there was a balance between a sufficient number of data points and a low standard error of the in the same bin (see Sect. 3.2). In spite of these conditions, Fig. 13 shows that biases are present in the calculated performance indicators. This is approximately 6 % (stable conditions) for free-wind turbine ζfree in Fig. 13a and −14 % (stable conditions) for inner-farm turbine ζinner in Fig. 13b, both of which should be zero, since they contain the reference loads used to create the SL tables. This could result from a lower number of cluster wake cases for neutral and stable stratifications. Another reason for increased biases could be the binning of the nacelle accelerations as a function of u and u′, both measured by nacelle anemometers. St. Martin et al. (2017) found that transfer functions are required to be corrected for the nacelle-anemometer-measured statistics. These corrections were found to be higher for unstable atmospheric stratification and higher turbulence intensities. ζinner shows increased bias, which also points to it not being a reliable indicator of load effects due to cluster wakes. This could mean that creating SL tables requires more parameters (stability in particular) as inputs when there is higher turbulence due to ambient conditions or single wake effects or that even more data are required for reference conditions of inner-farm wakes.
We also performed statistical tests on the distributions of ζfree when comparing free-wind turbines and cluster-wake-affected turbines to determine if the presented results showed statistical significance. We used both the two-sided t test and Welch’s ANOVA test (Wackerly, 2008), with the latter not assuming that the two variables have equal variances. It is to be noted that while there are only 96 cluster wake situations, the ζfree parameter is calculated on a turbine basis (see Sect. 4.2). This means, for example, that ζfree for cluster-wake-affected turbines actually contains 1180 values. The results from both tests show p values less than 0.05 for the 5 % significance level and a conclusive rejection of the null hypothesis. This means that the presented methodology to quantify load effects shows statistically significant results.
Table 4 shows that if only is considered as a load proxy, then the load effects for the cluster wake situations are even lower than those for the turbines in free wind. This could also be similar to a case study from Neumann and Emeis (2020), who found reduced turbulent kinetic energy (TKE) above a wind farm within the cluster wake region, even lower than the ambient TKE, but more sensor data are needed to confirm the TKE effects for the analysed cluster. However, we have seen that when the values are compared to a reference at the same local wind speeds, there are slightly higher loads. The results can be interpreted in two ways: in absolute values, the cluster wakes have no increased load effects and can even be beneficial by causing lower loads due to lower wind speeds. However, when local conditions of wind speed are accounted for, there are slightly increased loads. Determining whether this would affect lifetime fatigue loads requires more data, preferably from direct load measurements representative for the complete set of site-specific environmental and operating conditions. We also noticed that the absolute fluctuation values of the rotor speed and the power are increased, which is similar to the findings of Pettas et al. (2021), even though their comparisons were long-term averages and wind-speed-binned. We found that the turbines within the cluster wake on average had higher nacelle-based TI, though the location of the anemometers makes it difficult to conclude on the effects of the cluster wake on inflow TI. Nacelle anemometer measurements have been shown to capture wake effects inside wind farms (Kang and Won, 2015) and also the ambient TI, though with disturbance due to the effect of the rotor (Göçmen and Giebel, 2016). We found the resulting increased nacelle-based TI to be smaller for cluster wake turbines than for inner-farm turbines. Another factor that could affect the inner-farm turbine values is the superposition of two effects: cluster wakes and inner-farm wakes. There could be smaller effects in the row of turbines directly behind the front row, but it is difficult to distinguish an already small load increase due to cluster wakes with inner-farm wake added to it.
Although we utilized a suitable proxy for loads, ultimately, strain gauge measurements on turbines in cluster wake situations could further strengthen the conclusions. Ziegler et al. (2017) used only tower bottom strain gauge measurements and found it sufficient for structural monitoring and lifetime assessment of offshore wind turbines on monopiles. It is also possible that the cluster wake partially affects only one load parameter that was not directly correlated with the nacelle accelerations. Shaler et al. (2023) state that the most important parameters for fatigue and ultimate load analysis of turbines are the ambient turbulence and the vertical wind shear in the most dominant wind direction. Measurements of the TI at multiple locations would be ideal, as it will answer the question of how much the cluster wakes impact TI, also as a function of atmospheric stability. Furthermore, direct load measurements would enable DEL comparisons, and long-term statistics can then be compared against the simulated design loads. This will be particularly beneficial for the operators of wind farms that experience frequent cluster wakes and turbine manufacturers to know the potential effects of such conditions on the design load envelope. The calculated load increase in reference conditions is also limited to the analysed wind farm cluster, and the effects on loads will depend on not only the cluster layout, but also the operating conditions of turbines in both clusters. Additionally, high-frequency SCADA data could be used for analysing the wind turbine response to the transients at the moment the cluster wake impacts the downstream wind farms. Cluster wakes are inherently complex flow structures, and using only 10 min SCADA could leave out crucial information on the flow dynamics that could adversely impact the fatigue life of offshore wind turbines.
We aimed to experimentally quantify the effects of 15 to 21 km long cluster wakes on the short-term fatigue loading of offshore wind turbines dependent on atmospheric stability. Although cluster wakes cause wind speed deficits that lead to significant power losses, we found that they only marginally affect the fluctuations of the nacelle fore–aft acceleration, which was used as a proxy for fore–aft turbine loading. In absolute values, turbines in a cluster wake experience lower load effects than turbines in free-wind conditions when considering the load proxy due to lower wind speeds in the wake region. However, cluster-waked turbines show marginally higher load effects (≈2.5 %) compared to free-wind turbines when comparing situations with the same local wind speeds and wind speed fluctuations. No significant dependency was observed of the loads on atmospheric stratification, mean wind speed, fluctuations in wind speed, or the magnitude of the cluster wake deficit, though the uncertainties are higher in specific situations due to limited data. Spectral analysis of high-frequency nacelle acceleration data showed no increase in the frequency peaks in the spectrum due to cluster wakes, while the overall mean spectral shapes also showed negligible differences.
The current analysis shows only marginal effects of cluster-wake-induced short-term fatigue loading on wind turbines with the available load proxy of fore–aft nacelle acceleration fluctuations in the same local wind conditions. While the conclusion that the cluster wakes do not excite modes is beneficial from a design point of view, there are also limitations to which the data set is subject. Damage equivalent load (DEL) calculations were not performed for short-term or long-term statistics since the analysed wind farm turbines did not have strain gauges for load measurements, but DEL is an important metric for fatigue analysis. Further work can also be directed at intermediate distances between wind farms (9 to 15 km), along with even more cases of confirmed cluster wake occurrence. Future research should use actual load measurements and determine if the increased fatigue effects warrant an amendment of the design standards for load analysis and wind farm site assessment.
The 10 min and 10 Hz SCADA data used in the paper were obtained through the wind turbine manufacturer Siemens Gamesa and cannot be shared due to confidentiality reasons.
AA, JS, LB, VB, PD, and MK conceived the idea of the research. AA developed the methodology, performed the data analysis, and wrote the paper. MK supervised the work. JS, LB, VB, FT, and MK contributed with several fruitful discussions. All co-authors thoroughly reviewed the paper.
The contact author has declared that none of the authors has any competing interests.
Publisher's note: Copernicus Publications remains neutral with regard to jurisdictional claims made in the text, published maps, institutional affiliations, or any other geographical representation in this paper. While Copernicus Publications makes every effort to include appropriate place names, the final responsibility lies with the authors.
We would like to thank Martin Dörenkämper for providing WRF data and Bastien Duboc for simulation data and discussions regarding BHawC. We would also like to thank Andreas Rott for the discussions and insights regarding data analysis and uncertainties.
This research has been partly supported by the Federal Ministry for Economic Affairs and Climate Action in the framework of the research projects X-Wakes (FKZ 03EE3008D) and C2-Wakes (FKZ 03EE3087B) on the basis of a decision by the German Bundestag and by the European Union's Horizon 2020 research and innovation programme under the Marie Skłodowska-Curie grant agreement no. 858358 (LIKE – Lidar Knowledge Europe, H2020-MSCA-ITN-2019).
This paper was edited by Etienne Cheynet and reviewed by two anonymous referees.
Barthelmie, R. J., Frandsen, S. T., Nielsen, M., Pryor, S., Rethore, P.-E., and Jørgensen, H. E.: Modelling and measurements of power losses and turbulence intensity in wind turbine wakes at Middelgrunden offshore wind farm, Wind Energy, 10, 517–528, https://doi.org/10.1002/we.238, 2007. a
Cañadillas, B., Beckenbauer, M., Trujillo, J. J., Dörenkämper, M., Foreman, R., Neumann, T., and Lampert, A.: Offshore wind farm cluster wakes as observed by long-range-scanning wind lidar measurements and mesoscale modeling, Wind Energ. Sci., 7, 1241–1262, https://doi.org/10.5194/wes-7-1241-2022, 2022. a
Churchfield, M. J., Lee, S., Michalakes, J., and Moriarty, P. J.: A numerical study of the effects of atmospheric and wake turbulence on wind turbine dynamics, J. Turbul., 13, N14, https://doi.org/10.1080/14685248.2012.668191, 2012. a
Cosack, N.: Fatigue Load Monitoring with Standard Wind Turbine Signals, Ph.D. thesis, University of Stuttgart, 2010. a, b, c
de N Santos, F., D’Antuono, P., Robbelein, K., Noppe, N., Weijtjens, W., and Devriendt, C.: Long-term fatigue estimation on offshore wind turbines interface loads through loss function physics-guided learning of neural networks, Renew. Energ., 205, 461–474, 2023. a
de N Santos, F., Noppe, N., Weijtjens, W., and Devriendt, C.: Farm-wide interface fatigue loads estimation: A data-driven approach based on accelerometers, Wind Energy, 27, 321–340, 2024. a
Dörenkämper, M., Olsen, B. T., Witha, B., Hahmann, A. N., Davis, N. N., Barcons, J., Ezber, Y., García-Bustamante, E., González-Rouco, J. F., Navarro, J., Sastre-Marugán, M., Sīle, T., Trei, W., Žagar, M., Badger, J., Gottschall, J., Sanz Rodrigo, J., and Mann, J.: The Making of the New European Wind Atlas – Part 2: Production and evaluation, Geosci. Model Dev., 13, 5079–5102, https://doi.org/10.5194/gmd-13-5079-2020, 2020. a
ESA: Copernicus Sentinel data, retrieved from ASF DAAC on 18-07-2023, processed by ESA, https://search.asf.alaska.edu (last access: 18 July 2023), 2021. a, b, c
Fitch, A. C., Olson, J. B., Lundquist, J. K., Dudhia, J., Gupta, A. K., Michalakes, J., and Barstad, I.: Local and mesoscale impacts of wind farms as parameterized in a mesoscale NWP model, Mon. Weather Rev., 140, 3017–3038, https://doi.org/10.1175/MWR-D-11-00352.1, 2012. a
Göçmen, T. and Giebel, G.: Estimation of turbulence intensity using rotor effective wind speed in Lillgrund and Horns Rev-I offshore wind farms, Renew. Energ., 99, 524–532, https://doi.org/10.1016/j.renene.2016.07.038, 2016. a
Gonzalez, E., Stephen, B., Infield, D., and Melero, J. J.: Using high-frequency SCADA data for wind turbine performance monitoring: A sensitivity study, Renew. Energ., 131, 841–853, https://doi.org/10.1016/J.RENENE.2018.07.068, 2019. a
Hasager, C. B., Vincent, P., Badger, J., Badger, M., Di Bella, A., Peña, A., Husson, R., and Volker, P. J.: Using satellite SAR to characterize the wind flow around offshore wind farms, Energies, 8, 5413–5439, https://doi.org/10.3390/en8065413, 2015. a
Holtslag, M., Bierbooms, W., and Van Bussel, G.: Wind turbine fatigue loads as a function of atmospheric conditions offshore, Wind Energy, 19, 1917–1932, https://doi.org/10.1002/we.1959, 2016. a
IEA: Net Zero by 2050, Tech. rep., IEA, https://www.iea.org/reports/net-zero-by-2050 (last access: 23 October 2023), 2021. a
IEC 61400-1: International Standard IEC 61400-1:2019, Wind energy generation systems – Part 1: Design requirements, Tech. rep., International Electrotechnical Commission Geneva, Switzerland, 2019. a, b
Kang, S.-L. and Won, H.: Intra-farm wind speed variability observed by nacelle anemometers in a large inland wind farm, J. Wind Eng. Ind. Aerod., 147, 164–175, https://doi.org/10.1016/j.jweia.2015.10.010, 2015. a
Lin, Z. and Liu, X.: Wind power forecasting of an offshore wind turbine based on high-frequency SCADA data and deep learning neural network, Energy, 201, 117693, https://doi.org/10.1016/j.energy.2020.117693, 2020. a
Mittelmeier, N., Allin, J., Blodau, T., Trabucchi, D., Steinfeld, G., Rott, A., and Kühn, M.: An analysis of offshore wind farm SCADA measurements to identify key parameters influencing the magnitude of wake effects, Wind Energ. Sci., 2, 477–490, https://doi.org/10.5194/wes-2-477-2017, 2017. a, b, c
Muller, E., Gremmo, S., Houtin-Mongrolle, F., Duboc, B., and Bénard, P.: Field-data-based validation of an aero-servo-elastic solver for high-fidelity large-eddy simulations of industrial wind turbines, Wind Energ. Sci., 9, 25–48, https://doi.org/10.5194/wes-9-25-2024, 2024. a
Neumann, T. and Emeis, S.: Long-range modifications of the wind field by offshore wind parks–results of the project WIPAFF, Meteorol. Z, 29, 355–376, https://doi.org/10.1127/metz/2020/1023, 2020. a
Noppe, N., Iliopoulos, A., Weijtjens, W., and Devriendt, C.: Full load estimation of an offshore wind turbine based on SCADA and accelerometer data, J. Phys. Conf. Ser., 753, 072025, https://doi.org/10.1088/1742-6596/753/7/072025, 2016. a
Nygaard, N. G. and Christian Newcombe, A.: Wake behind an offshore wind farm observed with dual-Doppler radars, J. Phys. Conf. Ser., 1037, 072008, https://doi.org/10.1088/1742-6596/1037/7/072008, 2018. a
Ouro, P., Ghobrial, M., Ali, K., and Stallard, T.: Numerical modelling of offshore wind-farm cluster wakes, Renewable and Sustainable Energy Reviews, 215, 115526, https://doi.org/10.1016/j.rser.2025.115526, 2025. a
Pérez-Campuzano, D. and Gallego-Castillo, C.: Modelling damage equivalent loads in wind turbines from general operational signals: Exploration of relevant input selection methods using aeroelastic simulations, Wind Energy, 21, 441–459, https://doi.org/10.1002/we.2171, 2018. a
Pettas, V., Kretschmer, M., Clifton, A., and Cheng, P. W.: On the effects of inter-farm interactions at the offshore wind farm Alpha Ventus, Wind Energ. Sci., 6, 1455–1472, https://doi.org/10.5194/wes-6-1455-2021, 2021. a, b, c, d, e, f
Platis, A., Siedersleben, S. K., Bange, J., Lampert, A., Bärfuss, K., Hankers, R., Cañadillas, B., Foreman, R., Schulz-Stellenfleth, J., Djath, B., Neumann, T., and Emeis, S.: First in situ evidence of wakes in the far field behind offshore wind farms, Sci. Rep., 8, 2163, https://doi.org/10.1038/s41598-018-20389-y, 2018. a, b
Platis, A., Hundhausen, M., Lampert, A., Emeis, S., and Bange, J.: The role of atmospheric stability and turbulence in offshore wind-farm wakes in the German bight, Bound.-Lay. Meteorol., 182, 441–469, https://doi.org/10.1007/s10546-021-00668-4, 2021. a
Porté-Agel, F., Bastankhah, M., and Shamsoddin, S.: Wind-turbine and wind-farm flows: A review, Bound.-Lay. Meteorol., 174, 1–59, https://doi.org/10.1007/s10546-019-00473-0, 2020. a
Rott, A., Petrović, V., and Kühn, M.: Wind farm flow reconstruction and prediction from high frequency SCADA Data, J. Phys. Conf. Ser., 1618, 062067, https://doi.org/10.1088/1742-6596/1618/6/062067, 2020. a
Rubak, R. and Petersen, J. T.: Monopile as part of aeroelastic wind turbine simulation code, Proceedings of Copenhagen Offshore Wind, 20, 655, 2005. a
Sathe, A., Mann, J., Barlas, T., Bierbooms, W., and van Bussel, G.: Influence of atmospheric stability on wind turbine loads, Wind Energy, 16, 1013–1032, https://doi.org/10.1002/we.1528, 2013. a, b
Schneemann, J., Rott, A., Dörenkämper, M., Steinfeld, G., and Kühn, M.: Cluster wakes impact on a far-distant offshore wind farm's power, Wind Energ. Sci., 5, 29–49, https://doi.org/10.5194/wes-5-29-2020, 2020. a, b, c, d, e, f
Schulz-Stellenfleth, J., Emeis, S., Dörenkämper, M., Bange, J., Cañadillas, B., Neumann, T., Schneemann, J., Weber, I., zum Berge, K., Platis, A., Djath, B., Gottschall, J., Vollmer, L., Rausch, T., Barekzai, M., Hammel, J., Steinfeld, G., and Lampert, A.: Coastal impacts on offshore wind farms – A review focussing on the German Bight area, Meteorol. Z, 31, 289–315, https://doi.org/10.1127/metz/2022/1109, 2022. a
Seifert, J. K., Kraft, M., Kühn, M., and Lukassen, L. J.: Correlations of power output fluctuations in an offshore wind farm using high-resolution SCADA data, Wind Energ. Sci., 6, 997–1014, https://doi.org/10.5194/wes-6-997-2021, 2021. a
Shaler, K., Robertson, A. N., and Jonkman, J.: Sensitivity analysis of the effect of wind and wake characteristics on wind turbine loads in a small wind farm, Wind Energ. Sci., 8, 25–40, https://doi.org/10.5194/wes-8-25-2023, 2023. a
Skamarock, W., Klemp, J., Dudhia, J., Gill, D. O., Liu, Z., Berner, J., Wang, W., Powers, J. G., Duda, M. G., Barker, D., and Huang, X.-Y.: A description of the advanced research WRF version 4, NCAR tech. note ncar/tn-556+ str, 145, 2019. a
St. Martin, C. M., Lundquist, J. K., Clifton, A., Poulos, G. S., and Schreck, S. J.: Atmospheric turbulence affects wind turbine nacelle transfer functions, Wind Energ. Sci., 2, 295–306, https://doi.org/10.5194/wes-2-295-2017, 2017. a
Vera-Tudela, L. and Kühn, M.: Analysing wind turbine fatigue load prediction: The impact of wind farm flow conditions, Renew. Energ., 107, 352–360, https://doi.org/10.1016/j.renene.2017.01.065, 2017. a, b
Wackerly, D. D., Mendenhall, W., and Scheaffer, R.L.: Mathematical statistics with applications, Thomson Brooks/Cole, 2008 a
Ziegler, L., Smolka, U., Cosack, N., and Muskulus, M.: Brief communication: Structural monitoring for lifetime extension of offshore wind monopiles: can strain measurements at one level tell us everything?, Wind Energ. Sci., 2, 469–476, https://doi.org/10.5194/wes-2-469-2017, 2017. a