the Creative Commons Attribution 4.0 License.
the Creative Commons Attribution 4.0 License.
 | 24 Sep 2024
Experimental evaluation of wind turbine wake turbulence impacts on a general aviation aircraft
Jonathan D. Rogers
Continued development of wind farms near populated areas has led to rising concerns about the potential risk posed to general aviation aircraft when flying through wind turbine wakes. There is an absence of experimental flight test data available with which to assess this potential risk. This paper presents the results of an instrumented flight experiment in which a general aviation aircraft was flown through the wake of a utility-scale wind turbine at an operating wind farm. Wake passes were flown at different downwind distances from the turbine, and data were collected on the orientation disturbances, altitude and speed deviations, and acceleration loads experienced by the aircraft. Videos and pilot statements were also collected, providing qualitative information about the disturbances encountered in the wake. Results show that flight disturbances were small in all cases, with no difference observed between flight data inside and outside the wake at distances greater than six rotor diameters from the turbine. At distances closer than six rotor diameters, small load factor and orientation disturbances were noted but were commensurate with those experienced in light or moderate atmospheric turbulence. Overall, the loads and disturbances experienced were far smaller than those that would risk causing loss of control or structural damage.
- Article
(3783 KB) - Full-text XML
-
Supplement
(826 KB) - BibTeX
- EndNote


Land-based wind energy development is seen as critical to the transition to carbon-free energy production. Development of land-based wind farms continues at a steady pace internationally, with nearly 78 GW of new installed capacity in 2022 (GWEC, 2023). As wind farms have been developed closer to populated areas, land-use conflicts have become increasingly prevalent (Richardson et al., 2022). One notable concern that has affected the development of new wind energy projects, particularly in North America, is the potential hazards caused by wind turbines to light aircraft flying in the vicinity of wind farms. Two recent trends have exacerbated these concerns. The first is the shift in wind energy development in North America from more remote, largely unpopulated areas such as west Texas to more populated regions with extensive agricultural development in the Midwest (Xiarchos and Sandborn, 2017). These agricultural areas tend to contain a large number of small public and private airports which are used for recreational flying and aerial application (i.e., “crop dusting”). A 2018 analysis of airport and wind farm location data found that almost 40 % of wind turbines in the United States were located within 10 km of a small airport (Tomaszewski et al., 2018). The second trend that exacerbates concerns about aviation impacts is the general increase in wind turbine size. From 2021 to 2022, the average hub height of newly installed turbines increased by 4 % to 98.1 m, taller than the Statue of Liberty, and the average power capacity increased by 7 % to 3.2 MW (Wiser et al., 2023).
Concerns about aviation impacts focus on three potential issues: interference with air surveillance radar, collision risks, and the risks posed by added turbulence in the turbine wakes. Interference with radar has been well studied (Karlson et al., 2014), and mitigation procedures and technologies are currently under development (Gilman et al., 2016; FAA, 2017); besides, radar interference is usually of lesser concern to general aviation pilots in rural areas since they rarely use radar services when flying under visual flight rules or performing aerial application services. Collision risks may be analyzed on a case-by-case basis through standard procedures developed by, for instance, the FAA and/or International Civil Aviation Organization for assessing the risks posed by the construction of obstacles in the vicinity of airports (FAA, 2022; ICAO, 2022). Unlike radar interference and collision risks, the risk posed by added turbulence in wind turbine wakes is harder to quantify, and there are no existing standards or models governing risk assessment methods. It is well-known that the turbulence intensity (TI) inside a wind turbine wake is higher than the free-stream turbulence intensity due to vortex shedding, shear effects, and other factors (Vermeer et al., 2003; Quarton and Ainslee, 1990). In addition, the mean wind speed in the wake of the turbine is less than the free-stream speed (the so-called “velocity deficit”) due to the turbine extracting energy from the wind. Concerns have been raised in wind farm permitting processes throughout North America regarding the risk posed by turbine-added turbulence and velocity deficit to general aviation aircraft flying through turbine wakes – in some cases, such concerns have led to the relocation of turbines farther from airports (Tomaszewski et al., 2018).
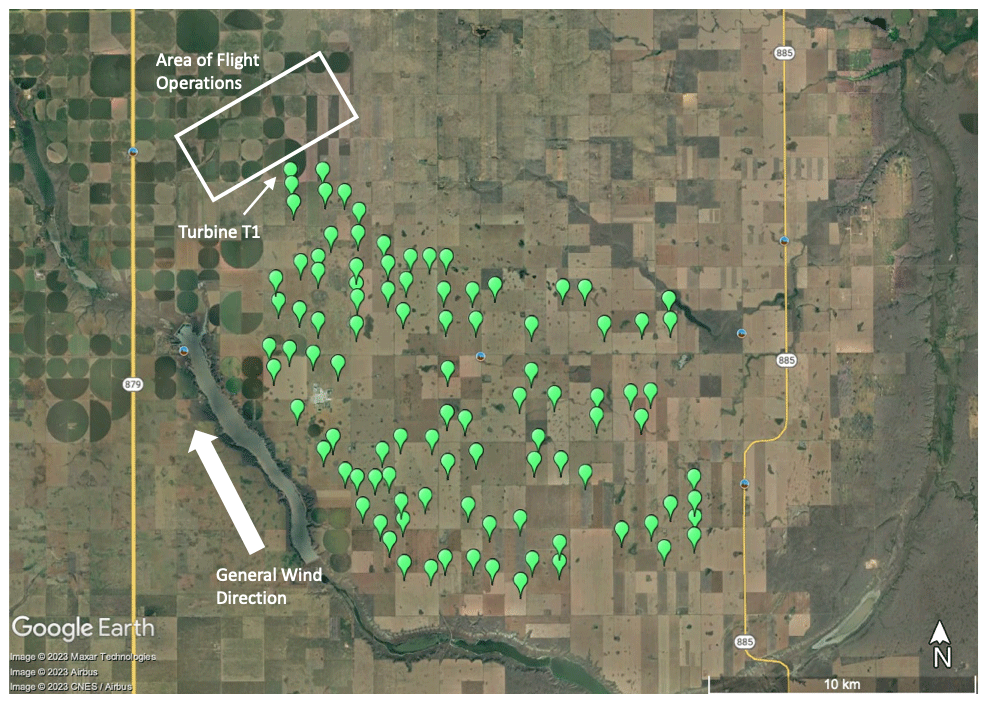
Figure 1Whitla Wind facility turbine locations and area of flight operations. Turbine T1 (highlighted) is the northwesternmost turbine located at Whitla.
Several authors have investigated the potential impacts of turbine-added wake turbulence on light aircraft. Mulinazzi and Zheng (2014, 2018) used a simple helical vortex model as well as miniaturized wind tunnel experiments to attempt to characterize the hazard posed by turbine-added turbulence. While the authors concluded that dangerous aircraft roll hazards may exist up to 4.5 km (2.8 mi) downwind of a wind turbine, they based their calculations on a 64.4 km h−1 (40 mi h−1) wind speed (which is unrealistically high for the operation of light aircraft) and did not account for the reduction in turbine thrust that occurs at higher wind speeds using pitch-regulated control (Wang et al., 2015). More recent studies by Tomaszewski et al. (2018) and Varriale et al. (2018) used wake velocity fields generated from computational fluid dynamics (CFD) models to study potential impacts on aircraft flight. Tomaszewski et al. (2018) assessed the roll hazard induced by flight through the wake via a static analysis of roll moment generation acting on the aircraft in hundreds of simulated wake passes. Results showed that 99.99 % of roll moments encountered within 10 rotor diameters (RD) of the turbine were classified as low-hazard, with 0.01 % classified as medium-hazard and no cases in the high-hazard category. Varriale et al. (2018) simulated aircraft flight through the wake using a six-degrees-of-freedom flight dynamic model of a Cessna 172 airplane. This study showed that the loads experienced by the aircraft in the wake passes were reasonably small and did not approach the structural limits of the aircraft. Wang et al. (2015, 2017) present piloted simulation studies in which several pilots flew a flight simulation of a light aircraft through wake velocity fields generated from a numerical model. These results showed that yaw disturbances due to wake encounters were less than 10°, and pilots rated the overall disturbances due to turbulence as minor. Several studies have also considered the potential effects of added wake turbulence on helicopters. Bakker et al. (2018) report the preliminary results of a variety of simulation studies, showing that under typical wind conditions, disturbances to helicopters in forward flight are likely to be minimal when crossing turbine wakes, although the paper suggests that potential hazards may exist in hover or low-speed flight when operating very close to turbines at high wind speeds. Finally, de Jong et al. (2020) analyzed hundreds of hours of accelerometer data from helicopters servicing offshore wind farms, comparing the vertical and lateral accelerations experienced inside and outside turbine wakes. The authors found no apparent difference in acceleration data between segments of flights inside and outside the wakes at offshore wind farms, indicating that added turbulence inside the wake did not noticeably impact vehicle control or stability.
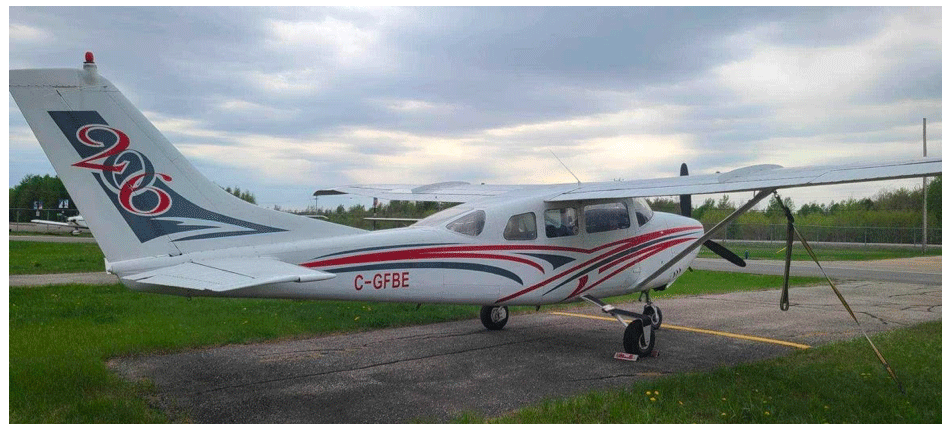
Figure 2The Cessna 206 used in flight tests (photo courtesy of Raina Naomi of Edmonton Skydive).
While the majority of the above studies conclude that added turbulence in wind turbine wakes is of sufficiently low magnitude to avoid posing a risk to light aircraft, there is a lack of experimental data, particularly from fixed-wing general aviation aircraft, with which to confirm these findings. For instance, in Varriale et al. (2018) the authors express the need for “a real-world flight or simulation test involving a pilot”, while de Jong et al. (2020) state that “a test flight with special equipment could help in the analysis” of turbulence effects on aircraft at land-based wind farms. The current paper fills this gap in experimental data by presenting the results of a dedicated flight experiment in which a general aviation aircraft was flown in close proximity to operating wind turbines at a land-based wind energy facility. The test flights were performed with a Cessna 206 aircraft near a Vestas V136 turbine at the Whitla Wind facility in southern Alberta, Canada. Thirteen wake passes were performed at distances ranging from 2125 m (15.6 rotor diameters, or RD) to 223 m (1.6 RD) from the turbine base. Aircraft state data, wind turbine operational data, meteorological mast data, and video footage were gathered during each wake pass. Analysis of the resulting data showed that the flight disturbances encountered by the aircraft while in the turbine wake were uniformly small and well below the level that would lead to the risk of loss of control or structural damage. Beyond 6 RD, load factor and orientation disturbances inside the wake could not be distinguished from those experienced outside the wake, while at closer distances, small perturbations were evident in the flight data but were only slightly higher than those caused by atmospheric turbulence outside the wake. Collectively, analysis of flight data, visual inspection of in-aircraft video recordings, and pilot feedback indicated that there was no safety risk to the aircraft when flying through turbine wake, even at close distances.
This section provides detailed information regarding the Whitla Wind facility where the flight tests were conducted, the test aircraft, the data gathered during the experimental flight, and the weather conditions that prevailed during each wake pass. The test trials were performed on 16 October 2023 during the hours of 13:30–15:30 mountain daylight time (MDT).
2.1 Description of Whitla Wind facility
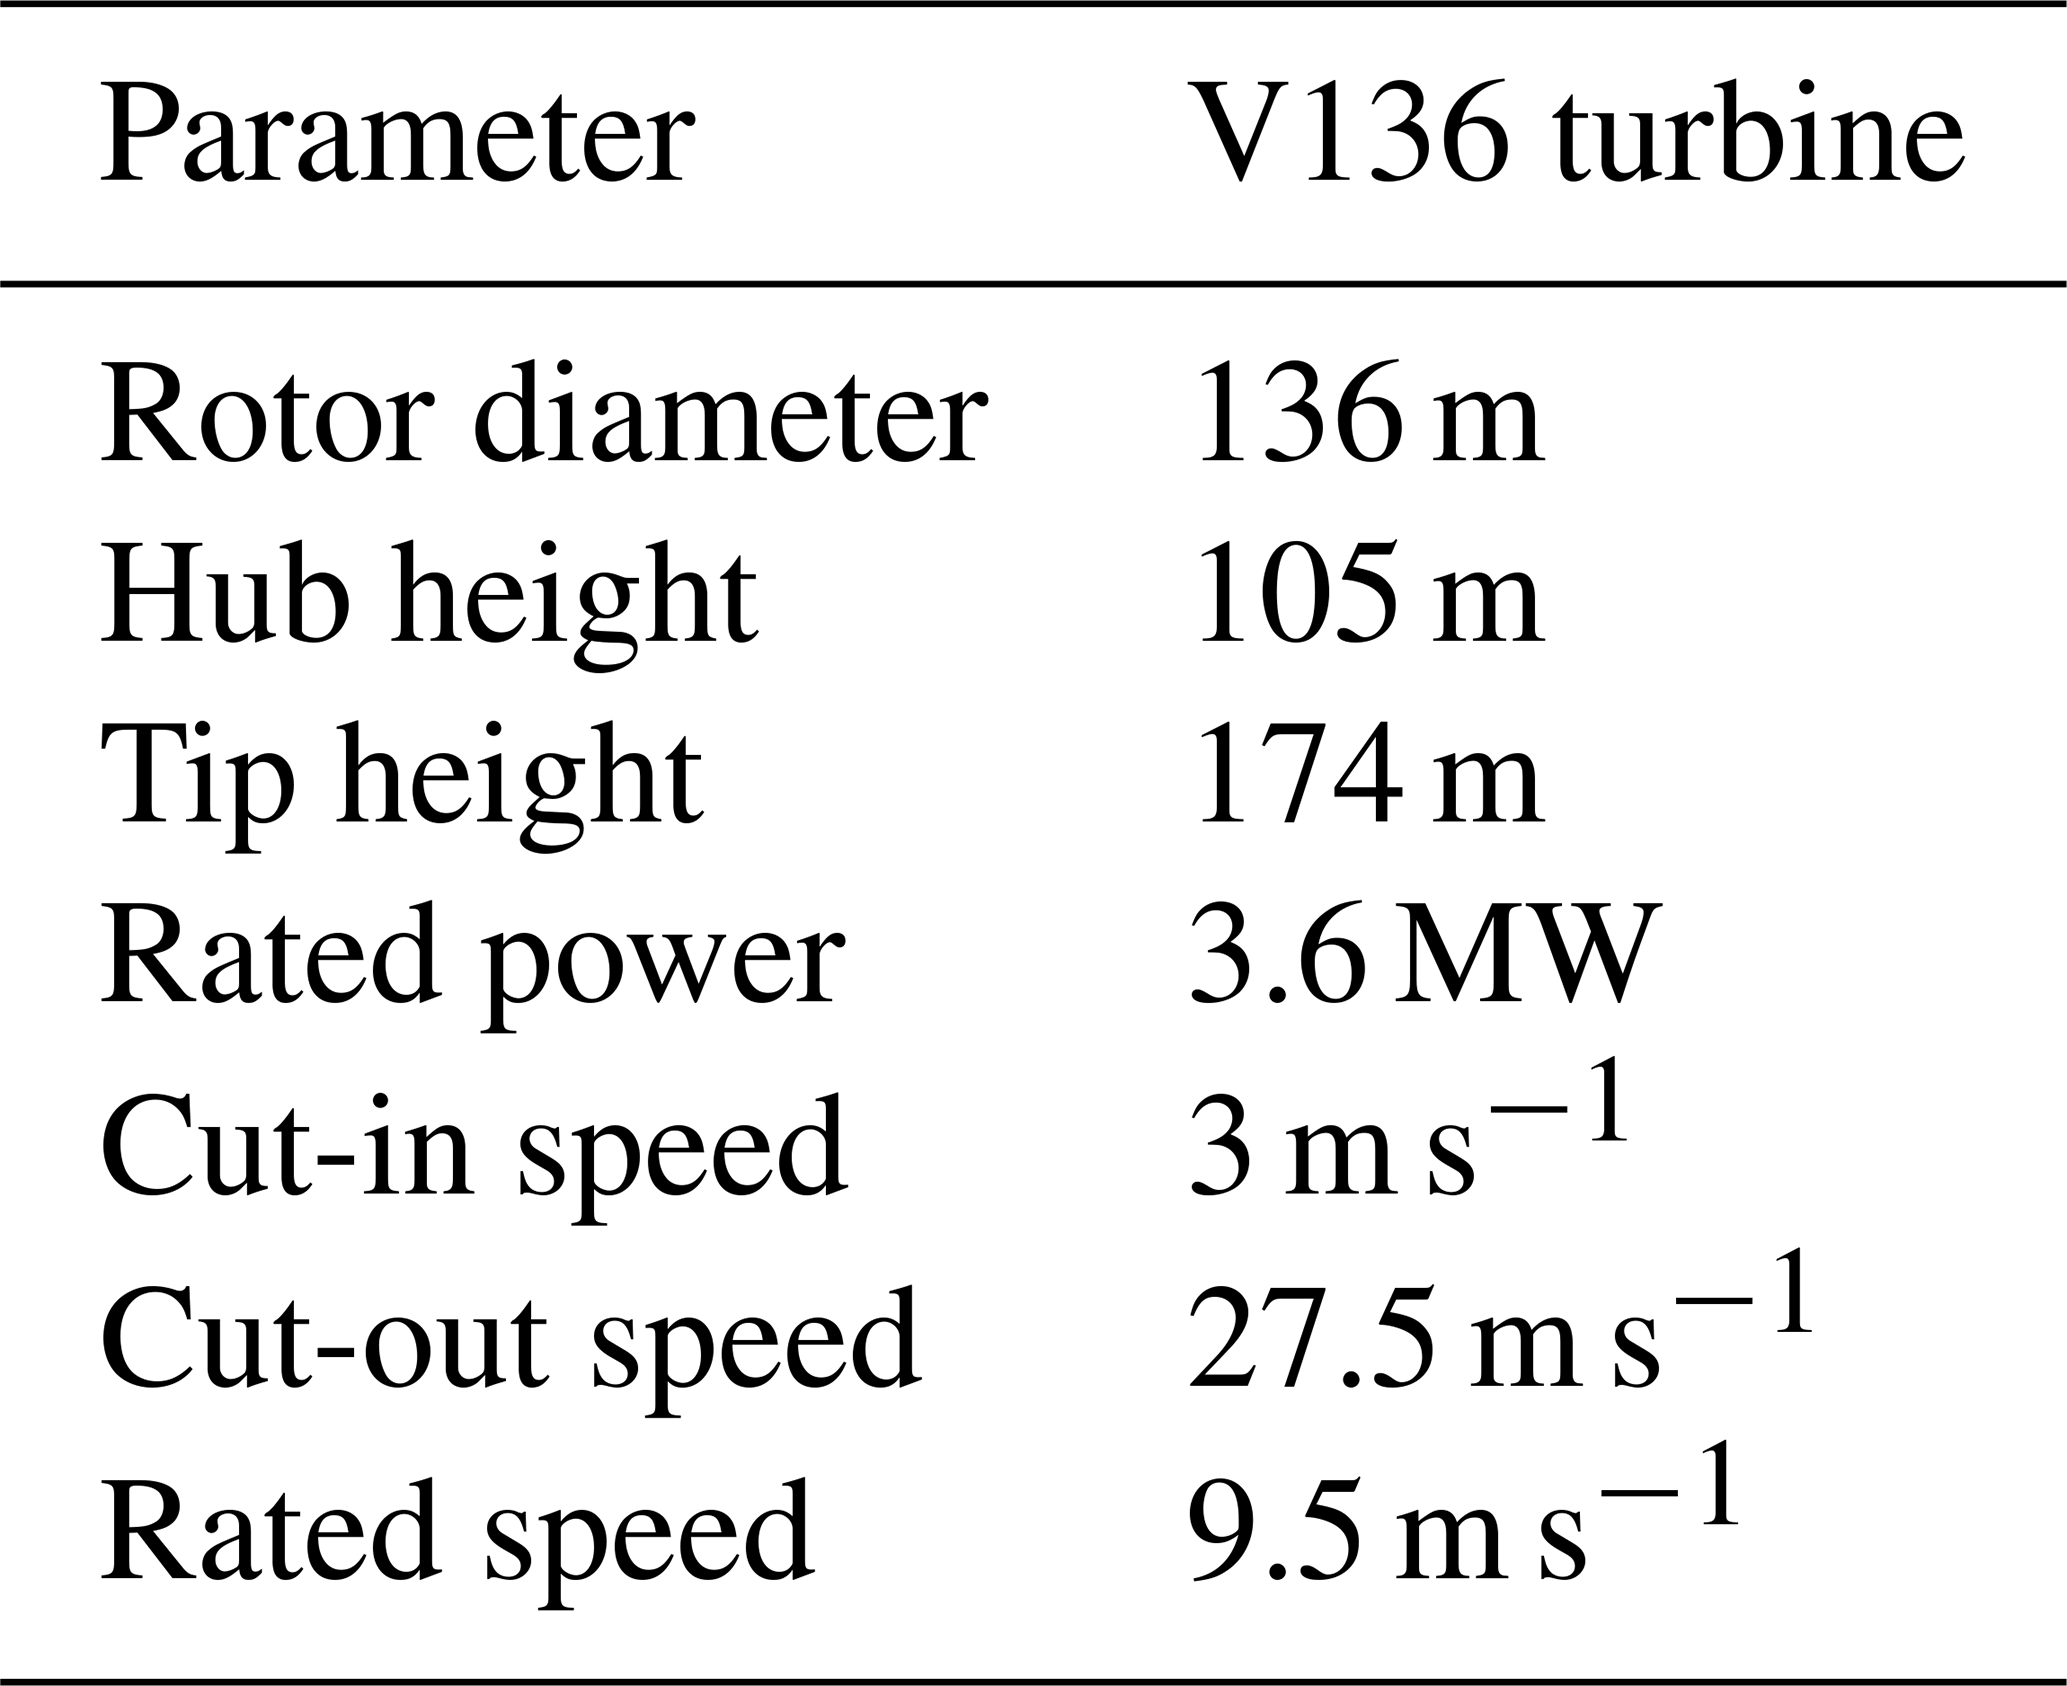
The Whitla Wind facility (“Whitla”) is located approximately 16 km south of Bow Island, Alberta, Canada. The 353 MW facility is comprised of 98 Vestas V136 turbines. The characteristics of the V136 turbines installed at Whitla are provided in Table 1.
The turbine locations at Whitla are shown in Fig. 1. At the time selected for the test flights, the winds were generally blowing from the southeast. As a result, the turbine wakes were propagating northwest of the project area. The area selected for flight operations was downwind of the farthest turbine at the northwest corner of the project, turbine T1. The location of this turbine and the selected area of flight operations are shown in Fig. 1.
2.2 Description of flight test aircraft and pilot qualifications
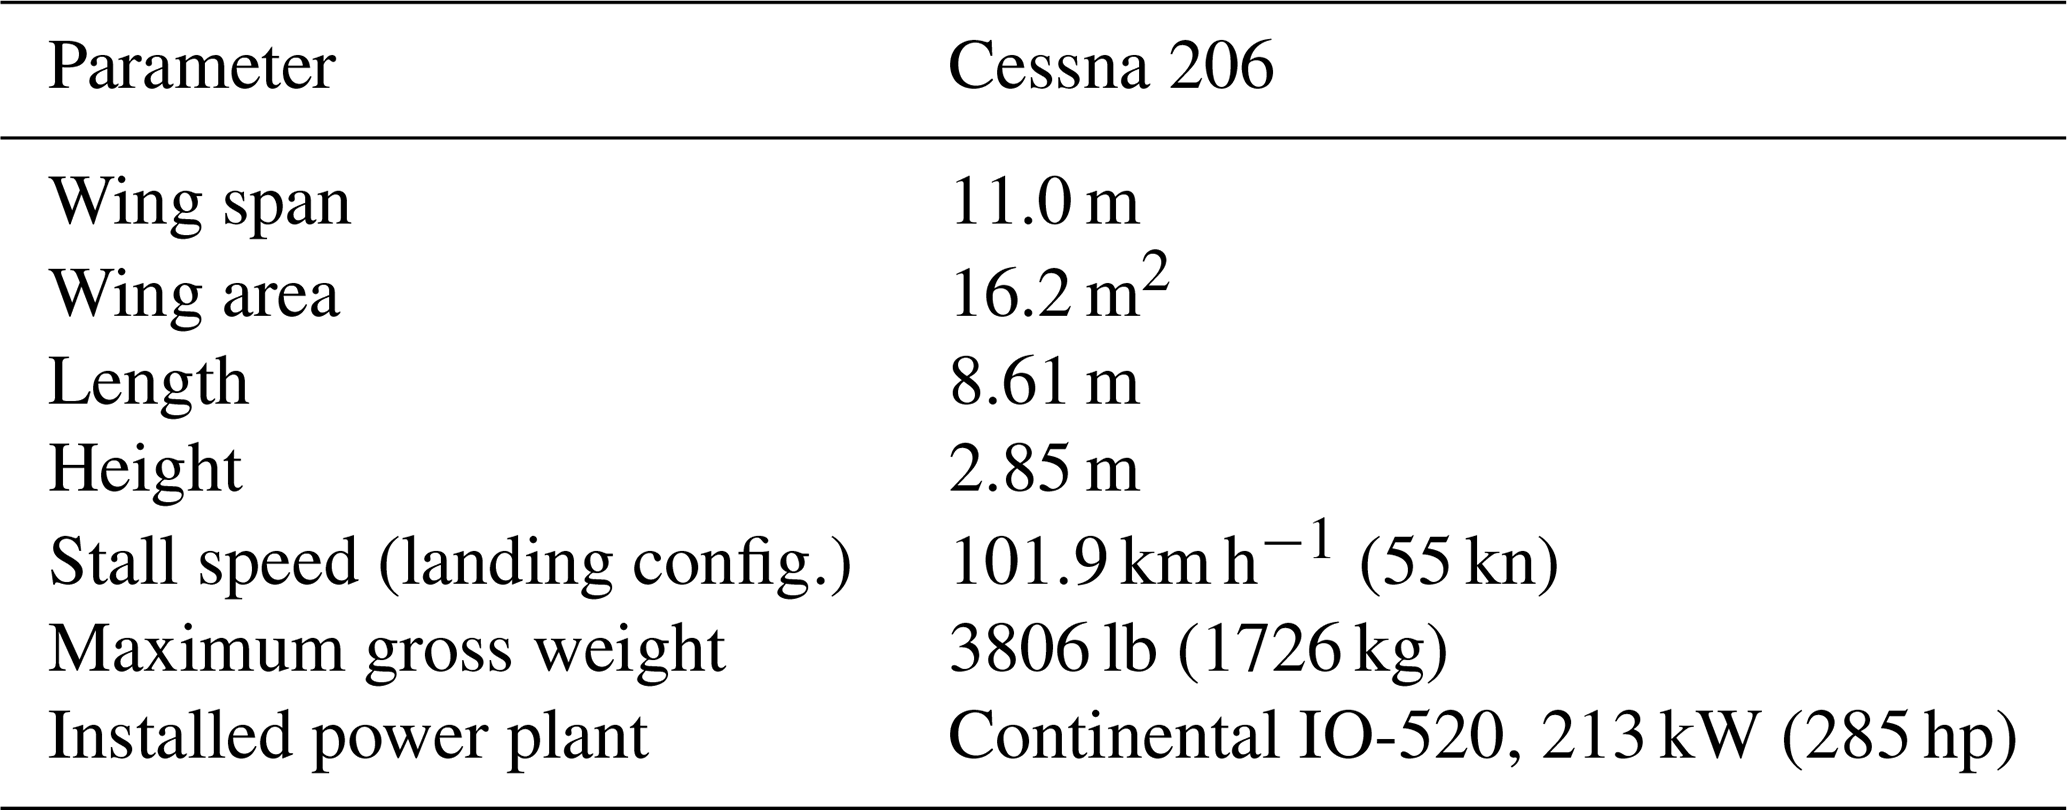
The aircraft used for the test flights was a Cessna 206 Stationair owned and operated by Edmonton Skydive. The aircraft used was a Cessna P206 (P stands for passenger model), registration number C-GFBE, S/N P206-044. A picture of the aircraft is shown in Fig. 2. This aircraft was selected as it is similar to other high-winged Cessna aircraft models such as the Cessna 172, Cessna 180, and Cessna 182 commonly flown out of small airports and airstrips in agricultural areas. The Cessna 206 has a wing area that is nearly identical to those of the Cessna 172 and Cessna 182, but it can be operated at a higher maximum gross weight of 1726 kg (compared to 998 kg for the Cessna 172 and 1338 kg for the Cessna 182). In order to maintain similarity to these smaller aircraft, the Cessna 206 used for the flight tests had all the interior components of the cabin removed and was operated at a gross weight of approximately 2300 lb during the wake passes. Note that gross weight and wing area are two of the most important drivers of the response of an airplane to turbulence according to US Air Force Handbook 15-10 (US Air Force, 2019), and thus this operational similarity of the flight test aircraft to other aircraft commonly flown near wind farms ensures the relevance of the results. Other characteristics of the flight test aircraft are provided in Table 2.
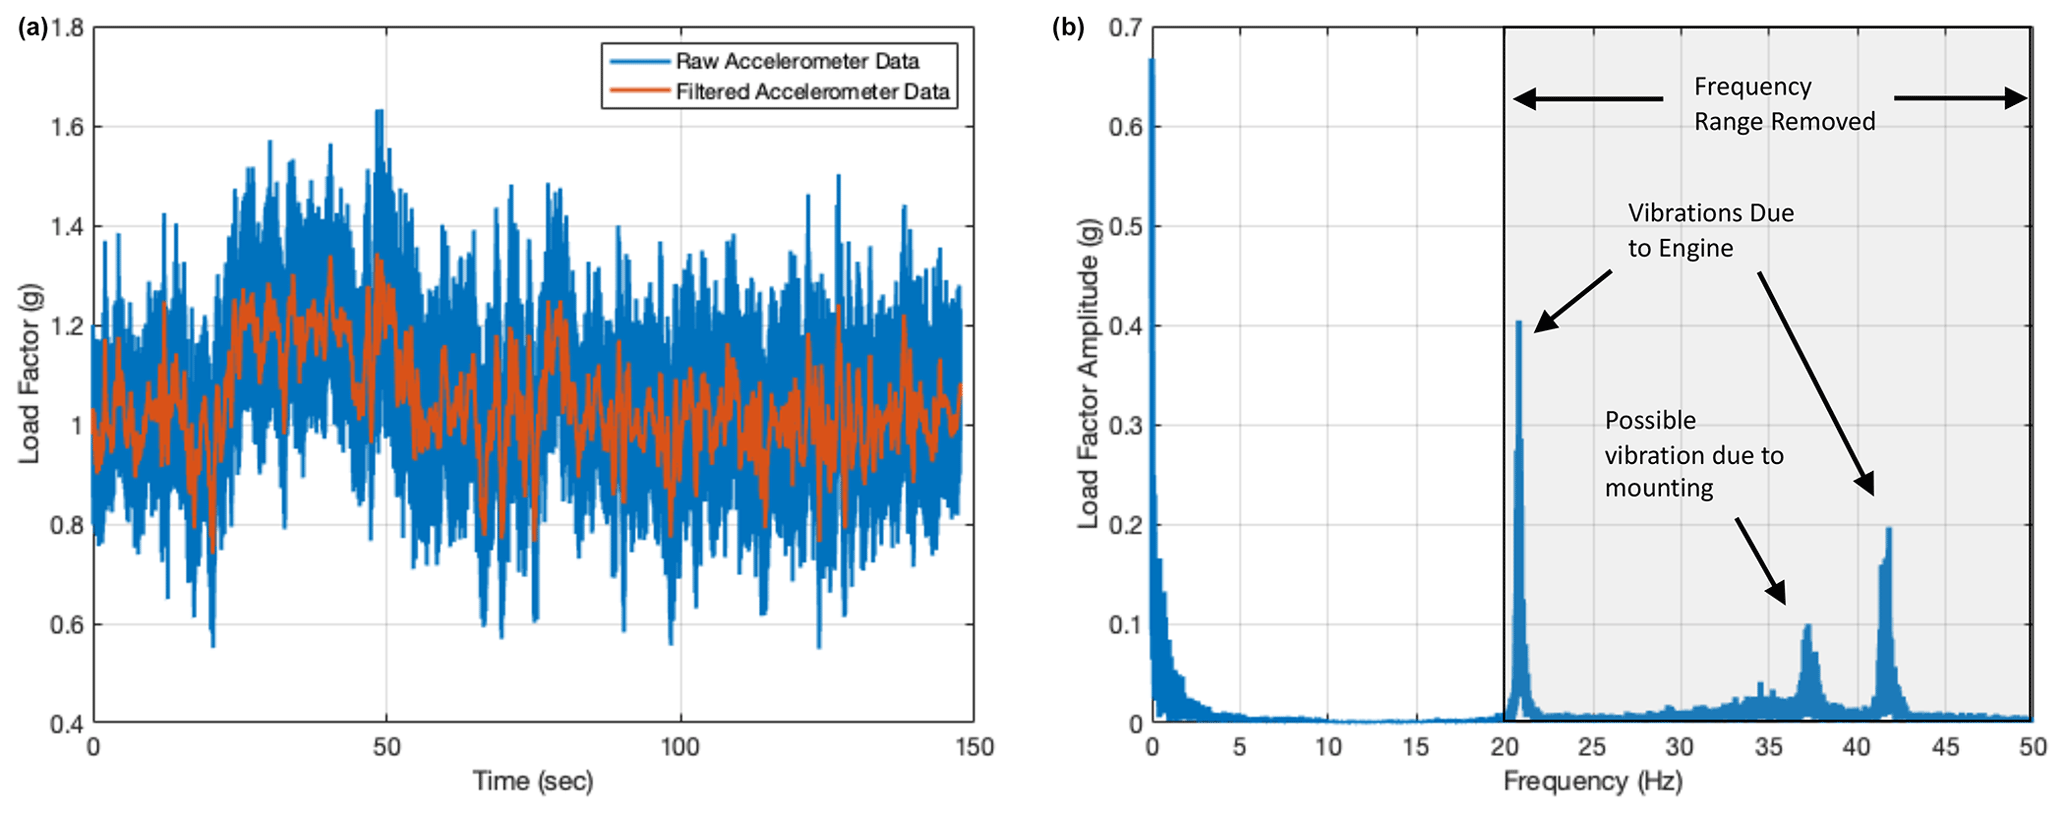
Figure 3Example raw and filtered accelerometer data (a); amplitude spectrum of raw data and areas of band-stop filtering (b).
The pilot who flew the wake passes holds a commercial pilot's license with a multi-engine rating and a group 1 IFR (instrument flight rules) rating. He is an experienced skydiving pilot and, at the time of the flight trials, regularly flew skydiving missions at Edmonton Skydive. At the time of the test flights, the pilot had 520 h of total flight time, with approximately 247 flight hours as pilot in command of a Cessna 206 acquired during the 3 months prior. A passenger (who was not a licensed pilot) was also present in the aircraft to assist with flight planning and data recording. The pilot and passenger knew beforehand that the purpose of the flights was to assess the level of turbulence experienced by the aircraft in a wind turbine wake and were asked to fly a set of test points at different distances from the turbine.
2.3 Description of data collection
The Cessna 206 does not have an onboard flight data recording system. To record flight data during the wake encounters, an iPhone 13 Pro was temporarily mounted in the cockpit of the aircraft and configured to record data during the wake encounters using an application called Sensor Logger. The iPhone 13 Pro is equipped with a range of sensors including a three-axis accelerometer, three-axis gyroscope, three-axis magnetometer, and GPS receiver. The iPhone operating system is equipped with attitude estimation algorithms that fuse data from the accelerometers, gyroscope, and magnetometer to determine the device's roll, pitch, and yaw angles via the Core Motion software framework (Apple, 2024). The Sensor Logger application provides a means to easily record raw sensor data as well as orientation estimates from the phone's operating system. Numerous recent publications have evaluated the accuracy of the acceleration and orientation data from the iPhone and found it to be similar in accuracy to commercial low- or medium-grade inertial measurement units (e.g., Grouios et al., 2023; Mourcou et al., 2015).
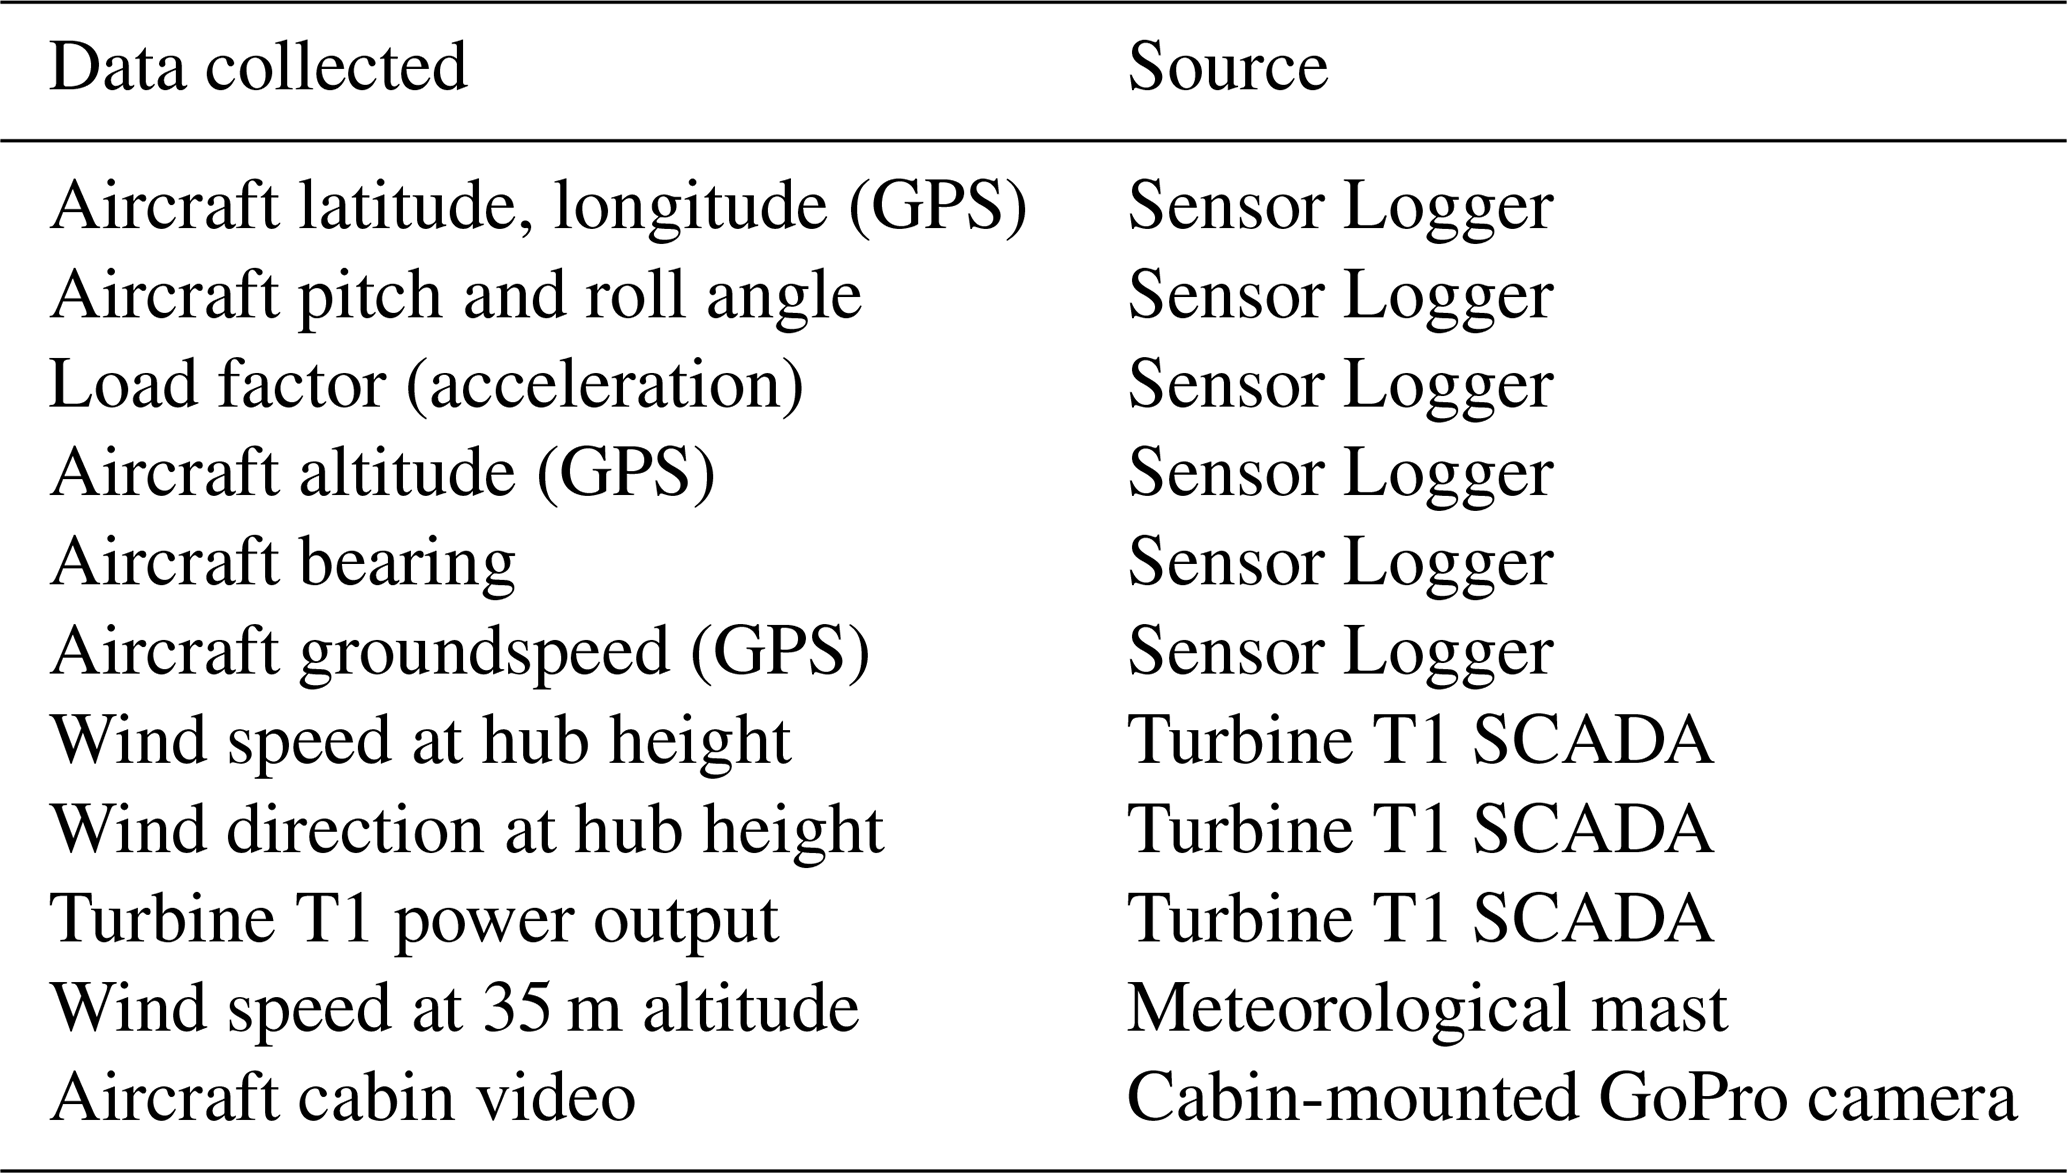
For each flight, the Sensor Logger app was used to record position, speed, bearing, and altitude with respect to mean sea level (MSL) derived from GPS; roll, pitch, and yaw orientation; and three-axis accelerometer outputs. The GPS data are derived directly from the GPS receiver in the iPhone 13 Pro. Mean sea level altitude is converted to altitude above ground level (AGL) by subtracting the ground height at turbine T1 (note that the terrain in the vicinity of T1 is generally flat, so the local ground elevation at any aircraft position is assumed to be the same as the ground elevation at the location of T1). The roll, pitch, and yaw orientations are the estimates provided by the phone's operating system, while the acceleration data are taken directly from the phone's three-axis accelerometer. In this work, the primary acceleration component of interest is the acceleration in the vertical direction with respect to the aircraft, i.e., the aircraft load factor. The load factor is the ratio of the acceleration experienced in the aircraft body-fixed vertical direction to the gravitational acceleration. This value is significant in that the aircraft structural limitations are defined in terms of the limit load factor for a specific make and model of aircraft. Thus, with the phone mounted flat on the aircraft dashboard, only the vertical-axis component of the acceleration is of interest. A summary of the collected flight data and meteorological data is provided in Table 3.
An accelerometer that is rigidly mounted to the aircraft will measure loads across a wide frequency range. Generally, signal components at frequencies of less than 10 Hz are due to turbulence and control inputs, while those at higher frequencies result from engine vibrations or excitation of aircraft structural modes (Mansfield and Aggarwal, 2022). Engine vibrations occur at the propeller rotation frequency (approximately 2500–2700 rpm for this flight) and its harmonics. Figure 3 shows raw vertical-axis accelerometer data for one of the wake passes along with the single-sided amplitude spectrum obtained from the Fourier transform of the data. Note the presence of a peak at the propeller rotation frequency around 42 Hz and at a subharmonic around 21 Hz. A smaller peak around 37 Hz was also evident in some of the data and could be due to vibration of the instrument panel on which the sensor was mounted or other aircraft structural vibrations. Note that the peaks at harmonics of the propeller rotation frequency at 21 Hz and 42 Hz nearly exactly match similar accelerometer data from a piston-engine aircraft shown in Ilic et al. (2017). Because the purpose of this study is to isolate the loads caused by turbulence, a frequency-domain low-pass filter was applied to the accelerometer data to remove frequency components higher than 20 Hz, as shown in Fig. 3b, resulting in the filtered accelerometer data shown in the orange trace in Fig. 3a. These filtered accelerometer data reflect the loads experienced due to turbulence and can be compared to the limit load factor to assess any potential for structural damage.
Hub height wind direction, wind speed, and power production data from turbine T1's supervisory control and data acquisition (SCADA) system were collected for the time period of the flight trials. These SCADA data were measured at hub height and are used to assess the wind conditions and wake propagation direction during each wake encounter. In addition, the wind data from the turbine can be combined with the groundspeed measurements of the aircraft from GPS to obtain an approximate airspeed of the aircraft. This airspeed approximation is performed by resolving the aircraft groundspeed and wind speed into north and east components, subtracting the wind from the groundspeed components, and computing the resulting vector magnitude. Note that this airspeed is an approximation and does not represent a precise airspeed measurement. To complement the hub height wind data from T1's SCADA system, lower-altitude wind conditions during the flight trials were recorded by a meteorological mast located within the Whitla project boundaries at an altitude of 35 m. These additional data provide a measurement of wind speed fairly close to the ground surface during the flights.
There were no sensors that directly recorded the control inputs to the aircraft. Control input information may be particularly useful in evaluating the pilot's response and any increase in workload observed when flying through the turbine wakes. In order to assess pilot behavior during the flights, a GoPro HERO10 Black camera was mounted in the cabin to record video footage for each trial. This video footage is useful in assessing pilot response and workload as well as providing a qualitative assessment of the experience of flying through the turbine wake. The video files are available as supplemental data accompanying this paper.
2.4 Description of wake passes
A total of 13 wake passes were performed. Three aircraft speed and flap configurations were used: airspeed of 90 knots (kn; 1 kn = 0.514 m s−1) with 0 flaps, airspeed of 80 kn with 10° flaps, and airspeed of 75 kn with 10° flaps. Wing flaps are retractable extensions on the trailing edge of the wing that are typically extended (i.e., deflected downward by a certain angle) during approach and landing to allow for higher lift production at lower flight speeds. The above flight conditions are representative of departure, approach, or landing operations, which are the flight segments in which a general aviation aircraft is most likely to be flying at low altitude in the vicinity of a wind turbine near an airport.
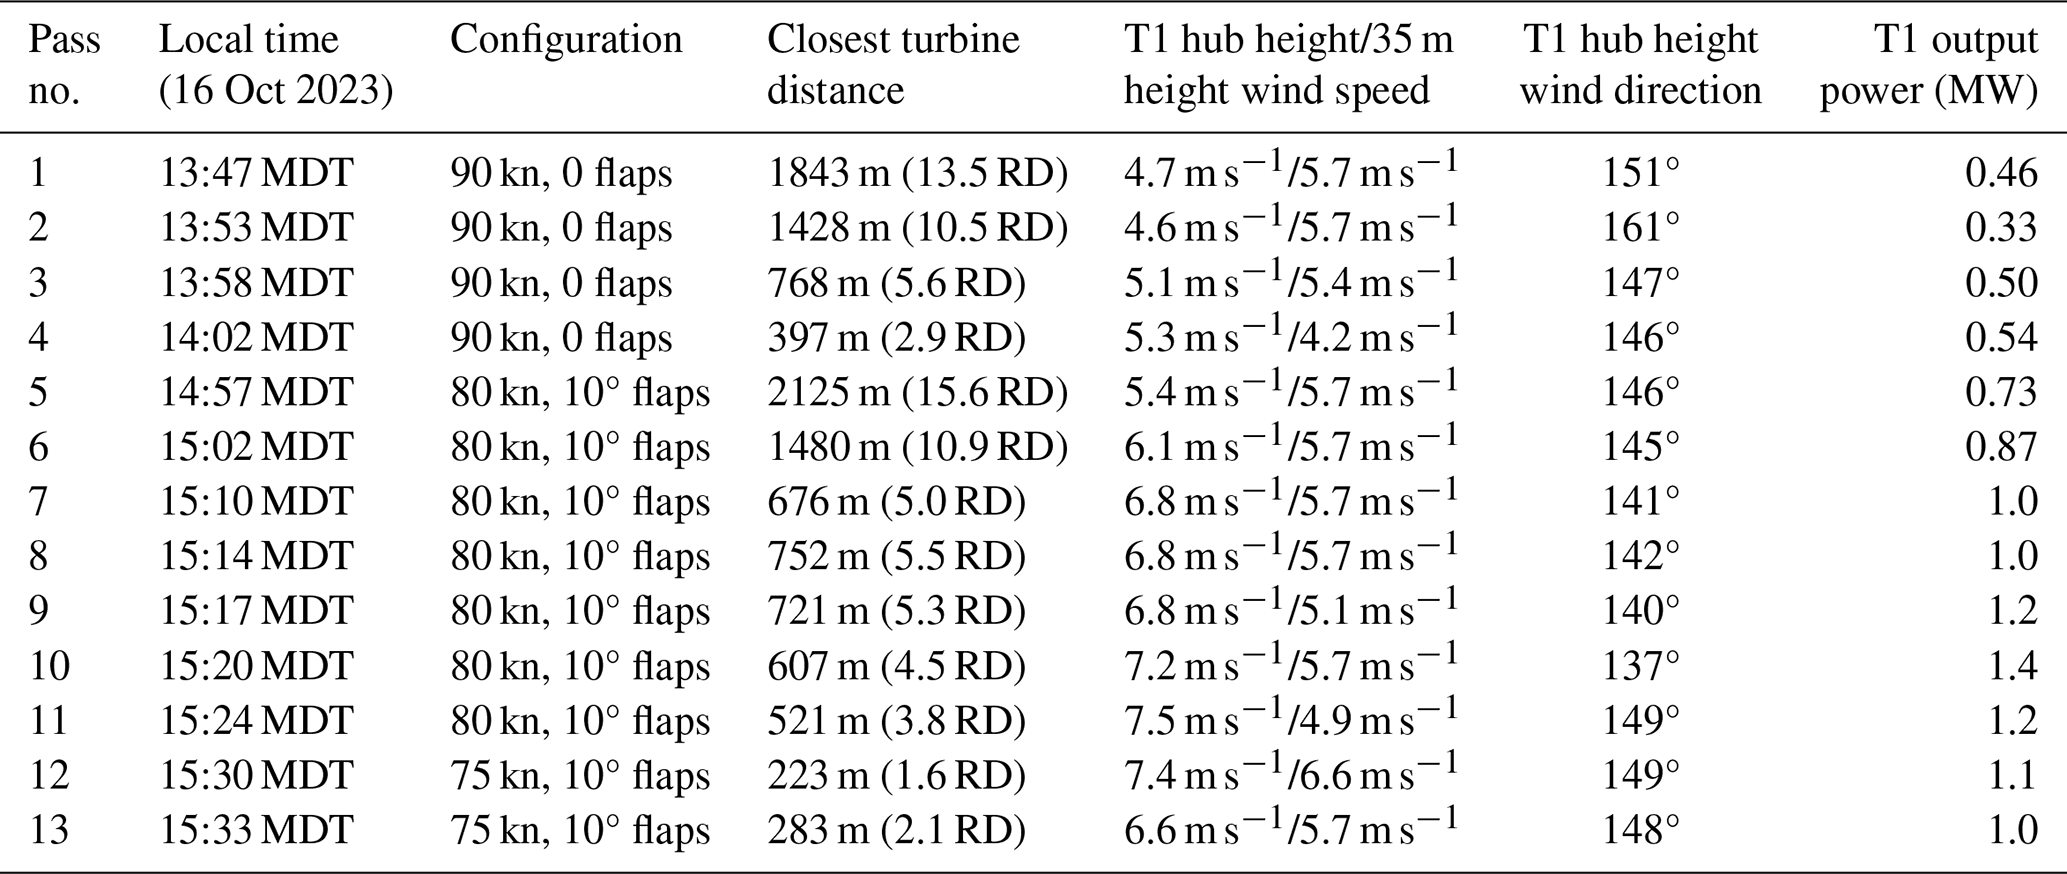
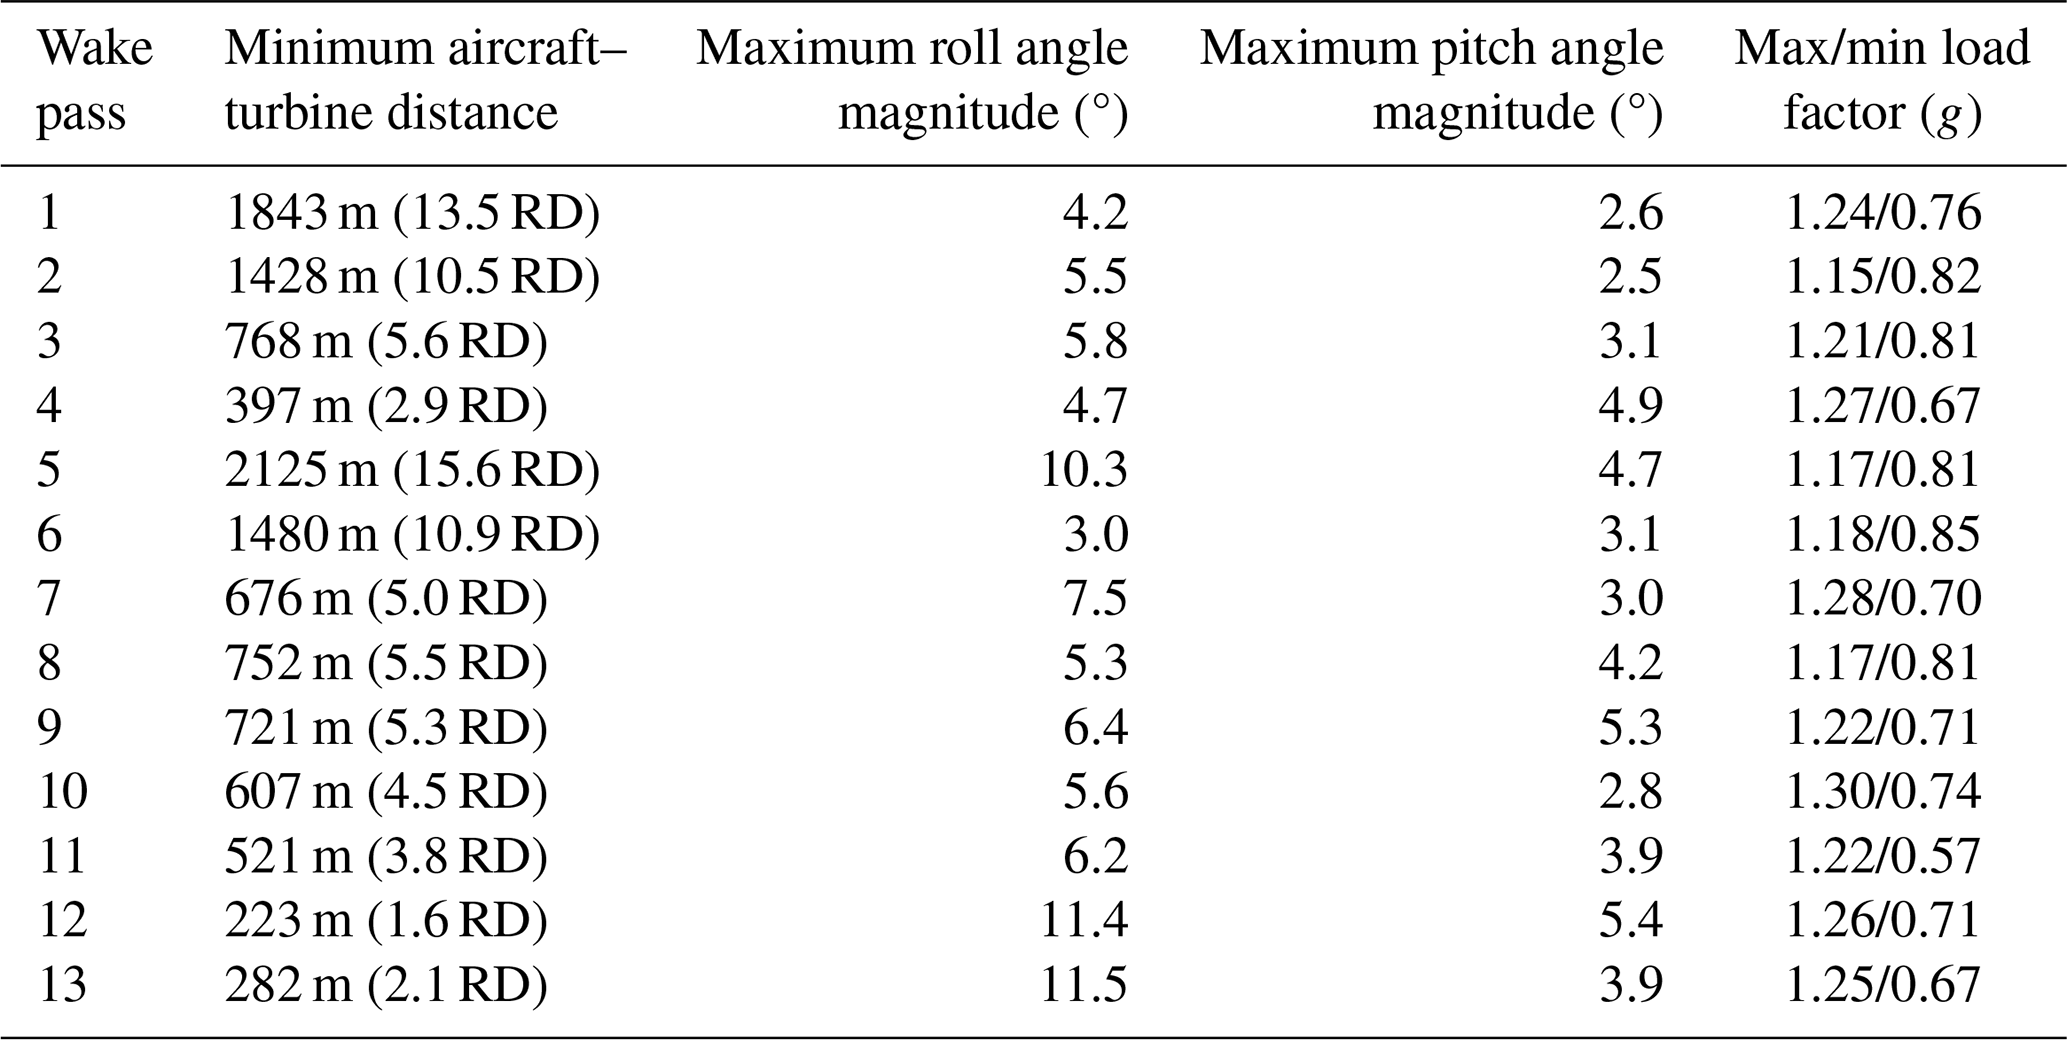
The pilot was asked to fly two passes with closest distances of approach to the turbine of 15, 10, 5, and 3 RD, with one pass at each distance flown with the 90 kn configuration and one flown with the 80 kn configuration. In addition, the pilot was asked to repeat the 5 RD pass at 80 kn four times to provide more data for this specific configuration. The pilot was also granted latitude to fly additional passes closer to the turbine as desired. The resulting passes, listed in Table 4, were flown at different lateral distances from the turbine with the closest point of approach ranging from 1.6 to 15.6 RD. The flights were flown at altitudes of 45–122 m above the ground, with most flights flown at an altitude near the hub height of the turbine (105 m). Figure 4 shows the GPS ground tracks of the 13 wake passes. Table 4 shows the time, flight configuration, closest point of approach to the turbine, wind speed, wind direction, and turbine power output for each wake pass. Note that the closest distance of approach to the turbine requested for each trial sometimes differed slightly from the closest distance actually flown (as listed in Table 4) due to small errors in flight path tracking. For instance, wake pass 1 was intended to approach the turbine within 15 RD but approached within 13.5 RD instead, while wake passes 7–10 were intended to approach within 5 RD of the turbine but varied between 4.5 and 5.5 RD.
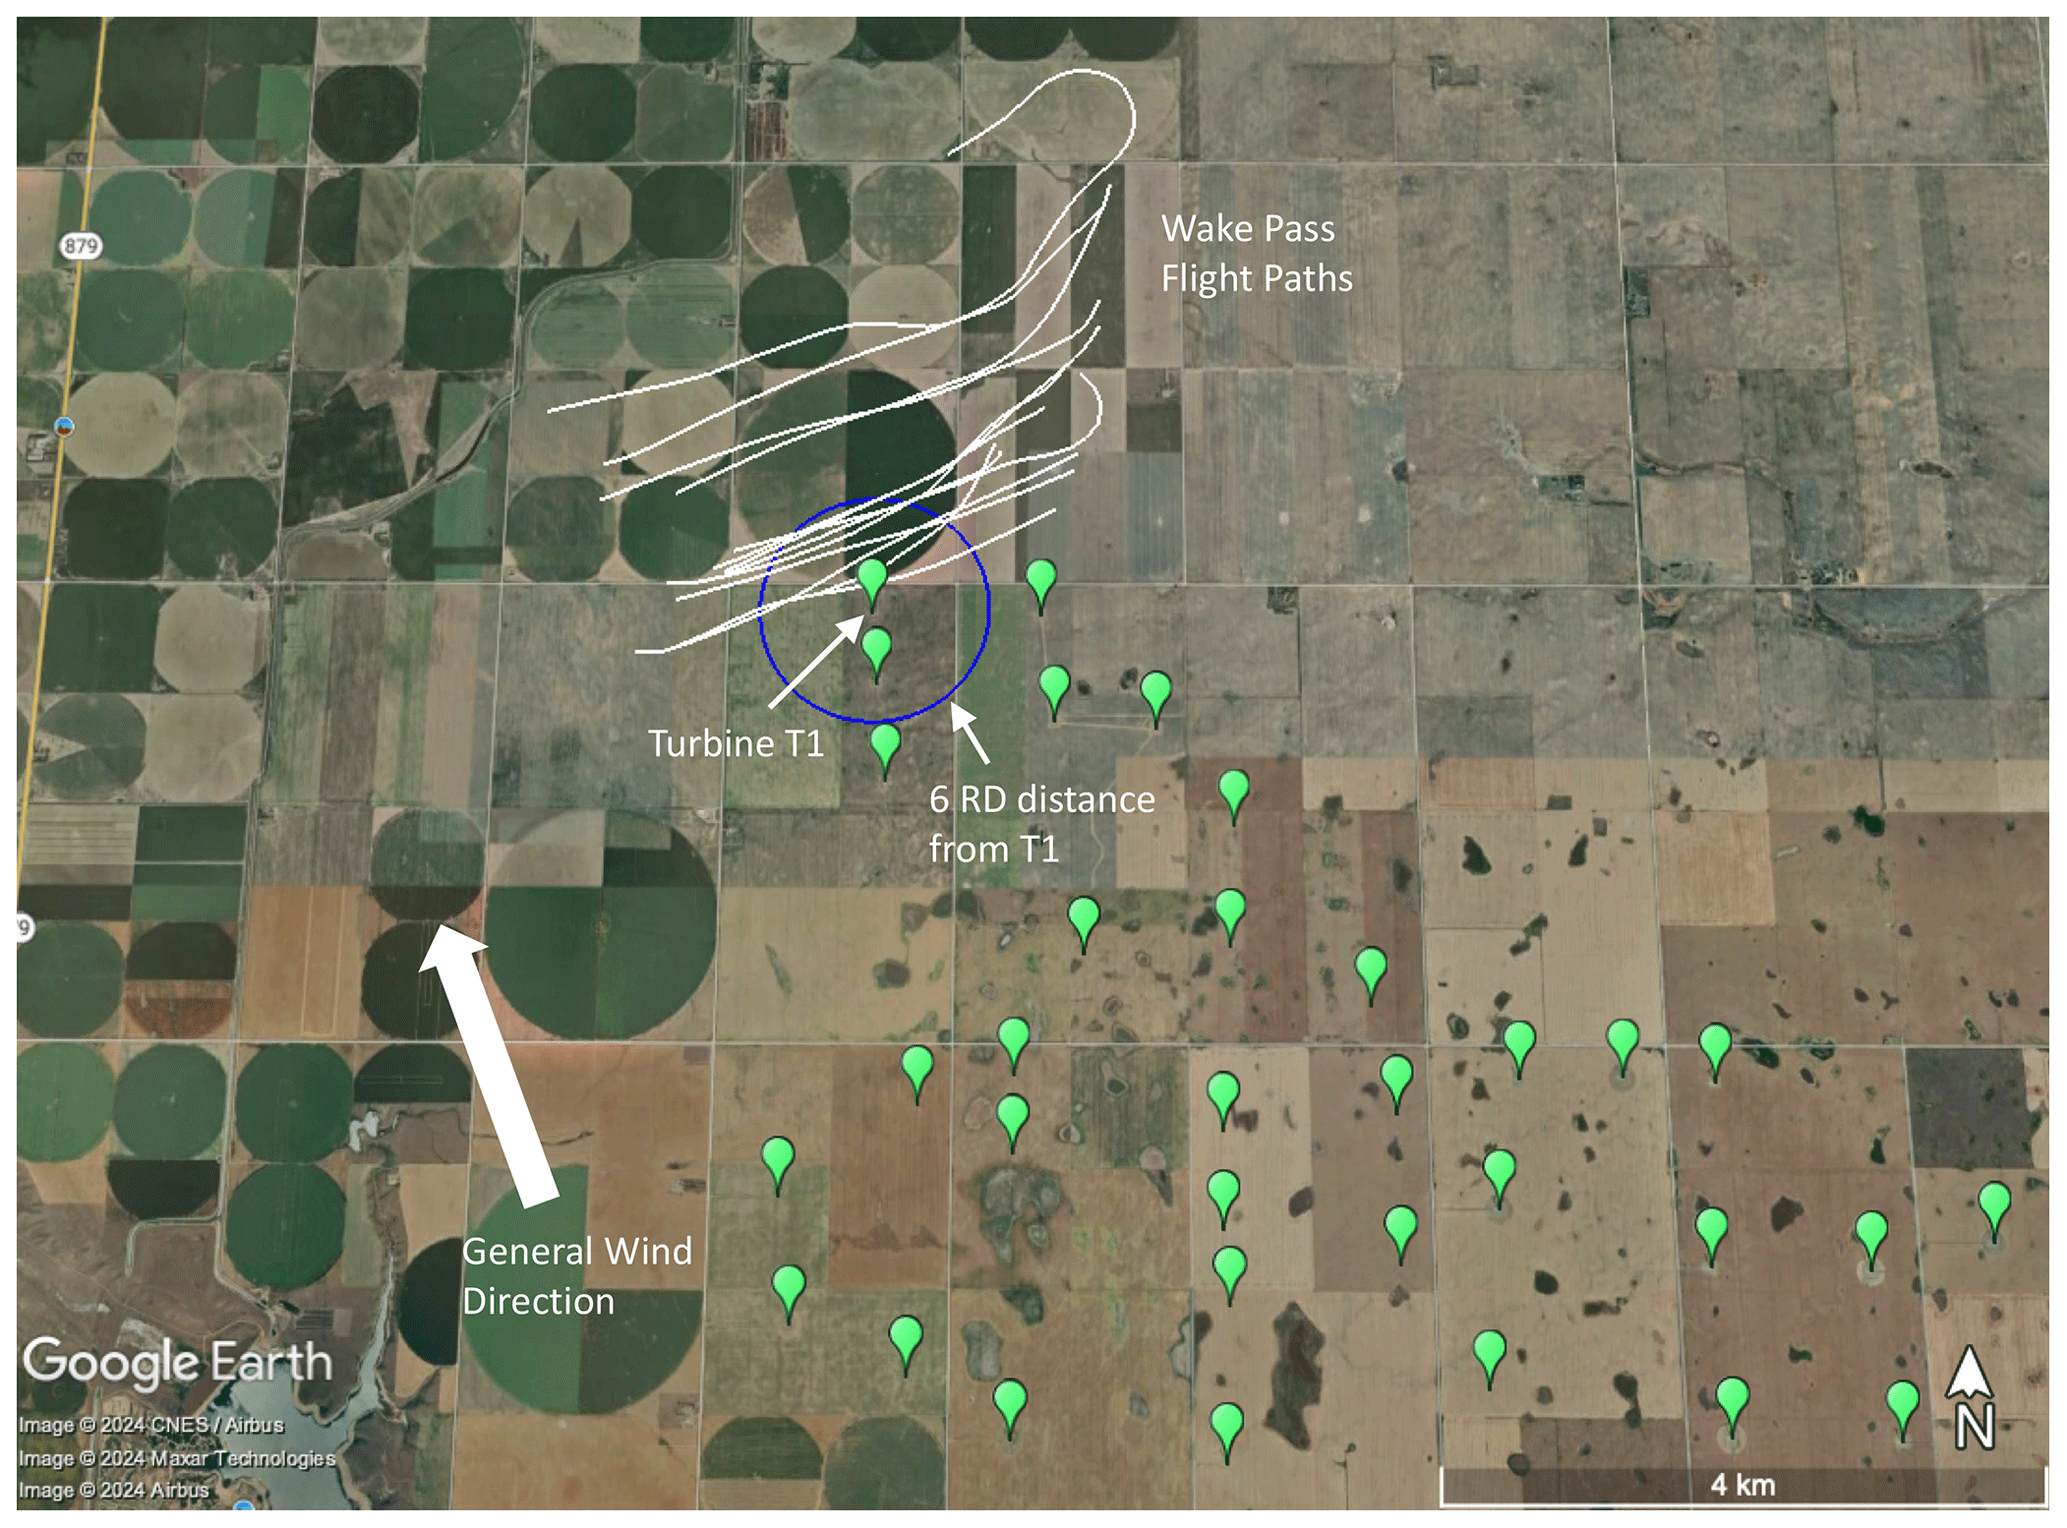
Figure 4GPS ground tracks of each wake pass.
The wind speeds at the time of the test flight shown in Table 4 were slightly lower than the annual average wind speed at Whitla of about 8 m s−1. However, wind conditions were generally favorable for the creation of added turbulence in the wind turbine wake. It is well-known that turbine-added turbulence is a function of the turbine thrust coefficient (Quarton and Ainslee, 1990; Crespo and Hernandez, 1996). Modern turbine control systems operate under high-thrust conditions when there are low wind speeds so as to avoid tower resonance, with thrust coefficients typically exceeding 0.96 at wind speeds below 7–8 m s−1 (Martinez-Tossas et al., 2022). The wind speeds recorded by turbine T1's SCADA system during the flight trials varied from 4.7–7.5 m s−1 and thus were conducive to the generation of added turbulence in the wake due to operation at a relatively high thrust coefficient. Furthermore, the wind speeds recorded by the meteorological tower at 35 m altitude in Table 4 were in the range of 4.9–6.6 m s−1, which would be favorable for recreational flying. One factor that may have reduced the level of turbulence encountered in the wake during the test flights is daytime-heating-induced vertical mixing, which is known to dilute the wake (Lee and Lundquist, 2017). Although nighttime conditions have the potential for higher levels of wake turbulence due to reduced vertical mixing, general aviation aircraft flight through a turbine wake at night would be extremely infrequent. The two most common scenarios where a general aviation aircraft may be expected to fly below tip height in the wake region of a turbine would be during aerial applicator (crop-dusting) missions or on takeoff or landing from an airport. Aerial application is done only during the daytime. Furthermore, in North America, airports located near turbines tend to be private or small public airstrips which have minimal nighttime operations. As a result, the flight test is representative of a situation in which a general aviation aircraft would encounter a turbine wake and embodies an almost worst-case scenario in which the turbine is producing relatively high levels of added turbulence in the wake in daytime conditions.
The flight test data consist of sensor data recorded from the iPhone mounted to the aircraft dashboard as well as videos captured during each wake pass. This section presents time histories of the relevant aircraft states, a description of the video data, and a qualitative description from the pilot regarding the level of turbulence encountered and the flight control response required.
3.1 Sensor data
This section presents the sensor data recorded during each wake pass. Figures 5 and 6 show the GPS tracks for the wake passes along with the approximate location of the wake. In these figures, the GPS tracks are shown with a black line, the turbine location is shown with a red dot, and the approximate wake boundaries are shown with dashed blue lines. The wake boundaries are approximated as a region that is two rotor diameters wide (272 m), directly downwind of the turbine. The wake boundaries shown for each wake pass are computed using the wind direction recorded during that wake pass by the turbine SCADA system. It is acknowledged that the wake does not always propagate directly downwind of the turbine due to effects such as wake meandering, and thus the wake boundaries shown are only approximate.
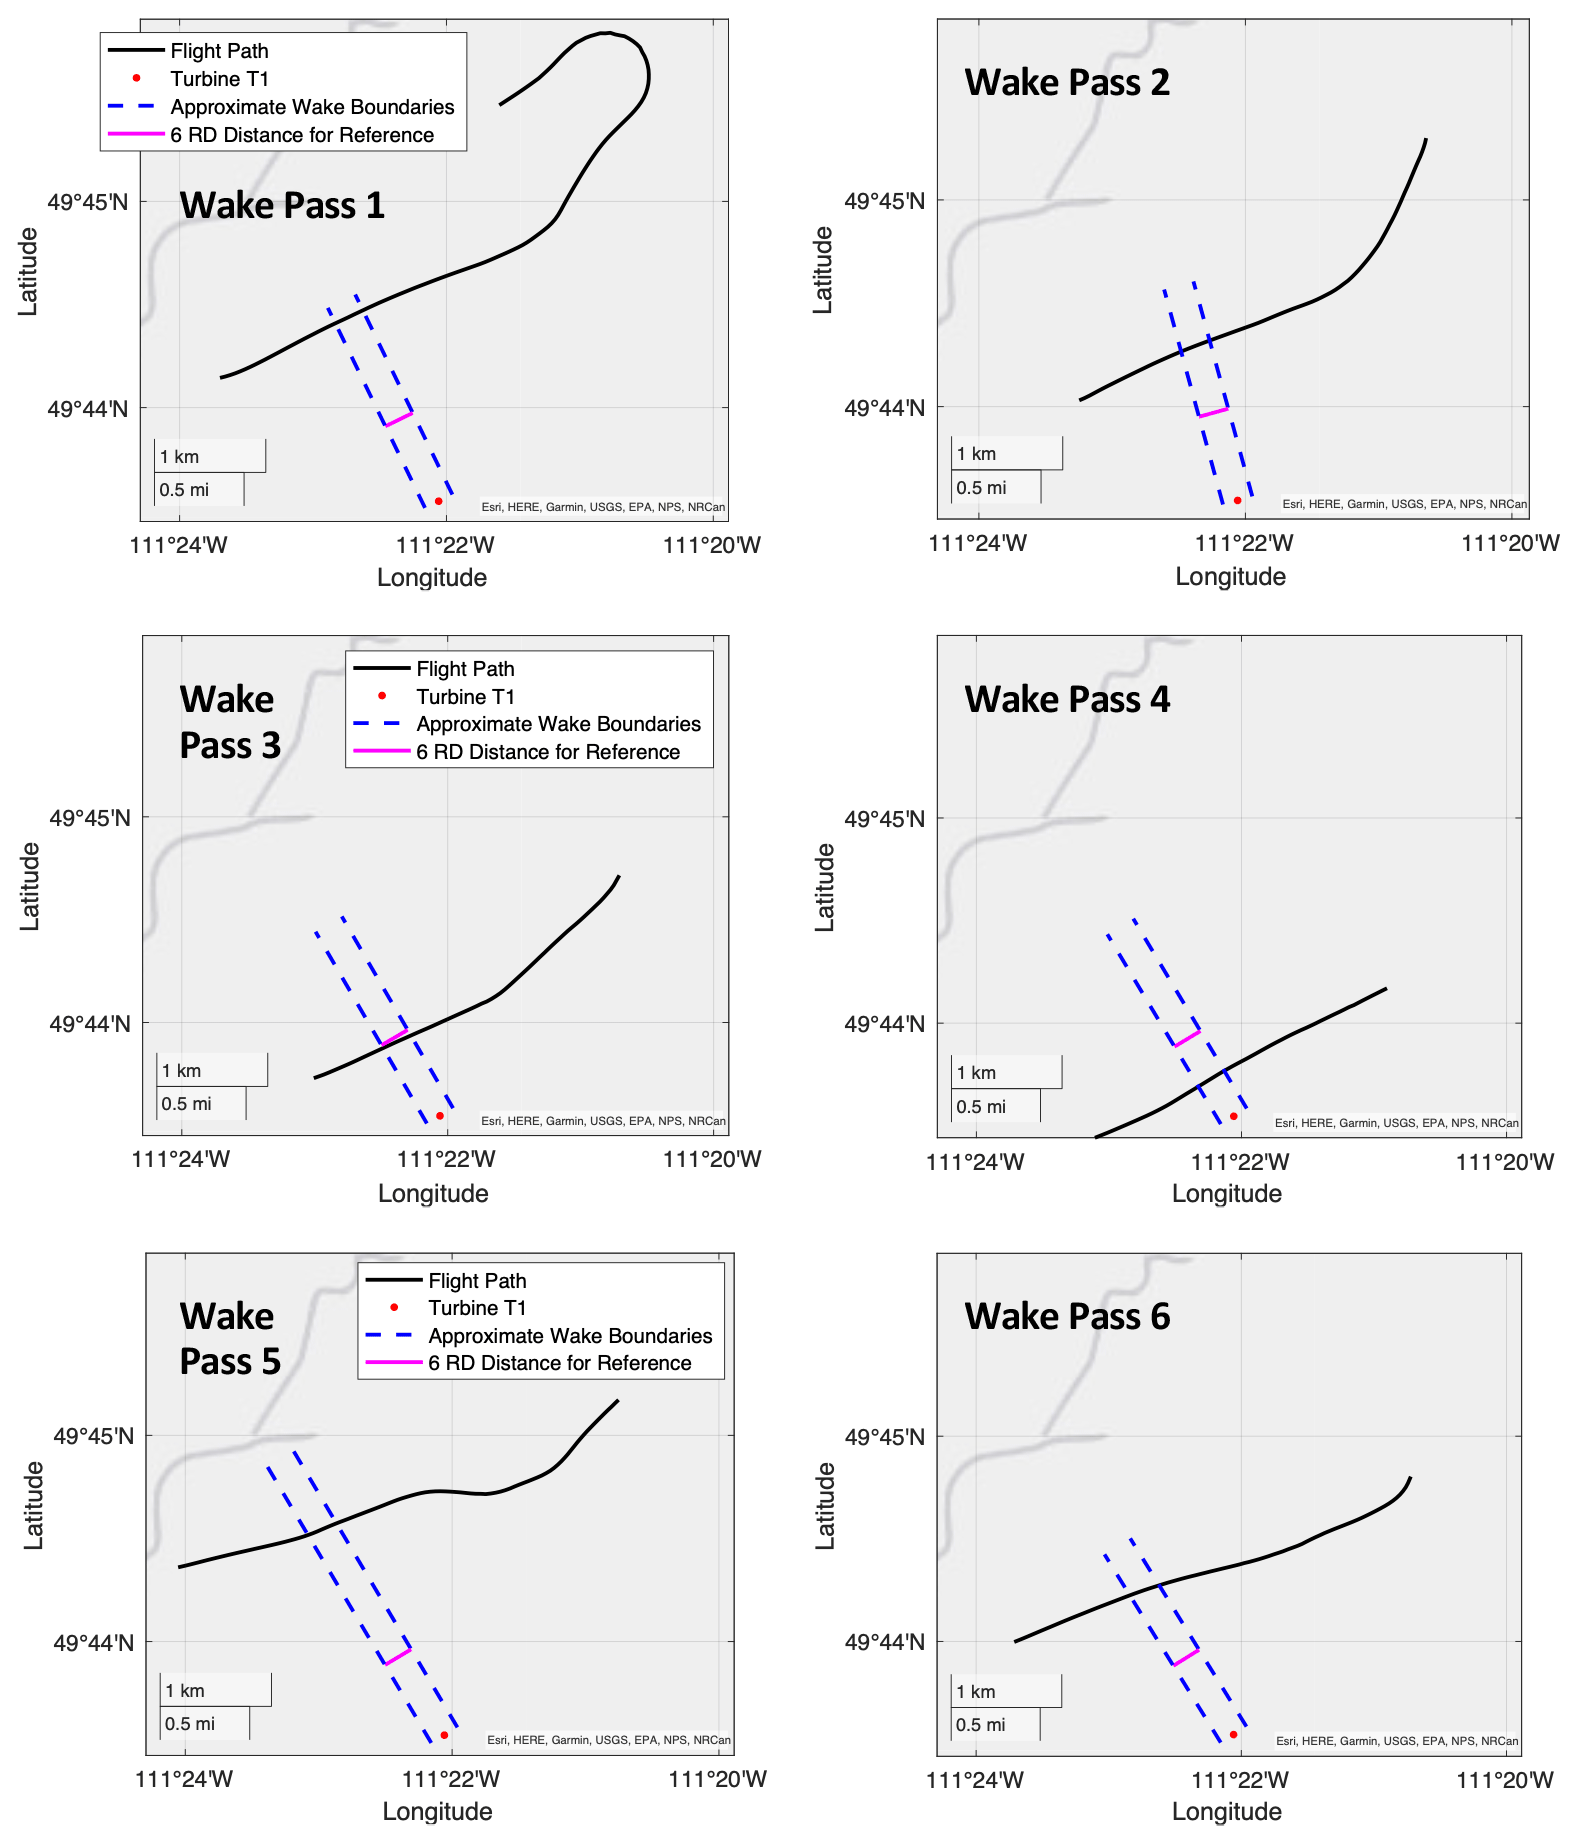
Figure 5GPS tracks for wake passes 1–6.
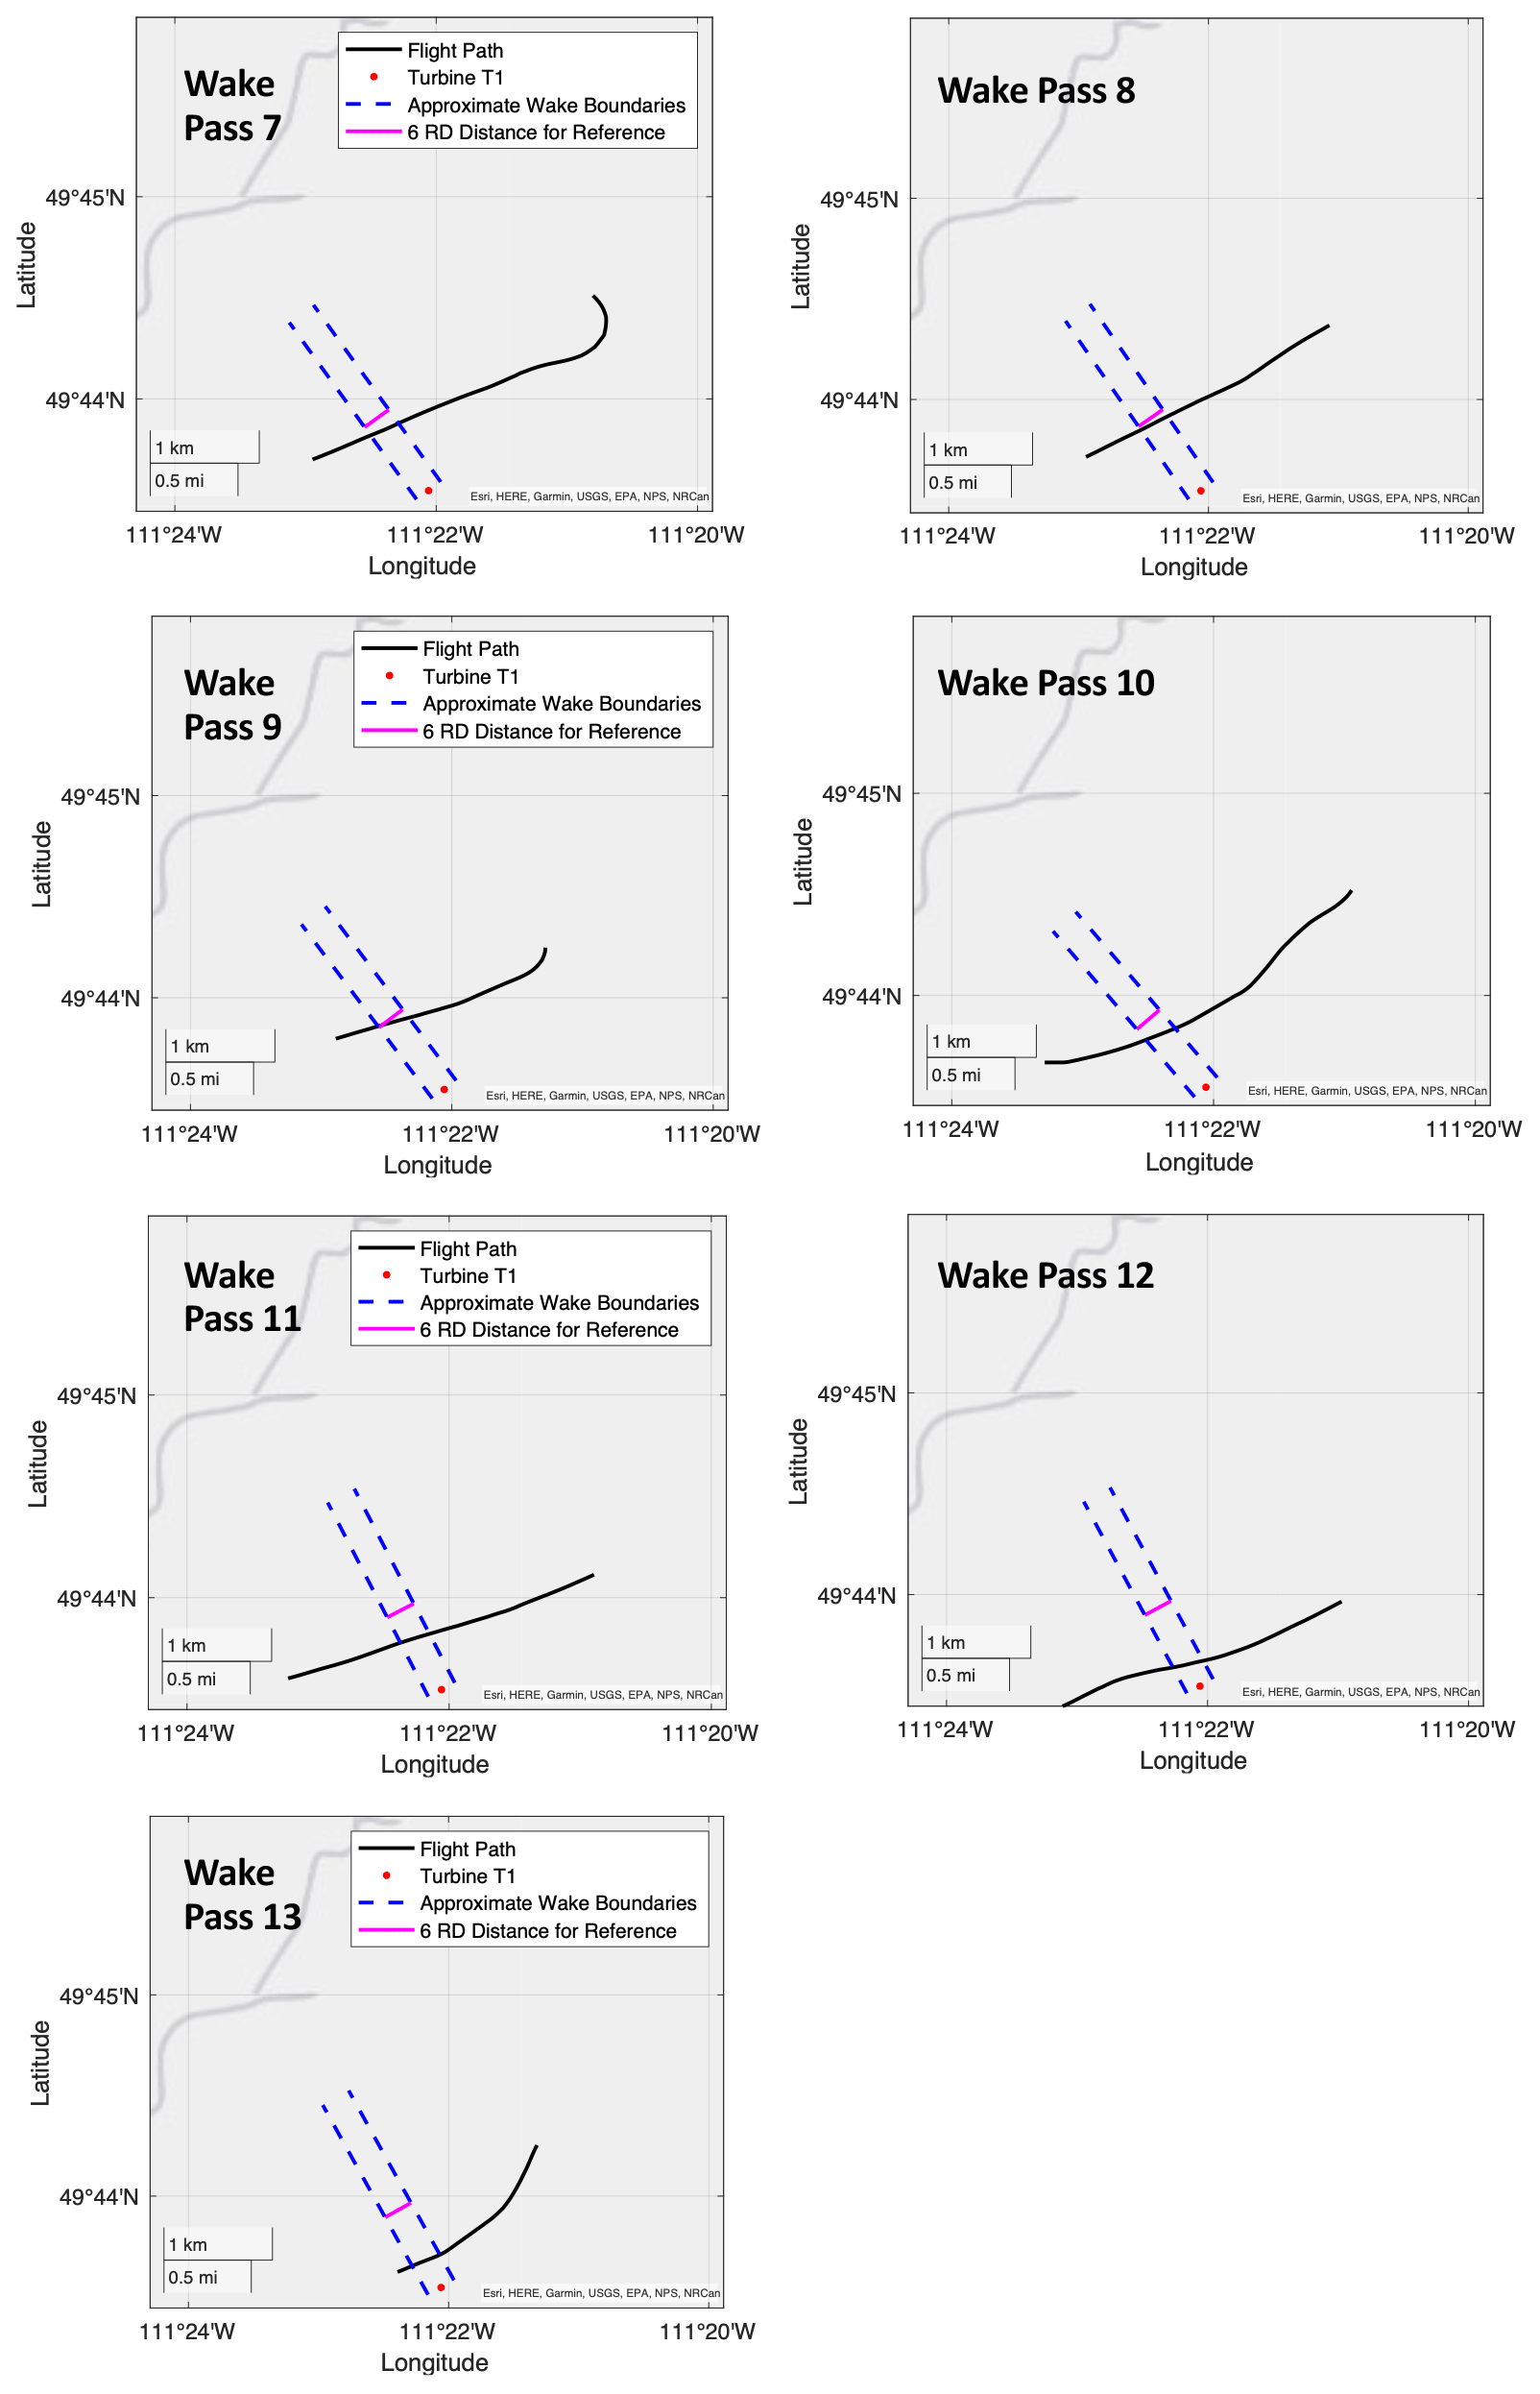
Figure 6GPS tracks for wake passes 7–13.
Figures 7–12 show the time histories of distance to the turbine, groundspeed and estimated airspeed, roll and pitch angles, bearing angle, altitude above ground level (AGL), and load factor for wake passes 2, 6, 7, 9, 12, and 13. Flight data from these wake passes are shown to illustrate general trends; data from the remaining wake passes are shown in the Supplement. In the flight data plots, the vertical dashed black lines indicate the approximate times when the aircraft enters and exits the wake. These times are determined from the GPS timestamps recorded when the aircraft crosses the approximate wake boundaries shown in Figs. 5 and 6. Although a target airspeed of either 90, 80, or 75 kn was selected for each wake pass, it is difficult to maintain a target airspeed precisely when flying the aircraft due to normal disturbances and imprecision when controlling the aircraft. Thus, in the results below, the airspeed and groundspeed deviate slightly from the selected speeds, both inside and outside the wake.
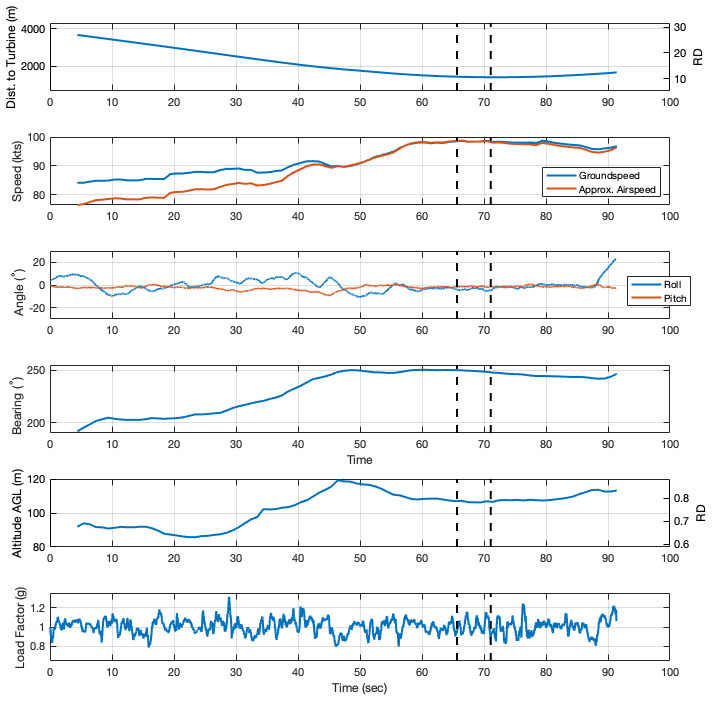
Figure 7Sensor data from wake pass 2 (closest distance of approach is 10.5 RD). Dashed lines indicate the time period during which the aircraft was present in the estimated wake region of turbine T1.
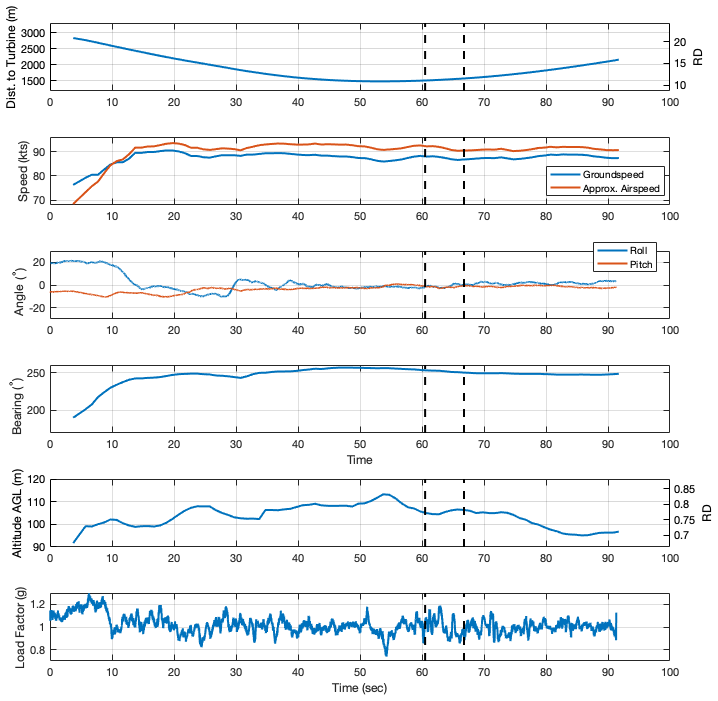
Figure 8Sensor data from wake pass 6 (closest distance of approach is 10.9 RD). Dashed lines indicate the time period during which the aircraft was present in the estimated wake region of turbine T1.
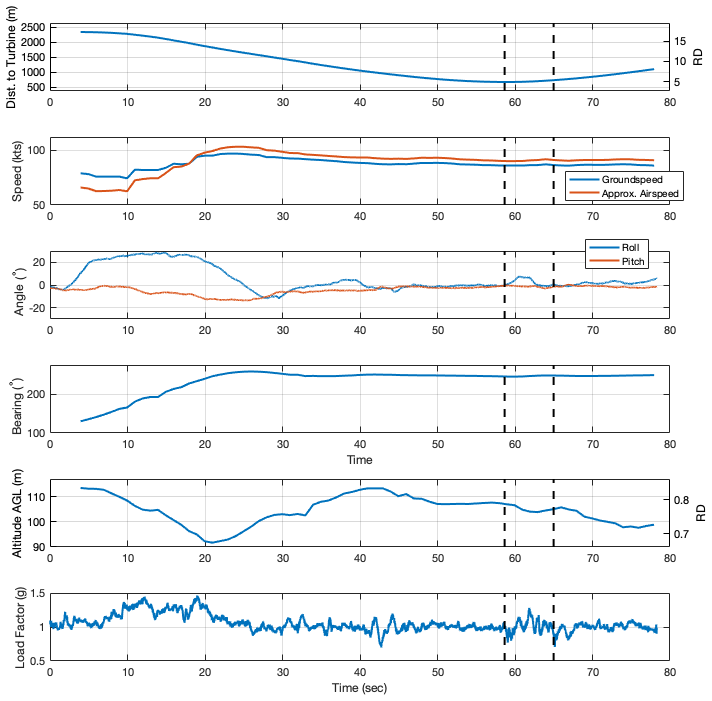
Figure 9Sensor data from wake pass 7 (closest distance of approach is 5.0 RD). Dashed lines indicate the time period during which the aircraft was present in the estimated wake region of turbine T1.
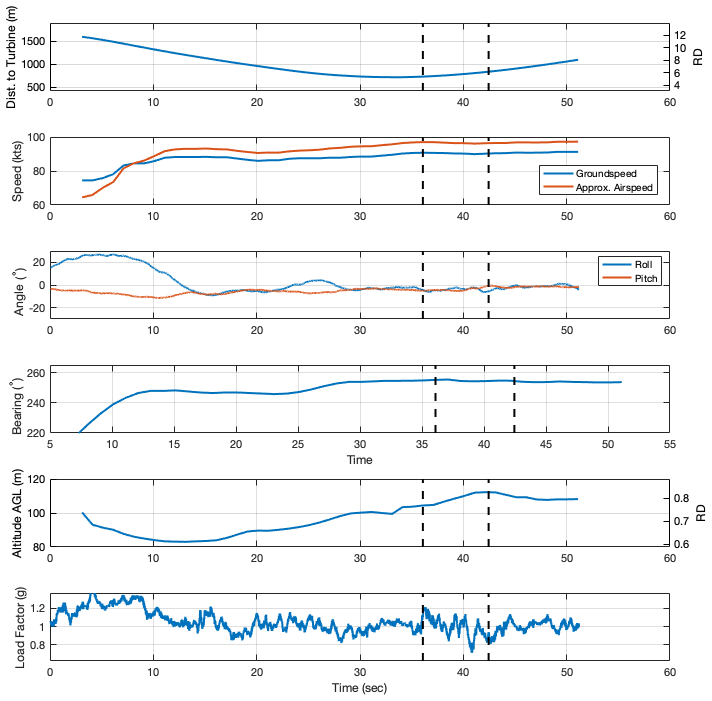
Figure 10Sensor data from wake pass 9 (closest distance of approach is 5.3 RD). Dashed lines indicate the time period during which the aircraft was present in the estimated wake region of turbine T1.
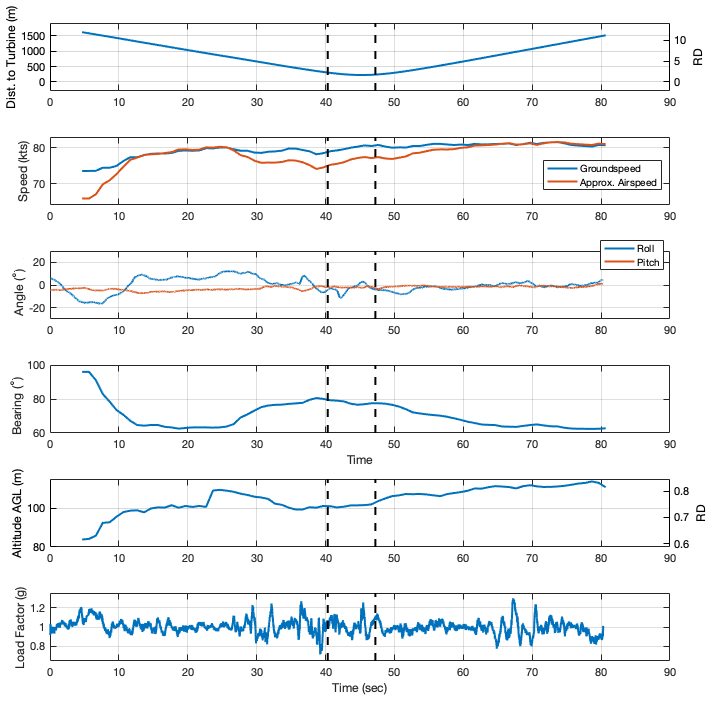
Figure 11Sensor data from wake pass 12 (closest distance of approach is 1.6 RD). Dashed lines indicate the time period during which the aircraft was present in the estimated wake region of turbine T1.
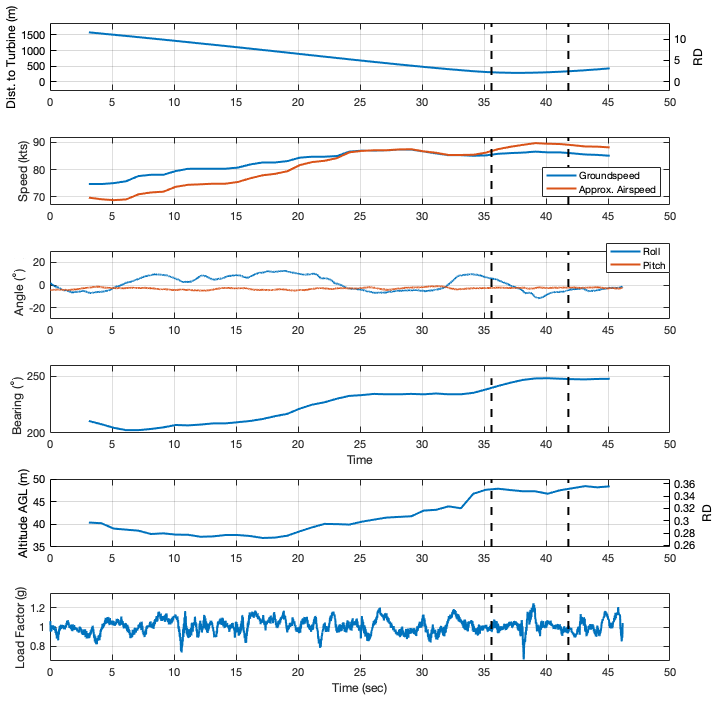
Figure 12Sensor data from wake pass 13 (closest distance of approach is 2.1 RD). Dashed lines indicate the time period during which the aircraft was present in the estimated wake region of turbine T1.
Several trends are evident in Figs. 5–12 and the figures in the Supplement. The GPS tracks show that the pilot flew nearly perpendicularly to the wake in each pass, and Figs. 7–12 show that the aircraft was present in the wake region of T1, as estimated by the above procedure, for between 5–10 s during each pass. In most wake passes, the levels of pitch and roll disturbances, load factor magnitudes, and speed and bearing deviations are not noticeably higher inside the wake compared to outside. In some passes close to the turbine, such as wake pass 7 (Fig. 9), a small roll angle deviation of approximately 7.5° and an increase in the magnitude of load factor perturbations are noted inside the wake region. The severity of these disturbances will be compared to relevant benchmarks in a subsequent section.
3.2 Pilot feedback regarding experience flying through wake
Prior to discussing the pilot's comments regarding his experience of flying through the wake, it is helpful to present general turbulence categories used by the aviation community for reference. The United States Federal Aviation Administration (FAA) Aeronautical Information Manual (AIM) (FAA, 2021a) describes four categories of turbulence: light, moderate, severe, and extreme. The definitions of these turbulence categories are provided below (as direct quotes from FAA, 2021a):
-
Light turbulence. Turbulence that momentarily causes slight, erratic changes in altitude and/or attitude (pitch, roll, yaw).
-
Moderate turbulence. Turbulence that is similar to “light turbulence” but of greater intensity. Changes in altitude and/or attitude occur but the aircraft remains in positive control at all times. It usually causes variations in indicated airspeed.
-
Severe turbulence. Turbulence that causes large, abrupt changes in altitude and/or attitude. It usually causes large variations in indicated airspeed. Aircraft may be momentarily out of control.
-
Extreme turbulence. Turbulence in which the aircraft is violently tossed about and is practically impossible to control. It may cause structural damage.
Note that light or moderate turbulence generally does not pose a risk to aircraft safety from either a loss-of-control or a structural-load standpoint.
The pilot was debriefed about his experiences during the wake passes. The pilot was asked to provide an overall summary of his experiences in writing and to answer more specific questions related to workload, the magnitude of flight disturbances, and the presence of any safety risk (each of which is discussed below). A summary of the pilot's experiences and feedback is provided here. First, the pilot noticed that during the flight down to the wind farm, the air was generally smooth, with no atmospheric turbulence noticeable. This indicates that a stable atmosphere prevailed during the flight experiment. It is well-known that stable atmospheric conditions, i.e., low ambient turbulence intensity, are conducive to the longer propagation of turbine-added wake turbulence (Tomaszewski et al., 2018; FAA, 2021a). Within 3–4 km of the wind farm, when flying below the turbine tip heights, the pilot noticed “very light turbulence”. This would be expected downwind of a wind farm given the combined wake effects of 98 turbines at the Whitla Wind facility. The pilot's impression was that the turbulence experienced was negligible. The videos of each flight trial provide an indication of the very light turbulence experienced (the aircraft is operating downwind of the wind farm within 3–4 km and below tip height during the entire portion of all the videos).
The pilot noted that in the wake passes flown beyond four rotor diameters (all wake passes except 4, 11, 12, and 13), the flight was “just a little bumpy” and “didn't have any real disturbance to attitude”. Those encounters were described as “definitely good overall”. In trials performed closer than 4 RD, the pilot noted that some attitude disturbances did occur in the form of a slight rolling motion, “probably 10–15°”, on either entry to or exit from the wake. This observation by the pilot matches the magnitudes of 10–11° recorded in the flight data for wake passes 12 and 13 shown in Figs. 11–12. The pilot described the turbulence encountered during trials 12 and 13, flown around 200 m downwind of the turbine, as “moderate”. It is worth noting that, unlike flight in moderate atmospheric turbulence, flight through the turbine wake at distances of one to four rotor diameters can only happen over a 5–10 s time span for typical general aviation aircraft since the pilot must be flying perpendicularly to the wake, as in the flight trials performed here. This is because flying toward the turbine at this distance for a sustained period would cause a collision, and flying away from the turbine at this distance would quickly lead to spacing beyond four rotor diameters. Thus, the aircraft would only experience this level of turbulence for several seconds.
Several questions were posed to the pilot following the flight experiment to assess workload and the perceived level of risk. First, the pilot was asked to comment on the level of control action required to maintain straight and level flight when flying through the wake of turbine T1, compared to flight outside the wake. The pilot's response to this question was as follows:
Overall I was trying to carefully set up the aircraft before entering the wake zone so that the data of that turbine's turbulence would be as good as possible. Once in the wake zone I was prepared to react however necessary. However, I did not end up flying differently inside the wake as compared to outside. I remained using small inputs to try and hold altitude and airspeed, except for the very last pass which I did, which was within a few hundred feet of the turbine. In the last pass, I used moderate control input to correct for the brief roll disturbance that occurred.
Second, the pilot was asked whether the turbulence encountered in the wake of turbine T1 ever posed a risk to the aircraft, led to an increase in pilot workload, or placed the aircraft in (or close to) an “upset” condition. Note that the FAA Airplane Flying Handbook (FAA, 2021b) defines an upset condition, which can be a precursor to loss of control, as a roll angle exceeding 45° and pitch angle less than −10° or greater than 25°. The pilot's response to this question was as follows:
The turbulence inside the wake did not pose a safety risk to the aircraft. My workload was already high as I was trying to hold altitude and airspeed as closely as possible to test requirements, while flying through air that was not smooth to begin with. Entering the wake zone behind the turbine did not increase my workload further. If I was flying with a lower workload, I do not think my workload would have increased. At no time during the requested test runs did the aircraft come close to entering an unusual attitude. Only on the last extra pass [wake pass 13] did the aircraft experience a wing drop that could have resulted in an unusual attitude without normal corrective action. This normal corrective action is similar to what would be used by a pilot in moderate atmospheric turbulence to correct for disturbances.
The pilot was also asked whether the turbulence experienced inside the wake of turbine T1 was similar to atmospheric turbulence he experienced outside the wake on this flight and on other flights not in proximity to wind farms. He replied, “I would say that it was the same.” Finally, the pilot was asked whether he would have any concerns about flying in wake turbulence from a turbine again, to which he replied that he would not.
3.3 Video recordings during wake passes
Each wake pass was recorded by a GoPro HERO10 Black video camera mounted rigidly at the back of the cabin, facing forward. Video files are available for viewing and download at https://doi.org/10.5281/zenodo.11085457 (Rogers, 2024a). Each video begins prior to entry into the wake of turbine T1 and ends after the aircraft exits the wake. The videos were all filmed while the aircraft was below the turbine tip heights. Examination of the videos reveals the light or very light turbulence experienced when outside the wake of T1 at the beginning and end of each video segment, corroborating the description provided by the pilot. The turbulence experienced in the middle of each video segment as the aircraft passes through T1's wake can be compared with this background level of turbulence to assess the additional level of disturbances to the aircraft motion caused by flight through T1's wake.
Review of the video evidence shows that there was no noticeable change in the magnitude of the aircraft perturbations as the aircraft flew through the wake in passes 1, 2, 3, 5, 6, 8, and 9 (flown at 13.5, 10.5, 5.6, 15.6, 10.9, 5.5, and 5.3 RD, respectively). Several of these wake passes (1, 2, 5, and 6) were flown beyond 10 rotor diameters from the turbine, while others (passes 3, 8, and 9) were flown closer than 6 rotor diameters. In videos from wake passes 4, 7, 10, 11, 12, and 13 (flown at 2.9, 5.0, 4.5, 3.8, 1.6, and 2.1 RD, respectively), it is possible to notice some slight perturbations to the aircraft as it passes through the wake. In wake passes 4, 7, 10, and 11, the perturbations are only very slightly noticeable. In passes 12 and 13, which were performed closer than two rotor diameters from the turbine, brief roll perturbations as well as small vertical disturbances are experienced. These disturbances were short-lived and, in the video, seemed to be easily corrected by the pilot. The video in these trials generally corroborates the pilot's descriptions of the turbulence magnitude and control actions required.
The video evidence did not show increased pilot workload or control action when flying through the wakes. Pilot control action and workload appeared to remain the same during the flight trials, regardless of whether flying inside or outside the wake. This video evidence again corroborates the pilot feedback provided after the flight trials.
The primary goal of this study is to measure the level of turbulence experienced by a general aviation aircraft in the wake of a utility-scale wind turbine and to compare the disturbances experienced to relevant thresholds to assess whether a safety hazard existed. When flying through turbulence, aircraft may encounter risks from both a loss-of-control standpoint and a structural-load standpoint. Thus, both of these factors must be considered when assessing the risk to the aircraft as it flies through the wake. For the purposes of this study, the risk of aircraft loss of control is measured by comparing the roll and pitch disturbances experienced by the aircraft as it traverses the wake to the definition of an upset as defined by the FAA Airplane Flying Handbook (FAA, 2021b). An upset condition may be a precursor to loss of control per the FAA (2021b) and therefore serves as a suitable benchmark. Aircraft loads experienced in the wake are compared to the aircraft limit load factor, which is defined by the FAA (2021b) as “the limit load [that] can be sustained without compromising the integrity of the aircraft structure”. For normal-category aircraft (such as the Cessna 206 and most other general aviation aircraft), the positive limit load factor is +3.8 g and the negative limit load factor is −1.52 g (the positive limit is reduced to +3.5 g with flaps extended).
The flight data shown in Figs. 7–13 and the Supplement, as well as the video evidence and pilot feedback, support the conclusion that the aircraft did not experience a safety hazard when flying through the wake, even in close proximity to the turbine. First, consider the load factors experienced in the wake. For wake passes beyond six rotor diameters, there was no noticeable difference between the load factors experienced inside the wake and outside the wake. For flights flown closer than six rotor diameters, there was a very slight increase in the load factor perturbations on the order of 0.1–0.2 g beyond the loads observed in steady-state flight outside the wake of T1. Table 5 shows the maximum and minimum load factors experienced within 5 s of entering and exiting the wake regions (using the 2 RD wake width criterion used in Figs. 5–12). This 5 s buffer guards against uncertainty in predicting where the wake was at the time the aircraft passed through it. The maximum load factor recorded was 1.30 g (wake pass 10), and the minimum was 0.57 g (wake pass 11). These load factor disturbances did not approach the load factor limits of a normal-category aircraft.
Table 5Maximum state disturbances in or near the turbine wake.
To explore this further, consider the load factor plots from the flight trials flown beyond 6 RD from turbine T1 in Fig. 13 and the load factor plots from the trials flown closer than 6 RD in Fig. 14. Examining Fig. 13 first, which covers wake passes 1, 2, 5, and 6, it is evident that the load factor perturbations inside the dashed lines are of similar magnitude to those experienced throughout the remainder of the trial, outside the wake. Next, examining Fig. 14, there is still no large difference between the load factor perturbations experienced inside the wake region and outside the wake region. However, in some (but not all) of the wake passes in Fig. 14, the maximum or minimum load factors experienced during the trials occurred in or near the predicted wake region (either inside or near the dashed-line region). This occurs in wake passes 4, 7, 9, 11, 12, and 13 but not in wake passes 3, 8, and 10. For instance, in wake pass 9, the load factor reaches its lowest point of about 0.71 g inside the wake region. However, this is only 0.1 g lower than the minimum load factor that occurs outside the wake region in level flight and is still extremely far from the limit load factor of −1.52 g. Likewise, in wake pass 11, the load factor reaches a minimum value of 0.57 g near the end of the wake region. This load factor magnitude is only about 0.1 g less than the 0.68 g disturbance experienced earlier in the flight outside the wake of T1.
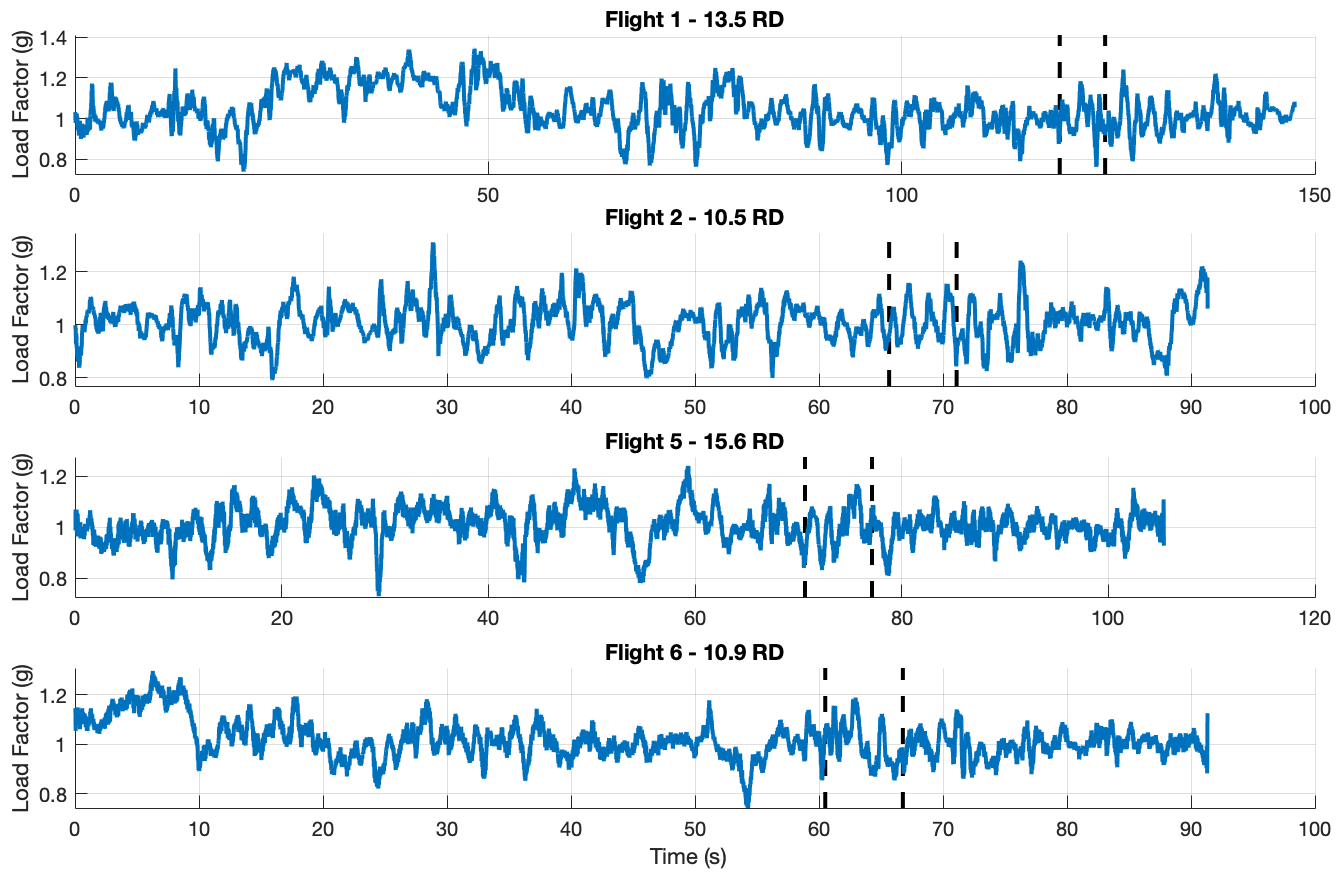
Figure 13Load factor vs. time for wake passes farther than 6 RD. Load factors experienced inside the wake region in the dashed lines are indistinguishable from those experienced outside the wake region.
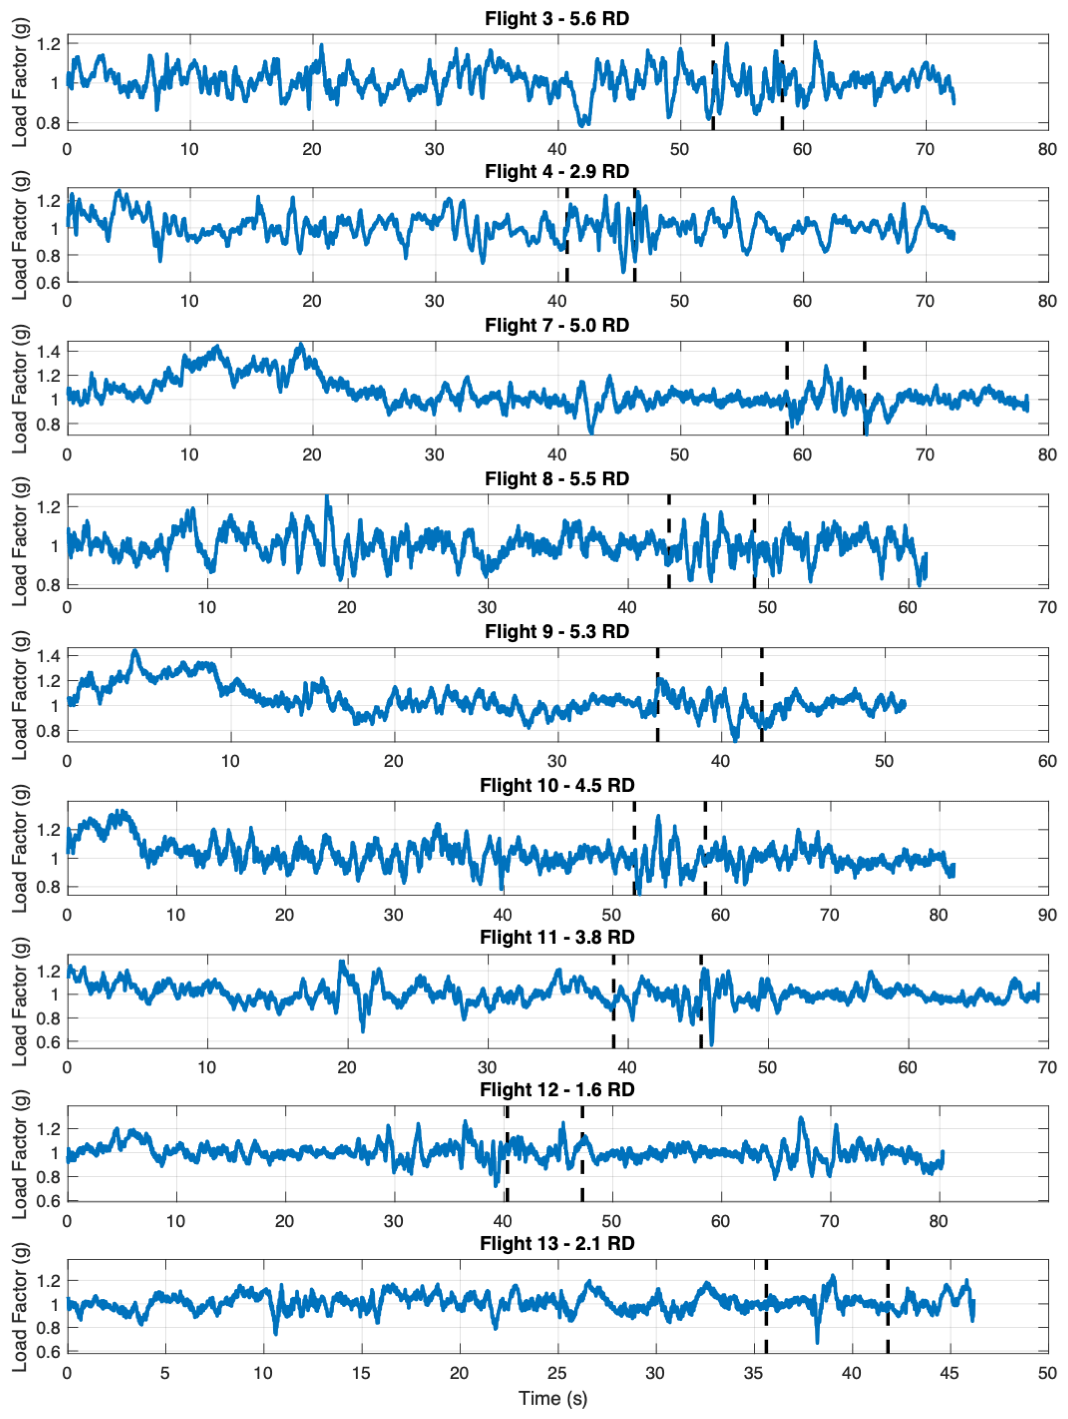
Figure 14Load factor vs. time for wake passes closer than 6 RD. Slight increases in load factor magnitudes when inside the wake are evident in wake passes 4, 7, 9, 11, 12, and 13 but not in wake passes 3, 8, and 10.
Another way to view these data is in terms of the maximum and minimum load factors experienced during each trial as a function of the closest distance of approach of each wake pass. These data are shown in Figs. 15 and 16. Although there is some scatter in the data, both figures show noticeable trends where larger load factor disturbances (both maximum and minimum) are experienced as the aircraft flies closer to the turbine, with maximum load factors reaching 1.25–1.30 g and minimum load factors reaching 0.5–0.75 g within 4 RD of the turbine.
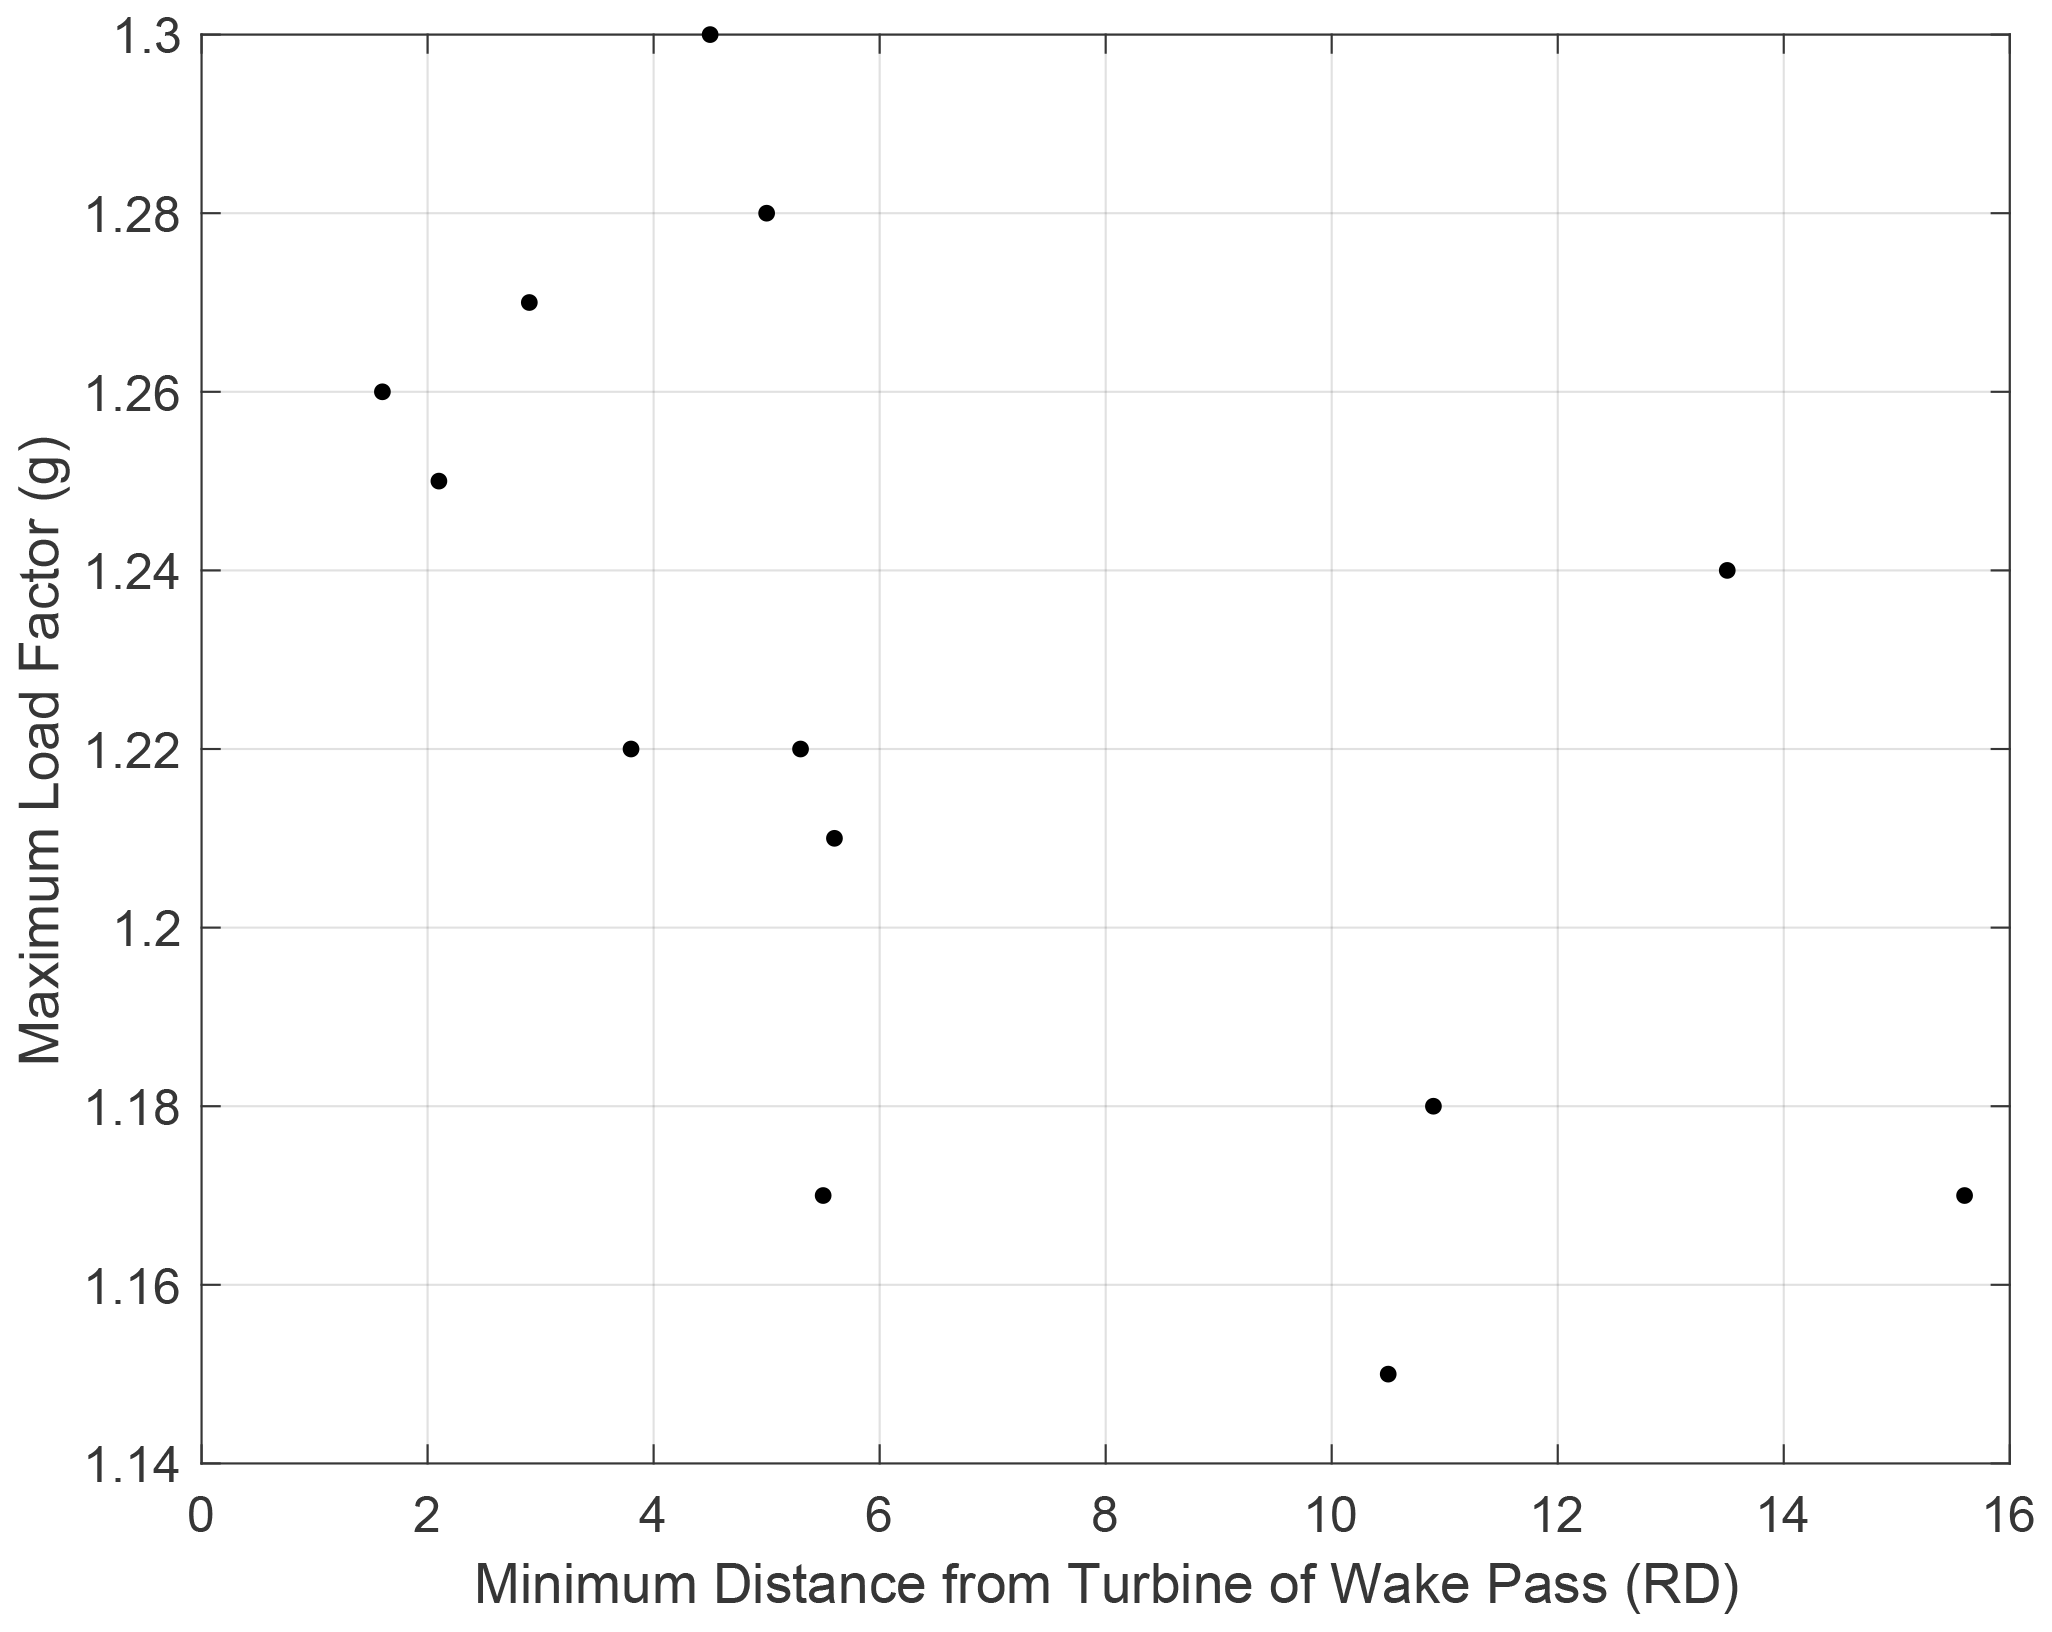
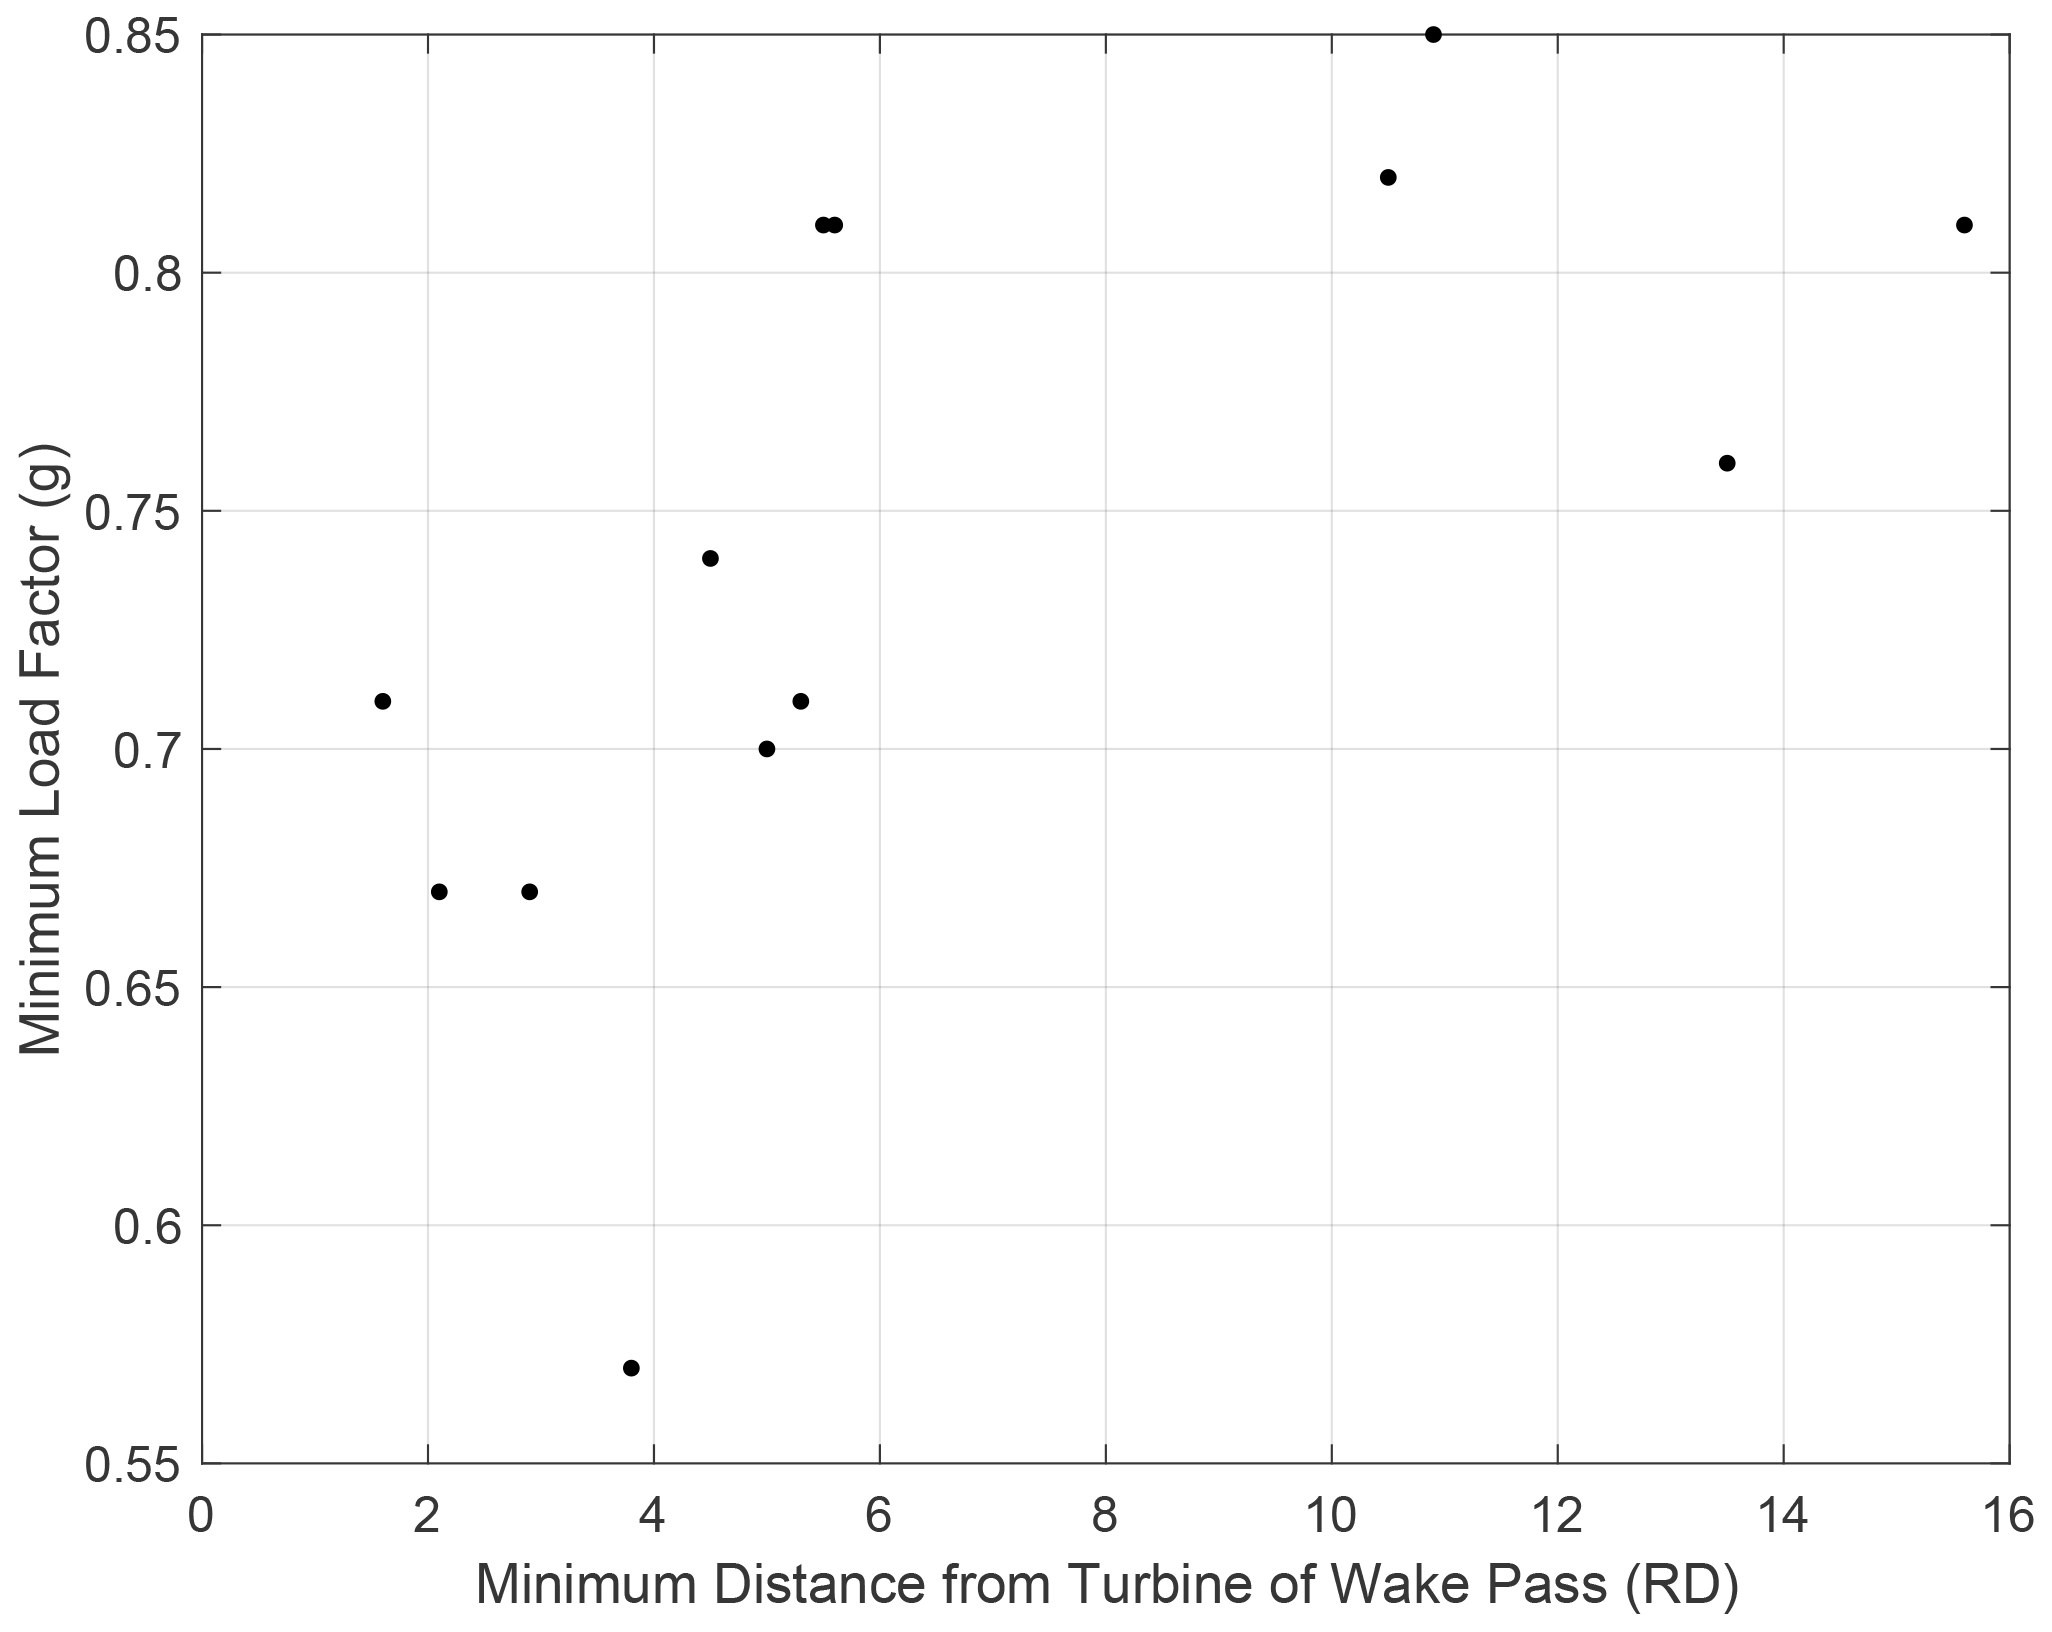
In summary, at distances greater than six rotor diameters, there was no noticeable effect of the wake in the recorded load factor data. At distances closer than six rotor diameters, a slight increase in vertical acceleration disturbances was noted in some of the wake passes, but they were of such a small magnitude that they did not pose a safety risk to the aircraft. Although the trends showed that higher load disturbances were experienced as the aircraft got closer to the turbine, the observed load factors were always well within the bounds of the limit load factor of +3.8 g (flaps up) or +3.5 g (flaps down) and −1.5 g. Furthermore, in light-ambient-turbulence conditions when the aircraft experiences similar loads due to atmospheric turbulence, loads of this magnitude may not be noticeable to the pilot or passengers.
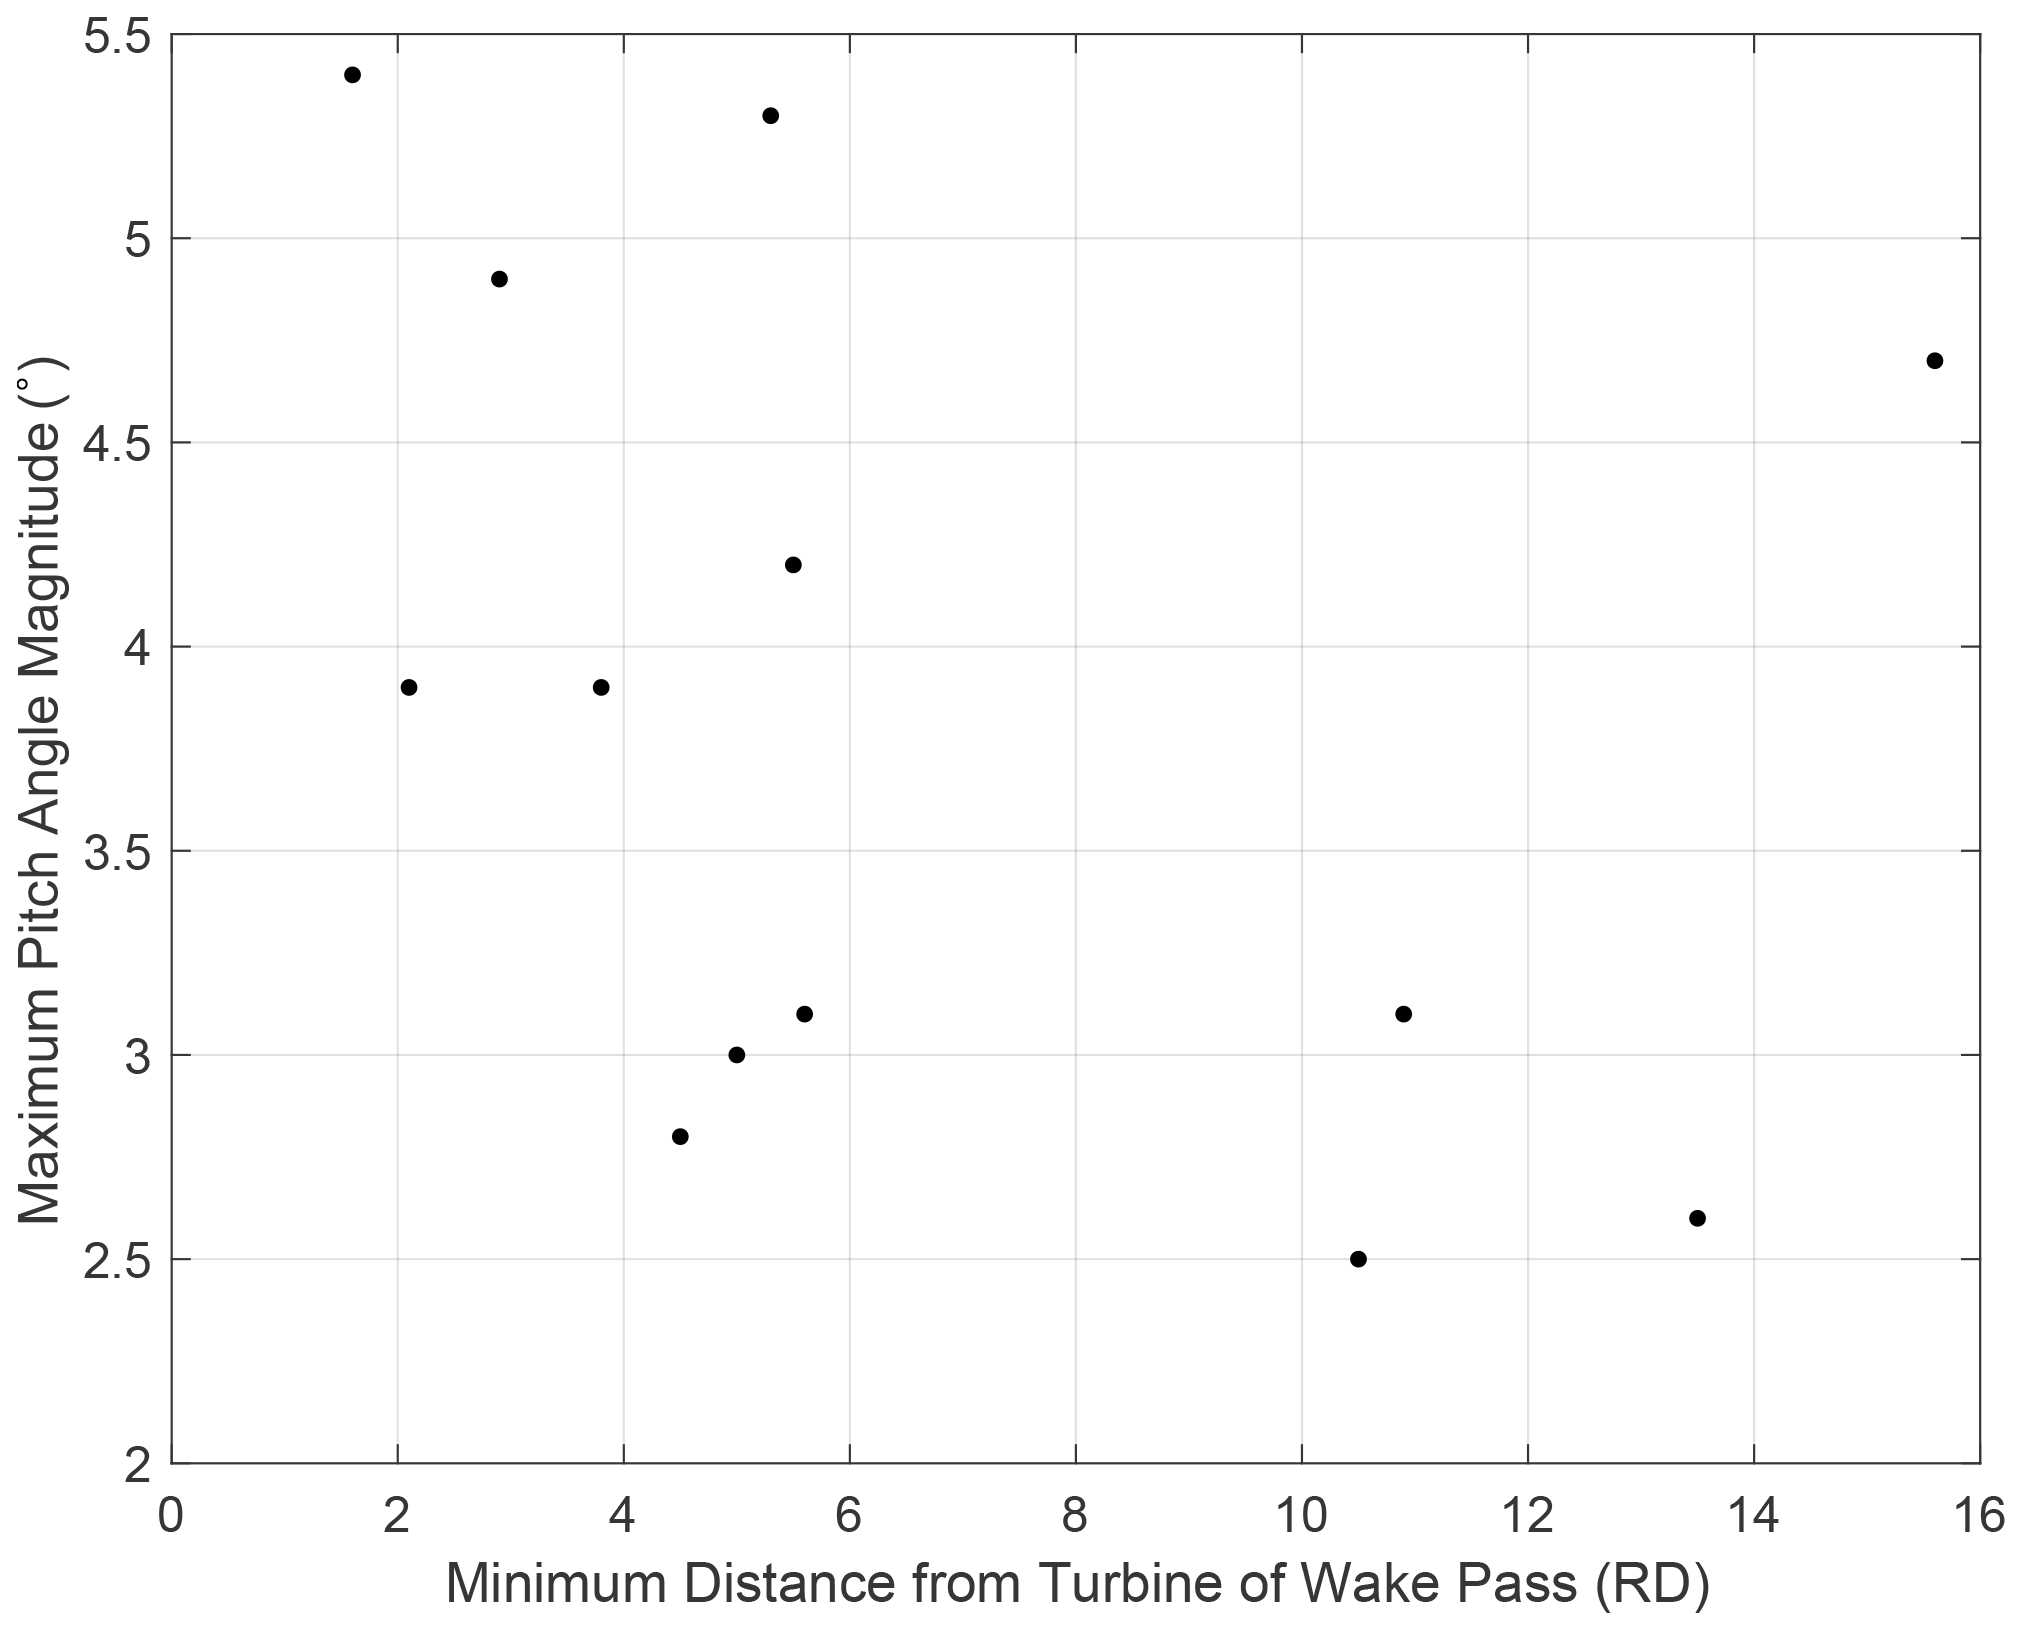
Turning to orientation disturbances, Table 5 shows the maximum roll and pitch magnitudes recorded inside the wake during each wake pass. As shown in this table, the maximum roll and pitch angles experienced were bounded by ±11.5° in roll and ±5.3° in pitch. Figures 17 and 18 show the maximum roll angle and pitch angle magnitudes versus the minimum aircraft–turbine separation distance for all wake passes. Except for the outlier in wake pass 5, there is a clear trend in the results showing that flying closer to the turbine results in larger maximum roll and pitch angle deviations.
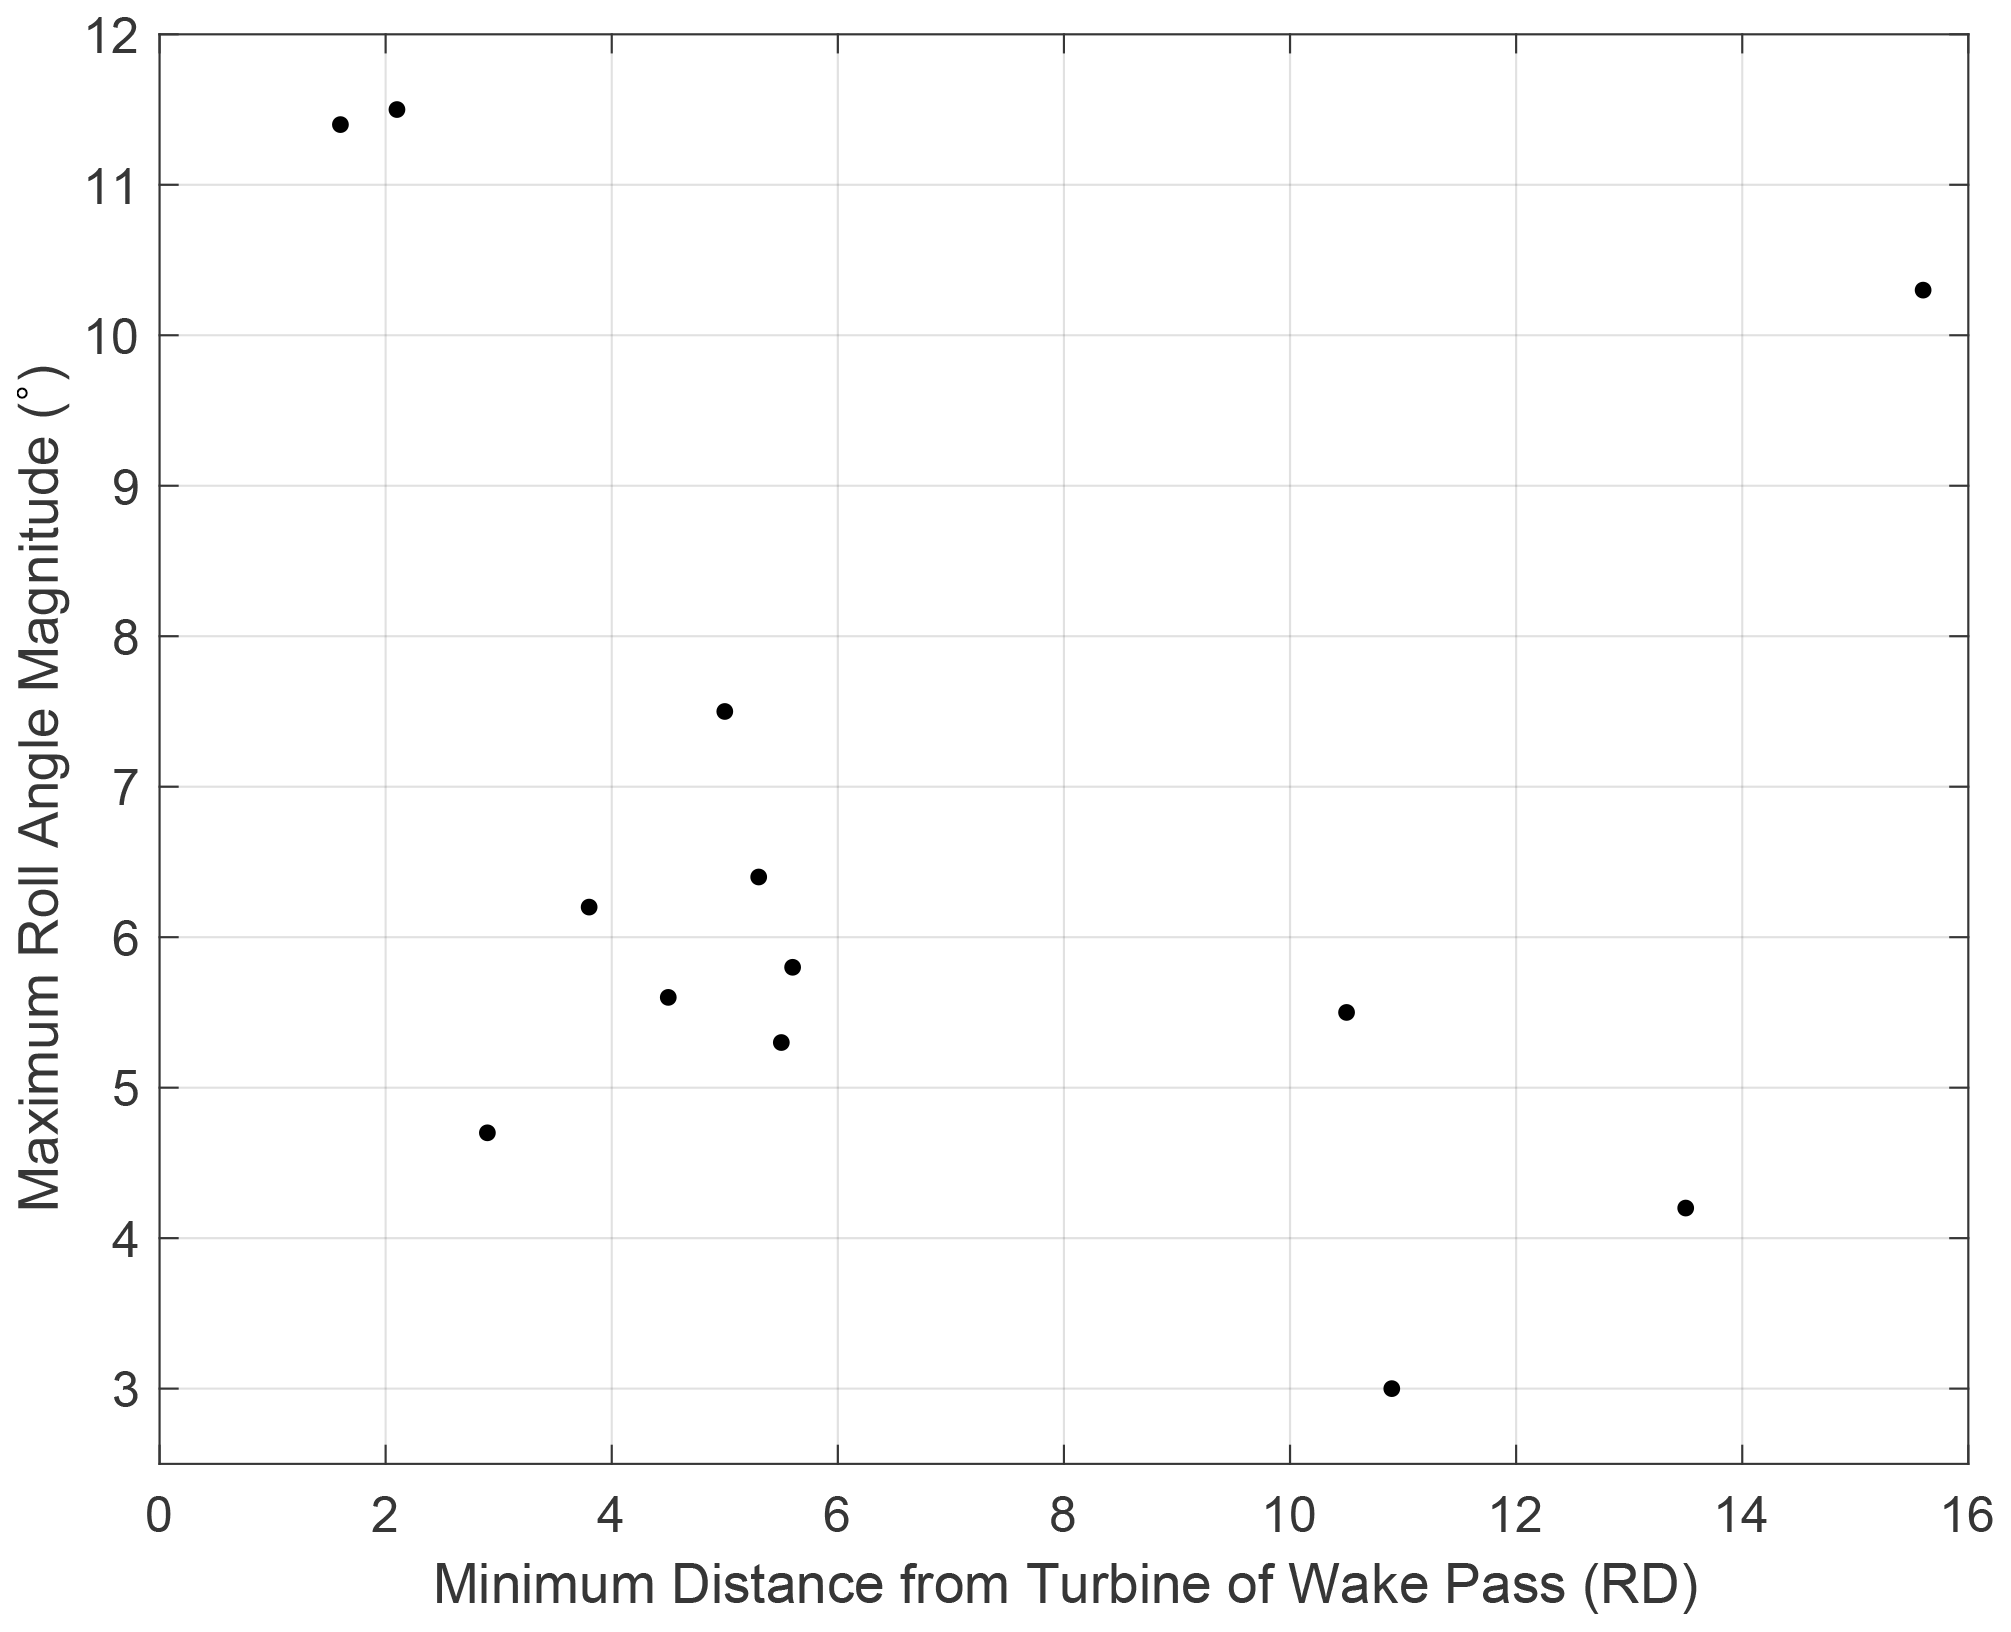
Regarding the higher roll angle disturbance in wake pass 5 (performed at 15.6 RD), it should be noted that the roll angle deviation was higher than other passes beyond 10 RD, but the maximum pitch angle and load factor were not. This is in contrast to, for instance, wake passes 12 and 13 where the roll, pitch (for pass 12), and load factor disturbances were all higher than wake passes performed at farther distances. Thus, it may be hypothesized that a random roll disturbance due to atmospheric turbulence happened to impact the aircraft during the time when it flew through the wake region in wake pass 5, which was separate from and unrelated to any turbine-added turbulence. Random roll disturbances of this magnitude may, for instance, be caused by updrafts due to ground heating that lead to a higher angle of attack on one side of the wing compared to the other.
To assess the safety risk imposed by the roll and pitch deviations in Table 5, consider that large orientation disturbances may present a risk to aircraft safety by inducing what is known as loss of control in flight (LOC-I). According to the European Union Aviation Safety Agency, LOC-I is “an extreme manifestation of a deviation from intended flight path” (EASA, 2024). LOC-I may result from environmental factors (including severe turbulence), mechanical factors, human factors, or stall-related factors (FAA, 2021b). When considering the effects of turbulence in particular, LOC-I may follow from what is described as an upset, according to the FAA Airplane Flying Handbook (FAA, 2021b). The handbook describes an upset condition as pitch attitude greater than 25° nose up, pitch attitude less than 10° nose down, or roll attitude greater than 45° in either direction. Aircraft attitude deviations that approach or exceed these limits would be cause for concern, as they pose a risk of LOC-I. However, the orientation disturbances observed in the wake passes were below these limits by a wide margin. The low magnitude of orientation disturbances suggests that, while the turbulence in the wake did affect the aircraft, the effect was small enough for it not to pose a risk from a loss-of-control perspective.
It should be noted that the wake passes were performed not in a location isolated to a single turbine wake but rather in an area roughly downwind of the entire 98-turbine Whitla Wind facility. Figure 4 shows that there are multiple turbines in close proximity to the south and southeast of turbine T1, including a turbine only 500 m to the south and another 1500 m to the southeast. The turbine wakes would be expected to intersect and influence one another to some extent given the wind direction from the southeast, producing cumulative wake effects in the vicinity of the wake passes. Even in the presence of cumulative wakes from multiple turbines, the pilot noticed only “very light turbulence” anytime he was within 3–4 km downwind of the wind farm at altitudes below the turbine tip heights (above the tip heights the air was smooth). This type of turbulence was classified as “negligible” by the pilot. An interesting avenue for future work may be to model the wakes of all turbines in the northern section of Whitla depicted in Fig. 4 to determine the extent of overlapping wakes that occurred during the flight, from which more definitive conclusions could be made regarding the aircraft flight path through overlapping wake regions. Such an analysis is beyond the scope of this initial work but would be a useful future extension.
In order to experimentally assess the risk of general aviation aircraft flight through wind turbine wakes, a series of instrumented tests were performed in which a Cessna 206 aircraft flew through the wake of an operating utility-scale wind turbine at different downwind distances. Recorded flight data show that the maximum bank angle magnitude experienced inside the wake region was 11.5° and the maximum pitch angle magnitude was 5.4°, both of which are well below the limit for an upset condition as defined in pilot training guidelines. The load factors experienced by the aircraft were between 0.57 g and 1.30 g, which are also well within the limit load factor boundaries for FAA normal-category aircraft. Sensor data, in combination with pilot feedback, suggest that light or very light turbulence may be experienced in the wake at distances farther than four to six rotor diameters downwind of the turbine and that light or moderate turbulence may be experienced at distances closer than 4–6 rotor diameters. The pilot did not report (nor did the flight data suggest) the presence of severe or extreme levels of turbulence in the wake region, which would have been a cause for concern from a loss-of-control or structural-integrity standpoint. Overall, the results from this flight experiment showed no evidence of any safety risk to general aviation aircraft from turbine-added turbulence in the wake region.
The code used to process the flight data and the plotting routines were built in MATLAB and are available from the author upon request.
The raw data used in this paper are publicly available at the following DOI: https://doi.org/10.5281/zenodo.13787764 (Rogers, 2024b). They are openly available for immediate download.
The video supplement is available at https://doi.org/10.5281/zenodo.11085457 (Rogers, 2024a).
The supplement related to this article is available online at: https://doi.org/10.5194/wes-9-1849-2024-supplement.
The author has declared that there are no competing interests.
Publisher’s note: Copernicus Publications remains neutral with regard to jurisdictional claims made in the text, published maps, institutional affiliations, or any other geographical representation in this paper. While Copernicus Publications makes every effort to include appropriate place names, the final responsibility lies with the authors.
The author would like to thank James Osness, Santi Churphongphun, and Matthew Davis from Capital Power Generation Services and Gavin Fitch from McLennan Ross for facilitating these flight tests. In addition, the author would like to acknowledge the contributions of Ian Watson and Al Christou from Edmonton Skydive in planning and carrying out the wake pass flights.
This paper was edited by Etienne Cheynet and reviewed by two anonymous referees.
Apple: https://developer.apple.com/documentation/coremotion, last access: 18 April 2024.
Bakker, R., Visingardi, A., van der Wall, B., Voutsinas, S., Basset, P.-M., Campagnolo, F., Pavel, M., Barakos, G., and White, M.: Wind Turbine Wakes and Helicopter Operations, 44th European Rotorcraft Forum, Delft, The Netherlands, 19–20 September 2018, https://repository.tudelft.nl/record/uuid:2c58df5b-7453-49bc-a83a-2f413b928d7a (last access: 17 September 2024), 2018.
Crespo, A. and Hernandez, J.: Turbulence Characteristics in Wind-Turbine Wakes, J. Wind. Eng. Ind. Aerod., 61, 71–85, https://doi.org/10.1016/0167-6105(95)00033-X, 1996.
de Jong, T., van der Ploeg, J., Timmers, J., Young, A., Veneman, R., and Rosenkrantz, R.: Effect of Wind Turbine Wake Turbulence on Offshore Helicopter Operations in and Around Wind Farms, Ministry of EZK and Rijksdienst voor Ondernemend Nederland (RVO), The Hague, Netherlands, https://offshorewind.rvo.nl/files/view/126a405b-fa67-41dc-b9ea-9fb4345d5481/158686102120200414_to70_effect%20wind%20turbine%20wake%20turbulence%20on%20offshore%20helicopters%20in%20and%20around%20wind%20farms-f.pdf (last access: 17 September 2024), 2020.
European Union Aviation Safety Agency (EASA): https://www.easa.europa.eu/en/domains/general-aviation/flying-safely/loss-of-control#group-easa-downloads, last access: 18 April 2024.
Federal Aviation Administration (FAA): JO 7400.2L CHG1: Procedures for Handling Airspace Matters, Washington, DC, https://www.faa.gov/regulations_policies/orders_notices/index.cfm/go/document.current/documentnumber/7400.2 (last access: 17 September 2024), 2017.
Federal Aviation Administration (FAA): Aeronautical Information Manual, Washington, DC, https://www.faa.gov/air_traffic/publications/atpubs/aim_html/ (last access: 17 September 2024), 2021a.
Federal Aviation Administration (FAA): FAA-H-8083-3C: Airplane Flying Handbook, Washington, DC, https://www.faa.gov/regulations_policies/handbooks_manuals/aviation/airplane_handbook (last access: 17 September 2024), 2021b.
Federal Aviation Administration (FAA): Advisory Circular 150/5300-13B: Airport Design, Washington, DC, https://www.faa.gov/airports/resources/advisory_circulars/index.cfm/go/document.current/documentnumber/150_5300-13 (last access: 17 September 2024), 2022.
Gilman, P., Husser, L., Miller, B., and Peterson, L.: Federal Interagency Wind Turbine Radar Interference Mitigation Strategy, US Department of Energy, Washington, DC, https://www.energy.gov/sites/default/files/2023-10/federal-interagency-wind-turbine-radar-interference-mitigation-strategy_082023.pdf (last access: 17 September 2024), 2016.
Global Wind Energy Council (GWEC): Global Wind Report 2023, Brussels, Belgium, https://gwec.net/globalwindreport2023/ (last access: 17 September 2024), 2023.
Grouios, G., Ziagkas, E., Loukovitis, A., Chatzinikolaou, K., and Koidou, E.: Accelerometers in Our Pocket: Does Smartphone Accelerometer Technology Provide Accurate Data?, Sensors, 23, 192, https://doi.org/10.3390/s23010192, 2023.
Ilic, Z., Rasuo, B., Jovanovic, M., Jovicic, S., Tomic, L., Jankovic, M., and Petrasinovic, D.: The Efficiency of Passive Vibration Damping on the Pilot Seat of Piston Propeller Aircraft, Measurement, 95, 21–32, https://doi.org/10.1016/j.measurement.2016.09.042, 2017.
International Civil Aviation Organization (ICAO): Annex 14 – Aerodromes – Volume I: Aerodromes Design and Operations, Montreal, Canada, https://store.icao.int/en/annex-14-aerodromes (last access: 17 September 2024), 2022.
Karlson, B., LeBlanc, B., Minster, D., Estill, D., Miller, B., Busse, F., Keck, C., Sullivan, J., Brigada, D., Parker, L., Younger, R., and Biddle, J.: IFT&E Industry Report: Wind Turbine-Radar Interference Test Summary, Sandia National Laboratories Technical Report SAND2014-19003, Albuquerque, NM, https://www.energy.gov/sites/prod/files/2014/10/f18/IFTE%20Industry%20Report_FINAL.pdf (last access: 17 September 2024),, 2014.
Lee, J. C. Y. and Lundquist, J. K.: Observing and Simulating Wind-Turbine Wakes During the Evening Transition, Bound.-Lay. Meteorol., 164, 449–474, https://doi.org/10.1007/s10546-017-0257-y, 2017.
Mansfield, N. and Aggarwal, G.: Whole-Body Vibration Experienced by Pilots, Passengers, and Crew in Fixed-Wing Aircraft: A State-of-the-Science Review, Vibration, 5, 110–120, https://doi.org/10.3390/vibration5010007, 2022.
Martinez-Tossas, L., Branlard, E., Shaler, K., Vijayakumar, G., Ananthan, S., Sakievich, P., and Jonkman, J.: Numerical Investigation of Wind Turbine Wakes Under High Thrust Coefficient, Wind Energy, 25, 605–617, https://doi.org/10.1002/we.2688, 2022.
Mourcou, Q., Fleury, A., Franco, C., Klopic, F., and Vuillerme, N.: Performance Evaluation of Smartphone Inertial Sensors Measurement for Rangle of Motion, Sensors, 15, 23168–23187, https://doi.org/10.3390/s150923168, 2015.
Mulinazzi, T. and Zheng, Z.: Wind Farm Turbulence Impacts on General Aviation Airports in Kansas, Kansas Department of Transportation Report No. K-TRAN: KU-13-6, Lawrence, KS, https://rosap.ntl.bts.gov/view/dot/26908 (last access: 17 September 2024), 2014.
Mulinazzi, T. and Zheng, Z.: Classification of Wind Farm Turbulence and its Effects on General Aviation Aircraft and Airports, Kansas Department of Transportation Report No. K-TRAN: KU-16-3, Lawrence, KS, https://rosap.ntl.bts.gov/view/dot/34831 (last access: 17 September 2024), 2018.
Quarton, D. and Ainslee, J.: Turbulence in Wind Turbine Wakes, Wind Engineering, 14, 15–23, 1990.
Richardson, J., Hall, P. K., and Morgan, W.: Land Use Conflicts Between Wind and Solar Renewable Energy and Agricultural Uses, WVU College of Law Research Paper No. 2022-004, https://researchrepository.wvu.edu/cgi/viewcontent.cgi?article=1104&context=law_faculty (last access: 17 September 2024), 2022.
Rogers, J.: Wind Turbine Wake Flight Trials, Zenodo [video], https://doi.org/10.5281/zenodo.11085457, 2024a.
Rogers, J.: Wind Turbine Wake Flight Experiment Raw Data, Zenodo [data set], https://doi.org/10.5281/zenodo.13787764, 2024.
Tomaszewski, J. M., Lundquist, J. K., Churchfield, M. J., and Moriarty, P. J.: Do wind turbines pose roll hazards to light aircraft?, Wind Energ. Sci., 3, 833–843, https://doi.org/10.5194/wes-3-833-2018, 2018.
US Air Force (USAF): Air Force Handbook 15-101: Weather Meteorological Techniques, Washington, DC, https://static.e-publishing.af.mil/production/1/af_a3/publication/afh15-101/afh15-101.pdf (last access: 17 September 2024), 2019.
Varriale, C., De Marco, A., Daniele, E., Schmidt, J., and Stoevesandt, B.: Flight Load Assessment for Light Aircraft Landing Trajectories in Windy Atmosphere and Near Wind Farms, Aerospace, 5, 42, https://doi.org/10.3390/aerospace5020042, 2018.
Vermeer, L., Sørensen, J., and Crespo, A.: Wind Turbine Wake Aerodynamics, Prog. Aero. Sci., 39, 467–510, https://doi.org/10.1016/S0376-0421(03)00078-2, 2003.
Wang, Y., White, M., and Barakos, G.: Wind Turbine Wake Encounter Study, University of Liverpool Technical Report, Liverpool, UK, https://www.liverpool.ac.uk/media/livacuk/flightscience/projects/cfd/wakeencounter/caa_wind_turbine_report.pdf (last access: 17 September 2024), 2015.
Wang, Y., White, M., and Barakos, G.: Wind Turbine Wake Encounter by Light Aircraft, J. Aircraft, 54, 366–369, https://doi.org/10.2514/1.C033870, 2017.
Wiser, R., Bolinger, M., Hoen, B., Millstein, D., Rand, J., Barbose, G., Darghouth, N., Gorman, W., Jeong, S., O'Shaughnessy, E., and Paulos, B.: Land-Based Wind Market Report: 2023 Edition, US Department of Energy, Office of Energy Efficiency and Renewable Energy, Washington, DC, https://www.energy.gov/sites/default/files/2023-08/land-based-wind-market-report-2023-edition.pdf (last access: 17 September 2024), 2023.
Xiarchos, I. M. and Sandborn, A.: Wind Energy Land Distribution in the United States of America, U.S. Department of Agriculture, Office of Energy Policy and New Uses, Washington, DC, https://www.usda.gov/sites/default/files/documents/FINAL-Wind_Energy_Land_Distribution_in_the_United_States_of_America_7282017.pdf (last access: 17 September 2024), 2017.