the Creative Commons Attribution 4.0 License.
the Creative Commons Attribution 4.0 License.
 | 02 Jul 2025
Experimental validation of parked loads for a floating vertical axis wind turbine: wind–wave basin tests
Md. Sanower Hossain
Parked loads are a major design load case for vertical axis wind turbines (VAWTs) because of persistent high loads on the rotor when in standstill conditions. This paper examines the aerodynamic parked loads of model-scale floating troposkein VAWTs tested in a wind–wave basin to support development and validation of a parked load model for floating VAWTs. We analyze the effects of wind speed, turbine solidity (varying number of blades), and rotor azimuth on parked loads and investigate the impact of different wind–wave platform conditions (comparing locked (fixed tower base) versus floating cases with and without waves). The experimental results indicate that parked loads (for both locked and floating platform conditions) and the amplitude of turbine tilting increase with the wind speed, which is expected. The parked loads also increase with the increase in solidity; however, the variation in loads in a revolution decreases for three blades versus two blades. If only aerodynamic parked loads are considered, the turbine with a floating platform exhibits lower parked loads compared to turbine with a locked platform (fixed base) due to the effect of the tilted condition of the floating platform. Moreover, comparison between floating with wind–wave and floating with wind only cases shows that although both exhibit parked loads of similar magnitude, the former exhibits more high-frequency variation due to coupled effects of wind, wave, and floating platform dynamics. Additionally, we present a semi-numerical tool for estimating parked loads of VAWTs that we improved and validated to predict the floating parked loads. The semi-numerical model accurately predicts the parked load behavior of VAWTs for the range of effects noted above. The datasets from this experimental work can serve as benchmarks for validating other computational parked load estimating tools, while the semi-numerical tool provides a way to gain insight into the unmeasurable quantities.
- Article
(8022 KB) - Full-text XML
- BibTeX
- EndNote


Vertical axis wind turbines (VAWTs) are gaining attention as a candidate for offshore deployments, especially in deep waters where floating platforms are required. Floating VAWTs have the potential to significantly reduce the cost of energy compared to floating horizontal axis wind turbines (HAWTs) (Shelley et al., 2018). Additionally, VAWTs have a lower center of gravity, which helps to reduce the overturning moment.
One critical aspect of VAWT operation and deployment is understanding the design loads for parked or standstill conditions. Parked loads refer to the forces exerted on a wind turbine when it is in a stationary or non-operational state, such as during maintenance, low wind conditions, or shutdown scenarios. These loads are influenced by various factors including wind speed, solidity, number of blades, wind–wave platform conditions, and the azimuthal position in a revolution.

Figure 1Parked loads on the 5 MW Darrieus VAWT at 30.64 m s−1 wind speed (Sakib and Griffith, 2022).
Accurate assessment of parked loads is essential for several reasons. When not employing a blade pitching mechanism, VAWTs are subjected to high parked loads for extended periods. Sakib and Griffith (2022) showed that the magnitude of parked loads is similar to the operating loads. A sample parked load with respect to azimuth at 30.94 m s−1 wind speed for a 5 MW UTD-designed VAWT is shown in Fig. 1. Assessing parked loads would ensure the structural integrity and longevity of the wind turbine and floating system, preventing potential damage that could occur when the turbine is not generating power. Finally, understanding these loads contributes to optimizing the overall design and performance of VAWTs, making them more reliable and efficient.
To date, very few parked load studies of VAWTs are found in the literature. Sakib and Griffith (2022) analyzed parked aerodynamic load for a 5 MW conceptual VAWT, considering rotor design variables such as tapered blade chord, number of blades, and aspect ratio (the ratio of rotor height to diameter). Although Sakib and Griffith (2022) numerically studied the effects of the number of blades on parked loads, in this study we have studied the effects of the number of blades on azimuthal variation of parked loads both numerically and experimentally. The analytical tool used in Sakib and Griffith (2022)'s study is validated here and improved by adding the capacity for estimating parked loads for offshore floating turbines. Ottermo et al. (2012) developed an analytical model to estimate extreme loads under parked conditions. Paulsen et al. (2013) conducted a CFD study to predict both the operating and parked load for the Deep Wind concept. Kuang et al. (2019) performed a numerical CFD investigation on the flow characteristics and dynamic responses of a parked straight-bladed vertical axis wind turbine (H-VAWT) and concluded that pressure distribution on the upwind blade surface is similar at different azimuthal locations. As wind speed increases, turbulent flow characteristics and wake effects become more pronounced, while dynamic responses due to parked conditions can be neglected. The only experimental parked load analysis of 12 kW VAWT was done by Goude and Rossander (2017), which used a fixed base (locked platform) for an H-VAWT.
This study focuses on the experimental investigation of parked loads on vertical axis wind turbines with experiments performed in a wind–wave basin. The research aims to provide a comprehensive understanding of the factors affecting parked loads and their impact on turbine performance. The findings from this study offer valuable insights for the design, operation, and maintenance of VAWTs, ultimately contributing to the advancement of sustainable wind energy technologies.
This paper also focuses on enhancing the capacity of UTD's (UT-Dallas) existing semi-numerical VAWT parked load estimating tool, originally developed by Sakib and Griffith (2022). This tool make use of a mid-fidelity, open-source, free vortex method code CACTUS (Code for Axial and Cross-flow Turbine Simulation) (Murray and Barone, 2011) and analytical methods. CACTUS was developed by Sandia National Laboratories in FORTRAN 95 language using VDART3 (Strickland et al., 1980) code as a basis. CACTUS is capable of performing an analysis of any arbitrary turbine configuration by segmenting the turbine blades and struts into a set of blade elements. A more detailed explanation of CACTUS can be found in Lu (2020).
In summary, the aim of this work is to experimentally study and validate the modeling of parked loads for Darrieus VAWTs with different platform conditions and to enhance the capacity of UTD's existing VAWT parked load estimating tool. The main contributions of this article are summarized below.
-
An experimental study is performed that examines troposkein wind turbines with two blades (2B) and three blades (3B).
-
The parked dataset presented here is unique because the data include both fixed base (locked platform, zero tilting) and floating platform conditions (floating with and without waves).
-
Experimental data are gathered to validate a semi-numerical parked load estimating tool, originally developed by Sakib and Griffith (2022). The tool has also been improved to assess the parked load for offshore floating turbines with tilting. Ultimately this tool can be used to gain insights into the unmeasurable quantities.
The organization of the paper can be described as follows. Section 2 covers the methods for experiments, the test campaign, and the development of the parked load model. Section 3 presents results and discussion for the experimental measurements and model validation efforts, with a focus on the effects of wind speed, turbine solidity (varying number of blades), different platform conditions, and the effect of rotor azimuth. Section 4 presents the concluding remarks.
The VAWT rotors were tested at UMaine's Alfond Wind–Wave Ocean Engineering Laboratory (W2) (Cole et al., 2017). This unique facility is equipped with high-precision measurement instruments and allows for variable water depths, wind, and wave conditions. The basin measures 30 m in length and 9 m in width, with a maximum water depth of 5 m. The wind machine, whose dimension is 7 m × 3.5 m, can generate up to 12 m s−1 wind speed using a narrower condenser passage; however, during these VAWT tests, maximum wind speeds were limited to 4.96 m s−1 with a turbulence intensity of 3.9 %, since the condenser passage was removed. A detailed description of the testing facility can be found in Parker (2022).

2.1 Test turbines
Two scaled turbine configurations were tested at the test facility. These turbines are designed based on the constraints and requirements of the wind–wave basin test facility, as well as constraints imposed by the floating system and safety requirements. For example, turbine dimension must not exceed the dimension of the wind-generating machine (W 7.0 × H 3.5 m). Both the turbines were alternately mounted on a floating platform which was originally used for FOCAL horizontal axis wind turbine. Details of the floating platform can be found in Robertson (2023). The turbines are also designed in a way that they maintain the load constraints implemented by the FOCAL platform. The rotor mass and overturning moment must not exceed 12.6 kg and 15.54 Nm, respectively. The overturning moment is defined as the multiplication of thrust force by the distance from mean water level to the center of pressure of the rotor. Moreover, the design meets international structural safety requirements from the international design standards of composite wind turbine blades stated in Germanischer (2010). For the detailed design of these model-scale VAWTs, readers are referred to Hossain et al. (2024).
Table 1Geometric configurations of two tested troposkein turbines.
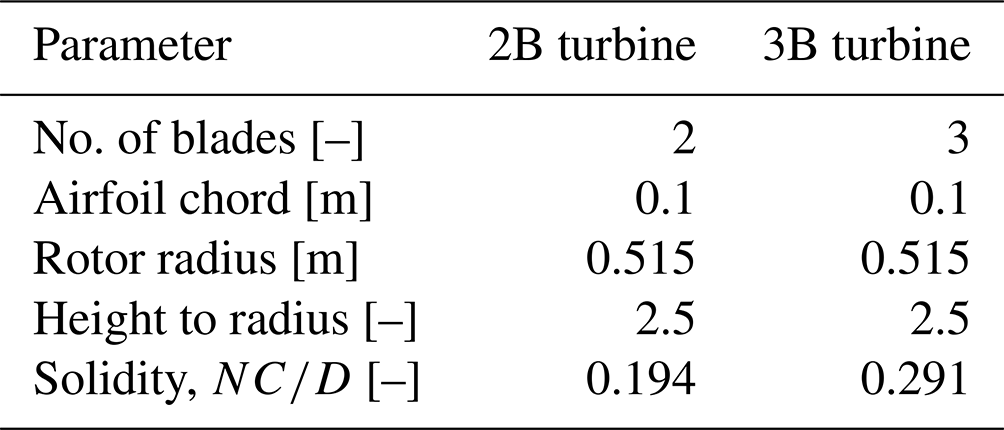
Both test VAWTs have identical geometric properties, except for the number of blades. One turbine has two blades, whereas the other has three blades. The shape of the turbine is troposkein with an equatorial radius of 0.515 m and height of 1.287 m. It is configured with an NACA0018 airfoil of constant chord length of 0.1 m. The solidities of the 2B turbine (two-bladed, 2B) and 3B turbine (three-bladed, 3B) are 0.194 and 0.291, respectively. In this work, the solidity of the turbine is defined as , where N is the number of blades, C is the chord length, and D is the maximum diameter of the turbine. The solidity was varied only by changing the number of blades in order to limit the manufacturing complexity and cost. It was easy to convert the 2B turbine into the 3B turbine using one set of blades. The summarized geometric parameters are listed in Table 1.
A schematic of the test turbine configuration CAD model with dimensions is shown in Fig. 2. The image shows both the front and top view of the 3B turbine. The dimensions of the 2B turbine are the same except for the number of blades.
2.2 Measurement system and data post-processing
An ATI Mini58 (SI-700-30 calibration) six-degree-of-freedom (6 DOF) load sensor was used to measure the loads and moments. The load cell can measure maximum thrust of 700 N, maximum overturning moment of 30 Nm, and maximum torque of 30 Nm, which meet the expected loads and moment requirements. The load sensor was placed in the tower base; please see Fig. 2 for the relative position. Table 2 lists the measurement systems for this experimental testing campaign. The rotor speed was measured using a motor encoder. And the platform dynamic motions (pitch and roll) were recorded using a Qualisys 6 DOF motion-measuring system.
Table 2Measurement systems for the experimental testing campaign.
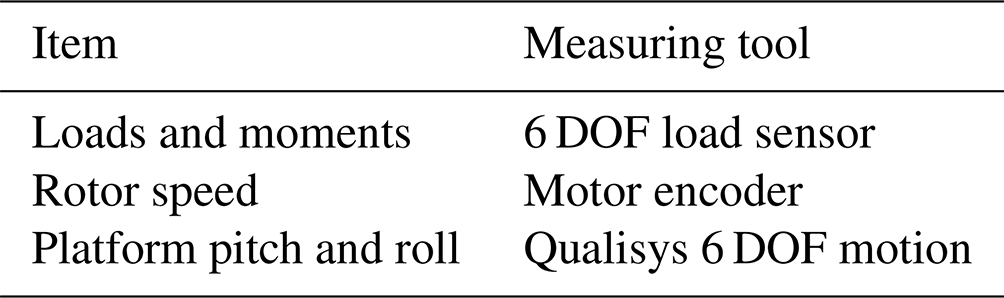

Figure 3Comparison of raw and post-processed average thrust and lateral loads at 2 m s−1 for the fixed base 2B turbine.
The testing facility and turbine design did not include the measurement of blade azimuthal tracking. Therefore, before every test, blade number 1 was placed at 0° azimuth position located at the most upwind position. Then the azimuth variation was tracked running the turbine at a constant 1 rpm.
Before starting every measurement, the system data were recorded at non-running and pre-load conditions to know if there were any residual values. After that, the fan was switched on to generate the specified wind speed. Then, after reaching a steady-state wind speed condition, the turbine was rotated at 1 rpm and the raw load data were recorded.
For each test, the data were recorded for at least 5 revolutions. After recording the data, the raw data were post-processed to exclude the startup (standstill to 1 rpm) and end (1 rpm to standstill) values. After that, the pre-load data were subtracted from the load condition raw data to get the actual true measured data. For averaging the raw data, a binning technique was applied. The azimuthal range (0 to 360°) was divided into 720 bins, with each bin representing a 0.5° interval. Data from all revolutions were assigned to the corresponding bins based on azimuthal position. The values within each bin were then averaged to obtain the final post-processed dataset consisting of 720 azimuthal locations.
Figure 3 shows a sample comparison between raw and the post-processed averaged parked thrust and lateral loads at 2 m s−1 wind speed for the fixed base 2B turbine. The blue points indicate the raw data, and the red continuous line indicates post-processed averaged data. This paper makes use of the post-processed averaged load data for all analysis hereafter.
2.3 Test matrix in the test campaign
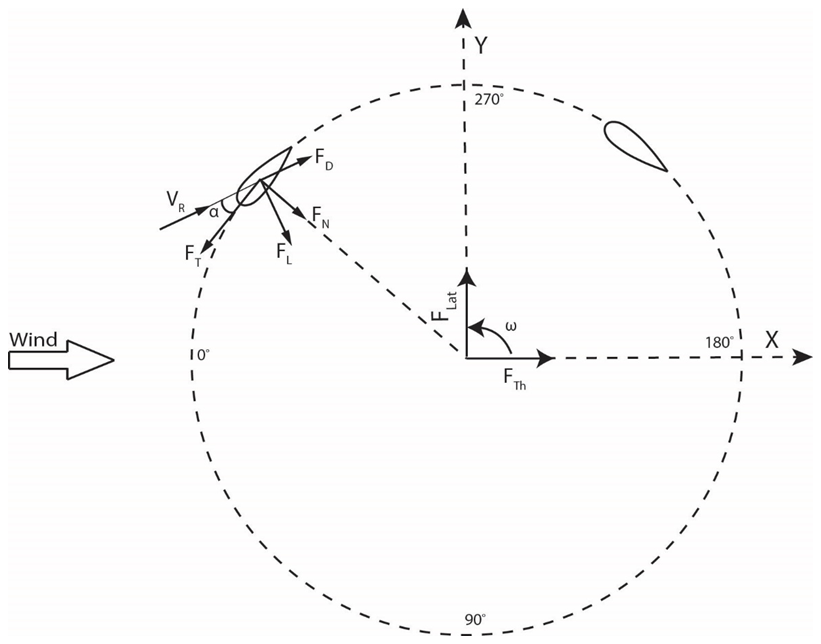
The test matrix consists of four important variables which have the largest impacts on the parked loads of floating VAWTs. The first variable we considered is the azimuthal position, which significantly influences the parked loads of VAWTs. Figure 5 shows the azimuthal angle convention used in this study, where 0° azimuthal positions indicates that the first blade is in the windward direction. The turbine rotates anticlockwise.
The second variable we considered is wind speed. The test facility is capable of producing a maximum of 4.96 m s−1 wind speed. Therefore, the turbines were tested at wind speeds varied between 2 and 4.96 m s−1 keeping the turbine rotational speed constant at 1 rpm. Geometric comparison of the test turbine (having a radius of 0.51 m) to the UTD 5 MW VAWT (Sakib and Griffith, 2022) (having a radius of 54.011 m) reveals that the test turbine is a 1:104.87 scaled version of the full-scale UTD 5 MW turbine. However, the test turbine is not a scaled design of the UTD 5 MW VAWT; this comparison is made solely to estimate the full-scale wind speeds. Applying Froude scaling with a velocity scale factor of λ0.5 results in a wind speed range of 20.48 to 50.79 m s−1 for the full-scale 5 MW UTD VAWT. This wind speed range is reasonable because the site-specific 50-year return period having a 10 min average wind speed of 30.96 m s−1 (Sirnivas et al., 2014) falls in this range.
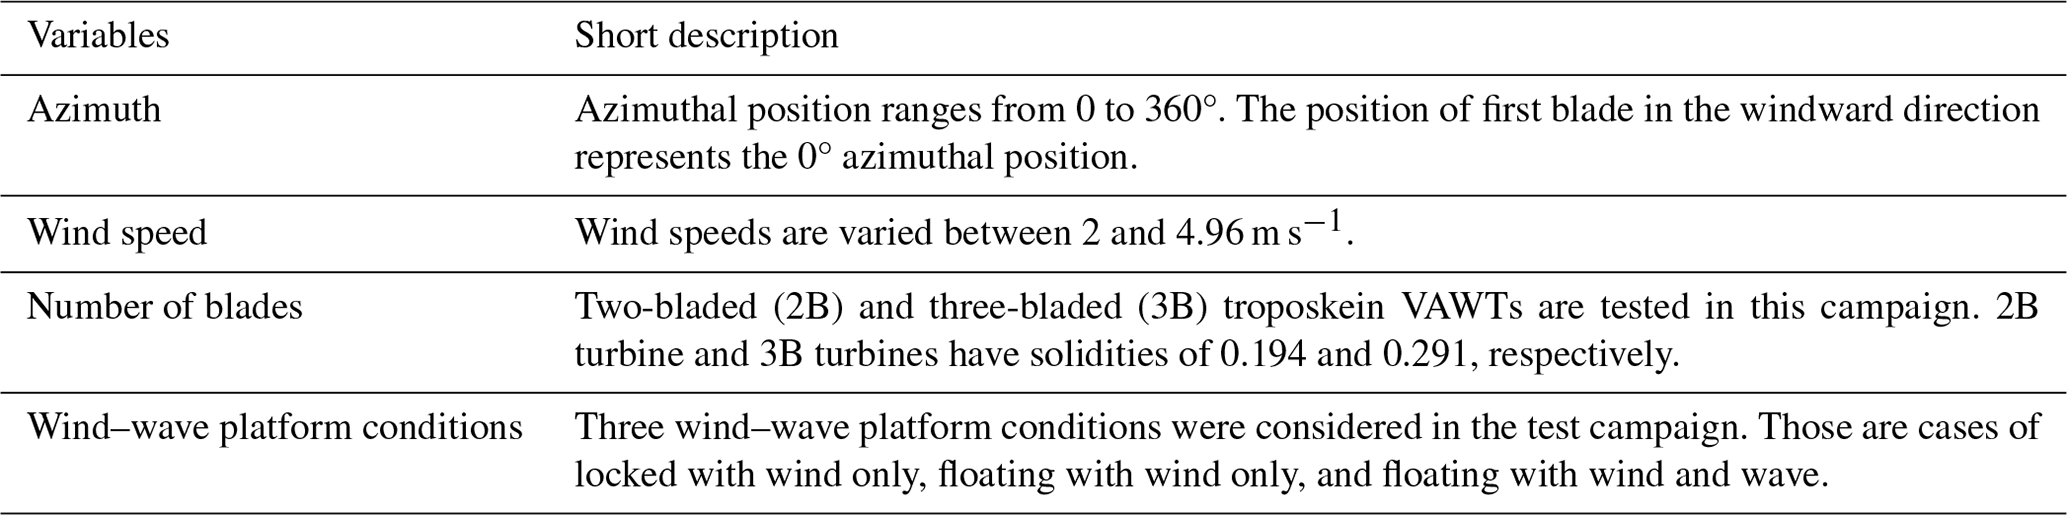
The third variable considered in this test campaign is the number of blades. The two-bladed turbine (2B) has solidity of 0.194, whereas the three-bladed turbine (3B) has solidity of 0.291. The geometric configurations and visual representation of tested turbines are shown in Table 1 and Fig. 2, respectively. The detailed design and manufacturing of the turbines can be found in Hossain et al. (2024).
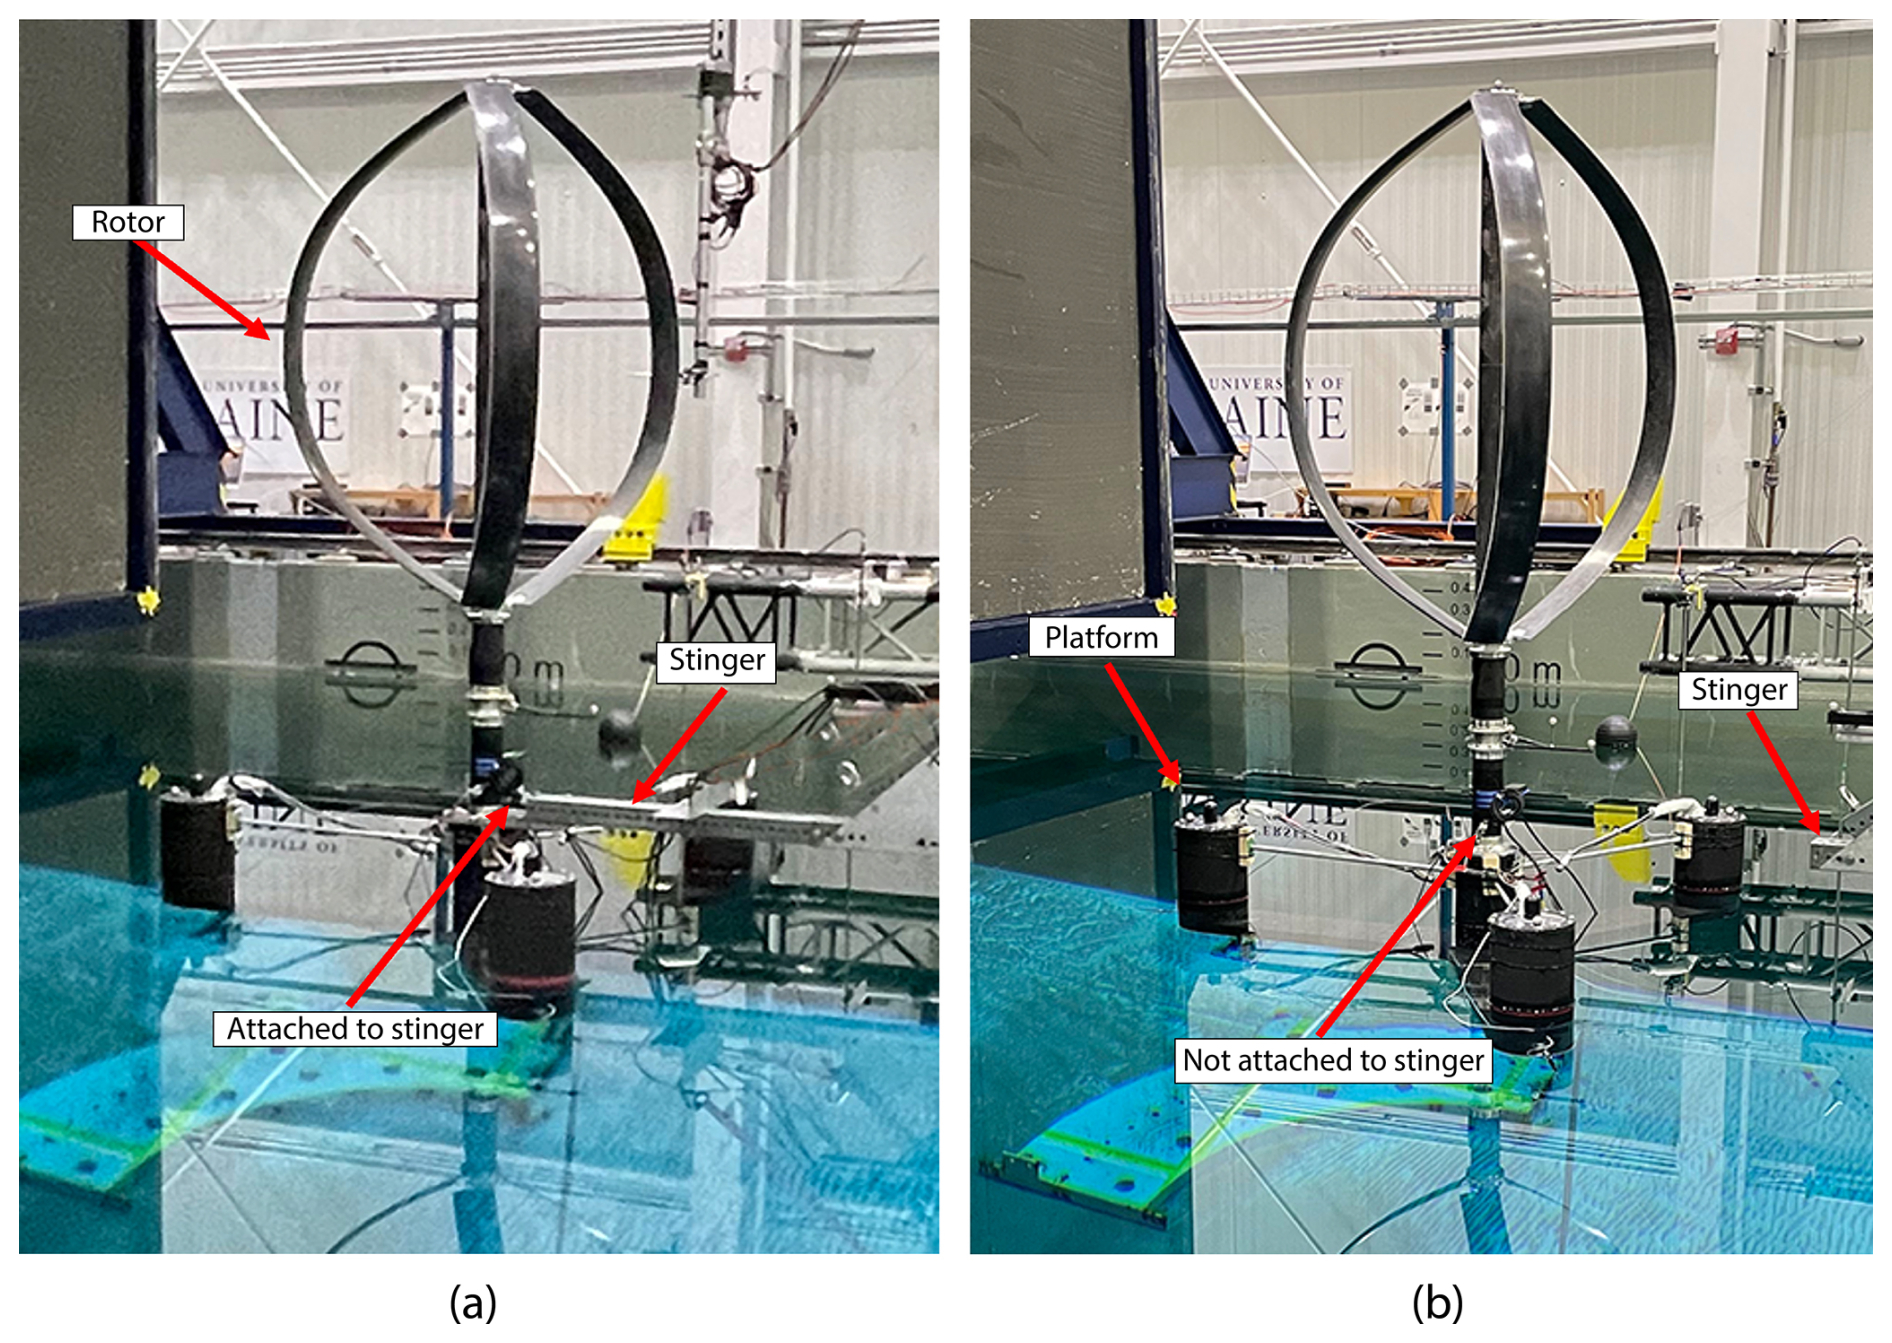
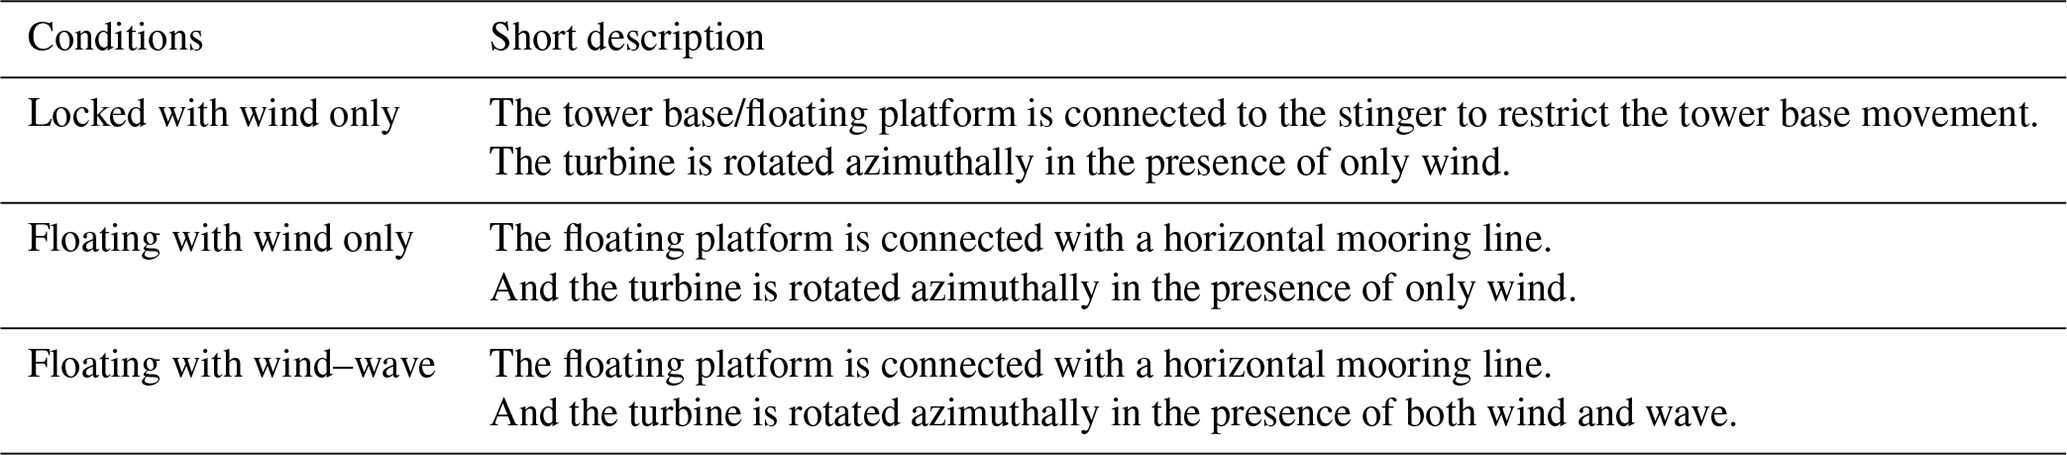
The fourth variable we considered is the wind–wave platform conditions. The turbines were tested for three wind–wave platform conditions: (a) locked (fixed tower base) with wind only, (b) floating with wind only (no waves), and (c) floating with wind and waves. The locked with wind only condition represents a case where the tower base is attached to a stinger to restrict tilting motion (i.e., fixed base), and the turbine is rotated only in the presence of wind with no wave influence. Please see Fig. 4 for details of the tower base attachment to the stinger. The floating with wind only condition makes use of a semi-submersible floating platform. The column of the floating platform is connected to horizontal mooring lines (not shown in Fig. 4) to keep the floating platform in place. However, the mooring lines were not connected to the basin bed. Instead, they were connected to the side wall to reduce the movement for this specific wind–wave basin. In this floating with wind only condition, the turbines are only exposed to the wind. The floating wind and wave condition also uses the semi-submersible floating platform; however, the turbines are exposed to both wind and wave. In this test campaign, a regular wave with a height of 0.155 m and a period of 1.61 s is used, which corresponds to a full-scale IEA 15 MW horizontal axis wind turbine with a height of 10.85 m and a period of 13.5 s (Fowler, 2023). Readers are referred to Fig. 4 for the visuals of locked and floating platforms and referred to Table 3 for the test matrix used in this campaign.
2.4 UTD's semi-numerical parked load tool
A semi-numerical parked load tool is developed to estimate the parked loads of the tested turbines. As methods like CFD will be very computationally intensive to predict parked loads, a semi-numerical method has been developed with goals of accuracy and low computational effort. This tool makes use of a static airfoil polar supplied with the CACTUS tool. Airfoil polars are applicable to VAWT operations, and they range from −180 to 180° in angle of attack. Use of static airfoil polars makes sense for the fixed base system. For the two floating cases, we performed an analysis of reduced frequency to see if the inflow is steady or unsteady. Reduced frequency is a nondimensional number, and it is defined in Matha et al. (2016) as follows:
where ωptfm is the platform pitching frequency, Ci is airfoil section chord, U∞ is freestream velocity, ri is section radius, and Ω is rotational velocity of rotor. According to Theodorsen theory, a flow can be categorized as unsteady if the reduced frequency K in Eq. (1) exceeds 0.05. The reduced frequency (K) does not go above a value of 0.05 for both floating wind only and floating wind–wave conditions for any of the wind speeds for either the 2B or 3B wind turbine. The highest reduced frequency (K) of 0.0158 occurs in the 3B floating wind–wave pitch case. As wind speed increases, the reduced frequency decreases. For the 3B floating wind–wave pitch case, the reduced frequencies (K) at wind speeds of 2, 3, 4, and 4.96 m s−1 are 0.0158, 0.0105, 0.0079, and 0.0063, respectively. This indicates that higher wind speeds result in a steadier inflow. Therefore, the inflow can be considered quasi-steady, and the use of a static polar for floating cases also makes sense. Since the induction due to blade wake is small compared to freestream velocity and to make the model simpler, blade wake effects have been excluded from the model. Moreover, strut effects and finite aspect ratio corrections have also not been considered.
The local relative velocity and angle of attack for all the azimuthal locations were calculated using CACTUS. In the relative velocity calculation, we only considered local freestream velocity ignoring the rotational and induced velocity components because the rotor is in standstill for the parked condition. However, induction due to tower wake was considered in the model as it was easy to implement.
where VN is normal velocity, VT is tangential velocity, and U is the freestream velocity. N and T represent normal and tangential vector components, respectively. The values of the normal vector component (N) and the tangential vector component (T) are calculated using the 3D vortex-based code CACTUS. The directions of forces and velocities are shown in Fig. 5, where the 0° azimuth is in the windward direction. The thrust load (FTh) is in the windward direction and the lateral load (FLat) is normal to the thrust load. The normal force (FN) is toward the center and tangential force (FT) is in the tangential direction of the airfoil. Local relative velocity is calculated as
After that, the angle of attack (α) is calculated from the normal and tangential components of the velocity.
Then the lift (CL) and drag (CD) coefficients for the respective angle of attack are calculated using the static airfoil polar supplied with the CACTUS tool. After that, the local normal (CN) and tangential (CT) force coefficients are calculated using CL and CD as follows:
where CL represents the lift coefficient, and CD represents the drag coefficient. The normal and tangential force coefficients are local: in other words, with respect to the specific element.

Therefore, normal and tangential force coefficients need to be re-referenced to full turbine scale to calculate the thrust and lateral forces. The conversion is done using the following equations.
Here AE is element area, A is rotor area, and CFtN and CFtT are normal and tangential force coefficients with respect to rotor, respectively. After that thrust (CTh) and lateral (CLat) force coefficients are calculated by applying specific normal and tangential directions in the azimuthal locations.
Thrust and lateral loads for the locked platform case are
A more detailed description of the semi-numerical parked load tool for fixed base VAWTs can be found in Sakib and Griffith (2022). The model also captures the tower drag. Tower drag is estimated using Eq. (14).
where AT represents the frontal tower area, and CD is the drag coefficient. For this analysis, a tapered cylindrical tower with an assumed CD of 1 was used. The measured thrust load for the locked platform case includes tower drag, while the lateral load does not account for it, as static tower drag force acts in the thrust load direction.
The parked load estimating tool presented in Sakib and Griffith (2022) could only calculate the parked load for a fixed base turbine. However, estimating parked loads for floating offshore VAWTs is also important, and the procedure of estimating parked loads for floating offshore VAWTs is outlined below.
The parked loads for floating offshore VAWTs are directly correlated with the turbine dynamic motions. For example, updated sensor measurement thrust and lateral loads are directly correlated with turbine pitch and roll motions, respectively. The detailed correlation of loads and turbine dynamic motions is shown in Sect. 3.1.4.
The load cell is fixed on the tower base; please see Fig. 1 for the load cell position. For the floating platform condition, the turbine tilts due to the coupled effects of the wind load and floating system. Therefore, the load cell, which is fixed in the tower, also tilts the same as the turbine. Therefore, the load cell's measured loads will not be in the original thrust or lateral load direction. The measured parked loads are in the tilted sensor measurement load direction. Readers are referred to Fig. 6 to see the updated sensor measurement load direction. The figure only shows the updated sensor measurement thrust direction. The original thrust direction is in the windward direction. However, due to wind and wave loads the load sensor also tilts. Therefore, the measured data correspond to the tilted updated sensor measurement direction. However, being consistent with the locked and floating platform terminologies, we will still call the floating parked loads thrust and lateral loads.
The semi-numerical parked load measuring tool takes this tilting effect into consideration by including the resulting inertial (weight) effect due to tilting. Due to tilting, the load sensor measures a component of weight, along with the loads (thrust and lateral) in the original direction. Figure 6 shows the concept of the weight effect present in the floating thrust load. In the test campaign, both the loads and turbine dynamic motions were recorded. We used the measured pitch and roll data to calculate the weight effect. One can use the aero-hydro floating VAWT model developed in Gao et al. (2022) to predict the tilt angles as pre-test data for input to the parked load model presented here. The input aerodynamic loads can be supplied using CACTUS, while the hydrodynamic coefficients can be obtained from a commercial software like WAMIT (Lee and Newman, 2006) or an open-source code like Capytaine (Ancellin and Dias, 2019). Then the aerodynamic model and hydrodynamic code can be combined with a mooring model to predict the tilt angles as done in Gao et al. (2022).
Thrust and lateral loads including both aerodynamic loads and weight effects for the floating platform case are given as follows:
where β is measured pitch angle, γ is measured roll angle, M is turbine mass, and g is the gravitational acceleration constant.
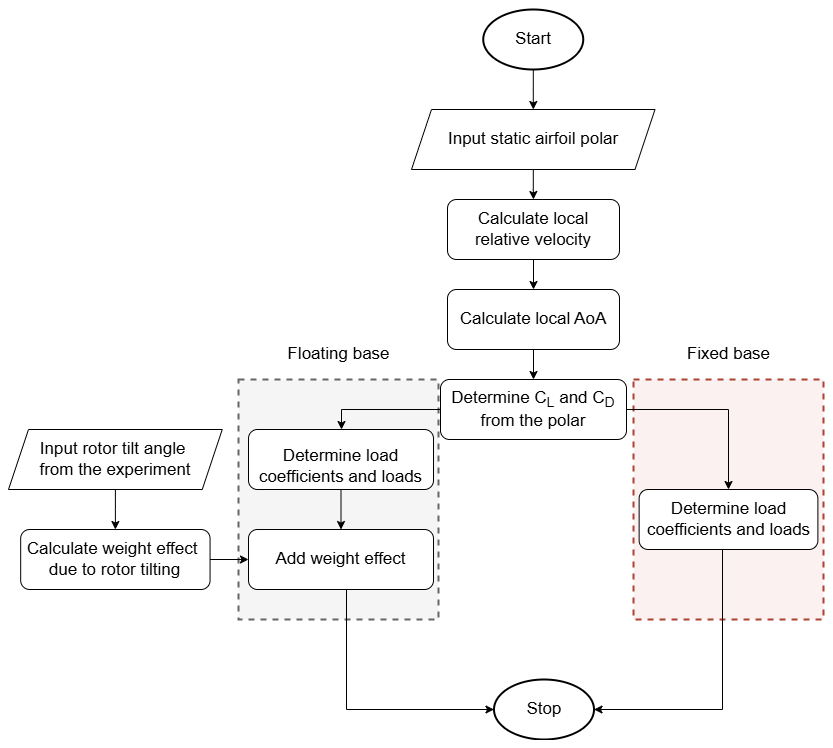
A flowchart of the semi-numerical parked load calculation process stated above is also shown in Fig. 7. This figure contains parked load modeling of both the locked base and floating base platforms. The floating base case compensates for the tilting effect by taking gravitational effects into consideration.
The UTD's parked load tool for the fixed tower base case has already been validated in Sakib and Griffith (2022). The extension of the tool for the floating tower base case is discussed and validated in the “Results and discussion” section of this paper.
3.1 Experimental data analysis
The main objective of this study is to quantify and model the effects of the number of blades, wind speeds, wind–wave platform conditions, and rotor azimuth on parked loads. This section will show and discuss the effects of these conditions successively.
3.1.1 Uncertainty in measurements
We perform an uncertainty analysis for the experimental measurements as follows (Coquilla et al., 2007):
where U is resultant uncertainty, β is bias uncertainty, σ is standard deviation, and t is the coverage factor of T distribution. The value of t is 1.96 at 95 % confidence level. Bias uncertainties of the load cell and anemometer are 0.1 %, and 2 %, respectively.
Uncertainties for experimentally measured parked loads of the 2B turbine for the locked wind only case are shown in Fig. 8. It is observed that the thrust load exhibits an uncertainty of approximately 10 % to 15 %, whereas the lateral load shows slightly higher uncertainty. Uncertainty levels are consistent across all measurements; therefore, in the interest of clarity in the presentation of results, the uncertainty bars have been excluded from the other plots.
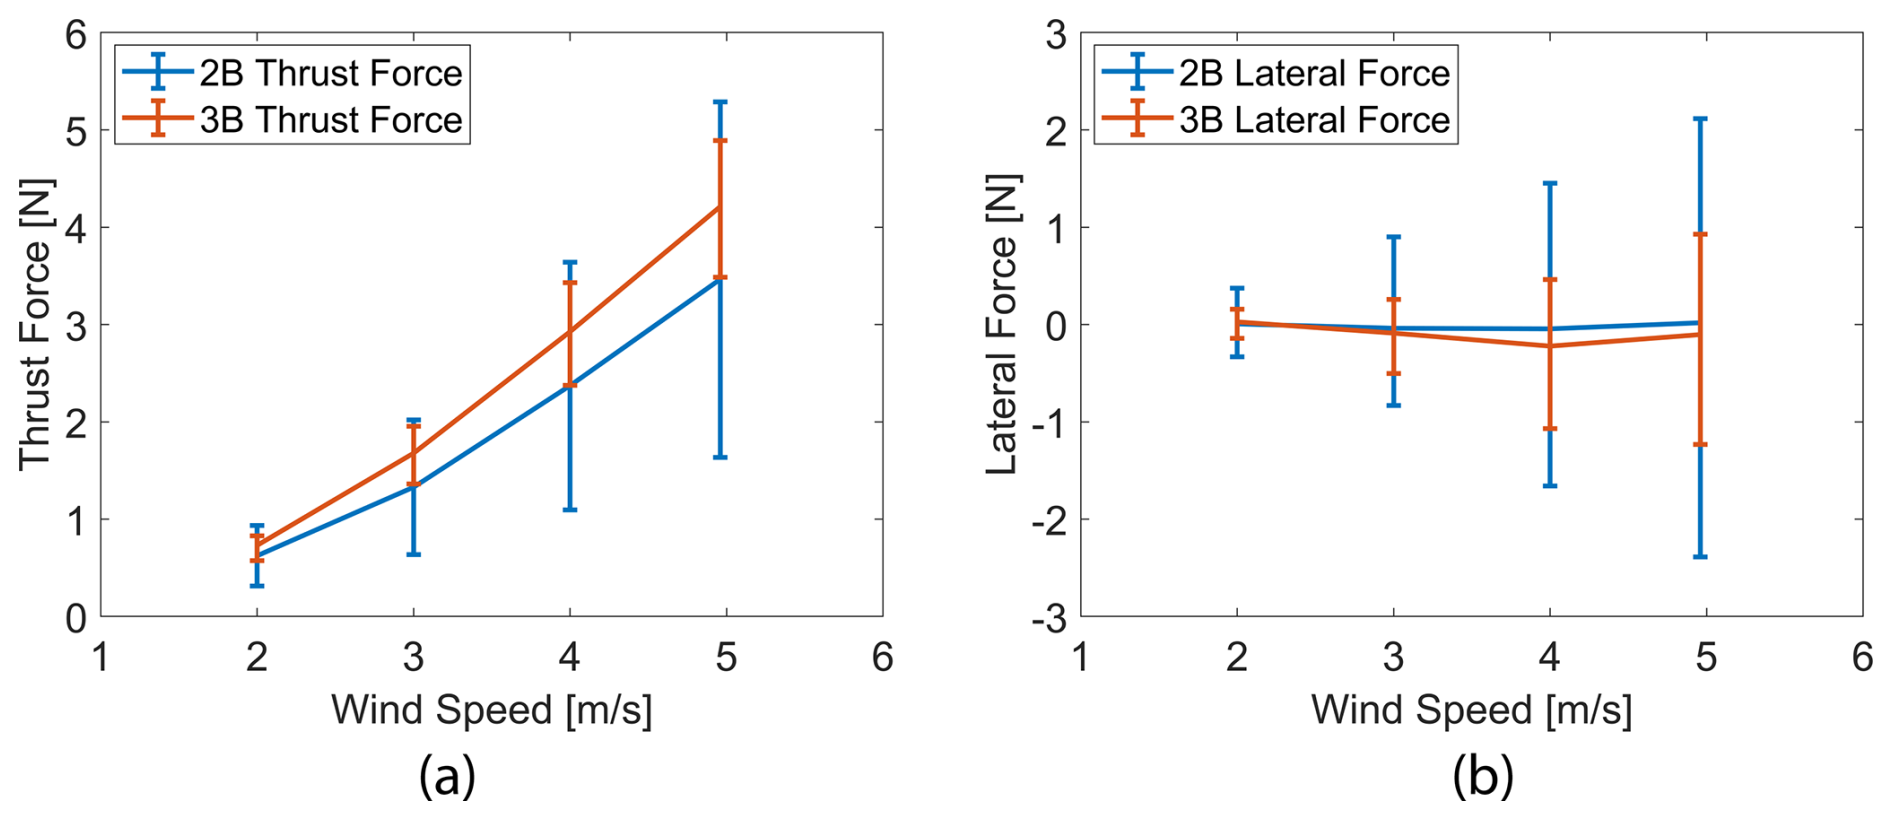
Figure 9Effect of number of blades in the locked tower base condition: (a) thrust force, (b) lateral force. Note that horizontal bars shown are the variation in load due to azimuthal dependency, not uncertainty in the measurement.
3.1.2 Effect of variations in the number of blades
Both 2B and 3B floating VAWTs were tested in this test campaign. Variations in the number of blades impact the aerodynamic characteristics, structural dynamics, and overall efficiency of the turbine. For floating VAWTs, understanding the effect of the number of blades on parked loads is essential to ensure stability and integrity under various operational and environmental conditions. This section explores the influence of the number of blades on parked loads and their implications for floating VAWTs. Both 2B and 3B VAWTs were tested for fixed tower base and floating tower base conditions. However, the result is shown for the locked-wind-only case due to the fact that locked and floating platform conditions show a similar trend.
Figure 9 shows the parked loads as a function of wind speed for both the turbines. The horizontal bar in the figure shows variation due to azimuthal dependency, not uncertainty. It is observed that average thrust load increases with the increase in the number of blades due to higher solidity and higher blockage to the incoming flow as stated in Rezaeiha et al. (2018), whereas the effects of the number of blades are highly azimuth-dependent. The variation (range) of thrust load due to azimuthal dependency in a particular wind speed decreases as the number of blades increases. The average lateral load is zero and independent of the number of blades. However, the amplitude of lateral forces (load fluctuation for a particular wind speed due to azimuthal dependency) decreases as the number of blades increases, which might be helpful for turbine structural integrity (Le Fouest and Mulleners, 2022).
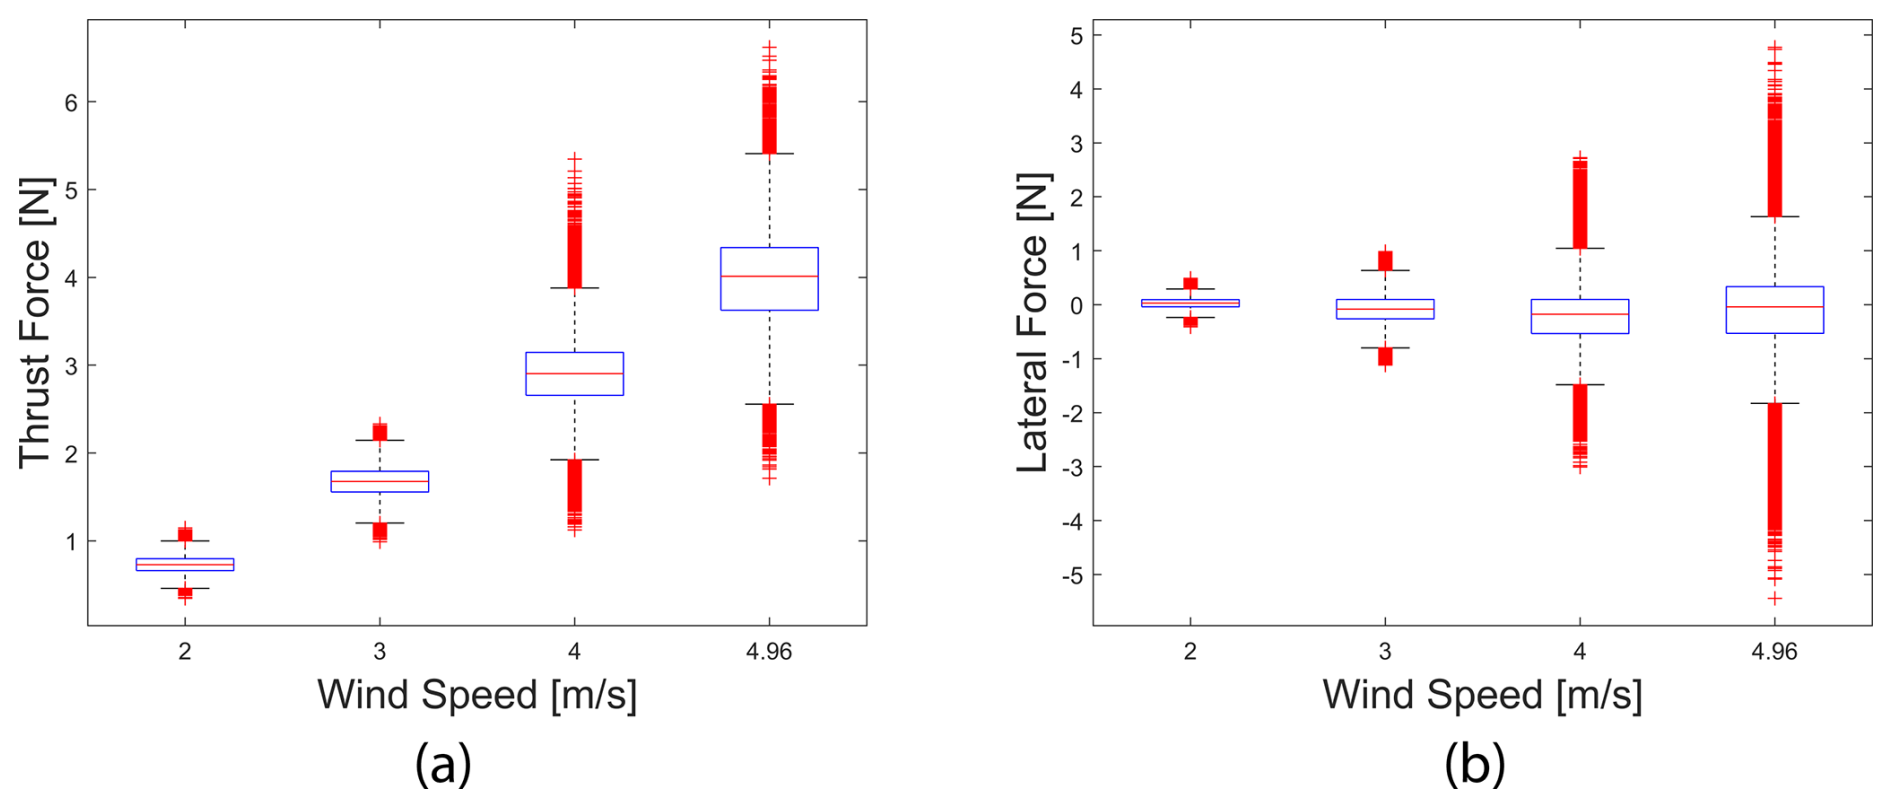
Figure 10Effect of wind speeds on the 3B turbine in the locked tower base condition: (a) thrust force, (b) lateral force.
3.1.3 Effect of wind speeds
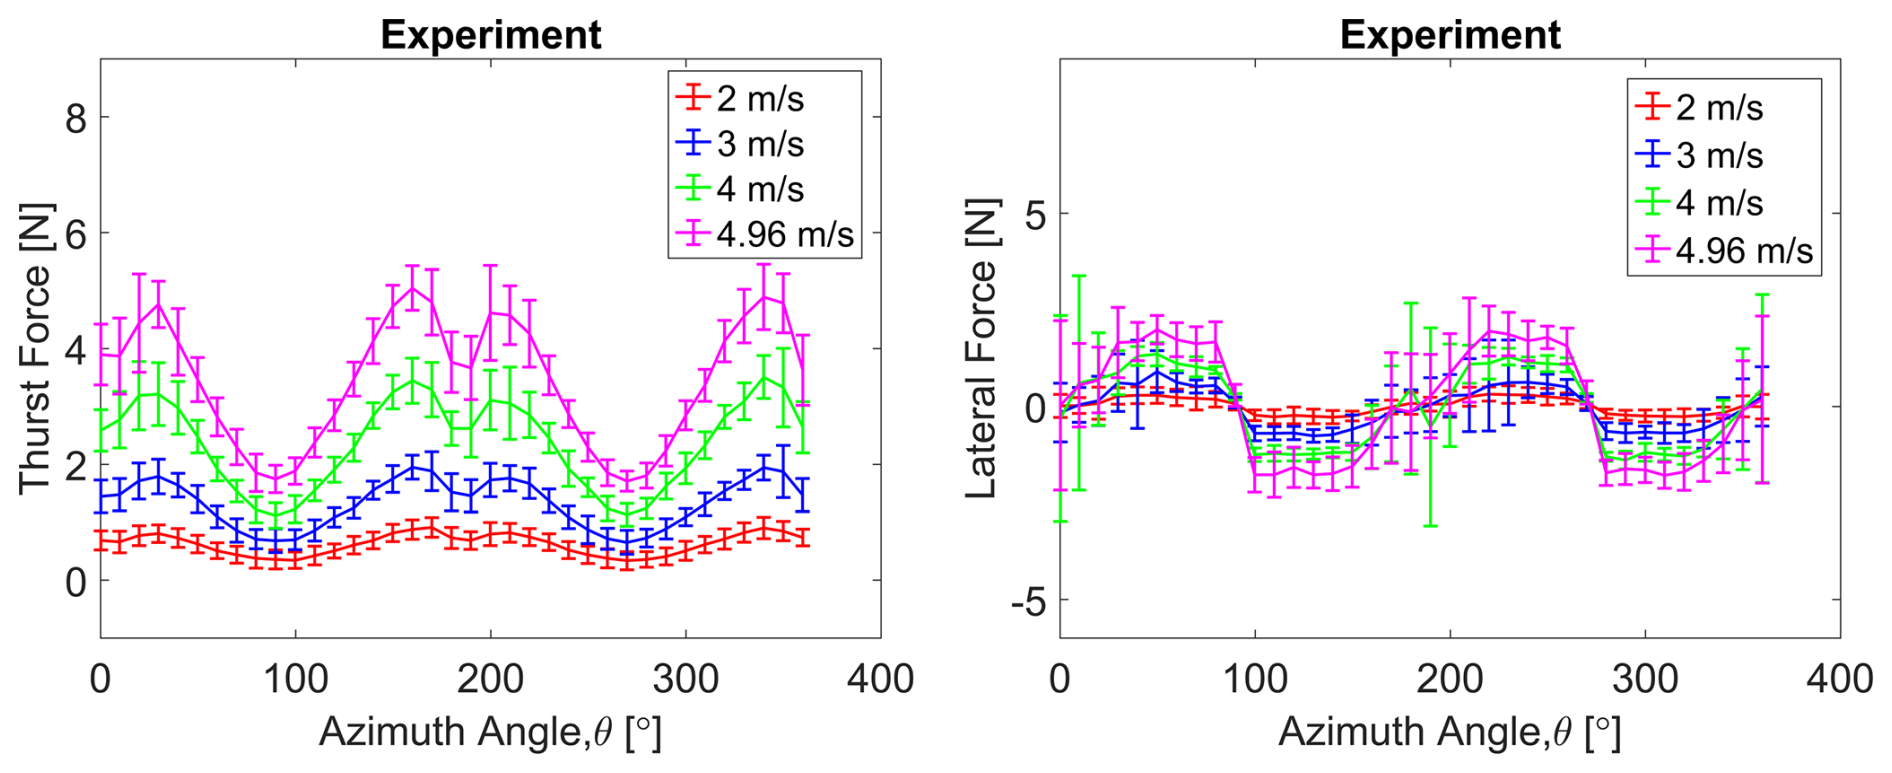
The parked loads of vertical axis wind turbines (VAWTs) are significantly influenced by wind speed. This section investigates the influence of wind speeds on the parked loads of VAWTs. To assess the impact of wind speeds on parked loads, a series of experiments were conducted using a scaled model of a floating VAWT. The turbines were exposed to wind speeds ranging from 2 to 4.96 m s−1 in a controlled wind tunnel environment. To keep the paper concise, this section only considers the parked loads in the locked-wind-only condition. We skipped the effect of wind speed for the 2B turbine due to the fact that the 2B turbine and 3B turbine show a similar trend for parked loads. The impact of wind speeds for parked loads for the 3B turbine in a whisker box plot is shown in Fig. 10. The figure shows the data for the locked-wind-only condition. The result indicates that the amplitude of lateral load and average thrust increase with the wind speed. The red dots indicate the outliers. The high number of outlier data is due to the variation of the load with respect to the azimuth.
Current vertical axis wind turbine concepts usually exclude the complex blade pitching mechanism that can be used to shed some load in higher wind speeds. Therefore, the load increase with the wind speed is expected as no blade pitching was present in this study. The increase in parked loads with wind speeds can also be substantiated from similar comments made in Carmo et al. (2024). This increase in parked loads with wind speed signifies that parked loads will be a crucial factor in high wind speed. Thus, wind turbine designers should focus on parked loads too, especially for high wind speeds.
3.1.4 Comparisons among different wind–wave platform conditions
In this section, we compare the parked loads among the three conditions detailed in Table 4. In the locked-wind-only (fixed tower base) condition, the tower base is attached to a stinger to restrict all the tower base motion. In the floating-wind-only condition, the floating platform is connected to the mooring line. The mooring lines are horizontal, which are connected to the bottom of the floating platform columns and springs. The horizontal mooring was adopted to reduce the experimental uncertainty related to conventional catenary mooring (Ahsan et al., 2022). In the floating wind–wave condition, the rotor was operated on a floating platform in the presence of both wind and waves.
In the test campaign, we measured the parked loads for 2, 3, 4, and 4.96 m s−1 for locked-wind-only and floating-wind-only conditions. Tests were conducted for both 2B and 3B turbines. However, parked loads for 4 and 4.96 m s−1 wind speeds were measured for the floating wind–wave condition. This case considered the 3B turbine only due to limitations of available testing time.
Offshore floating conditions often cause turbines to tilt, which has two competing effects: greater tilt reduces aerodynamic loads but increases weight effects. Experimental lateral load and thrust load comparisons among different conditions are shown in Figs. 11 and 12, respectively. The results show that lateral load amplitude and average thrust load for floating conditions are greater than the locked-wind-only condition. Although tilting in the floating case can reduce aerodynamic loads due to reduction in swept area and through damping effects (Ahsan et al., 2022), the added weight component in the sensor's direction results in higher measured loads. When the turbine tilts, the six-degree-of-freedom load and moment measuring sensor also tilts. This sensor tilting along with gravitational load measurement is shown in Fig. 6. Thus, the measured data include the load component and weight load of the turbine due to rotor tilting. If we considered the loads in the original thrust or lateral direction only, then the floating with wind only and floating with wind–wave cases would show the expected lower parked loads compared to the locked-wind-only case.
The lateral load amplitude and average thrust load for floating wind only and floating wind–wave are almost the same (please refer to Figs. 11 and 12). The only variation is that the floating wind–wave data are noisier (or varied with high frequency) than the floating-wind-only condition due to the coupled dynamics of wind and wave. The high-frequency variation is due to the high frequency (0.62 Hz) of the regular wave used in the experiment.
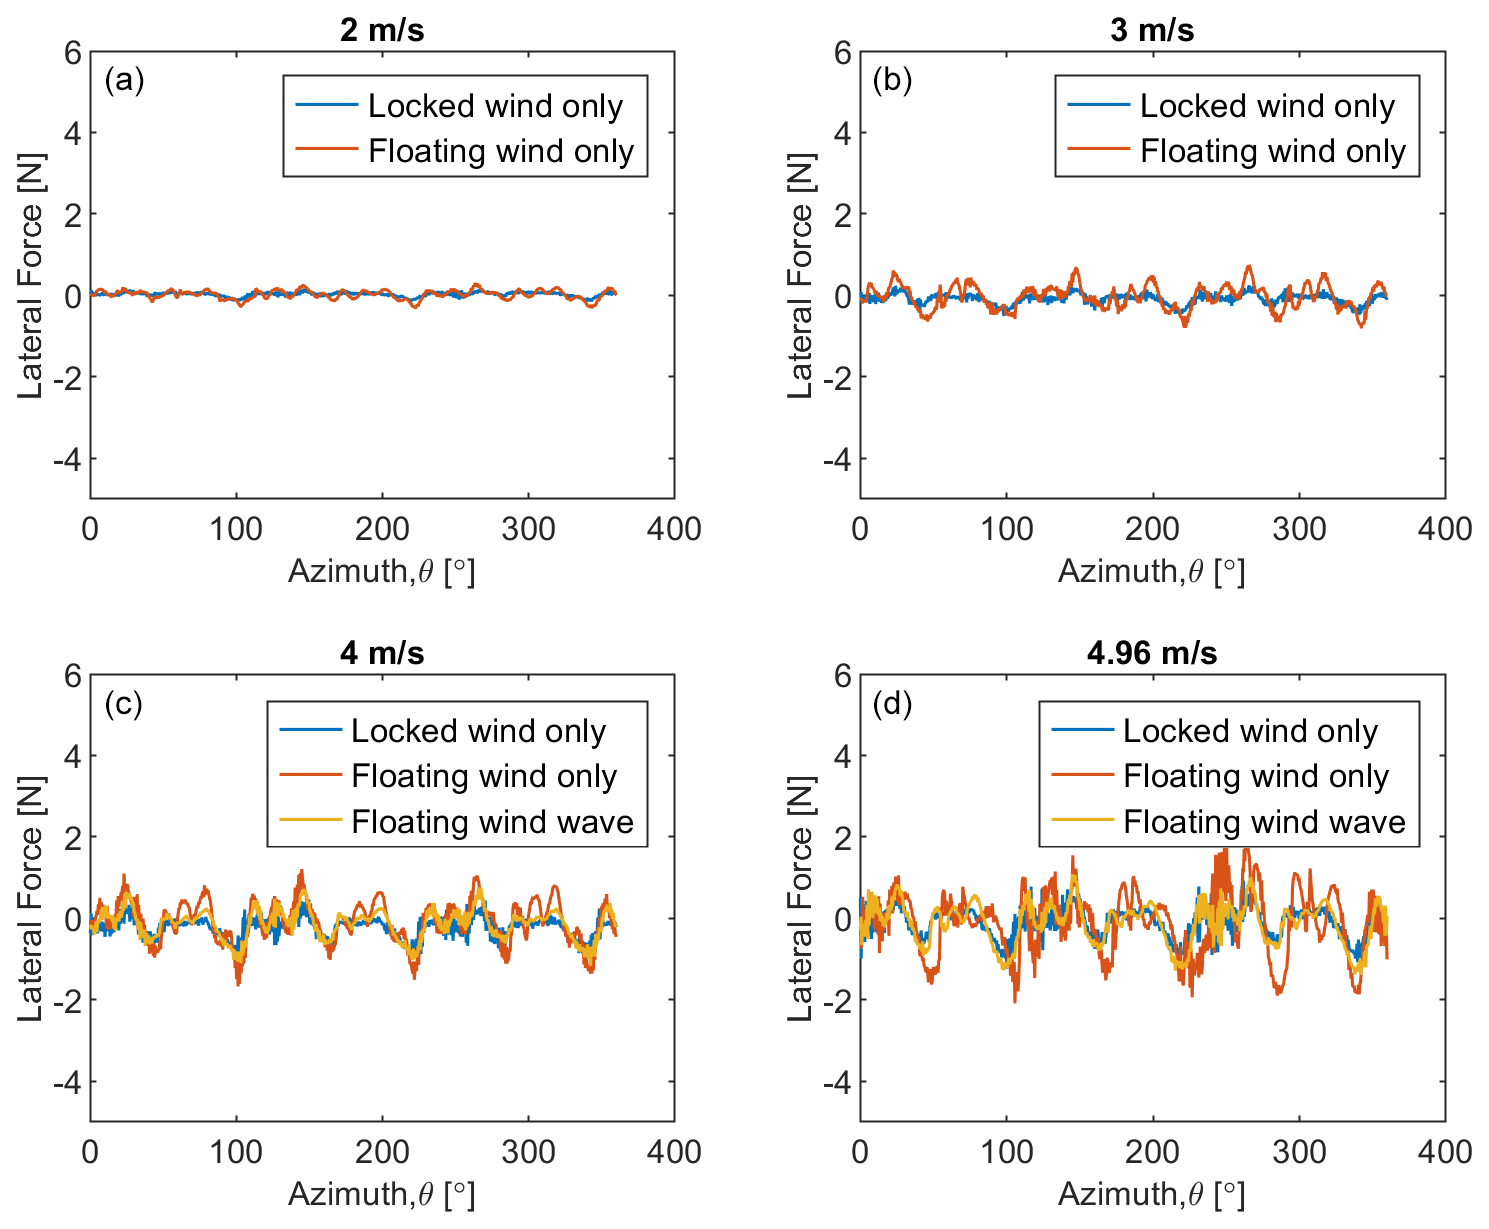
Figure 11Experimental lateral load as a function of azimuth (3B Turbine) (a) 2 m s−1, (b) 3 m s−1, (c) 4 m s−1, (d) 4.96 m s−1.
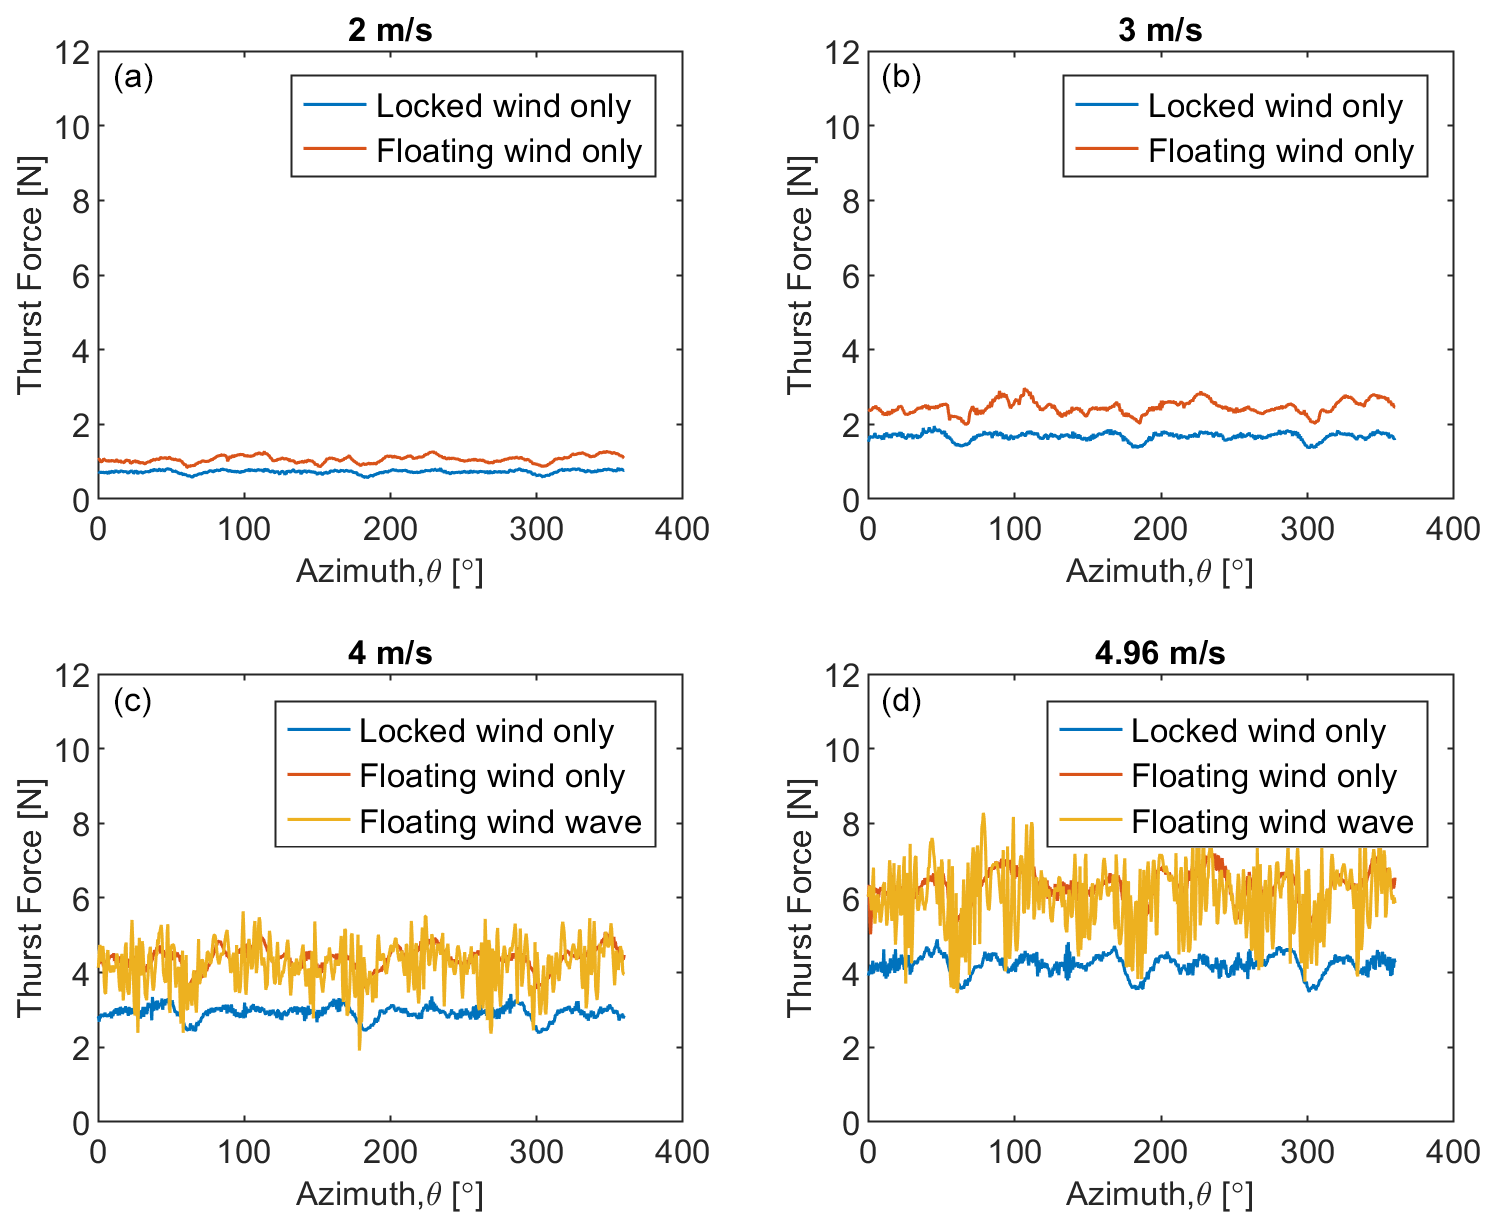
Figure 12Experimental thrust load as a function of azimuth (3B turbine): (a) 2 m s−1, (b) 3 m s−1, (c) 4 m s−1, (d) 4.96 m s−1.
3.1.5 Correlation between parked loads and turbine dynamics
The correlation coefficient of two random variables is a measure of their linear dependence. If each variable has N scalar observations, then the Pearson correlation coefficient is defined as
where μA and σA are the mean and standard deviation of A, respectively, and μB and σB are the mean and standard deviation of B.
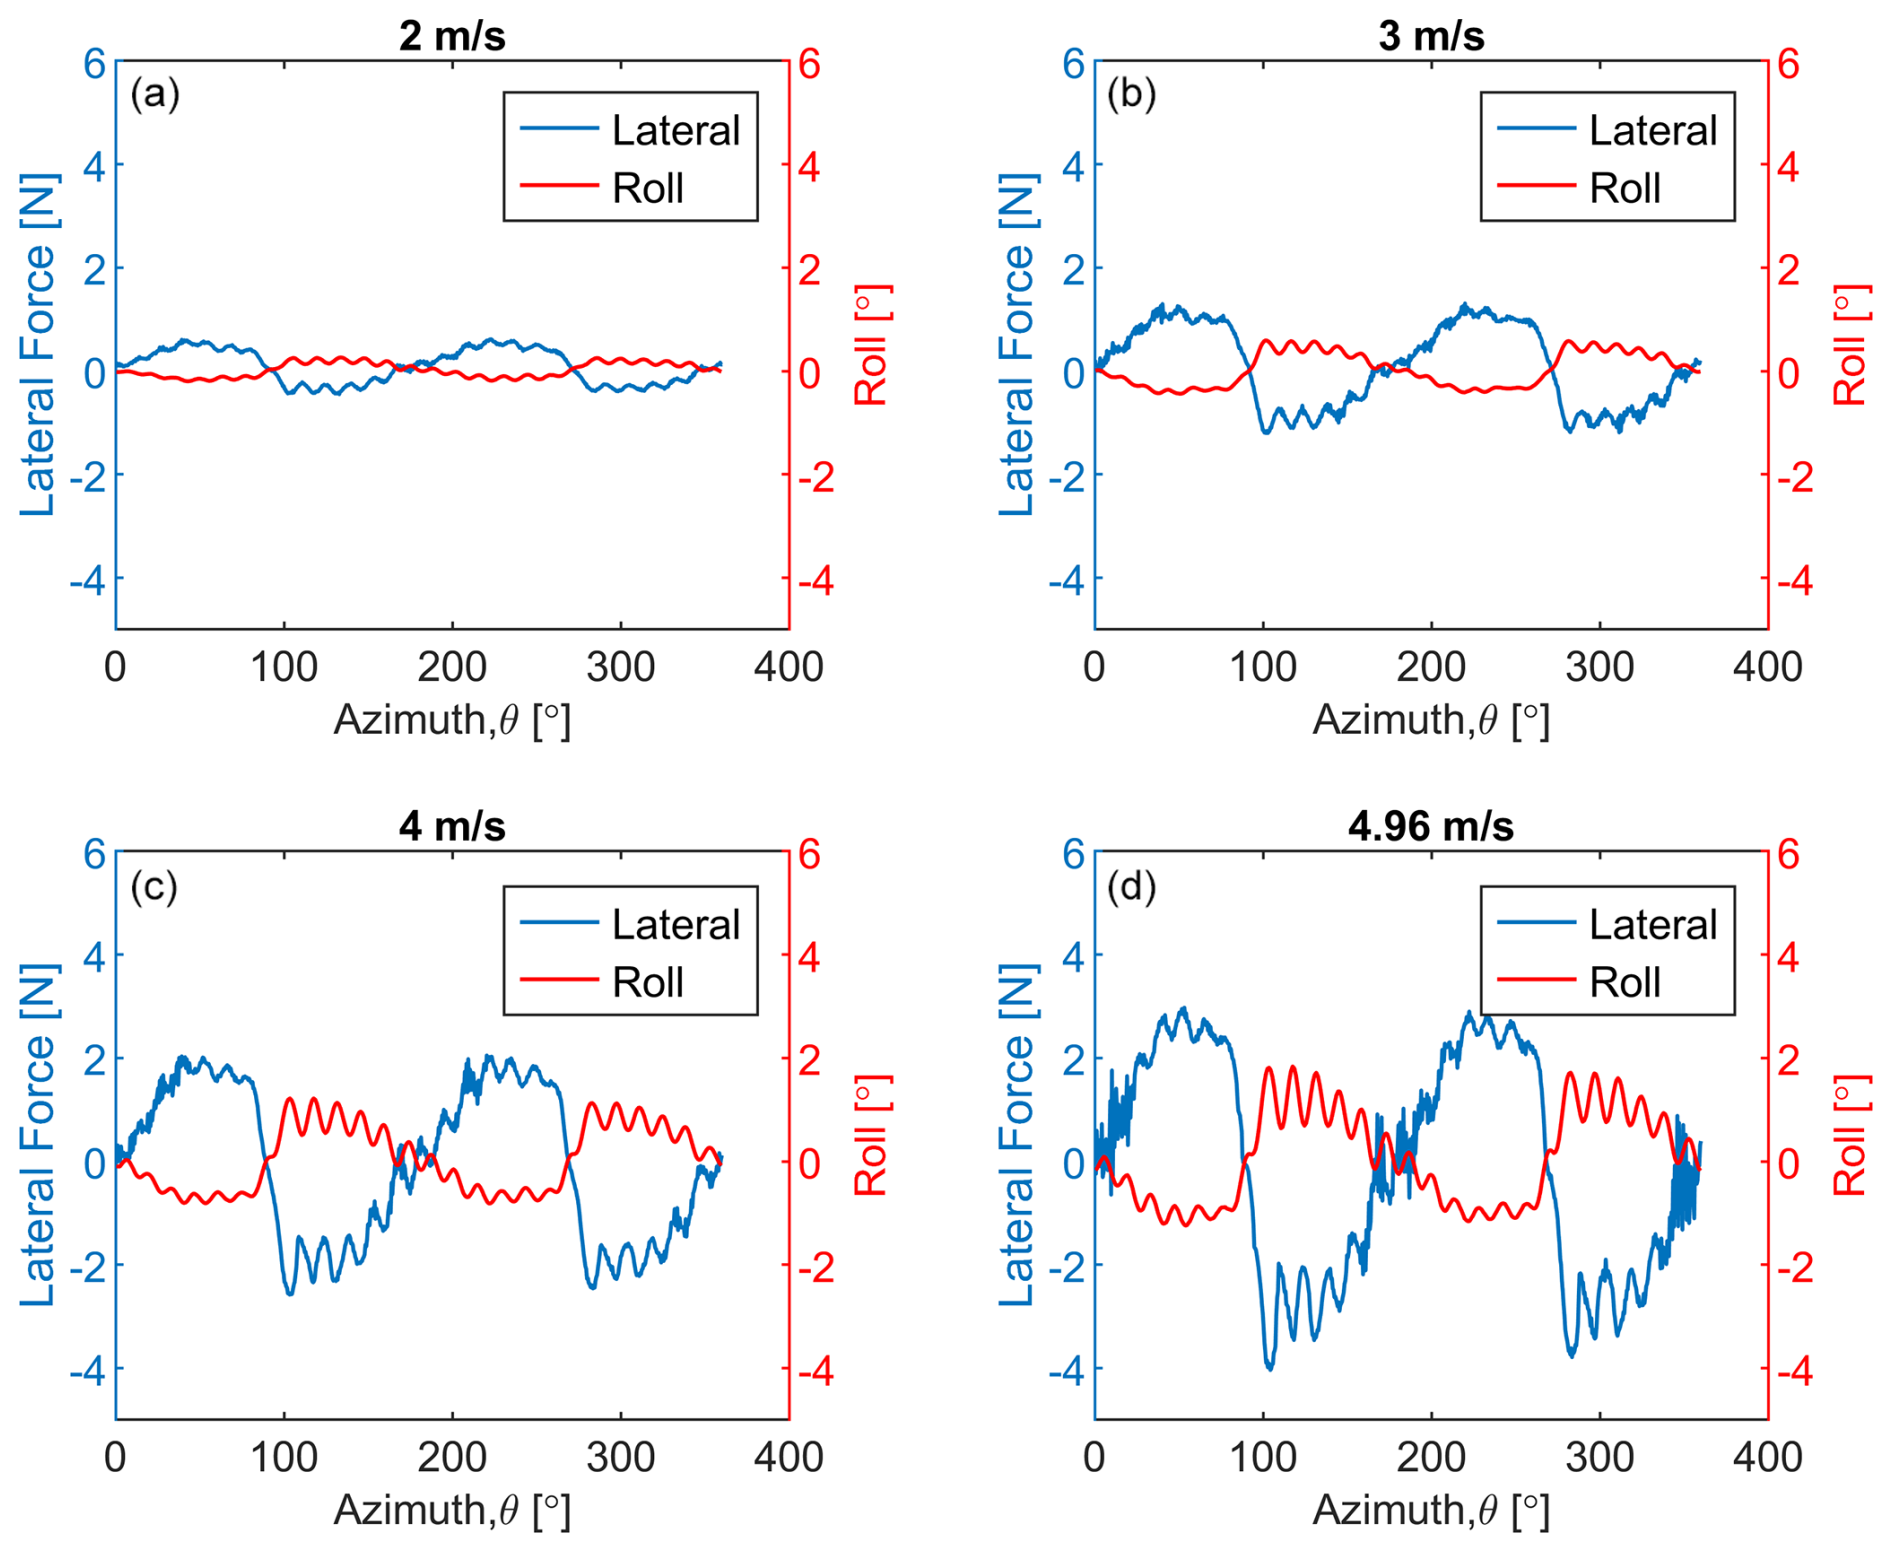
Figure 13Experimental lateral load and dynamic roll motions in floating-wind-only conditions for the 2B turbine: (a) 2 m s−1, (b) 3 m s−1, (c) 4 m s−1, (d) 4.96 m s−1.
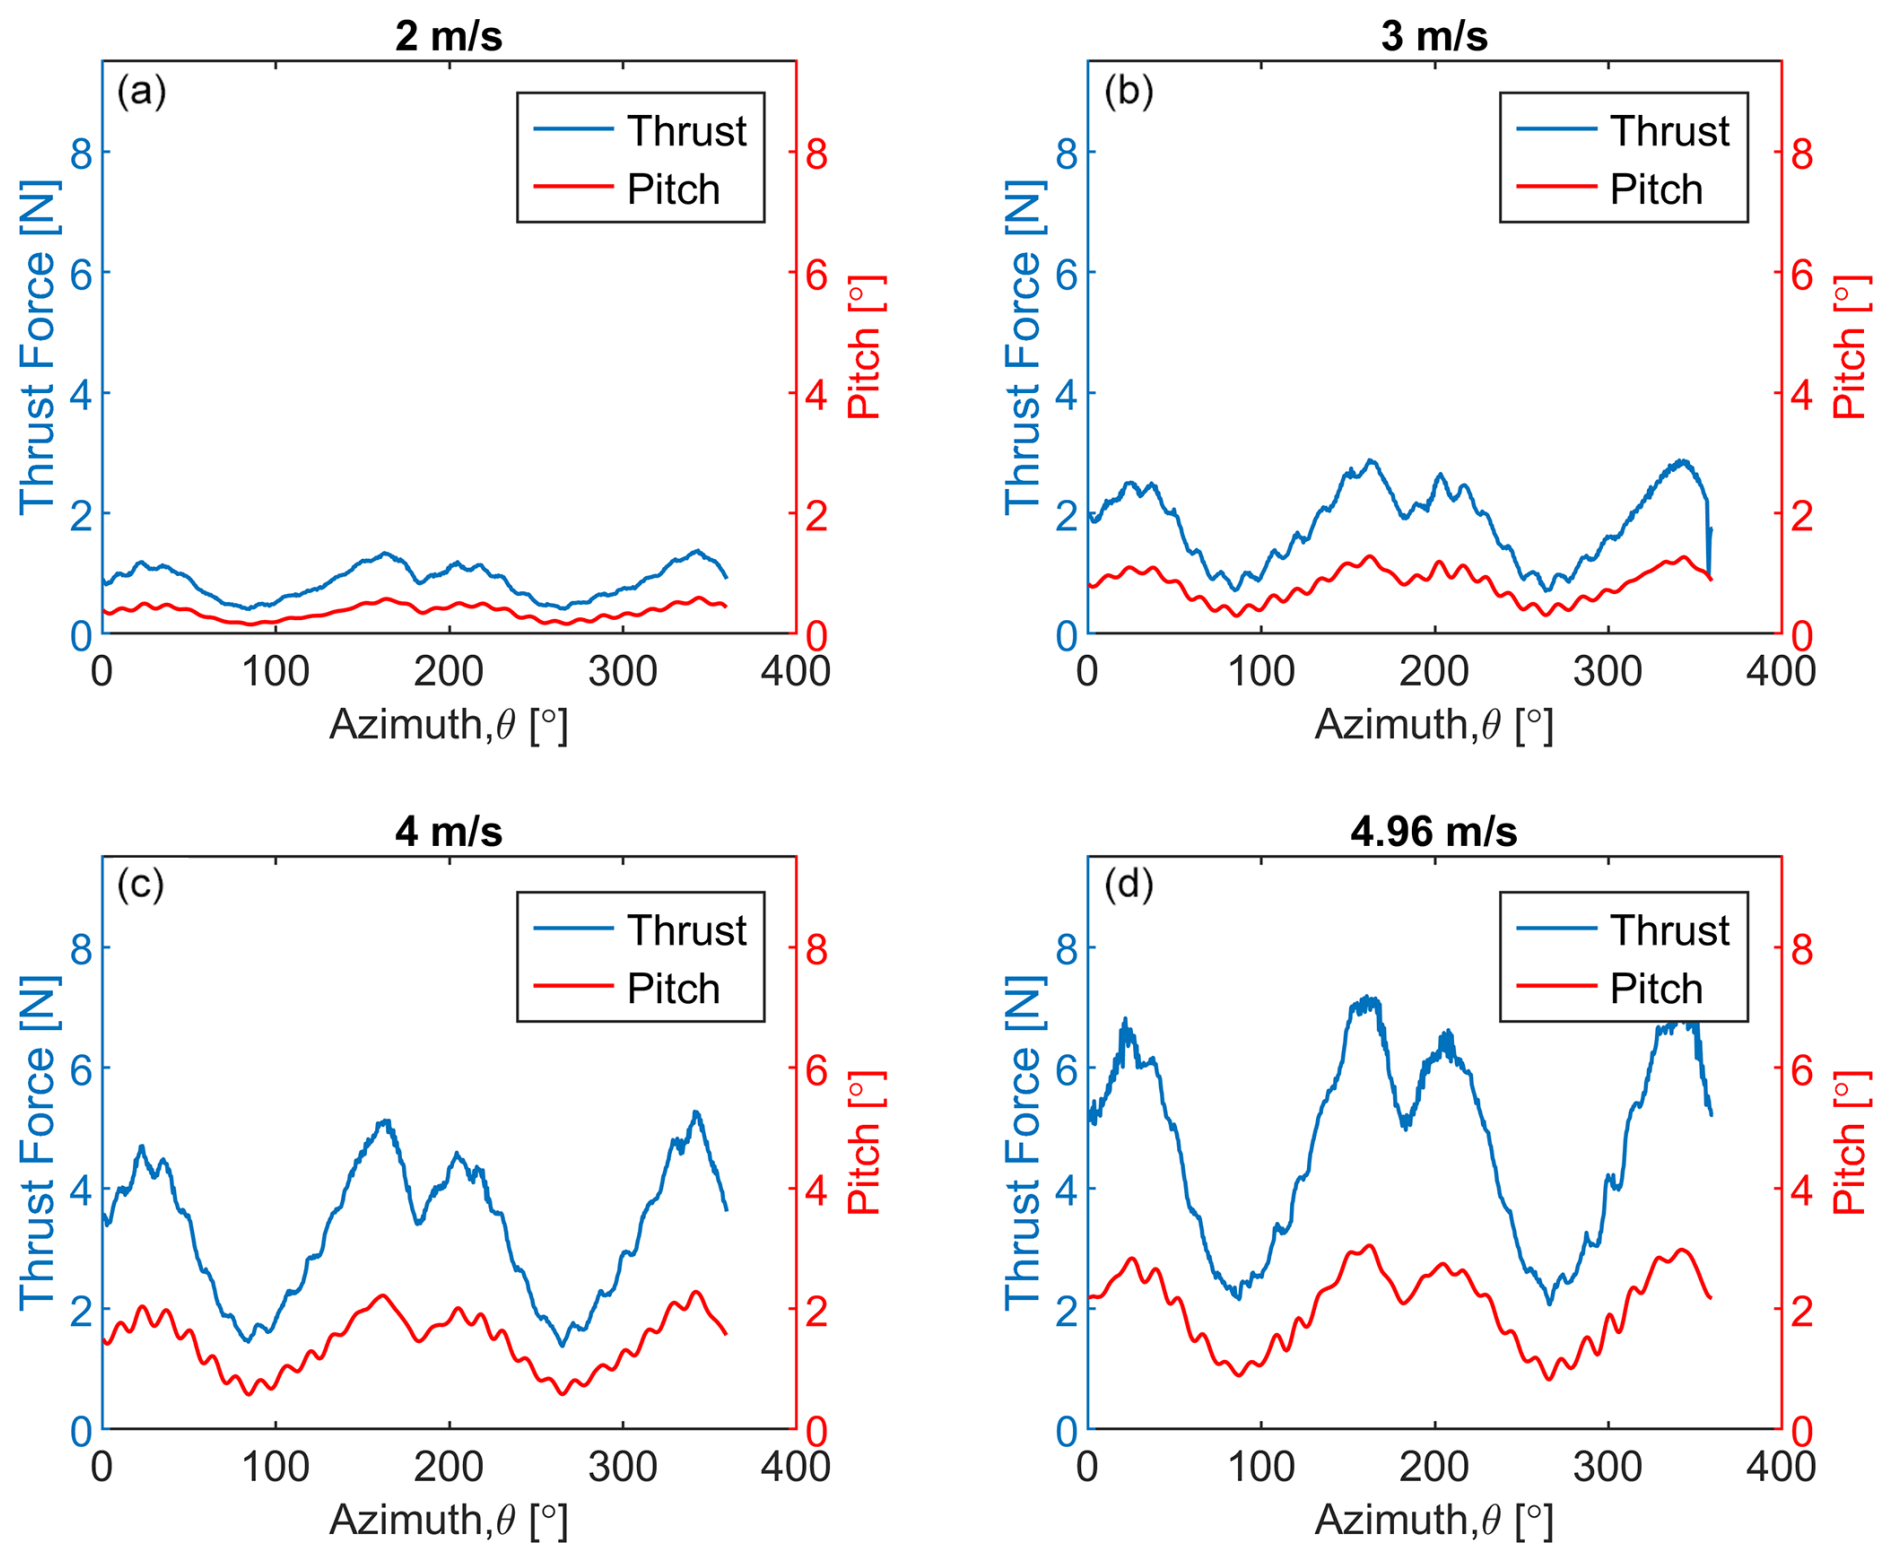
Figure 14Experimental thrust and dynamic pitch motions in floating-wind-only conditions for the 2B turbine: (a) 2 m s−1, (b) 3 m s−1, (c) 4 m s−1, (d) 4.96 m s−1.
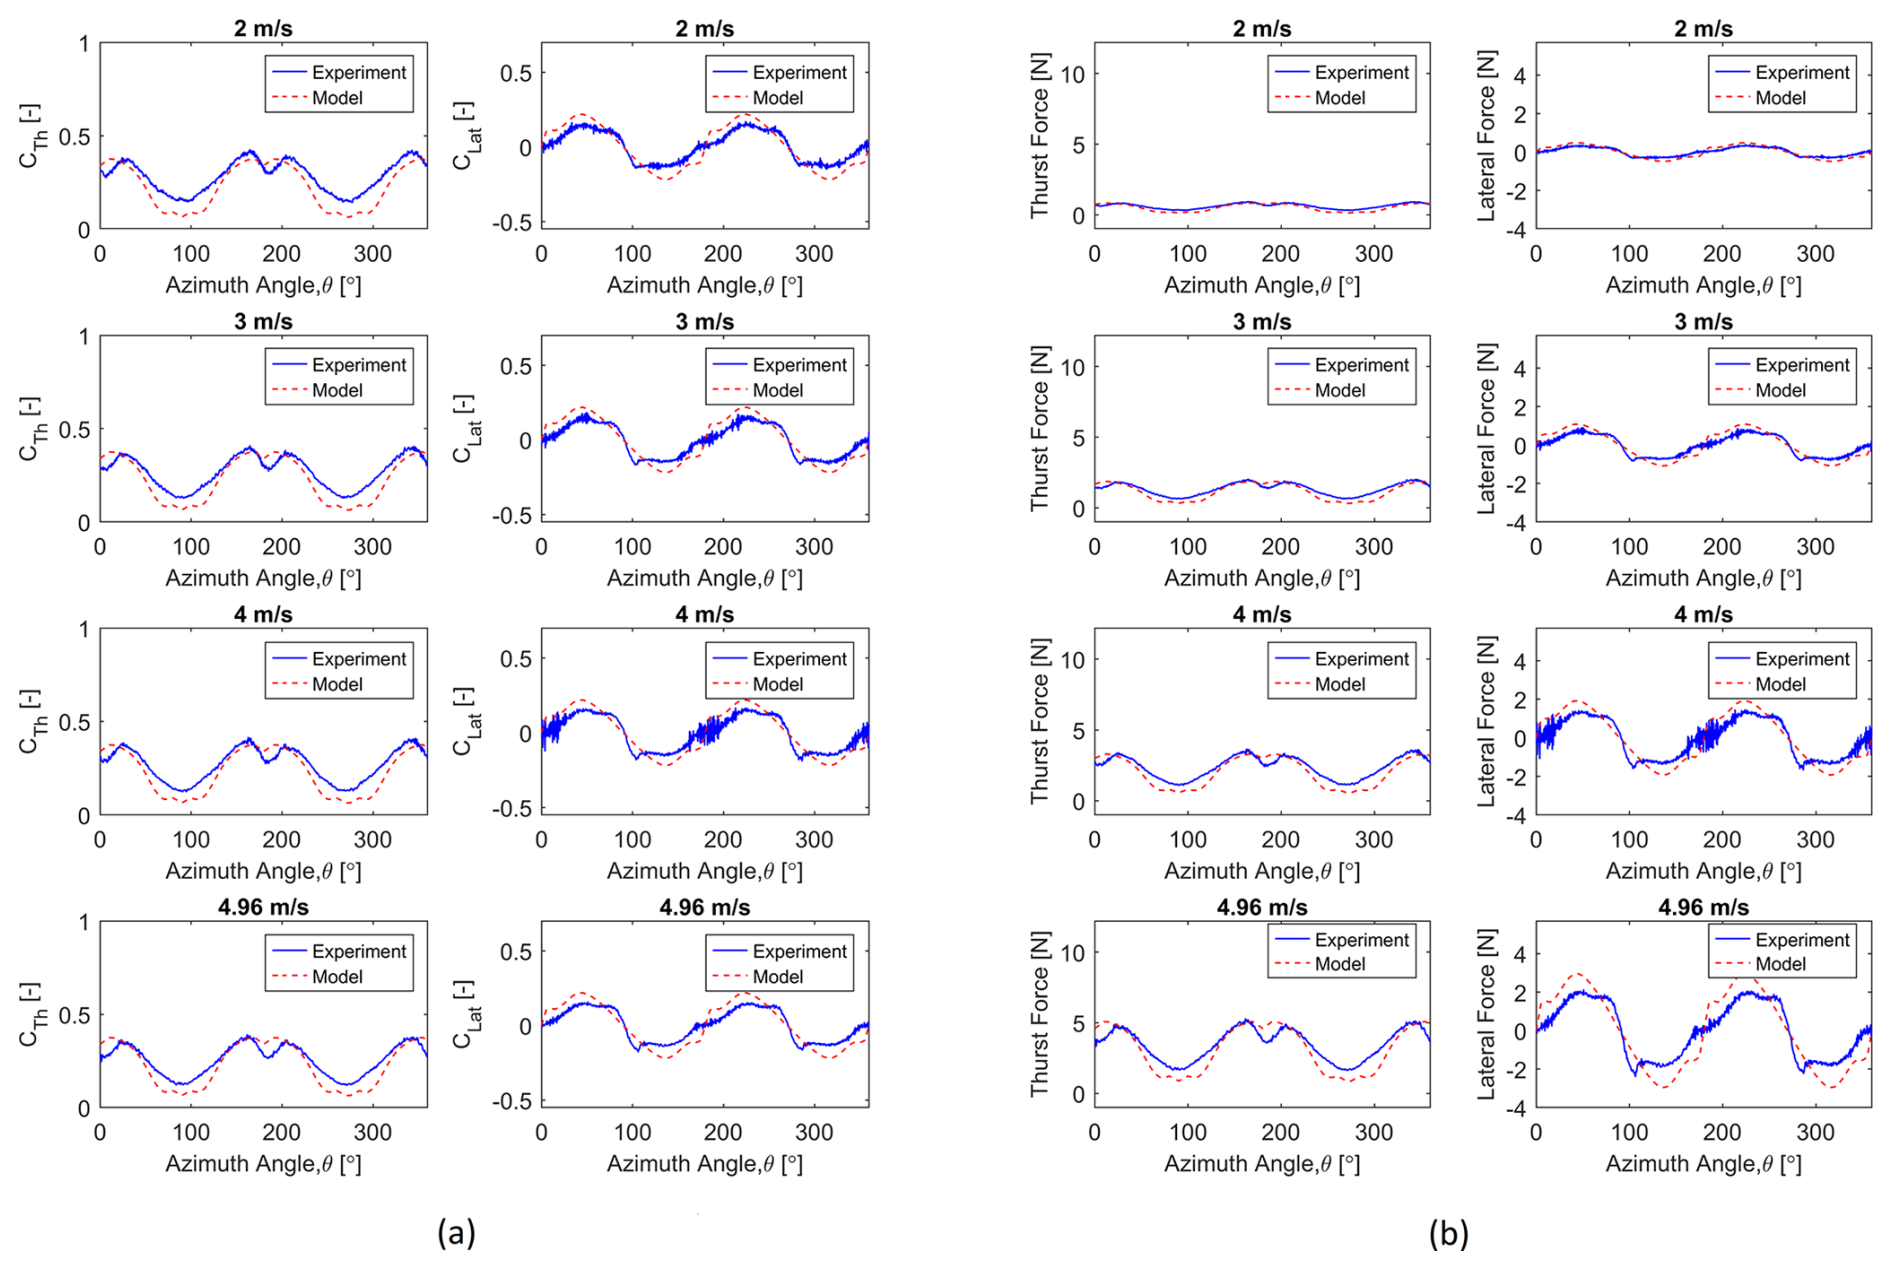
Figure 15Comparison between experimental and semi-numerical parked loads of the 2B turbine for the locked with wind only condition: (a) nondimensional loads, (b) dimensional loads.
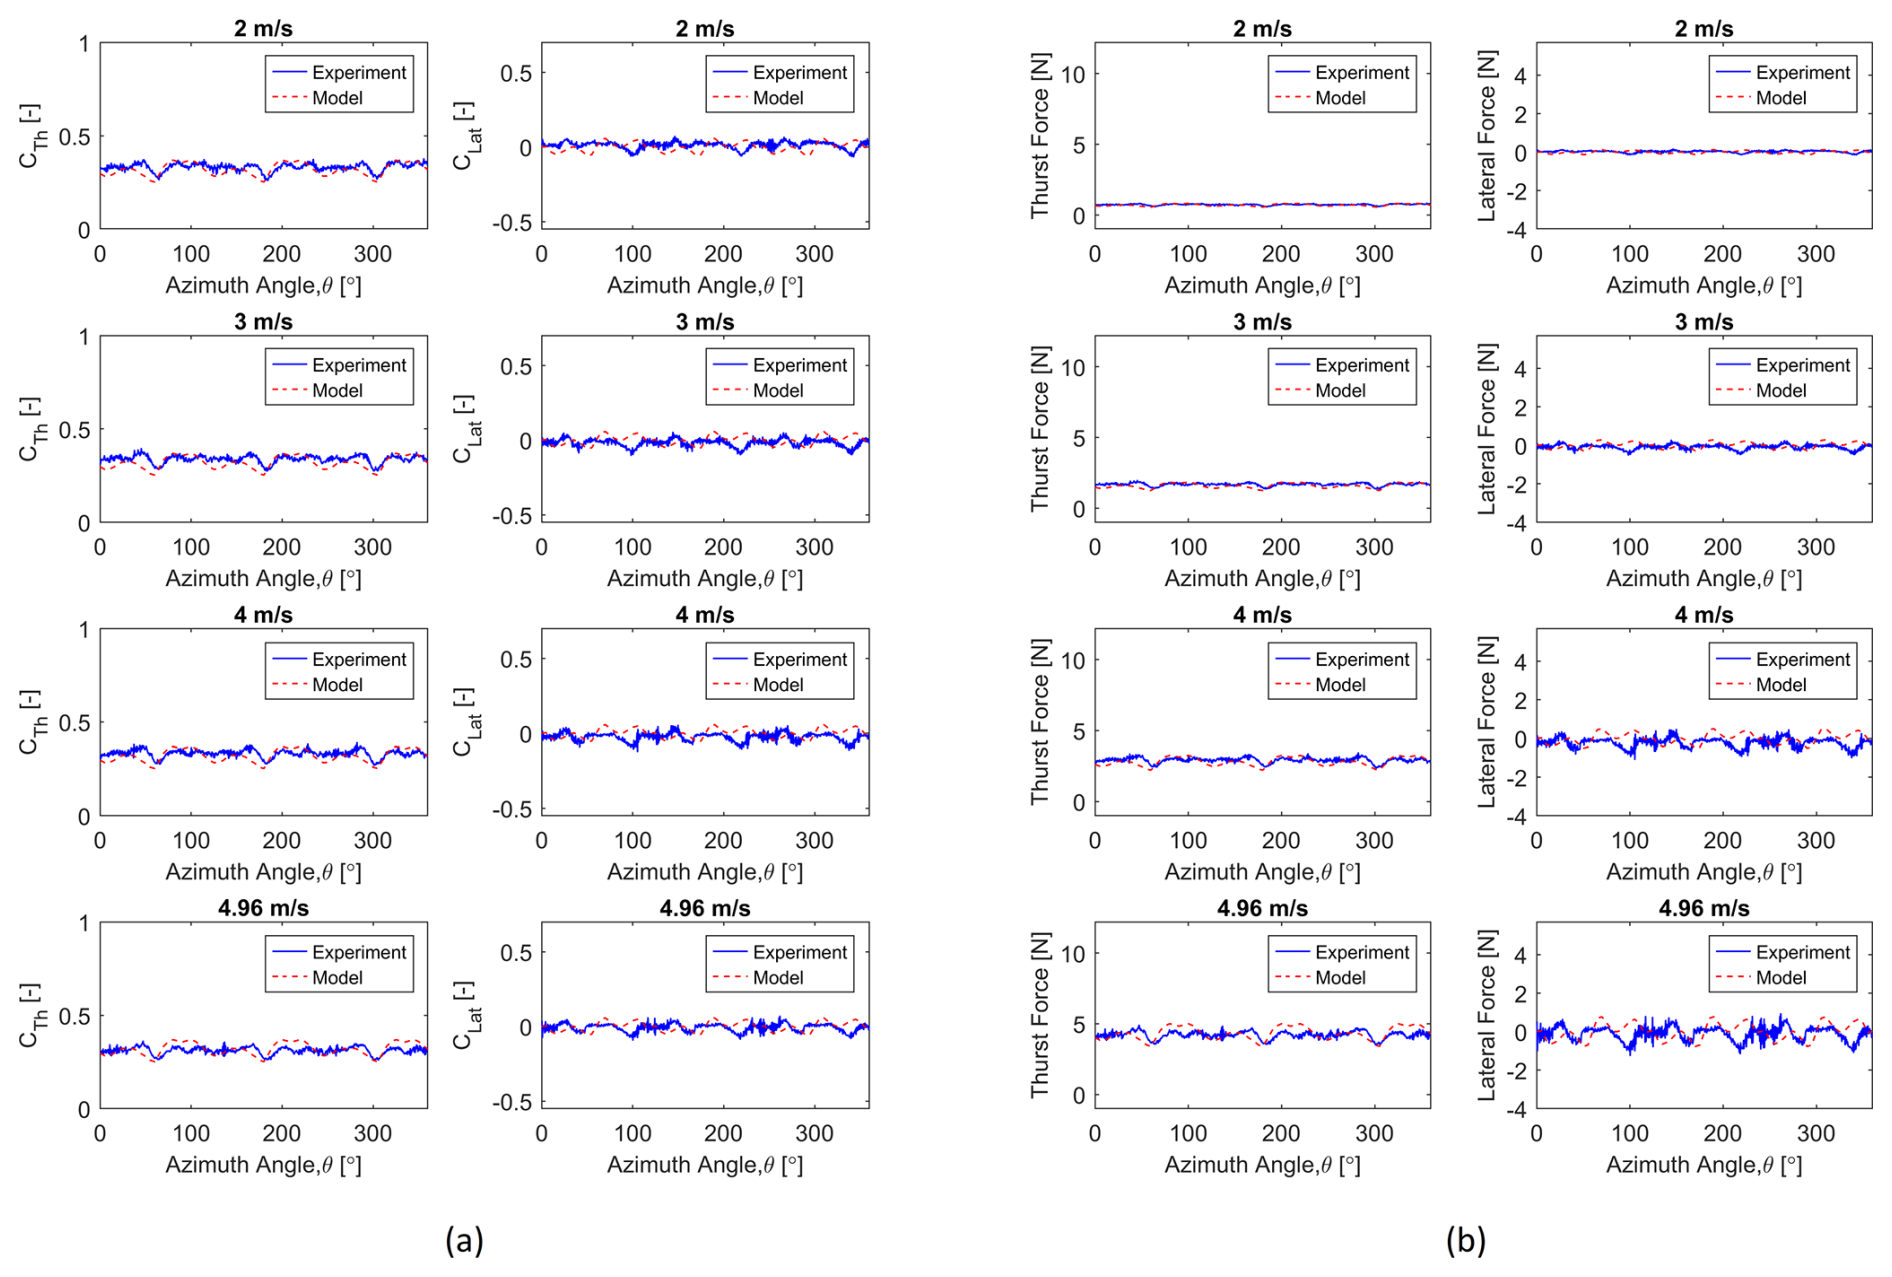
Figure 16Comparison between experimental and semi-numerical parked loads of the 3B turbine for the locked with wind only condition: (a) nondimensional loads, (b) dimensional loads.
The loads and dynamic motions with respect to azimuthal position are shown in Figs. 13 and 14 for the lateral and roll as well as thrust, pitch loads, and motions, respectively. The left y axis represents the load, and the right y axis represents the tilt angle. The correlation coefficients between lateral load and roll motion for 2, 3, 4, and 4.96 m s−1 are −0.98, −1, −0.99, and −1, respectively, whereas the correlation coefficients between thrust load and pitch motion for 2, 3, 4, and 4.96 m s−1 are 0.98, 0.99, 0.99, and 0.99, respectively. The coefficients shown here are for the 2B turbine. It is seen that the dynamic motions and parked loads are highly correlated. Thrust load is highly correlated with pitch motion, whereas lateral load is highly correlated with roll motion. For the lateral loads and roll motion case, the negative correlation coefficient is simply due to the assumed lateral load and roll direction variation. This does not mean that as the roll angle increases the turbine lateral load decreases.
3.2 Semi-numerical parked load model and validation
3.2.1 Locked-wind-only condition
This section compares parked loads from both the experiments and the semi-numerical model of two-bladed (2B) and three-bladed (3B) test turbines with the locked tower base condition.
Figures 15 and 16 illustrate the variation of parked thrust and lateral loads with respect to azimuthal position for the 2B turbine and 3B turbine, respectively. The experimental data represent the phase average of 5 revolutions, where the semi-numerical data are based on the last revolution values after the CACTUS simulation has converged. Figure 15a shows a comparison of nondimensional forces, helping the evaluation of loads of different scale turbines, while Fig. 15b shows a comparison of the dimensional case, which applies exclusively to this test turbine. Analysis generally shows very good agreement between experiments and our parked load model in terms of both magnitudes and rotor azimuth dependence. Both thrust and lateral load amplitudes increase with the wind speed increment. The sharp decrease in experimental thrust load at 180° azimuthal location is due to the tower shadow effect, which is captured well in our model.
Both experimental and semi-numerical results show a clear relationship between wind speed and thrust force: higher wind speeds generate larger thrust forces. The periodic nature of the thrust force with respect to azimuth angle is consistent for the experiments and model.
The lateral force increases in magnitude with the increase in wind speeds, keeping the mean force at almost zero. Experimental results show measurement noise due to sensor inaccuracies and inherent variability in the system. The results from the semi-numerical model appear smoother compared to measured data. Again, the overall trends of force variation are captured similarly by both the experiment and the semi-numerical model.
Thrust force shows (Figs. 15 and 16) a strong resemblance between the experiment and model, although the experimental results include measurement noise. Both the model and experiment capture the cyclic nature (two cycles for the 2B turbine and three cycles for the 3B turbine in a revolution) of the forces with respect to the azimuth angle.
3.2.2 Floating-wind-only condition
Modeling the floating case with wind comes with a new challenge. The challenge is to model the weight effect due to rotor tilting in the floating tower base case, as well as capturing the impact of tilting on aerodynamic loads. A detailed description of modeling parked loads in the floating tower base condition is shown in Sect. 2.
This section is intended to analyze the modeled parked load data for the floating-wind-only case in the absence of waves. Due to the floating condition, the rotor tilts under wind loading, which adds a component of rotor weight in the measured updated sensor thrust and lateral direction. The rotor weight was already measured in the wind–wave basin. The 2B and 3B turbines weigh 5.97 and 6.55 kg, respectively. This mass includes only the components mounted above the load cell, including the blades and tower mass, excluding the mass of the lower tower section, load cell, generator, and hull.
A representative weight effect in the thrust direction for the 2B turbine in the floating-wind-only condition is shown in Fig. 17. This figure represents the pitch in red and turbine weight force in the measured thrust direction in blue. It is observed that, with the increase in wind speed, the weight effect also increases. It is a significant amount compared to the parked thrust load of similar wind speed. The 2B turbine generates maximum thrust force of 5 N at 4.96 m s−1 for the locked-wind-only case, whereas the weight effect for the same turbine in the floating condition due to tilting at 4.96 m s−1 is 2.4 N, which is around 48 % of the thrust load of the locked-wind-only case. Thus, including the rotor weight effect is very important when modeling the parked load for floating cases.
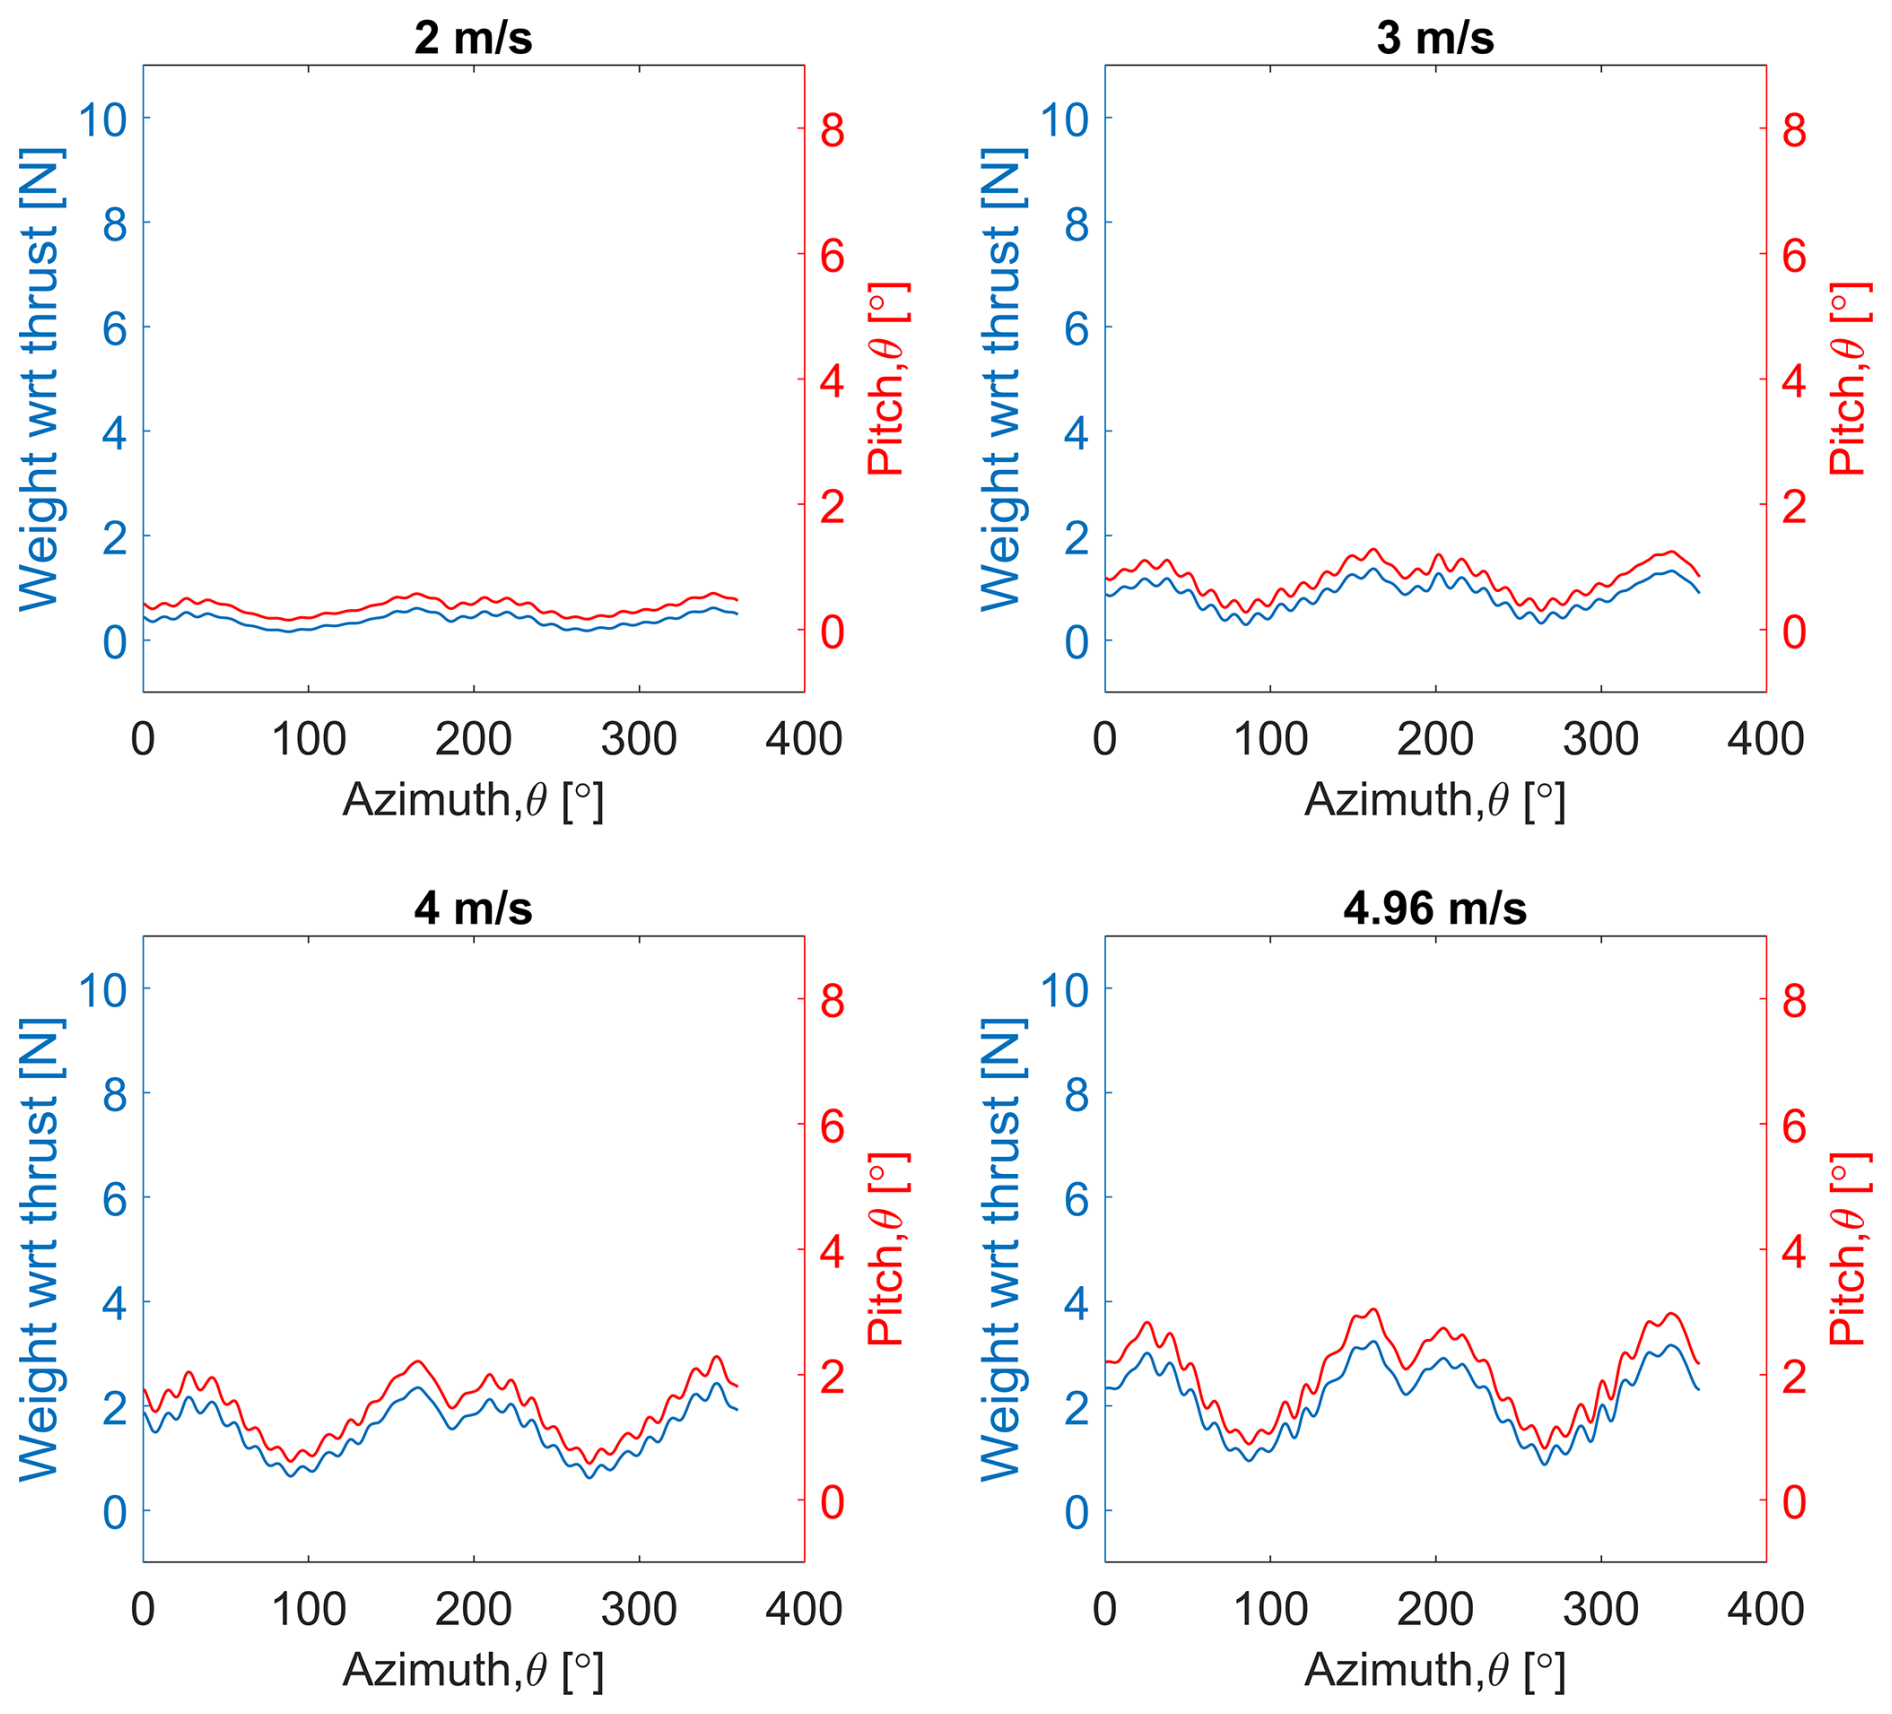
Figure 17Weight effect in the thrust direction for the 2B turbine in the floating with wind only tower base condition.
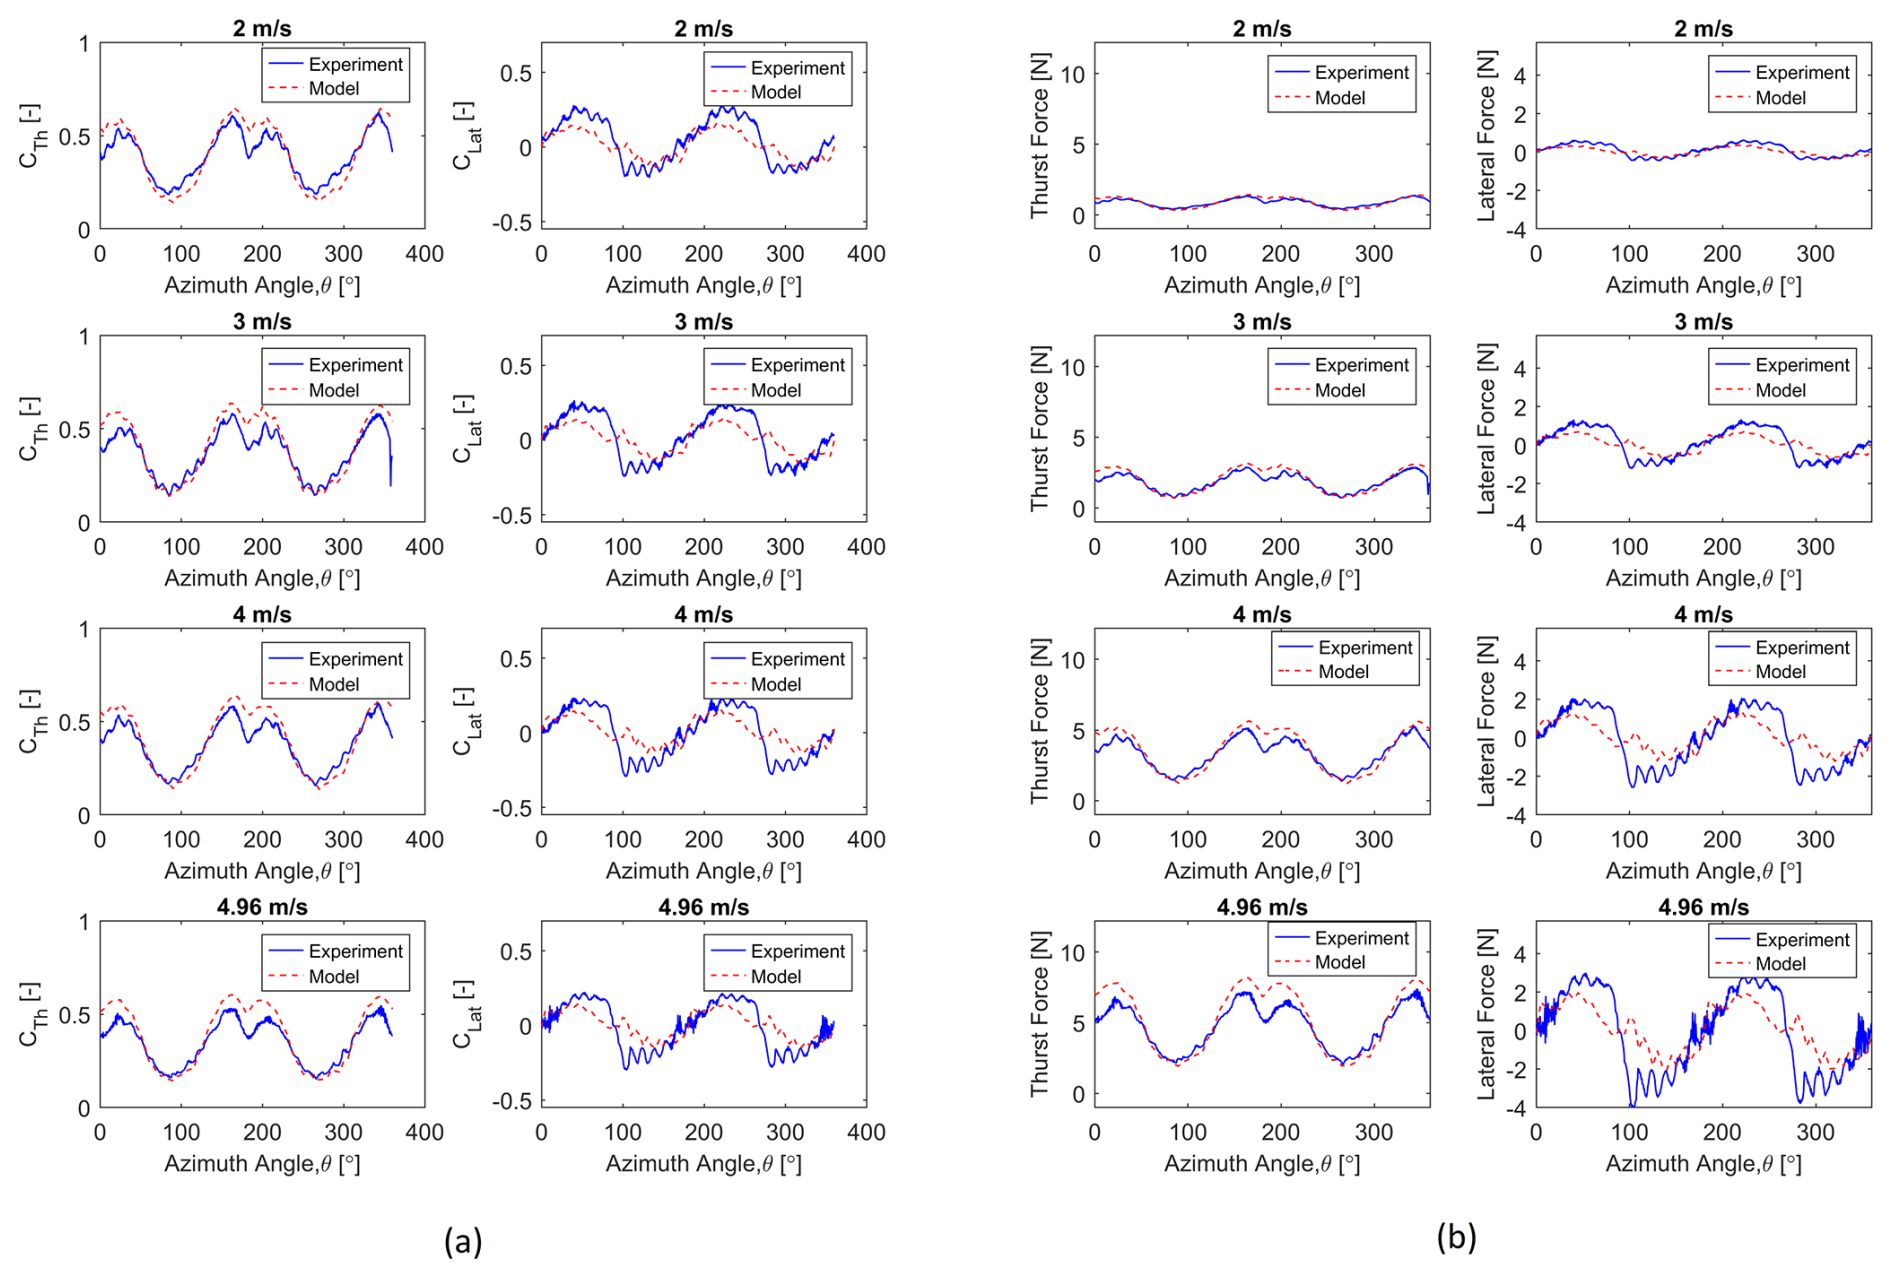
Figure 18Comparison between experimental and semi-numerical parked loads of the 2B turbine for the floating with wind only condition: (a) nondimensional loads, (b) dimensional loads.
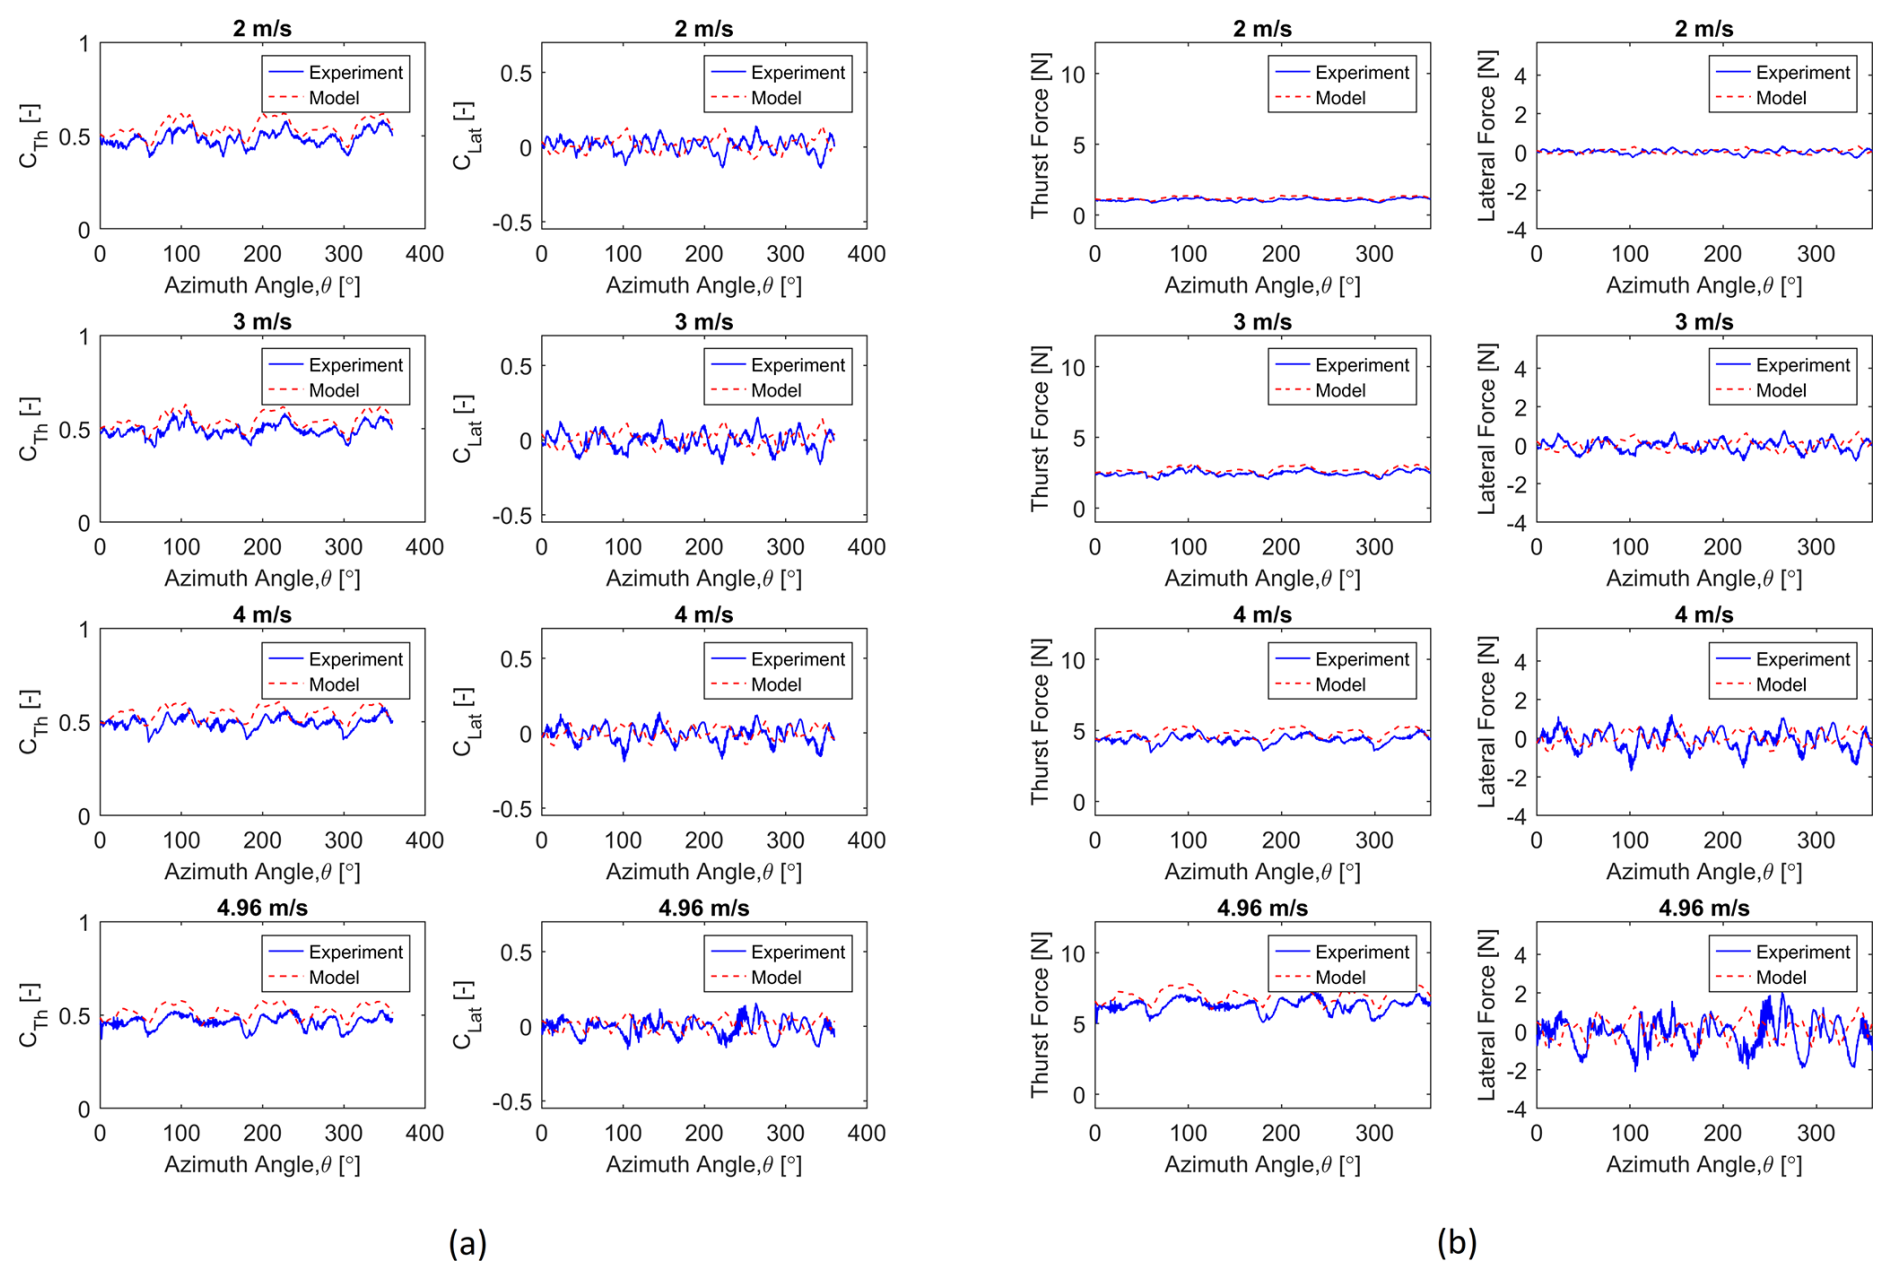
Figure 19Comparison between experimental and semi-numerical parked loads of the 3B turbine for the floating with wind only condition: (a) nondimensional loads, (b) dimensional loads.
Figures 18 and 19 show the validation of the UTD semi-numerical parked load with the floating-wind-only condition for 2B and 3B turbines, respectively. The tool accurately predicts the trend for both thrust and lateral parked loads for the floating-wind-only case. However, the model slightly overpredicts the thrust load in some of the azimuthal locations, especially near 0° (360°) and 180° locations. Additionally, it underpredicts the lateral loads in certain azimuthal locations. The high-frequency variation in loads, in both thrust and lateral parked loads, is due to turbine dynamics (roll and pitch) in the floating condition. The dimensional and nondimensional plots show similar trends.
3.2.3 Floating tower base with wind and wave
We now examine the third configuration of the test, which is floating with both wind and waves. The turbine weight effect is also added with the fixed tower base parked load to calculate the parked load for the wind and wave case. A regular wave with a height of 0.155 m and a period of 1.61 s is used to measure the parked load in the floating tower base with wind and wave condition. And as the base is floating, it reflects a coupled effect due to wind, wave, and floating platform.

Figure 20Comparison between experimental and semi-numerical parked loads of the 3B turbine for the floating with wind and wave condition: (a) nondimensional loads, (b) dimensional loads.
The validation in the case of floating with wind and wave for the 3B turbine is shown in Fig. 20. It is observed that the tool cannot properly capture the dynamic nature of pitch and roll and respective dynamic thrust and lateral loads due to coupled wind, wave, and floating platform effects, although it does handle the static pitch and roll motions. A prediction of pitch and roll motions requires integrating aerodynamic, wave, hydrodynamic, platform, and mooring dynamic models. A code, such as WAMIT (Lee and Newman, 2006), or an open-source code like Capytaine (Ancellin and Dias, 2019) can be used to model the hydrodynamics and then coupled with mooring and aerodynamic models to predict the platform motion using an aero-hydro model (Gao et al., 2022). Such a model can be used for pre-test motion prediction. Here, the authors have restricted their study to the current semi-numerical parked load model and comparison with the experimental data. Overall, the semi-numerical tool predicts the magnitude of parked loads, azimuthal dependence on loads, and the effects of wind speed and solidity for all the wind–wave platform conditions well. Additionally, this tool accurately captures the tower shadow at the 180° azimuthal location.
Floating offshore VAWTs are showing promise for deepwater offshore locations as they offer several advantages including a lower center of gravity, thus improving stability and reducing the risk of overturning. However, some aspects in the design of floating VAWTs, including parked loads, which are comparable in magnitude to operating loads (Sakib and Griffith, 2022), are thus critical design loads, yet no studies have measured parked loads under floating conditions.
This study experimentally investigates parked loads on floating VAWTs in a wind–wave basin, aiming to provide insights on the factors influencing parked loads. Additionally, this study seeks to gather data to improve and validate a semi-numerical parked load estimation tool for floating VAWTs under both wind-only and wind-and-wave conditions that is based on a vortex aerodynamic model of the rotor and an analytical model of tower drag. Further, this model effectively captures the effects of tower shadow, azimuth dependence, and weight effects.
The study presents data on parked loads across varying wind speeds, solidity values, and wind–wave platform conditions, examining the impact of gravitational loads from tilting and the correlation between tilt angles and parked loads. Validation of the semi-numerical estimation tool is also included.
The findings highlight the significance of wind speed, solidity, azimuth dependence, and wind–wave platform conditions in determining parked loads for floating VAWTs. It was observed that VAWTs are subjected to substantial forces even in a stationary state, which necessitates robust structural designs to ensure their durability and safety.
The insights gained from this study underscore the importance of considering parked loads in the design phase of VAWTs. By incorporating validated parked load models into the design process, engineers can develop more resilient turbines that can withstand the stresses encountered during non-operational periods. This is particularly crucial for enhancing the longevity and reliability of VAWTs, thereby making them a more viable option for renewable energy generation in diverse settings.The summary of the main findings of the paper can be stated as follows.
-
Solidity (in terms of the number of blades) influences the parked loads. The load variation (range) decreases as the number of blades increases.
-
In floating conditions, average thrust load increases due to the gravitational load effect of turbine, while the amplitude of lateral load also increases.
-
The floating wind–wave case exhibits more noisy loads due to dynamic nature compared to the floating-wind-only case.
-
The UTD's semi-numerical parked load tool quite accurately estimates the parked loads for both locked and floating platform conditions. It effectively captures the average load magnitude, the load's azimuthal dependence, effects of wind speed, and number of blades. Tower shadow is also captured. However, this model is not formulated to predict the dynamic nature of pitch and roll motions and respective dynamic thrust and lateral loads due to coupled wind, wave, and floating platform effects, although it effectively captures the average loads.
In conclusion, this study has advanced our understanding of the experimental parked loads on VAWTs and their impact on turbine performance. The results provide valuable guidelines for designing and implementing floating VAWTs that are both efficient and resilient. Future research should focus on further refining these findings through long-term field studies and exploring innovative materials and design strategies to mitigate parked loads. By addressing these challenges, we can enhance the overall performance and adoption of VAWTs, contributing to the growth of sustainable wind energy solutions.
The CACTUS code for calculating the direction of the wind is available in the public CACTUS GitHub repository (https://github.com/sandialabs/CACTUS, CACTUS, 2025). The analytical drag load calculation code will be shared upon request to the corresponding author (D. Todd Griffith).
The data that support the findings of this study are available on reasonable request from the corresponding author (D. Todd Griffith).
This work was performed during the PhD research of MSH under the supervision of DTG as part of an Advanced Research Projects Agency–Energy (ARPA-E)-funded project named “A Low-cost Floating Offshore Vertical Axis Wind System”. MSH and DTG contributed to the analysis and interpretation of the data, and the paper was prepared by MSH with the help of DTG.
The contact author has declared that neither of the authors has any competing interests.
Any opinions, findings, and conclusions or recommendations expressed in this material are those of the authors and do not necessarily reflect the views of ARPA-E.
Publisher's note: Copernicus Publications remains neutral with regard to jurisdictional claims made in the text, published maps, institutional affiliations, or any other geographical representation in this paper. While Copernicus Publications makes every effort to include appropriate place names, the final responsibility lies with the authors.
This article is part of the special issue “NAWEA/WindTech 2024”. It is a result of the NAWEA/WindTech 2024, New Brunswick, United States, 30 October–1 November 2024.
The research presented herein was funded by the US Department of Energy Advanced Research Projects Agency–Energy (ARPA-E) under the ATLANTIS program with the project title “A Low-cost Floating Offshore Vertical Axis Wind System” associated with award no. DE-AR0001179. The authors are grateful for the support of the ARPA-E program and staff, as well as the project team.
This research has been supported by the Advanced Research Projects Agency–Energy (grant no. DE-AR0001179).
This paper was edited by Alessandro Bianchini and reviewed by two anonymous referees.
Ahsan, F., Griffith, D. T., and Gao, J.: Modal dynamics and flutter analysis of floating offshore vertical axis wind turbines, Renew. Energ., 185, 1284–1300, 2022. a, b
Ancellin, M. and Dias, F.: Capytaine: a Python-based linear potential flow solver, J. Open Source Softw., 4, 1341, https://doi.org/10.21105/joss.01341, 2019. a, b
CACTUS (Code for Axial and Cross-Flow TUrbine Simulation): sandialabs/CACTUS, GitHub [code], https://github.com/sandialabs/CACTUS, last access: 29 June 2025. a
Carmo, L., Bergua, R., Wang, L., and Robertson, A.: Validation of Local Structural Loads Computed by OpenFAST Against Measurements From the FOCAL Experimental Campaign, in: International Conference on Offshore Mechanics and Arctic Engineering, vol. 87851, V007T09A048, American Society of Mechanical Engineers, 2024. a
Cole, A., Fowler, M., Zangeneh, R., and Viselli, A.: Development of a New Federally Funded Wind/Wave/Towing Basin to Support the Offshore Renewable Energy Industry, in: SNAME American Towing Tank Conference, West Bethesda, Maryland, USA, D011S003R006, SNAME, 2017. a
Coquilla, R. V., Obermeier, J., and White, B. R.: Calibration procedures and uncertainty in wind power anemometers, Wind Eng., 31, 303–316, 2007. a
Fowler, M. J. L.: Floating Offshore-wind and Controls Advanced Laboratory Program: 1: 70-scale Testing of a 15 Mw Floating Wind Turbine, The University of Maine, 2023. a
Gao, J., Griffith, D. T., Sakib, M. S., and Boo, S. Y.: A semi-coupled aero-servo-hydro numerical model for floating vertical axis wind turbines operating on TLPs, Renew. Energ., 181, 692–713, 2022. a, b, c
Germanischer, L.: DNV Standard GL. IV – Rules and Guideline Industrial Services, Guideline for the certification of offshore wind turbines, Hamburg, http://www.gl-group.com/GLRenewables (last access: 22 October 2022), 2010. a
Goude, A. and Rossander, M.: Force measurements on a VAWT blade in parked conditions, Energies, 10, 1954, https://doi.org/10.3390/en10121954, 2017. a
Hossain, M. S., Mendoza, A. S. E., Ahsan, F., Griffith, D. T., Brownstein, I., Strom, B., and Frye, A.: Design of a Floating Vertical Axis Wind Turbine for Wind-Wave Basin Experiments, in: Journal of Physics: Conference Series, vol. 2767, 062007, IOP Publishing, 2024. a, b
Kuang, L., Su, J., Chen, Y., Han, Z., Zhou, D., Zhao, Y., Jiang, Z., and Bao, Y.: Flow characteristics and dynamic responses of a parked straight-bladed vertical axis wind turbine, Energ. Sci. Eng., 7, 1767–1783, 2019. a
Lee, C. and Newman, J.: Wamit® user manual, versions 6.3, 6.3 PC, 6.3 s, 6.3 S-pc, Chestnut Hill, MA, WAMIT, Inc., Cambridge, MA, 2006. a, b
Le Fouest, S. and Mulleners, K.: The dynamic stall dilemma for vertical-axis wind turbines, Renew. Energ., 198, 505–520, 2022. a
Lu, W.: Aerodynamic Modelling of Vertical Axis Wind Turbine Struts: Using the Lifting Line Method CACTUS, T.U. Delft Thesis, 2020. a
Matha, D., Cruz, J., Masciola, M., Bachynski, E. E., Atcheson, M., Goupee, A. J., Gueydon, S. M., and Robertson, A. N.: Modelling of Floating Offshore Wind Technologies, Floating Offshore Wind Energy: The Next Generation of Wind Energy, edited by: Cruz, J. and Atcheson, M., Springer International Publishing, 133–240, https://doi.org/10.1007/978-3-319-29398-1, 2016. a
Murray, J. and Barone, M.: The development of cactus, a wind and marine turbine performance simulation code, in: 49th AIAA Aerospace Sciences Meeting including the New Horizons Forum and Aerospace Exposition, 4–7 Januray 2011, Orlando, Florida, 147, https://doi.org/10.2514/6.2011-147, 2011. a
Ottermo, F., Eriksson, S., and Bernhoff, H.: Parking Strategies for Vertical Axis Wind Turbines, ISRN Renew. Energ., 2012, 1–5, https://doi.org/10.5402/2012/904269, 2012. a
Parker, A.: Development and Testing of a 1: 70 Scale Model Wind Turbine of the IEA Reference 15 MW Floating Offshore System, The University of Maine, 2022. a
Paulsen, U. S., Madsen, H. A., Hattel, J. H., Baran, I., and Nielsen, P. H.: Design optimization of a 5 MW floating offshore vertical-axis wind turbine, Energ. Proced., 35, 22–32, 2013. a
Rezaeiha, A., Montazeri, H., and Blocken, B.: Towards optimal aerodynamic design of vertical axis wind turbines: Impact of solidity and number of blades, Energy, 165, 1129–1148, 2018. a
Robertson, A.: FOCAL Campaign IV: Integrated System Control: Turbine+ Hull, Tech. rep., Pacific Northwest National Lab.(PNNL), Richland, WA (United States, 2023. a
Sakib, M. S. and Griffith, D. T.: Parked and operating load analysis in the aerodynamic design of multi-megawatt-scale floating vertical-axis wind turbines, Wind Energ. Sci., 7, 677–696, https://doi.org/10.5194/wes-7-677-2022, 2022. a, b, c, d, e, f, g, h, i, j, k, l
Shelley, S. A., Boo, S., Kim, D., and Luyties, W. H.: Comparing levelized cost of energy for a 200 mw floating wind farm using vertical and horizontal axis turbines in the northeast usa, in: Offshore Technology Conference, Offshore Technology Conference held in Houston, Texas, USA, 30 April–3 May 2018, https://doi.org/10.4043/28700-MS, D031S040R007, OTC, 2018. a
Sirnivas, S., Musial, W., Bailey, B., and Filippelli, M.: Assessment of offshore wind system design, safety, and operation standards, Tech. rep., National Renewable Energy Lab.(NREL), Golden, CO (United States), 2014. a
Strickland, J., Webster, B., and Nguyen, T.: Vortex model of the Darrieus turbine: an analytical and experimental study, NASA STI/Recon Technical Report N, 80, 25887, 1980. a