the Creative Commons Attribution 4.0 License.
the Creative Commons Attribution 4.0 License.
 | 07 Jul 2025
Non-proportionality analysis of multi-axial fatigue stress histories in trailing edge adhesive joints of wind turbine rotor blades
Claudio Balzani
Pablo Noever Castelos
The dynamic response of wind turbine rotor blades can result in multi-axial, non-proportional stress histories in the adhesive joints. These are not properly considered in current design guidelines and standards. In this paper, the concept of non-proportionality factors is utilized for the quantification of the degree of non-proportionality. A novel formulation is proposed and verified, followed by its application to the analysis of trailing edge adhesive joints of three different blade designs with varying blade sizes. Two simple fatigue analysis concepts, one based on global equivalent stresses and the other on the search for a critical plane, are evaluated with respect to their ability to account for multi-axial, non-proportional stress time series.
A clear correlation of the degree of non-proportionality with the blade size was not found, as the blade response depends on not only the turbine size but also the blade design philosophy. A remarkable degree of non-proportionality was observed for all three blades. The fatigue damage criteria employed in this study revealed that the critical-plane approach can deal with non-proportional, multi-axial stress time series and therefore is more precise when non-proportionality is involved. The global equivalent stress approach seems to provide conservative predictions. However, there are implications from the literature that global equivalent stress approaches can result in non-conservative estimates under specific circumstances, so further research including validation of appropriate models is necessary for final conclusions.
- Article
(6319 KB) - Full-text XML
- BibTeX
- EndNote


During a wind turbine’s lifetime, rotor blades and their adhesive joints are subjected to multi-axial stress states. According to current design guidelines for wind turbine rotor blades (e.g., DNV GL, 2015), fatigue analyses of adhesive joints have to take these into account. However, regulations lack clear descriptions of the associated analysis procedures. Picking up research challenges formulated by van Kuik et al. (2016), van Kuik and Peinke (2016), and Veers et al. (2019, 2023), the question of whether failure of adhesive joints exposed to multi-axial fatigue loads can be predicted well arises. A thorough understanding of the nature of stress states in the adhesives throughout their lifetime is inevitable for choosing (or developing) an appropriate fatigue analysis framework and for designing validation test methods.
1.1 Fatigue analysis concepts
Fatigue analyses may be based on global stress–strength relationships (Rankine, 1857; Beltrami, 1885; von Mises, 1913; Schleicher, 1926; Drucker and Prager, 1952; Stassi-D’Alia, 1967; Raghava et al., 1973; Christensen, 2004). Some of these have already been applied to rotor blade adhesives (Noever Castelos and Balzani, 2016a; Antoniou et al., 2018; Eder et al., 2020) and take into account the coupling between different three-dimensional stress components. They translate the stress tensor to the scalar-valued global equivalent stress, which is easy to handle in a cycle counting scheme such as rainflow counting (Endo et al., 1974; Downing and Socie, 1982; Rychlik, 1987; Lee and Tjhung, 2012). However, the transition from an engineering stress space to an equivalent stress space must thoroughly consider potential tension–compression asymmetries, which are present in epoxy-based adhesives (Wentingmann et al., 2022). Moreover, the method is only valid for proportional stress histories (Kuhn et al., 2023). In this case, the major principal stress direction does not change with time, but the amplitude may vary (Stephens et al., 2001).
The loads acting on rotor blades are strongly dynamic (Söker, 2013; Liu et al., 2017) and non-linear (Manolas et al., 2015; Noever Castelos and Balzani, 2016b). Edgewise bending is governed by the rotor blades' inertia and is mostly deterministic and harmonic, with an excitation frequency of the rotor rotation speed and multiples thereof. Flapwise bending, however, is caused by aerodynamic forces, which are more stochastic in the time domain due to the turbulent wind inflow (White and Musial, 2004). The normal stress in the spanwise direction is usually dominant in trailing edge adhesive joints and is mainly caused by edgewise bending (Noever Castelos and Balzani, 2016a). The flapwise bending contributes to the normal stress to a minor extent (Bak et al., 2013) but is, besides torsion, predominantly responsible for shear stresses in the trailing edge adhesive joint. Since the edgewise and flapwise loads generally exhibit a phase shift, the share of each stress component in the three-dimensional stress tensor changes over time. Consequently, the orientations of the principal stresses change as well, which, by definition (e.g., Socie and Marquis, 2000), results in non-proportional stress time series. These cannot be captured by global equivalent stress approaches (Fatemi and Shamsaei, 2011; Kuhn et al., 2023).
A physically more meaningful way is to apply the critical-plane approach (Socie and Marquis, 2000; de Castro and Meggiolaro, 2016; Deng et al., 2022, 2023). Therein, the damage calculation is restricted to the plane on which a physical crack will appear, which is called the critical plane. Such concepts evaluate local equivalent stress functions that are formulated on the critical plane and take into account the normal stress perpendicular and the two shear stresses (or the resulting shear stress) parallel to such a plane. However, the orientation of the critical plane may change over time, which is linked to the orientation change in the first principal stress (Anes et al., 2014). It is thus not known a priori in non-proportional stress histories and needs to be a result of the fatigue analysis. A computationally efficient method for the determination of the critical-plane orientation was proposed by Wentingmann et al. (2018).
1.2 Quantification of non-proportionality
To quantify the degree of non-proportionality in the stress histories, non-proportionality factors denoted by fNP are commonly used. These are scalar-valued magnitudes with values between 0 (for purely proportional stress histories) and 1 (for purely non-proportional stress histories). Socie and Marquis (2000) presented a selection of approaches to calculate a non-proportionality factor. They have in common the fact that each time instance in a stress time series is plotted in the stress domain. The conglomeration of all these points forms a body in the six-dimensional stress space if the whole stress tensor is considered and reduces to fewer dimensions if stress components are neglected.
One approach is to consider the non-proportionality factor as the aspect ratio of a minimum-size convex surface surrounding this body. This convex surface is an ellipsis in the two-dimensional case. The concept is visualized for three different artificial 2D cases in Fig. 1, where the shear stress τxy is combined with the normal stress σx. The convex hull method is easy to apply in the 2D stress space. However, it becomes more complicated with increasing dimension, as one needs to consider ellipsoids in the 3D stress space or hyper-ellipsoids in the general case (Zouain et al., 2006). Besides, the non-physical and rather geometric nature of this method is linked with a loss of information on the cyclicity of the stress time series due to the generalizing hull and can lead to poor predictions of fNP depending on the load path complexity (Meggiolaro and de Castro, 2012).
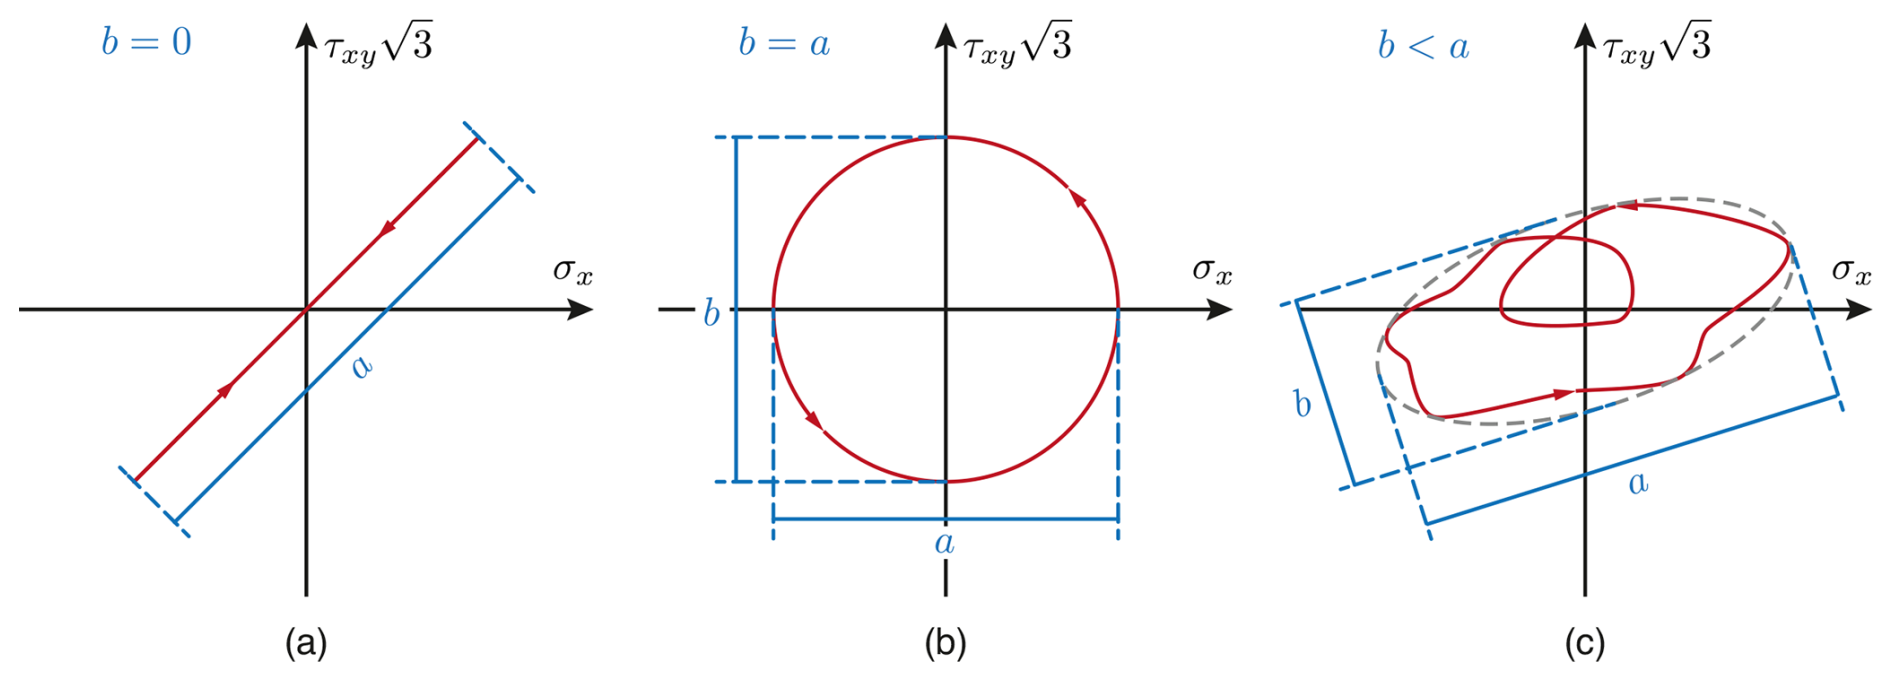
Figure 1Minimum size convex hull surrounding the body spanned by the stress states at each time instance of a stress time series in the two-dimensional case (reproduced from Socie and Marquis, 2000): (a) proportional stress time series with (expressed by a straight line, i.e., b=0); (b) stress time series with a 90° phase shift and (expressed by a circle, i.e., a=b); and (c) arbitrary time series with , as b<a.
Kanazawa et al. (1979) presented a different approach, estimating fNP by means of a rotation factor, which is defined by the inverse of the ratio between the maximum shear strain range and the shear strain with an orientation of 45° to the maximum shear strain range. This factor represents the ellipticity of the load path in the bi-axial τxy−σx stress space and depends on both the phase angle and the amplitude (Socie and Marquis, 2000). Following a similar idea, Itoh et al. (1995) evaluated the temporal integral of the product of the largest principal strain at each time instance (denoted by ε1) and the angular deviation between ε1 and its time-related maximum in the time series. This approach, originally introduced for 2D load paths, was later extended to a 3D representation (Itoh et al., 2013) but is not applicable to the general six-dimensional case.
Bishop (2000) introduced an analogy to mass moments of inertia. Using Mandel notation, the state of stress for each time instance was mapped as a point in the six-dimensional stress space. The rectangular moment of inertia (RMOI) matrix of the accumulation of these points for a complete time series was calculated with respect to the mean stress. The non-proportionality factor was then defined by the square root of the ratio between the largest and second-largest eigenvalue of the RMOI matrix. Meggiolaro et al. (2016) concluded the following drawbacks of this approach: (i) the Bishop non-proportionality factor is formulated in the stress space instead of in a more appropriate plastic strain space; (ii) the 6D formulation implicitly assumes an influence of the hydrostatic pressure, which is wrong for materials with pressure-insensitive yield functions; (iii) the rectangular moments of inertia are calculated with respect to a mean, which produces errors for certain load paths; and (iv) the Bishop non-proportionality factor gives the wrong results for tension–torsion load paths, where it describes a circle in a σii versus diagram with j≠k and not the well-known 90° phase shift with a circle in the σii versus diagram. Meggiolaro and de Castro (2014) represented the stresses in a 5D deviatoric subspace and calculated the RMOI matrix of the resulting 5D stress path independently of a mean. In this way, the aforementioned drawbacks were eliminated. This approach showed good agreement with experimental results for metals (Meggiolaro and de Castro, 2014). However, polymers are sensitive to the hydrostatic pressure (Adams, 2005; Gilat et al., 2005; Hu et al., 2003; Beber et al., 2017). A combination of the approaches from Bishop (2000) and Meggiolaro and de Castro (2014) is thus proposed in this work to adapt the non-proportionality factor to a polymeric adhesive.
1.3 Fatigue of rotor blade trailing edges
A variety of damage types is observed in rotor blades in operational settings (Katsaprakakis et al., 2021; Boopathi et al., 2022). The following ones are found to occur predominantly on trailing edges: longitudinal cracks along the adhesive joint and transverse cracks within the adhesive and the surrounding laminate structures (Ataya and Ahmed, 2013).
The longitudinal cracks can manifest as a cohesive crack through the adhesive or as a detachment of the adhesive from the substrates. In some cases, these phenomena may occur as a combination of both possibilities. Such cracks are caused, for instance, by peel stresses in the adhesive resulting from a pumping motion of the trailing edge panels (Eder et al., 2014), which is associated with the warping of cross-sections in the cross-sectional plane and is also called blade breathing (Balzani and Gebauer, 2023). To characterize the peel strength and toughness, tests were conducted at the coupon or small-scale structural level (Eder and Bitsche, 2015; Fan et al., 2024). Rosemeier et al. (2020) put forth a pragmatic methodology for evaluating peel stresses in rotor blade adhesive joints. In addition to blade breathing, geometrically non-linear undulating deformations of the trailing edge associated with the transition to buckling may occur in a region around the maximum chord length. Such deformation can also result in the formation of longitudinal cracks in the trailing edge adhesive joint due to a mixture of shear and peel stresses. This type of damage was observed in full-scale blade tests and was able to be reproduced in numerical simulations (Haselbach and Branner, 2015; Haselbach et al., 2016; Haselbach and Branner, 2016; Haselbach, 2017).
Subsequently, a series of subcomponent tests were conducted in which trailing edge segments were subjected to eccentric axial compression, which was representative of trailing edges in a blade, in order to induce buckling (Lahuerta et al., 2018; Chen et al., 2019a, b; Wang et al., 2021; Wu et al., 2023). The tests revealed that as a consequence of the trailing edge buckling, de-bonding in the adhesive joint and subsequent cracks in the trailing edge panels occurred, mostly on the suction side and particularly in the sandwich core. Numerical simulations using the finite-element method were able to represent the damage behavior observed during most of the tests (Lahuerta et al., 2018; Chen et al., 2019a, b). (Bangaru et al., 2023) have proposed an analytical method to describe de-bonding of a trailing edge adhesive joint under simplifying assumptions, which is useful for quick assessments without detailed finite-element simulations. However, all the aforementioned studies on subcomponent level were limited to static loads.
Transverse cracks were observed in operating wind turbines (Ataya and Ahmed, 2013) and in full-scale rotor blade tests (Rosemeier et al., 2022b). In terms of fatigue, the majority of analysis was conducted numerically (Rosemeier et al., 2019a, b). It can be concluded that these cracks are a consequence of the predominant occurrence of cyclic longitudinal strains in the trailing edge, which results in the generation of high longitudinal normal stresses in the adhesive. These stresses exceed the fatigue-related load-carrying capacity of the adhesive over time. However, it should be noted that thermal residual stresses can also exert a significant influence on the formation of cracks. It has been demonstrated that the exclusion of thermal residual stresses can result in an underestimation of fatigue damage by up to 30 %–40 % (Antoniou et al., 2020). It was reasonably deduced that the thermal residual stresses are responsible for the majority of the mean stress, while the mechanical loads resulting from turbine operation are responsible for the majority of the stress amplitudes (Rosemeier et al., 2022b). Furthermore, it was highlighted that in exceptional circumstances, thermal residual stresses can result in the formation of transverse cracks even during the manufacturing process (Rosemeier et al., 2022a). In the aforementioned publications, however, the thermal residual stresses were calculated under simplifying assumptions. Relaxation, for instance, which has the potential to significantly reduce the thermal residual stresses, necessitates intricate characterization and has yet to be addressed. Furthermore, it is not possible to determine thermal residual stresses directly through experimentation; instead, they must be recalculated based on the diversions of deformation measurements. This was demonstrated in coupon experiments (Jørgensen et al., 2019). However, the corresponding deformations of a rotor blade trailing edge are likely to be very small and therefore challenging to measure, which complicates the validation of thermal residual stresses in a full-scale rotor blade structure.
The investigations into the occurrence of transverse cracks, as previously referenced, were conducted utilizing global equivalent stresses in order to account for the interactions between stress components. As previously stated, these methods do not sufficiently address non-proportionality in the stress time series. The topic of non-proportional fatigue in wind turbine rotor blades has been explored by several researchers (Vassilopoulos, 2013; Hu et al., 2016; Rubiella et al., 2018; Hu et al., 2020). However, the subject has not been extensively investigated yet. The aforementioned publications are limited in scope, focusing exclusively on non-proportional fatigue in the composite laminate components of wind turbine blades and neglecting fatigue damage in adhesive joints. There are very few publications that specifically investigate non-proportional fatigue in trailing edge adhesive joints (Balzani et al., 2018; Wentingmann et al., 2018). However, a comprehensive analysis of the non-proportionality characteristics in the adhesive joint was not conducted. To the best of the authors' knowledge, there is no existing publication that studies the degree of non-proportionality in the stress time series of a trailing edge adhesive joint.
1.4 Research objectives
The objective of this study is to address the aforementioned gap in knowledge. The underlying hypothesis is that a significant amount of non-proportionality can occur in stress time series of trailing edge adhesive joints. The aims are to thoroughly analyze the stress time series that serve as the basis for calculating the fatigue damage in adhesive joints and to derive an equivalent value for their lifespan. This fundamental knowledge is crucial for choosing an appropriate fatigue analysis framework during the design of wind turbine rotor blades. Another aim of this paper is an initial comparison of the qualitative difference in fatigue damage estimates based on either a global equivalent stress-based concept or a critical-plane-based concept. The overall methodology employed in this study is outlined in the following section.
In this section, the methods used in this paper are described. In the following subsections, the overall methodology is summarized, the mathematical formulation of a non-proportionality factor suitable for epoxy-based adhesives is derived, the application examples are outlined, and the overall strategy for finite-element modeling of the blades under investigation is presented.
2.1 Methodology
For the quantification of the degree of non-proportionality in the adhesive, the concept of non-proportionality factors is employed. The mathematical formulation of the approach used in this study is derived in Sect. 2.2. A novel non-proportionality factor is proposed that combines two existing formulations. The main benefit is that the new formulation accounts for the dependency of the fatigue behavior of an epoxy-based adhesive on the hydrostatic stress state. The new non-proportionality factor is verified using numerical examples from the literature.
Application examples for the analyses are then selected in Sect. 2.3. Three blades are considered, two of which have a similar size, and the third is considerably smaller. The smaller blade has a pre-sweep in the rotor area to introduce a geometrical bend–twist coupling. The sweep is supposed to introduce a higher portion of shear stresses in the adhesive due to torsion and thus a higher degree of non-proportionality. The blades were selected because the first two are similar in size and the third is significantly smaller, offering the possibility of comparing different blade sizes and design philosophies.
The methodology for the calculation of non-proportionality factors consists of three steps: (i) determination of loads through turbine simulations, (ii) calculation of 3D stress tensors in the adhesive, and (iii) evaluation of the degree of non-proportionality by means of the non-proportionality factor. The loads analyses are limited to the design load case power production (DLC 1.2) according to the International Electrotechnical Commission (IEC) standard 61400-1 (International Electrotechnical Commission, 2019). The blade loads extracted, which are internal forces and moments according to beam theory, are transformed into 3D stress time series in the adhesive, as these are the required input for the non-proportionality factor. The transfer was done via 3D finite-element simulations of each blade and application of external loads according to a methodology that is described in Noever Castelos and Balzani (2016b). The stress time series are used to calculate the non-proportionality factor in the finite elements representing the adhesive at different wind speeds.
The distribution of the non-proportionality factor along the blade is then investigated as a function of the wind speed. The distribution of the non-proportionality factor in the cross-sectional direction is also discussed, and a wind-speed-weighted mean non-proportionality factor is introduced for comparison between the different blades. To study the impact of the choice of the general fatigue analysis concepts described in Sect. 1.1 on the fatigue damage estimate, one representative of each concept is chosen, and a fatigue damage analysis is executed. The results of both concepts are compared by analyzing the difference in fatigue damage in relation to the degree of non-proportionality.
An attempt to derive conclusions from the comparisons is made at the end of the paper.
2.2 Mathematical formulation of the non-proportionality factor
For the quantification of non-proportionality, we follow the concept of a scalar-valued non-proportionality factor fNP as outlined in the introduction. We start the derivation of a mathematical formulation with the concept of Bishop (2000), who introduced an analogy to mass moments of inertia. Mandel notation is used to replace the symmetric stress tensor, whose metric is expressed by a 3×3 matrix, with a six-dimensional vector σM∈ℝ6 according to
The state of stress for a given time instance can be mapped as a point in the six-dimensional stress space. The collection of these points for a complete stress time series, i.e., the accumulation of such points for all time instances along a time series, results in a six-dimensional body, which is referred to as the stress body in the following. The rectangular moment of inertia (RMOI) matrix of the stress body is denoted by I∈ℝ6 and is calculated using the expression
Herein, the RMOI matrix is calculated with respect to the mean stress , which is determined by the relationship
Provided that represents the Euclidean distance between two time steps, L reflects the complete Euclidean arc length of the stress path Σ that connects all points of the stress body in chronological order. Calculation of the n eigenvalues λi of the RMOI matrix I and sorting them in decreasing order, i.e., , yields the non-proportionality factor defined by
see Bishop (2000). A reformulation was introduced by Meggiolaro and de Castro (2014), in which the stresses are represented in a 5D deviatoric subspace given by
where
In contrast to Eq. (2), the RMOI matrix I∈ℝ5 of the 5D stress path Σ is calculated independently of a mean and is given by the expression
The non-proportionality factor fNP is then calculated according to Eq. (4). This reformulation overcomes some general deficiencies of Bishop's formulation identified by Meggiolaro et al. (2016): it represents the plastic strain space, it disregards the hydrostatic component, the RMOI matrix is independent of a mean, and a circle in the σ versus diagram is recognized as such. It thus shows good agreement with experimental results for metals (Meggiolaro and de Castro, 2014). However, polymers, such as the epoxy-based adhesives considered in this study, are sensitive to the hydrostatic pressure (Adams, 2005; Gilat et al., 2005; Hu et al., 2003; Beber et al., 2017). That is accounted for in Eq. (2) but not in Eq. (7). However, the RMOI matrix should not be related to a mean because that produces errors for certain load paths. We thus redefine
In the latter expression, we combine the advantages of Eqs. (2) and (7) by omitting the mean stress and including the full stress tensor in Mandel notation in order to account for the hydrostatic pressure. Hence, the problem that a 90° phase shift path is not represented by a circle in the σ versus diagram still exists. However, we assume linear elastic material behavior of the adhesive when transforming load time series into stress time series, as described in Noever Castelos and Balzani (2016b). A plastic strain path representation is thus not necessary. The non-proportionality factor fNP is still computed following Eq. (4).
In order to compare the three approaches described above, 20 different synthetic stress paths are evaluated; see Fig. 2. The choice of these paths is discussed in Itoh et al. (1995) and Meggiolaro and de Castro (2014). The characteristics of the underlying stress histories and the corresponding test case numbers are summarized in Table 1. The first 15 paths were taken from Itoh et al. (1995) and consider general factors like different or rotating principal stress directions, full reversed loadings, or step length influences. From Meggiolaro and de Castro (2014), five additional critical paths were extracted, addressing, e.g., a 90° phase shift or the influence of the mean stress.
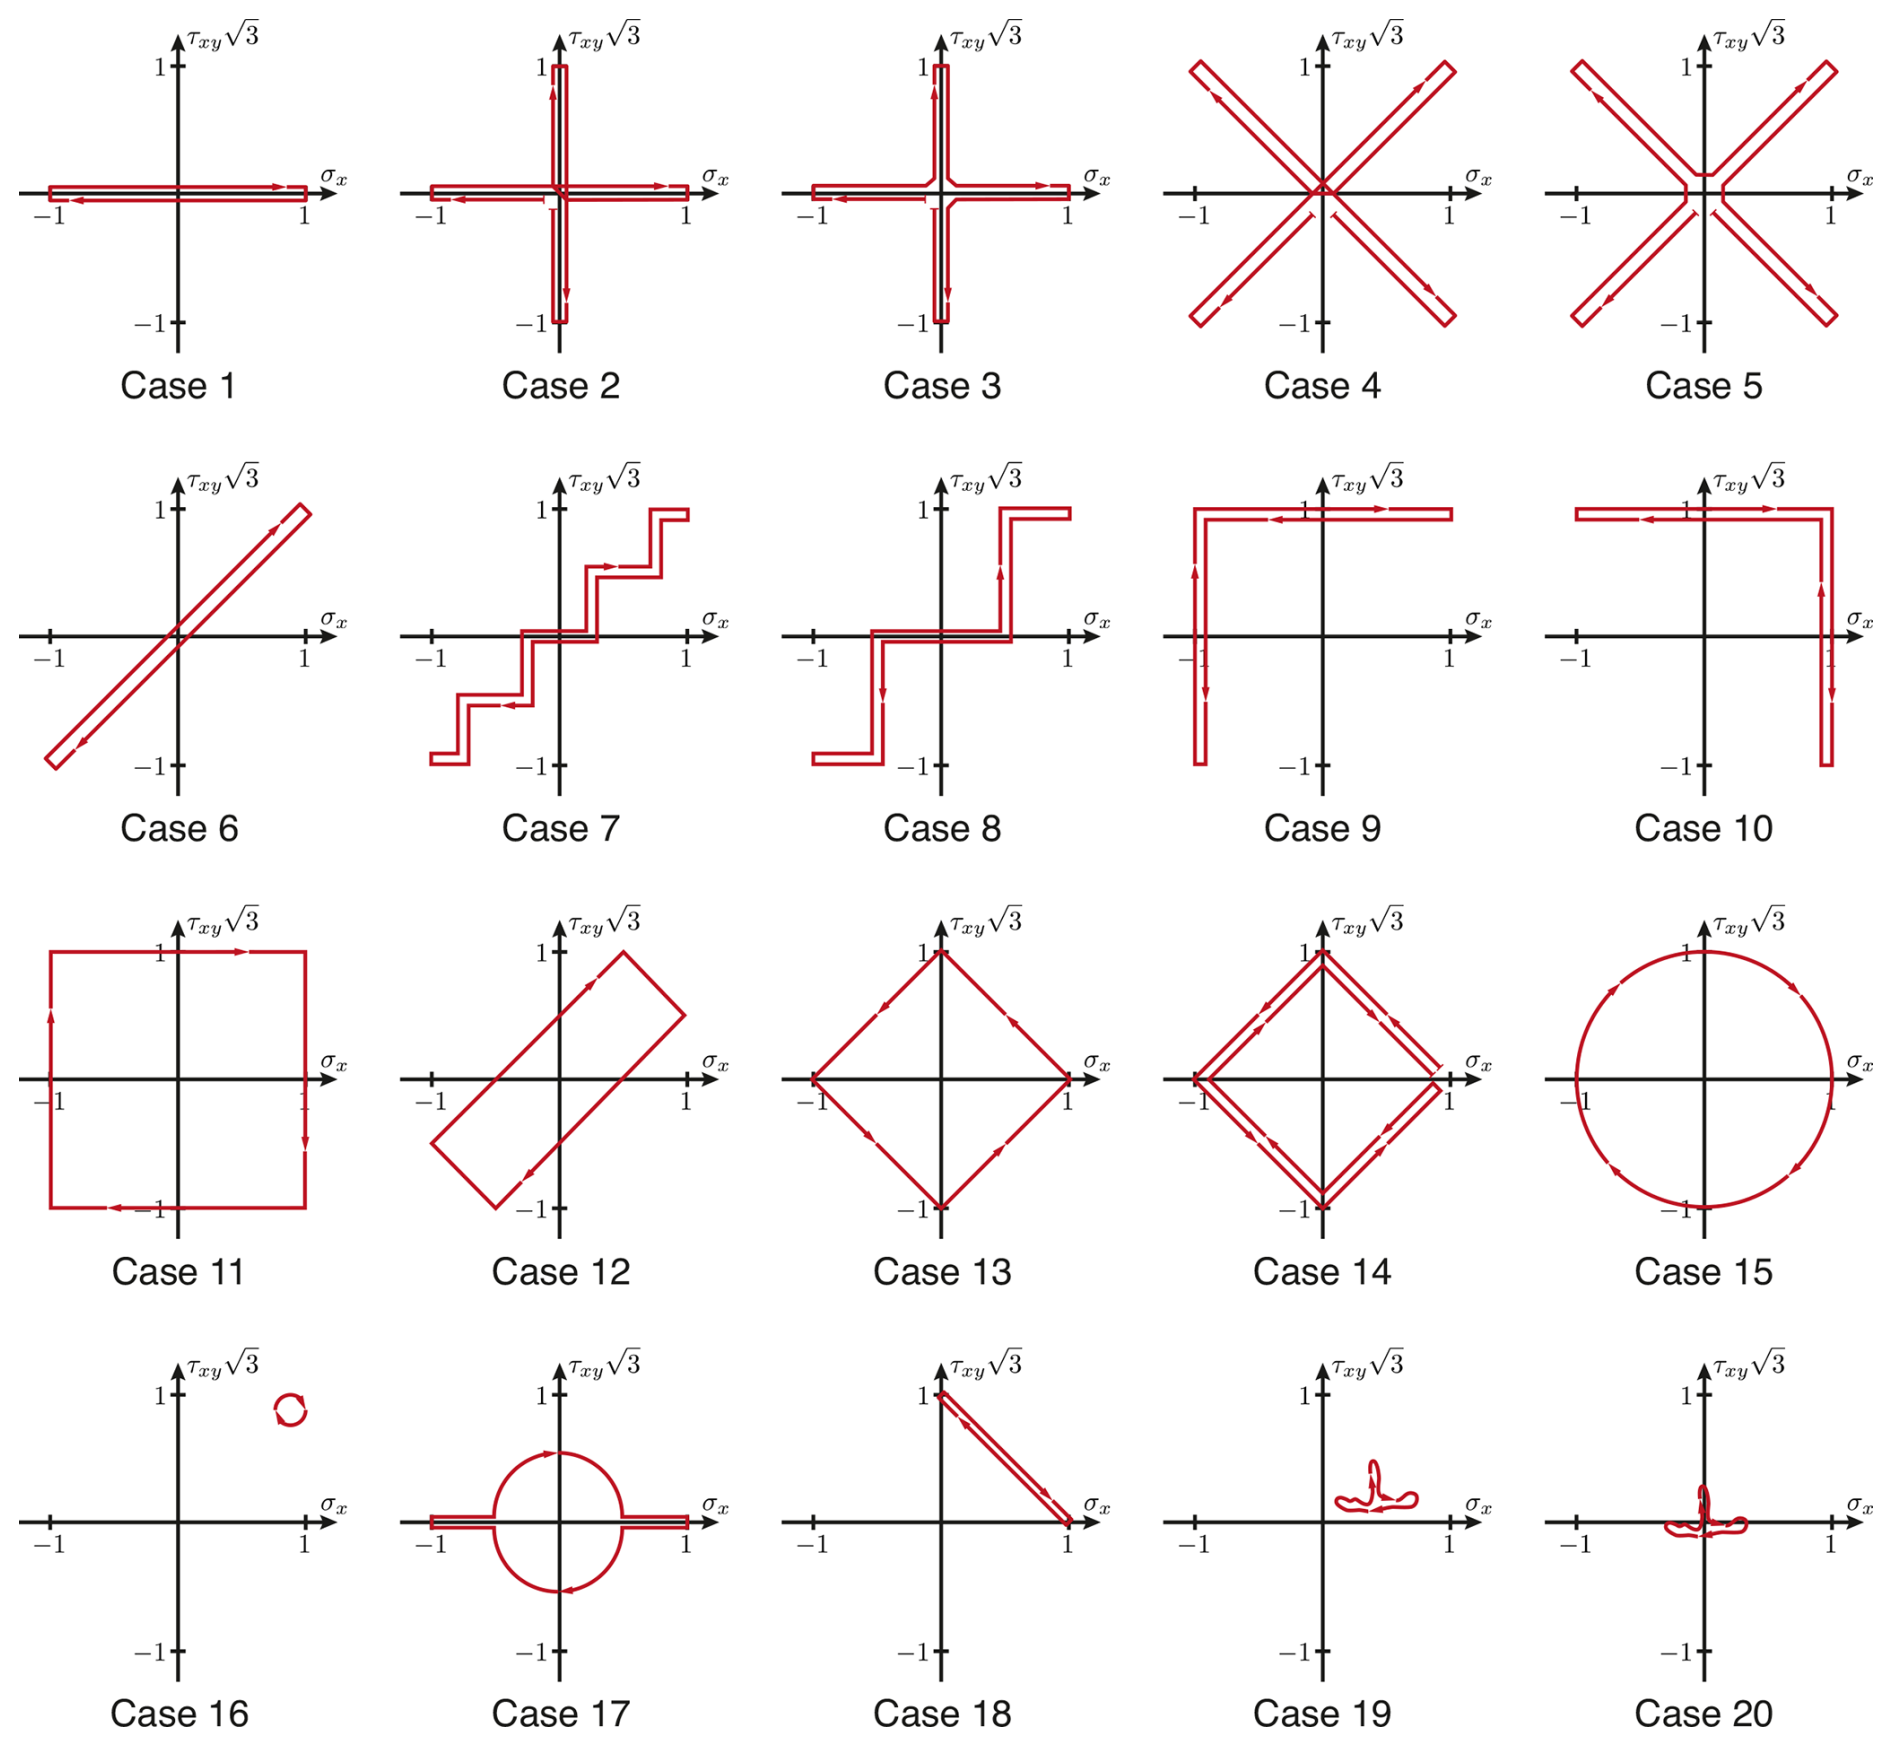
Figure 2Load history test cases used for comparison of the non-proportionality factor approaches, extracted and reproduced from Itoh et al. (1995) and Meggiolaro and de Castro (2014).
Table 1Stress history characteristics of the 20 test cases applied. Test cases are taken from Itoh et al. (1995) and Meggiolaro and de Castro (2014) and are plotted in Fig. 2.
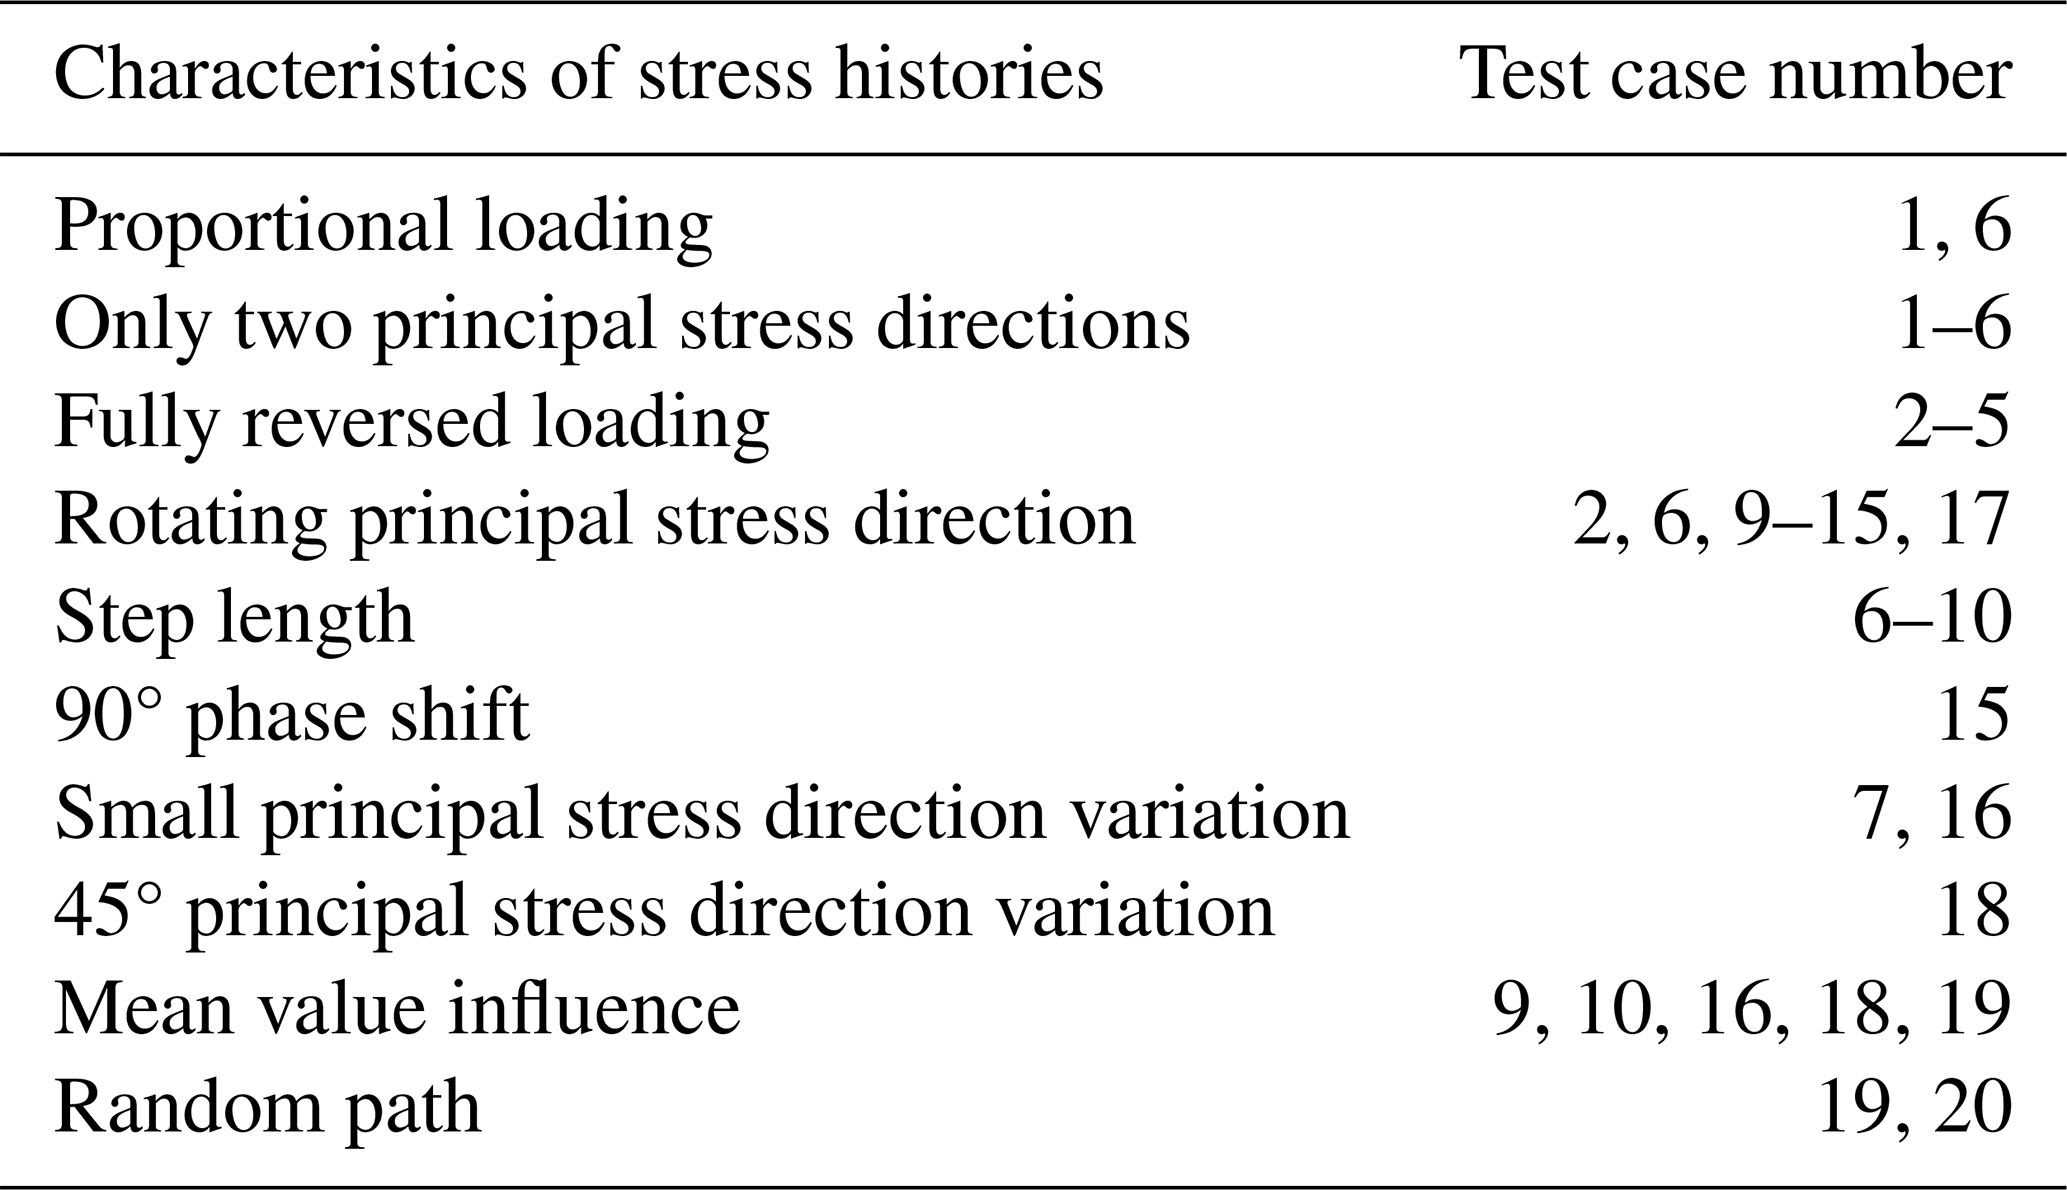
Table 2Comparison of the non-proportionality factors computed for the stress histories shown in Fig. 2 according to Bishop (2000), Meggiolaro and de Castro (2014), and the approach proposed in this paper.
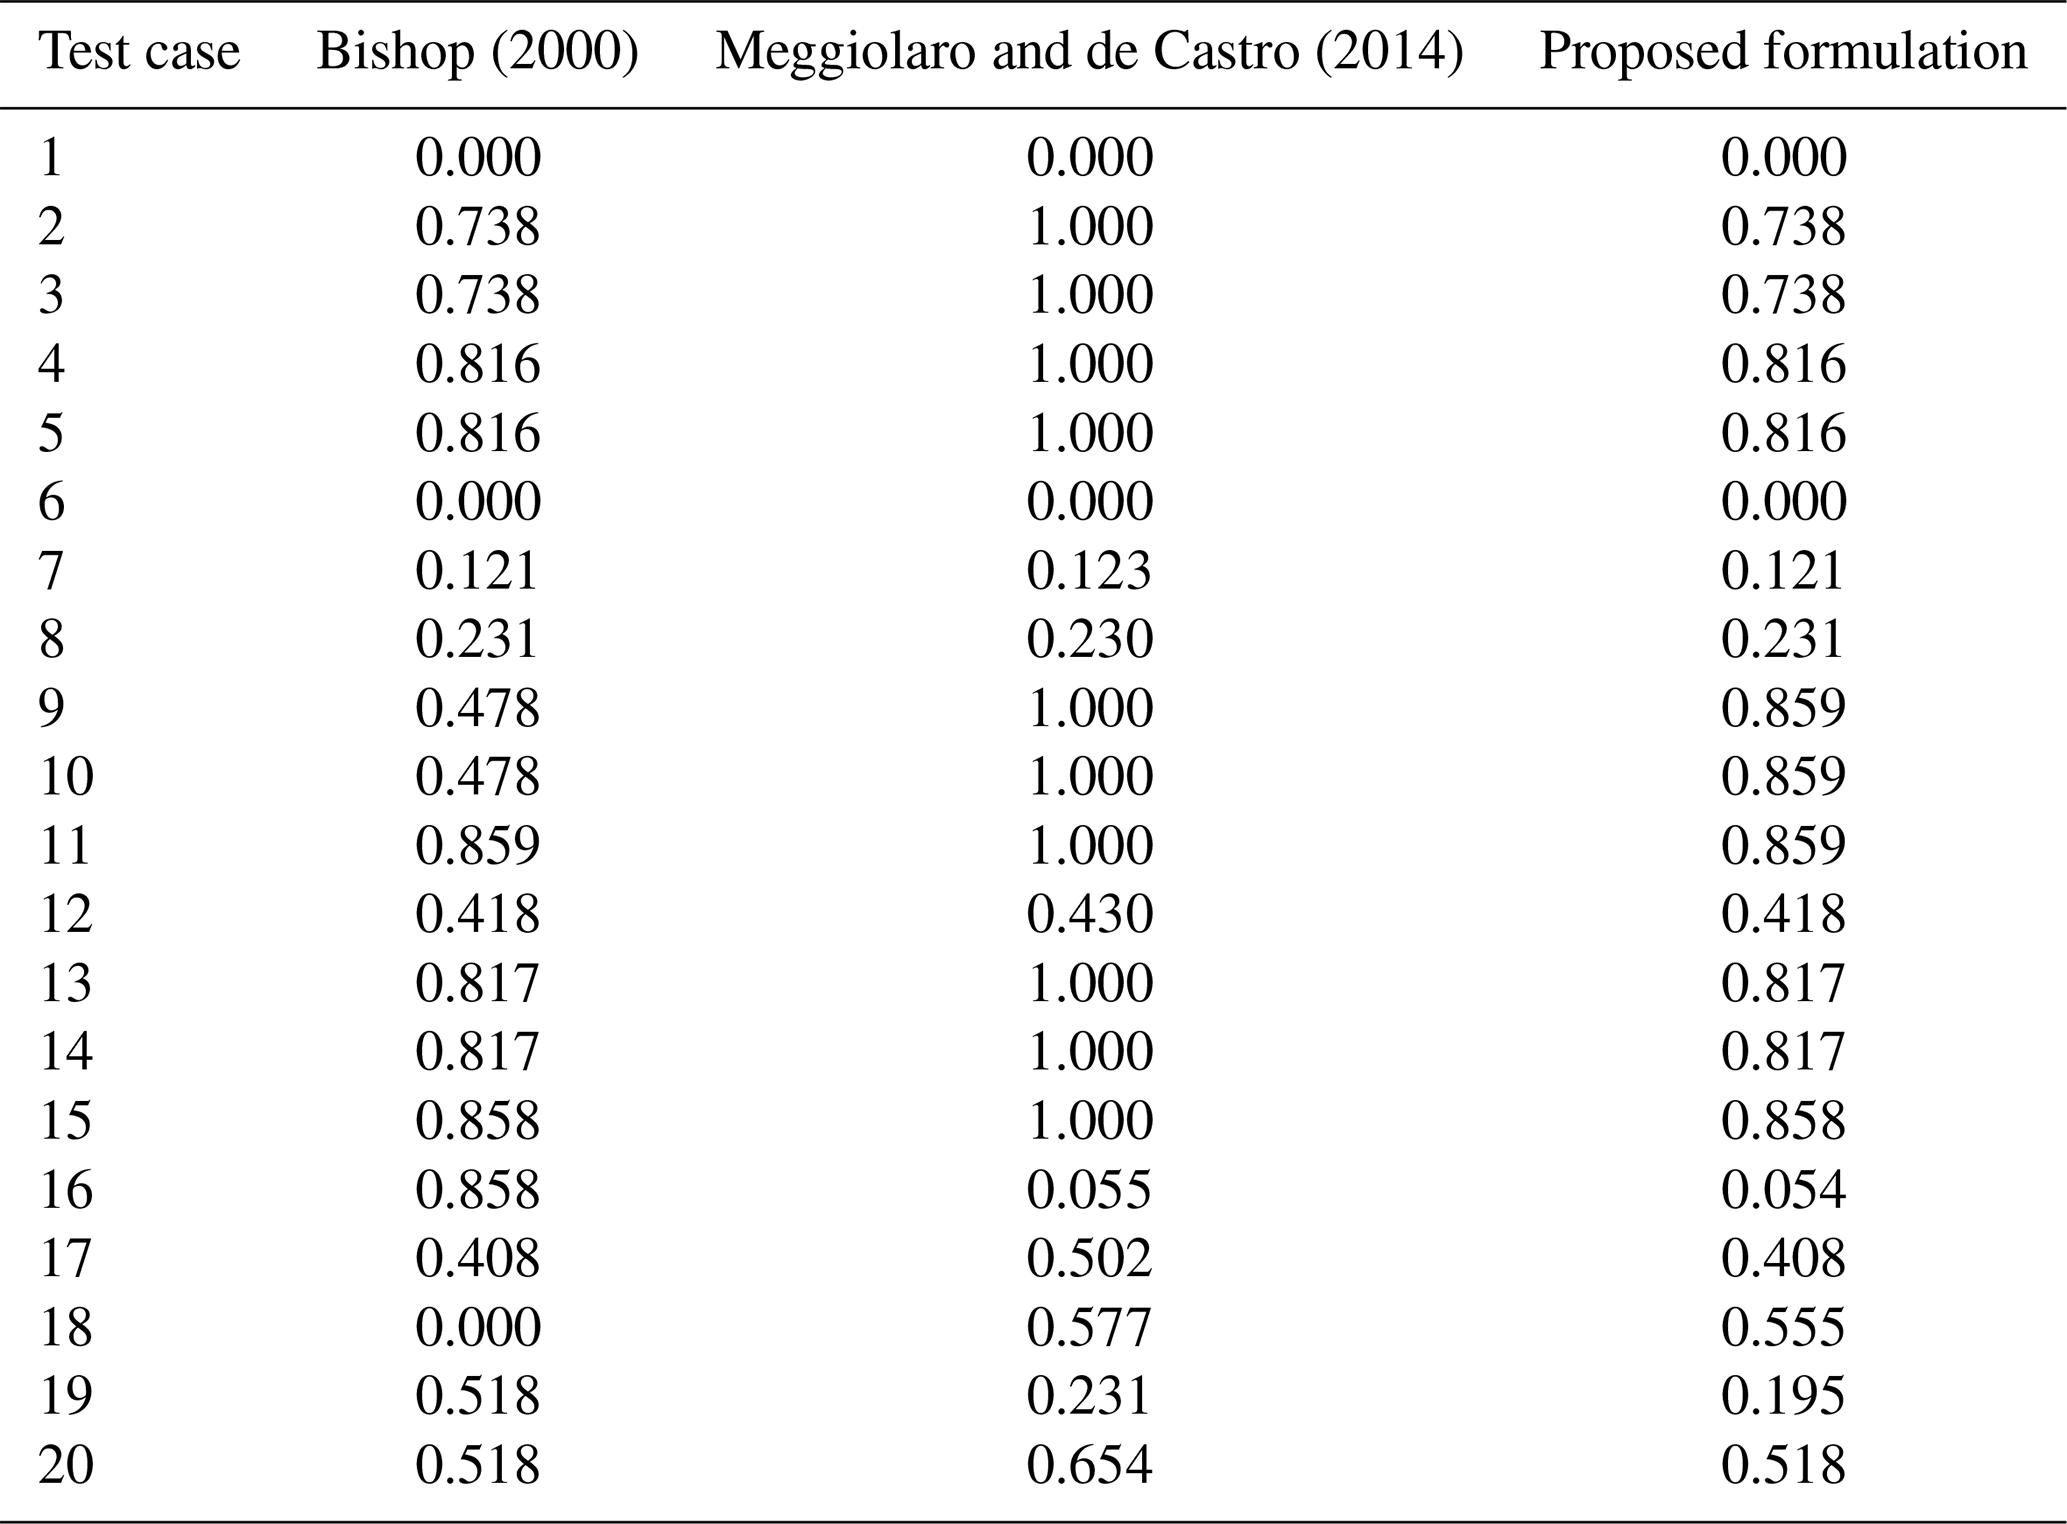
Table 2 shows computational results of the fNP test cases for the approaches according to Bishop (2000) and Meggiolaro and de Castro (2014), as well as the formulation proposed in this paper. These show that the derived method behaves in exactly the same way as the approach from Bishop (2000) for all load paths that are symmetric to the origin. Similarly to Meggiolaro and de Castro (2014), it correctly predicts a nearly proportional stress path of fNP=0.054 for test case 16, where the formulation of Bishop (2000) recognizes an ellipsis in the Mandel notation around a mean value and computes the same value as for test case 15 (fNP=0.858). This difference also becomes clear for the random loading centered on the origin (test case 20) compared to test case 19, where an offset was introduced. Test case 18 provokes the same problem as Bishop's approach (Bishop, 2000) considering the mean value but with the result that Eq. (2) only leads to one non-zero eigenvalue and thus to fNP=0, which represents proportional loading. However, this path is characterized by a 45° variation in the principal stress direction. For this stress path, the method proposed in this work yields fNP=0.555, reflecting a similar value to the approach of Meggiolaro and de Castro (2014). In general, the non-proportionality factor proposed in this paper computes the same values as Bishop's approach for stress paths without mean values (Bishop, 2000) and tends to result in the formulation of Meggiolaro and de Castro (2014) for non-zero mean values. However, there is still some discrepancy compared to Meggiolaro's approach (Meggiolaro and de Castro, 2014) due to the different representation of the stress space.
2.3 Application examples
Three different blades were analyzed with the aim of avoiding blade-specific conclusions. Two of these were chosen to compare similarly sized blades: one has a length of 86 m and is adapted from the DTU 10 MW reference turbine (Bak et al., 2013); the other is 80 m long and is taken from the IWES IWT-7.5-164 reference turbine (Popko et al., 2018). The third blade under consideration is the 20 m long demonstrator blade (Bätge, 2016) from the SmartBlades2 project (Tessmer et al., 2021), which is called SB2-DemoBlade in the following. The latter was chosen to broaden the investigations to different blade sizes. It exhibits a pre-sweep in the rotor area towards the trailing edge, resulting in a geometric bend–twist coupling; i.e., the thrust forces result in torsion, introducing shear stresses in the trailing edge adhesive.
Finite-element (FE) models of the selected blades were generated with the in-house MoCA (model creation and analysis) tool. The modeling strategy was validated in detail using the SB2-DemoBlade (Noever Castelos et al., 2022). Mesh convergence studies were carried out with respect to static deflections, natural frequencies, mode shapes, blade mass, and the location of the center of gravity for all blades to ensure converged and reliable solutions. Figure 3 shows coarse versions of the blade meshes (the FE meshes used were too fine for visualization) of all three blades, highlighting the size differences. Ansys was used as the FE solver. The postprocessing, i.e., the calculation and analysis of non-proportionality factors, was executed using our own routines in MATLAB.
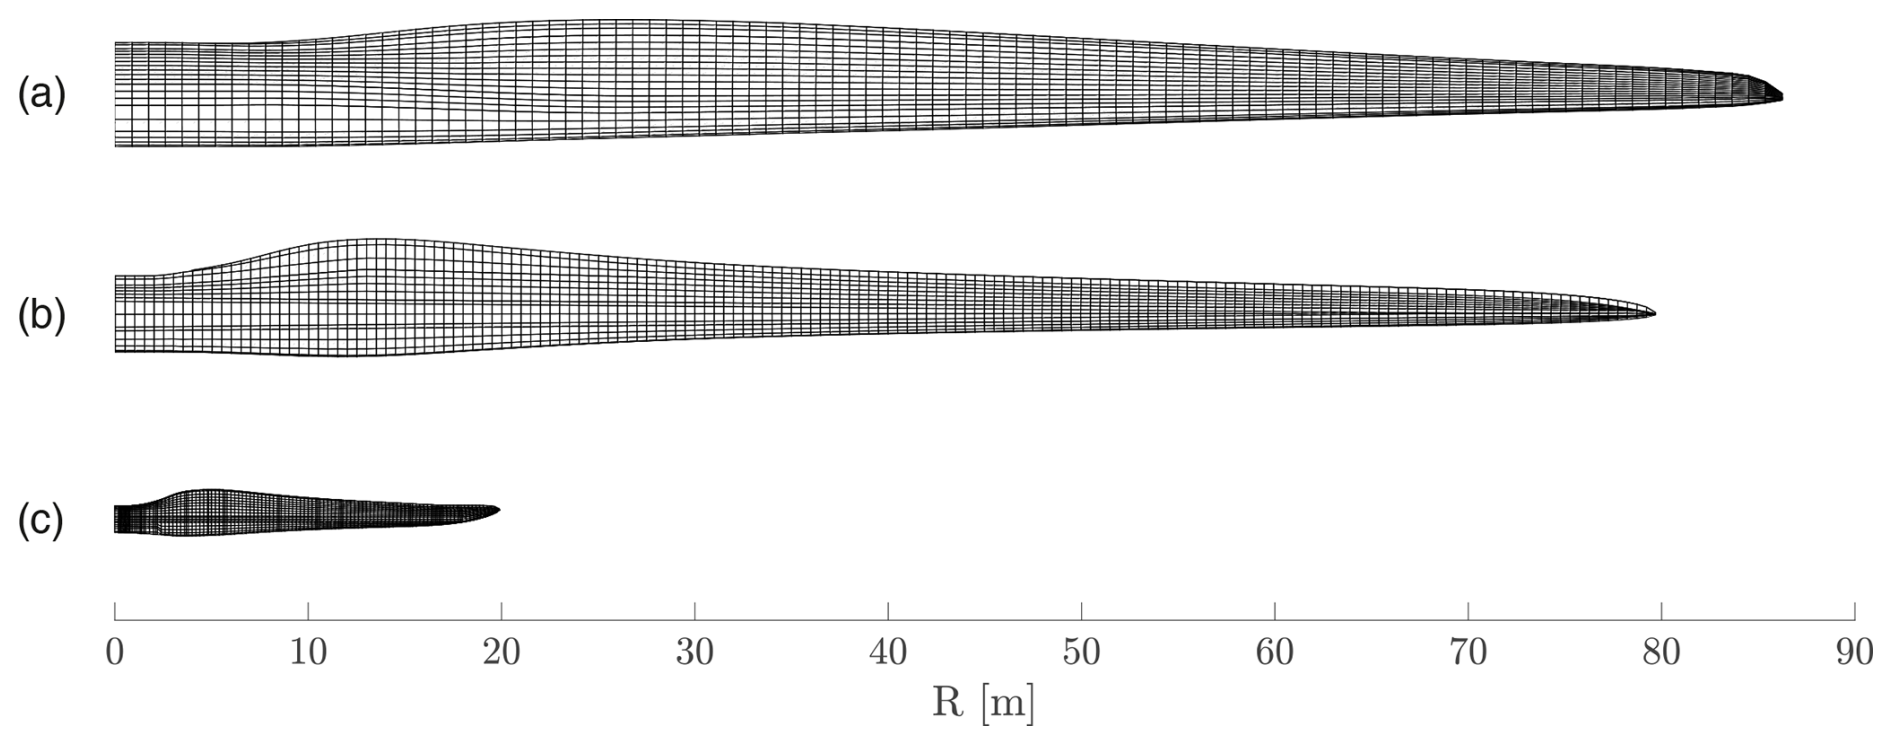
Figure 3Finite-element models of the three rotor blades investigated: (a) DTU 10 MW (Bak et al., 2013), (b) IWES IWT-7.5-164 (Popko et al., 2018), and (c) SB2-DemoBlade (Bätge, 2016).
All composite components of the blades were represented by four-node shell elements. The trailing edge adhesive joints were modeled with eight-node solid elements; see the detailed view in Fig. 4 as an example of the IWES IWT-7.5-164 blade. Since the transitions from the root sections to the thin, aerodynamic airfoils were different for the three blades (including the design of the trailing edge adhesive joints), the analyses were limited to the outboard regions of the blades at normalized radii of , where r is the local radius and R is the rotor radius. Note that the radii are measured from the blade root; i.e., the hub radius is neglected. The FE meshes were locally refined at the trailing edges in the analysis regions in order to obtain better stress resolutions and stress convergence (not displayed in Figs. 3–4). Note that we excluded the outermost row of elements in the calculation of non-proportionality factors or fatigue damage. In this way, we ensured that we did not consider stress concentrations close to singularities associated with geometric corners or discrete jumps in material properties.
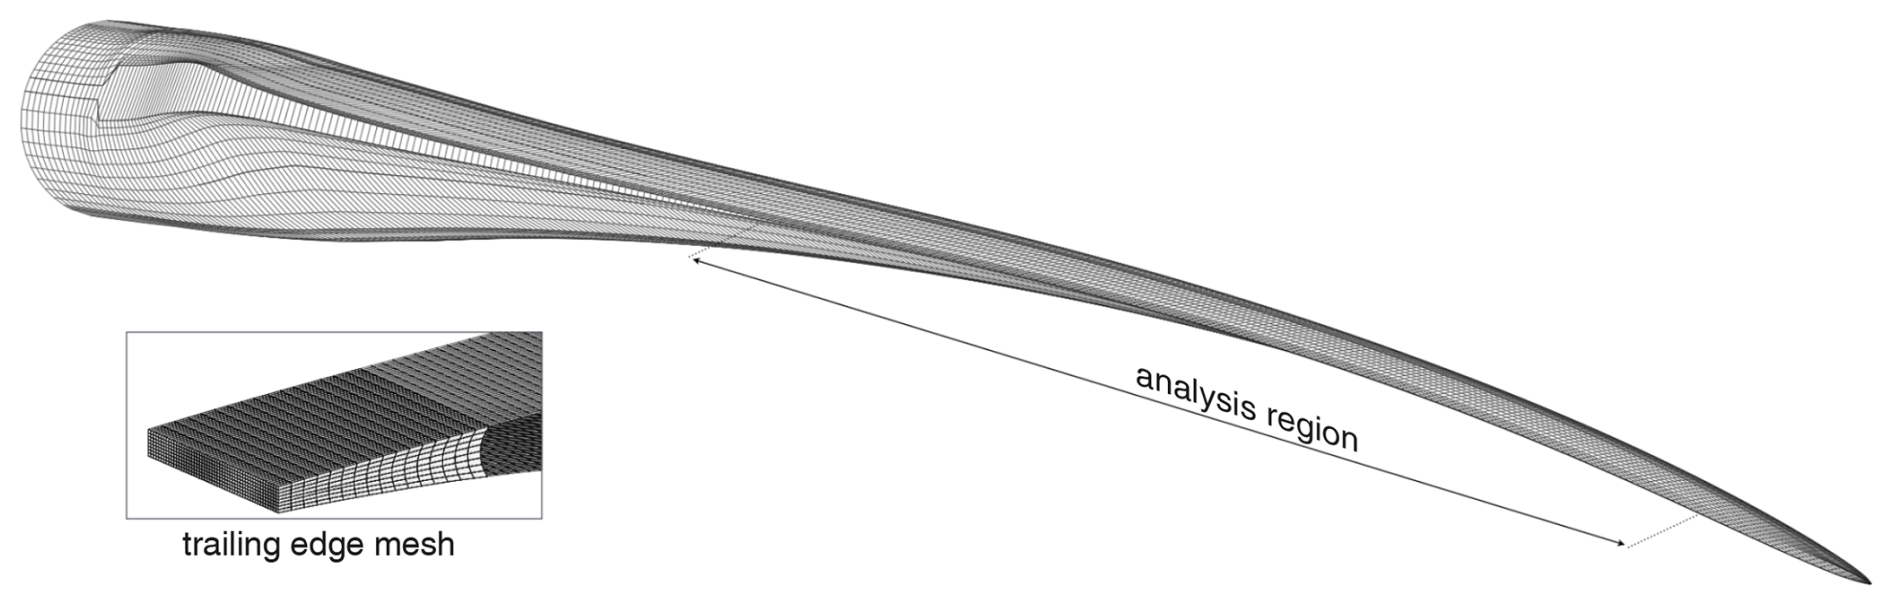
Figure 4Visualization of the analysis region and a detailed view of the trailing edge FE mesh of the IWES-IWT-7.5 reference turbine blade.
Although transverse fatigue cracks in the trailing edge adhesive normally occur in the vicinity of the maximum chord length (see Sect. 1.3), the outboard region was primarily selected to provide comparability between the different blades. Moreover, there were structural details in the maximum chord region of the SB2-DemoBlade, such as balsa wood inlays to limit the adhesive thickness, that were not possible to model with the finite-element model generator without excessive effort that was considered unjustified.
2.4 Calculation of fatigue damage
Two models were applied to calculate the annual fatigue damage. The first one was a global equivalent stress approach neglecting non-proportionality, and the second was a critical-plane approach taking non-proportionality into account. In this way, we were able to carry out a comparison between the different approaches and evaluate the impact of non-proportionality on fatigue analyses.
The Rankine theory (Rankine, 1857) was used as a simple representative of a global equivalent stress criterion. The maximum principle stress was evaluated in each time step of the stress time series. After a rainflow count, the fatigue damage was calculated using normal stress S–N curves and applying Miner's rule of linear damage accumulation (Miner, 1945). Although the direction of the maximum principle stress changes with time due to the non-proportionality content, the partial damage was globally accumulated, neglecting the impact of non-proportionality.
In the critical-plane-based approach, the fatigue damage was calculated on material planes with a discrete orientation increment of 15°. The shear stresses on the material planes were neglected. Note that this simplification was applied for comparability with the global equivalent stress approach and should not be the subject of a regular fatigue analysis, as the fatigue damage is underestimated. The rainflow counting and damage accumulation were executed on each material plane individually. The plane with the maximum damage was then interpreted as the critical plane where fatigue damage was expected to occur.
In the case where the stress time histories are perfectly proportional, both methods result in the same fatigue damage. However, when non-proportionality is involved, the fatigue damage is expected to be smaller in the critical-plane approach, meaning that the critical-plane approach is less conservative, which can justify the additional effort needed to find the actual critical plane.
In this section, the results of the analyses are presented in detail. In the following subsections, the degree of non-proportionality is presented by means of the non-proportionality factor. The correlation with an example representative excerpt of the stress time series is shown, a wind speed-weighted mean non-proportionality factor is introduced to compare the degree of non-proportionality in the three blades analyzed, and the results of the fatigue analysis using two different concepts are presented.
3.1 Non-proportionality in trailing edge adhesive joints
The non-proportionality factors fNP were calculated according to the newly proposed formulation introduced in Sect. 2.2. In Fig. 5, the maximum non-proportionality factors fNP,max found in the trailing edge adhesive elements in each cross-section along the span of the blade are illustrated as a contour plot for all three blades. Therein, the normalized radii are plotted on the x axis and the wind speeds v on the y axes. The color scale is given on the left and the corresponding Weibull frequency distributions of the wind speeds, hW, on the right.
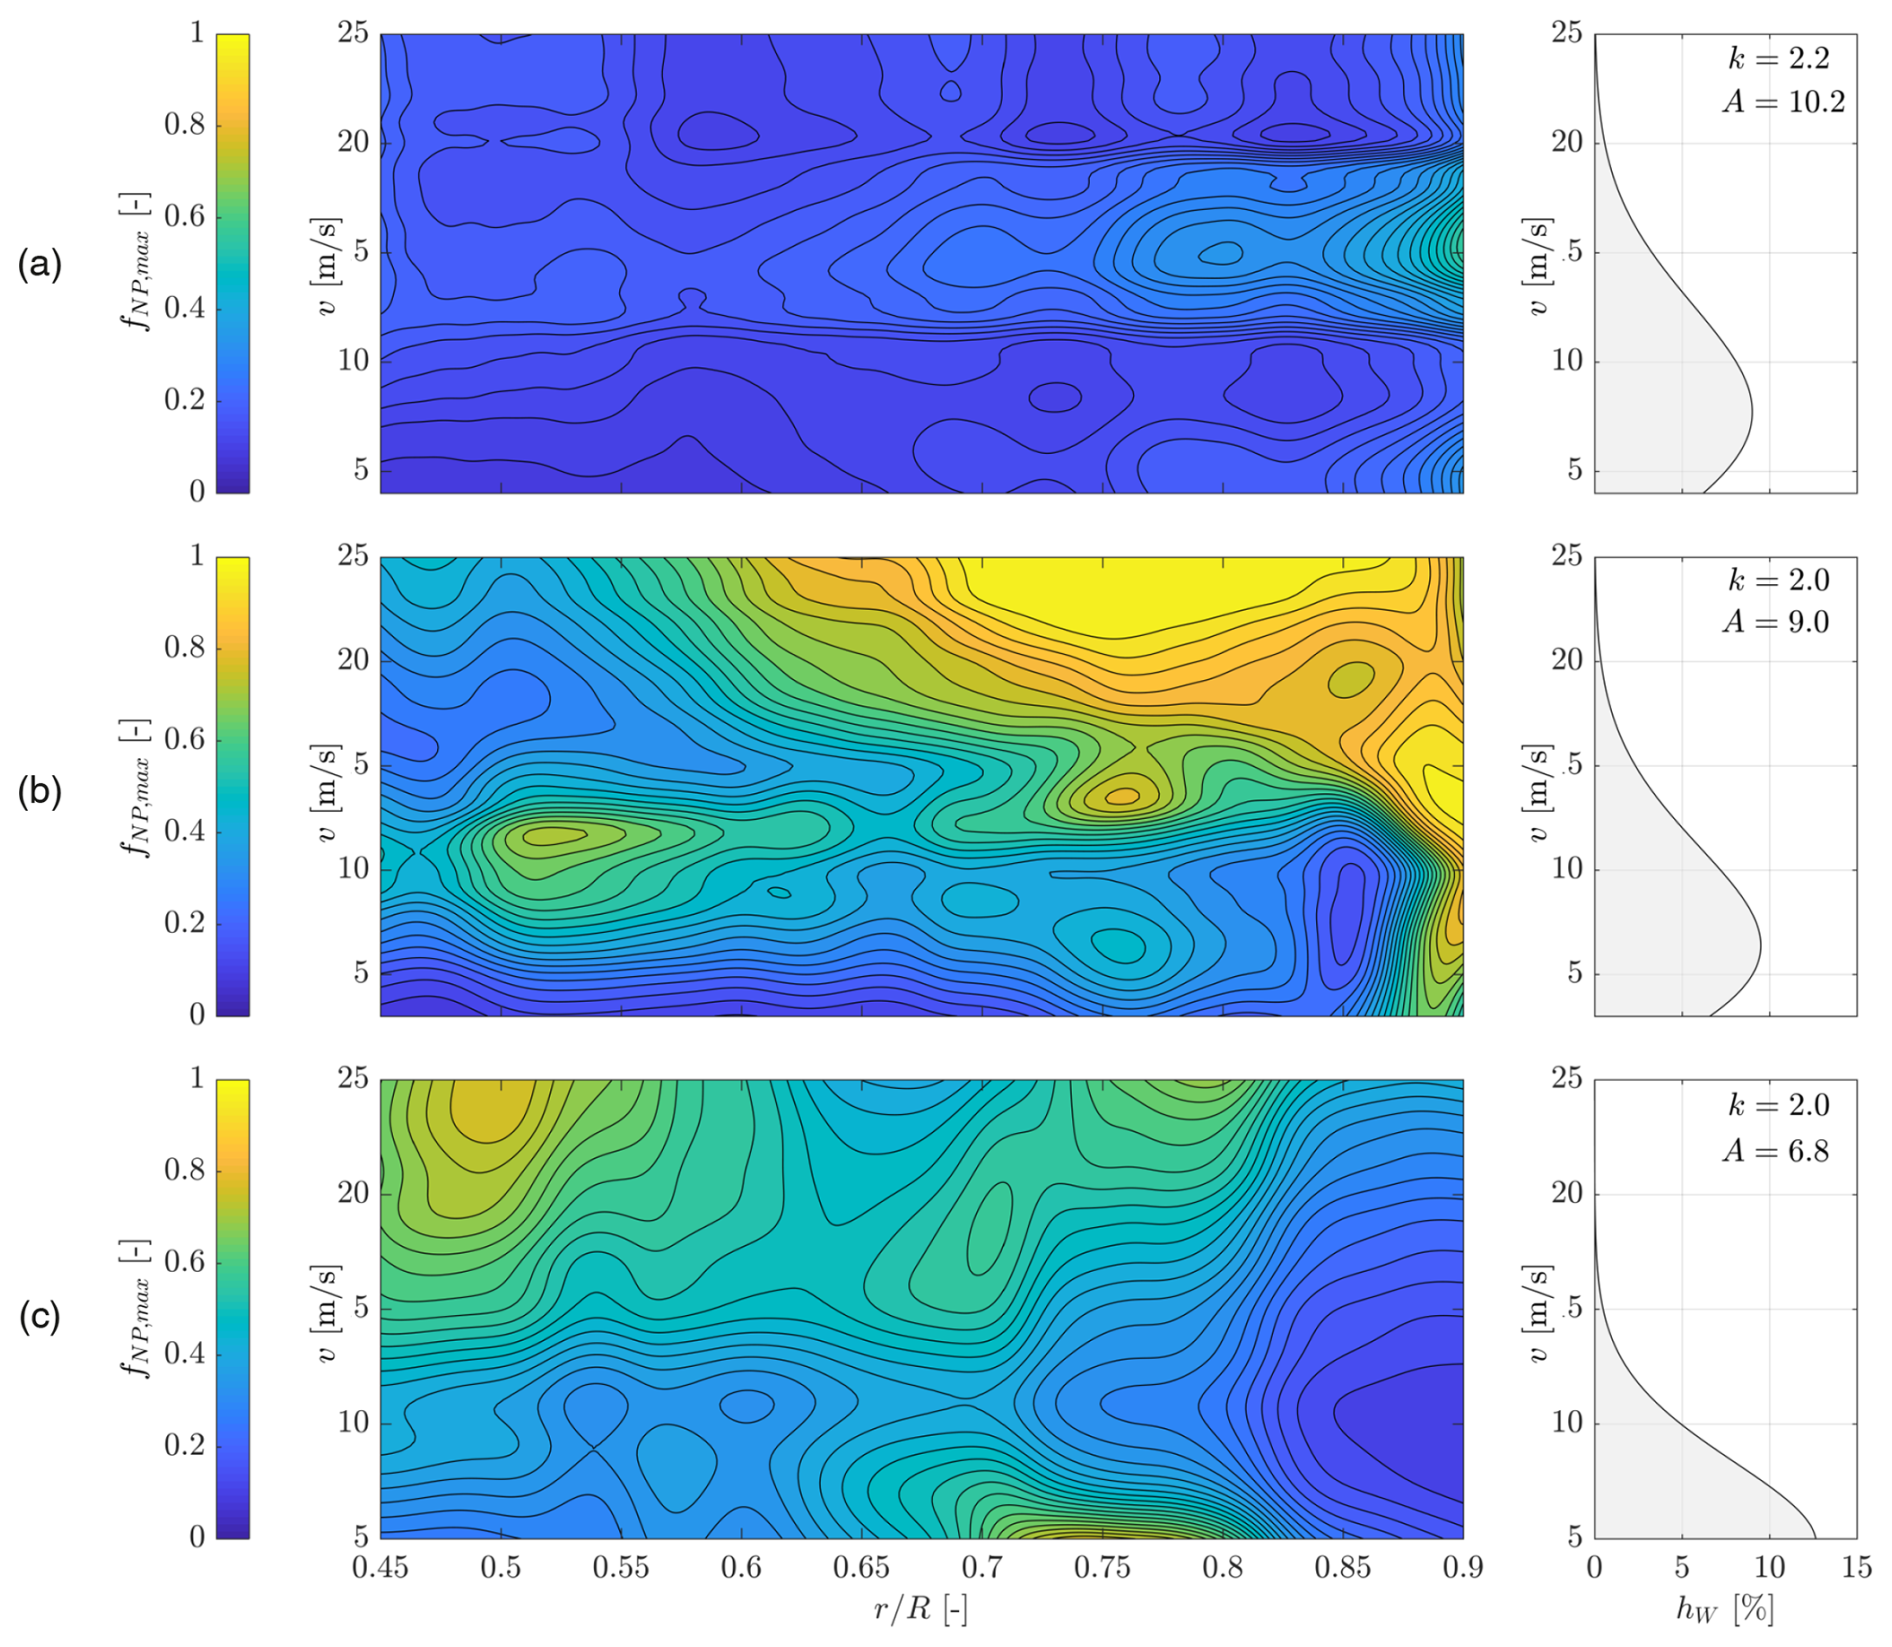
Figure 5Contour plot of the non-proportionality factors as a function of the normalized radius (on the x axis) and the wind speed v (on the y axis): (a) DTU-10 MW reference turbine blade (Bak et al., 2013), (b) IWES IWT-7.5-164 reference turbine blade (Popko et al., 2018), (c) SB2-DemoBlade (Bätge, 2016). The color scale is presented on the left; the Weibull frequency distribution of the wind speed is on the right.
Figure 5a depicts the results for the DTU 10 MW reference blade. A generally low degree of non-proportionality can be observed, with a global average of about . In a region close to the blade tip (), the local average reaches a maximum value of the non-proportionality factor of for wind speeds of m s−1. When it comes to the contribution of fatigue damage, it is important to consider the frequency of occurrence of the wind speed, as that will be used for the damage extrapolation in the assessment of the fatigue life. In the case of the DTU 10 MW blade, a Weibull frequency distribution associated with an offshore site is used with a scaling factor of A=10.2 m s−1 and a shape factor of k=2.2. In this case, the wind speeds resulting in higher non-proportionality factors ( m s−1; see above) cover approximately 25 % of the year, whereas the lower wind speeds ( m s−1) appear in 64 % of the year but result in much lower fNP,max values. However, the higher wind speeds are normally associated with higher stress amplitudes, so it is difficult to say whether the higher stress amplitude or the higher frequency of occurrence is governing the fatigue damage.
Although the IWES 7.5 MW blade is similar in length to the DTU blade, the design is qualitatively very different; see also Fig. 3. The distribution of the non-proportionality factor along the span of the blade and the wind speeds hence also appear very different. The degree of non-proportionality generally reaches much higher values than those in the DTU blade; see Fig. 5b. In general, the degree of non-proportionality increases with the radius and the wind speed. However, there are two hot spots at a normalized radius of and a wind speed of m s−1 and at and m s−1. The Weibull frequency distribution is associated with a high wind speed near-shore site (i.e., A=9.0 m s−1 and k=2.0). Hence, the high non-proportionality is present also at wind speeds with non-negligible probability.
The SB2-DemoBlade is much shorter than the other two blades. It is a comparably stiff blade design but includes a pre-sweep for geometrical bend–twist coupling. The contour plot of the non-proportionality factor is shown in Fig. 5c. The non-proportionality is generally higher than in the DTU blade but not as high as in the IWES blade. Two hot spots are present at high wind speeds (v>18 m s−1) in two regions along the blade, i.e., and . The external design conditions for this blade are associated with a low wind speed onshore site, hence A=6.8 m s−1 and k=2.0. The aforementioned Weibull parameters were derived from measurements of the field research validation site of the National Renewable Energy Laboratory (NREL) CART3 turbine (Jager and Andreas, 1996) that the blade was designed for, and it was put into operation for some time. Consequently, the wind speed frequencies of occurrence are very low for the two non-proportionality hot spots. The non-proportionality at the aforementioned positions may thus be irrelevant for the fatigue assessment, but that will be analyzed later. There is a third hot spot at a radial position of and a low wind speed of about 5 m s−1. The frequency of occurrence of the wind speed is very high at this location, so the non-proportionality may significantly affect the fatigue damage.
3.2 Stress time series
Figure 6 shows a representative excerpt of the stress time series in the trailing edge adhesive of all blades, with a duration of 50 s. A normalized radial position of and the wind speed with the highest frequency of occurrence were chosen as examples. The radial position was chosen to capture high non-proportionality factors in the IWES blade and the SB2-DemoBlade. The non-proportionality factor in the DTU blade is generally comparably small, and the hotspot is located close to the blade tip, which is a location that is not commonly prone to trailing edge fatigue damage. Hence, there was no need to pick a different location for this blade. The stress time series are plotted for the element with the highest fNP factor for the cross-sections and wind speeds considered. The stress results are calculated in the blade coordinate system according to DNV GL (2015), meaning that the z axis is pointing from the blade root to the blade tip, the y axis from the leading to the trailing edge, and the x axis from the pressure to the suction side. Hence, σx is the through-thickness normal stress in the adhesive; σy is the normal stress along the width of the adhesive; σz is the longitudinal normal stress; and τxy, τxz, and τyz are the in-plane and the transverse shear stresses.
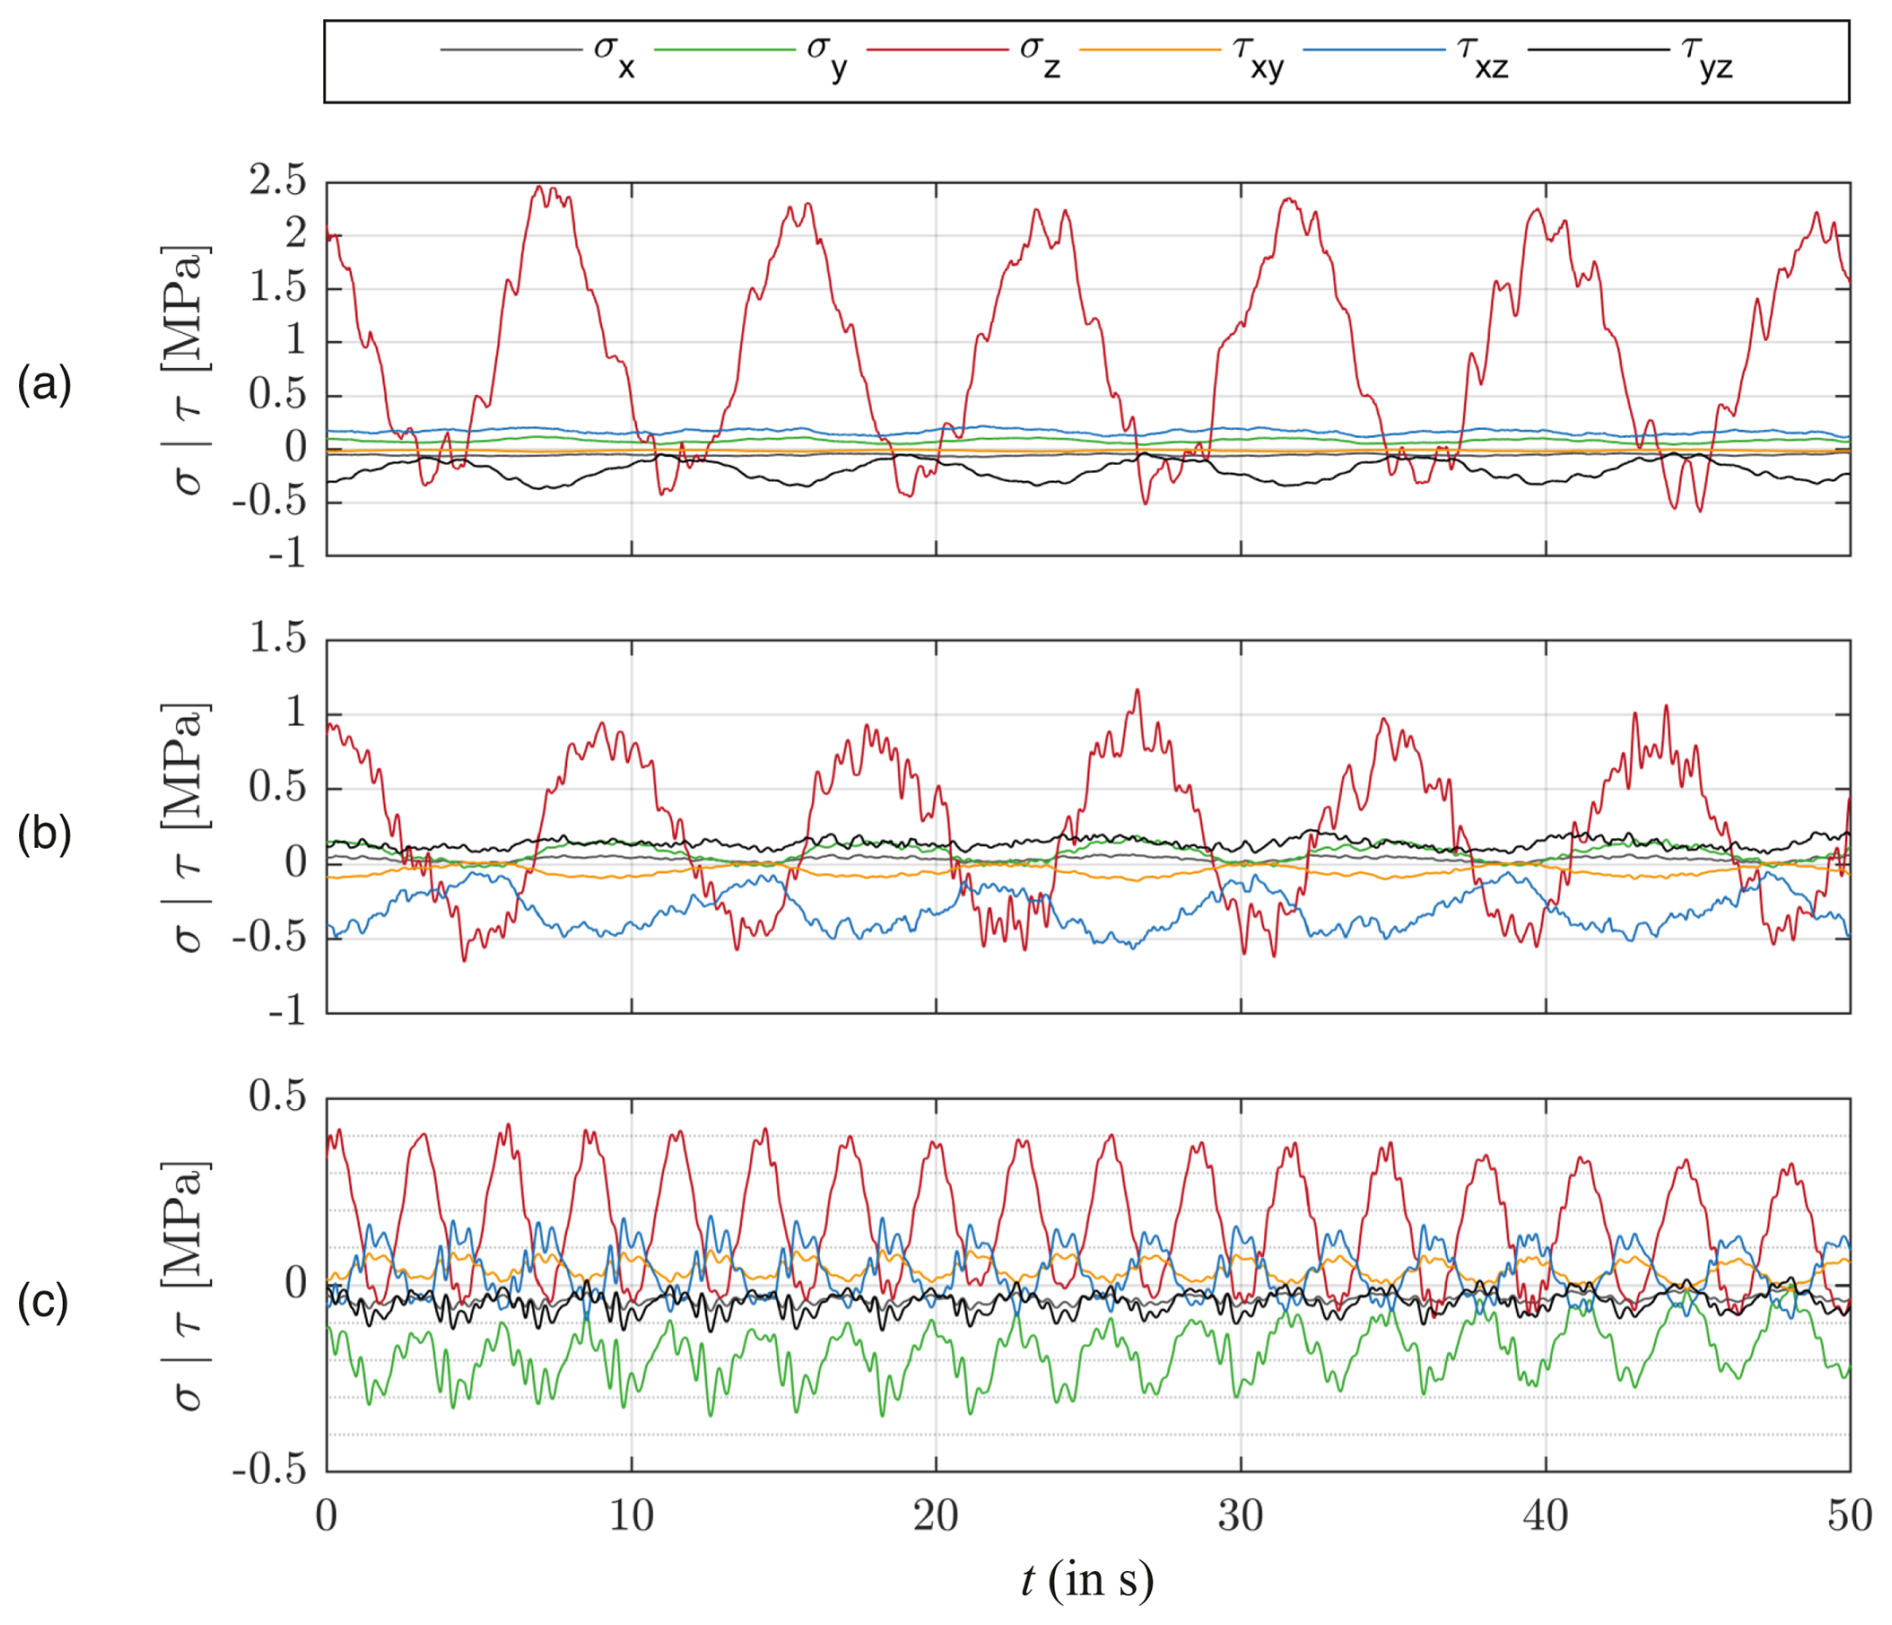
Figure 6Stress histories of the finite element in the trailing edge adhesive joints with the highest non-proportionality at a normalized radial position of for all investigated blades related to the blade coordinate system according to DNV GL (2015): (a) DTU 10 MW reference blade, v=8 m s−1, fNP=0.159; (b) IWES IWT-7.5-164 reference blade, v=7 m s−1, fNP=0.465; and (c) SB2-DemoBlade, v=5 m s−1, fNP=0.766.
The stress time series for the DTU blade is plotted in Fig. 6a. It can be seen that the longitudinal stress σz is dominating the time series with an amplitude of approximately 1.5 MPa, a mean stress of approximately 1 MPa, and a 1 per revolution frequency. The mean stress is caused by the torque resulting in the power output of the turbine. The oscillation is due to a high edgewise bending moment originating from the blade mass in rotation. The other stresses have negligible amplitudes and mean stresses.
Figure 6b presents the stress time series for the IWES blade. The major excitation frequency is again 1 per revolution and is of the same magnitude as that of the DTU blade, as the blade size and the tip speed ratio are very similar. The longitudinal normal stress is still the dominant stress component. The amplitude is much lower compared to the DTU blade (approximately 0.75 MPa), as well as compared to the mean stress (approximately 0.25 MPa). The reason is the different design philosophy expressed in the general blade shape (see Fig. 3), which results in a different mass distribution and a stiffer trailing edge girder, reducing the strain and consequently the stress in the trailing edge adhesive. The through-thickness transverse shear stress τxz is remarkably higher than in the DTU blade and is also remarkably higher than all other stress components, but it is still significantly smaller than the longitudinal normal stress.
The stress time series of the SB2-DemoBlade is presented in Fig. 6c. It can be seen that the governing 1 per revolution excitation frequency is much higher compared to the DTU and the IWES blades. This is due to the much smaller rotor diameter (the tip speed ratio is a bit smaller, but the rotor diameter is about one-fourth as large). The longitudinal normal stress σz has the highest amplitude of about 0.25 MPa and has a mean stress of approximately 0.15 MPa. In contrast to the DTU and the IWES blades, other stress components are much higher. For example, the normal stress in width direction, σy, is about half as much as σz, which is not negligible. Moreover, the in-plane and transverse shear stresses in the thickness direction, namely τxy and τxz, respectively, have a significant amplitude. It is worth mentioning that the major part of the longitudinal normal stress is deterministic in nature; i.e., it shows a small deviation from a sinusoidal signal. The other stress components have a much higher fluctuation, i.e., a higher stochastic content.
3.3 Weighted mean non-proportionality
Up to this point, the non-proportionality factor has been given for each wind speed. However, it is necessary to evaluate the degree of non-proportionality for the entire service life of the wind turbine, including all possible wind speeds. A weighted mean value of the non-proportionality factor is thus introduced, employing the wind speed frequency distribution as a weighting factor. Introducing the cut-in and cut-out wind speeds vin and vout and an integer number i identifying a wind speed bin, the weighted mean of the non-proportionality factor, , is given by the relationship
Herein, fNPi is the non-proportionality factor for the given wind speed bin i, and hWi is the frequency of occurrence of said wind speed bin according to the Weibull distribution functions given in Fig. 5.
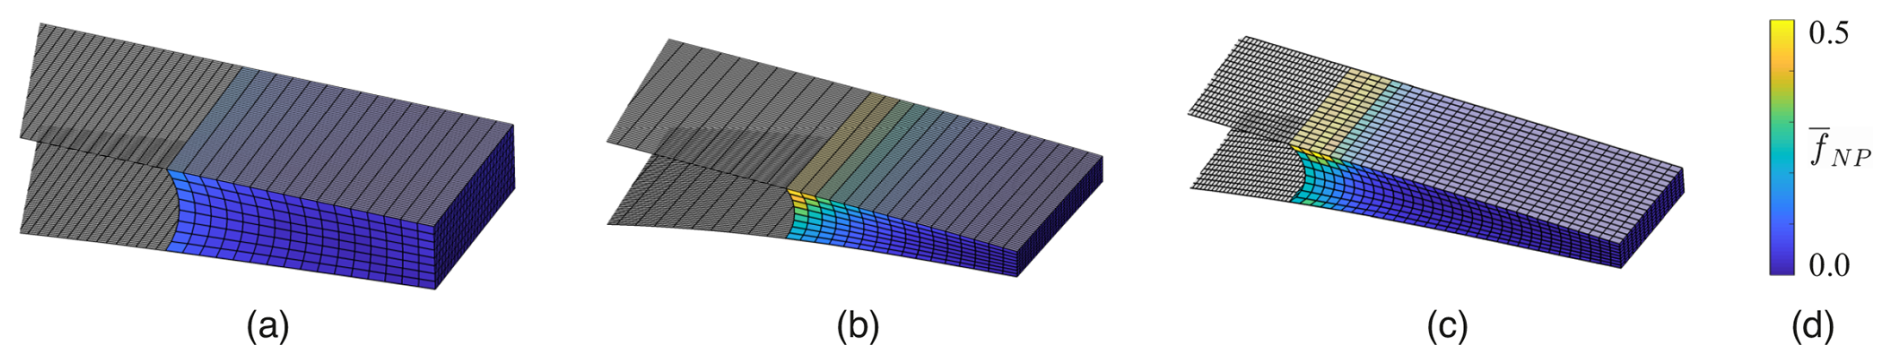
Figure 7Contour plots of the weighted mean non-proportionality factor in the trailing edge adhesive for all three blades (cutout with the visible cross-section at a radial position of ): (a) DTU blade, (b) IWES blade, (c) SB2-DemoBlade, (d) color code.
Figure 7 shows distributed across the cross-section of the trailing edge adhesive joint at a radial position of for all three blades, corresponding to the radial position of the stress history excerpt given in Fig. 6. The cross-sectional views show parts of the suction-side shells (at the top) and the pressure-side shells (at the bottom). The trailing edge is on the right. As already concluded from the contour plots of Fig. 5 and the stress histories in Fig. 6, the DTU 10 MW blade shows the lowest and the SB2-DemoBlade the highest degree of non-proportionality. However, for all blades, the distribution in the cross-section is qualitatively similar. The inner face of the adhesive joint has the highest degree of non-proportionality, which decreases towards the trailing edge.
It is important to exercise caution when interpreting the stresses in the corners of the adhesive, as it is widely acknowledged that stresses do not converge with the mesh density in such singularities (geometric sharp corner and/or sudden jump in material properties in the interface between adhesive and shell laminates). Given that the non-proportionality factor is a direct consequence of the stress state, it is similarly prudent to exercise caution when considering the non-proportionality factor in the corners. Thus, in the subsequent analysis, the non-proportionality factor in the outermost elements of the adhesive were excluded from the results, ensuring that the conclusions are valid and not affected by spurious stress components.
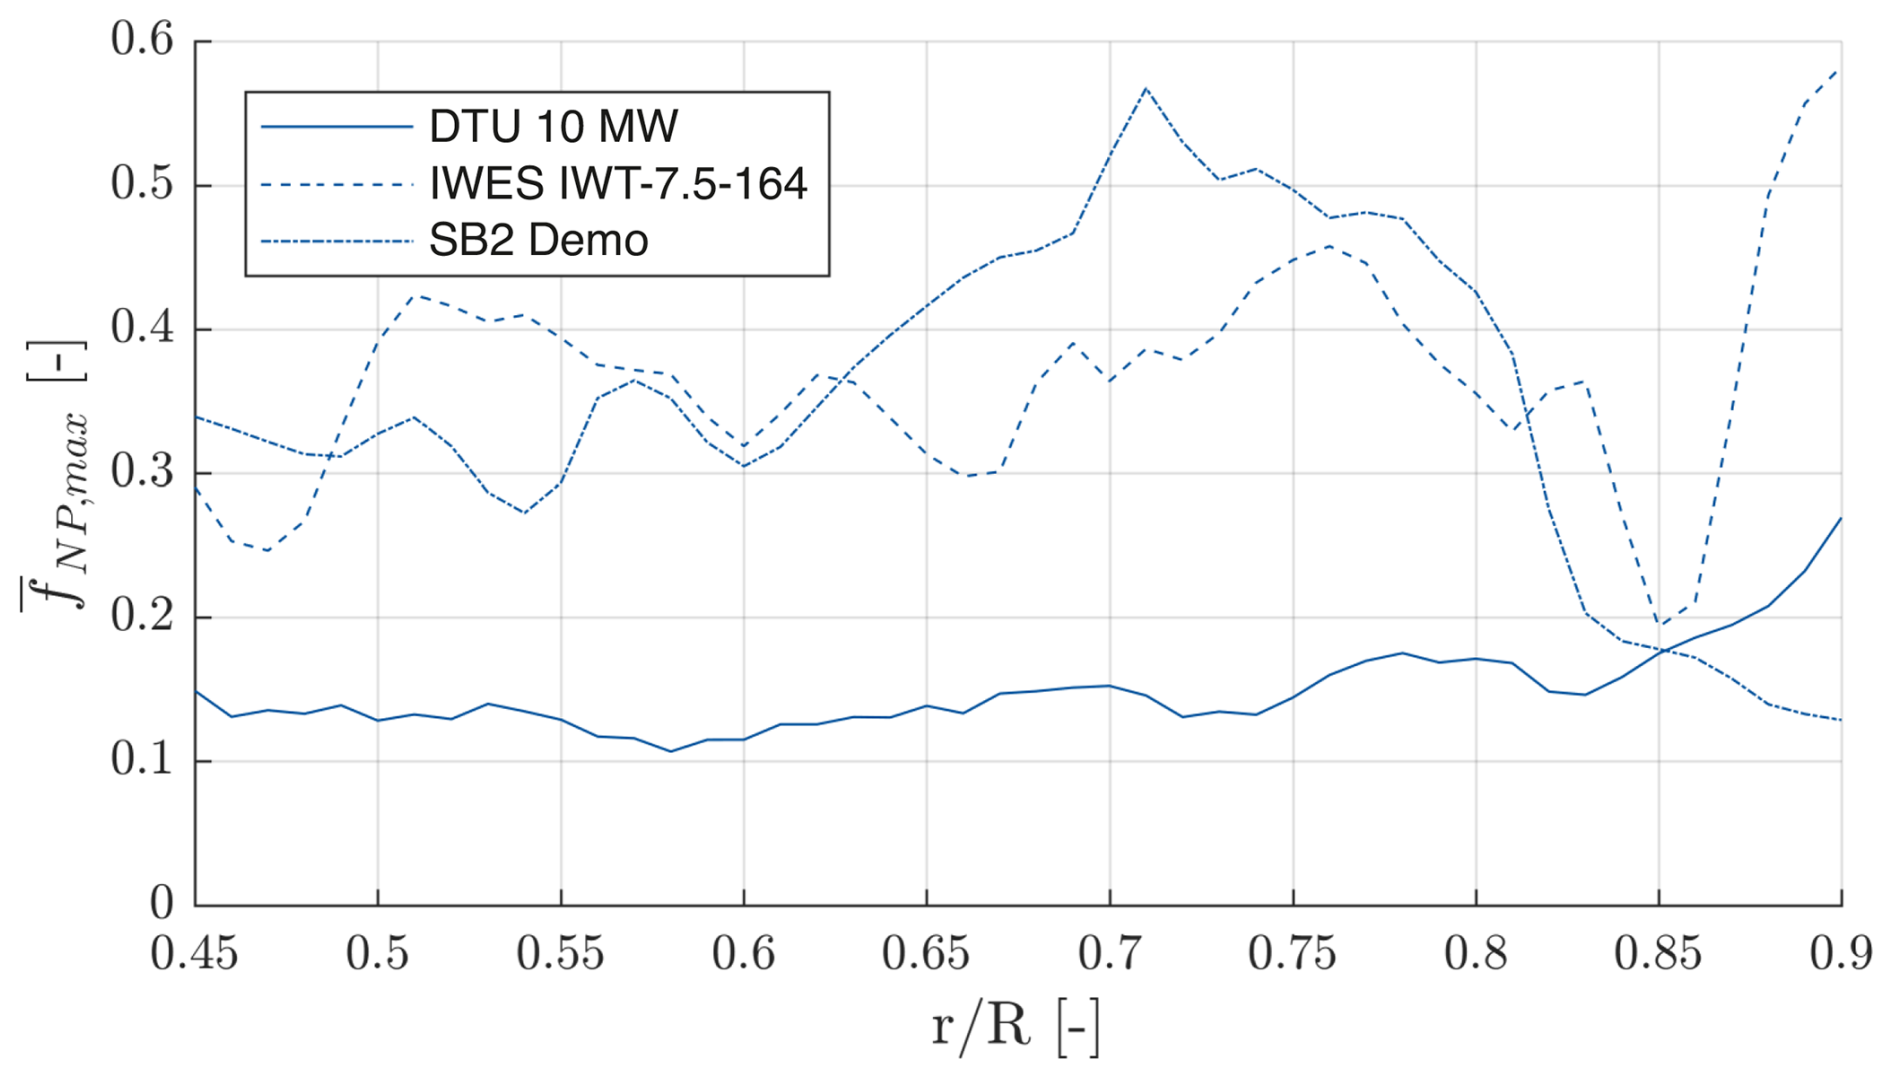
Figure 8The maximum weighted mean non-proportionality factor in the trailing edge adhesive joint plotted as a function of the normalized radial position for all three blades.
The maximum weighted mean non-proportionality factor in each cross-section, , is plotted as a function of the normalized radial position for all three blades in Fig. 8. In the DTU blade, the degree of the non-proportionality factor is very low. It is more or less constant at a value of along the blade but increases towards the blade tip to its maximum of about 0.28. The IWES blade, which has a similar length, has moderate non-proportionality values of , with more distinct variability along the blade. The SB2-DemoBlade has a peak in non-proportionality at a radial position of , with a maximum value of about 0.58. In this region, the non-proportionality factor is higher than in the other blades, whereas at smaller and larger radial positions, the degree of non-proportionality is lower than that of the IWES blade, and close to the tip it is also lower than that of the DTU blade. The large blades (DTU and IWES blades) behave somewhat similarly close to the tip, where the degree of non-proportionality is increasing. On the contrary, the SB2-DemoBlade's non-proportionality decreases towards the blade tip. Generally speaking, it can be seen that the distributions of the maximum weighted mean non-proportionality factor along the blade are significantly different for the three blades analyzed in this work.
3.4 Fatigue damage
Figure 9 shows the relative fatigue damage differences, ΔD, plotted against the weighted mean non-proportionality factor, , for the three blades investigated. The relative fatigue damage difference is defined by , where Dg and Dcp are the fatigue damage based on the global equivalent stress and the critical-plane approach, respectively.
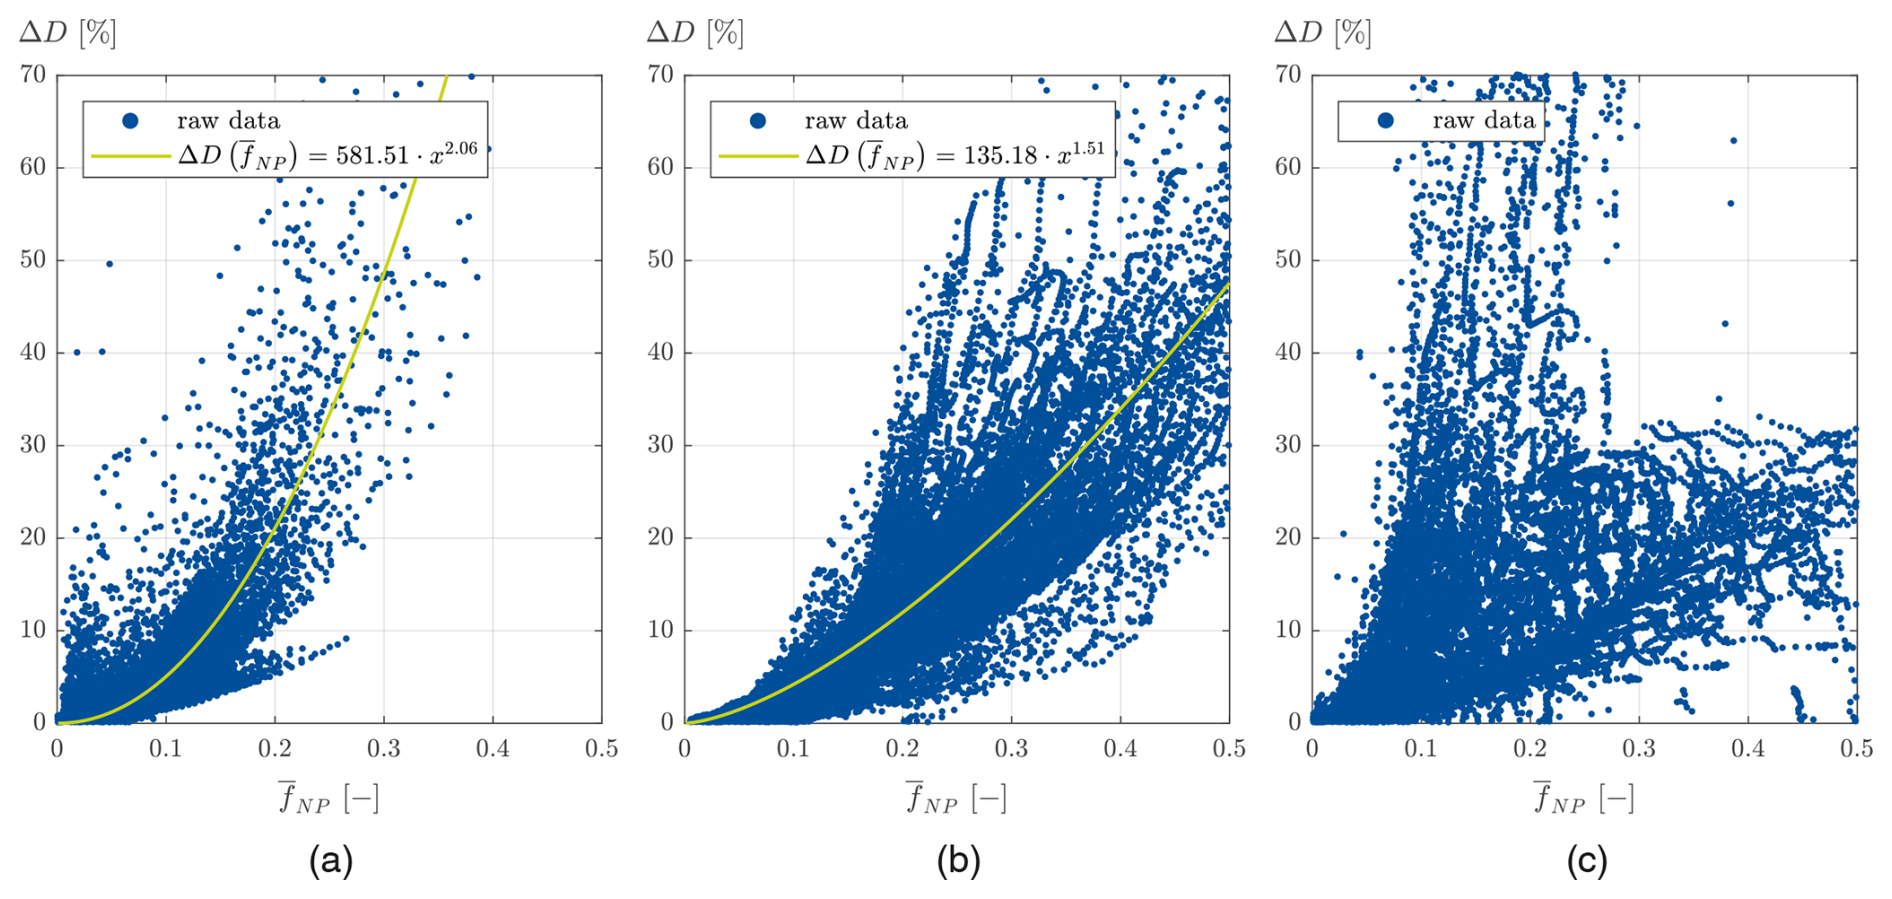
Figure 9The relative fatigue damage difference (ΔD) plotted against the weighted mean non-proportionality factor () for (a) the DTU blade, (b) the IWES blade, and (c) the SB2-DemoBlade. The fatigue damage difference (difference between the global equivalent stress and the critical-plane approach) is normalized by the fatigue damage based on the global equivalent stress approach. Positive values indicate that the global equivalent stress approach is inaccurate but conservative. Each blue dot indicates the fatigue damage difference in one finite element. The trend line fitted to an exponential function is plotted in green and is given in the respective legend. A clear trend cannot be observed for the SB2-DemoBlade, so no trend line was fitted in this case.
Each dot in Fig. 9 represents ΔD in one finite element. Trend lines are added for the DTU and the IWES blades; see Fig. 9a–b. Their functions are given in the respective legends in Fig. 9. It can be seen that the relative fatigue damage difference increases exponentially with the weighted mean non-proportionality factor for these blades. For the SB2-DemoBlade, however, we do not observe a clear trend, so a trend line was not fitted in this case. However, Fig. 9c confirms the general trend of higher ΔD values for higher non-proportionality contents.
The relative fatigue damage difference is generally positive and reaches values of as much as 70 %. This means that the fatigue damage is much higher when the global equivalent stress approach is utilized, whereas it is smaller when using the critical-plane approach.
Generally, the degrees of non-proportionality in the three blades are very different. It is thus difficult (or impossible) to draw general conclusions about the degree of non-proportionality. The higher degree of non-proportionality in the SB2-DemoBlade could have been triggered by the geometrical bend–twist coupling originating from the pre-sweep in the rotor area. The DTU and IWES blades are numerical blade models that were developed for the research community. They may thus not be representative of a commercial blade designed for operation in the field. The SB2-DemoBlade, however, was designed for field testing of geometrical bend–twist coupling. The structural design was thus executed at a much higher level of detail but, due to the small size, may not be representative of modern utility-scale wind turbines.
The correlation between the degree of non-proportionality and the blade size was not substantiated. The reason is that the stress response in a blade depends on a large variety of influencing factors such as the choice of the fatigue analysis methodology (global equivalent stress versus critical-plane approach), the choice of the underlying equivalent stress criteria, the quality of the material database, the general design policy of the blade designer, the design targets with respect to aeroelastic performance and cost, the risks the designer is willing to accept, the overall turbine concept, the dynamic response of not only the blades but also the entire turbine, and the different inflow conditions of small and large rotor diameters. Hence, the degree of non-proportionality in a rotor blade has to be analyzed for each turbine individually.
However, it was shown that non-proportionality is generally present in each of the analyzed blades. While it was very low in the DTU 10 MW blade, the degree of non-proportionality was significant in the IWES 7.5 MW blade and in the SB2-DemoBlade. A common finding for all three blades was that the longitudinal normal stress was the predominant stress component, which agrees well with the observation of transverse cracks in operating wind turbines. A major goal in blade design should thus be to avoid excessive longitudinal strain and stress. This cannot be realized by increasing the bond-line width, which is the usual design parameter for adhesive joints, but is instead done by increasing the stiffness of the trailing edge. When doing this, care must be taken to not implement excessively high stiffness in order to avoid damage from thermal residual stresses. However, if the longitudinal stress is reduced, the other stress components not affected by the stiffening of the trailing edge girder will become more significant, and the degree of non-proportionality will increase.
In the DTU blade, comparably low non-proportionality content was generally observed; see Fig. 5a. The stress history is almost proportional. The weighted mean non-proportionality factor is below 0.2 throughout the blade. This correlates with a strongly dominant longitudinal normal stress in the trailing edge adhesive, which results in a very pronounced RMOI in z direction and far smaller RMOIs in the other directions. Close to the tip, the non-proportionality increases up to ; see Fig. 8. There, the longitudinal stress associated with the blade weight becomes smaller such that the influence of other stress components becomes more significant.
Although the through-thickness transverse shear stress is significantly smaller than the longitudinal normal stress in the IWES blade, it is much bigger than in the other blades and contributes much more to the non-proportionality factor. This is accompanied by a 90° phase shift with respect to σz, which further contributes to the non-proportionality content; see also test case 15 in Sect. 2.2. Consequently, the non-proportionality factor reaches fNP=0.465 (see Fig. 5b), which is about 3 times as much as in the DTU blade. The highest non-proportionality factor is located in the outer third of the blade length at high wind speeds. This is because in this blade region, the longitudinal stress originating from edgewise bending is smaller, but at high wind speeds, the flapwise bending, and thus the through-thickness shear stress, becomes larger. The weighted mean non-proportionality factor exceeds at several positions along the blade.
The stress history for the SB2-DemoBlade results in a higher degree of non-proportionality of fNP=0.766; see Fig. 5c. The reason for that is the higher contributions of stress components apart from the longitudinal stress; see Fig. 6. Some of these are in phase. For example, the normal stresses σy and σz have peaks and valleys at the same time. This normally results in a proportional stress history. However, the higher variability in σy contributes to non-proportionality. Other stress components, e.g., the shear stresses τxy and τxz, show a 90° phase shift to the aforementioned normal stresses, which naturally results in non-proportionality. The phase shift is due to the different excitation: the normal stresses σy and σz are governed by the blade mass in rotation, resulting in peaks and valleys when the blade is in the three and nine o'clock azimuthal positions. The shear stresses τxy and τxz, however, are influenced by asymmetries in the wind field, namely the wind shear, resulting in peaks and valleys at azimuthal positions of 6 and 12 o'clock, respectively.
The increase in towards the inner edge of the adhesive (see Fig. 7) is caused by the increasing distance from the principle edgewise bending axis towards the trailing edge. Consequently, the longitudinal normal stress σz from edgewise bending increases towards the trailing edge, which is accompanied by an increase in its dominance and hence a decrease in non-proportionality. The increase in towards the suction side is caused by flapwise bending. Hence, the longitudinal normal stress from flapwise bending increases towards the suction side, increasing the stress non-proportionality. The interior surface of the adhesive was modeled by a concave shape, which may seem unrealistic given what is seen in the field. The trailing edge adhesive joint is a blind bond line, especially in the outboard region of the blade. The adhesive thus is squeezed into the inside of the blade, forming a rather convex or clip shape at the interior surface. The corner stress in such configurations was studied in Rosemeier (2024). It was shown that the stress concentration due to the geometric singularity in the inner corners of the adhesive is more severe for convex and clip-like shapes. This gives rise to the implication that modeling the correct shape may be important. However, it was also shown that the stress concentration vanishes along a very short distance from the corner. Since the first element row was excluded in the fatigue damage calculation in this paper, which avoids issues with the corner stress concentration, the related effort to model more realistic interior geometric shapes was not justified. Besides, the interior shape of the adhesive can be influenced by applying foam strips during mold closure, which helps to avoid the squeeze-out into the inside of the blade, forming a concave shape as was modeled here.
One might be forgiven for assuming that investigating the non-proportionality degree in the adhesive is an unnecessary exercise, given that transverse cracks are a common occurrence in operating turbines (Ataya and Ahmed, 2013; Rosemeier et al., 2022b). This is evidently due to the dominant longitudinal normal stress. In such a scenario, the search for the critical plane is rendered unnecessary, as its existence is already known. This is currently the case since adhesive joints in rotor blades are often designed for shear stress transfer only. To circumvent the formation of transverse cracks, it would be prudent to reinforce the trailing edge laminate, for instance, through the incorporation of additional unidirectional material. As a result, the strains in the trailing edge and, consequently, the longitudinal normal stress in the adhesive would decrease. A reduction in the longitudinal normal stress would result in an increase in the degree of non-proportionality, with the relative contribution of other stress components also rising. While there is a possibility that thermal residual stresses may become a critical issue if the trailing edge is excessively stiff (Rosemeier et al., 2022a), it should be feasible to identify an optimal solution through a process of compromise. It should be noted that the present study did not account for thermal residual stresses, which introduces an error in the stress histories (Rosemeier et al., 2019b, a). However, as recently highlighted by Kuhn (2023), the bi-axial combination of a constant stress in one direction and a cyclic stress in the other direction results in non-proportionality. This finding can be readily extended to a multi-axial stress state. The constant thermal residual stress in the longitudinal direction (Rosemeier et al., 2022b) superimposed on the cyclic shear stress components would thus result in a further increase in the degree of non-proportionality. Therefore, the simplification is conservative with respect to the non-proportionality factor. It can be concluded that considering non-proportional fatigue should be of even greater importance in properly designed rotor blades (meaning those designed for shear stress transfer and longitudinal strain) when thermal residual stresses are taken into account in light of the results presented in this study.
The finding that the global equivalent stress approach yields higher fatigue damage estimates (see Fig. 9) may make the method appear conservative. This is because the fatigue damage is accumulated on all material planes and not only on one particular plane that is considered critical (i.e., the plane with maximum fatigue damage), as is the case in the critical-plane approach. Assuming that the critical-plane approach is more accurate, the ΔD values of up to 70 %, however, indicate that the global equivalent stress approach is quite inaccurate in the case where significant stress non-proportionality is involved. At any rate, the fatigue damage results must be treated with caution, as they strongly depend on the criteria applied to both the global equivalent stress and the critical-plane approach. It has been experimentally proven for an epoxy-resin-based rotor blade adhesive at the coupon level that neutral material behavior occurs (Kuhn et al., 2023). This means that the fatigue life does not depend on the degree of non-proportionality (Sonsino, 2020). This behavior was reproducible with the critical-plane approach but not with the global approach. Note that different criteria from those used here were applied in that study, which highlights the necessity of carefully choosing the correct fatigue damage criteria. Even more important, it was shown that the fatigue damage in the case of the global equivalent stress approach was not higher for increasing non-proportionality but was instead significantly lower (Kuhn et al., 2023). In this respect, the global approach not only incorrectly predicted the basic fatigue behavior (i.e., it did not capture the neutral behavior) but also significantly overestimated the fatigue life. The prediction was therefore substantially non-conservative. Obviously, further investigations need to be carried out to finally conclude the abilities and deficiencies of the fatigue analysis procedures.
In this paper, a non-proportionality factor was proposed that serves to quantify the degree of non-proportionality in a fatigue stress time series. Two different formulations from the literature were combined. The non-proportionality factor was evaluated for 20 test cases, where the new formulation was benchmarked against other formulations. The agreement was excellent for the test cases where no difference was expected. It was further shown that the non-proportionality calculated with the new formulation is independent of mean stress (which is an important feature) and accounts for hydrostatic pressure states. The new formulation is thus an improvement for materials that are sensitive to the presence of hydrostatic pressure in fatigue, as is the case for the epoxy-based adhesive investigated in this paper.
The non-proportionality factor was then applied to evaluate the degree of non-proportionality in trailing edge adhesive joints of three different rotor blades, two of which had similar blade sizes and the third being smaller and equipped with a pre-sweep in the rotor plane. The characteristics of the degrees of non-proportionalities were analyzed in detail and were correlated with excerpts of the load time series. The distribution of the non-proportionality factor in the cross-section plane was similar in all cases and increased from the trailing edge towards the inner face corner on the suction side. It was observed that dominant longitudinal normal stress, which can appear in real blades, reduces the degree of non-proportionality (which is also the reason for the cross-sectional distribution of the non-proportionality factor).
In the present study, it was shown that the difference in fatigue damage when using the global equivalent stress approach or the critical-plane approach increases with the degree of non-proportionality. While the critical-plane concept is understood to be more accurate, it is associated with higher computational cost. The equivalent stress approach provided conservative estimates in the present paper. However, this finding strongly depends on the materials used and the failure criteria embedded in the fatigue analysis. In contrast to the current study, it has been shown in the literature that the choice of a suitable fatigue analysis framework depends on the degree of non-proportionality (which is supported by the current findings) and that a global equivalent stress approach gives reasonable and accurate fatigue damage estimates for proportional stress histories. However, it has also been shown that if there is a lot of non-proportionality involved, the critical-plane approach needs to be utilized because the error in the global equivalent stress approach increases with the level of non-proportionality and is not necessarily conservative.
The non-proportionality factor proposed in this work could be utilized in the future as a metric to choose an appropriate fatigue analysis procedure, finding the best compromise between accuracy and computational cost before actually carrying out the fatigue analysis. Further research is needed to clarify the applicability of different fatigue analysis concepts depending on the degree of non-proportionality. Moreover, experimental validation is imperative to substantiate the findings of this paper and future studies.
The code and data to reproduce the results are available from the corresponding author upon reasonable request.
CB wrote the paper, did a part of the literature research, prepared the graphical abstract, and provided scientific guidance and supervision to PNC in all project phases. PNC did the rest of the literature research, derived the equations, implemented pre- and postprocessing scripts in MATLAB, carried out the simulations, prepared figures, and internally reviewed the paper.
The contact author has declared that neither of the authors has any competing interests.
The information in this paper is provided as is and no guarantee or warranty is given that the information is fit for any particular purpose. The user thereof uses the information at its sole risk and liability.
Publisher’s note: Copernicus Publications remains neutral with regard to jurisdictional claims made in the text, published maps, institutional affiliations, or any other geographical representation in this paper. While Copernicus Publications makes every effort to include appropriate place names, the final responsibility lies with the authors.
This research was part of the Collaborative Research Center 1463 “Integrated Design and Operation Methodology for Offshore Megastructures” (SFB1463) and the coordinated research projects “SmartBlades2” and “ReliaBlade”. The authors acknowledge the financial support therein.
This research has been supported by the Deutsche Forschungsgemeinschaft (grant no. 434502799) and the Bundesministerium für Wirtschaft und Klimaschutz (grant nos. 0324032C and 0324335B).
The publication of this article was funded by the open-access fund of Leibniz Universität Hannover.
This paper was edited by Julie Teuwen and reviewed by Alexander Krimmer and four anonymous referees.
Adams, R. D.: Adhesive bonding: Science, technology and applications, second edition, Elsevier Ltd., https://doi.org/10.1016/C2019-0-00395-0, 2021. a, b
Anes, V., Reis, L., Li, B., and de Freitas, M.: New approach to evaluate non-proportionality in multiaxial loading conditions, Fatigue Fract. Eng. M., 37, 1338–1354, https://doi.org/10.1111/ffe.12192, 2014. a
Antoniou, A., Rosemeier, M., Tazefidan, K., Krimmer, A., and Wolken-Möhlmann, G.: Impact of site-specific thermal residual stress on the fatigue of wind-turbine blades, AIAA J., 58, 4781–4793, https://doi.org/10.2514/1.J059388, 2020. a
Antoniou, A. E., Vespermann, M. M., Sayer, F., and Krimmer, A.: Life prediction analysis of thick adhesive bond lines under variable amplitude fatigue loading, in: Proceedings of the 18th European Conference on Composite Materials (ECCM18), 24–28 June, Athens, Greece, 1–8, ISBN 9781510896932, 2018. a
Ataya, S. and Ahmed, M. M.: Damages of wind turbine blade trailing edge: Forms, location, and root causes, Eng. Fail. Anal., 35, 480–488, https://doi.org/10.1016/j.engfailanal.2013.05.011, 2013. a, b, c
Bak, C., Zahle, F., Bitsche, R., Kim, T., Yde, A., Henriksen, L. C., Natarajan, A., and Hansen, M. H.: Description of the DTU 10 MW Reference Wind Turbine, Tech. rep., DTU Wind Energy, Report-I-0092, 2013. a, b, c, d
Balzani, C. and Gebauer, J.: Impact of shell structure stiffness on aero-structural coupling in wind turbine rotor blades, IOP C. Ser.-Mat. Sci., 1293, 012025, https://doi.org/10.1088/1757-899X/1293/1/012025, 2023. a
Balzani, C., Noever-Castelos, P., and Wentingmann, M.: Finite element analysis and failure prediction of adhesive joints in wind turbine rotor blades, in: Proceedings of the 6th European Conference on Computational Mechanics and the 7th European Conference on Computational Fluid Dynamics, edited by: Owen, R., de Borst, R., Reese, J., and Pearce, C., CIMNE, 3779–3790, ISBN 9788494731167, 2018. a
Bangaru, A. K., Miao, X.-Y., Sørensen, B. F., and Chen, X.: Prediction of crack growth at trailing edge bondlines of a wind turbine rotor blade for the assessment of remaining service life, IOP Conf. Ser.-Mat. Sci., 1293, 012037, https://doi.org/10.1088/1757-899X/1293/1/012037, 2023. a
Bätge, M.: Design of a 20 m blade for the demonstration turbine (Deliverables 1.2.6.2/1.2.6.3), Schlussbericht Projekt SmartBlades, https://doi.org/10.2314/GBV:871472740, 2016. a, b, c
Beber, V. C., Fernandes, P., Schneider, B., Brede, M., and Mayer, B.: Fatigue lifetime prediction of adhesively bonded joints: An investigation of the influence of material model and multiaxiality, Int. J. Adhes. Adhes., 78, 240–247, 2017. a, b
Beltrami, E.: Sulle condizioni di resistenza dei corpi elastici, Il Nuovo Cimento, 18, 145–155, 1885. a
Bishop, J. E.: Characterizing the non-proportional and out-of-phase extent of tensor paths, Fatigue Fract. Eng. M., 23, 1019–1103, 2000. a, b, c, d, e, f, g, h, i, j, k
Boopathi, K., Mishnaevsky Jr., L., Sumantraa, B., Premkumar, S. A., Thamodharan, K., and Balaraman, K.: Failure mechanisms of wind turbine blades in India: Climatic, regional, and seasonal variability, Wind Energy, 25, 968–979, https://doi.org/10.1002/we.2706, 2022. a
Chen, X., Berring, P., Madsen, S. H., Branner, K., and Semenov, S.: Understanding progressive failure mechanisms of a wind turbine blade trailing edge section through subcomponent tests and nonlinear FE analysis, Compos. Struct., 214, 422–438, https://doi.org/10.1016/j.compstruct.2019.02.024, 2019a. a, b
Chen, X., Haselbach, P. U., Branner, K., and Madsen, S. H.: Effects of different material failures and surface contact on structural response of trailing edge sections in composite wind turbine blades, Compos. Struct., 226, 111306, https://doi.org/10.1016/j.compstruct.2019.111306, 2019b. a, b
Christensen, R. M.: A two-property yield, failure (fracture) criterion for homogeneous, isotropic materials, J. Eng. Mater.-T. ASME, 126, 45–52, 2004. a
de Castro, J. T. P. and Meggiolaro, M. A.: Fatigue Design Techniques Under Real Service Loads, Volume II – Low-Cycle and Multiaxial Fatigue, CreateSpace Independent Publishing Platform, 1st edn., ISBN 9781530797042, 2016. a
Deng, Q.-Y., Zhu, S.-P., He, J.-C., Li, X.-K., and Carpinteri, A.: Multiaxial fatigue under variable amplitude loadings: review and solutions, International Journal of Structural Integrity, 13, 349–393, 2022. a
Deng, Q.-Y., Zhu, S.-P., Niu, X., Lesiuk, G., Macek, W., and Wang, Q.: Load path sensitivity and multiaxial fatigue life prediction of metals under non-proportional loadings, Int. J. Fatigue, 166, 107281, https://doi.org/10.1016/j.ijfatigue.2022.107281, 2023. a
DNV GL: DNVGL-ST-0376 – Rotor blades for wind turbines, https://www.dnv.com/energy/standards-guidelines/dnv-st-0376-rotor-blades-for-wind-turbines/ (last access: 1 July 2025), 2015. a, b, c
Downing, S. D. and Socie, D. F.: Simple rainflow counting algorithms, Int. J. Fatigue, 4, 31–40, 1982. a
Drucker, D. C. and Prager, W.: Soil mechanics and plastic analysis or limit design, Q. Appl. Math., 10, 157–165, 1952. a
Eder, M., Bitsche, R., Nielsen, M., and Branner, K.: A practical approach to fracture analysis at the trailing edge of wind turbine rotor blades, Wind Energy, 17, 483–497, https://doi.org/10.1002/we.1591, 2014. a
Eder, M. A. and Bitsche, R. D.: Fracture analysis of adhesive joints in wind turbine blades, Wind Energy, 18, 1007–1022, https://doi.org/10.1002/we.1744, 2015. a
Eder, M. A., Semenov, S., and Sala, M.: Multiaxial Stress Based High Cycle Fatigue Model for Adhesive Joint Interfaces, in: Computational and Experimental Simulations in Engineering – Proceedings of ICCES2019, Mechanisms and Machine Science, vol. 75, edited by: Okada, H. and Atluri, S., Springer, Cham, 621–632, https://doi.org/10.1007/978-3-030-27053-7_53, 2020. a
Endo, T., Mitsunaga, K., Takahashi, K., Kobayashi, K., and Matsuishi, M.: Damage evaluation of metals for random or varying loading – three aspects of rain flow method, Mech. Beh. M., 1, 371–380, 1974. a
Fan, J., Vassilopoulos, A. P., and Michaud, V.: Mode I fracture of thick adhesively bonded GFRP composite joints for wind turbine rotor blades, Compos. Struct., 327, 117705, https://doi.org/10.1016/j.compstruct.2023.117705, 2024. a
Fatemi, A. and Shamsaei, N.: Multiaxial fatigue: An overview and some approximation models for life estimation, Int. J. Fatigue, 33, 948–958, 2011. a
Gilat, A., Goldberg, R. K., and Roberts, G. D.: Strain Rate Sensitivity of Epoxy Resin in Tensile and Shear Loading, NASA, Springfield, NASA/TM—2005-213595, https://ntrs.nasa.gov/api/citations/20050179433/downloads/20050179433.pdf (last access: 1 July 2025), 2005. a, b
Haselbach, P. U.: An advanced structural trailing edge modelling method for wind turbine blades, Compos. Struct., 180, 521–530, https://doi.org/10.1016/j.compstruct.2017.08.029, 2017. a
Haselbach, P. U. and Branner, K.: Effect of Trailing Edge Damage on Full-Scale Wind Turbine Blade Failure, in: Proceedings of the 20th International Conference on Composite Materials (ICCM20), Copenhagen, Denmark, 19–24 July 2025, http://www.iccm20.org/proceedings/ (last access: 20 June 2025), 2015. a
Haselbach, P. U. and Branner, K.: Initiation of trailing edge failure in full-scale wind turbine blade test, Eng. Fract. Mech., 162, 136–154, https://doi.org/10.1016/j.engfracmech.2016.04.041, 2016. a
Haselbach, P. U., Eder, M. A., and Belloni, F.: A comprehensive investigation of trailing edge damage in a wind turbine rotor blade, Wind Energy, 19, 1871–1888, https://doi.org/10.1002/we.1956, 2016. a
Hu, W., Choi, K. K., Zhupanska, O., and Buchholz, J. H. J.: Integrating variable wind load, aerodynamic, and structural analyses towards accurate fatigue life prediction in composite wind turbine blades, Struct. Multidiscip. O., 53, 375–394, https://doi.org/10.1007/s00158-015-1338-5, 2016. a
Hu, W., Zhao, W., Wang, Y., Liu, Z., Cheng, J., and Tan, J.: Design optimization of composite wind turbine blades considering tortuous lightning strike and non-proportional multi-axial fatigue damage, Eng. Optimiz., 52, 1868–1886, https://doi.org/10.1080/0305215X.2019.1690649, 2020. a
Hu, Y., Xia, Z., and Ellyin, F.: Deformation behavior of an epoxy resin subject to multiaxial loadings. Part I: Experimental investigations, Polym. Eng. Sci., 43, 721–733, 2003. a, b
International Electrotechnical Commission: Wind energy generation system – Part 1: Design requirements, International Standard No. 61400-1:2019, https://webstore.iec.ch/en/publication/26423 (last access: 20 June 2025), 2019. a
Itoh, T., Sakane, M., Ohnami, M., and Socie, D. F.: Nonproportional Low Cycle Fatigue Criterion for Type 304 Stainless Steel, J. Eng. Mater.-T. ASME, 117, 285–292, 1995. a, b, c, d, e
Itoh, T., Sakane, M., and Ohsuga, K.: Multiaxial low cycle fatigue life under non-proportional loading, Int. J. Pres. Ves. Pip., 110, 50–56, 2013. a
Jager, D. and Andreas, A.: NREL National Wind Technology Center (NWTC): M2 Tower, Boulder, Colorado, Measurement and Instrumentation Data Center (MIDC) of NREL (National Renewable Energy Laboratory) [data set], https://doi.org/10.7799/1052222, 1996. a
Jørgensen, J. B., Sørensen, B. F., and Kildegaard, C.: The effect of residual stresses on the formation of transverse cracks in adhesive joints for wind turbine blades, Int. J. Solid. Struct., 163, 139–156, https://doi.org/10.1016/j.ijsolstr.2018.12.020, 2019. a
Kanazawa, K., Miller, K. J., and Brown, M. W.: Cyclic deformation of 1 % Cr-Mo-V Steel under out-of-phase loads, Fatigue Fract. Eng. M., 2, 217–228, 1979. a
Katsaprakakis, D. A., Papadakis, N., and Ntintakis, I.: A Comprehensive Analysis of Wind Turbine Blade Damage, Energies, 14, 5974, https://doi.org/10.3390/en14185974, 2021. a
Kuhn, M.: Non-proportional fatigue by example of fiber-reinforced rotor blade adhesive, PhD thesis, Leibniz University Hannover, Institute for Wind Energy Systems, https://doi.org/10.15488/15770, 2023. a
Kuhn, M., Manousides, N., Antoniou, A., and Balzani, C.: Effects of non-proportionality and tension–compression asymmetry on the fatigue life prediction of equivalent stress criteria, Fatigue Fract. Eng. M., 46, 3161–3178, 2023. a, b, c, d
Lahuerta, F., Koorn, N., and Smissaert, D.: Wind turbine blade trailing edge failure assessment with sub-component test on static and fatigue load conditions, Compos. Struct., 204, 755–766, https://doi.org/10.1016/j.compstruct.2018.07.112, 2018. a, b
Lee, Y.-L. and Tjhung, T.: Chapter 3 – Rainflow Counting Techniques, in: Metal Fatigue Analysis Handbook – Practical problem-solving techniques for computer-aided engineering, edited by: Lee, Y.-L., Barkey, M. E., and Kang, H.-T., Elsevier Inc., 89–112, https://doi.org/10.1016/B978-0-12-385204-5.00003-3, 2012. a
Liu, X., Lu, C., Liang, S., Godbole, A., and Chen, Y.: Vibration-induced aerodynamic loads on large horizontal axis wind turbine blades, Appl. Energ., 185, 1109–1119, 2017. a
Manolas, D. I., Riziotis, V. A., and Voutsinas, S. G.: Assessing the Importance of Geometric Nonlinear Effects in the Prediction of Wind Turbine Blade Loads, J. Comput. Nonlin. Dyn., 10, 041008, https://doi.org/10.1115/1.4027684, 2015. a
Meggiolaro, M. A. and de Castro, J. T. P.: An improved multiaxial rainflow algorithm for non-proportional stress or strain histories – Part I: Enclosing surface methods, Int. J. Fatigue, 42, 217–226, 2012. a
Meggiolaro, M. A. and de Castro, J. T. P.: Prediction of non-proportionality factors of multiaxial histories using the Moment Of Inertia method, Int. J. Fatigue, 61, 151–159, 2014. a, b, c, d, e, f, g, h, i, j, k, l, m, n, o, p
Meggiolaro, M. A., de Castro, J. T. P., and Wu, H.: On the use of tensor paths to estimate the nonproportionality factor of multiaxial stress or strain histories under free-surface conditions, Acta Mech., 227, 3087–3100, 2016. a, b
Miner, M. A.: Cumulative Damage in Fatigue, J. Appl. Mech., 12, A159–A164, https://doi.org/10.1115/1.4009458, 1945. a
Noever Castelos, P. and Balzani, C.: On the impact of multi-axial stress states on trailing edge bondlines in wind turbine rotor blades, J. Phys. Conf. Ser., 753, 062002, https://doi.org/10.1088/1742-6596/753/6/062002, 2016a. a, b
Noever Castelos, P. and Balzani, C.: The impact of geometric non-linearities on the fatigue analysis of trailing edge bond lines in wind turbine rotor blades, J. Phys. Conf. Ser., 749, 012009, https://doi.org/10.1088/1742-6596/749/1/012009, 2016b. a, b, c
Noever-Castelos, P., Haller, B., and Balzani, C.: Validation of a modeling methodology for wind turbine rotor blades based on a full-scale blade test, Wind Energ. Sci., 7, 105–127, https://doi.org/10.5194/wes-7-105-2022, 2022. a
Popko, W., Thomas, P., Sevinc, A., Rosemeier, M., Bätge, M., Braun, R., Meng, F., Horte, D., Balzani, C., Bleich, O., Daniele, E., Stoevesandt, B., Wentingmann, M., Polman, J. D., Leimeister, M., Schürmann, B., and Reuter, A.: Reference Wind Turbine IWT-7.5-164 Rev 4, Tech. rep., Fraunhofer Institute for Wind Energy Systems IWES, Bremerhaven, Germany, https://doi.org/10.24406/IWES-N-518562, 2018. a, b, c
Raghava, R., Caddell, R. M., and Yeh, G. S. Y.: The macroscopic yield behaviour of polymers, J. Mater. Sci., 8, 225–232, 1973. a
Rankine, W. J. M.: On the stability of loose earth, Philos. T. R. Soc. Lond., 147, 9–27, https://doi.org/10.1098/rstl.1857.0003, 1857. a, b
Rosemeier, M.: Engineering approach for predicting tunneling crack initiation in trailing-edge adhesive joints of wind turbine blades under mechanical fatigue and thermal residual stresses, PhD thesis, TU Berlin, FG Luftfahrzeugbau und Leichtbau, Institute of Aeronautics and Astronautics, https://doi.org/10.14279/depositonce-19144, 2024. a
Rosemeier, M., Alexander, K., Bardenhagen, A., and Antoniou, A.: Tunneling crack initiation in trailing-edge bond lines of wind-turbine blades, AIAA J., 57, 5462–5474, https://doi.org/10.2514/1.J058179, 2019a. a, b
Rosemeier, M., Krimmer, A., Bardenhagen, A., and Antoniou, A.: Fatigue impact of mechanical and thermal residual stresses on the trailing edge bond line of wind turbine blades, in: AIAA Scitech 2019 Forum, San Diego, California, USA, 7–11 January 2019, 1–13, https://doi.org/10.2514/6.2019-0246, 2019b. a, b
Rosemeier, M., Gebauer, T., and Antoniou, A.: A practical approach for the peel stress prediction in the trailing-edge adhesive joint of wind turbine blades, IOP C. Ser.-Mat. Sci., 942, 012026, https://doi.org/10.1088/1757-899X/942/1/012026, 2020. a
Rosemeier, M., Gebauer, T., and Antoniou, A.: Sub-component versus full wind turbine blade structure: Influence of manufacture-induced thermal residual stresses on crack initiation in adhesive joints, in: 20th European Conference on Composite Materials (ECCM20), 26–30 June, Lausanne, Switzerland, Zenodo [data set], https://doi.org/10.5281/zenodo.6786885, 2022a. a, b
Rosemeier, M., Melcher, D., Krimmer, A., Wroblewski, W., and Antoniou, A.: Validation of crack initiation model by means of cyclic full-scale blade test, J. Phys. Conf. Ser., 2265, 032045, https://doi.org/10.1088/1742-6596/2265/3/032045, 2022b. a, b, c, d
Rubiella, C., Hessabi, C. A., and Fallah, A. S.: State of the art in fatigue modelling of composite wind turbine blades, Int. J. Fatigue, 117, 230–245, https://doi.org/10.1016/j.ijfatigue.2018.07.031, 2018. a
Rychlik, I.: A new definition of the rainflow cycle counting method, Int. J. Fatigue, 9, 119–121, 1987. a
Schleicher, F.: Der Spannungszustand an der Fließgrenze (Plastizitätsbedingung), J. Appl. Math. Mech., 6, 199–216, 1926. a
Socie, D. F. and Marquis, G. B.: Multiaxial fatigue, Society of Automotive Engineers, Warrendale, Pennsylvania, ISBN 9780768004533, 2000. a, b, c, d, e
Sonsino, C. M.: Multiaxial fatigue life response depending on proportionalitygrade between normal and shear strains/stressesand material ductility, Int. J. Fatigue, 135, 105468, https://doi.org/10.1016/j.ijfatigue.2019.105468, 2020. a
Stassi-D’Alia, F.: Flowand fracture of materials according to a new limiting conditionof yelding, Meccanica, 2, 178–195, 1967. a
Stephens, R. I., Fatemi, A., Stephens, R. R., and Fuchs, H. O.: Metal fatigue in engineering, John Wiley & Sons, New York, 2nd edn., ISBN 9780471510598, 2001. a
Söker, H.: 2 – Loads on wind turbine blades, in: Advances in Wind Turbine Blade Design and Materials, edited by: Brøndsted, P. and Nijssen, R. P. L., Woodhead Publishing, Philadelphia, 29–58, https://doi.org/10.1533/9780857097286.1.29, 2013. a
Tessmer, J., Montano Rejas, Z. M., Rose, M., Daniele, E., Stoevesandt, B., Riemenschneider, J., Hölling, M., and Balzani, C.: SmartBlades2 – Bau, Test und Weiterentwicklung intelligenter Rotorblätter, Final Report, https://doi.org/10.2314/KXP:178353785X, 2021 (in German). a
van Kuik, G. A. M., Peinke, J., Nijssen, R., Lekou, D., Mann, J., Sørensen, J. N., Ferreira, C., van Wingerden, J. W., Schlipf, D., Gebraad, P., Polinder, H., Abrahamsen, A., van Bussel, G. J. W., Sørensen, J. D., Tavner, P., Bottasso, C. L., Muskulus, M., Matha, D., Lindeboom, H. J., Degraer, S., Kramer, O., Lehnhoff, S., Sonnenschein, M., Sørensen, P. E., Künneke, R. W., Morthorst, P. E., and Skytte, K.: Long-term research challenges in wind energy – a research agenda by the European Academy of Wind Energy, Wind Energ. Sci., 1, 1–39, https://doi.org/10.5194/wes-1-1-2016, 2016. a
van Kuik, G. A. M., Peinke, J., Nijssen, R., Lekou, D., Mann, J., Sørensen, J. N., Ferreira, C., van Wingerden, J. W., Schlipf, D., Gebraad, P., Polinder, H., Abrahamsen, A., van Bussel, G. J. W., Sørensen, J. D., Tavner, P., Bottasso, C. L., Muskulus, M., Matha, D., Lindeboom, H. J., Degraer, S., Kramer, O., Lehnhoff, S., Sonnenschein, M., Sørensen, P. E., Künneke, R. W., Morthorst, P. E., and Skytte, K.: Long-term research challenges in wind energy – a research agenda by the European Academy of Wind Energy, Wind Energ. Sci., 1, 1–39, https://doi.org/10.5194/wes-1-1-2016, 2016. a
Vassilopoulos, A. P.: Fatigue life prediction of wind turbine blade composite materials, in: Advances in Wind Turbine Blade Design and Materials, edited by: Brøndsted, P. and Nijssen, R. P., Woodhead Publishing Series in Energy, Chap. 8, Woodhead Publishing, 251–297, ISBN 978-0-85709-426-1, https://doi.org/10.1533/9780857097286.2.251, 2013. a
Veers, P., Dykes, K., Lantz, E., Barth, S., Bottasso, C. L., Carlson, O., Clifton, A., Green, J., Green, P., Holttinen, H., Laird, D., Lehtomäki, V., Lundquist, J. K., Manwell, J., Marquis, M., Meneveau, C., Moriarty, P., Munduate, X., Muskulus, M., Naughton, J., Pao, L., Paquette, J., Peinke, J., Robertson, A., Rodrigo, J. S., Sempreviva, A. M., Smith, J. C., Tuohy, A., and Wiser, R.: Grand challenges in the science of wind energy, Science, 366, eaau2027, https://doi.org/10.1126/science.aau2027, 2019. a
Veers, P., Bottasso, C. L., Manuel, L., Naughton, J., Pao, L., Paquette, J., Robertson, A., Robinson, M., Ananthan, S., Barlas, T., Bianchini, A., Bredmose, H., Horcas, S. G., Keller, J., Madsen, H. A., Manwell, J., Moriarty, P., Nolet, S., and Rinker, J.: Grand challenges in the design, manufacture, and operation of future wind turbine systems, Wind Energ. Sci., 8, 1071–1131, https://doi.org/10.5194/wes-8-1071-2023, 2023. a
von Mises, R.: Mechanik der festen Körper im plastisch-deformablen Zustand, Nachrichten von der Gesellschaft der Wissenschaften zu Göttingen, Mathematisch-Physikalische Klasse, 4, 582–592, 1913. a
Wang, J., Huang, X., Wei, C., Zhang, L., Li, C., and Liu, W.: Failure analysis at trailing edge of a wind turbine blade through subcomponent test, Eng. Fail. Anal., 130, 105596, https://doi.org/10.1016/j.engfailanal.2021.105596, 2021. a
Wentingmann, M., Noever-Castelos, P., and Balzani, C.: An adaptive algorithm to accelerate thecritical plane identification for multiaxialfatigue criteria, in: Proceedings of the 6th European Conference on Computational Mechanics and the 7th European Conference on Computational Fluid Dynamics, edited by: Owen, R., de Borst, R., Reese, J., and Pearce, C., CIMNE, 3745–3754, ISBN 9788494731167, 2018. a, b
Wentingmann, M., Manousides, N., Antoniou, A., and Balzani, C.: Yield surface derivation for a structural adhesive based on multiaxial experiments, Polym. Test., 113, 107648, https://doi.org/10.1016/j.polymertesting.2022.107648, 2022. a
White, D. L. and Musial, W. D.: The Effect of Load Phase Angle on Wind Turbine Blade Fatigue Damage, J. Sol. Energ.-T. ASME, 126, 1050–1059, 2004. a
Wu, H., Qi, L., Qian, J., Cao, H., Shi, K., and Xu, J.: Experimental research on the compression failure of wind turbine blade trailing edge structure, J. Adhesion, 99, 1488–1507, https://doi.org/10.1080/00218464.2022.2126313, 2023. a
Zouain, N., Mamiya, E. N., and Comes, F.: Using enclosing ellipsoids in multiaxial fatigue strength criteria, Eur. J. Mech. A-Solid., 25, 51–71, 2006. a