the Creative Commons Attribution 4.0 License.
the Creative Commons Attribution 4.0 License.
 | 18 Jul 2025
Life cycle assessment of New Jersey offshore wind
Nawal Shoaib
Pankaj Lal
As offshore wind gains momentum within US (United States) renewable energy goals, New Jersey's ambitious targets for offshore wind development represent a significant opportunity to reduce emissions and transition towards cleaner energy sources. This study presents a life cycle assessment (LCA) of a planned offshore wind farm off of New Jersey's coast, emphasizing the implications of a domestic supply chain. Key findings suggest that the offshore wind farm is projected to produce 0.013 kg CO2 kWh−1 of electricity generated, reflecting a 98 % decrease in carbon emissions compared to natural-gas-derived electricity. Further, when compared to carbon emissions from other renewable energy technologies, offshore wind outperforms both solar and onshore wind by 79 % and 43 %, respectively. This finding highlights offshore wind's role in greenhouse gas (GHG) emissions reduction through decarbonizing the electricity generation sector. This role is reinforced through the case of a domestic supply chain, a necessary factor in the mitigation of transportation-related impacts, like fuel combustion, to decrease emissions. Beyond GHG emissions, results indicate that the steel-intensive materials used in turbines and infrastructure contribute heavily to toxicity-related impacts, highlighting a need to seek alternative, lower-impact materials. This research underscores the potential of offshore wind to reduce greenhouse gas emissions and offers insight into the environmental dynamics and improved environmental-impact-based decision making to improve offshore wind deployment in the US.
- Article
(3111 KB) - Full-text XML
-
Supplement
(502 KB) - BibTeX
- EndNote


1.1 Offshore wind energy in New Jersey
Globally, offshore wind has been identified as a key player in mitigating the effects of climate change by reducing the reliance on fossil-fuel-based energy generation. In 2021, the United States (US) federal government announced the ambitious goal of deploying 30 GW of offshore wind technology by 2030, and 110 GW by 2050 (The White House, 2021; U.S. Department of Energy, 2022). In line with these national goals, New Jersey set the offshore wind goals of 7.5 GW by 2035, and 11 GW by 2040 (New Jersey Executive Order No. 92, 2019; New Jersey Executive Order No. 307, 2022). New Jersey's current electricity generation profile does not meet the state's needs; the state produces 64.4 TWh yr−1 of electric power (mostly from natural gas and nuclear sources) but consumes 74 TWh (U.S. Energy Information Administration, 2024a). Offshore wind development opens the opportunity to disrupt the state's reliance on nonrenewable sources of electricity generation, improve energy security and independence, and contribute to the national goals by improving the electricity generation mix countrywide.
At the federal level, the Bureau of Ocean Energy Management (BOEM) has facilitated the lease sales of outer-continental-shelf (OCS) blocks for the development of offshore wind energy farms. Average wind speeds of approximately 8–9 m s−1 at 90 m high have been measured on New Jersey's coastline, making this region ideal for offshore wind development (U.S. Energy Information Administration, 2021; Hernando et al., 2023). There are currently three offshore lease areas with projects in development off the coast of New Jersey (Fig. 1). Collectively, these lease areas and their proposed projects will have the capacity to produce 5.2 GW of clean energy. It is estimated that these projects would cut the state's electricity generation greenhouse gas (GHG) emissions by 6.0×10⁶ t annually by displacing fossil fuels (Official Site of the State of New Jersey, 2024). Supporting these and future offshore wind projects is the New Jersey Wind Port – an offshore wind marshaling port designed to provide open access to the Atlantic Ocean and offshore wind lease areas and host the technical tradespeople and workforce needed to support the industry.
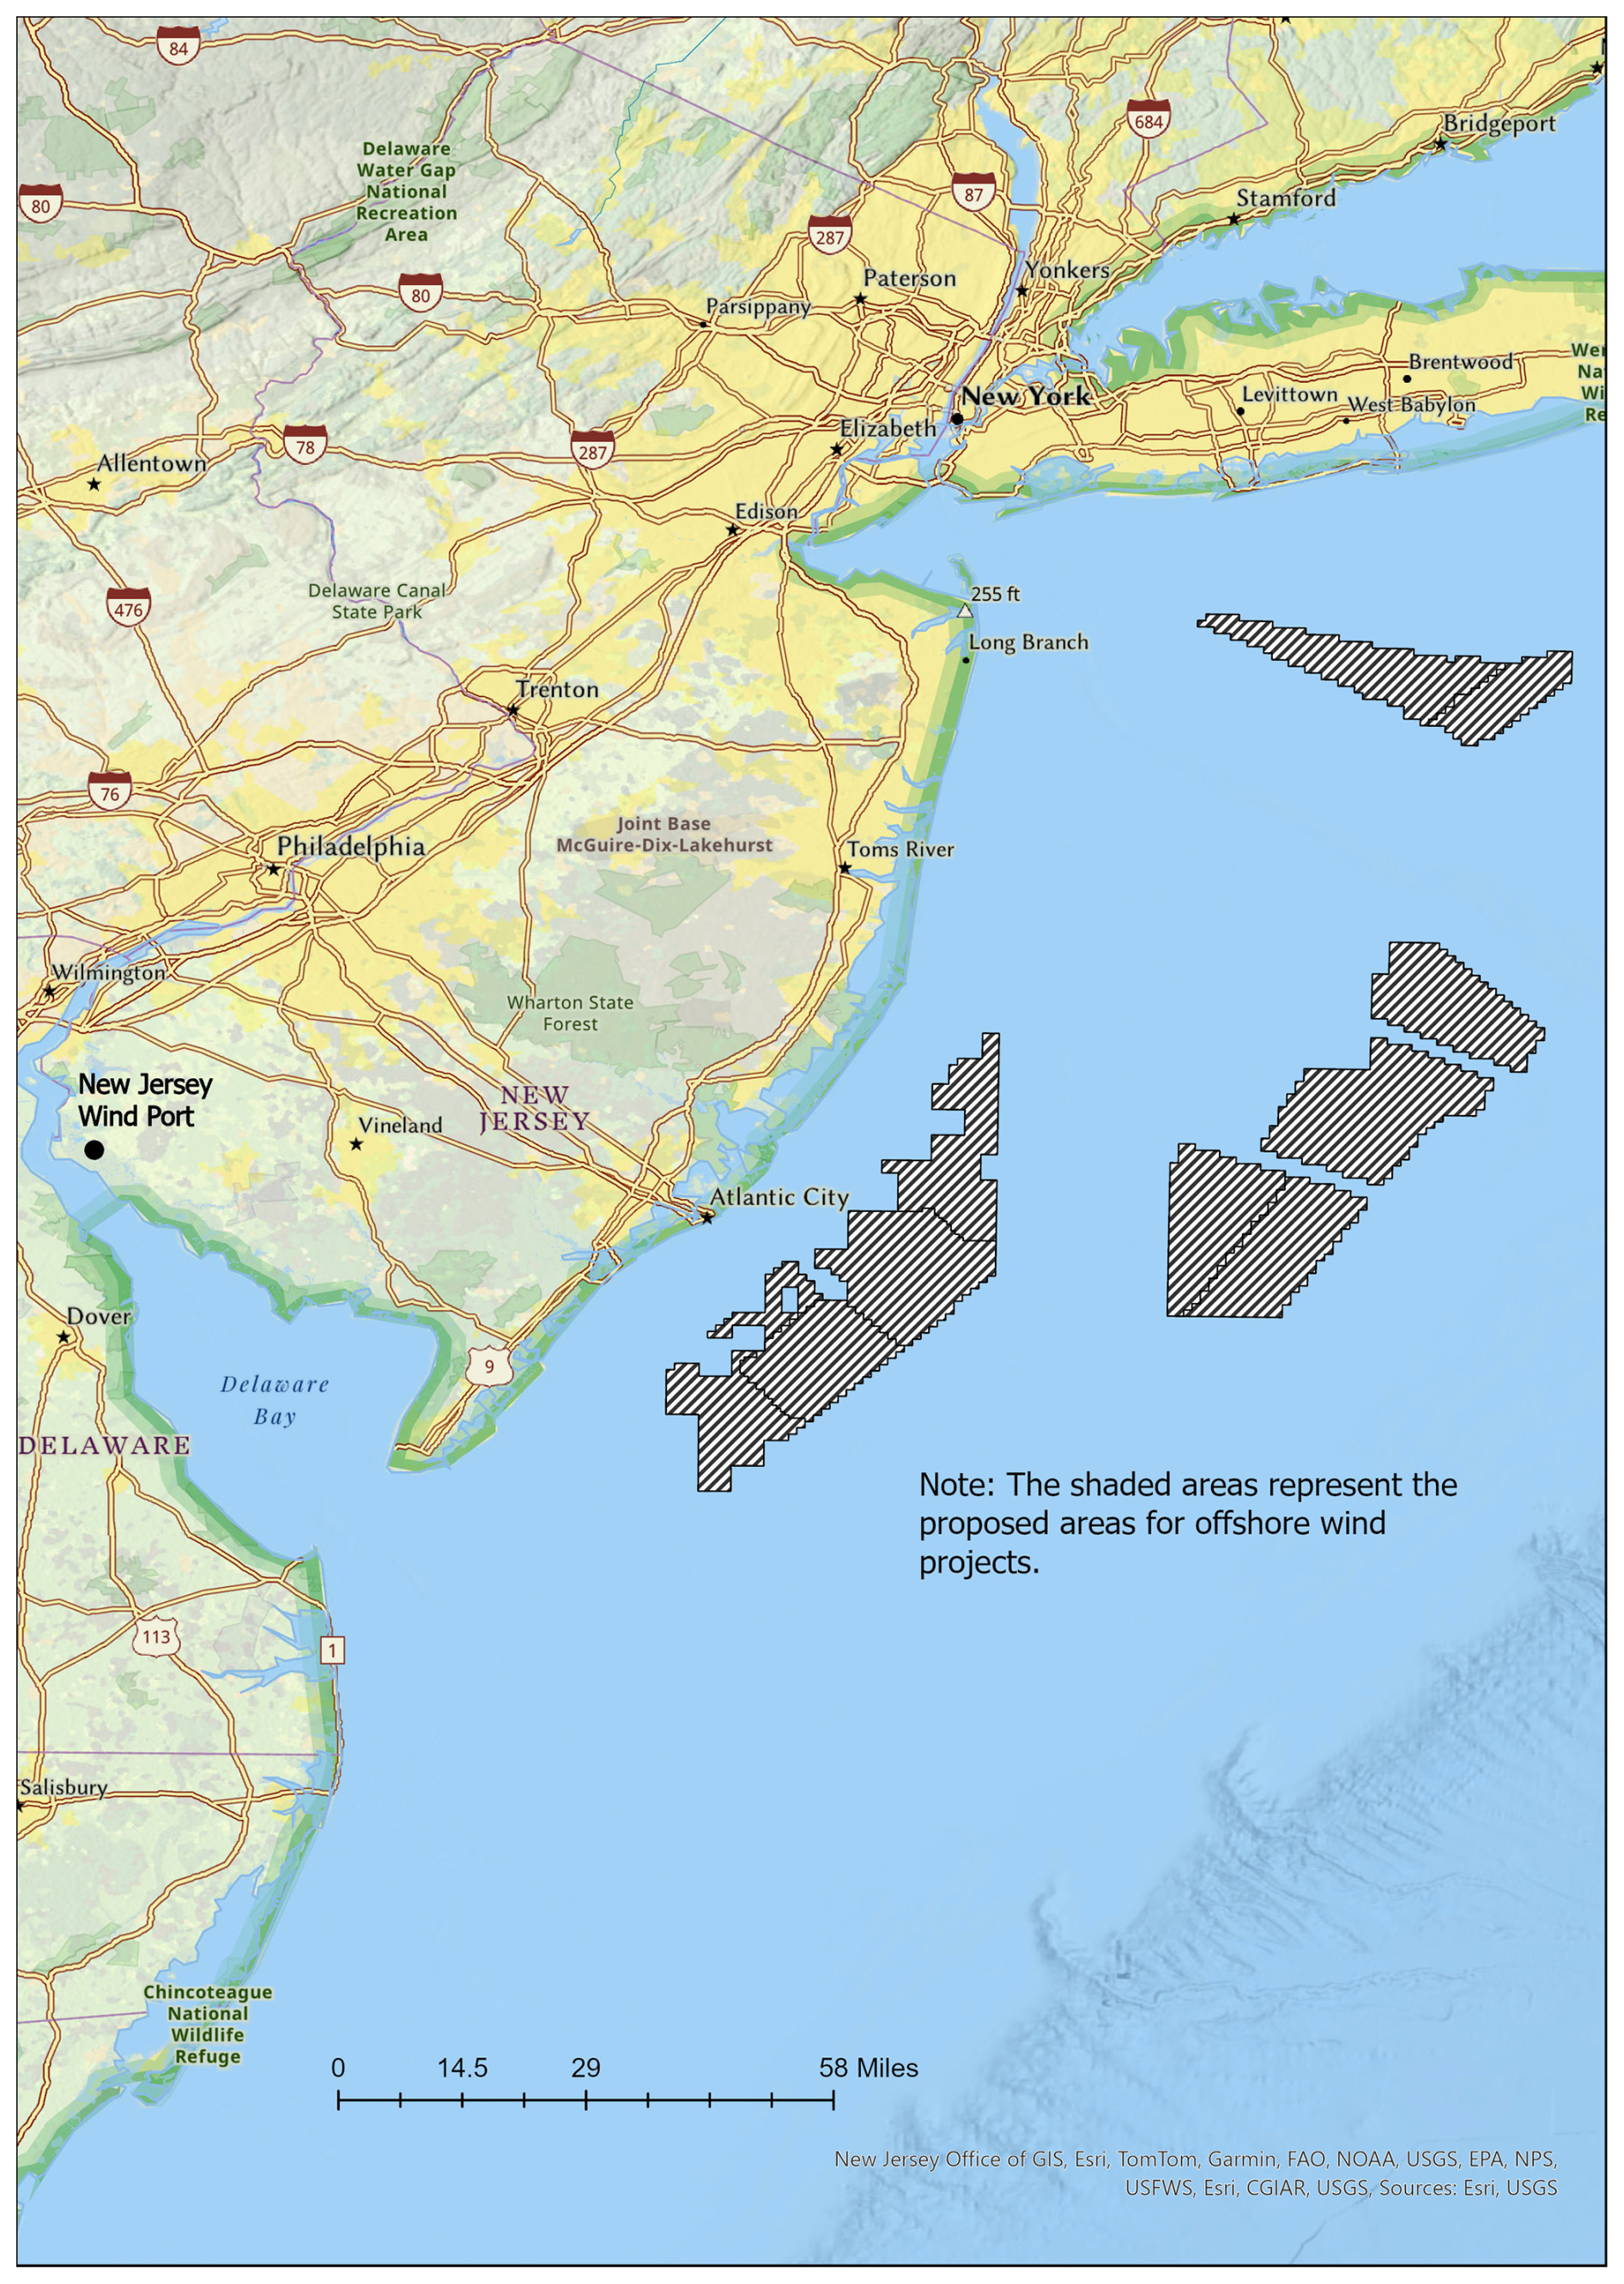
Figure 1Map of offshore wind project lease areas and the New Jersey Wind Port.
While progress has been made towards reaching these goals, there are several barriers towards the sustainable development of offshore wind energy. One major concern is the domestic supply chain needed to support these projects. The US Department of Energy (DOE) has established the Near-term Offshore Wind (NOW) initiative, which outlines their research and development (R&D) efforts and plans to address the supply chain issue, among other concerns (U.S. Department of Energy, 2023). Among these R&D efforts are two National Renewable Energy Laboratory (NREL) reports that discuss the demand for and a road map towards a domestic offshore wind supply chain (Shields et al., 2022, 2023). In addition to the New Jersey Wind Port, several manufacturing facilities for critical offshore wind energy components have been announced along the Atlantic coastline, which will help support offshore wind development in the state. In order for US offshore wind to be successful and financially viable, this supply chain must exist to meet the demand pipeline and maintain a sustainable industry. Dependence on established international supply chains has resulted in a cyclical pattern, where delays in project timelines contribute to financial losses, project cancelations, and escalating inflation, thereby exacerbating both costs and delays (National Offshore Wind Research and Development Consortium, 2021; Shields et al., 2023).
1.2 Scope 1, 2, and 3 emissions
The GHG Protocol first defined Scope 1, 2, and 3 emissions as a way of categorizing the different kinds of carbon emissions that a company creates in its own operations and in its value chain (The Greenhouse Gas Protocol, 2004). Scope 1 emissions are from sources that the organization directly owns or controls. Scope 2 emissions are from the energy purchased in order to support the organization's operations. Scope 1 and 2 emissions are more straightforward to calculate because the reporting organization has the primary data required to calculate the associated emissions. Scope 3 emissions encompass all other emissions that are not produced by the organization itself but rather by the wider value chain. These “scopes” are the basis for GHG reporting and have been widely adopted for mandatory standardization of how organizations measure their emissions (The Greenhouse Gas Protocol, 2015). Because of dynamic supply chains and limited transparency across organizations, the indirect Scope 3 emissions can be incredibly challenging to calculate. It is estimated that over 70 % of an organization's emissions could be categorized as Scope 3 emissions, making this a crucial component of environmental accounting (The Greenhouse Gas Protocol, 2011). By developing an extended environmental impact assessment that includes each scope of emissions, we can avoid the concern of “shifting the burden” to another part of the value chain. This circular or systems thinking is critical for accurate emissions accounting as well as sustainable metric design and development.
1.3 Life cycle assessment of wind energy
Life cycle assessment (LCA) is a systematic analysis of the environmental impact over the course of the entire lifetime of a product, process, or system. LCA is an advanced modeling technique compared to traditional input–output models, in that it accounts for the interacting systems in a production value chain. LCA goes beyond traditional CO2 accounting, expands to include a suite of emissions, and aggregates emission data into impact categories, which is useful in providing valuable data for informing sustainability initiatives. As LCA provides information to evaluate the environmental efficacy of the value chain, it is also useful for downstream and upstream hot-spot analysis, which can lead to continuous improvement. LCA has been used extensively to evaluate the environmental impact of renewable energy technology and projects. By comparing these newer technologies to traditional fossil fuels, LCA has proven to be a useful tool for justifying the transition to these often costly and expansive projects.
Recent studies reveal that while offshore wind turbines generally produce significantly lower emissions compared to fossil-fuel-based energy sources, their environmental impact can be significant due to the energy-intensive manufacturing of steel and other materials used in turbine construction. The material production and transportation stages contribute substantially to the GHG emissions associated with offshore wind, often constituting up to 80 % of the life cycle emissions of a single turbine (Brussa et al., 2023; Chen et al., 2023; Moussavi et al., 2023; Yuan et al., 2023). Globally, offshore wind life cycle studies have predominantly focused on European markets, where the industry is more established and it benefits from the well-developed infrastructure. US studies are, however, limited; the nuances of turbine design, grid integration challenges, limited supply chain, and specific regulatory requirements are not well understood (Moussavi et al., 2023).
LCA is unique in that geographical context is key for creating a realistic model; while LCAs in different geographies can provide useful insights, they fail to capture the details pertaining to specific geographies and technologies. This research addresses this subject gap by modeling the developing offshore wind industry in New Jersey with an established domestic supply chain.
2.1 Goal and scope of the study
This study applies LCA, which quantifies the potential environmental impacts throughout the life cycle of a system; in this case, the system refers to all life cycle stages of an offshore wind farm, from raw material extraction to waste management (ISO 14040:2006, International Organization for Standardization, 2018a; ISO 14044:2006, International Organization for Standardization, 2018b). We performed the LCA using the SimaPro Version 9.5 software, applying the ReCiPe 2016 method under the hierarchist (H) perspective, which calculates emissions based on a global perspective with a 100-year time horizon (Huijbregts et al., 2016a; PRé Sustainability, 2023). The ReCiPe midpoint method aggregates complex emission data into 18 cause–impact categories, while the endpoint reflect damage in three areas of protection: human health, ecosystem quality, and resource scarcity (Table S1) (Goedkoop et al., 2009; Huijbregts et al., 2016a). These two methods are complementary in that they highlight environmental flows with minimal uncertainty and allow for easier interpretation and greater relevance of those environmental flows.
This offshore wind farm LCA is meant to act as a baseline model for offshore wind farms in development off the coast of New Jersey, US, on the Atlantic continental shelf. The Atlantic coast has shallower water depths, 60 m or less, that are suitable for fixed-bottom offshore wind turbines (U.S. Department of Energy, 2022) as opposed to floating substructures. Atlantic Shores Offshore Wind, LLC, was awarded lease area OSC-A-0499 in 2019, which will be launched in two projects (south and north), allowing for a combined 1510 MW of renewable energy flowing into the state of New Jersey. The Atlantic Shores Offshore Wind south project is the furthest along in the planning and development phase among all of the New Jersey offshore wind projects (Atlantic Shores Offshore Wind, 2024a). Designed to operate up to 30 years, the south project (219.2 km2) will consist of 105–136 turbines spaced 1.9 km apart connected through inter-array cables, with the most westward point approximately 14 km from the shoreline. There will be two large offshore substations, which connect to the landfall point near Atlantic City through submarine cables. From the landfall point, the power is transmitted to an onshore substation about 20 km away (Atlantic Shores Offshore Wind, 2024a). Relying on the published details of the planned south project to create the framework for this study makes for a narrow goal with a well-defined scope to reduce uncertainty in the model in a developing sector.
Because construction of this project is not projected to begin until after 2026, this LCA uses the International Energy Agency (IEA) Wind 15 MW Offshore Reference Wind Turbine (IEA Wind 15 MW) with a fixed-bottom monopile support structure to model its offshore wind farm. We assume 105 turbines at a more conservative 25-year lifetime operating at 40 % efficiency (capacity factor), with power transmission as specified in the official Atlantic Shores documentation summarized above. Blades are the turbine component most susceptible to wear over time; however, they are built to last 20–25 years (Lui and Barlow, 2017; Majewski et al., 2022). This model further attempts to construct a domestic supply chain informing the transportation of goods and materials based on locations of announced manufacturing facilities operating on the same regional electricity generation mix (Smith et al., 2021; Shields et al., 2023). The selected functional unit is 1 kWh of electricity produced by the offshore wind farm that is sent to the onshore grid.
2.2 System boundary
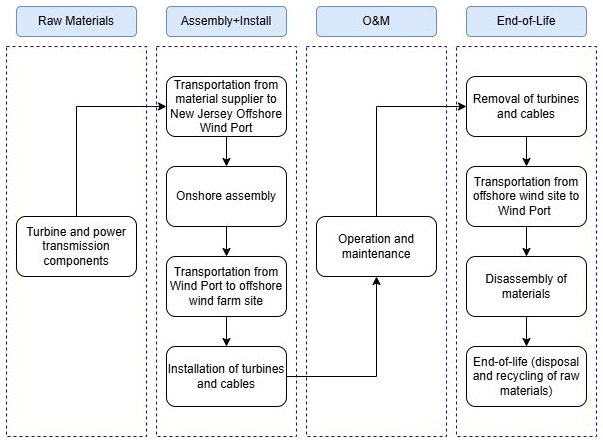
In the system boundaries of the model, each life cycle stage is included: (1) materials; (2) assembly, transportation, and installation; (3) operation and maintenance; and (4) dismantling, transportation, and end of life (Fig. 2).
Not included in the LCA model is the existing onshore substation, which is used to transform high-voltage electricity so that it is suitable for local distribution. Local distribution and end-use of the electricity is also outside of the scope of this model, as it is considered part of the broader electricity grid infrastructure rather than being unique to the offshore wind project itself. While the offshore substation is included in the model, we limit this to the steel structure and do not include electrical, communications, or safety equipment in order to focus on components with high material and energy impacts. Assumptions in the transportation stages include the shortest distance traveled on both land and the sea. A more advanced transportation model using weight-restricted truck routes and sea-depth-restricted navigation routes can provide additional insights once the exact locations of these facilities are announced.
2.3 Life cycle inventory (LCI)
The data used in this analysis were collected and adapted from the Ecoinvent version 3.9.1 (allocation, cutoff by classification – unit) database among other governmental and academic literature sources, where calculations were made such that the model would be representative of an offshore wind farm as described in the Atlantic Shores Offshore Wind, LLC, documentation based on the study's functional unit of 1 kWh. The LCI is available in this study's Supplement (Tables S2–S6).
2.3.1 Materials
IEA Wind 15 MW turbine
The turbines are modeled based on the IEA Wind 15 MW, which was designed based on the GE Haliade-X 12 MW turbine, using a similar drivetrain configuration and specific power that is meant to model the potential of offshore wind technology in coming years (Gaertner, 2020). The IEA Wind 15 MW is an International Electrotechnical Commission (IEC) Class I-B direct-drive machine, meaning that it is appropriate for high wind speeds (average 10 m s−1) and low (16 %) turbulence; it is rated for 332 W m−2.
The tower and monopile are an isotropic steel tube, where the hub height reaches 150 m, allowing 30 m of ground clearance from the blades, and extends 30 m beneath the sea level to the mud line. The monopile foundation has a 10 m diameter, and attaches to the seafloor using an embedded suction pile 45 m below the mud line. While steel makes up the large majority of the mass (95 %), other materials, such as those for cables, electronic devices, and lubricant oil, are considered in the LCI (Raadal et al., 2014; Brussa et al., 2023).
The direct-drive nacelle uses a permanent-magnet synchronous radial flux outer-rotor generator. This design offers several advantages, including fewer parts, lower complexity, and higher reliability compared to geared drivetrains. The assembly consists of a hub shaft supporting the turbine and generator rotors on two bearings, which are housed on a turret and cantilevered from the bed plate, and the yaw system connects the bed plate base with the tower top. Based on the details shared in the IEA report, the nacelle, generator, and rotor are analyzed separately. While these components are primarily made of steel and iron, additional materials are considered, including copper, transformers, electronics, and the magnet.
The blade design was based on the rotor diameter of 240 m; 3117 m blades attach to the rotor. The blade design is two main load-carrying carbon fiber spars connecting the root and the tip, with two shear webs that span the vertical length; the leading and trailing edges have reinforcing glass fiber and foam filler panels. We assume that 90 % of the weight of the blade comes from carbon fiber reinforced plastic (CFRP) and glass fiber reinforced plastic (GFRP) and that 10 % is from polyvinyl chloride (PVC) foam.
Power transmission
At its closest point, the south project wind turbine area is approximately 14 km from the New Jersey shoreline; the turbines will be aligned in a uniform grid, connected by inter-array cables and inter-link cables (totaling about 440 and 30 km, respectively) buried about 2 m beneath the seabed. The inter-array cables are estimated to be 35 kg m−1, and the inter-link cables connecting to the substations are estimated to be 50 kg m−1. The project will require two large offshore substations, which will be located approximately 21 km from the landfall point near Atlantic City. We estimate that there will be four high-voltage direct current (HVDC) export cables totaling about 84 km in length buried about 2 m beneath the seabed (Atlantic Shores Offshore Wind, 2024b), weighing approximately 60 kg m−1. The proposed onshore interconnection cable route (landfall point to existing onshore substation) is estimated to be 20 km in length and to weigh approximately 40 kg m−1. The material breakdown of power transmission and approximate weight per length of each type was informed by OpenAI and validated referencing the previous literature (Brussa et al., 2023; Moussavi et al., 2023; OpenAI, 2023).
2.3.2 Assembly, transportation, and installation
Included in the assembly, transportation, and installation phase are the electricity used while operating on the regional grid, which is estimated at 50 kWh t−1 of material (Burger and Bauer, 2007; Brussa et al., 2023); the transportation of materials from suppliers to the New Jersey Wind Port (Shields et al., 2023); the transportation of materials from the Wind Port to the wind farm (Atlantic Shores Offshore Wind, LLC, 2024a); and seabed transformation (219.2 km2) and occupation (6.58×10⁶ m2 yr−1) (Atlantic Shores Offshore Wind, LLC, 2024b).
Regional electricity generation mix
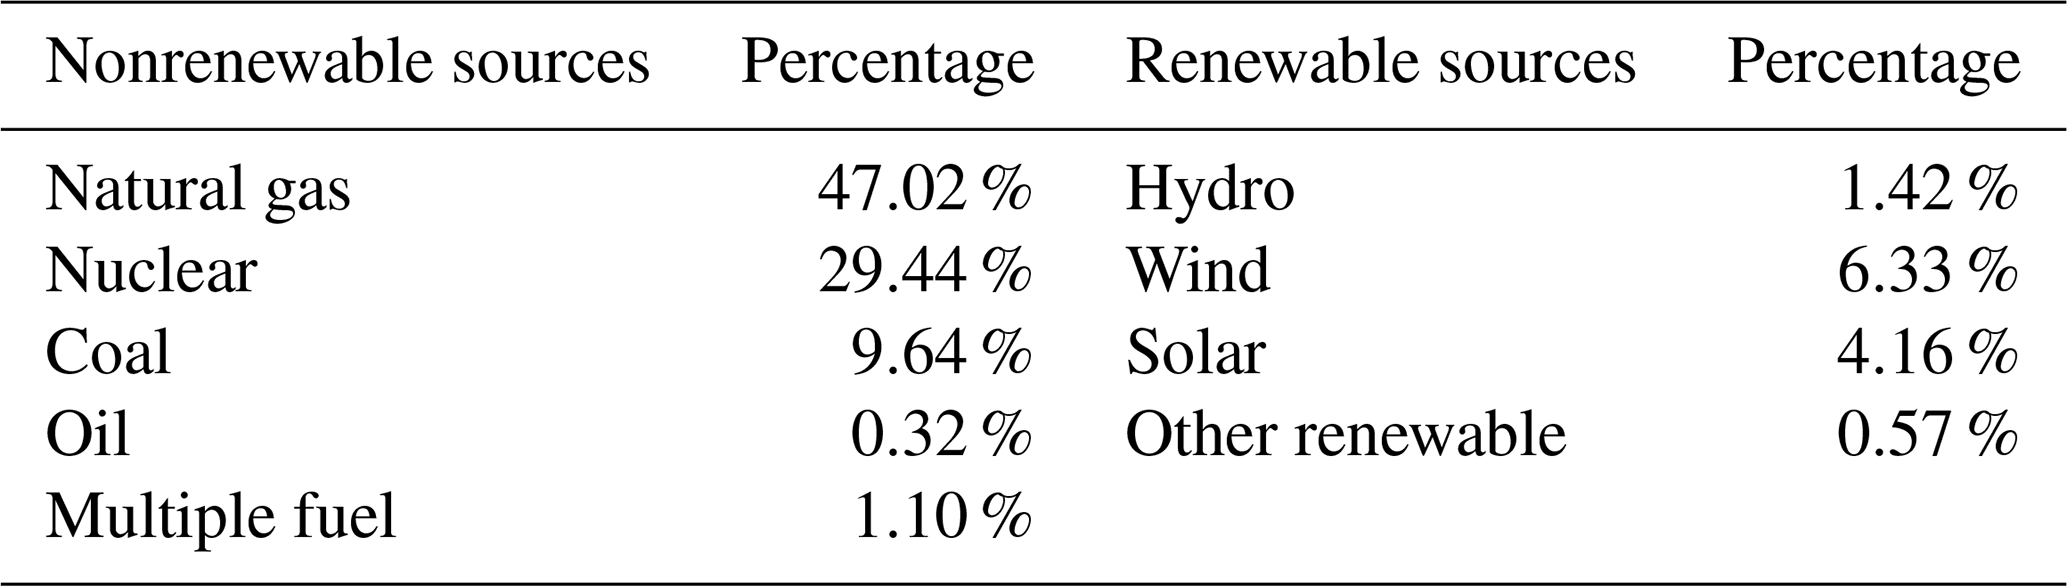
PJM Interconnection is an independent system operator/regional transmission organization (ISO/RTO) that coordinates the movement of wholesale electricity in all or parts of 13 states and the District of Columbia. Among the areas covered are New Jersey, Virginia, and Maryland, which are all a part of the modeled regional supply chain described in the following section. We assume that the electricity associated with assembly, installation, and disassembly draws upon the PJM Interconnection electricity generation mix, creating a custom process in SimaPro to reflect regionality (Table 1) (PJM Markets and Operations, 2024).
Transportation from the supplier to the New Jersey wind port
The offshore wind energy industry in the US is gaining momentum, and in order to be viable in terms of both timeline and finances, there needs to be a domestic supply chain. While this supply chain is not fully developed, there are several announced and planned supply chain manufacturing facilities, as outlined in the NREL's Supply Chain Road Map (Shields et al., 2023), which is the basis for our supply chain transportation model (Table 2).
Table 2The announced domestic supply chain located near New Jersey.
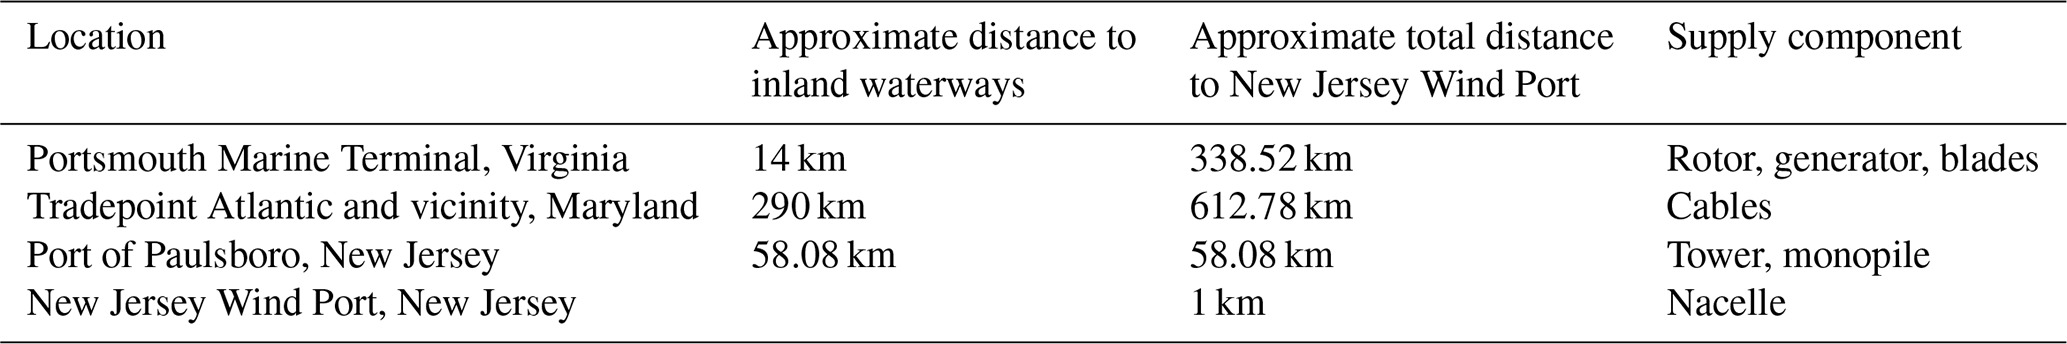
The New Jersey Wind Port is set to be located on the eastern shore of the Delaware River in Lower Alloways Creek, New Jersey. The Wind Port will be the first of its kind in the US, a hub-style marshalling and manufacturing port that will serve wind projects in New Jersey and along the US east coast. The Wind Port will be developed in two phases: (1) a 30 acre (∼ 12 ha) marshalling port that was targeted for completion in 2024 and (2) 35 additional acres (∼ 14 ha) of marshalling space, enabling two projects to marshal concurrently, and 60–70 acres (∼ 24–28 ha) of space developed for supply chain manufacturers (i.e., Tier 1 components such as nacelles). Transportation of the parts produced at the Wind Port uses the largest-capacity freight transport lorry available in Ecoinvent, size class > 32 t gross vehicle weight, which already includes fuel consumption; we assume 1 km of travel as an estimate for on-site movement. Transportation of the parts produced in the three other locations to the Wind Port uses the freight carrier with a 50 000 t load capacity to best represent a transport barge, which is a large flat-bottomed vessel used to transport materials from the port, through inland waterways, and out to the point of installation. A towing tugboat is needed to tow large vessels safely in and out of inland waterways to/from the New Jersey Wind Port. With no representative vessel available in the Ecoinvent database, we calculated that the diesel fuel needed to operate a tugboat is approximately 568 L h−1 (Weeks Marine, 2024). Distances were estimated using the Google Earth measurement tool (Google LLC, 2025). Based on the carrying capacity of the barge, the weight of each supply component, the distance from each port to the New Jersey Wind Port, and the assumption that the tugboat would travel at a speed of 8 knots h−1, we calculated 68 838 L or 58.5 t of diesel fuel consumed per round trip. The equipment that would be needed to load and unload the material is outside of the system boundaries.
Transportation from the New Jersey wind port to offshore wind farm
The total distance traveled from the Wind Port to the offshore wind site is estimated at 210 km, with the first 50 km requiring tugboat assistance within inland waterways estimated using the Google Earth measurement tool (Google LLC, 2025). As in the previous section, we chose the same freight carrier with a 50 000 t load capacity and calculated the diesel fuel needed to operate a tugboat for approximately 5 h in each direction, consuming 5678 L or 4.8 t of diesel fuel each trip. Due to the load capacity of the transport barge, this would require eight trips total.
Installation
Installation of the offshore wind farm requires several pieces of specialized equipment, including heavy-lift vessels, jack-up vessels, dredgers, and service vessels for the crew and operators. While the vessels are not represented in this analysis, fuel consumption of the vessels is included.
The heavy-lift vessel is equipped with heavy equipment, such as the specialized cranes needed to move the materials from the barge to the point of installation (consumes 14 t diesel fuel d−1). The jack-up vessel is a barge with legs that can create a stable platform above the water, used for drilling, dredging, and wind turbine installation (consumes 14 t d−1) (Fred. Olsen Windcarrier, 2019). The dredger (18 t d−1) is equipped with excavation tools to remove sediment from the seabed for cable laying, and the fall pipe vessel (14 t d−1) is used to move cement or rocks to bury the cables after they are installed (De Cuyper et al., 2014; Van Oord, 2021). For each of these vessels, a towing tugboat (5.2 t d−1) would be needed to navigate narrower waters (70 km) (Weeks Marine, 2024). Service operation vessels (9 t d−1) are used to provide safe extended housing for crew during periods of construction and maintenance (Weeks Marine, 2024). Assuming a 2-year construction period, these vessels would consume about 55 000 t of diesel fuel combined. Not included is the use of helicopters during installation, maintenance, and disassembly, which in some cases is necessary to support the transportation and hoisting of personnel and equipment to save time, especially during challenging weather conditions.
2.3.3 Operation and maintenance
Offshore wind farms require corrective, preventative, and predictive maintenance in order to efficiently operate and maintain the machines and their wearable parts. Both the south and north parts of the Atlantic Shore Project will be designed to operate autonomously without on-site technicians and will be equipped with supervisory control systems and monitoring sensors to interface between the various components of the site. These remote-control systems are outside of the scope of this work. This LCA assumes regularly scheduled annual maintenance and no unscheduled maintenance, where crew will inspect, test, replace consumable materials, and complete any preventative maintenance needed. This will include the use of a service operation vessel and the replacement of the lubricating oil in each turbine. We assume that all wearable parts will require no material replacement (e.g., blade removal and replacement), as they are built to last the full 25-year lifetime.
2.3.4 Dismantling, transportation, and end of life
This process represents the removal of all property and the restoration of the leased area on termination of the lease as per the lease agreement. Dismantling the offshore wind turbines is modeled using the same inputs as the “assembly, transportation, and installation”, with a few exceptions. Transportation from the New Jersey Wind Port to the supplier is not included, land transformation is from seabed infrastructure to the “unspecified” category, and land occupation is to the sea and ocean.
This process also includes the material end of life after it has been disassembled, following the method of Brussa et al. (2023). Metals (steel, aluminum, copper, and iron) are 90 % recycled and 10 % landfilled. High recycling rates in industry standards are supported by established recycling infrastructure with high recovery rates (International Energy Agency, 2021). The recycling process used is an empty process with no emissions or waste to avoid double counting; however, recycling tends to be an energy-intensive process and should be further explored in future research to better assess environmental trade-offs (Brussa et al., 2023; International EPD® system, 2021). Glass from the turbine blades and plastics from several components are 100 % incinerated. Electronics and cables are 100 % treated and disposed, and lubricating oil is 100 % treated as hazardous waste and incinerated.
2.4 Comparison analysis
The US Energy Information Administration (EIA) estimated the resulting CO2 emissions according to fuel source, including petroleum (1.08 kg CO2 kWh−1), coal (1.04 kg CO2 kWh−1), and natural gas (0.44 kg CO2 kWh−1) (U.S. Energy Information Administration, 2024b). Further, because the US operates on a diverse electricity generation mix, including 21 % of electricity produced from renewable sources, the same report estimates that the nation's grid produced 0.39 kg CO2 eq. kWh−1 of electricity produced in 2022 (CO2 eq. is the CO2 equivalent). To further assess the performance of the offshore wind farm, we compare the model to the conventional and renewable electricity generation sources currently used by PJM Interconnection (Table 1). The selected Ecoinvent processes are listed in Table S7.
3.1 Life cycle impact assessment
To calculate the environmental impact of Atlantic Shores south, we included the turbine and power transmission materials, transportation from domestic suppliers to the New Jersey Wind Port, transportation to the offshore wind farm area, assembly and installation of the turbines and cables, annual operation and maintenance, disassembly, and end-of-life waste treatment. The model assumes 105 fixed monopile turbines (15 MW) connected by inter-array cables and linked to two offshore substations, where export cables run to the shoreline where they connect to the onshore substation, with a 25-year operational lifetime. The impacts across each midpoint and endpoint category per functional unit of 1 kWh of wind energy power produced are shared in Table S8.
The results of the impact assessment display the emissions produced by the offshore wind farm per 1 kWh of wind energy power produced. Across several midpoint impact categories, the tower and monopile account for the largest percentage of impact, primarily due to the large amount of steel (Fig. 3). The overall global warming impact of kg carbon dioxide equivalent (kg CO2 eq.) is substantial, with 36.9 % coming from the tower and monopile. Steel production is known to have a significant environmental impact, accounting for approximately 9 % of global greenhouse gas emissions. The coke ovens used for steel production are also associated with high air pollution, releasing emissions such as naphthalene and sulfur during the cooking process. Steel production also produces substantial wastewater; the overall water consumption is estimated at m3, with 24.3 % coming from the tower and monopile process. The steel process used in this study is produced by a basic oxygen furnace, which is highly carbon intensive and relies on substantial amounts of water for cooling and emissions control. However, the more common method of steel production in the US is by electric arc furnace (EAF), which has a lower environmental impact due to its greater use of steel scrap and smaller water consumption (American Iron and Steel Institute, 2023). Future work modeling the EAF steel production pathway is likely to present lower emissions and a more accurate outlook for a fully domestic supply chain.
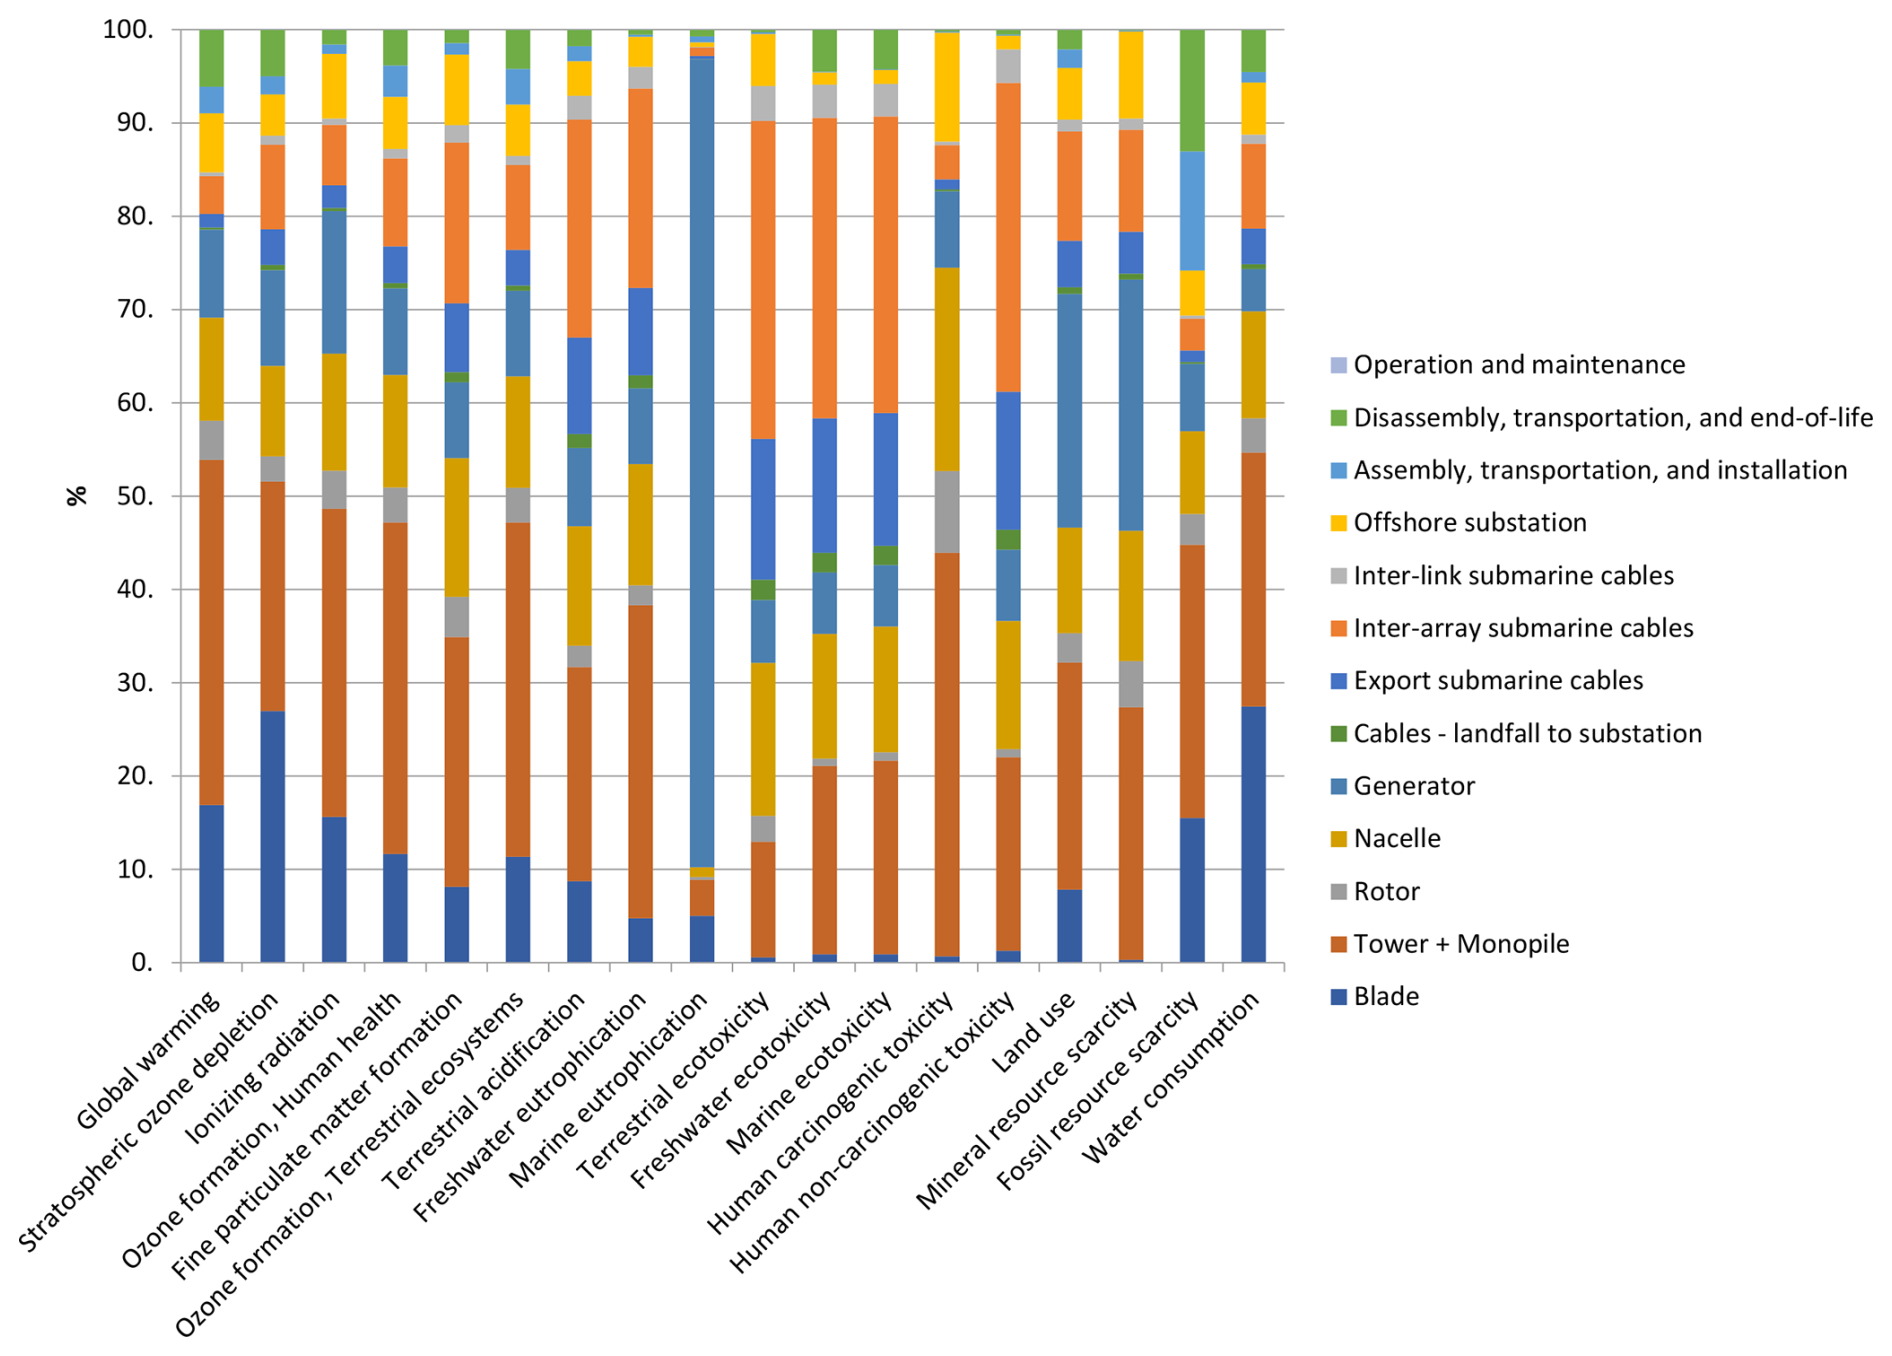
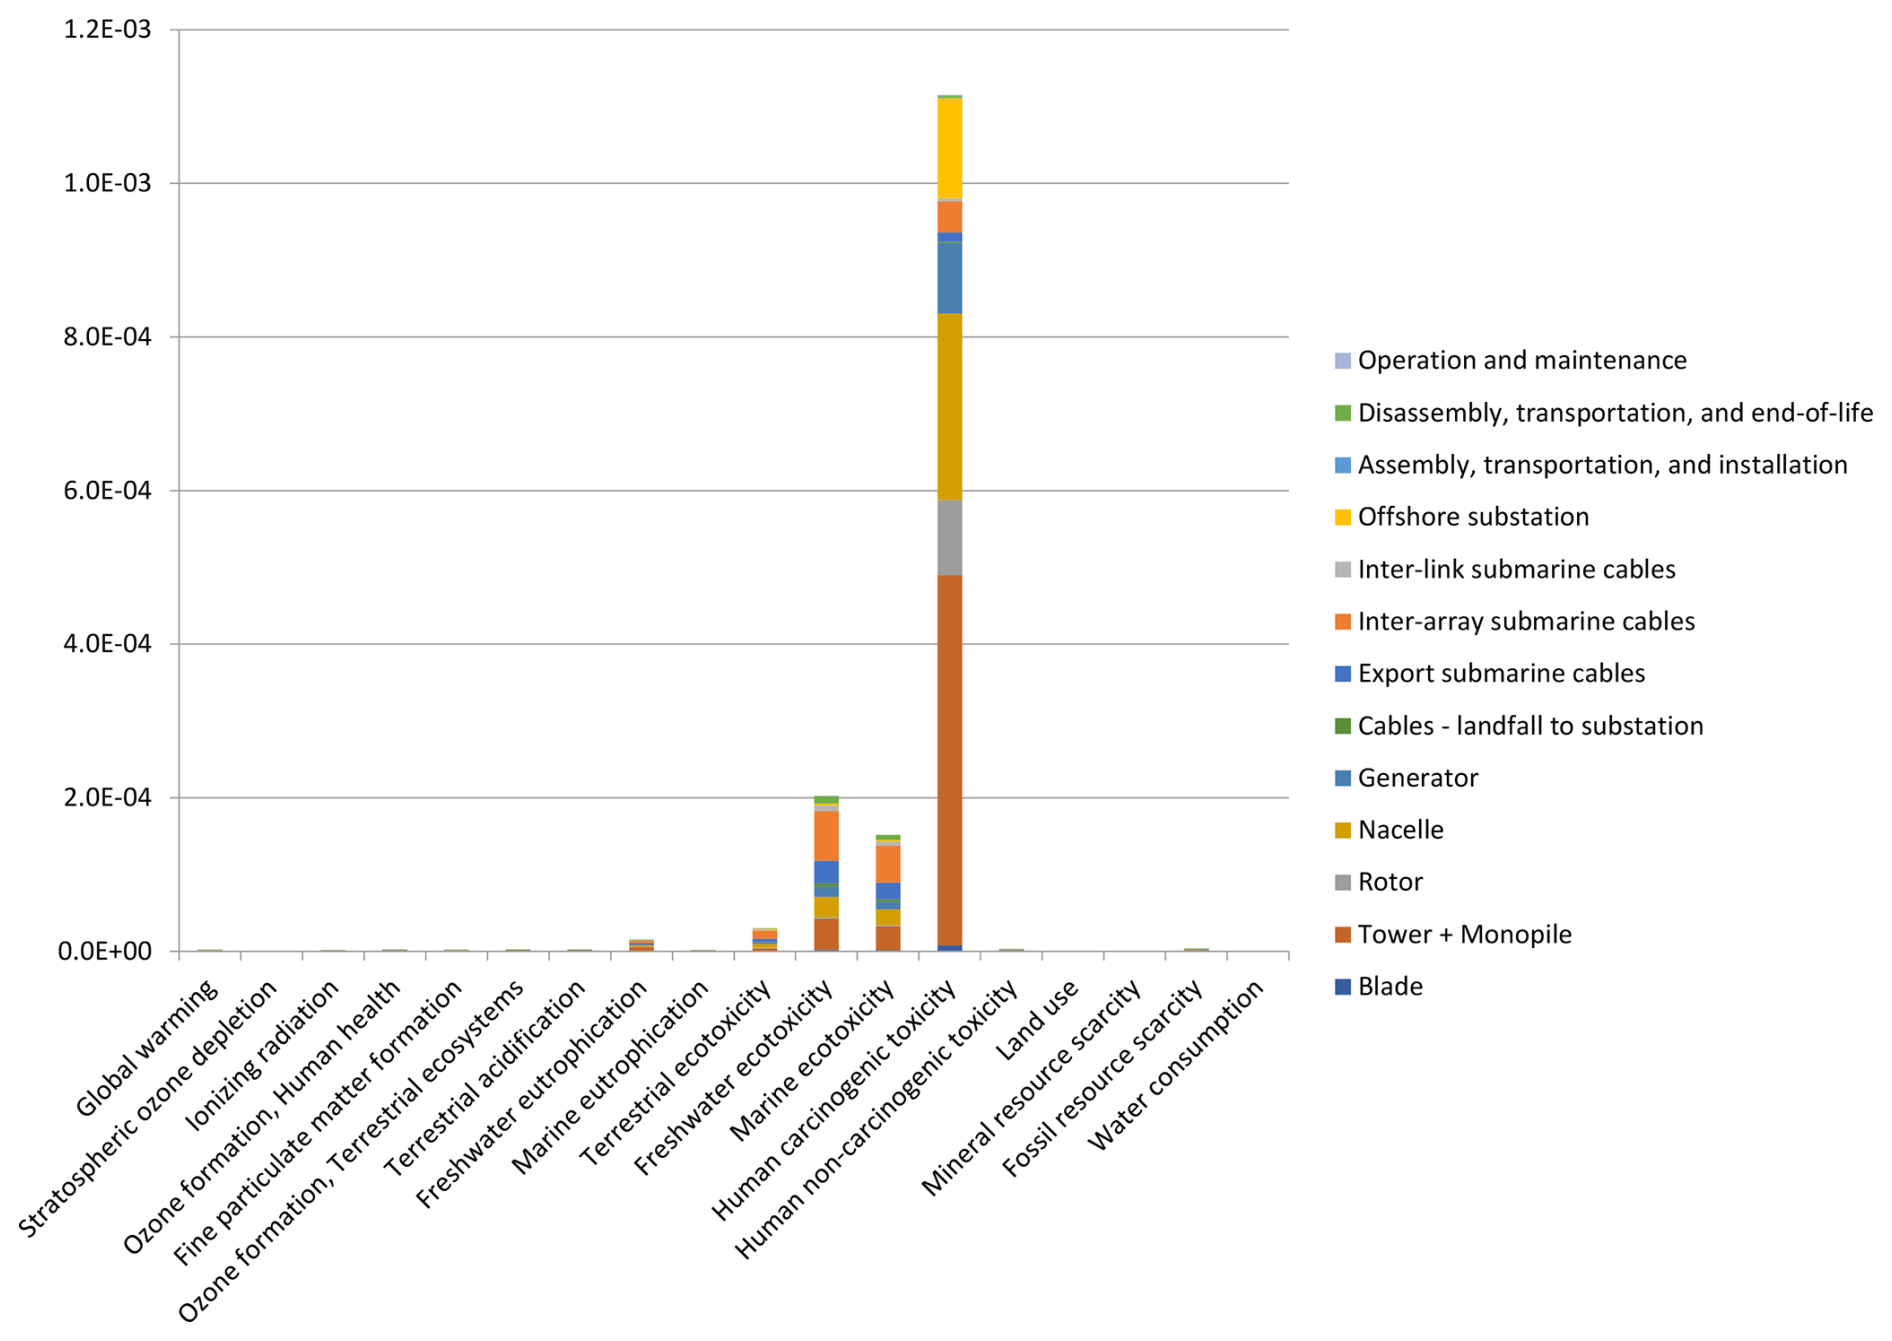
While CO2 is the most commonly reported emission, it is often not the most important in terms of the environmental and human health impact. Normalization of the data allows the impact category indicator results to be compared to a reference (normal) value (Huijbregts et al., 2016b). This allows us to see the priority areas across several impact categories. With normalization, we see that human carcinogenic toxicity is by far the highest concern, with an overall impact of kg 1,4-dichlorobenzene (1,4-DCB) (Fig. 4). Again, we see that the tower and monopile process is the largest contributor at 12.4 %. Other notable contributors include the nacelle (16.4 %) and offshore substation (5.6 %) due to their large amounts of steel. Freshwater ( kg 1,4-DCB), marine ( kg 1,4-DCB), and terrestrial ( kg 1,4-DCB) ecotoxicity are also shown to have substantial impacts compared to the other categories. While the tower and monopile process is a major contributor, the inter-array submarine cables show the highest impact across each of these categories, at 32.2 %, 31.8 %, and 34.1 %, respectively. Notably, across several impact categories, “operation and maintenance” has a relatively low impact. This model is limited to annual transport of lubricating oil during scheduled maintenance. Unscheduled and emergency maintenance and replacement of the turbine components could greatly change the impact of this category. Allekotte and Garrett (2024) found that when doubling replacement parts, the impact on all categories increased in the range of 0.2 %–2.1 %.
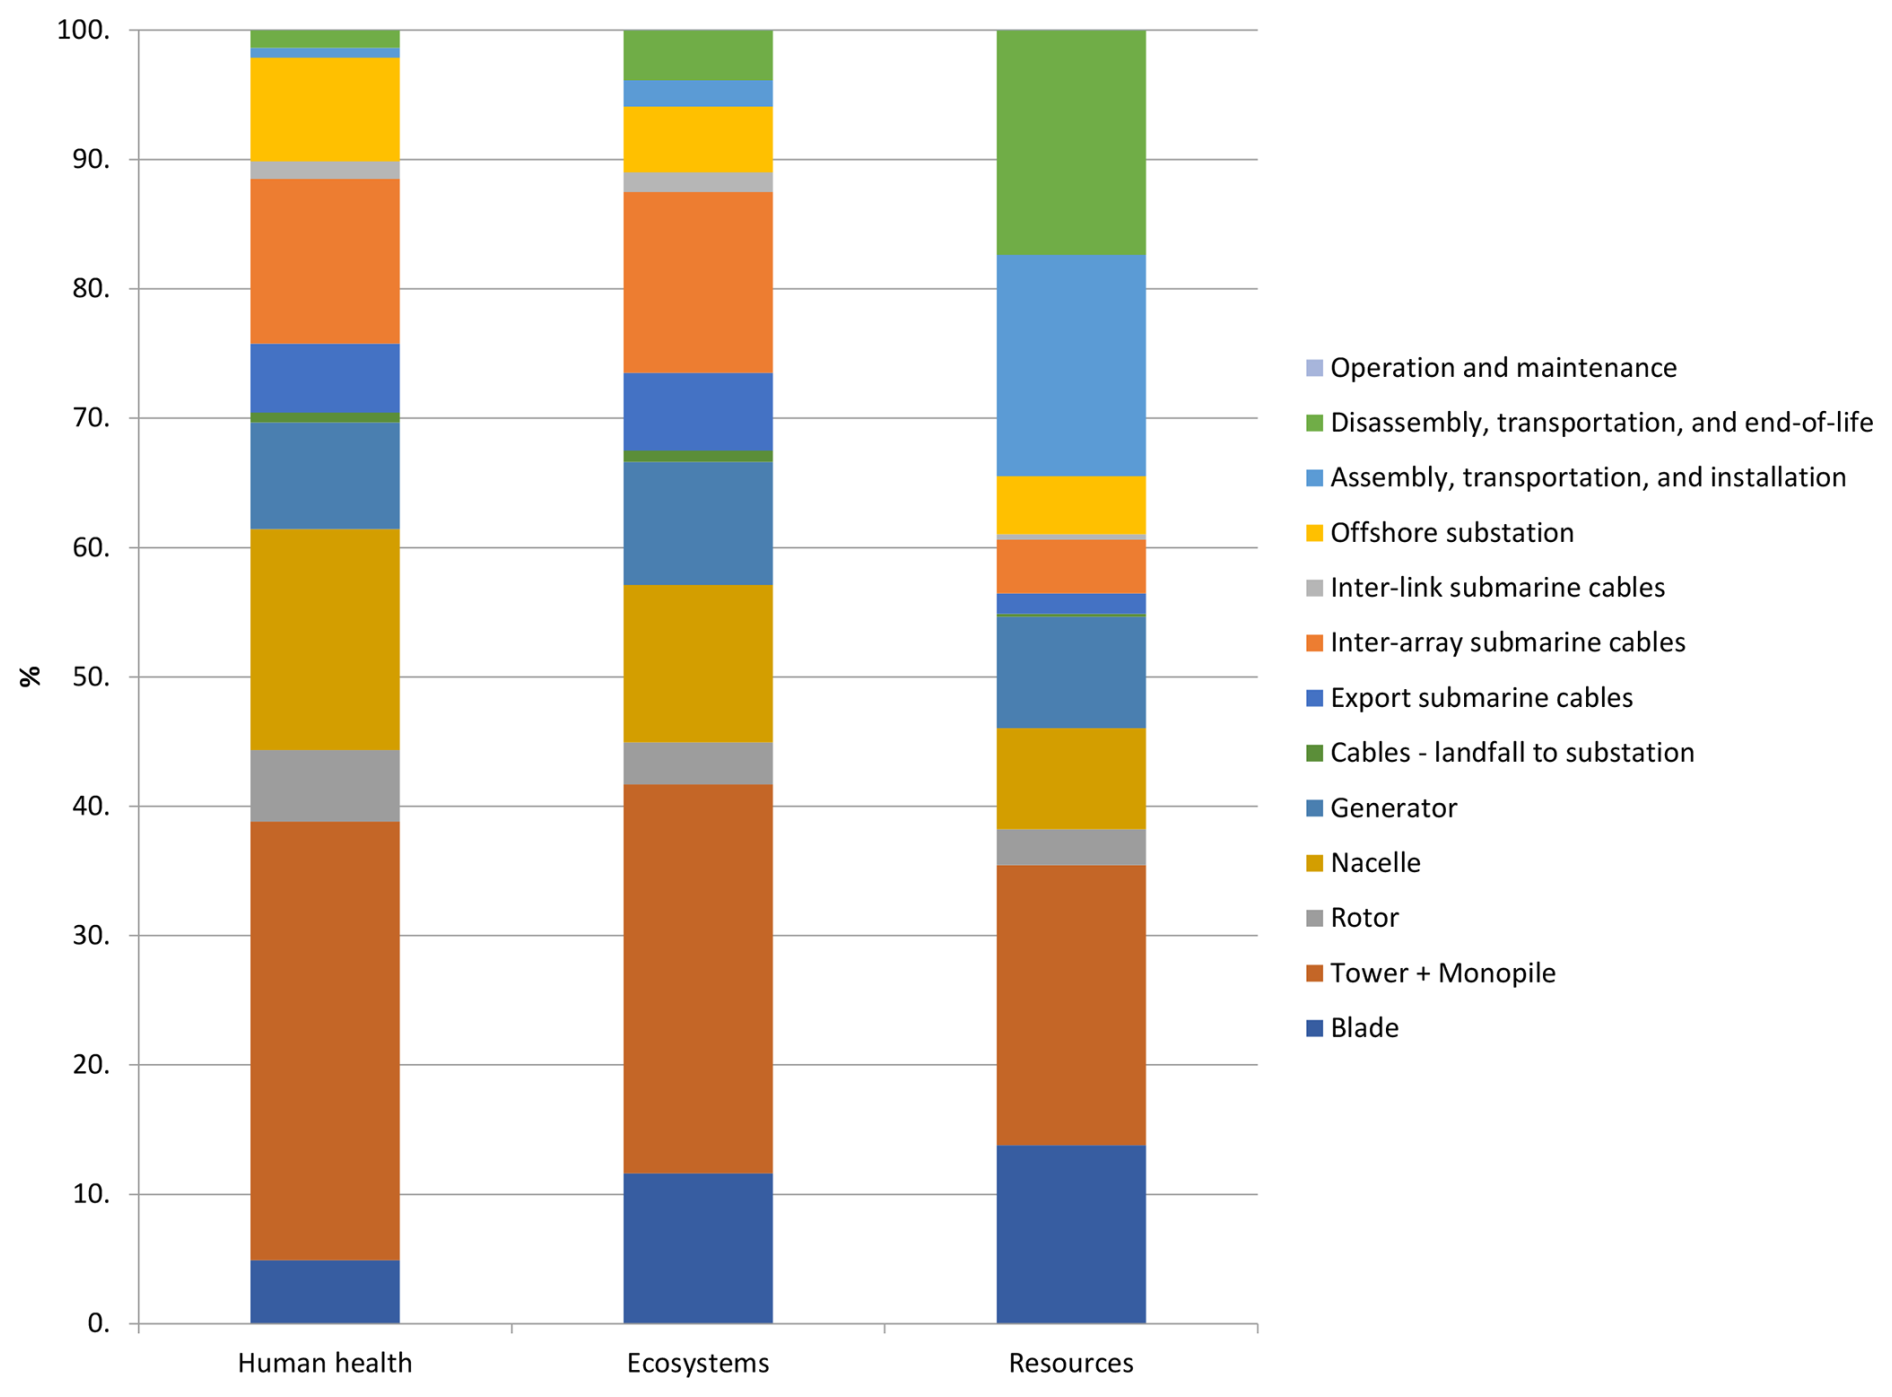
The endpoint approach further aggregates the emissions data into three impact categories: human health, ecosystems, and resources (Huijbregts et al., 2016a). The overall human health impact is disability adjusted life years (DALY), with the tower and monopile having the largest contribution at 33.8 % (Fig. 5). The overall ecosystem impact is species yr−1, with the tower and monopile having the largest contribution at 30.0 %. The overall resource impact is USD 0.001 (in 2013 US dollars), with the tower and monopile having the largest contribution at 21.6 %; although notably, assembly and disassembly are also major contributors at about 17 %. Results suggest that even with a domestic supply chain, the impact of transporting materials is significant, especially in the form of fossil fuel resource consumption. Greater distances traveled from an international supply chain would yield even higher impacts, making a case for a domestic supply chain as well as exploration of the use of alternative fuels.
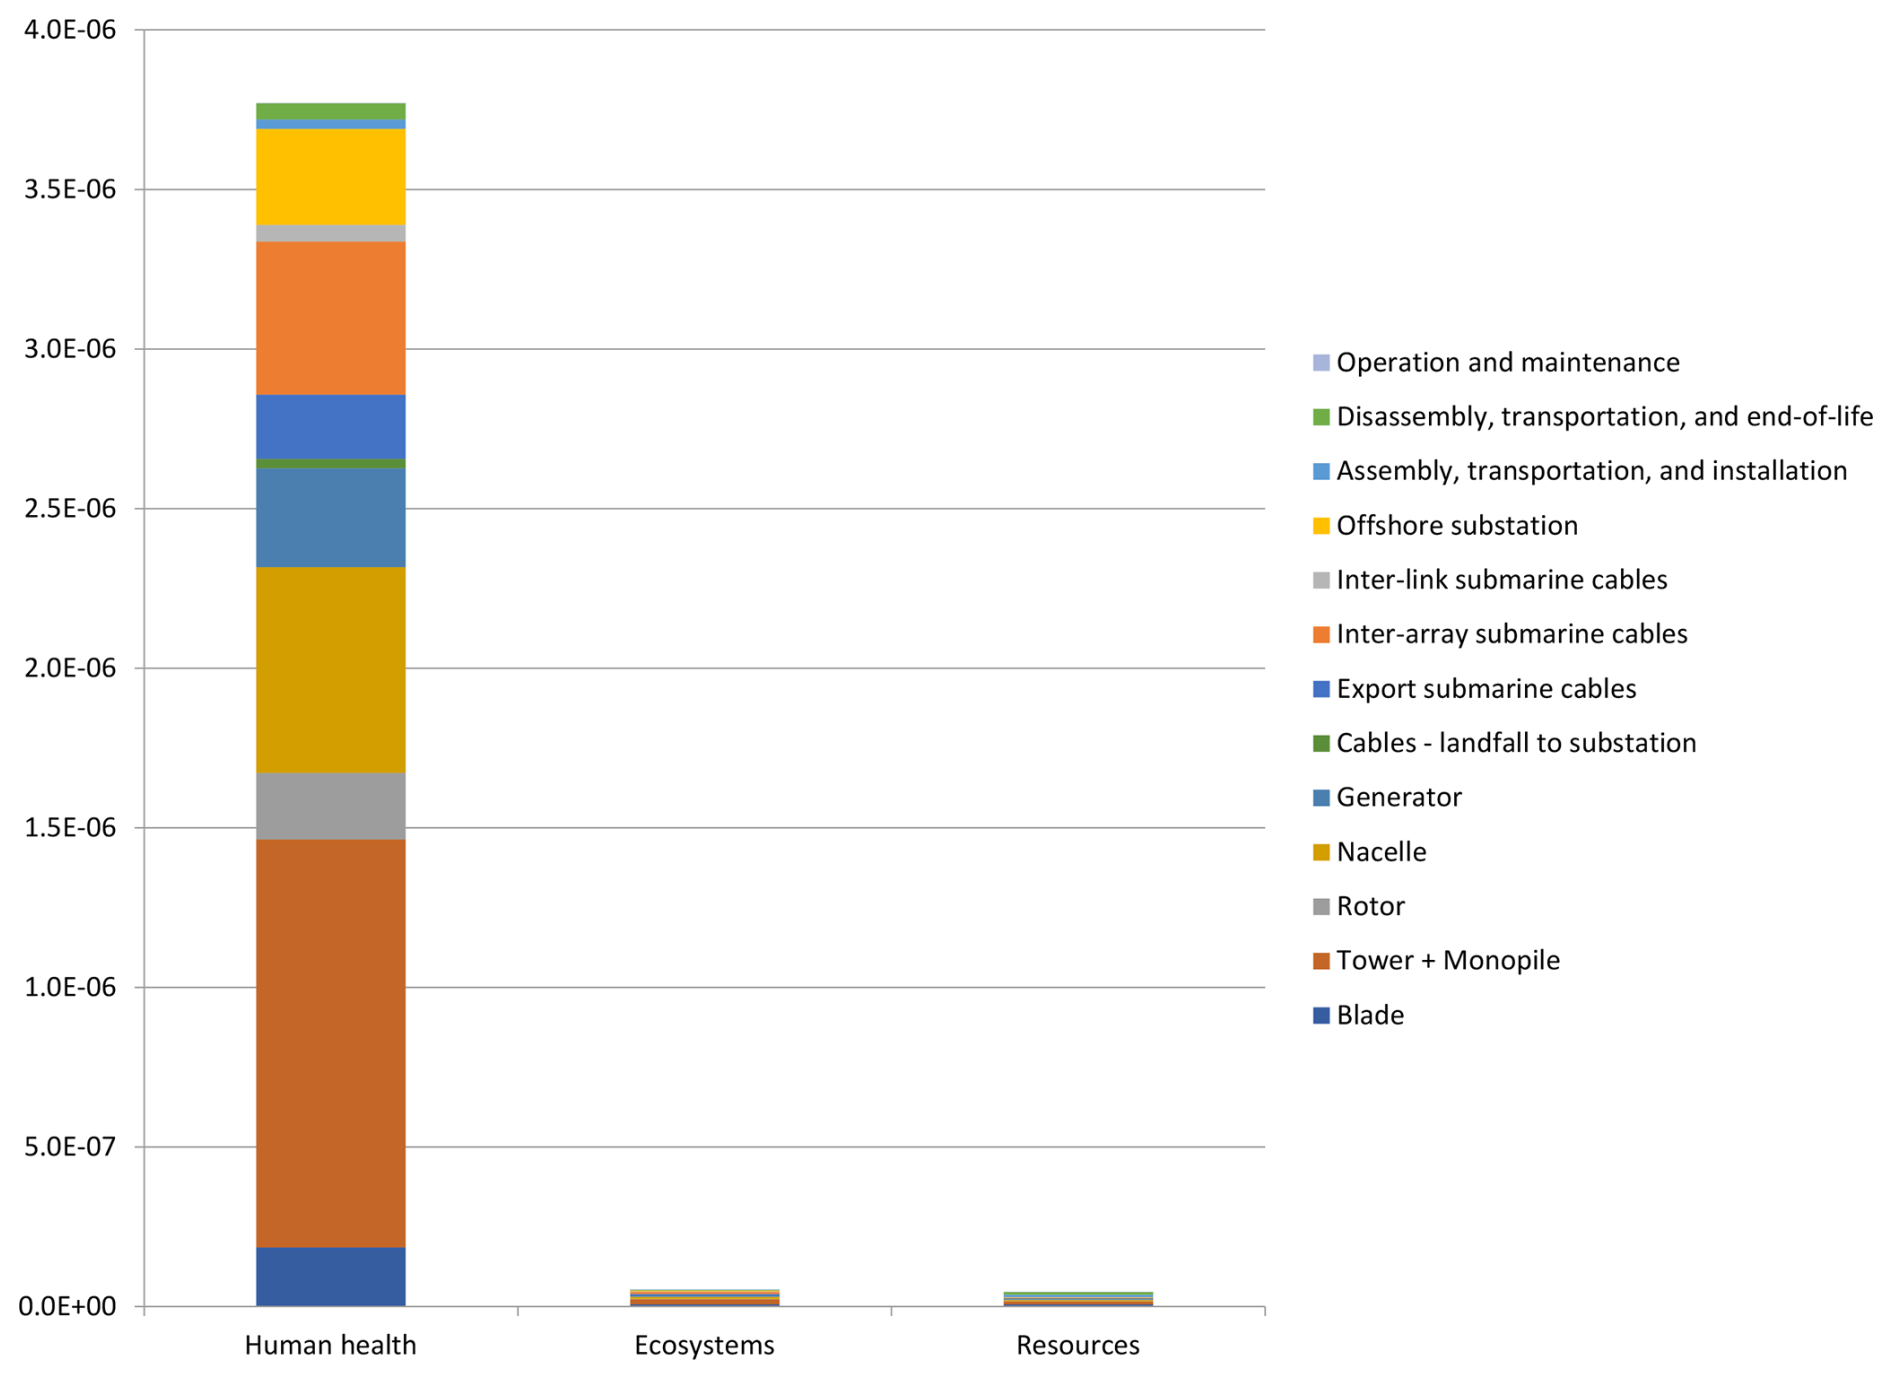
The normalization factors used for the ReCiPe 2016 endpoint method will always prioritize human health, as seen in the normalization of the data (Fig. 6). While fuel consumption and the associated emissions are key areas of concern with regard to sustainability metrics, we see that steel must be prioritized in light of a growing domestic supply chain.
The results from this study show similar distribution trends to prior offshore-wind-based LCA studies. Two studies have used the IEA reference turbine as the basis for their LCA model; however, the system boundaries are not directly comparable. Brussa et al. (2023) estimated 0.31 kg CO2 eq. kWh−1 for a 190 turbine farm off Italy's coast; while this is substantially higher than our model's estimate, this study used floating foundations that require even more steel for the floating substructure and mooring system. Moussavi et al. (2023) report that 62 % of CO2 emissions are associated with the tower, offshore substation, and cables, the most steel-intensive categories, which mirrors our findings of about 50 %, and, when including the nacelle, generator, and rotor, which were excluded from their report, rises to about 74 %. Because this study reported their normalized values, we are unable to directly compare results. While several other studies have evaluated offshore wind, the turbine power rating is significantly lower, such that results cannot be directly compared.
3.2 Comparison analysis
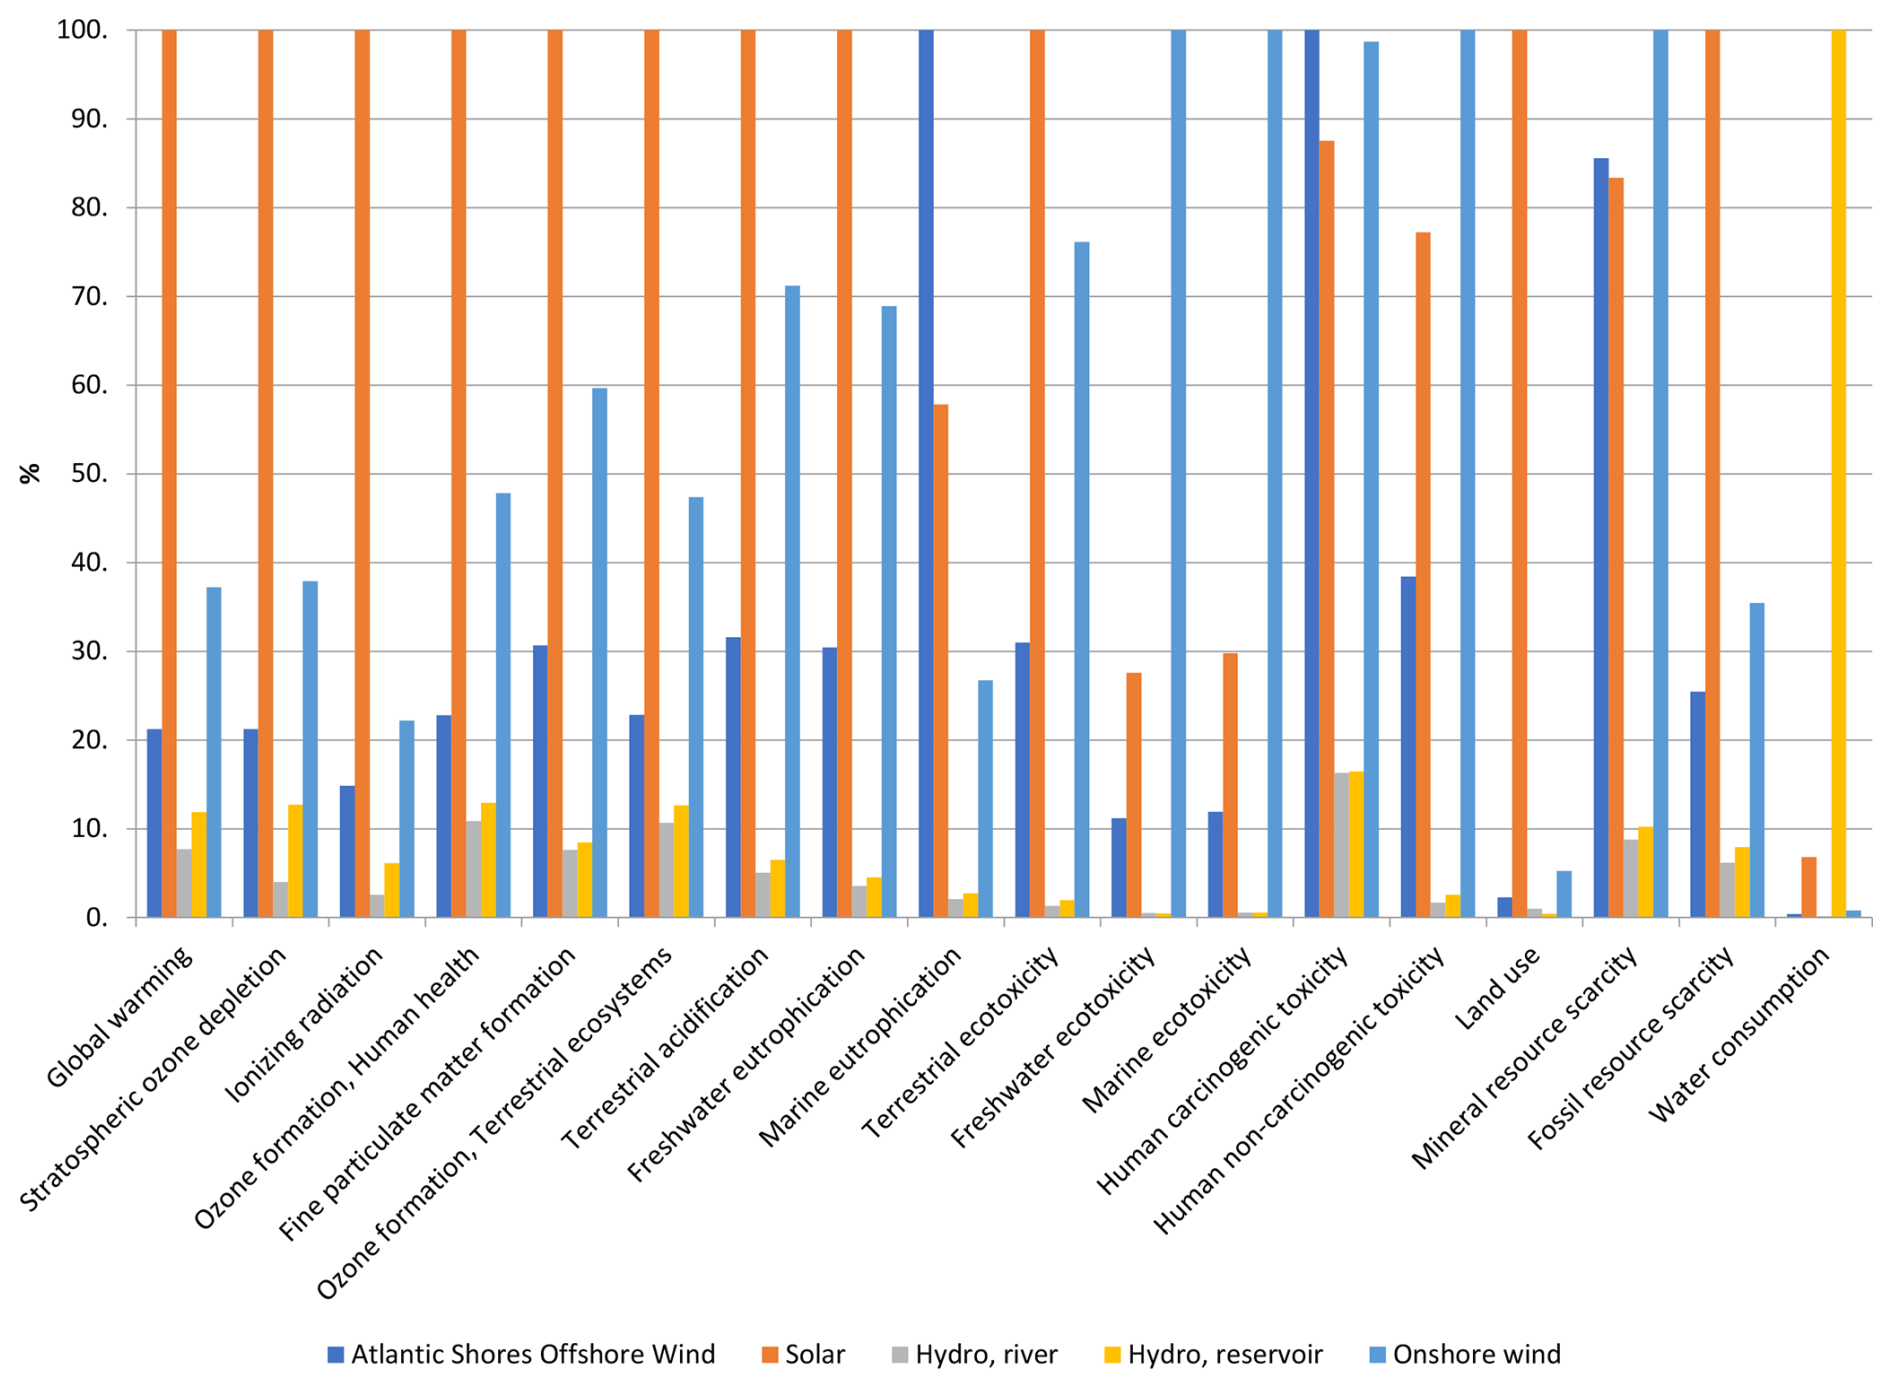
Continuing the push for electricity generation from renewable sources is key to reducing reliance on fossil fuels as a nation, and offshore wind allows New Jersey, a small state with high energy needs, to participate in improving national carbon emissions. Using Ecoinvent process data, we evaluated the performance of electricity generation sources used by the PJM Interconnection electricity generation mix across impact categories beyond global warming potential, separated for ease of visualization into conventional (Fig. 7) and renewable (Fig. 8) sources of electricity generation. The full results of the analysis are shared in Table S9.
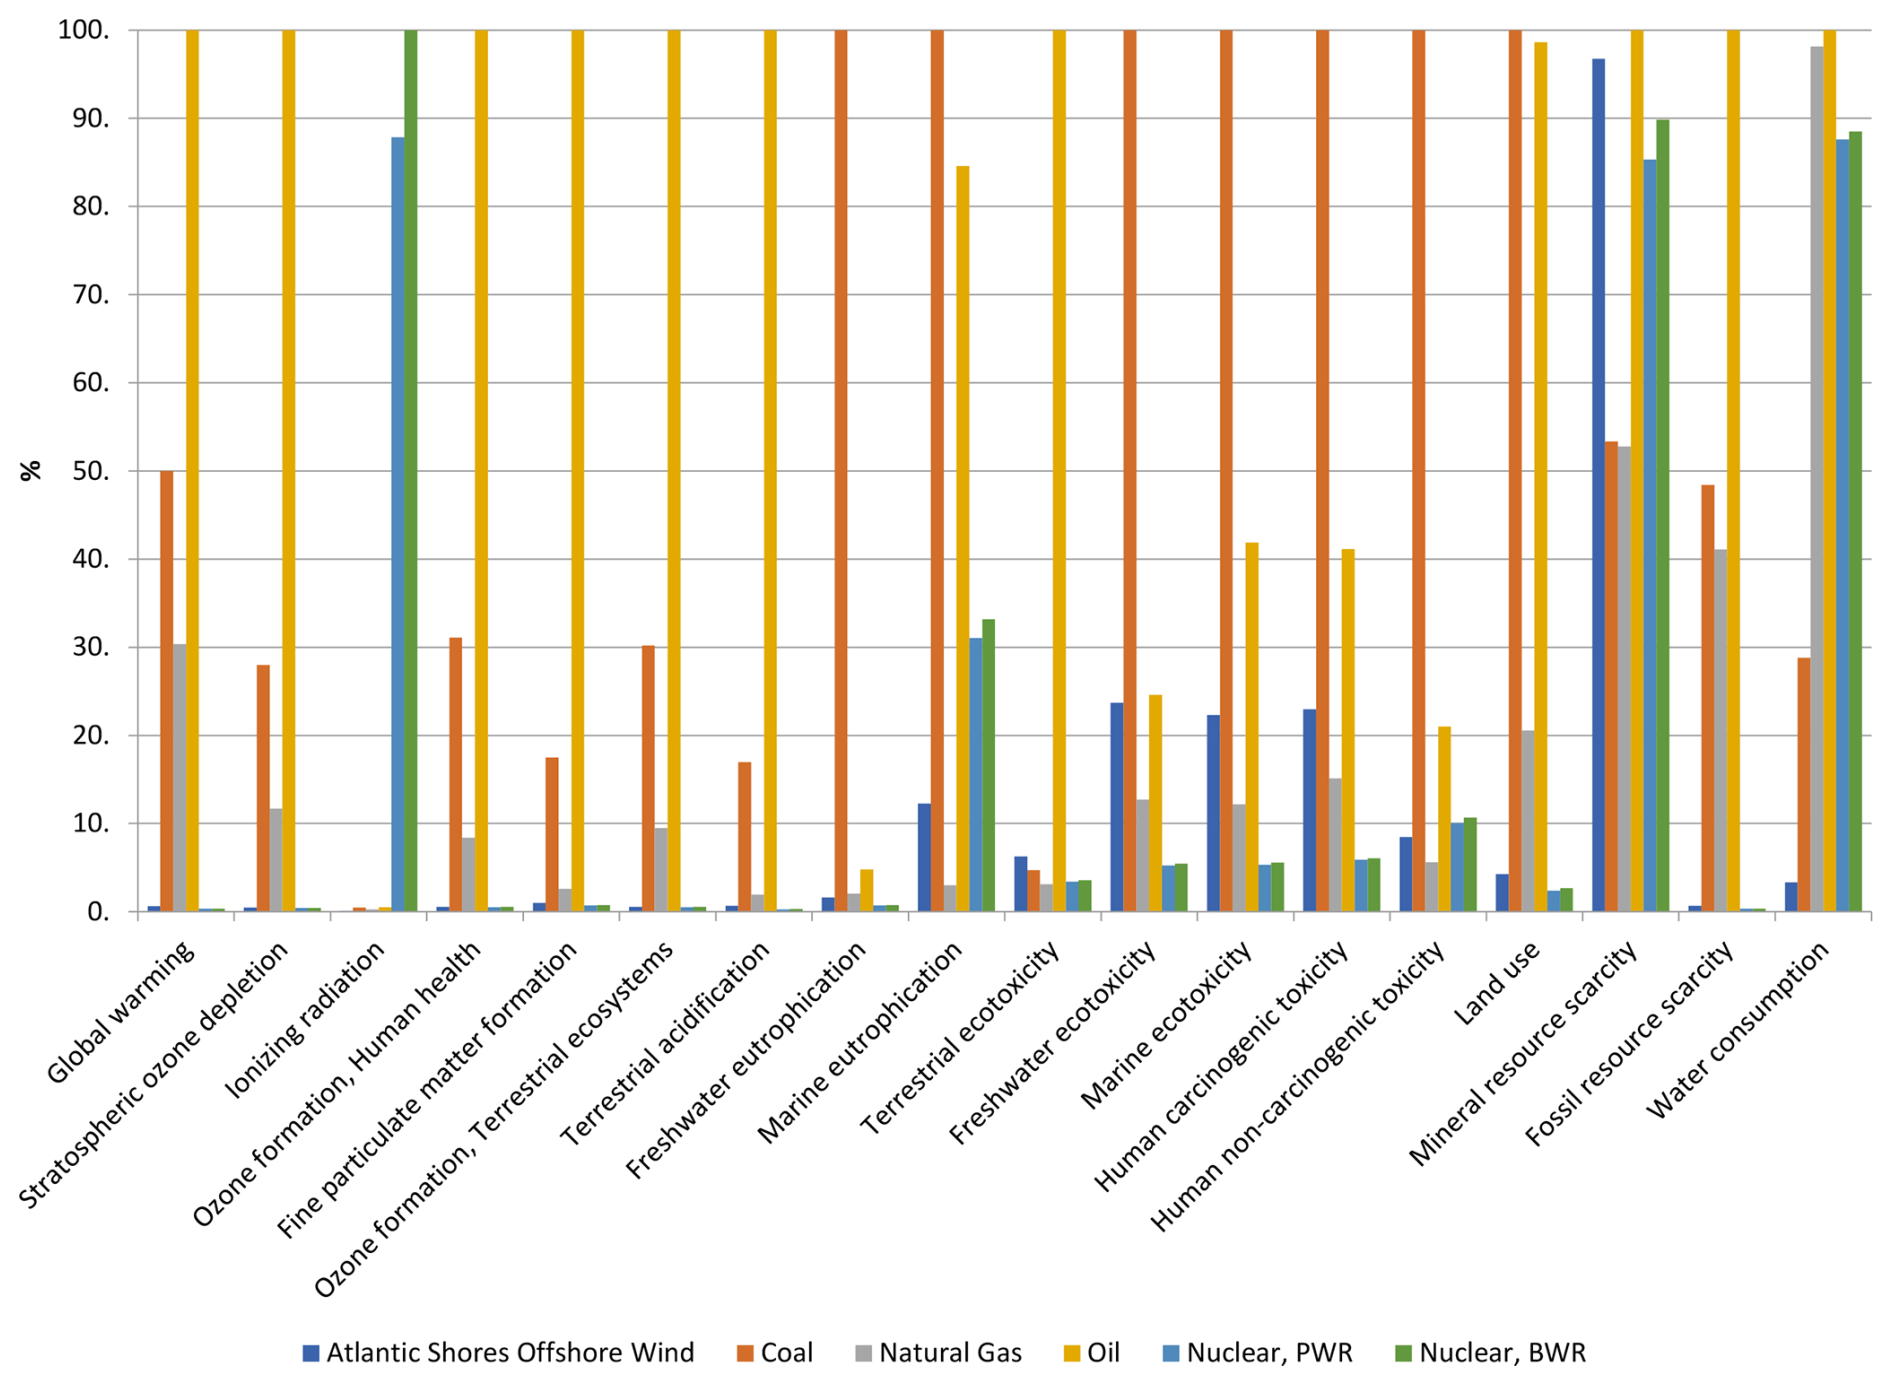
The CO2 emissions from the fossil fuel sources estimated by the EIA were somewhat different: 2.05 kg CO2 eq. (oil), 1.02 kg CO2 eq. (coal), and 0.62 kg CO2 eq. (natural gas); without full details of the EIA estimation process, it is difficult to know why the estimations for oil/petroleum differ. We expand our analysis to include nuclear power (pressurized water reactor (PWR) and boiling water reactor (BWR)), and we see that these two approaches tend to outperform offshore wind in terms of CO2 emissions. While these are clean-electricity technologies, the other impacts such as ionizing radiation highlight the risk of relying on nuclear power for a clean-energy transition. Other considerations beyond the scope of this research, such as ecosystem concerns related to nuclear waste, may be better estimated through other environmental impact assessment methods. Compared to conventional sources, we see that offshore wind performs very well across most environmental impact categories. Results confirm, however, that the impact of offshore wind on the freshwater, marine, and human carcinogenic toxicity categories remains a concern compared to several conventional methods of electricity generation, with the exception of coal and oil. We also see that the impact on mineral resource scarcity remains relatively high compared to coal and natural gas. Each of these is related to the large amount of steel needed for the turbines, highlighting the importance of identifying alternative materials for these massive structures.
When analyzing the renewable electricity generation sources, we see that in terms of CO2 eq., offshore wind outperforms solar and onshore wind by 78.7 % and 42.8 %, respectively. Hydroelectricity outperforms offshore wind by 63.8 % (run of river) and 44.3 % (pumped reservoir) depending on the method. The only impact categories where offshore wind performs the worst are marine eutrophication, reflecting the relative location of the technologies compared, and human carcinogenic toxicity, reflecting the large amounts of steel and copper needed to connect the turbines to the grid. Notably, offshore wind performs worse compared to hydro energy (both river and reservoir methods) across all impact categories, with the exception of water consumption. However, the effect of hydroelectric dams on water quality and habitat destruction should not be taken lightly; while chemical emissions are considered in this analysis, the broader impact of these emissions may be better calculated using alternate environmental impact assessment methods. Further, hydroelectric dams can only be utilized in certain geographical areas; while New Jersey has several hydroelectric dams in operation, possibilities for expansion in this sector are minimal given land limitations.
This LCA of the Atlantic Shores south offshore wind project off New Jersey's coastline provides a detailed analysis of the environmental impacts associated with offshore wind energy production in the context of a developing US supply chain. Further, we compare these results to other electricity generation sources including nonrenewable (oil, coal, natural gas, nuclear) and renewable (solar, hydro, onshore wind) technologies. Findings suggest that while offshore wind offers a substantial reduction in greenhouse gas emissions relative to fossil fuels, there are considerable environmental impacts associated with the steel-intensive construction materials and transportation of those materials, particularly within the Scope 3 emissions profile. Scope 3 emissions, which include indirect emissions from upstream activities such as material production and transport, are found to be a major contributor to the project's total environmental impact. Steel manufacturing in particular poses substantial challenges to sustainable offshore wind development due to its high emission intensity and the toxicity impacts on human health and ecosystems. When we consider the performance of offshore wind compared to other renewable energy technologies, we observe that, in general, offshore wind is a good option, particularly in the context of New Jersey, which has ample coastline access and limited available land space for the expansion of other electricity generation options. This research provides quantitative data that can guide regulatory frameworks, incentive structures, and investment decisions that prioritize both emission reductions and sustainable industry development. By aligning with the performance of other renewable technologies, this research also contributes to broader energy transition planning, supporting evidence-based policies that promote the most environmentally and economically viable solutions for the US energy grid.
The lack of a domestic supply chain is a large, well-known barrier to US offshore wind development. The emissions associated with the transportation of turbine components overseas highlight the ineffectiveness of utilizing offshore wind as a means to decarbonize the electricity generation sector. Implementing a more localized supply chain would not only reduce transportation-related emissions but also foster greater energy security and economic benefits within the region. This study contributes a crucial baseline for future US east coast offshore wind LCA models and emphasizes the importance of the regional context in sustainability metrics. New Jersey's offshore wind developments offer a promising step toward a renewable energy transition provided that the challenges of supply chain sustainability and resource management are effectively addressed.
Future research should explore the aspects of offshore wind farms that are outside of the scope of this study. For example, the offshore substation contains substantial amounts of materials beyond steel, such as transformers, high-voltage equipment, power control systems, and communication equipment, which could have a significant environmental impact relative to the total offshore wind farm. Future research can explore the potential impacts of a decarbonized steel sector, assessing how a transition to low-carbon steel production would alter the environmental footprint of offshore wind projects. Further modeling efforts could also assess the use of innovative materials, such as composite or recycled materials, and their feasibility within offshore wind applications. By investigating alternative materials, future work could identify best management practices within the offshore wind sector as it continues to develop its domestic supply chain, ensuring that as a nation, we are providing a strong foundation for a sustainable offshore wind sector.
Data for this study are available in the Supplement.
The supplement related to this article is available online at https://doi.org/10.5194/wes-10-1389-2025-supplement.
MS contributed to the conceptualization, methodology, project administration, formal analysis, validation, and writing (original draft preparation). NS contributed to the conceptualization, methodology, formal analysis, and writing (review and editing). PL contributed to the conceptualization, funding acquisition, supervision, and writing (review and editing).
The contact author has declared that none of the authors has any competing interests.
Any opinion, findings, conclusions, or recommendations expressed in this material are those of the authors and do not necessarily reflect the views of the Clean Energy and Sustainability Analytics Center at Montclair State University.
Publisher’s note: Copernicus Publications remains neutral with regard to jurisdictional claims made in the text, published maps, institutional affiliations, or any other geographical representation in this paper. While Copernicus Publications makes every effort to include appropriate place names, the final responsibility lies with the authors.
This article is part of the special issue “NAWEA/WindTech 2024”. It is a result of the NAWEA/WindTech 2024, New Brunswick, United States, 30 October–1 November 2024.
The authors are grateful for support from the Clean Energy and Sustainability Analytics Center at Montclair State University.
This paper was edited by Julia Kirch Kirkegaard and reviewed by two anonymous referees.
Allekotte, L. and Garrett, P.: Life Cycle Assessment of electricity production from an offshore V236-15 MW™ wind plant, Vestas Wind Systems A/S, version 1.1, https://www.vestas.com/content/dam/vestas-com/global/en/sustainability/environment/LCA of Electricity Production from an offshore V236-15MW.pdf.coredownload.inline.pdf (last access: 13 May 2025), 2024.
American Iron and Steel Institute: Steel Profile, American Iron and Steel Institute, https://www.steel.org/wp-content/uploads/2024/01/AISI-Profile-Book_updated-3.2023.pdf (last access: 3 March 2025), 2023.
Atlantic Shores Offshore Wind, LLC: Appendix I-G: Submarine export and onshore interconnection cable routes determination, Atlantic Shores Offshore Wind, LLC, https://www.boem.gov/sites/default/files/documents/renewable-energy/state-activities/2024-05-01_App I-G_SubmarineExportOnshoreInterconnectionCableRoutesSummary_REDACTED.pdf (last access: 13 May 2025), 2024a.
Atlantic Shores Offshore Wind, LLC: Construction and Operations Plan: Lease Area OSC-A 0499: Atlantic Shores South, Volume 1: Project Information, Atlantic Shores Offshore Wind, LLC, https://www.boem.gov/sites/default/files/documents/renewable-energy/state-activities/Atlantic Shores South_Volume I_Project Description_05-01-2024.pdf (last access: 14 May 2025), 2024b.
Brussa, G., Grosso, M., and Rigamonti, L.: Life cycle assessment of a floating offshore wind farm in Italy, Sustainable Production and Consumption, 134, 134–144, https://doi.org/10.1016/j.spc.2023.05.006, 2023.
Burger, B. and Bauer, C.: Wind power plant construction, 2 MW, offshore, fixed parts – GLO”, Ecoinvent 3.8, ecoQuery [data set] https://ecoquery.ecoinvent.org/3.11/cutoff/dataset/6829/documentation (last access: 18 July 2024), 2007.
Chen, J., Mao, B., Wu, Y., Zhang, D., Wei, Y., Yu, A., and Peng, L.: Green development strategy of offshore wind farm in China guided by life cycle assessment, Resour. Conserv. Recy., 188, 106652, https://doi.org/10.1016/j.resconrec.2022.106652, 2023.
De Cuyper, J., Ansoms, B., and Verboomen, B.: Smart, Sustainable: A Life Cycle Approach to Fuel Economy as Applied to Dredging Vessels, Terra et Aqua, Number 137, https://www.iadc-dredging.com/wp-content/uploads/2017/02/article-smart-sustainable-a-life-cycle-approach-to-fuel-economy-as-applied-to-dredging-vessels-137-1.pdf (last access: 14 May 2025), 2014.
Fred. Olsen Windcarrier: Bold Tern, http://www.windcarrier.com/fleet/bold-tern (last access: 30 September 2024), 2019.
Gaertner, E., Rinker, J., Sethuraman, L., Zahle, F., Anderson, B., Barter, G., Abbas, N., Meng, F., Bortolotti, P., Skrzypinski, W., Scott, G., Feil, R., Bredmose, H., Dykes, K., Shields, M., Allen, C., and Viselli, A: Definition of the IEA 15-megawatt offshore reference wind, National Renewable Energy Laboratory, Golden, Colorado, https://www.nrel.gov/docs/fy20osti/75698.pdf (last access: 14 May 2025), 2020.
Goedkoop, M., Heijungs, R., Huijbregts, M. A. I., De Schryver, A., Struijs, J., and van Zelm, R.: ReCiPe 2008: A life cycle impact assessment method which comprises harmonized category indicators at the midpoint and endpoint levels, First edition (version 1.08), Report I: Characterization, Ruimte en Milieu, Ministerie van Volkshuisvesting, Ruimtelijke Ordening en Milieubeheer, https://www.rivm.nl/sites/default/files/2018-11/ReCiPe 2008_A lcia method which comprises harmonised category indicators at the midpoint and the endpoint level_First edition Characterisation.pdf (last access: 14 May 2025), 2009.
Google LLC: Google Earth: Measurement tool, https://earth.google.com (last access: 1 April 2005), 2025.
Hernando, D. M., Musial, W., Duffy, P., and Shields, M.: Summary analysis of different offshore wind capacity density drivers in proposed U.S. projects and impacts on progress towards state and federal deployment targets, North American Wind Energy Academy (NAWEA)/WindTech 2023 Conference, Denver, Colorado, 30 October–1 November, https://docs.nrel.gov/docs/fy24osti/87947.pdf (last access: 18 July 2024), 2023.
Huijbregts, M. A. J., Steinmann, Z. J. N., Elshout, P. M. F., Stam, G., Verones, F., Vieira, M., Zijp, M., Hollander, A., and van Zelm, R.: ReCiPe2016: A harmonized life cycle impact assessment method at midpoint and endpoint level, Int. J. Life Cycle Ass., 22, 138–147, https://doi.org/10.1007/s11367-016-1246-y, 2016a.
Huijbregts, M. A. J., Steinmann, Z. J. N., Elshout, P. M. F., Stam, G., Verones, F., Viera, M. D. M., Hollander, A., and Van Zelm, R.: Normalization scores ReCiPe 2016, National Institute for Public Health and the Environment, Ministry of Health, Welfare and Sport [data set], https://www.rivm.nl/en/life-cycle-assessment-lca/downloads (last access: 18 July 2024), 2016b.
International Energy Agency: End-of-life recycling rates for selected metals, https://prod.iea.org/data-and-statistics/charts/end-of-life-recycling-rates-for-selected-metals (last access: 18 July 2024), 2021.
International EPD ® System: General Programme Instructions for the International EPD ® System Version 4.0, International EPD® System, https://www.datocms-assets.com/37502/1617181375-general-programme-instructions-v-4.pdf (last access: 14 May 2025), 2021.
International Organization for Standardization: ISO 14040:2006 Environmental management: Life cycle assessment. Principles and framework, https://www.iso.org/standard/37456.html (last access: 18 July 2024), 2018a.
International Organization for Standardization: ISO 14044:2006 Environmental management: Life cycle assessment. Requirements and guidelines, https://www.iso.org/standard/38498.html (last access: 18 July 2024), 2018b.
Liu, P. and Barlow, C. Y.: Wind turbine blade waste in 2050, Waste Manage, 62, 229–240, https://doi.org/10.1016/j.wasman.2017.02.007, 2017.
Majewski, P., Florin, N., Jit, J., and Stewart, R. A.: End-of-life policy considerations for wind turbine blades, Renew Sust Energ Rev, 164, 122538, https://doi.org/10.1016/j.rser.2022.112538, 2022.
Moussavi, S., Barutha, P., and Dvorak, B.: Environmental life cycle assessment of a novel offshore wind energy design project: A United States-based case study, Renew. Sust. Energ. Rev., 185, 113643, https://doi.org/10.1016/j.rser.2023.113643, 2023.
National Offshore Wind Research and Development Consortium: Announces offshore wind supply chain roadmap project, https://www.energy.gov/eere/wind/articles/national-offshore-wind-research-and-development-consortium-announces-offshore (last access: 18 July 2024), 2021.
New Jersey Executive Order No. 92: Governor Murphy signs executive order to increase offshore wind goal to 7,500 megawatts by 2035, https://nj.gov/infobank/eo/056murphy/pdf/EO-92.pdf (last access: 18 July 2024), 2019.
New Jersey Executive Order No. 307: Governor Murphy signs executive order to increase offshore wind goal to 11,000 megawatts by 2040, https://nj.gov/infobank/eo/056murphy/pdf/EO-307.pdf (last access: 18 July 2024), 2022.
Official Site of the State of New Jersey: NJ Energy, climate, and environment work, https://nj.gov/governor/climateaction/work/ (last access: 18 July 2024), 2024.
OpenAI: ChatGPT, https://chat.openai.com/chat (last access: 18 July 2024), 2023.
PJM Markets and Operations: Generation fuel mix, https://www.pjm.com/markets-and-operations.aspx (last access: 30 September 2024), 2024.
PRé Sustainability: SimaPro Software, Version 9.5.0.2., PRé Sustainability, https://www.simapro.com (last access: 14 May 2025), 2023.
Raadal, H. L., Vold, B. I., Myhr, A., and Nygaard, T. A.: GHG emissions and energy performance of offshore wind power, Renew. Energ., 66, 475–486, https://doi.org/10.1016/j.renene.2013.11.075, 2014.
Shields, M., Marsh, R., Stefek, J., Oteri, F., Gould, R., Rouxel, N., Diaz, K., Molinero, J., Moser, A., Malvik, C., and Tirone, S.: The demand for a domestic offshore wind supply chain, National Renewable Energy Laboratory, Golden, Colorado, https://www.nrel.gov/docs/fy22osti/81602.pdf (last access: 14 May 2025), 2022.
Shields, M., Stefek, J., Oteri, F., Maniak, A., Kreider, M., Gill, E., Gould, R., Malvik, C., Tirone, S., and Hines, E.: A supply chain road map for offshore wind energy in the United States, National Renewable Energy Laboratory, Golden, Colorado, https://www.nrel.gov/docs/fy23osti/84710.pdf (last access: 14 May 2025), 2023.
Smith, M., Bevacqua, A., Tembe, S., and Lal, P.: Life cycle analysis (LCA) of residential ground source heat pump systems: A comparative analysis of energy efficiency in New Jersey, Sustainable Energy Technologies and Assessments, 47, 101364, https://doi.org/10.1016/j.seta.2021.101364, 2021.
The Greenhouse Gas Protocol: A corporate accounting and reporting standard, The Greenhouse Gas Protocol, https://ghgprotocol.org/sites/default/files/standards/ghg-protocol-revised.pdf (last access: 14 May 2025), 2004.
The Greenhouse Gas Protocol: Corporate value chain (Scope 3) accounting and reporting standard, https://ghgprotocol.org/sites/default/files/standards/Corporate-Value-Chain-Accounting-Reporing-Standard-EReader_041613_0.pdf (last access: 14 May 2025), 2011.
The Greenhouse Gas Protocol: Corporate accounting and reporting standard, The Greenhouse Gas Protocol, https://ghgprotocol.org/sites/default/files/standards/ghg-protocol-revised.pdf (last access: 14 May 2025), 2015.
The White House: FACT SHEET: Biden Administration jumpstarts offshore wind energy projects to create jobs, https://bidenwhitehouse.archives.gov/briefing-room/statements-releases/2021/03/29/fact-sheet-biden-administrationjumpstartsoffshore-administrationjumpstartsoffshore-wind-energy-projects-to-create-jobs (last access: 1 July 2024), 2021.
U.S. Energy Information Administration: Off Shore Wind Speed 90m (NREL), https://atlas.eia.gov/datasets/ddc4fbdf89b54d63b24ad2f841bf1f86_0/about (last access: 25 March 2025), 2021.
U.S. Department of Energy: Advancing offshore wind energy in the United States: U.S. Department of Energy strategic contributions toward 30 gigawatts and beyond, U.S. Department of Energy, https://www.energy.gov/sites/default/files/2023-03/advancing-offshore-wind-energy-full-report.pdf (last access: 14 May 2025), 2022.
U.S. Energy Information Administration: New Jersey state energy profile, https://www.eia.gov/state/print.php?sid=NJ (last access: 18 July 2024), 2024a.
U.S. Energy Information Administration: How much carbon dioxide is produced per kilowatthour of U.S. electricity generation?, https://www.eia.gov/tools/faqs/faq.php (last access: 14 May 2025), 2024b.
Van Oord: Flexible fallpipe vessel: Nordnes, Van Oord, https://www.vanoord.com/drupal/media/data/default/2021-07/leaflet_nordness_2021_a42_lr.pdf (last access: 18 July 2024), 2021.
Weeks Marine: Equipment, https://www.weeksmarine.com/equipment/, last access: 18 July 2024.
Yuan, W., Feng, J., Zhang, S., Sun, L., Cai, Y., Yang, Z., and Sheng, S.: Floating wind power in deep-sea area: Life cycle assessment of environmental impacts, Advances in Applied Energy, 9, 100122, https://doi.org/10.1016/j.adapen.2023.100122, 2023.