the Creative Commons Attribution 4.0 License.
the Creative Commons Attribution 4.0 License.
 | 01 Aug 2025
Quantifying tropical-cyclone-generated waves in extreme-value-derived design for offshore wind
Sarah McElman
Amrit Shankar Verma
Andrew Goupee
Wave extreme values, such as significant wave height, peak period, and crest height, are central to design and operation practices for offshore wind structures. However, the most suitable methods for deriving these extremes, both statistically and from numerical models, are not straightforward. This is especially acute in mixed-type climates, as on the Atlantic coast of the US, where tropical cyclones (hurricanes) and extratropical cyclones (winter storms) occur at the same locations with varying frequency and intensity. Limited guidance is provided in major offshore wind energy standards for the minimum requirements of these ocean models and methods used for determining accurate design and operational metocean conditions for regions with tropical cyclones and mixed-type environments. This study investigates the representation of extreme significant wave heights on the US Atlantic coast generated by mixed storm types, as represented in numerical simulations and univariate extreme value analysis. Notable differences between N-year design values are found, as projected by the two different modeled conditions with both block maxima and peaks-over-threshold methods. Attributing factors include hindcast duration, proximity of design location to storm track centers, and single analysis of mixed-type distributions. This paper is the first of its kind to propose a methodology for defining extreme significant wave heights due to tropical cyclones for offshore wind design and operation in mid-Atlantic and North Atlantic waters. Recommendations for achieving accurate and representative extreme values for offshore design on the US Atlantic coast are provided.
- Article
(12546 KB) - Full-text XML
- BibTeX
- EndNote


As offshore wind development expands to locations with mixed storm types, such as a combination of tropical and extratropical cyclones, new meteorological and oceanographic features influence infrastructure planning, design, and operation. The successful design and operation of offshore projects require long-term metocean data, traditionally in the form of a locally validated, high-fidelity, multi-decade hindcast of coupled winds, waves, currents, and water levels. These models are typically forced with or derive boundary conditions from global or downscaled reanalysis datasets, such as the Climate Forecast System Reanalysis (CFSR) or European Centre for Medium-Range Weather Forecasts Reanalysis v5 (ERA5) (e.g., Groll and Weisse, 2017). Data from these models form the basis for extreme value analysis (EVA), the statistical determination of an N-year parameter. The results of these methods can be sensitive to method choice, parameterization, or data fit (see, for example, Haselsteiner and Thoben, 2020).
The representation of coastal extreme events by numerical models is also sensitive to parameterization choices and model design decisions. Investigations in the literature have quantified tropical cyclone features and their influence on offshore wind design on turbine-scale dynamics. Kim and Manuel (2019) simulated the local wind, waves, and hydrodynamic features of Hurricane Sandy at a number of offshore wind development areas on the Atlantic coast with the Miami Coupled Model. They recommend coupled wind–ocean modeling for the best representation of the features and evolution of tropical cyclones as a prerequisite to intensity assessment and wind–wave probability distribution. Gomez et al. (2023) quantified the convective momentum transfer of Category 1, 2, and 3 tropical cyclones, developed from a catalog of synthetic events on the US East Coast, and found that the resulting turbulence and gust characteristics of these scenarios at times exceeded current IEC standards.
Fewer studies have focused on tropical-cyclone-generated waves and wave growth and how they are represented in offshore wind engineering decisions. Additionally, limited guidance is provided in major offshore standards (American Petroleum Institute, 2021; DNV, 2021; International Electrochemical Commission, 2019) for the minimum requirements of ocean models and methods for capturing tropical-cyclone-generated N-year wave heights and periods. As a result, many different approaches have been taken to model and quantify these ocean design values. Few studies have investigated how current methods treat mixed climates with annual tropical and extratropical cyclone events.
In the absence of abundant buoy observations in the path of a tropical cyclone at the points of interest, the regionally validated GROW-Fine East Coast model is referenced in this work as the best representation of these events to assess whether typical metocean method choices of models and statistical options deliver suitable ocean design parameters for the region.
In this study, the selection of proper design values depends on accuracy in three tiers: statistical methodology, model capacity, and model design. Statistical characterization of the meteorological and oceanographic extremes on the US Atlantic coast with general extreme value and generalized Pareto methods is frequently selected in the literature for similar applications, for example in Jonathan and Ewans (2013), Haselsteiner and Thoben (2020), Northrop et al. (2017), Barthelmie et al. (2021), and Bhaskaran et al. (2023). In contrast, Wada et al. (2022) propose the STM-E (space–time maximum and exposure) method for determining wave extremes from synthetic tropical cyclone data. In a broader study, Kresning et al. (2024) investigate load assessment uncertainty for offshore wind on the US Atlantic coast resulting from a variety of univariate and bivariate extreme value methods; they find differences of up to 6 % between return values with different methods based on the same data. Similarly, Neary et al. (2020) found that discrepancies between univariate and bivariate methods based on the same data were random and indicated “reasonable agreement on average”.
The capacity of spectral wave models to resolve tropical storm features has been investigated by MacAfee and Wong (2007), O'Grady et al. (2022), and Padilla-Hernández et al. (2007) and establish that Simulating Waves Nearshore (SWAN) (Booij et al., 1996) and the Wave Modeling Project (WAM) (Group, 1988), the basis of the GROW-Fine East Coast wave model, are capable of capturing peak wave values and trapped-fetch swell generated by tropical cyclones. Additionally, similar wave growth and propagation behavior is found by Fonseca et al. (2016) between the SWAN and MIKE21 (Johnson and Kofoed-Hansen, 2000) models in coastal Portugal, where large wave heights can be challenging to sufficiently represent in numerical models.
In addition to tool capacity, modeling choices such as boundary condition quality must be investigated for sufficient ability to resolve tropical cyclone features. As in Campos et al. (2022) and Gandoin and Garza (2024), metocean models frequently employ the ERA5 reanalysis dataset for direct analysis or as a boundary condition to high-resolution modeling. In these investigations, Campos and Gandoin both found that ERA5 underrepresented peak winds during storm events, while Caires and Sterl (2005) and Stephens and Gorman (2006) found that ERA-based wave models under-captured significant wave heights (Hs). Similarly, Neary et al. (2020) found a “systematic underbias for extreme significant wave height derived from model hindcasts as compared to those derived from buoy measurements” for 50-year significant wave heights at locations on the US Atlantic coast. Each author suggests additional calibration for improved performance.
This paper investigates the performance of two metocean models forced by global ocean reanalysis datasets (hereafter referred to as “high-resolution” for their high-resolution wave component) to (1) represent significant wave height due to tropical and extratropical events and (2) quantify differences in return period values between these high-resolution models and datasets generated from direct modeling of tropical and extratropical storm events. Two locations on the US East Coast are considered, which experience tropical and extratropical events with varying frequencies and magnitudes, the North Atlantic (“NA”, New England Wind) and the Mid-Atlantic Bight (“MAB”, Kitty Hawk Wind), to assess the sensitivity of the analysis to different mixed-type climates (see map, Fig. 1). A schematic of the study method is provided in Fig. 2. Wind and ocean parameterizations of all three models are documented in Tables 1 and 2, respectively. Finally, to ensure that the statistical findings from this study are not significantly sensitive to the selected extreme value method employed, a subset of model data are additionally analyzed with an alternative extreme value method.
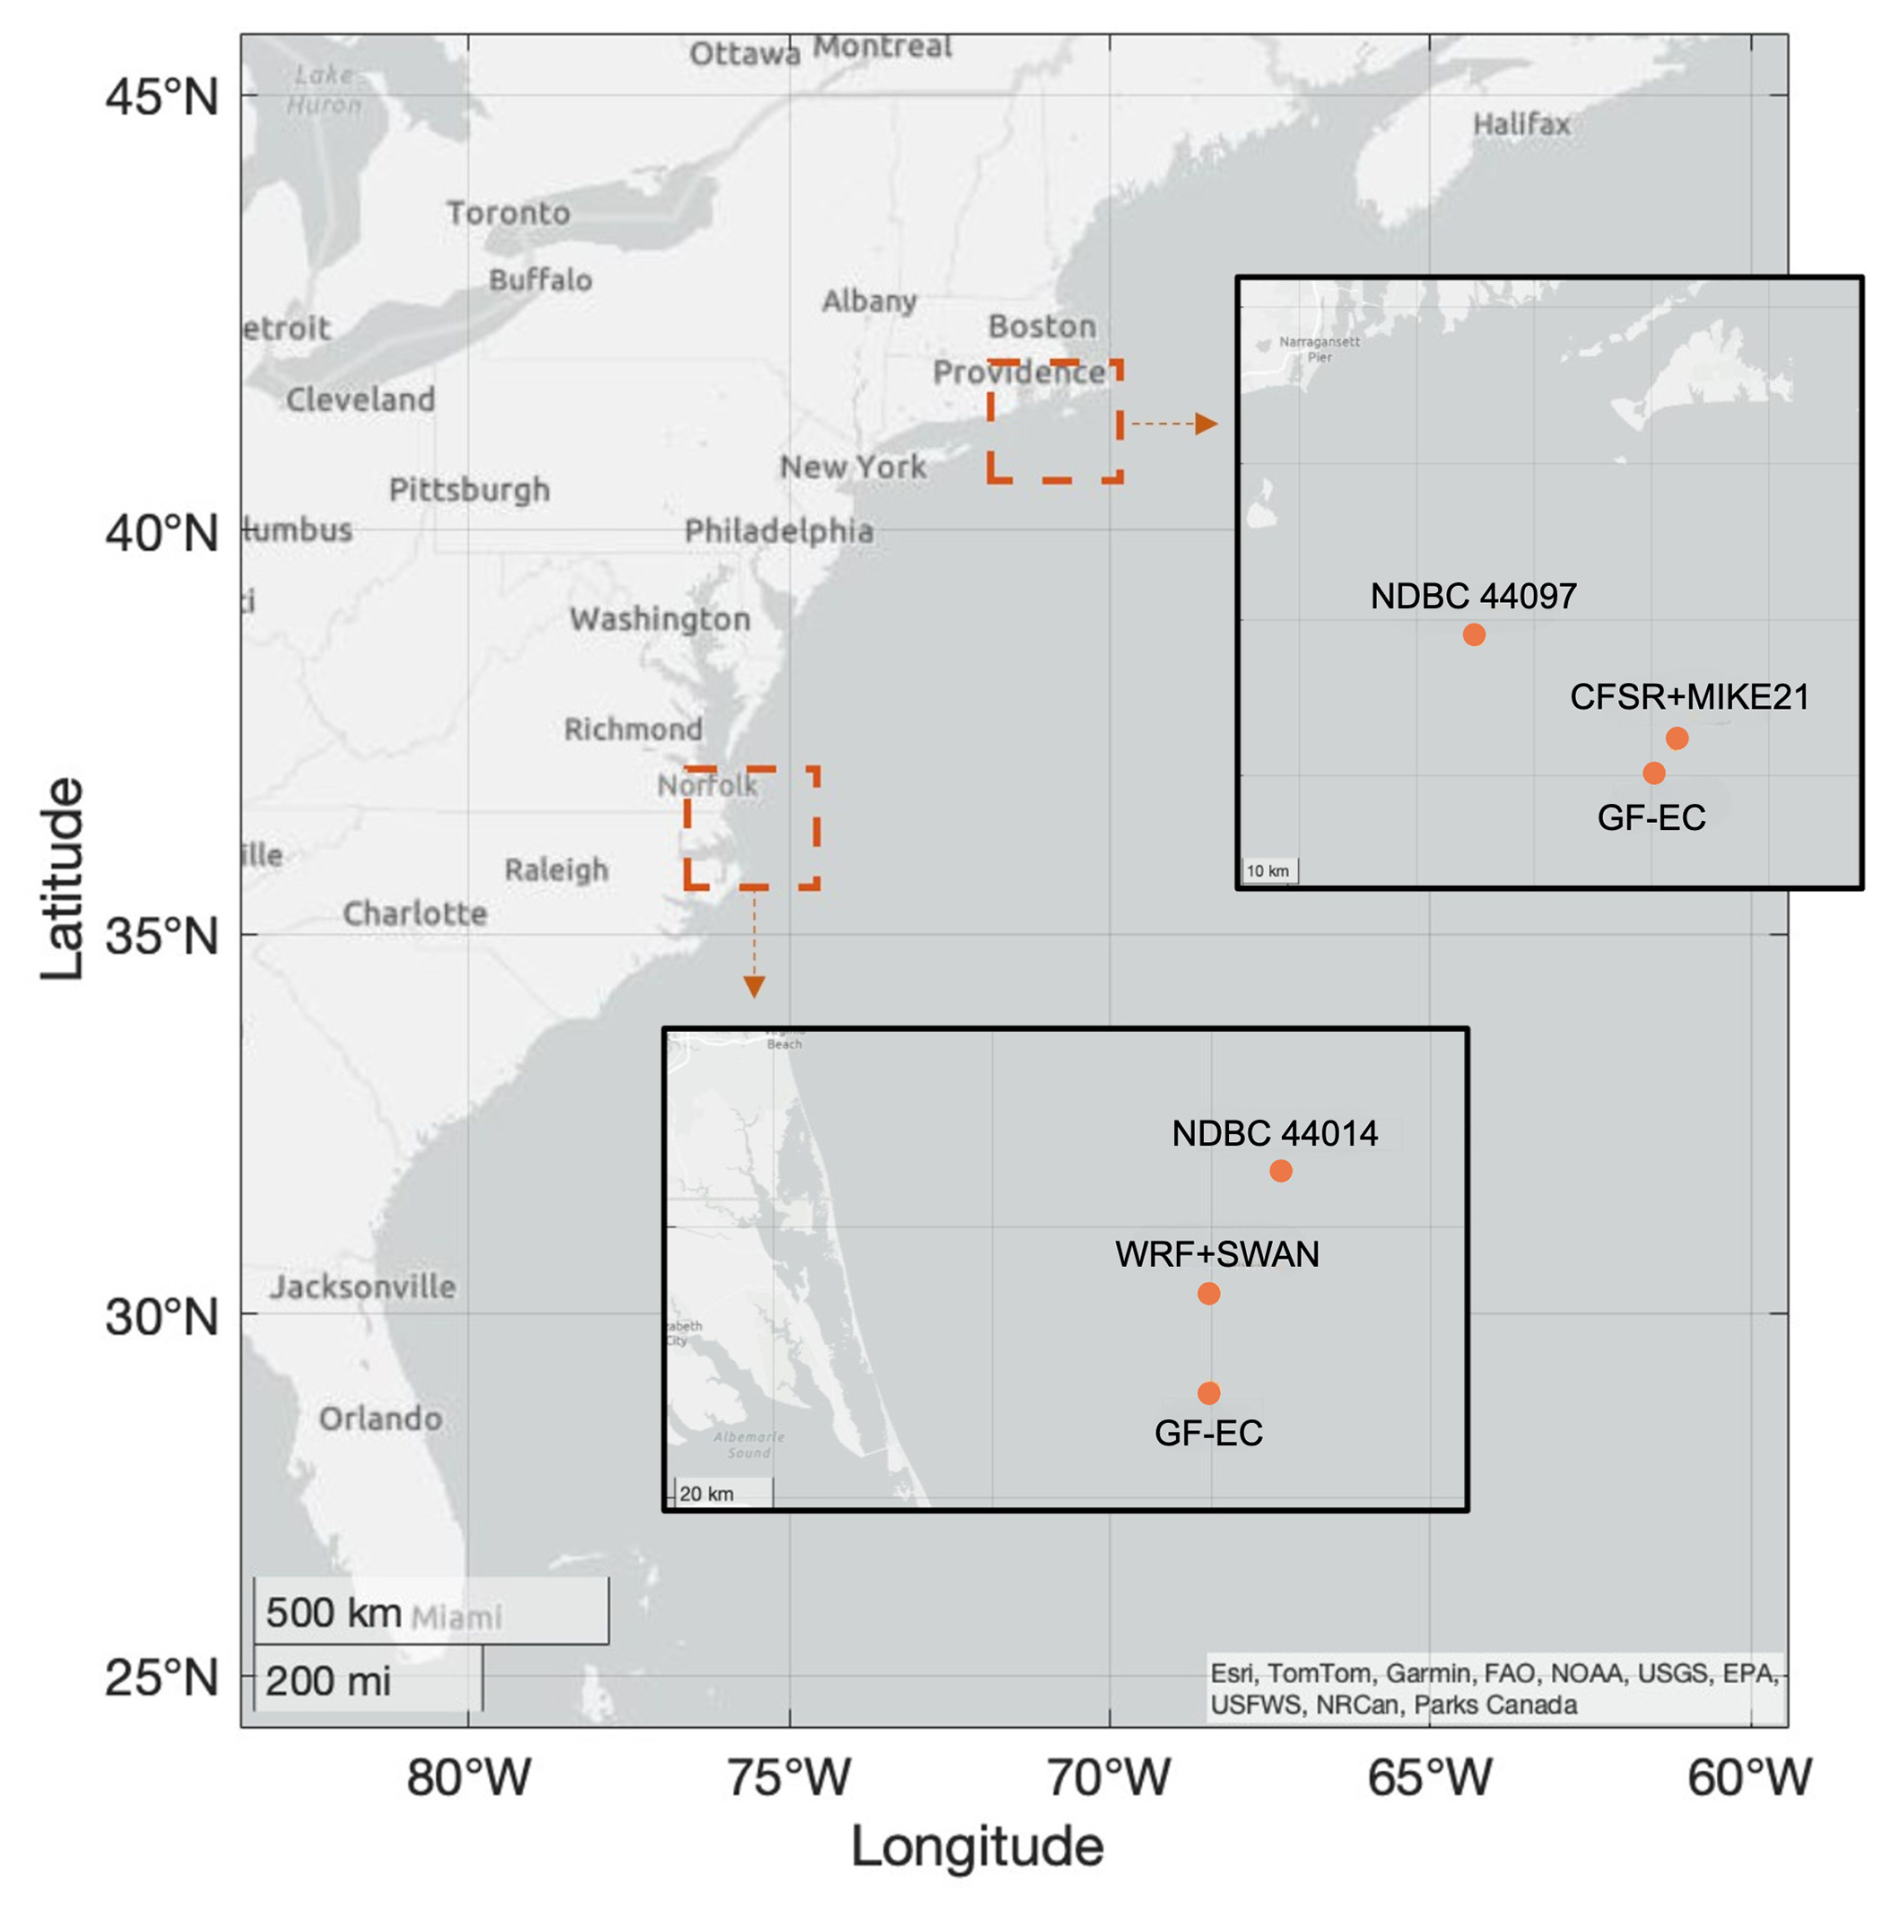
Figure 1Location of study data: buoy observations and associated turbine analysis locations in the North Atlantic (top insert) and in the Mid-Atlantic Bight (bottom insert).
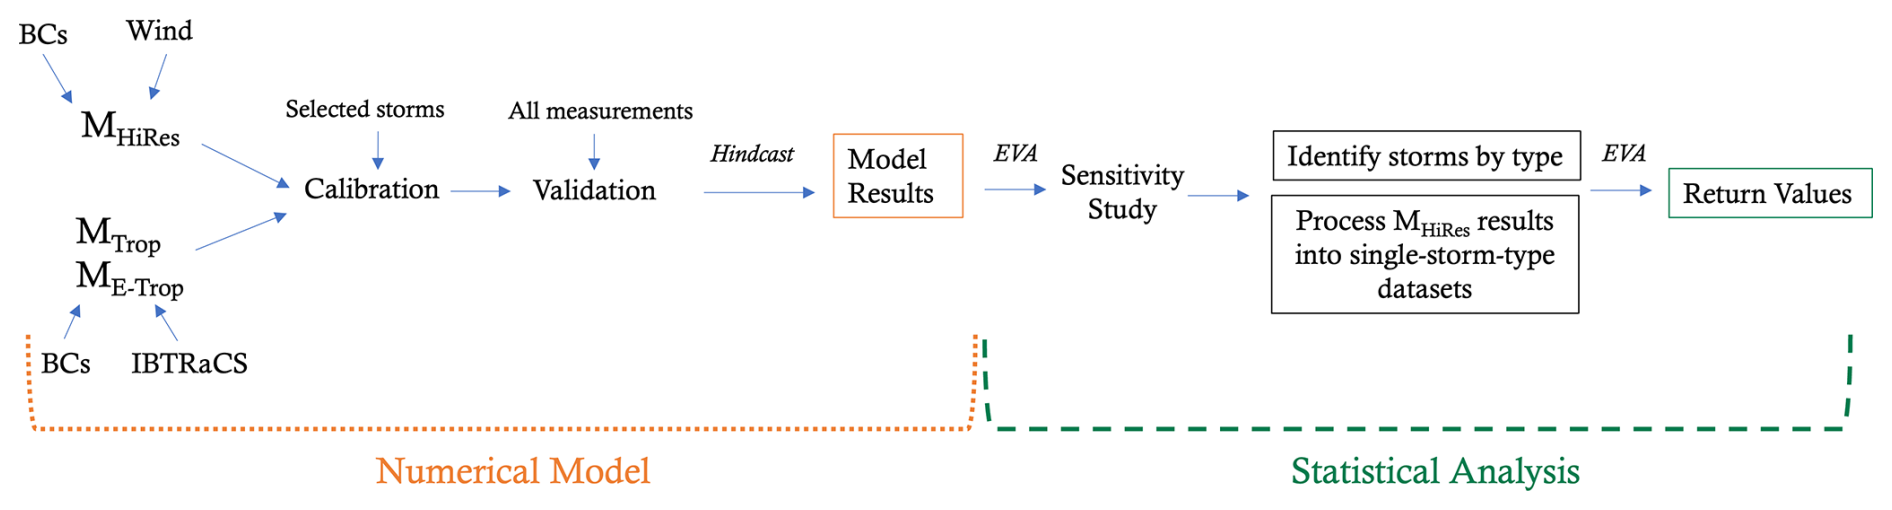
Figure 2Study overview: model parameters are calibrated based on a subset of measurements prior to model validation and extreme value analysis. Additional datasets are post-processed from the high-resolution models into time series of normal and single-type events. This process is applied in the North Atlantic and the Mid-Atlantic Bight analysis locations. Boundary conditions (BCs) and model parameterization are provided in Tables 1 and 2.
Two calibrated and validated high-resolution coupled models of wind, waves, and hydrodynamics simulate a multi-decade hindcast of hourly conditions around the two wind project areas. Post-calibrated model results are compared to buoy observations and the reconstructed tropical and extratropical storm models (collectively referred to as the “GROW-Fine East Coast” model). Results are presented as a collection of absolute and normalized values to protect intellectual property of the GROW-Fine data, where necessary.
Return period estimates from all four models (high-resolution models in the North Atlantic and in the Mid-Atlantic Bight, the GROW-Fine tropical-cyclone-only model, and the GROW-Fine extratropical-cyclone-only model) are calculated by the block maxima (BM) method with a Gumbel distribution, using the Wave Analysis for Fatigue and Oceanography (“WAFO”) toolbox (see Brodtkorb et al. (2000)).
To ensure that the results were not significantly influenced by the chosen statistical method, a sensitivity analysis of a subset of model results was carried out with peaks over threshold (POT). A sample of results from this analysis is available in Appendix A. To enable long hindcast periods for the tropical and extratropical GROW-Fine models, only storm events are represented in these model datasets, with modeled periods of up to 1 week surrounding a peak event. Such a limited dataset poses challenges in establishing the correct threshold and clustering time for analysis by the peaks-over-threshold method. Following results of a Kolmogorov–Smirnov one-sample test (see Sect. 2.2.1), the annual maxima method was considered adequate at all sites for analysis.
2.1 Model descriptions
Different spectral wave and hydrodynamic coupled models were chosen for the two investigated sites (Fig. 1) in this study. These combinations, described in Tables 1 and 2, were chosen as representative modeling choices that quantify the wind, waves, and hydrodynamics of the coastal United States and of traditional metocean models for offshore wind design. The domains and extents are shown in Fig. 3.
Table 1Wind parameterization for the three investigated models in the North Atlantic, in the Mid-Atlantic Bight, and along the US Atlantic coast (GROW-Fine East Coast).
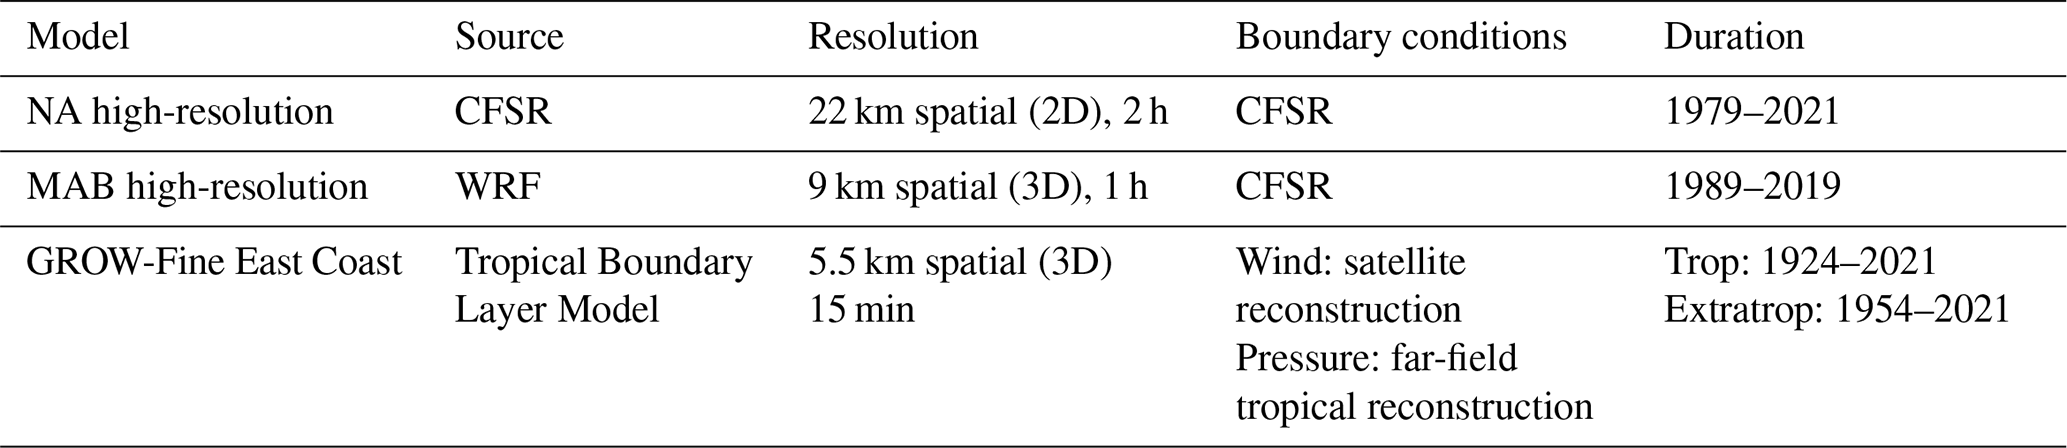
Table 2Wave and hydrodynamic parameterization for the three investigated models in the North Atlantic, in the Mid-Atlantic Bight, and along the US Atlantic coast (GROW-Fine East Coast). All model bathymetries are derived from GEBCO. The NA and MAB model bathymetries are supplemented with 1 m geophysical survey measurements within the project area.
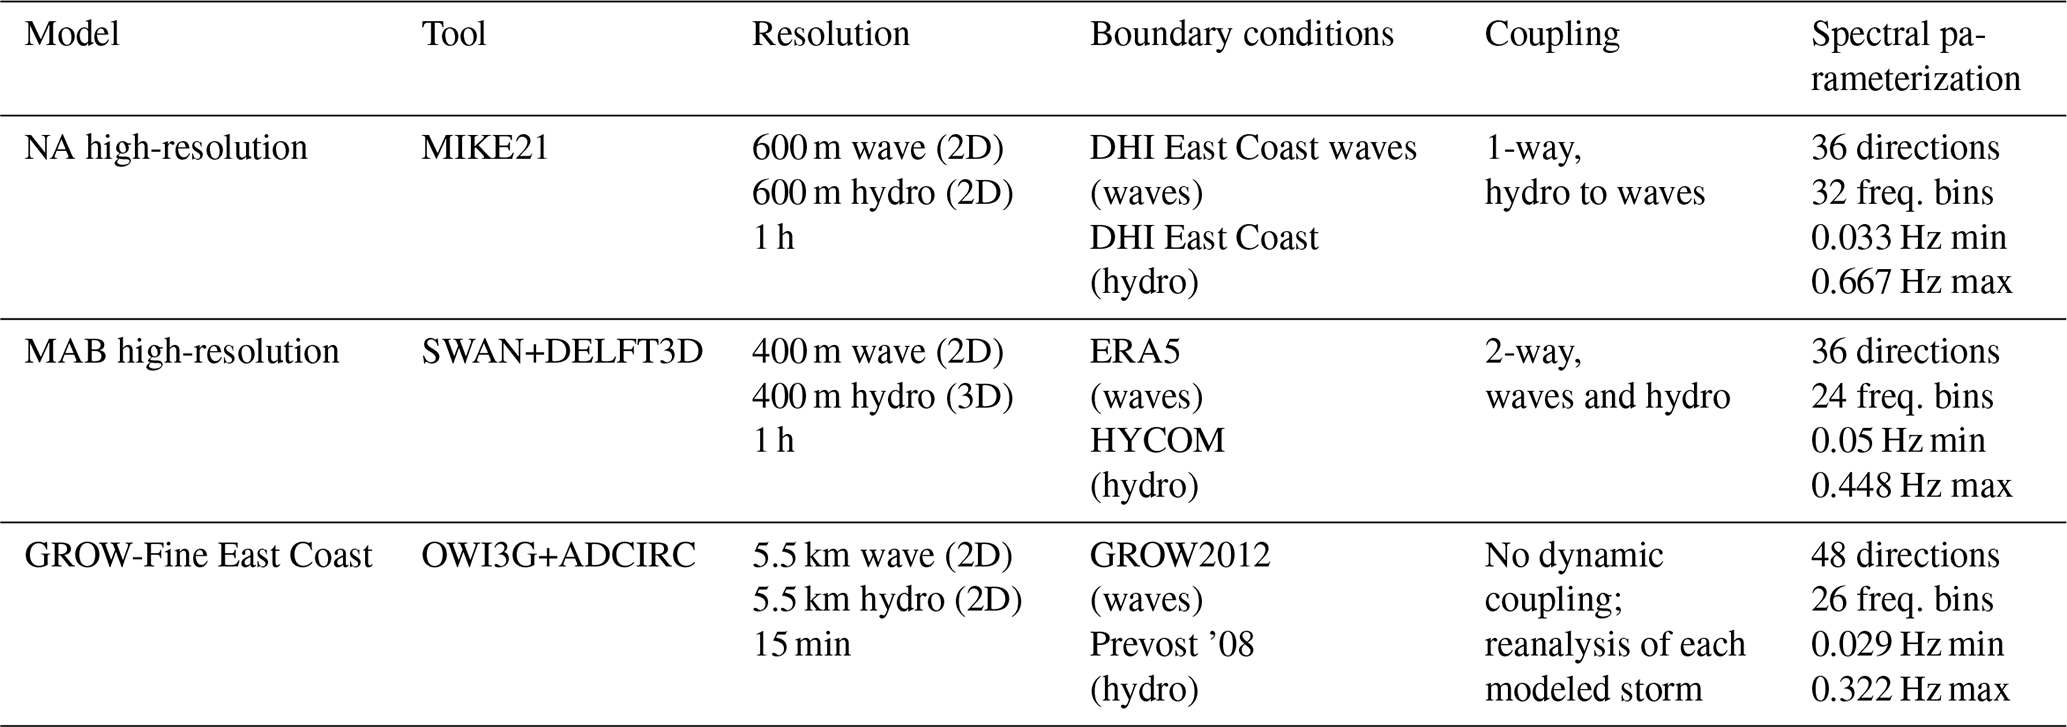
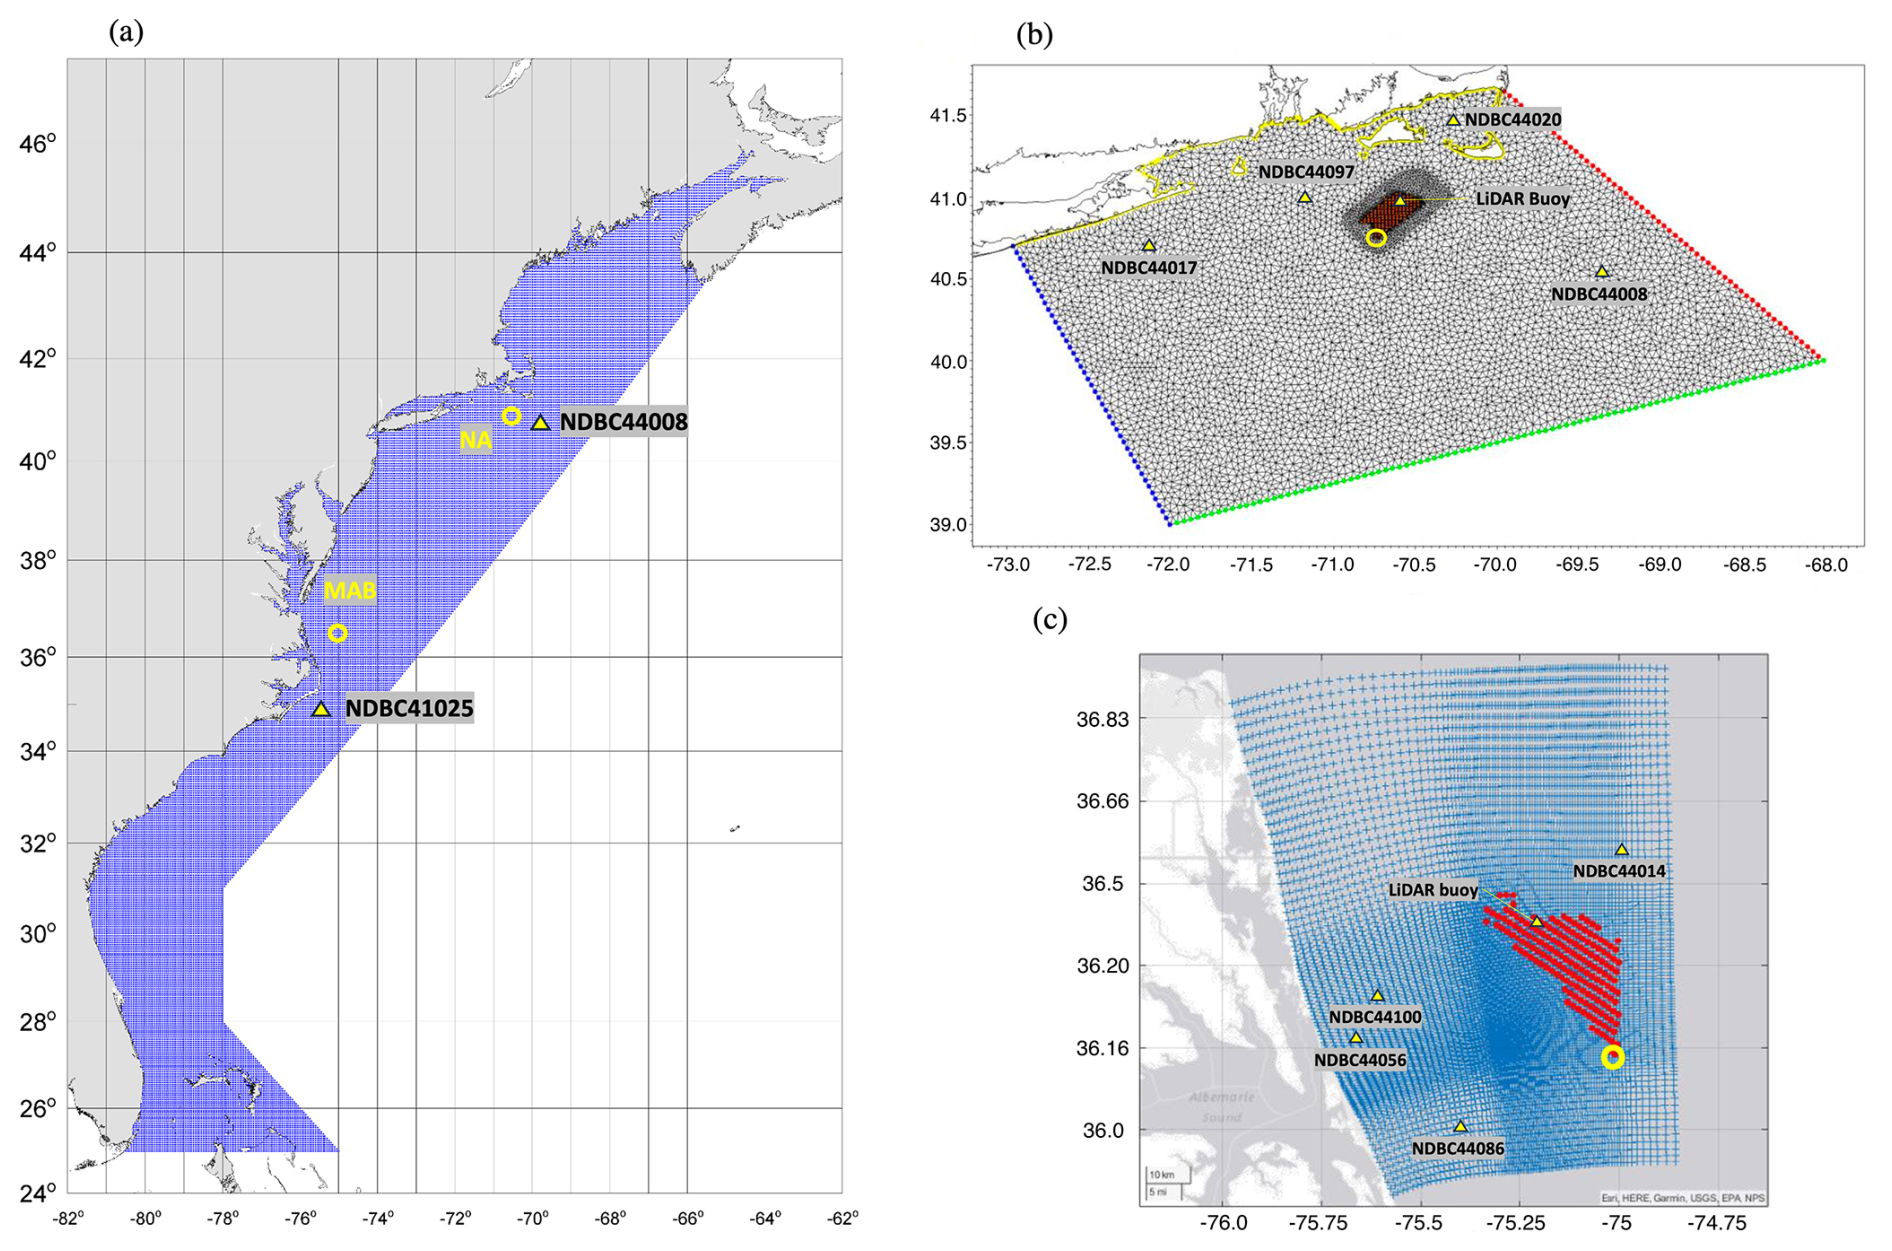
Figure 3Analysis locations are indicated by circles and validation locations are indicated by triangles. (a) The structured-grid GF-EC domain spans from 25 to 45.85° N and 82 to 64.3° W. (b) The unstructured-grid NA “high-resolution” domain spans from 39 to 41.5° N and 73 to 68° W. The wave boundary conditions are taken from a regional spectral wave model that spans 28 to 46° N and 82 to 58° W, covering 16 directions and 25 frequencies from 1 to 33 s. (c) The structured-grid MAB “high-resolution” domain spans from 35.83 to 37° N and 75.58 to 74.83° W.
A list of significant storms during the hindcast period, available observations, and storm events used for model calibration is provided in Appendix C, beginning with the first available buoy-based observations.
2.1.1 North Atlantic high-resolution model
The North Atlantic model comprises 42 years of CFSR winds forcing a MIKE21 spectral wave and MIKE21 hydrodynamics hindcast, with one-way coupling from hydrodynamics to waves. The CFSR dataset is reanalyzed from the National Centers for Environmental Prediction (NCEP) Climate Forecast System model. In this study, 2 h averaged winds are interpolated to the hydrodynamic and wave domain resolutions, with a wind–wave coupling time step of 1 h. The MIKE21 wave model is based on the wave action conservation formulation and is run in fully spectral mode for this study. Depth-induced wave breaking (breaking parameter γ=0.8 and time step factor α=1), spatially varying whitecapping (coefficient of surface drag Cds=0.021 to 0.026 from the Charnock formulation), and nonlinear growth (coefficient =1.35) are modeled. Wave calibration is based on a mixed-type set of 16 storms at four buoys and is applied uniformly throughout the domain. Tides are modeled by the DTU10 Global Tide Model to capture any tidally induced hydrodynamic or wave effects.
This study investigates extremes at the NA model location at 40.75° N, 70.74° W, which has a depth of 62 m and is 45 km from buoy 44 097 (measured depth: 49.4 m), the closest observation to the turbine location of interest. GROW-Fine East Coast (“GF-EC”) model results are presented for 40.8° N, 70.7° W, which has a depth of 59 m.
2.1.2 Mid-Atlantic model
The mid-Atlantic model comprises 30 years of Weather Research and Forecasting (WRF) winds forcing a SWAN spectral wave and Delft3D hydrodynamics hindcast (Lesser et al., 2004), with two-way coupling between the hydrodynamic and wave models. The WRF model is a mesoscale atmospheric model developed by the National Center for Atmospheric Research (NCAR) and partners. In this study, horizontally nested domains with real lateral boundary conditions (CFSR) are applied. The planetary boundary layer is modeled with the YSU (“Yonsei University”) scheme. Depth-induced wave breaking, whitecapping (Westhuysen formulation, van der Westhuysen et al., 2007), and nonlinear growth are similarly modeled as for the North Atlantic case. Tides are modeled by the Oregon State University TPXO dataset to capture any tidally induced hydrodynamic or wave effects. Wave calibration is based on observations of the 2020 “Hurricane Isaias” at 36.41° N, 75.23° W and is applied uniformly throughout the domain.
This study investigates extremes at MAB model location 36.38° N, 75.00° W, which has a depth of 38 m and is 53 km from buoy 44014 (measured depth: 49.1 m), the closest observation to the turbine location of interest. GROW-Fine EC model results are presented for 36.2° N, 75.0° W, which has a depth of 40 m.
2.1.3 GROW-Fine East Coast model
The GROW-Fine East Coast tropical and extratropical models reconstruct storm winds and pressure fields based on multiple types of historical observations, including from satellites, aircraft flights, and SF microwave radiometetry. Waves are modeled by OWI3G, the Oceanweather third-generation wave model based on WAM. This model does not require a prescribed wave spectrum for initialization, and results are further assimilated with ocean observations. The GF-EC domain spans from southern Florida through the Bay of Fundy.
To reconstruct 100 years of tropical storms and 75 years of extratropical storms, normal sea states are omitted from the dataset, and only major storm events are represented. The duration (associated data of storm development and decay) of individual events therefore varies for each storm throughout the dataset. The trajectory of tropical storms in the GF-EC tropical model is based on International Best Track Archive for Climate Stewardship (IBTRaCS) records. While validation of individual events is difficult prior to the deployment of large-scale observing systems like the National Data Buoy Center (NOAA), select events with limited observations from the early to mid-20th century are recreated from the verified model, balancing model fidelity with overall dataset duration.
To assess the influence of time (number of storms) on the statistical assessment of extremes, extreme value analysis (EVA) is conducted for both the full duration of the GF-EC records and the shorter duration of the high-resolution models: 1979–2020 (42 years) for the North Atlantic and 1989–2019 (30 years) for the Mid-Atlantic Bight.
Model validation with NOAA buoy observations spanning the Atlantic coast from 1979, the beginning of data availability, has been carried out by Oceanweather. For more details on the storm wind reconstruction method, see Powell et al. (2010).
2.1.4 Model skill
The GROW-Fine East Coast winds and waves are validated against 20 buoy measurements, spanning from NDBC 41009 in coastal Florida to NDBC 44027 in the northern Gulf of Maine, in addition to satellite altimetry. A selection of validation statistics is provided in Table 3.
Table 3Validation statistics throughout the North Atlantic model domain against continuous measurements, 2010–2020.
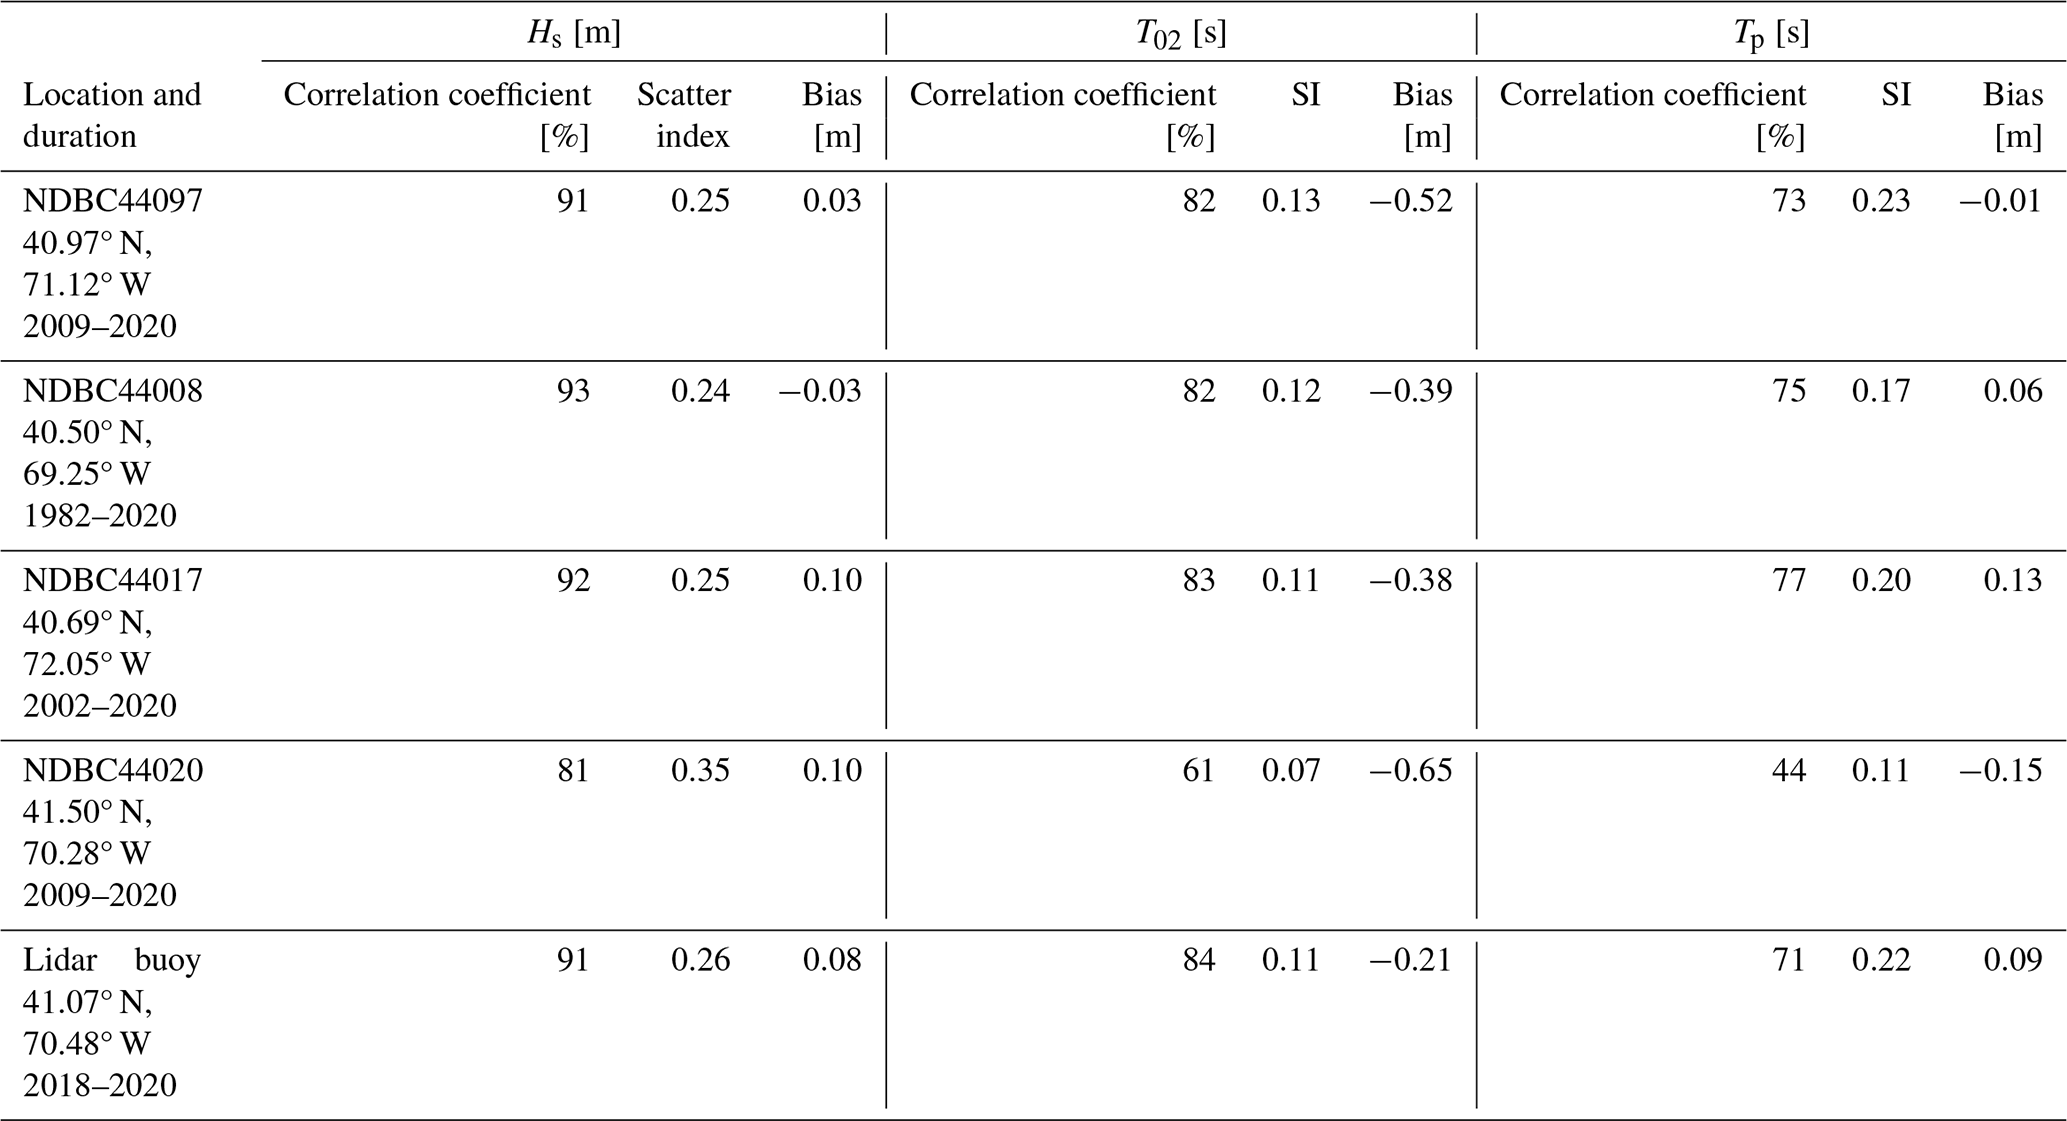
Table 4Selected validation statistics for the GROW-Fine East Coast model overall and in the North Atlantic and mid-Atlantic regions (recreated from the GROW-Fine project description).
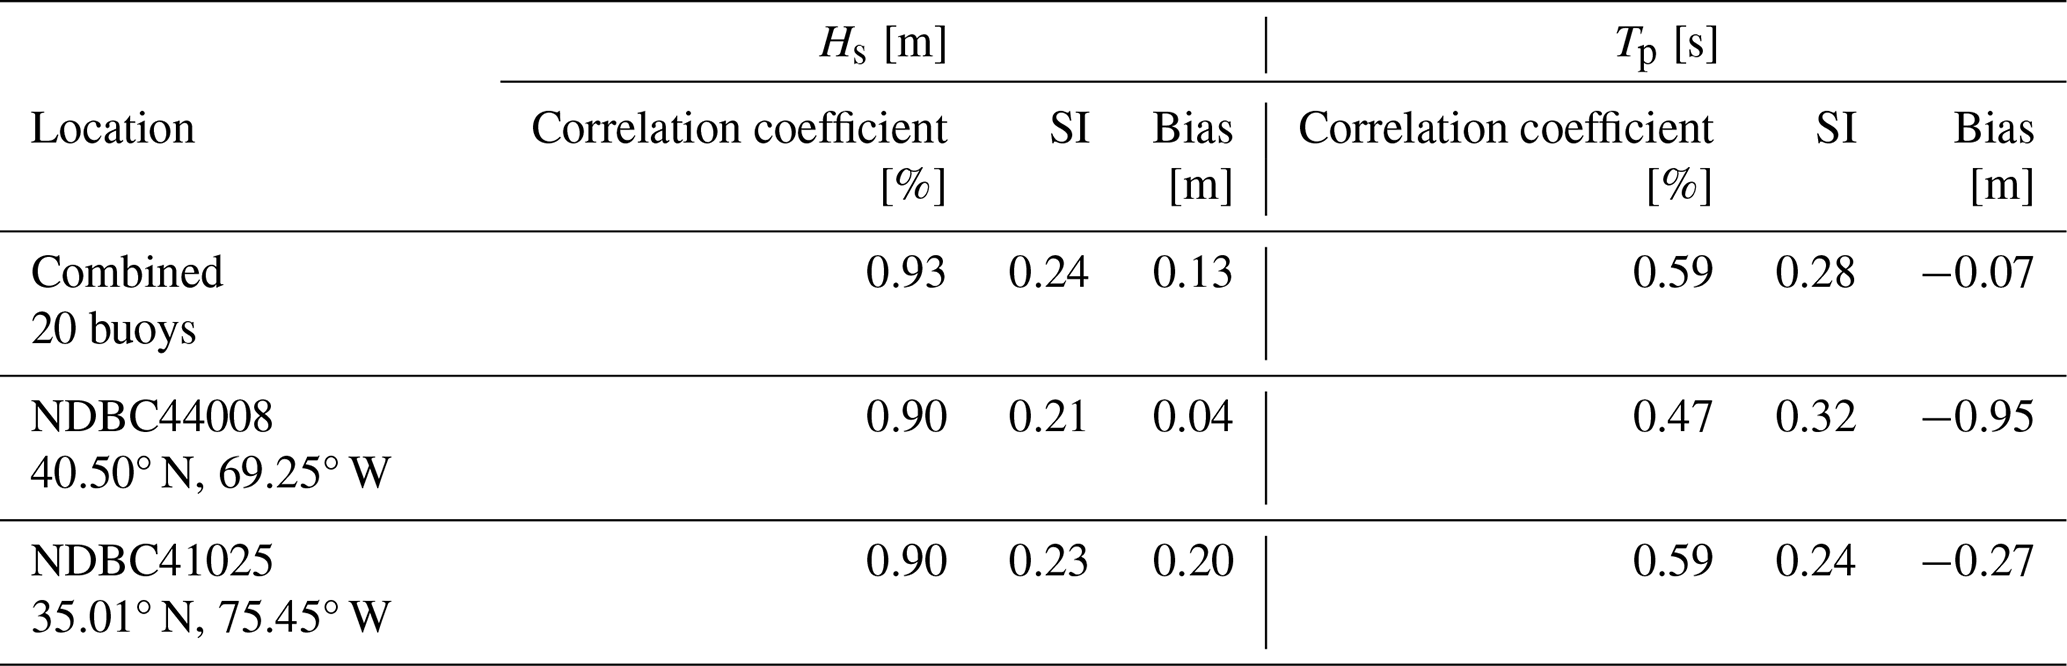
The North Atlantic model calibration was determined from a range of cap to friction velocity values and nonlinear growth coefficients for overall performance during (1) a mixed set of storms and (2) the entire year of 2012. After this calibration, validation was conducted over a 10-year period at five observation locations throughout the model domain. Validation statistics are provided in Table 4.
Very few measurement data are available within the project area: in the case of the North Atlantic model, no tropical cyclones were captured during the 2-year deployment of the lidar buoy, and in the case of the mid-Atlantic model, there is only a 3-month overlap between observations and the hindcast period. The performance of the calibrated model during multiple tropical cyclone events is therefore assessed at a farther location: in the North Atlantic, the closest observation to the project area is 29 km away, at NDBC buoy 44097. Nine significant tropical and 20 significant extratropical events occurred during this 10-year period. For all significant wave heights modeled during this period, the high-resolution root mean square error (RMSE) is 0.338 m. When only considering tropical-cyclone-generated waves, the RMSE at this location increases to 0.474 m, suggesting poorer performance during these events. In the mid-Atlantic region, the closest observation to the project area is again 29 km away, at NDBC buoy 44014. A total of 27 significant tropical and 35 significant extratropical events occurred during this overlapping 30-year period. Similar to the North Atlantic high-resolution model, when only tropical cyclone events are considered, the significant wave height RMSE remains elevated at 0.468 m.
2.2 Univariate extreme value methods
Return values are determined according to the general linear model,
which associates covariates x with the return values Y in terms of regression coefficient β′ and error ϵ. The return values are calculated based on the log-likelihood of the density function, described here as either block maxima (fit with a Gumbel distribution) or as probability-based peaks over threshold (fit with a generalized Pareto distribution). Two methods were chosen to assess the sensitivity of results to method choice.
2.2.1 Block maxima
The generalized extreme value distribution describes a set of data in terms of shape ξ, location μ, and scale σ. When ξ=0, this distribution is equivalent to the two-parameter Gumbel cumulative distribution function used in this study,
from Coles (2001). The location and scale variables were determined by maximum likelihood estimation (tabulated parameter values can be found in Appendix B). The associated return value, xp, for annual exceedance probability p is calculated as
The statistical basis for the distribution fit is composed of the largest annual significant wave heights of the model dataset (fitted distributions of model data are provided in Fig. 4). A one-sample K-S test was conducted to ensure that the data follow a Gumbel cumulative distribution function. The null hypothesis H0, the data follow a Gumbel distribution, was not rejected, indicating that at a 95 % confidence level this distribution adequately fits the data. Figures of the fitted and empirical Gumbel CDF of the data are provided in Appendix A.
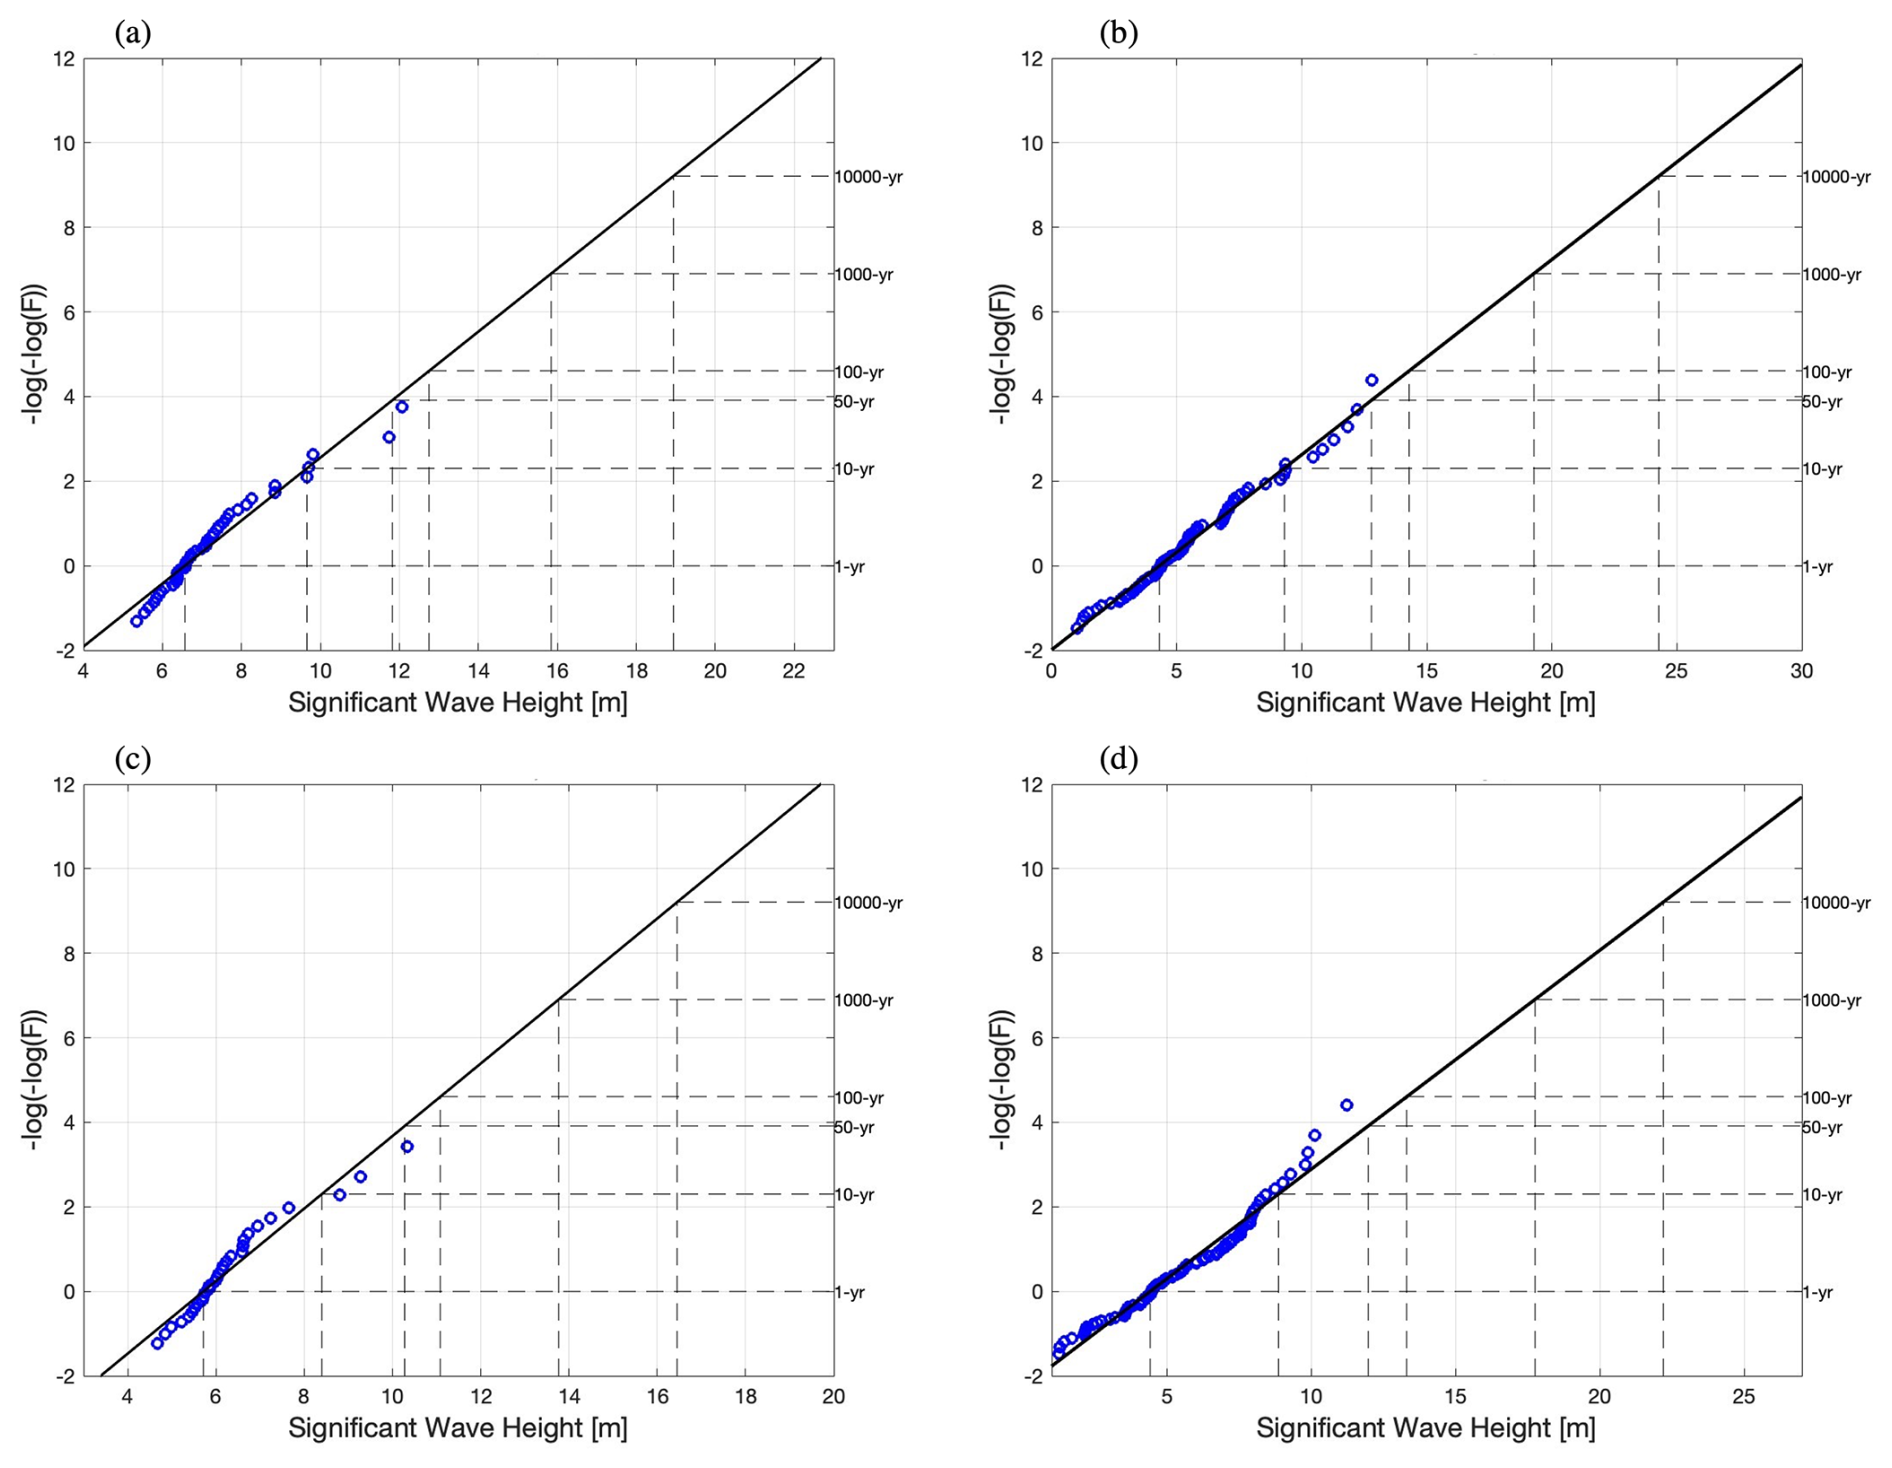
Figure 4Model data with annual maxima fit to Gumbel distribution. (a) NA high-resolution model; (b) NA GF-EC tropical model; (c) MAB high-resolution model; (d) MAB GF-EC tropical model.
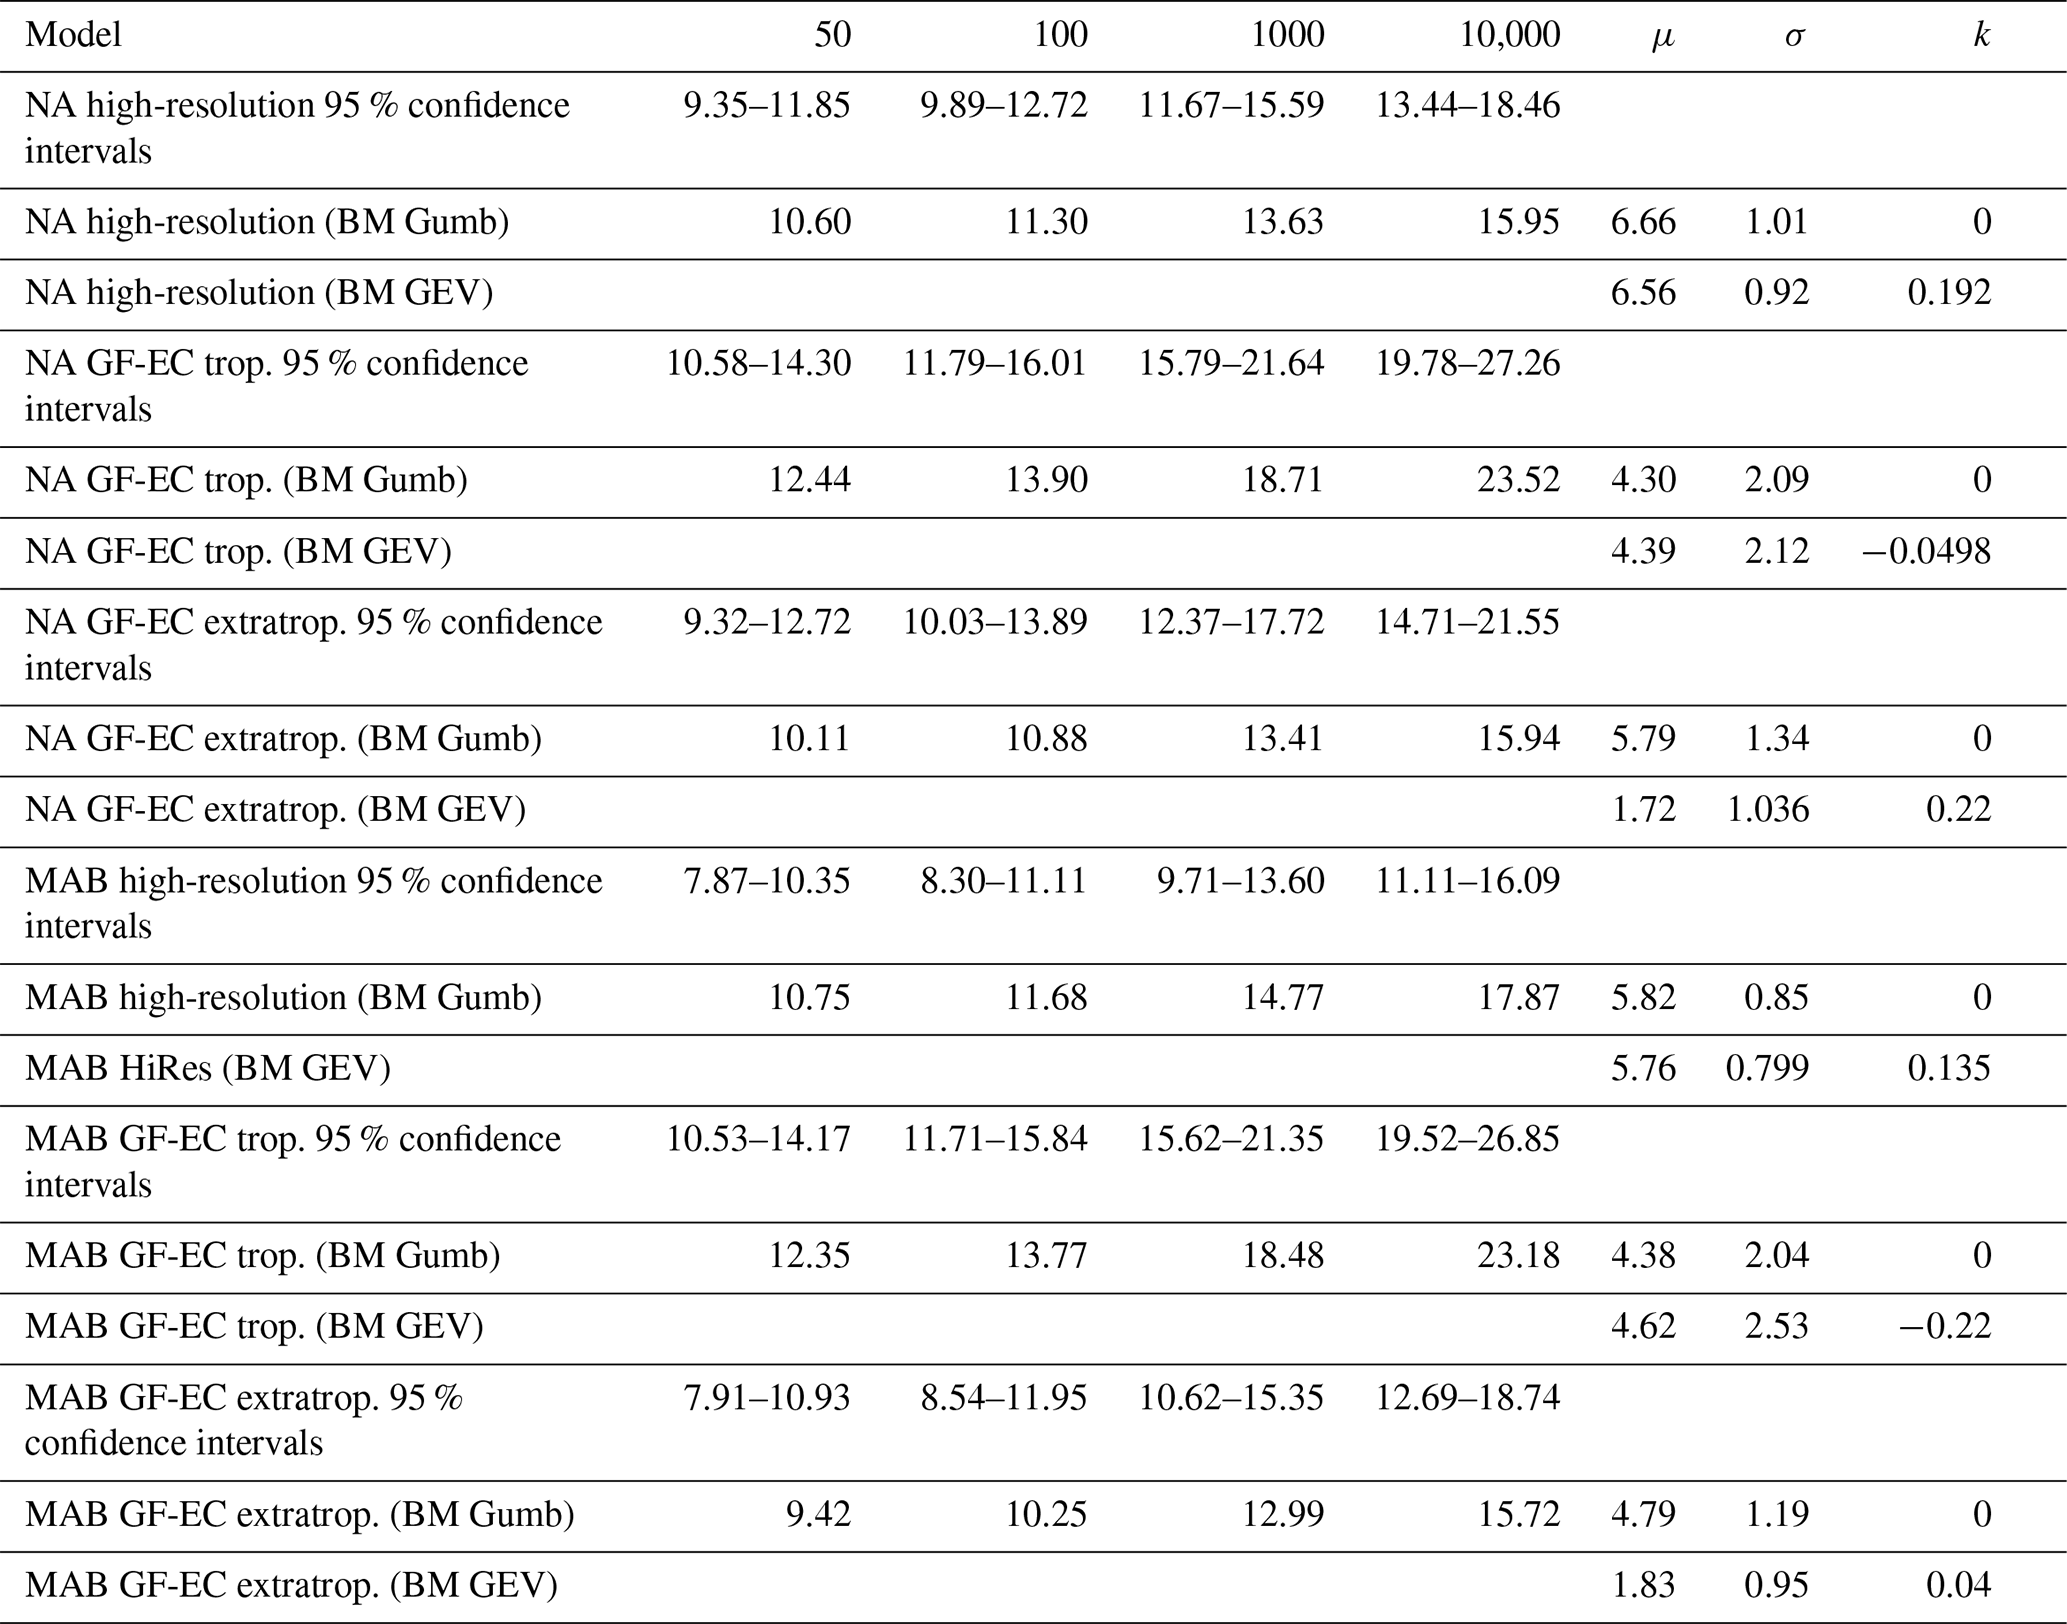
Based on an assessment of the Atlantic hurricane season between 1991 and 2020, an average of 14 named storms (depressions, storms, and hurricanes) and 7 hurricanes occur each year (see “Tropical Cyclone Climatology”, NOAA (2025), for an overview of this assessment), a small annual value that poses a challenge for sufficient representation in sample sets. The GF-EC MAB site data include 81 tropical cyclone events (storm samples). The GF-EC NA site data include 80 tropical cyclone events. In the event that a tropical cyclone did not pass near the analysis location during the season, no maxima are recorded for that year in the GF-EC dataset. In the “tropical cyclone only, high-resolution” NA and MAB datasets, if there is no tropical cyclone activity, a smaller, non-extratropical cyclone is selected as the annual maxima. Annual maxima analysis for the “high-resolution” model datasets account for 42 storms (tropical or extratropical cyclones) at the NA location and 30 storms (tropical or extratropical cyclones) at the MAB location. The “high-resolution” hindcast duration, and therefore storm sample size, is set by the available duration of reanalysis data applied to the model boundaries.
2.2.2 Separating storm types
The high-resolution hindcasts comprise all normal and mixed-type storm periods in one dataset. In order to calculate extreme return values according to storm type, as established by Gomes and Vickery (1978), the high-resolution model results were post-processed for their entire hindcast period into two datasets: one with tropical storm events removed and another with extratropical storm events removed, aligned with storms represented in the overlapping period with the GROW-Fine datasets.
Extreme value theory assumes that extreme values are independent variables (Mackay and Johanning, 2018). However, multiple peaks may be attributed to the same event during storm growth and dissipation. To preserve the independence criterion in this study, only the peak significant wave height is retained in a period of 98 h during an identified storm. For simplicity, the same storm duration is assumed for both tropical and extratropical events; however, in a number of instances, the storm duration is shorter than this period. In general, tropical cyclone forward speed is highly dependent on local climatic conditions, which influences storm duration in a given location. For storm removal from a dataset, values 49 h prior to and 49 h after the peak significant wave height are removed.
As return periods extend to 50 years and beyond, tropical cyclones become the dominating storm type for extremes both in the North Atlantic and for all return periods in the mid-Atlantic (green dash-dotted line, Fig. 5). While extratropical cyclones are a more frequent occurrence at the North Atlantic site (there are 48 significant extratropical cyclone events recorded during the 42-year hindcast period, whereas there are 15 significant tropical cyclone events), tropical cyclones were able to reach greater intensities in the studied record.
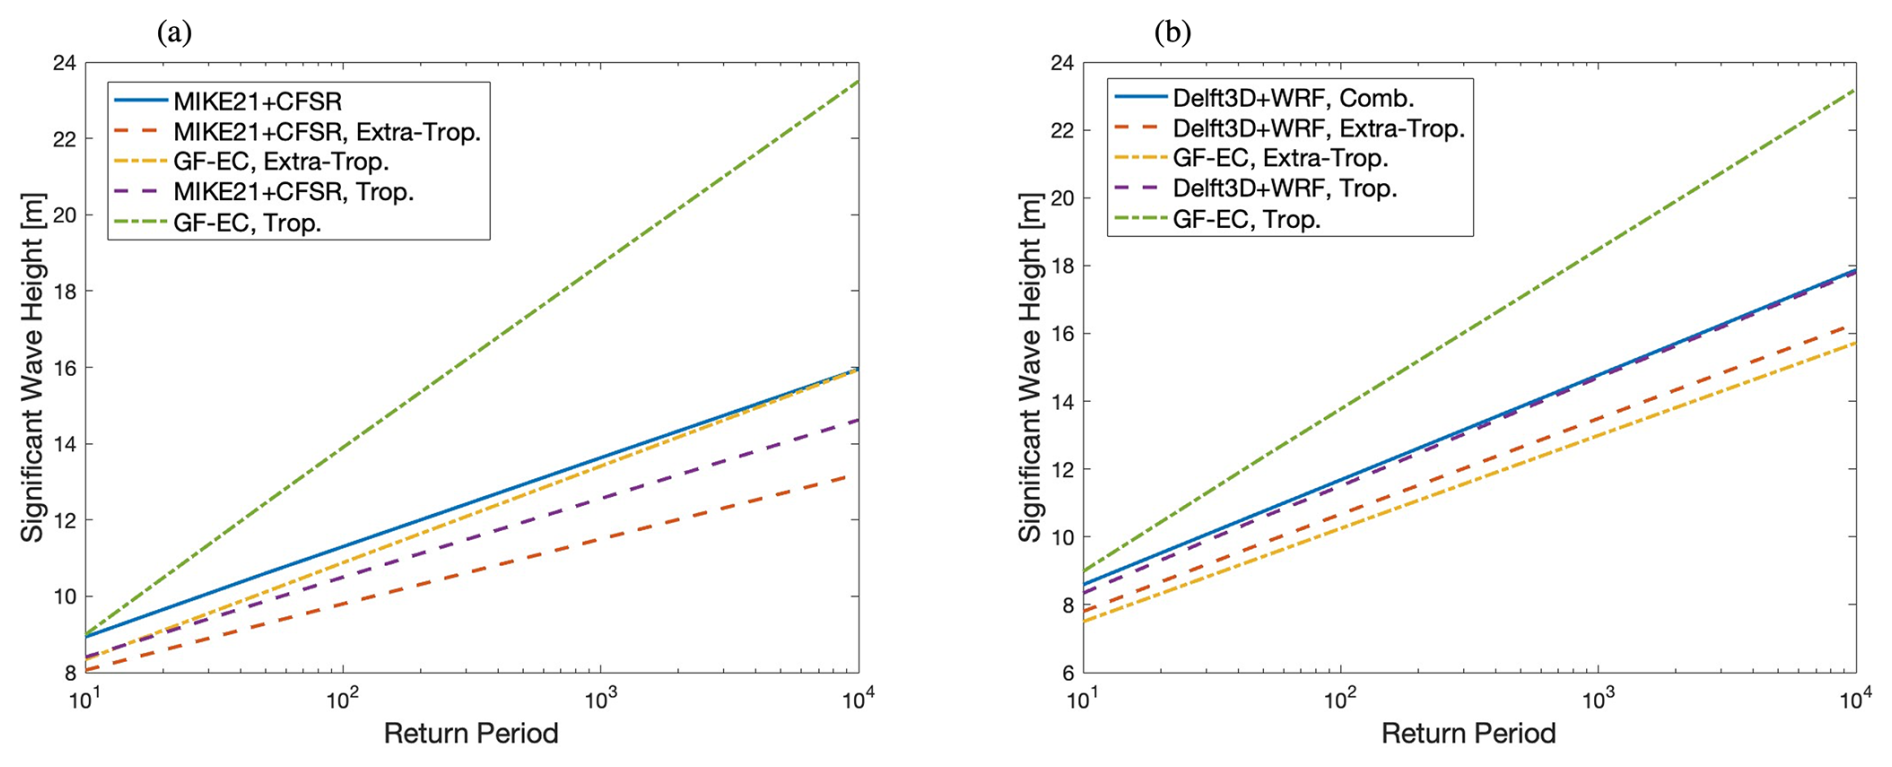
Figure 5Significant wave height return values for all models by annual maxima with Gumbel distribution fit. (a) North Atlantic site (40.8° N, 70.7° W) and (b) Mid-Atlantic Bight site (36.2° N, 75.0° W).
The return values calculated from the GF-EC tropical model show diverging values in trend and magnitude from the high-resolution hindcast for both the North Atlantic (Fig. 5a) and the mid-Atlantic (Fig. 5b) scenarios, despite different calibrations, boundary conditions, and latitudes. The influence of statistical and modeling choices on these diverging trends for tropical cyclone events, as representing storm frequency and intensity, is investigated further in the following sections.
In contrast, there is good agreement between the GF-EC extratropical model and the high-resolution model data in both its original and post-processed (normal + extratropical events) datasets (for the North Atlantic, see Fig. 5a, dash-dotted yellow line, and for the Mid-Atlantic Bight, see Fig. 5b, dash-dotted yellow line). The similarity of return values between models suggests that both the storm type and sample set of extratropical events at these latitudes are sufficiently represented by the high-resolution models in the 30–42-year periods investigated.
3.1 Influence of model characteristics
3.1.1 Overall model performance
Representative model performance is presented here for similar-intensity storms: the January 2015 extratropical storm, a Class 3 storm on the Dolan–Davis scale, and “Hurricane Dorian”, a Category 2 storm on the Saffir–Simpson scale. (For more information on these scaling systems, see Dolan and Davis, 1992, and Simpson, 1974.) The time and duration of the extratropical wave height successive peaks (Fig. 6a) agree between models and measurements, with the GF-EC extratropical model representing a slightly larger peak from measurements (45 km distance). Importantly for wave growth, the evolution of total wave period was captured well for the extratropical event by all three sources (Fig. 6b).
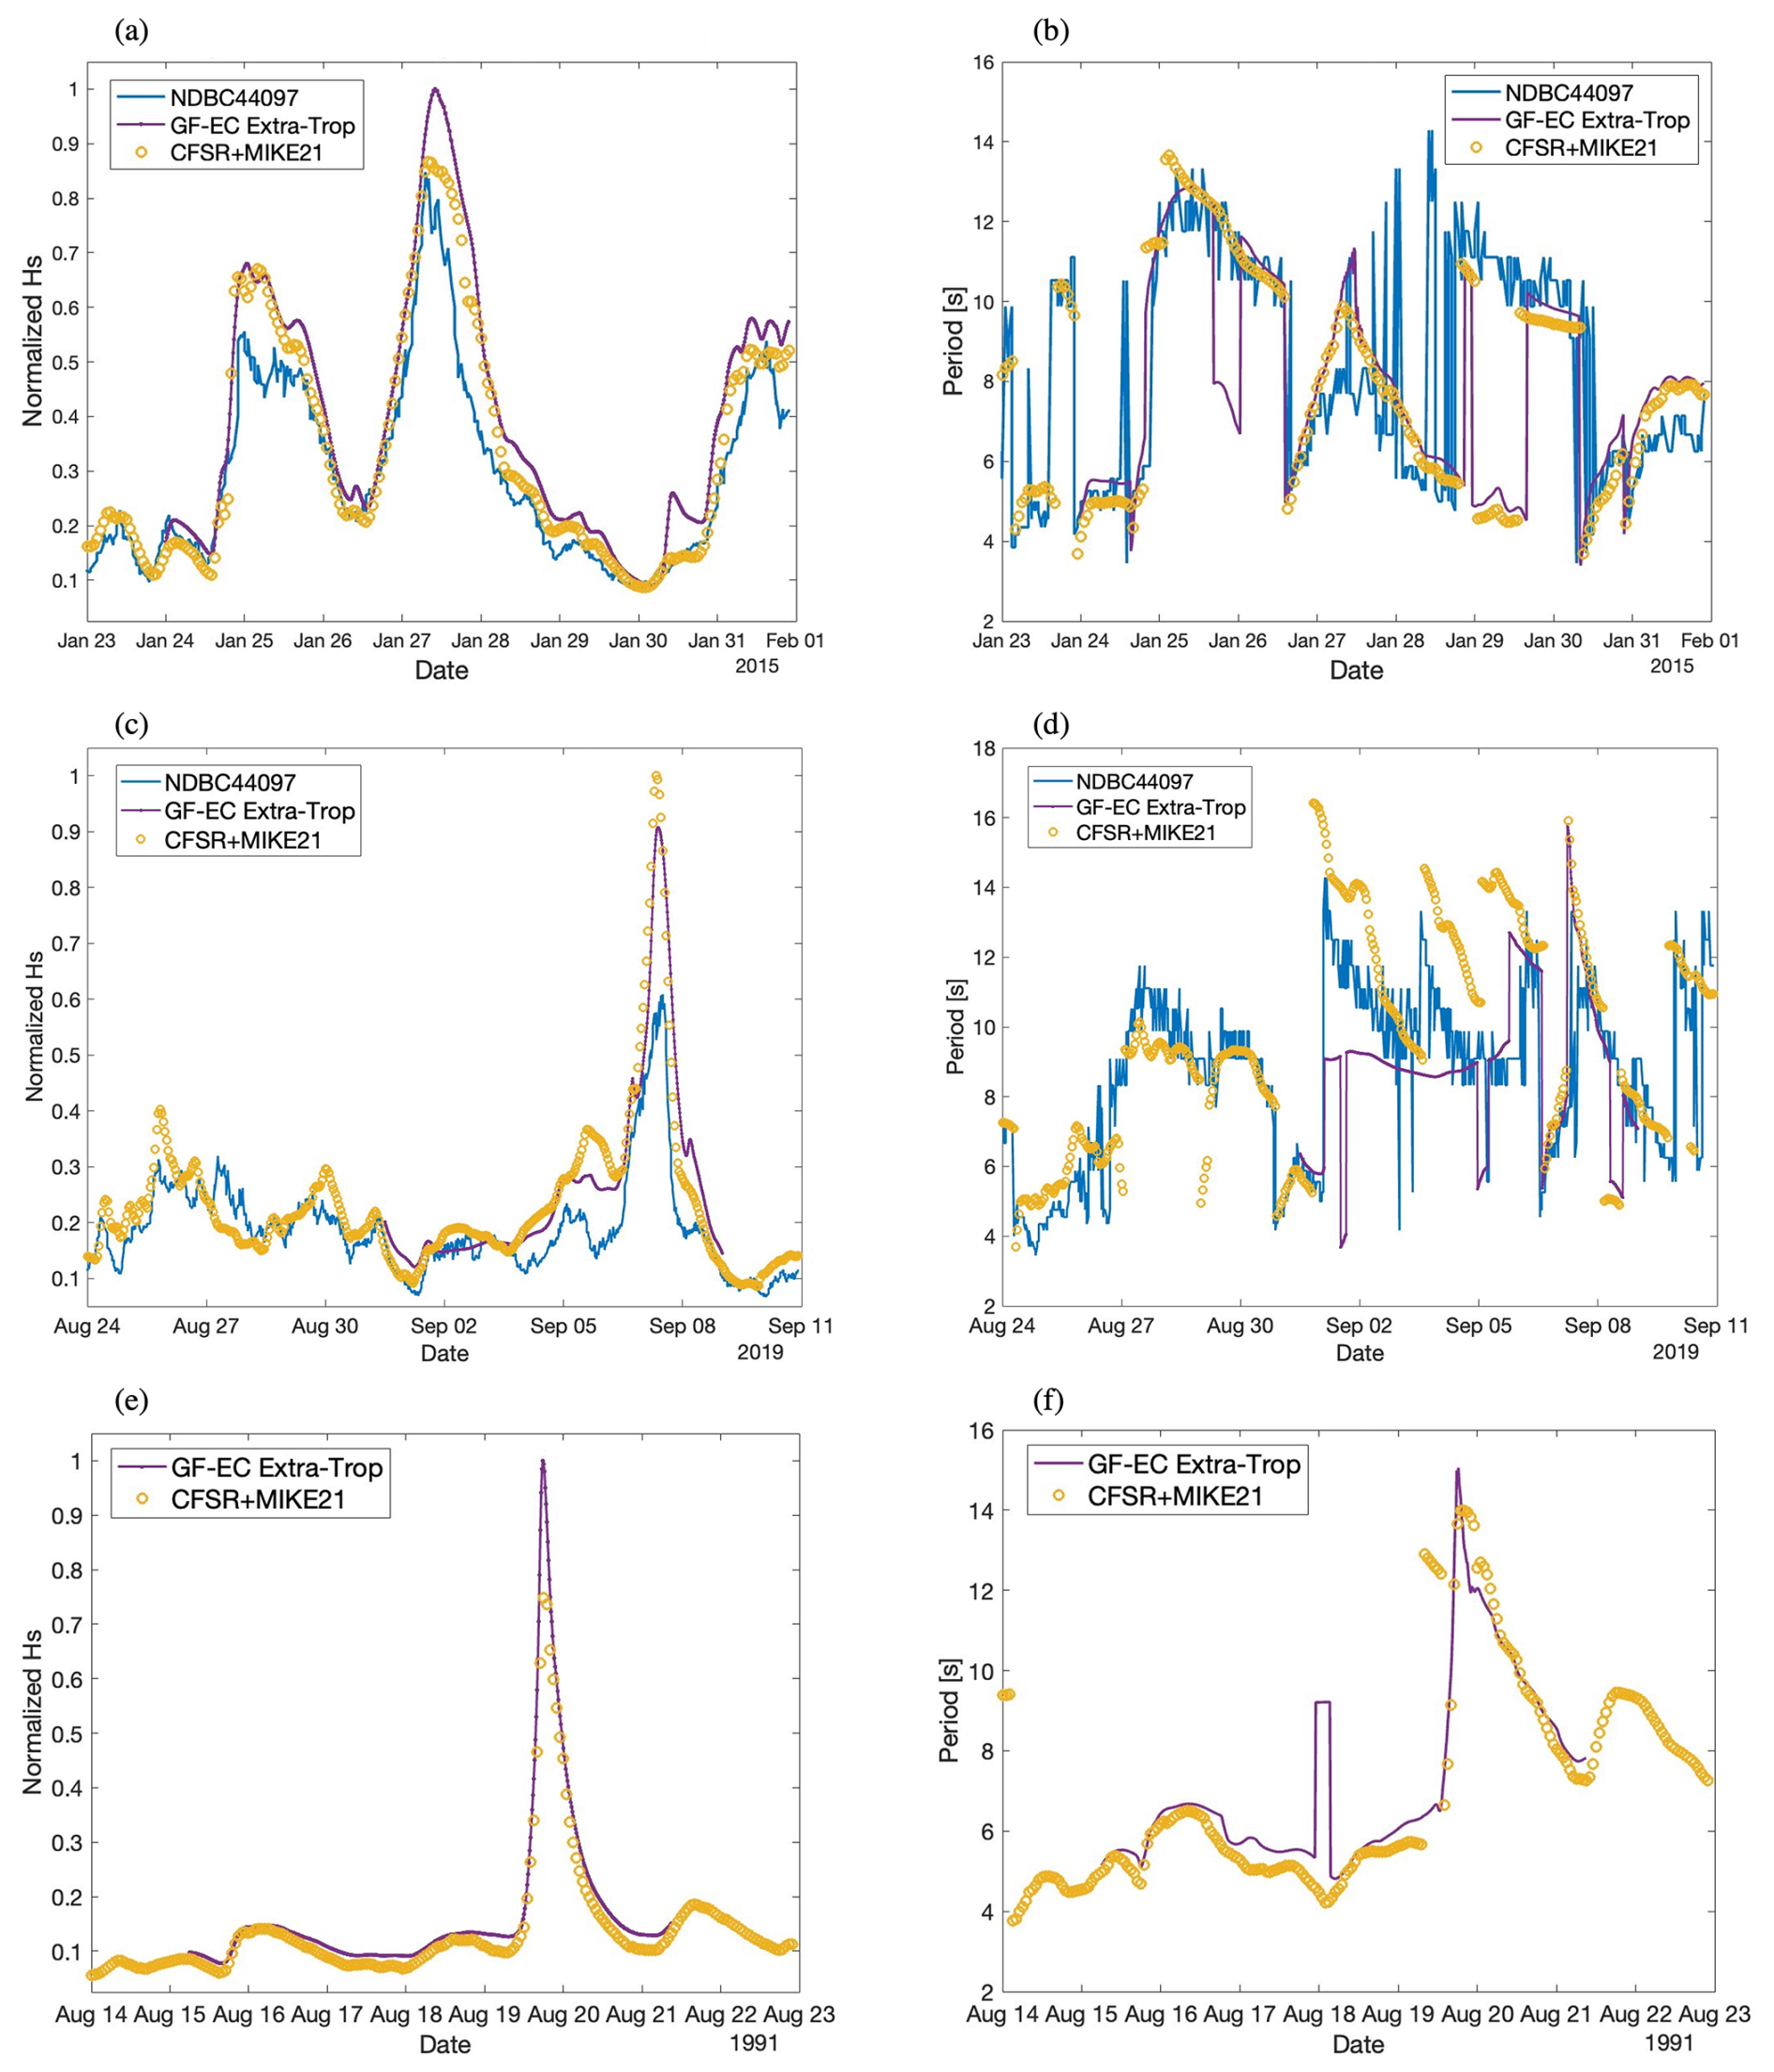
Figure 6Representative performance of the high-resolution and GF-EC model ocean wave models during (a–b) extratropical and (c–f) tropical cyclone storm events, with observations. To protect intellectual property and to preserve scale, significant wave height values are normalized to the single largest peak value. (a) Hs during the 2015 blizzard, North Atlantic; (b) Tp during the 2015 blizzard, North Atlantic; (c) Hs during “Hurricane Dorian”, North Atlantic; (d) Tp during “Hurricane Dorian”, North Atlantic; (e) Hs during “Hurricane Bob”, North Atlantic; (f) Tp during “Hurricane Bob”, North Atlantic.
While there is overall agreement between models and measurements on peak timing and storm duration during “Hurricane Dorian”, the proper significant wave height is more difficult to assess, as observations are 45 km farther from the storm eye than the investigated location. The range of peak periods throughout the event is also captured by both models compared to observations. Finally, a notable difference in significant wave height is observed between the models for “Hurricane Bob” (Fig. 6e), when the analysis point is within the storm fetch and 100 km from the storm eye. In a region prone to occasional high-intensity events (or the propagation of large waves from these events) this single discrepancy likely influences the long-term statistics for the region, notwithstanding more frequent and less intense winter storms.
Throughout the 42-year period, the North Atlantic model represents all significant tropical and extratropical events on record, including in a number of cases larger significant wave heights than in the GF-EC tropical dataset. However, the combined effect of the “Hurricane Bob” wave height difference between models, the low number of hurricanes in the high-resolution model period (15 in 42 years), and the overall magnitude of the storm within the regional extremes history (a significant wave height on the order of “Hurricane Gloria” in 1985 and the “Storm of the Century” blizzard of 1993, the two largest at the site) has consequential implications for extreme value estimations within the region.
Similarly, throughout the 30-year period of the MAB high-resolution hindcast, all identified tropical and extratropical events are represented. There is a notable trend of underrepresentation of the largest storm peaks, suggesting that calibration based on a single tropical cyclone observation was insufficient in terms of numerical modeling. However, calibration is not the only (or largest) influence on the return values calculated in this study, as discussed in Sect. 3.2.
3.1.2 Tropical cyclone sea state representation
Model performance is first assessed for the representation of wind-sea and swell waves generated during storm evolution; the two-dimensional wave spectrum is partitioned by the watershed algorithm. (For brevity, only the North Atlantic case is presented here.) For both the high-resolution and GF-EC datasets, the wave components are similarly captured during “Hurricane Bob” and during “Hurricane Dorian”. Both models capture the physical progression of a tropical cyclone as signaled by the evolution of wave peak period: elevated swell frequencies (approximately 10 s, Bob, Fig. 7; up to 16 s, Dorian, Fig. 7) precede maximum winds. In the case of “Hurricane Bob”, where the analysis point is within the storm fetch, peak significant wave height (solid vertical line) corresponds to the wind-sea and overall storm maximum peak periods (approximately 15 s), suggesting coherent representation of the storm physics. Both swell and wind-sea frequencies are characterized similarly by both the high-resolution and GF-EC tropical models.
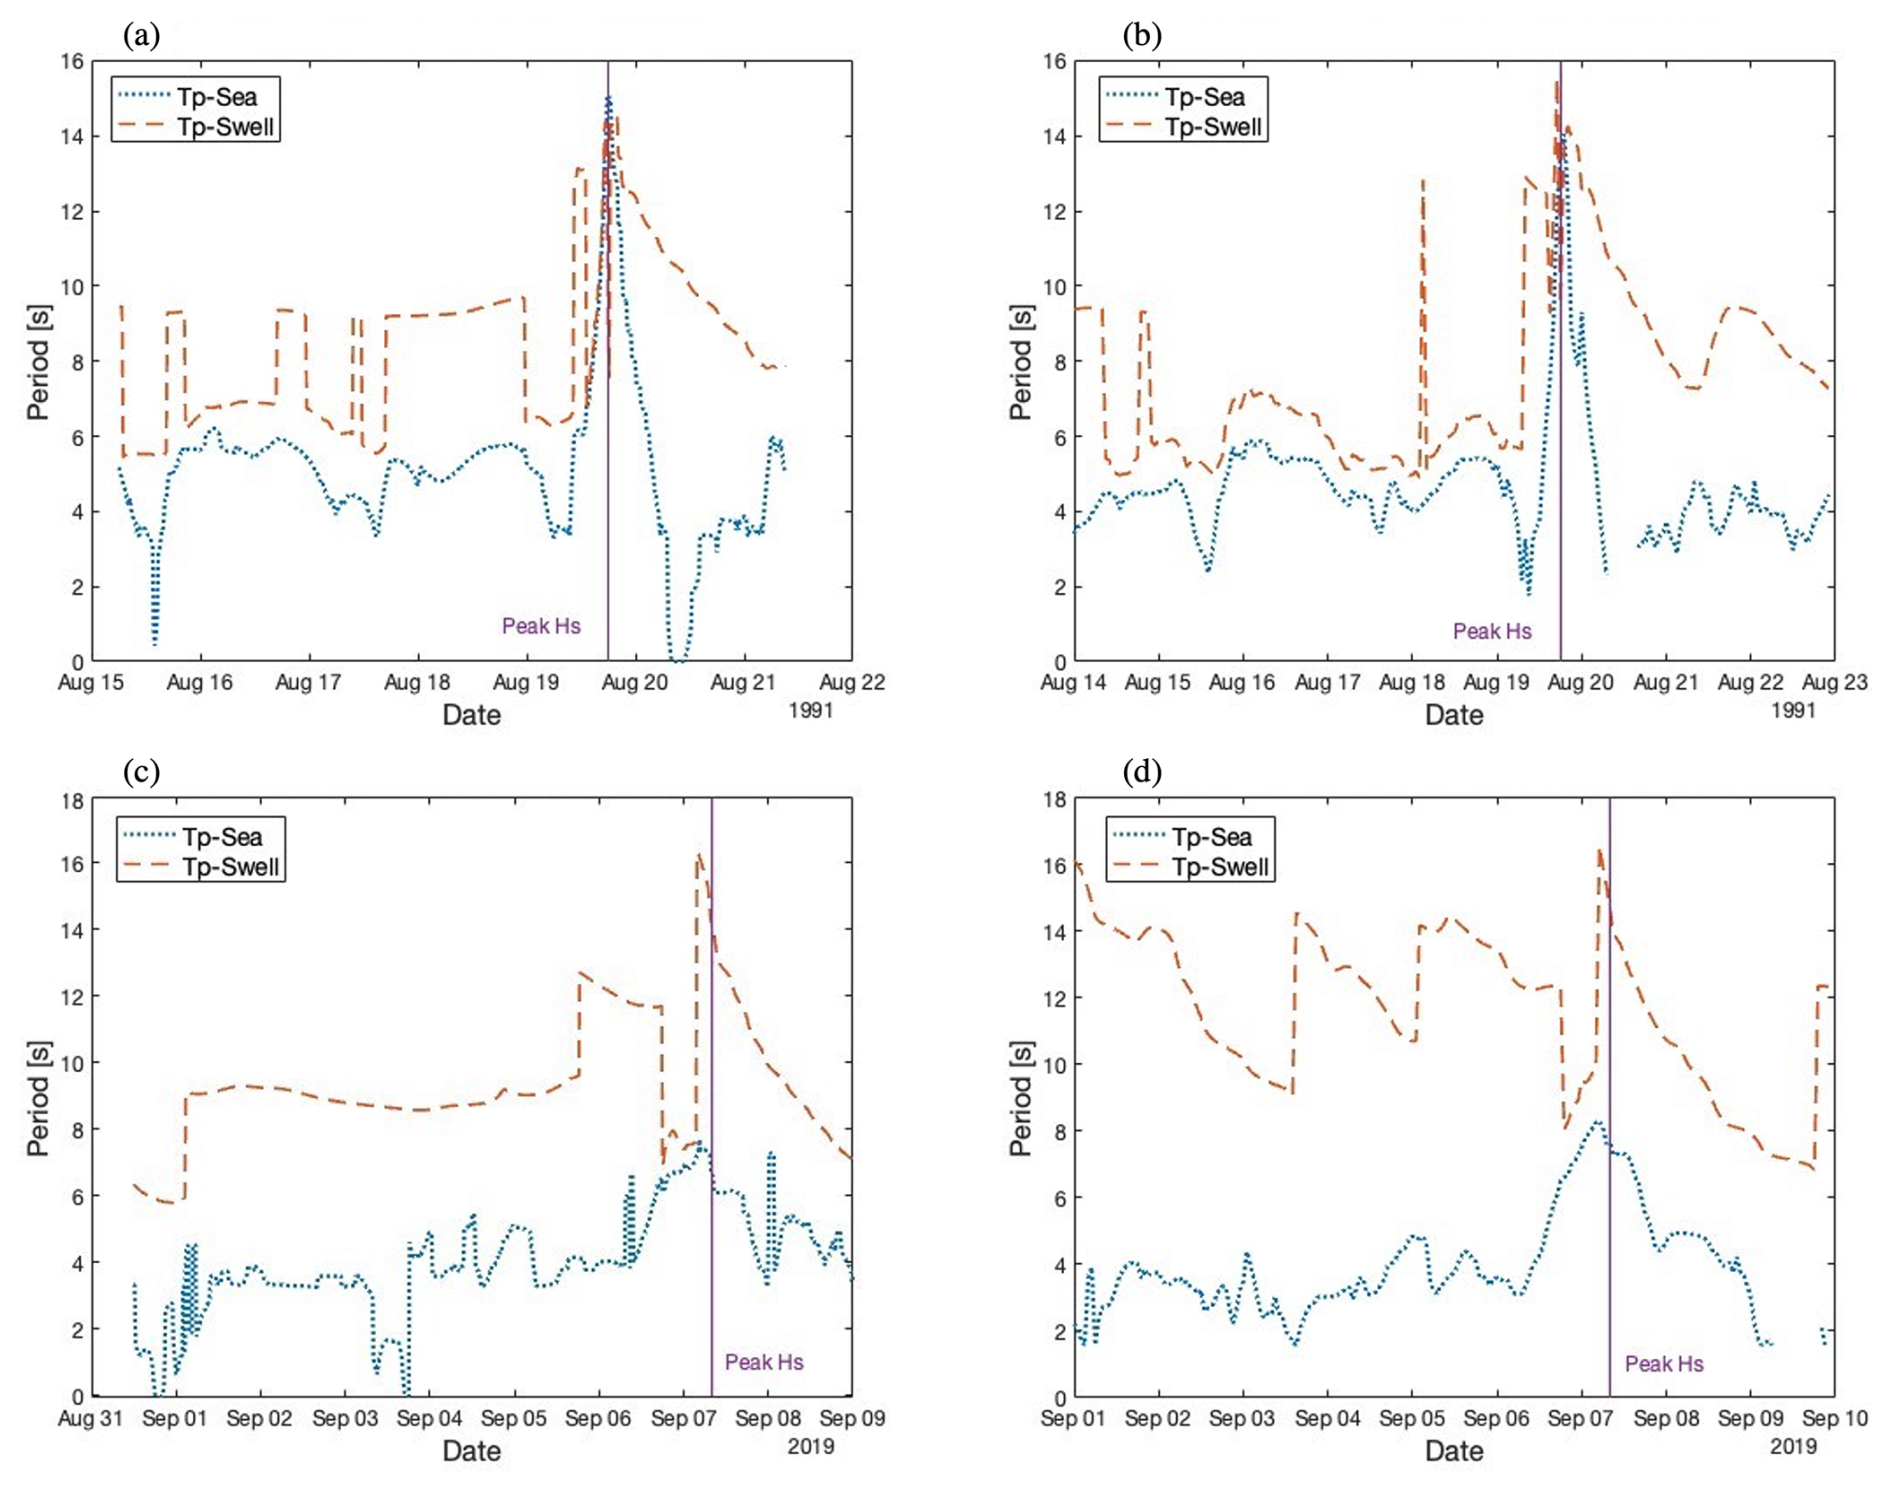
Figure 7Partitioned wave systems during the arrival and passage of two tropical cyclone events by the high-resolution and GF-EC tropical models for the North Atlantic site. (a) “Hurricane Bob”, GF-EC tropical model; (b) “Hurricane Bob”, NA high-resolution model; (c) “Hurricane Dorian”, GF-EC tropical model; (d) “Hurricane Dorian”, NA high-resolution model.
In the case of “Hurricane Dorian”, where the analysis point is outside of the storm fetch, the swell maximum peak period (16 s) and wind-sea maximum peak period in both models arrive prior to the time of peak significant wave height (vertical solid line), representing a slightly different wave growth environment than during “Hurricane Bob”. During and after this time, both models represent “Hurricane Dorian” with similar magnitudes of wind-sea and swell, but there is a notable difference in swell frequencies prior to the storm peak between the two models. Section 3.1.4 investigates this discrepancy further.
3.1.3 Wave systems during storm passage
The representation of the storms in Fig. 6 is also investigated with respect to storm type and forward speed. In the case of “Hurricane Dorian”, the models show global similarities in mean wave direction, but the direction of the largest waves in the NA high-resolution model (36 directional sectors and 32 frequency bins) is less concentrated than for the GF-EC model (48 directional sectors and 26 frequency bins), suggesting the emergence of a separate wave system (Fig. 8c). In Fig. 8a, waves appear to be represented by the GF-EC model in bulk from the south-southeast from the path of the storm (see Fig. 11).
Figure 8Mean wave direction during passage of “Hurricane Dorian” at the North Atlantic site. (a) GF-EC tropical model; (b) NDBC buoy 44097 observations; (c) NA high-resolution model.
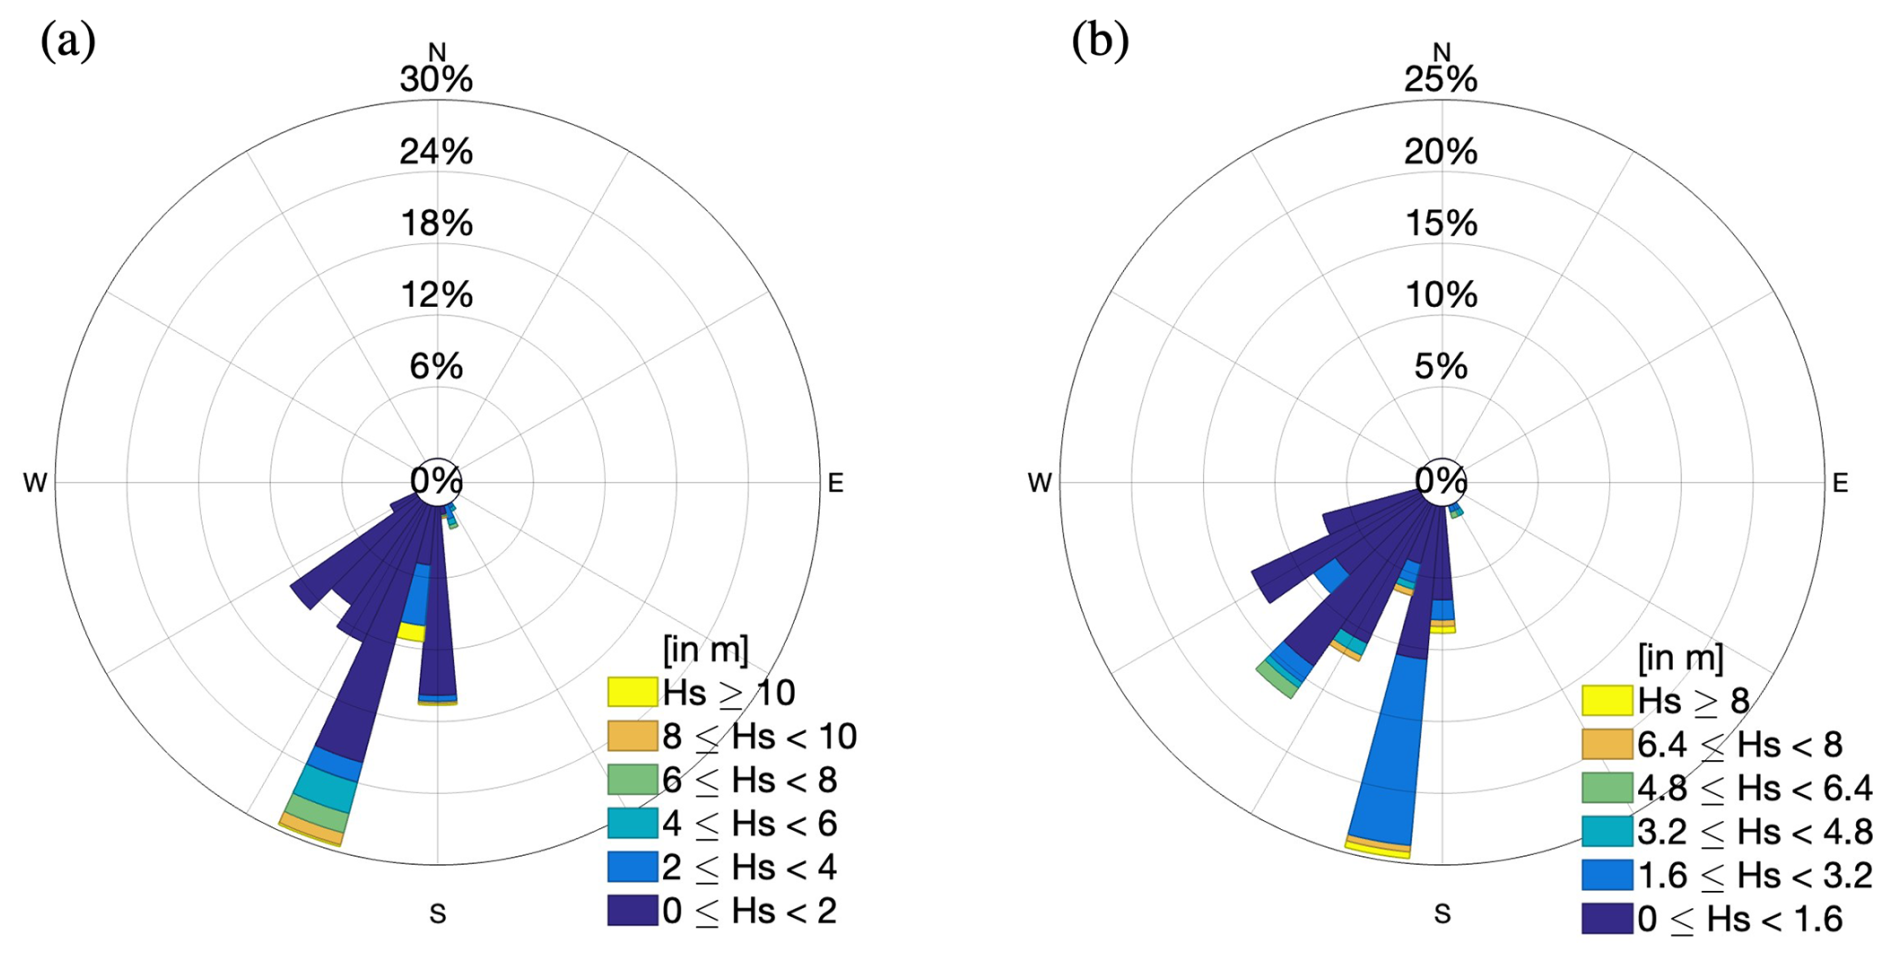
Figure 9Mean wave direction during passage of “Hurricane Bob” at the North Atlantic site. (a) GF-EC tropical model; (b) NA high-resolution model.
In the case of “Hurricane Bob”, both models represent a concentrated range of waves similarly for the average and largest waves (Fig. 9), while the magnitude of the wave height differs. This narrower range is a studied feature of hurricanes (Forristall and Ewans, 1998), especially approaching the eye of the storm. 1 min sustained storm surface winds (90 knots, or 46 m s−1, at a 10 m height) were recorded in this location, and the storm eye passed over the site in 1 h. Given the temporal resolution of the models (the time step of the GF-EC model is 15 min, and the time step of the NA high-resolution model is 1 h), it is likely that the modeled interaction of wind-sea and swell waves over this time is influenced by temporal resolution for this fast, significant event.
In contrast, a large spread of wave directions is observed in both models during the 2015 blizzard (Fig. 10), a feature Forristall and Ewans (1998) attribute to extratropical cyclones. While ocean response to tropical cyclones may result in a variety of wind-sea and swell wave system interactions, there is a generally narrower range of directional spreading within the storm fetch for tropical cyclones than for extratropical cyclones. Particular attention to the radial propagation of waves from wind forcing, with respect to storm type, is important to ensure the proper ocean physics are represented during these events.
Figure 10Mean wave direction during passage of the 2015 blizzard at the North Atlantic site. (a) GF-EC tropical model; (b) NDBC buoy 44097 observations; (c) NA high-resolution model.
3.1.4 Proximity to tropical cyclone eye
The physical evolution of tropical cyclones varies from to storm to storm. The radius of a tropical cyclone can span from 20 to over 250 km, while the radius of an extratropical cyclone can span on the order of 100 to 2000 km. The representation of waves and wave growth due to a tropical cyclone in design values is therefore sensitive to storm track, fetch, and the location of derived site conditions. The two tropical cyclone events investigated in detail here represent a close proximity to the storm path: from IBTRaCS records, the eye of “Hurricane Bob” reached its peak low pressure (950 mb, Category 3) 60 km from the mid-Atlantic analysis point and came within 100 km of the North Atlantic analysis point on 19 August 1991 as a Category 2 storm. The eye of “Hurricane Dorian” also came within 60 km of the mid-Atlantic analysis point as a Category 2 storm and persisted as Category 2 within 260 km of the North Atlantic analysis point.
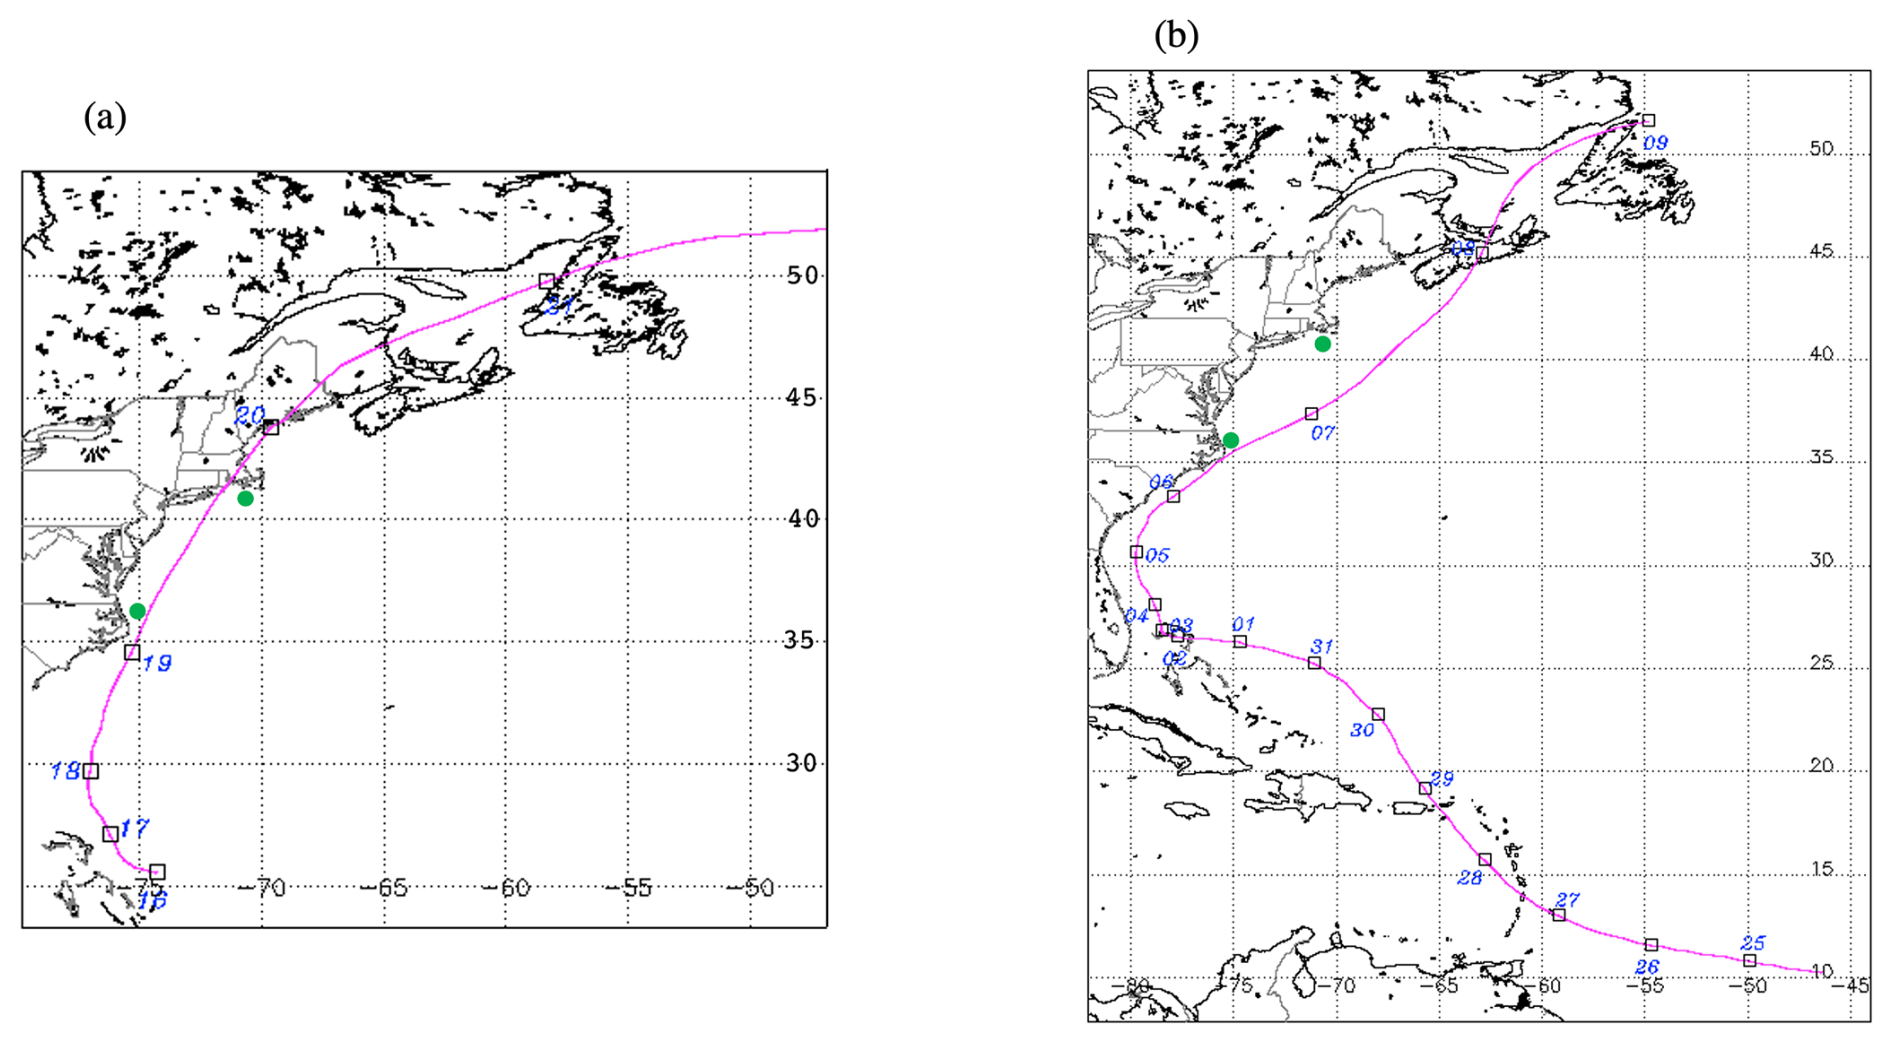
Figure 11Historical best tracks of the studied tropical cyclones from https://ncics.org/ibtracs/ (last access: 10 June 2024). (a) “Hurricane Bob”, 1991; (b) “Hurricane Dorian”, 2019.
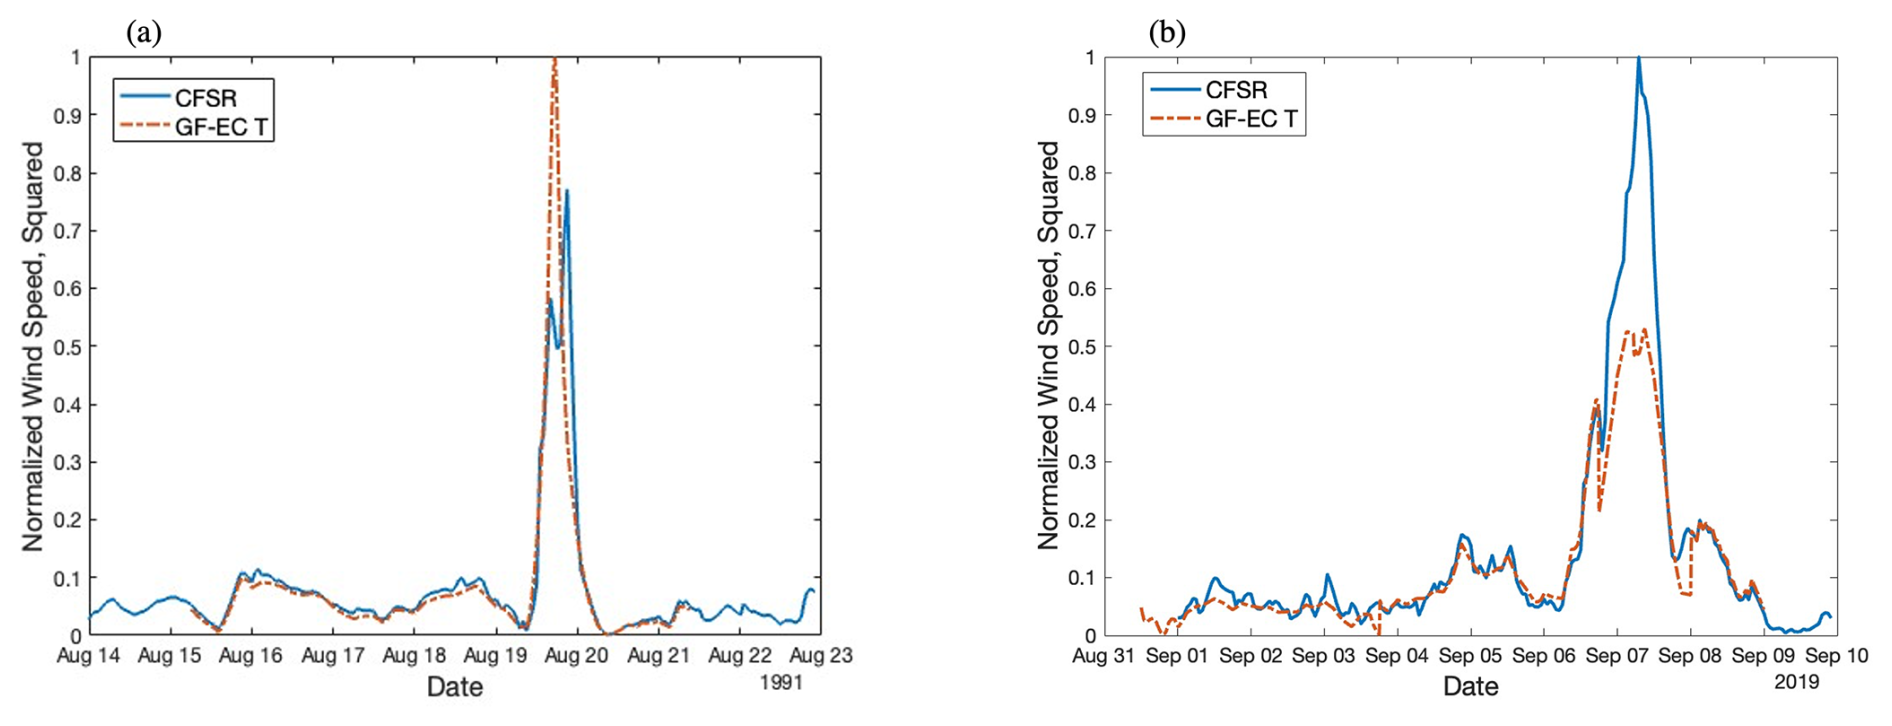
Figure 12Effective normalized wind stress on the ocean surface during two tropical cyclones at the North Atlantic site. GF-EC tropical and NA high-resolution normalized wind, squared, (a) inside the storm radius (fetch) during “Hurricane Bob” and (b) outside of the storm fetch during “Hurricane Dorian”.
Following Hwang and Walsh (2018), who studied tropical cyclone development from satellite observations of multiple events and found similar wave growth features between tropical cyclones and other conditions, differences in wave development between models are considered here to be primarily a function of fetch or duration representation and not model performance. To further quantify the influence of storm fetch on peak significant wave heights, the momentum flux between the atmosphere and the ocean surface is investigated in terms of wind stress (from Jones, 2011):
where ρ is air density and CD is the coefficient of drag. Setting aside constants, effective stress is a function of the square of the wind speed, normalized here to the largest magnitude recorded from either the GF-EC tropical or NA high-resolution models during the event. These quantities are provided for “Hurricane Bob”, which is analyzed inside of the storm radius in Fig. 12a, and for “Hurricane Dorian”, which is analyzed outside of the storm radius in Fig. 12b. The sensitivity to distance is clear, despite both storms persisting as Category 2 at the time and location of analysis: as the stress on the ocean surface is a function of the square of wind velocity (Eq. 4), the height of non-fully developed wind waves generated by tropical cyclones is sensitive to the square of the error in peak modeled wind speed. Underrepresentations of these values, as noted in Campos et al. (2022) and Caires and Sterl (2005), in conjunction with characterization of points solely outside of the storm fetch can lead to the underrepresentation of modeled wave growth and significant wave heights.
Coupling quality (the momentum transfer between winds and waves) and the fidelity of storm representation are also pertinent to accurately model ocean stress. While in the NA high-resolution case, wave height is proportional to wind speed (a 25 % lower wind stress results in a 25 % lower significant wave height during “Hurricane Bob” compared to the GF-EC model), assimilated wave fields of the GF-EC model during “Hurricane Dorian” are only 10 % lower than from the NA high-resolution model, despite a theoretical wind stress that is 48 % lower. This presents an interesting area of further investigation for sufficient coupling strategies for capturing the features of these storms; a coupled wind and ocean model may not be sufficient on its own for adequate representation of hurricane-generated sea states. Additionally, reliance on calibration to correct underrepresentation is not sufficient without careful selection of observations from within and from outside of the tropical cyclone fetch for calibration.
3.2 Influence of statistical choices
In the North Atlantic, where extratropical cyclones are an annual event, the 10-year return value for the high-resolution model shows a characteristic of mixed species analysis: the influence of these events lifts the overall return value over the tropical-cyclone-only values (see the intersection of the “CFSR+MIKE21” and “GF-EC Trop. Full” trend lines after the 10-year mark, Fig. 13a). However, the opposite is observed at longer return periods: the influence of the less intense storm type appears to reduce the overall return value, leading to increasing divergence between the GF-EC tropical model and the NA high-resolution (“CFSR+MIKE21”) trend lines.
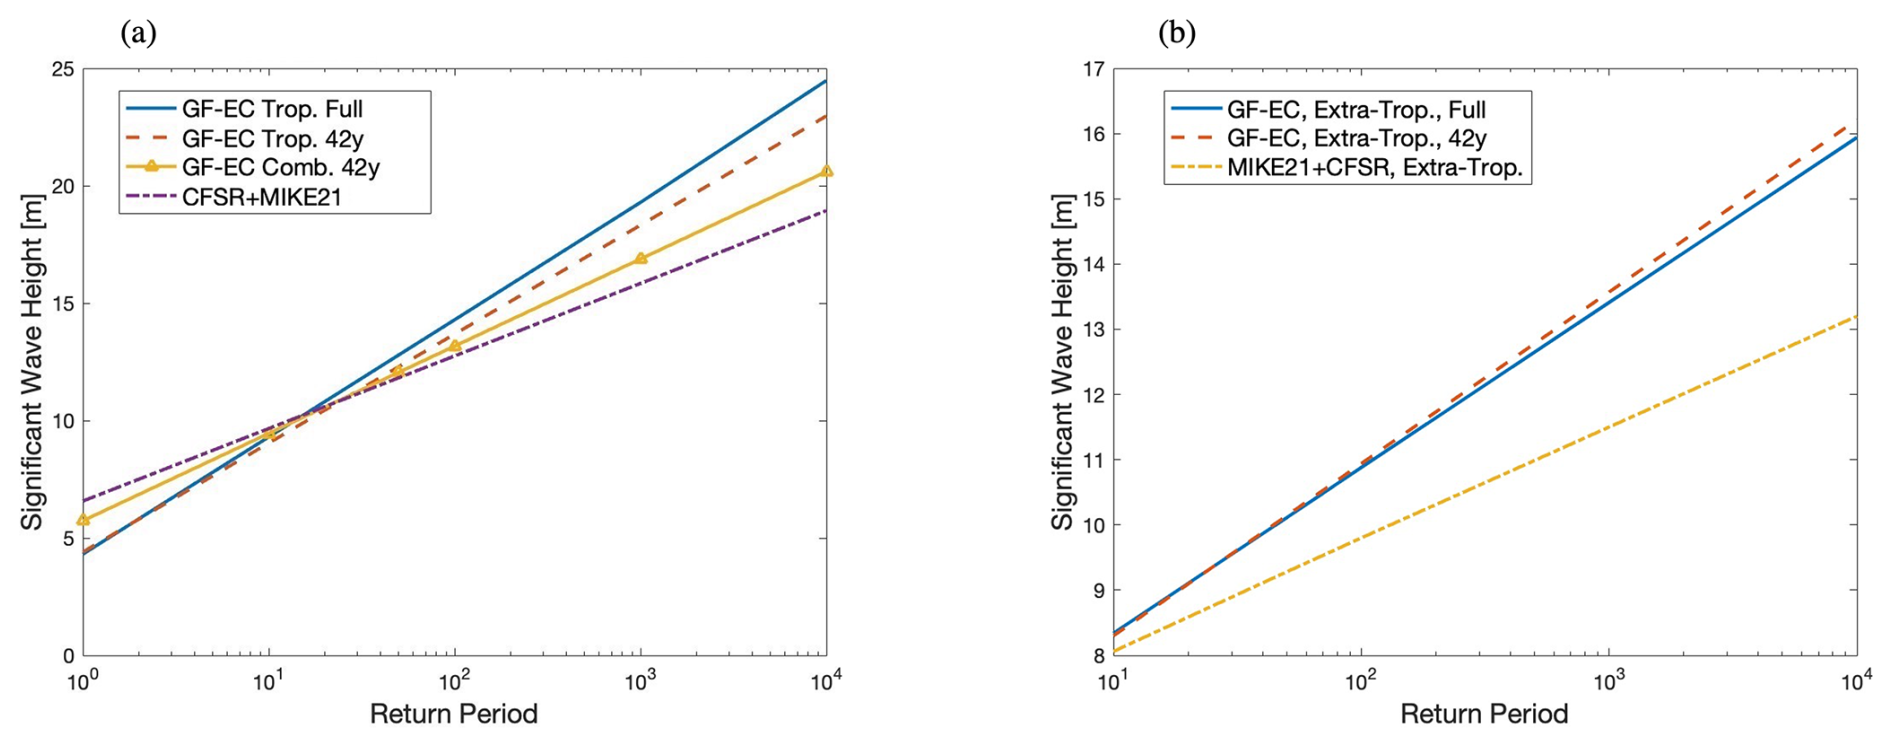
Figure 13Return values for single-storm conditions at the North Atlantic site from the high-resolution and post-processed GF-EC datasets. (a) Tropical-only return values from the GF-EC tropical, high-resolution, and post-processed GF-EC model data; (b) extratropical-only return values from the GF-EC extratropical, high-resolution, and post-processed GF-EC model data.
When assessing return value sensitivity to dataset length or the number of extreme events represented in the data, the GF-EC tropical and extratropical datasets are shortened to 42 years (for the North Atlantic) and 30 years (for the Mid-Atlantic Bight). The 10- to 10 000-year return values are reduced slightly in the North Atlantic case (Fig. 13a) and increased slightly in the mid-Atlantic case (Fig. 14a). In neither scenario does this shortened dataset explain the trend and magnitude differences between the two sets of results. On the contrary, the increase in return values observed in the mid-Atlantic case is influenced by higher-than-average tropical cyclone activity in the 1990s and 2000s and misses the lower-than-average period of Atlantic hurricane activity in the 1970s and 1980s.
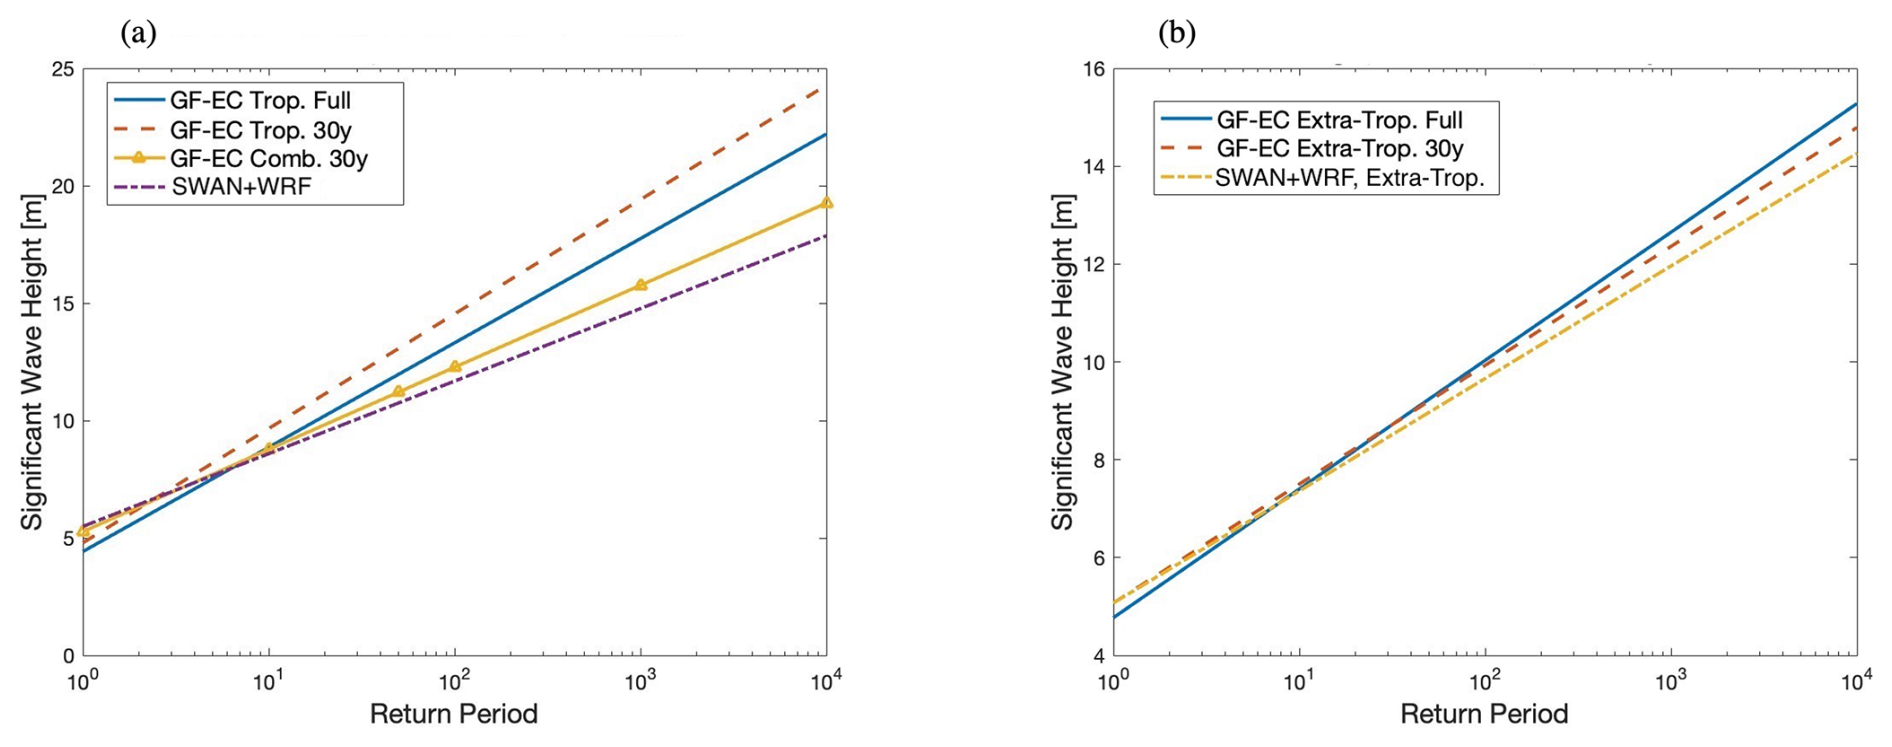
Figure 14Return values for single-storm conditions at the Mid-Atlantic Bight site from the high-resolution and post-processed GF-EC datasets. (a) Tropical-only return values from the GF-EC tropical, high-resolution, and post-processed GF-EC model data; (b) extratropical-only return values from the GF-EC extratropical, high-resolution, and post-processed GF-EC model data.
Similarly, analysis of the post-processed high-resolution data into a single storm type dataset did not mitigate differences between the GF-EC-tropical- and high-resolution-derived return values in Figs. 13a and 14a; in fact, these values are observed in Fig. 5 to be further reduced (red dashed line) from the original high-resolution dataset (blue solid line). In both locations, these lower values suggest that the periods of 1989–2019 (mid-Atlantic) and 1979–2020 (North Atlantic) do not present a sufficient basis for fully characterizing extremes due to tropical cyclones. As previously mentioned, the underrepresentation in the high-resolution model of one of the largest peaks in the dataset, “Hurricane Bob”, also likely contributes to the lower projected return values in the North Atlantic case. To mitigate this effect due to limited dataset duration of the high-resolution models, grid point “pooling” proposed by Heideman and Mitchell (2009) may be appropriate.
This trend is significantly reduced in both locations for extreme values due to extratropical cyclones (Fig. 13b, North Atlantic, and Fig. 14b, mid-Atlantic). The numerical and statistical representation of extratropical extremes by the high-resolution model duration, configuration, and boundary conditions appears to be more adequate in both the North Atlantic and mid-Atlantic cases.
Conducting a single analysis of the multi-species storm dataset (combining the GF-EC tropical and GF-EC extratropical datasets into a single storm distribution) notably deflates return value estimates to similar levels as those derived from the high-resolution datasets (see Fig. 13a, GF-EC “combined” 42-year line with triangle, and Fig. 14a, GF-EC “combined” 30-year line with triangle). The cumulative effect of a reduced storm sample (shortening the GF-EC tropical data from 100 to 42 and 30 years) and single statistical analysis of the mixed species shows a clear influence of storm type and storm sample on wave fields for both regions investigated. From Fig. 5a and b, extreme values calculated from this “combined” dataset are up to 15.9 % lower than the tropical-only case in the North Atlantic and up to 13.2 % lower than the tropical-only case in the mid-Atlantic. These differences occur similarly in both locations, despite differences in tropical storm frequency and peak storm intensities observed in the historical record. Subsequently, the recommendations of IEC 61400-1, Annex J, which specify separated analysis of winds by storm type, should be extended to wave fields for ocean engineering applications.
In this study, the factors influencing extreme significant wave height estimations for design due to tropical cyclones were assessed for the relative influence of model and statistical choices at two locations on the US Atlantic coast. The performances of two high-resolution models with differing calibration methods were assessed alongside reanalyzed ocean wave values, forced by reconstructed storm winds, during a period spanning from 30 to 100 years. Choices leading to the statistical distribution of extreme events with the block maxima method were also investigated.
Overall, return values associated with extratropical events are shown in this study to be well-resolved by established methods of metocean modeling with CFSR- or WRF-generated winds and ERA5 wave boundary conditions compared to observations and as evidenced by similar return values generated from all models investigated. However, the differences in extreme values estimated in this study when only considering tropical cyclones suggest that underrepresentation of peak wave parameters by the high-resolution models cannot be mitigated by calibration alone, due in part to the model temporal resolution of wind-generated waves, model treatment of the momentum flux transfer between coupled wind and waves, and the limited treatment by calibration factors of spatially dependent features within and outside of the fetch of a tropical cyclone. While both high-resolution models, with different wind forcing, model design, boundary conditions, and calibration techniques, captured tropical cyclone peak significant wave heights within 7 % on average for both the NA and MAB high-resolution time series, larger differences were observed for the largest storm waves.
In addition to numerical representation, statistical choices are a major contributing factor to significant wave height return values. Regardless of the storm type driving the largest two to three storms in a dataset, analysis of decades of storms as a combined set of types resulted in an overall reduction of derived return values for periods 10 years and greater in both the North Atlantic and mid-Atlantic locations. Adequate sample size is also necessary (but insufficient alone) to characterize extreme wave heights on the US Atlantic coast due to these storms. The combination of sufficient sample size and analysis by single storm type leads to the notable differences in estimated return values between the datasets presented in this study. One implication of these findings can be investigated for the proper sizing of offshore substation deck height, which is based on the maximum wave crest height: using the North Atlantic “high-resolution” data, the deck is 20 % shorter than that from the GF-EC dataset if following API guidance (based on a 1000-year maximum crest height) and 26 % shorter if following standard DNV-ST-0145 (10 000-year maximum crest height).
For more representative estimation of return values for offshore infrastructure design in areas with tropical cyclone activity, the following is recommended.
-
Analysis of a range of points within and outside of characteristic storm radius at the site.
-
Storm type has a nontrivial effect on estimated significant wave height return values. Extreme value analysis of significant wave height should be carried out on single-storm-type datasets, extending the guidance of IEC 61400-1 Annex J, which is concerned with separated analysis of synthetic storm wind fields.
-
A 30- to 40-year hindcast period is sufficient to characterize extratropical extremes in the North Atlantic and mid-Atlantic locations investigated.
-
A 30- to 40-year hindcast period is not sufficient in the investigated areas to characterize tropical cyclone extremes, even with model calibration to a number of tropical cyclone events. If a longer data period is not available, grid point pooling should be considered.
The sensitivity of return values to the chosen distribution, parameters, and extreme value method employed in this study was investigated for a number of distributions and methods. Return values by block maxima were assessed with both generalized extreme value and Gumbel distributions.
While the generalized extreme value distribution is the most comprehensive distribution for the block maxima method, the Gumbel distribution was chosen for its treatment of the tail of the data, the small or negligent values of shape factor parameter over all investigated datasets, and the goodness of fit as assessed by the Kolmogorov–Smirnov one-sample test (Fig. A1).
The influence of the chosen method was also investigated. Return values are displayed in Fig. A2 for both the NA and MAB high-resolution data with peaks over threshold, fit with a generalized Pareto distribution.
While there are differences between absolute return values between extreme value analysis by POT and by BM (BM Gumbel returned values 3–4 m higher than for POT-GP of the same data at both sites), similar layered trends by dataset are observed, which is the focus of this study. At the 1000-year period (Fig. A2), an interesting and opposite trend is observed between the two sites: in the North Atlantic, values trend lower in a nonlinear fashion, whereas in the mid-Atlantic, they trend higher nonlinearly. Given that there is no significant bias between the two locations toward one method or the other, the block maxima method is considered suitable for this investigation.
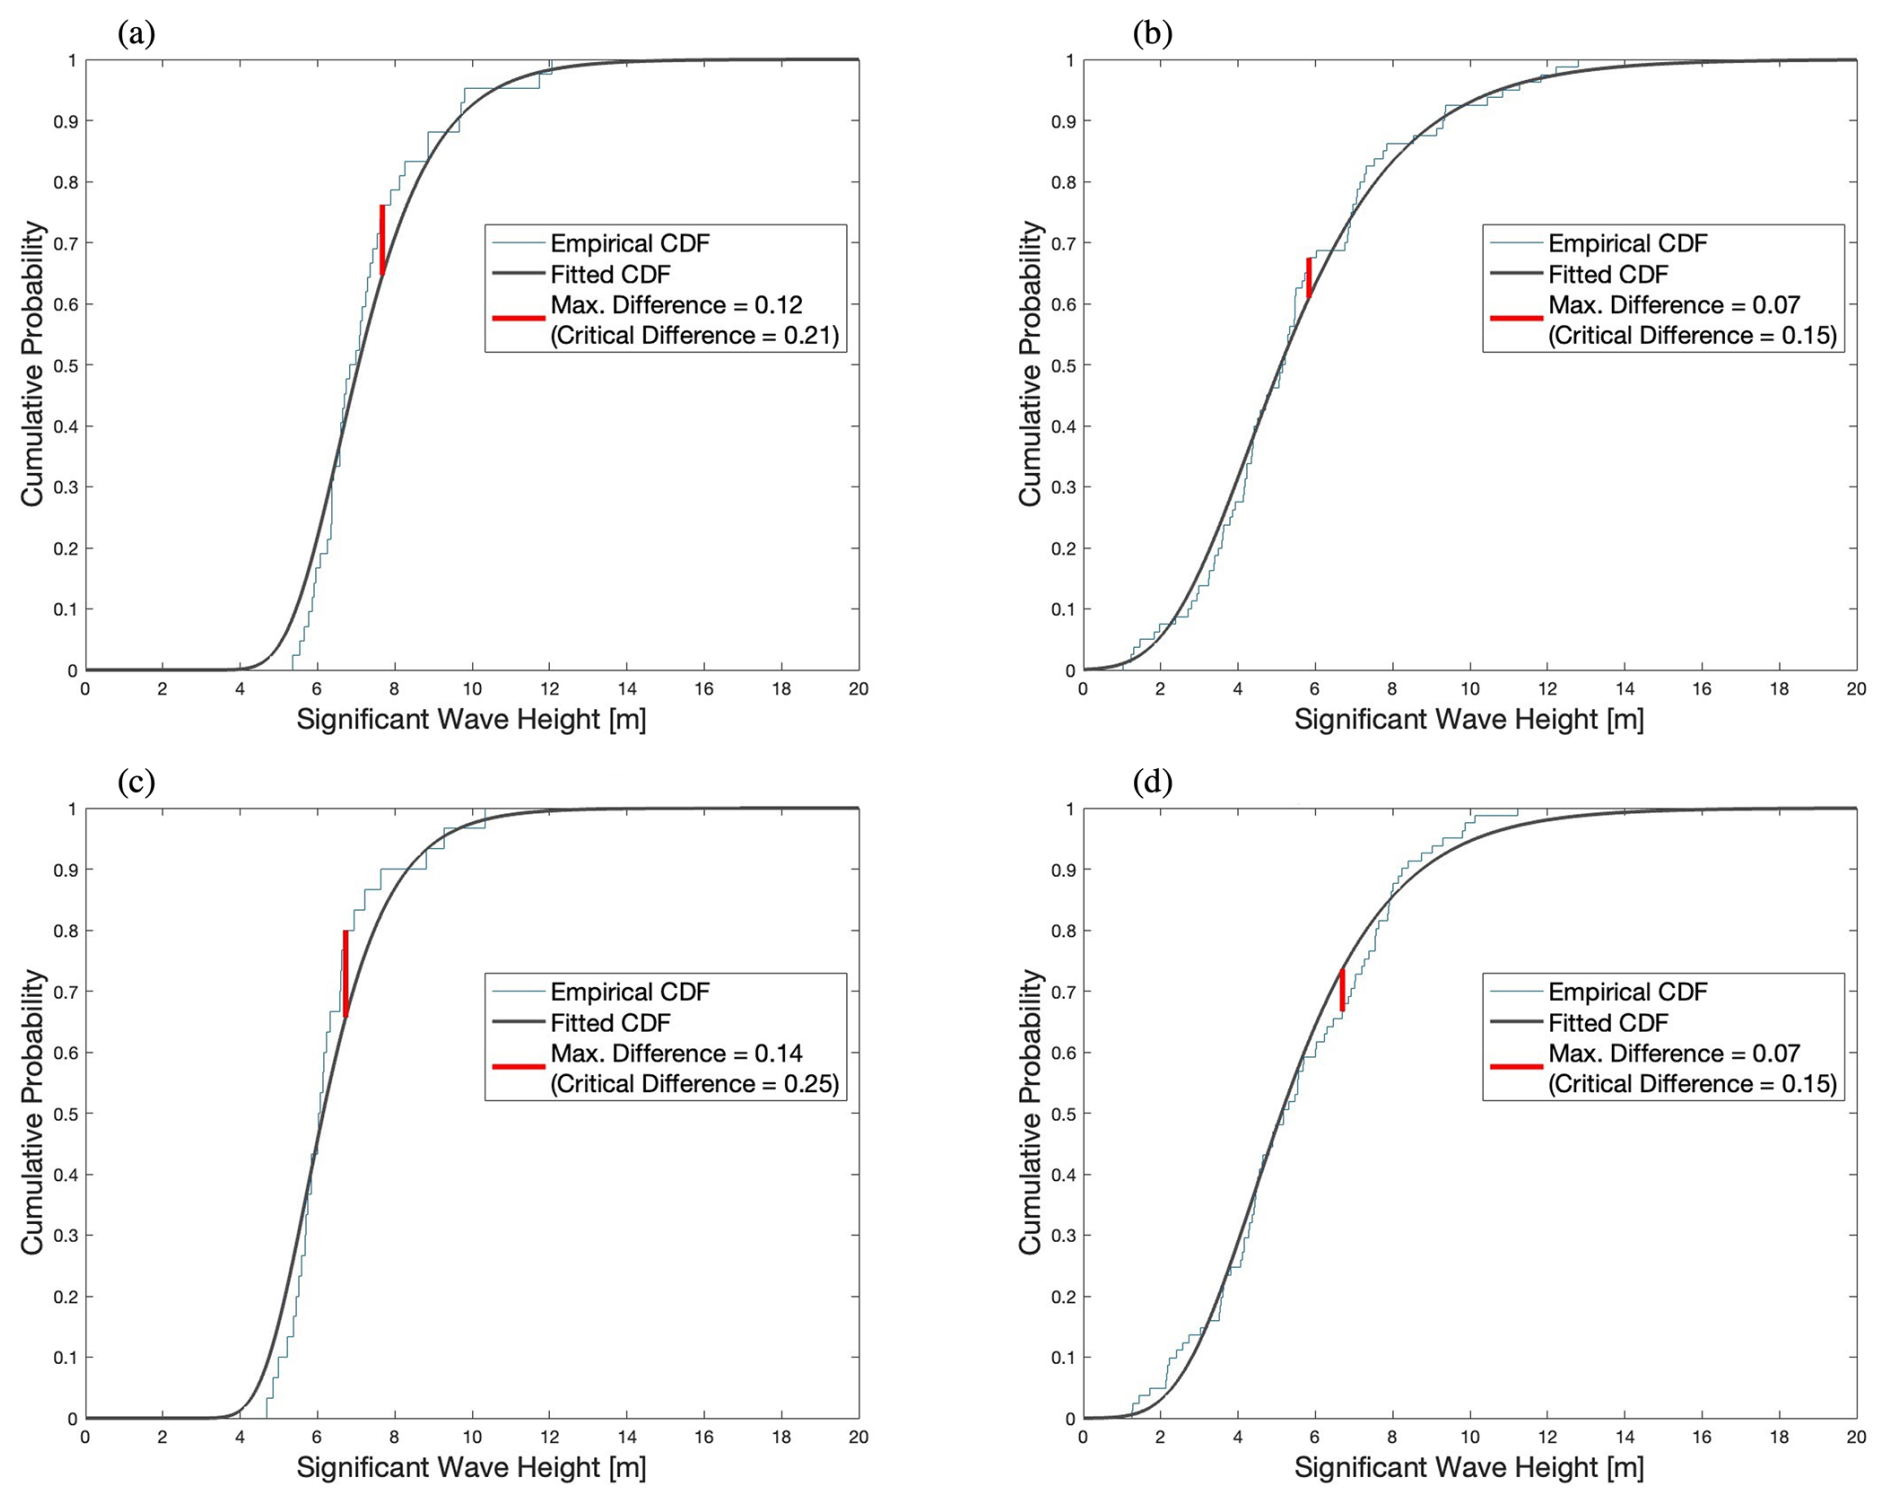
Figure A1Gumbel distribution goodness of fit, Kolmogorov–Smirnov one-sample tests. (a) NA high-resolution model; (b) NA GF-EC model; (c) MAB high-resolution model; (d) MAB GF-EC model.
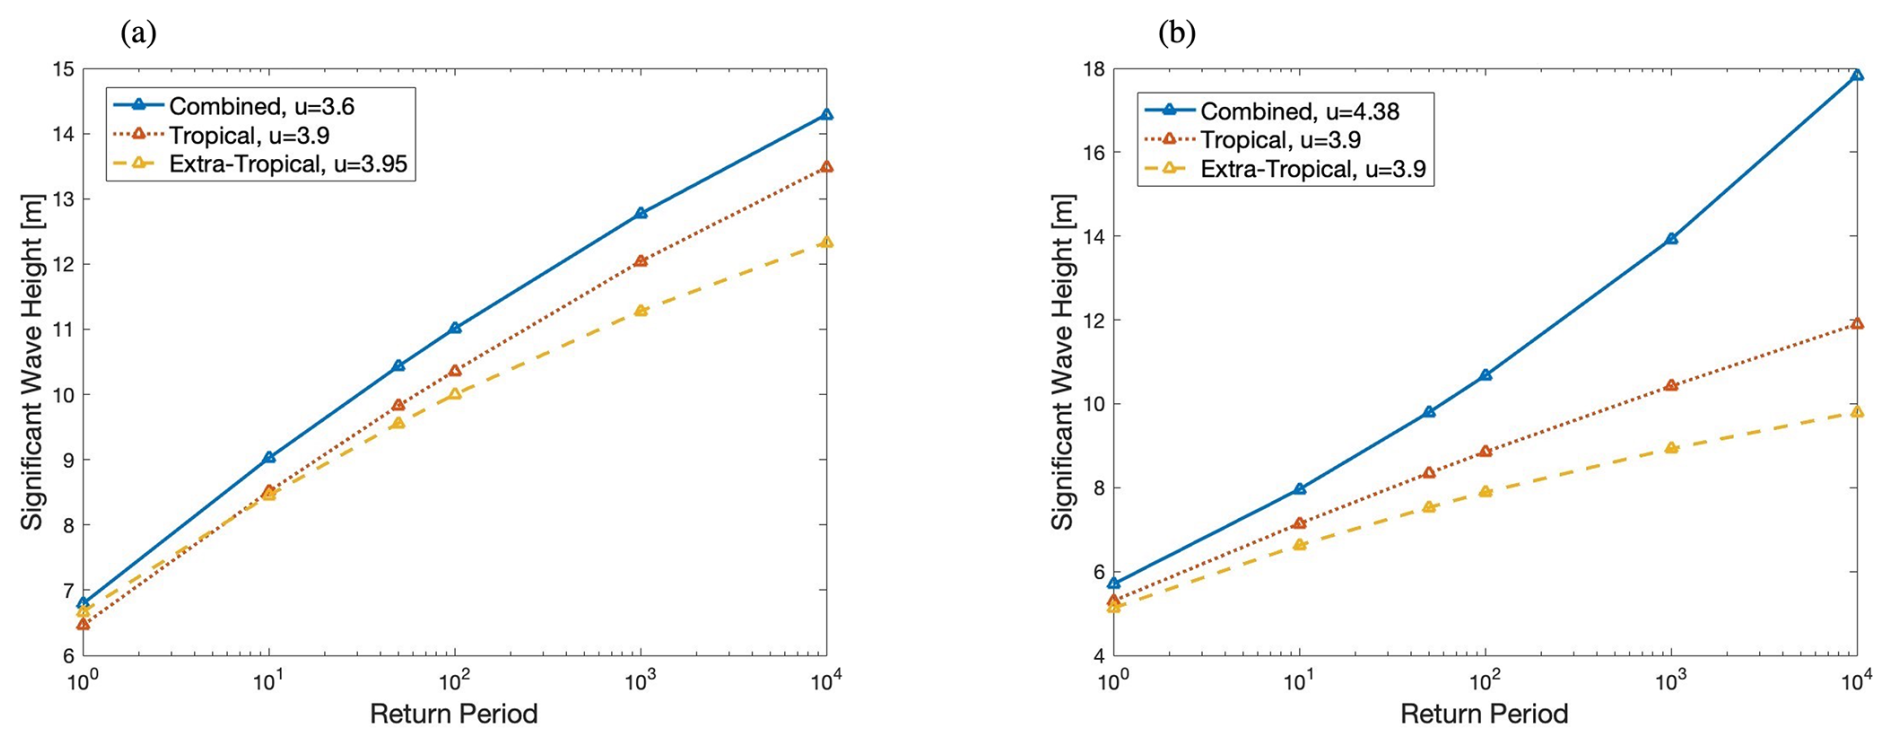
Figure A2Return values by peaks over threshold for the “high-resolution” return estimates with a generalized Pareto distribution and selected thresholds, u. (a) NA high-resolution model and post-processed tropical- and extratropical-only subsets; (b) MAB high-resolution model and post-processed tropical- and extratropical-only subsets.
Table B1Selected return period extreme significant wave heights [m] and associated fit parameters for block maxima (BM) analysis at the North Atlantic (NA) and at the Mid-Atlantic Bight (MAB) locations. Fit parameters of the data with the generalized extreme value distribution are also provided, showing a shape factor, k, near 0.
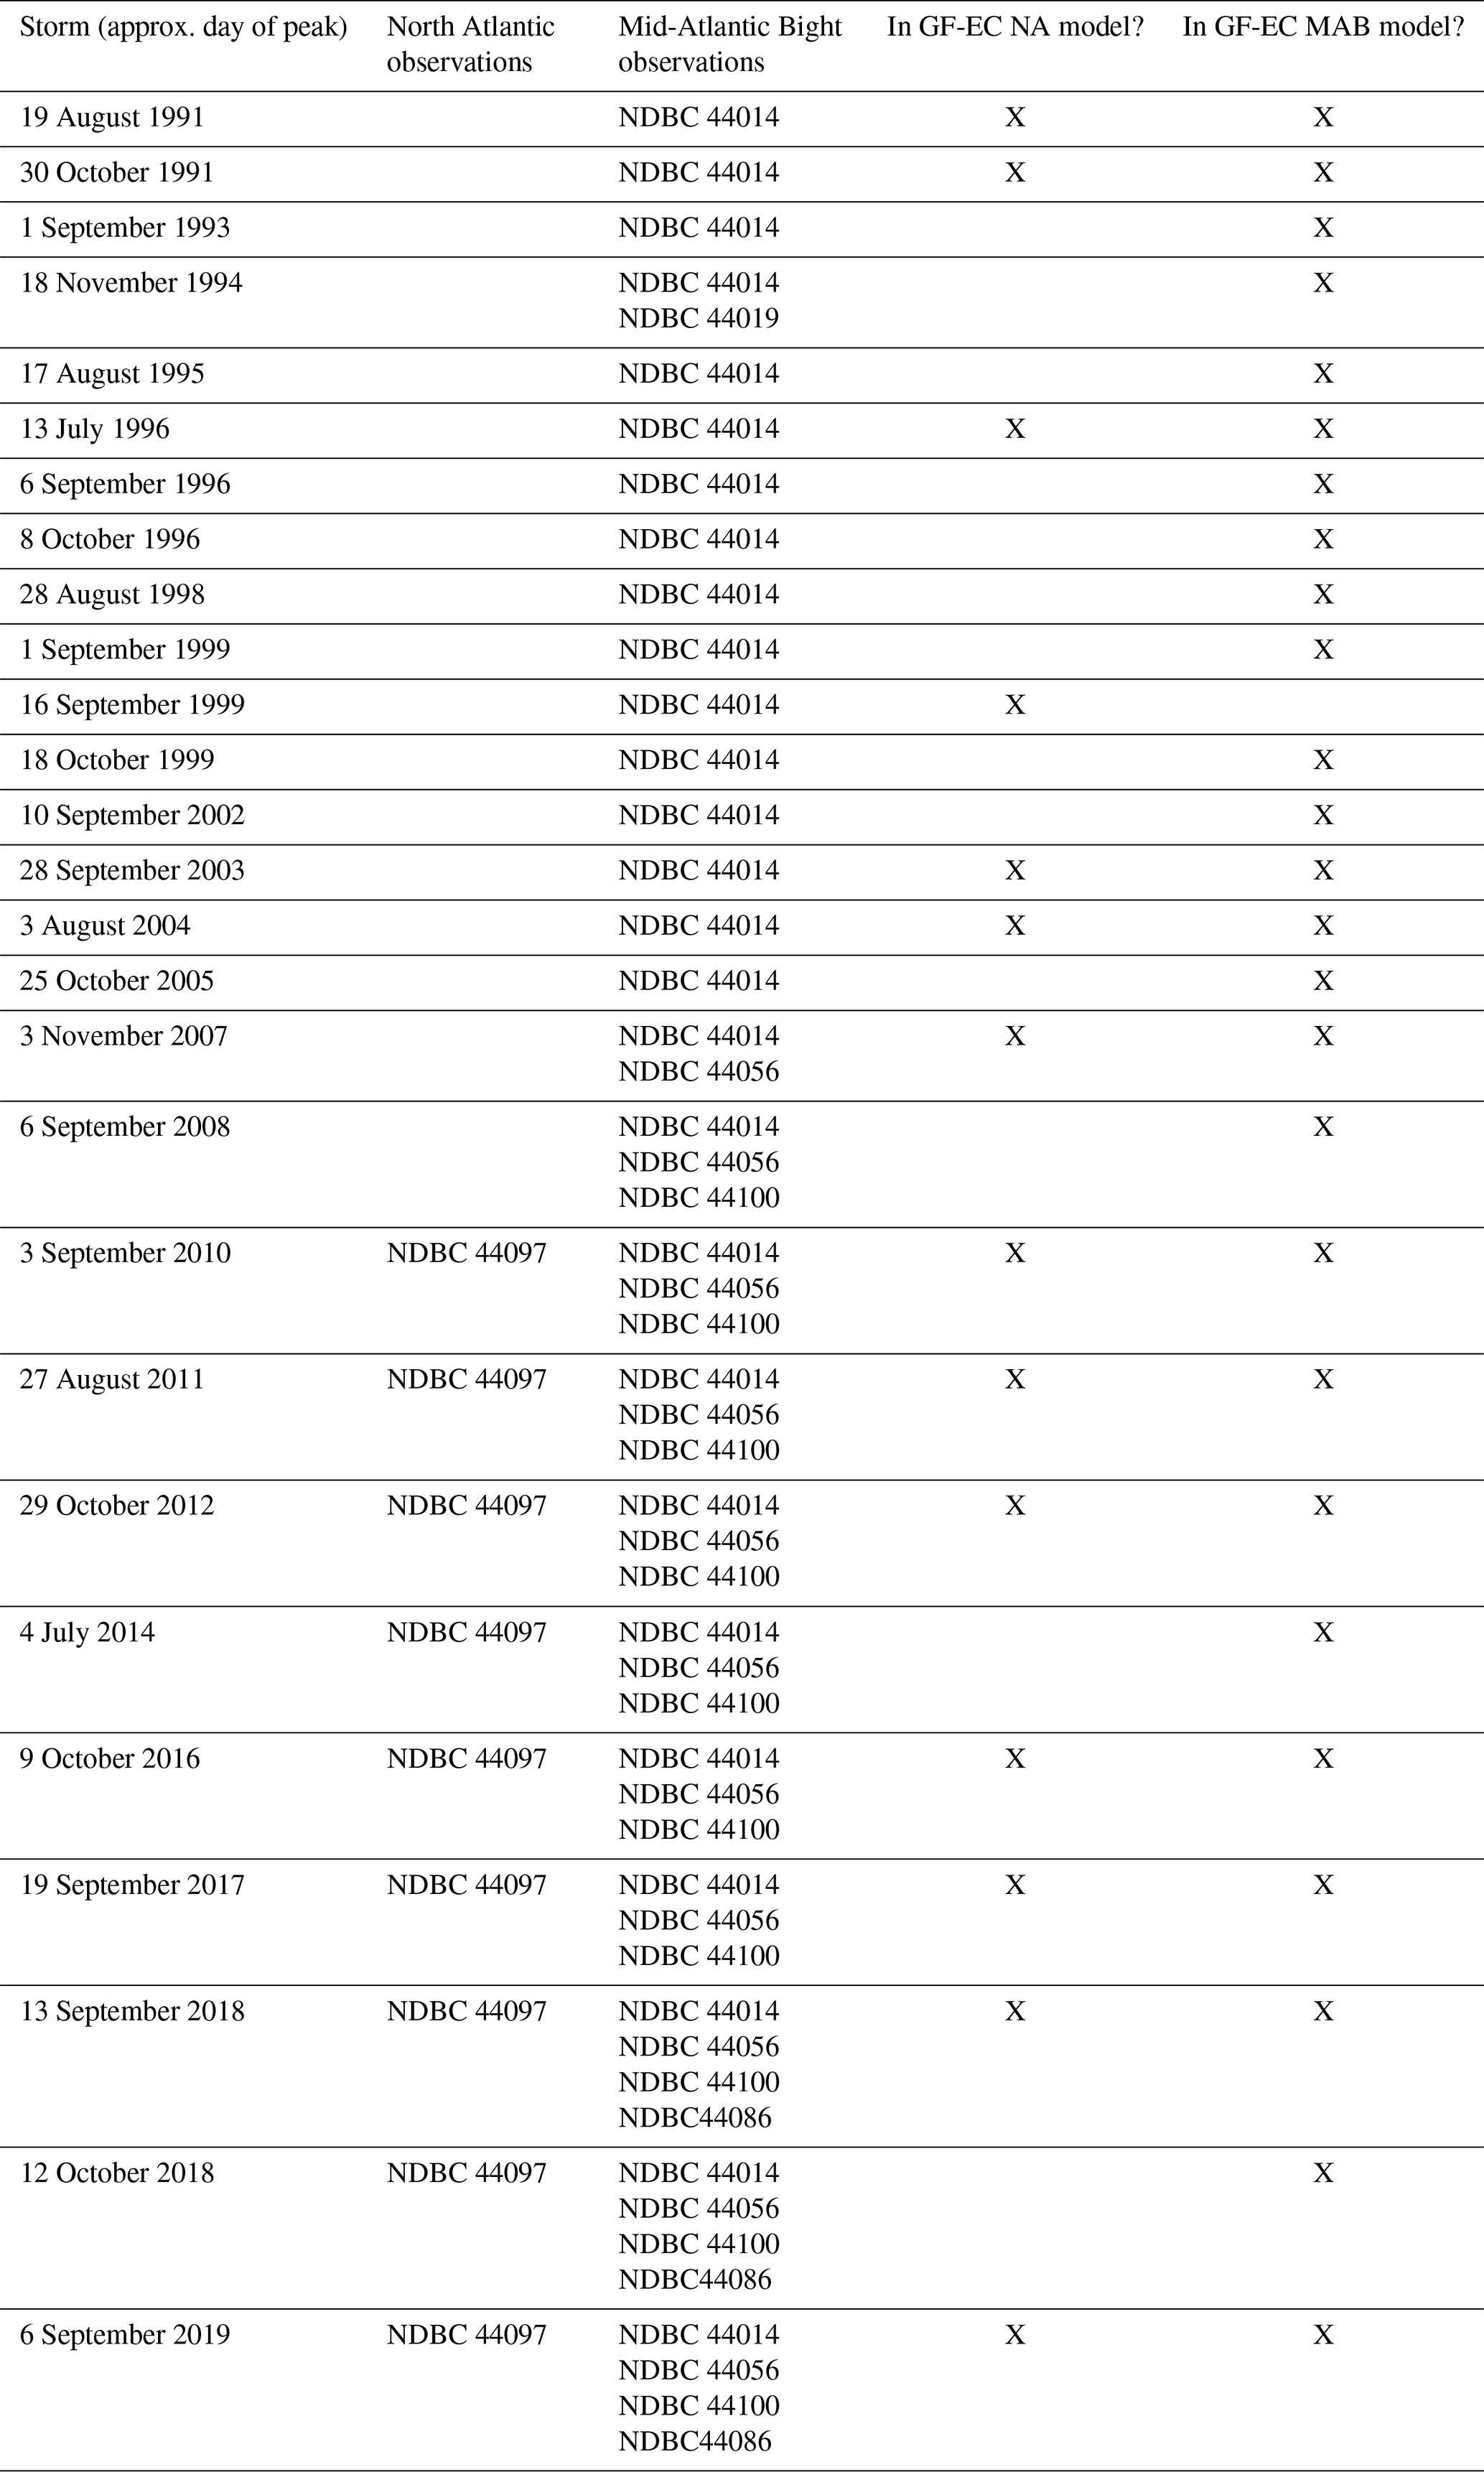
All tropical cyclone events that occurred during the high-resolution forecast and buoy-based observations of these events are provided in Table C3. The largest 16 storms in the 2009–2020 period were used for calibration, four of which were tropical cyclones; there were six tropical cyclones in the North Atlantic during this time period.
The mid-Atlantic model was calibrated against lidar buoy observations of “Hurricane Isaias” in July 2020. The friction coefficient, whitecapping parameterization (Westhuysen or Komen), time step, and wave boundary conditions were adjusted during the calibration process. The boundary condition calibration (ERA5 wave forcing on three boundaries or ERA5 waves on the eastern boundary with open condition on the remaining boundaries) resulted in notable differences in the mean wave direction compared to observations during hurricane passage. This is attributed to improved treatment of wind-driven waves during this event, and ERA5 wave forcing only on the eastern boundary was chosen for the final configuration. Significant wave heights were similar to observations for both boundary condition configurations. The final calibration values are provided in Table C1. Validation statistics are provided in Table C2.
Table C1Calibration values for the MAB “high-resolution” model.
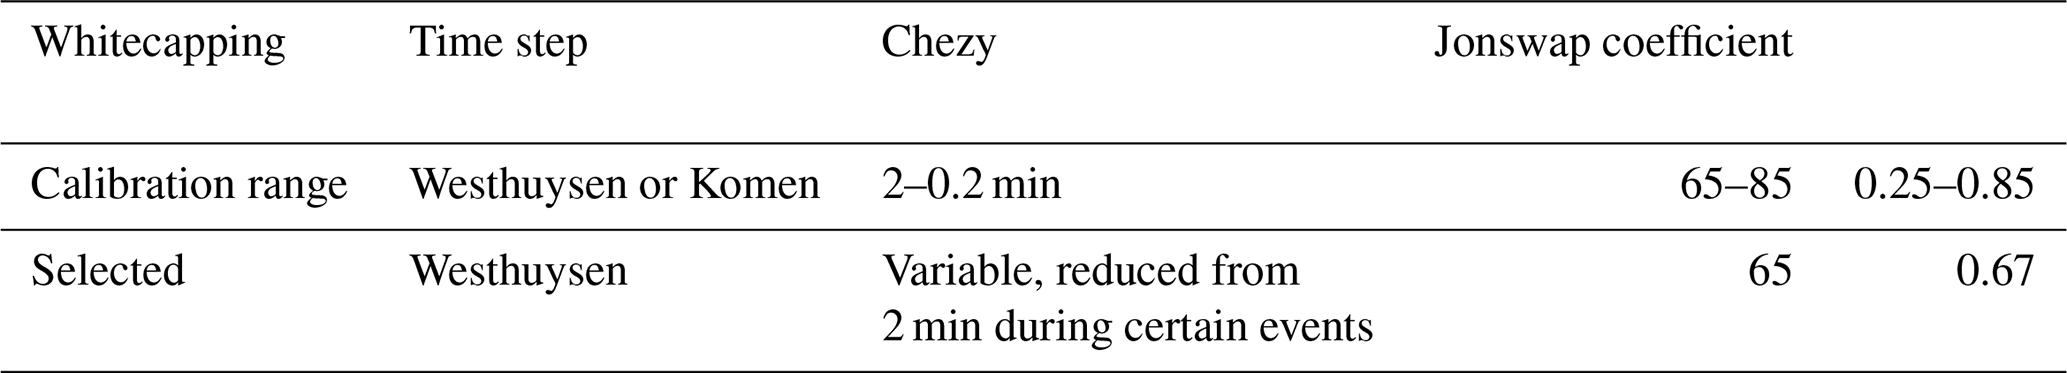
Table C2Validation statistics for the MAB “high-resolution” model.
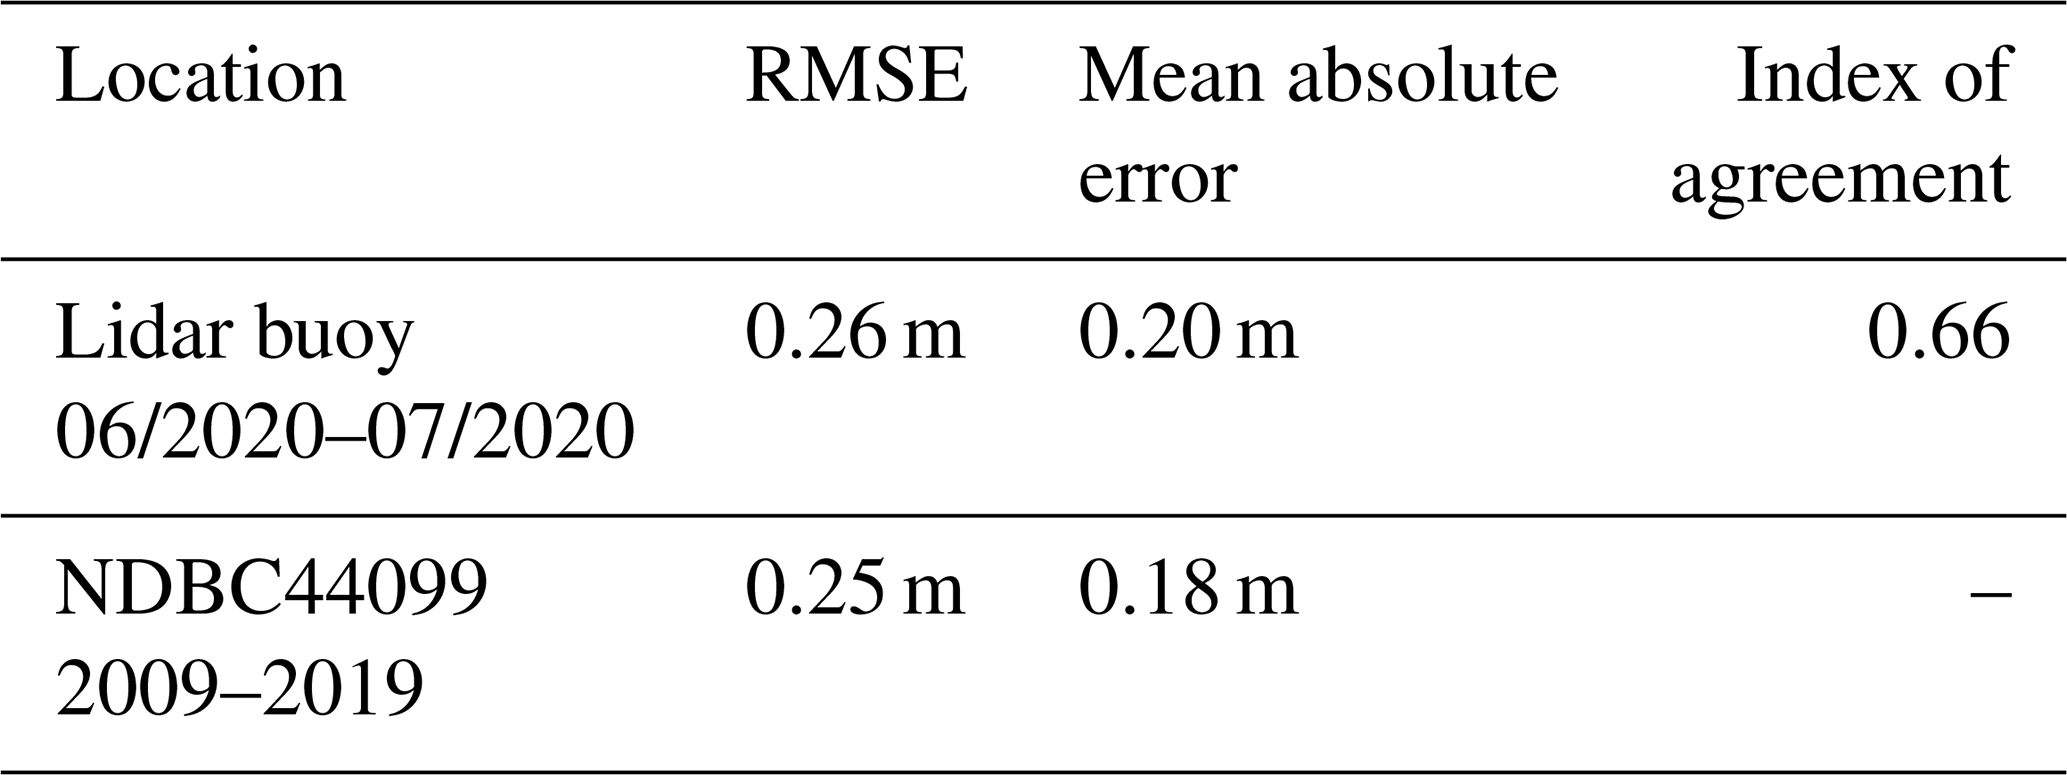
Table C3Available observations of hurricane events in the modeled time period.
Original high-resolution wave model time series at 40.8° N, 70.7° W and 36.2° N, 75.0° W are available at https://doi.org/10.5281/zenodo.13884957 (McElman, 2024). Due to intellectual property protection, the GROW-Fine East Coast model data are not publicly available.
SM contributed data, designed the study methodology, and conducted numerical/statistical analysis. AV and AG contributed to paper review, editing, and guidance.
The contact author has declared that none of the authors has any competing interests.
Publisher’s note: Copernicus Publications remains neutral with regard to jurisdictional claims made in the text, published maps, institutional affiliations, or any other geographical representation in this paper. While Copernicus Publications makes every effort to include appropriate place names, the final responsibility lies with the authors.
This article is part of the special issue “NAWEA/WindTech 2024”. It is a result of the NAWEA/WindTech 2024, New Brunswick, United States, 30 October–1 November 2024.
This work was possible with the valuable insight and perspectives of Louis Bowers, Cyril Frelin, Chan Kwon Jeong, and Gregory Gerbi. The authors would also like to thank the Oceanweather team (Andrew Cox, Erin Harris) for their feedback and for supporting the use of the GROW-Fine model for academic work.
This research has been partially supported by the National Science Foundation (grant no. CBET-2343210).
This paper was edited by Sandrine Aubrun and reviewed by three anonymous referees.
American Petroleum Institute: Derivation of Metocean Design and Operating Conditions, RP 2MET 2nd Edition, https://store.accuristech.com/standards/api-rp-2met?product_id=2091972&srsltid=AfmBOooA2k_Iks9Zm6sCYvkd-F3e_NJizt1sKud6oFHNUW7QElzG1nnB (last access: 24 February 2022), 2021. a
Barthelmie, R. J., Dantuono, K. E., Renner, E. J., Letson, F. L., and Pryor, S. C.: Extreme wind and waves in U.S. east coast offshore wind energy lease areas, Energies, 14, 1053, https://doi.org/10.3390/en14041053, 2021. a
Bhaskaran, S., Verma, A. S., Goupee, A. J., Bhattacharya, S., Nejad, A. R., and Shi, W.: Comparison of Extreme Wind and Waves Using Different Statistical Methods in 40 Offshore Wind Energy Lease Areas Worldwide, Energies, 16, 6935, https://doi.org/10.3390/en16196935, 2023. a
Booij, N., Holthuijsen, L. H., and Ris, R. C.: The `Swan” Wave Model for Shallow Water, Coastal Engineering, https://doi.org/10.1061/9780784402429.053, 1996. a
Brodtkorb, P., Johannesson, P., Lindgren, G., Rychlik, I., Ryden, J., and Sjo, E.: WAFO – A Matlab toolbox for analysis of random waves and loads, Proceedings of the International Offshore and Polar Engineering Conference, 3, Seattle, USA, 343–350, ISBN 1880653494, 2000. a
Caires, S. and Sterl, A.: American Meteorological Society 100-Year Return Value Estimates for Ocean Wind Speed and Significant Wave Height from the ERA-40 Data, J. Climate, 18, 1032–1048, 2005. a, b
Campos, R. M., Gramcianinov, C. B., de Camargo, R., and da Silva Dias, P. L.: Assessment and Calibration of ERA5 Severe Winds in the Atlantic Ocean Using Satellite Data, Remote Sensing, 14, 4918, https://doi.org/10.3390/rs14194918, 2022. a, b
Coles, S.: An Introduction to Statistical Modeling of Extreme Values, Springer-Verlag, London, ISBN 1852334592, 2001. a
DNV: Site extreme wind speeds due to tropical cyclones for wind power plants, DNV Technical Note, https://www.dnv.com/publications/new-technical-note-to-address-wind-farm-design-for-tropical-cyclone-areas-207260/ (last access: 1 August 2024), 2021. a
Dolan, R. and Davis, R. E.: An Intensity Scale for Atlantic Coast Northeast Storms, J. Coastal Res., 8, 840–853, http://www.jstor.org/stable/4298040 (last access: 15 September 2024), 1992. a
Fonseca, R. B., Gonçalves, M., and Guedes Soares, C.: Comparing the Performance of Spectral Wave Models for Coastal Areas, J. Coastal Res., 33, 331–346, https://doi.org/10.2112/JCOASTRES-D-15-00200.1, 2016. a
Forristall, G. Z. and Ewans, K. C.: Worldwide Measurements of Directional Wave Spreading, J. Atmos. Ocean. Tech., 15, 440–469, https://doi.org/10.1175/1520-0426(1998)015<0440:WMODWS>2.0.CO;2, 1998. a, b
Gandoin, R. and Garza, J.: Underestimation of strong wind speeds offshore in ERA5: evidence, discussion and correction, Wind Energ. Sci., 9, 1727–1745, https://doi.org/10.5194/wes-9-1727-2024, 2024. a
Gomes, L. and Vickery, B. J.: Extreme wind speeds in mixed wind climates, J. Wind Eng. Ind. Aerod., 2, 331–344, https://doi.org/10.1016/0167-6105(78)90018-1, 1978. a
Gomez, M. S., Lundquist, J. K., Deskos, G., Arwade, S. R., Myers, A. T., and Hajjar, J. F.: Wind Fields in Category 1–3 Tropical Cyclones Are Not Fully Represented in Wind Turbine Design Standards, J. Geophys. Res.-Atmos., 128, e2023JD039233, https://doi.org/10.1029/2023JD039233, 2023. a
Groll, N. and Weisse, R.: A multi-decadal wind-wave hindcast for the North Sea 1949–2014: coastDat2, Earth Syst. Sci. Data, 9, 955–968, https://doi.org/10.5194/essd-9-955-2017, 2017. a
Group, W.: The WAM Model – A Third Generation Ocean Wave Prediction Model, J. Phys. Oceanogr., 18, 1775–1810, 1988. a
Haselsteiner, A. F. and Thoben, K. D.: Predicting wave heights for marine design by prioritizing extreme events in a global model, Renew. Energ., 156, 1146–1157, https://doi.org/10.1016/j.renene.2020.04.112, 2020. a, b
Heideman, J. C. and Mitchell, D. A.: Grid Point Pooling in Extreme Value Analysis of Hurricane Hindcast Data, J. Waterw. Port, C., 135, 31–37, 2009. a
Hwang, P. A. and Walsh, E. J.: Estimating maximum significant wave height and dominant wave period inside tropical cyclones, Weather Forecast., 33, 955–966, https://doi.org/10.1175/WAF-D-17-0186.1, 2018. a
International Electrochemical Commission: Wind energy generation systems – Part 3-1: Design requiremnts for fixed offshore wind turbines, IEC 61400-3-1, https://webstore.iec.ch/en/publication/29360 (last access: 24 February 2022), 2019. a
Jonathan, P. and Ewans, K.: Statistical modelling of extreme ocean environments for marine design: A review, Ocean Eng., 62, 91–109, https://doi.org/10.1016/j.oceaneng.2013.01.004, 2013. a
Jones, I.: Wind Stress Over the Ocean, Cambridge University Press, Cambridge, ISBN 9780511552076, 2011. a
Kim, E. and Manuel, L.: Simulation of Wind, Waves, and Currents During Hurricane Sandy for Planned Assessment of Offshore Wind Turbines, J. Offshore Mech. Arct., 141, 061904, https://doi.org/10.1115/1.4043777, 2019. a
Kresning, B., Hashemi, M. R., Shirvani, A., and Hashemi, J.: Uncertainty of extreme wind and wave loads for marine renewable energy farms in hurricane-prone regions, Renew. Energ., 220, 119570, https://doi.org/10.1016/j.renene.2023.119570, 2024. a
MacAfee, A. W. and Wong, S. W.: Extreme value analysis of tropical cyclone trapped-fetch waves, J. Appl. Meteorol. Clim., 46, 1501–1522, https://doi.org/10.1175/JAM2555.1, 2007. a
Mackay, E. and Johanning, L.: A generalised equivalent storm model for long-term statistics of ocean waves, Coast. Eng., 140, 411–428, https://doi.org/10.1016/j.coastaleng.2018.06.001, 2018. a
McElman, S.: Wave hindcast data [high-resolution models] at 40.8N, 70.7W and 36.2N, 75.0W, Zenodo [data set], https://doi.org/10.5281/zenodo.13884957, 2024. a
Johnson, H. K. and Kofoed-Hansen, H.: Influence of Bottom Friction on Sea Surface Roughness and Its Impact on Shallow Water Wind Wave Modeling, J. Phys. Oceanogr., 30, 1743–1756, https://doi.org/10.1175/1520-0485(2000)030<1743:IOBFOS>2.0.CO;2, 2000. a
Neary, V. S., Ahn, S., Seng, B. E., Allahdadi, M. N., Wang, T., Yang, Z., and He, R.: Characterization of Extreme Wave Conditions for Wave Energy Converter Design and Project Risk Assessment, Journal of Marine Science and Engineering, 8, 289, https://doi.org/10.3390/JMSE8040289, 2020. a, b
NOAA: Tropical Cyclone Climatology, https://www.nhc.noaa.gov/climo/, last access: 30 January 2025. a
Northrop, P. J., Attalides, N., and Jonathan, P.: Cross-validatory extreme value threshold selection and uncertainty with application to ocean storm severity, https://doi.org/10.1111/rssc.12159, 2017. a
O'Grady, J. G., Stephenson, A. G., and McInnes, K. L.: Gauging mixed climate extreme value distributions in tropical cyclone regions, Sci. Rep., 12, 4626, https://doi.org/10.1038/s41598-022-08382-y, 2022. a
Padilla-Hernández, R., Perrie, W., Toulany, B., and Smith, P. C.: Modeling of two northwest Atlantic storms with third-generation wave models, Weather Forecast., 22, 1229–1242, https://doi.org/10.1175/2007WAF2005104.1, 2007. a
Powell, M. D., Murillo, S., Dodge, P., Uhlhorn, E., Gamache, J., Cardone, V., Cox, A., Otero, S., Carrasco, N., Annane, B., and Fleur, R. S.: Reconstruction of Hurricane Katrina's wind fields for storm surge and wave hindcasting, Ocean Eng., 37, 26–36, https://doi.org/10.1016/j.oceaneng.2009.08.014, 2010. a
Lesser, G. R., Roelvink, J. A., van Kester, J. A. T. M., and Stelling, G. S.: Development and validation of a three-dimensional morphological model, Coast. Eng., 51, 883–915, https://doi.org/10.1016/j.coastaleng.2004.07.014, 2004. a
Simpson, R.: The hurricane disaster–potential scale, Weatherwise, 27, 169–186, https://doi.org/10.1080/00431672.1974.9931702, 1974. a
Stephens, S. A. and Gorman, R. M.: Extreme wave predictions around New Zealand from hindcast data, New Zeal. J. Mar. Fresh., 40, 399–411, https://doi.org/10.1080/00288330.2006.9517431, 2006. a
van der Westhuysen, A. J., Zijlema, M., and Battjes, J. A.: Nonlinear saturation-based whitecapping dissipation in SWAN for deep and shallow water, Coast. Eng., 54, 151–170, https://doi.org/10.1016/j.coastaleng.2006.08.006, 2007. a
Wada, R., Rohmer, J., Krien, Y., and Jonathan, P.: Statistical estimation of spatial wave extremes for tropical cyclones from small data samples: validation of the STM-E approach using long-term synthetic cyclone data for the Caribbean Sea, Nat. Hazards Earth Syst. Sci., 22, 431–444, https://doi.org/10.5194/nhess-22-431-2022, 2022. a
- Abstract
- Introduction
- Methods
- Results and discussion
- Conclusions
- Appendix A: Comparing return values by method
- Appendix B: Tabulated extreme values
- Appendix C: Calibration and tropical cyclone events during the hindcast period
- Data availability
- Author contributions
- Competing interests
- Disclaimer
- Special issue statement
- Acknowledgements
- Financial support
- Review statement
- References