the Creative Commons Attribution 4.0 License.
the Creative Commons Attribution 4.0 License.
 | 20 Aug 2025
How does turbulence affect wake development in floating wind turbines? Some insights from comparative large-eddy simulations and wind tunnel experiments
Leonardo Pagamonci
Gabriel Cojocaru
Marco Belloli
Alessandro Bianchini
Research is flourishing on how to model, mitigate, or even try to exploit the complex motions floating offshore wind turbines (FOWTs) are subjected to due to the combined loading from wind, waves, currents, and buoyancy effects. While preliminary studies made use of simplified inflows to focus attention on blade–flow interaction, recent evidence suggests that the impact of realistic inflows can be much larger than expected. The present study presents a critical analysis aimed at quantifying to what extent turbulence characteristics affect the wake structures of a floating turbine undergoing large motions. Numerical computational fluid dynamics (CFD) simulations, using a large-eddy simulation (LES) approach coupled with an actuator line method for the rotor, are benchmarked against wind tunnel experimental data from the first campaign of the NETTUNO project on a scaled rotor that was tested both in static conditions and when oscillating in pitch. A comparative analysis of the results at different turbulence levels first confirmed that, whenever idealized flows with no significant turbulence are considered, platform motion in FOWTs indeed leads to the creation of induced flow structures in the wake that dominate its development and the vortex breakdown in comparison to bottom-fixed cases. More interestingly, analyses show, on the other hand, that whenever realistic turbulence comes into play, only small gains in terms of wake recovery are noticed in FOWTs in comparison to bottom-fixed turbines, suggesting the absence of superposition effects between inflow and platform motion, with inflow turbulence contributing significantly to dissipating the structures induced by turbine oscillation. Finally, as an ancillary outcome of the study, evidence provided by LES high-fidelity simulations was used to understand to what extent a less computationally intensive unsteady Reynolds-averaged Navier–Stokes (URANS) approach can be used to study the impact of realistic turbulence. In particular, an innovative URANS approach featuring improved inflow boundary conditions proved to yield consistent results when mean wake profiles were considered.
- Article
(24383 KB) - Full-text XML
- BibTeX
- EndNote


Floating offshore wind turbines (FOWTs) are seen as an enabling technology to boost wind energy production worldwide (Musial et al., 2020) as they will allow the exploitation of windy sites offshore, even if they are characterized by significant water depths. While industry has started developing the first large-scale floating wind farms, technical solutions for such projects are inevitably conservative as they are still mostly adapted from bottom-fixed case studies. On the other hand, the research community is working in parallel to progress in technology and develop more advanced solutions for a massive but sustainable deployment in years to come (Veers et al., 2022). Challenges posed by FOWTs are indeed many at all system levels (Veers et al., 2022). Due to their deployment in open sea and the unprecedented dimensions of modern rotors, these turbines will have to face metocean conditions that can be extremely variable and include extreme events (McCann, 2016); moreover, blades can now exceed the atmospheric boundary layer, facing inflow conditions in terms of wind intensity and turbulence that have never been encountered by wind turbines to date (Veers et al., 2019). More significantly, installing a wind turbine on a floating platform means that the system is now subject to a combination of loads coming not only from wind, but also from waves and currents (Chen et al., 2020). Floating wind dynamics are highly coupled, depending on aero/hydro loading, controls, and substructure and mooring design, with a compliant support structure, meaning that aerodynamic forces impact hydrodynamic loading and vice versa, and each control maneuver that induces changes in aerodynamic loads necessarily also affects the global dynamics of the system (Larsen and Hanson, 2007; Vanelli et al., 2022).
Among the implications of the fully coupled, aero-hydro-servo-elastic response of FOWTs, an aspect that is receiving special attention is the potential impact on turbine wakes. On the one hand, studies are being carried out to understand to what extent blade performance can be affected by an interaction with their own wake in the case of massive turbine displacements (Ramos-García et al., 2022); similar events have been demonstrated to be possible, although probably not as frequently as originally supposed (Papi et al., 2024). On the other hand, it is apparent from many studies that platform motion may indeed affect wake meandering mechanisms (Fontanella et al., 2022; Kleine et al., 2022; Messmer et al., 2024a). This evidence has even prompted some researchers to speculate on how such motions could be turned into potential advantages, such as further increasing the wake mixing and thus delivering a more energized flow to the downstream turbines in the farm. Advanced control strategies, like helix and pulse mixing, have been proposed for the scope and have been numerically investigated for both fixed (Frederik et al., 2020) and floating conditions (van den Berg et al., 2022, 2023).
Overall, it is apparent that the study of FOWTs' wakes is still an open question from many perspectives, with the lack of any experimental validation at a large scale still representing an obstacle to a more complete understanding (Xu et al., 2024). In response to this limitation, the scientific community is investing efforts in empowering research programs that are able to provide experiments at wind tunnel scale to validate and tune numerical models (Wang et al., 2021). Among such programs, in Task 30 from the International Energy Agency (OC6 project; IEA Wind, 2022), significant research has been devoted to investigating aerodynamic models (ranging from state-of-the-art blade element momentum (BEM) codes to computational fluid dynamics (CFD)) and evaluating their ability to reproduce the aerodynamics of FOWTs (Bergua et al., 2023; Cioni et al., 2023). The OC6 project made use of the experiments carried out in the wind tunnel of Politecnico di Milano (Fontanella et al., 2021), in which a scaled turbine has been mounted on a 6 degrees of freedom (6 DOFs) robot and subjected to floating-like pitch and surge motions at different frequencies. While good agreement between the project's participants (and the different levels of fidelity) was found when predicting rotor loads and near-wake characteristics (Bergua et al., 2023), more uncertainty was noted in the middle and far wake (Cioni et al., 2023), with a larger spread between simulations and a large gap from experiments. Among the hypothesized reasons for such discrepancies, the simplified modeling of inflow turbulence is seen as one of the most critical. Indeed, most CFD-based models feature very low turbulence at the rotor plane, while the ones based on lifting-line free vortex wake methods neglect these effects completely (Cioni et al., 2023). While this choice is reasonable from the perspective of a fair comparison between all codes, suggestions are being made about the fact that turbulence may in fact change some of the phenomena described so far in numerical studies. For example, Xu et al. (2024) studied the impact of a realistic atmospheric flow on an FOWT, showing that power and thrust had greater instability compared to uniform inflow and shear inflows. Moreover, the atmospheric inflow induced wake breakdown and wake meandering, resulting in a faster wake recovery. Properly accounting for turbulence is particularly relevant to those using unsteady Reynolds-averaged Navier–Stokes (URANS) CFD (e.g., Fang et al., 2020; Arabgolarcheh et al., 2022), in which Reynolds decomposition leads to instantaneous quantities being decomposed into their time-averaged and fluctuating quantities. The fluctuating velocity field is replaced with a Reynolds stress term, treating the effect of turbulence basically as an additional viscosity. In this regard, properly setting turbulence parameters, like turbulent kinetic energy and dissipation rate, is critical, as they decay fast along the domain for numerical reasons. Only recently have higher-fidelity tools been applied to FOWT wake analysis, with near and far wakes of floating systems being solved with an actuator line method (ALM) combined with LES for the solution of the flow field (Combette, 2023; Fang et al., 2020; Firpo et al., 2024; Yu et al., 2023), although the investigation of the effects of turbulent inflows still remains an open issue. In addition, recent experiments have underlined the influence of turbulence on FOWT wakes. Messmer et al. (2024a) performed wind tunnel experiments on a small-scale rotor model and noted improved mixing and wake recovery downstream of the moving rotor in laminar conditions. When subject to varying levels of inflow turbulence, however, the effects of rotor motion appear to be greatly diminished (Messmer et al., 2024b).
Moving from this background, the present study aims to contribute to the understanding of FOWT wake development, particularly regarding how rotor motion interacts with inflow turbulence. To this end, high-fidelity CFD simulations are used. The computational approach is based on a large-eddy simulation (LES) for the flow field, while the turbine is modeled with an actuator line model. Simulations are validated with a new set of experiments, carried out again in the wind tunnel of Politecnico di Milano within the framework of the NETTUNO research project (Understanding turbine–wake interaction in floating wind farms through experiments and multi-fidelity simulations) (NETTUNO, 2023). The turbulence spectrum used in simulations closely reproduces the one measured in experiments. Turbulent simulations are compared to idealized ones with laminar inflow to point out how the macrostructures in the wake of an FOWT (both still and in pitch motion) are affected by turbulence. As an ancillary outcome of the study, analyses are provided to quantify to what extent less computationally expensive wake solution methods, such as unsteady Reynolds-averaged Navier–Stokes (URANS) methods (currently more affordable at an industrial level than LES), can be used to reliably study the problem of FOWT wakes. To this end, two URANS setups are compared; in the first, which actually represents the standard approach to URANS simulations, inlet turbulence is modeled by imposing appropriate boundary conditions on turbulence parameters (namely turbulence intensity and length scale), while in the second, inflow turbulence is modeled similarly to higher-fidelity methods, i.e., by imposing free-stream velocity fluctuations along the boundary.
The work is structured as follows. The case study of the NETTUNO project is first introduced (Sect. 2). A complete description of the numerical setup, including the domain, the mesh, and the numerical setup necessary to achieve satisfactory accuracy of the results, is then provided (Sect. 3). The results (Sect. 4) first present a phenomenological description of the effects of turbulence on FOWTs, comparing the results from LES simulations and experiments, and then analyze the modifications in the main macrostructures of the wake. Then, results from the URANS approaches are compared with the LES results, assessing the capabilities of both for similar studies. Finally, Sect. 5 presents some conclusions and provides directions for future developments.
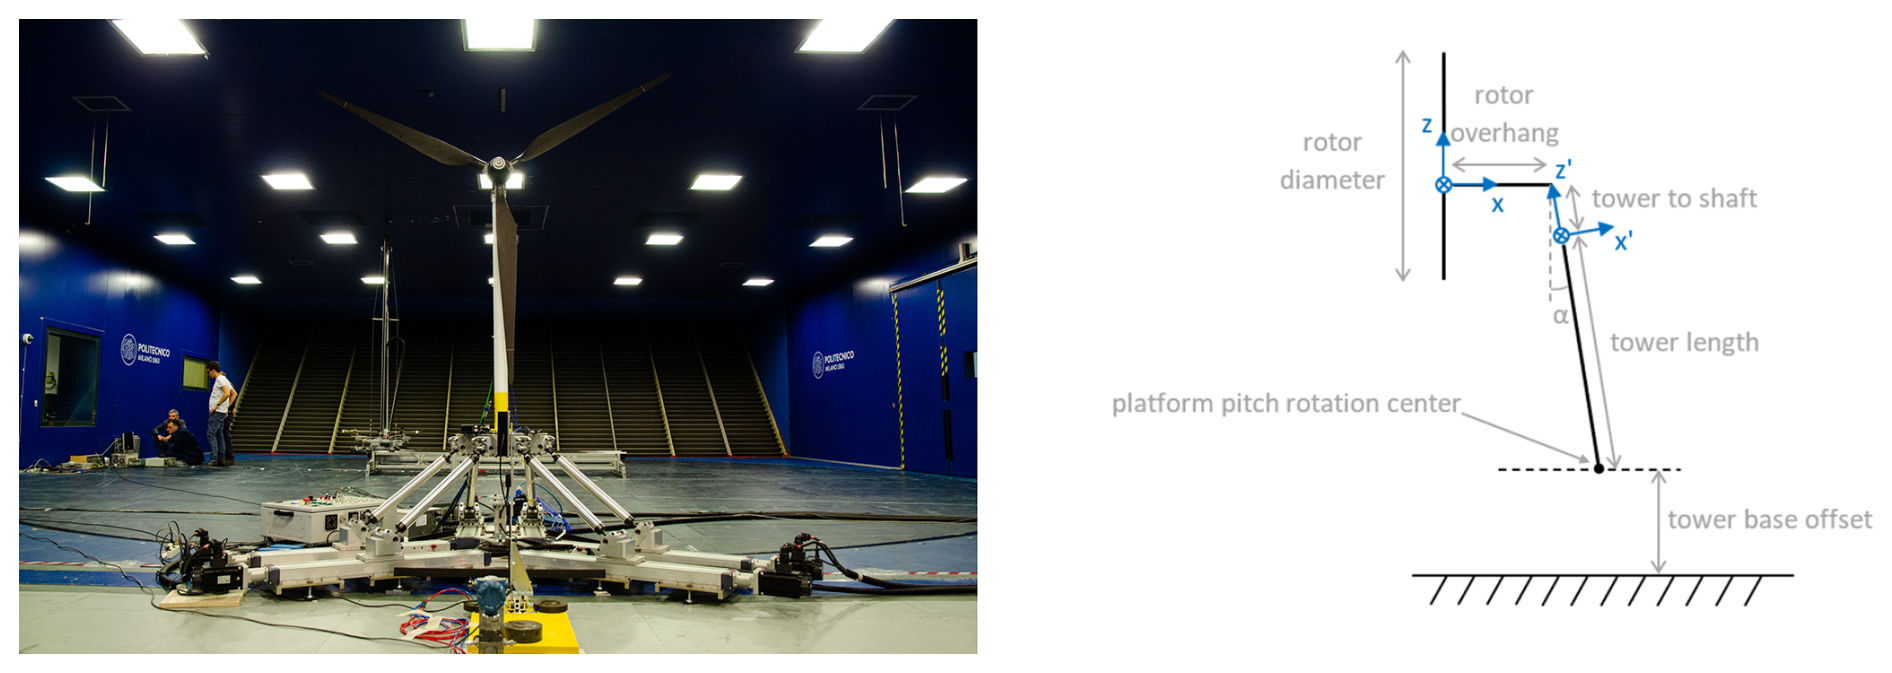
Numerical analyses have run in parallel and share the test case with the first stage of the NETTUNO project, a new experimental campaign realized by Politecnico di Milano (PoliMi), which is part of more extensive work investigating the influence of the wake of a floating wind turbine on the response of a second downstream turbine. The 1:75 scaled DTU 10 MW wind turbine model was tested within the Galleria del Vento of PoliMi (GVPM). The wind tunnel has an extension of 35 m × 13.84 m × 3.84 m. The turbine is shown in Fig. 1, and its main characteristics are reported in Table 1. Further details regarding the experimental test case can also be found in Fontanella et al. (2021).
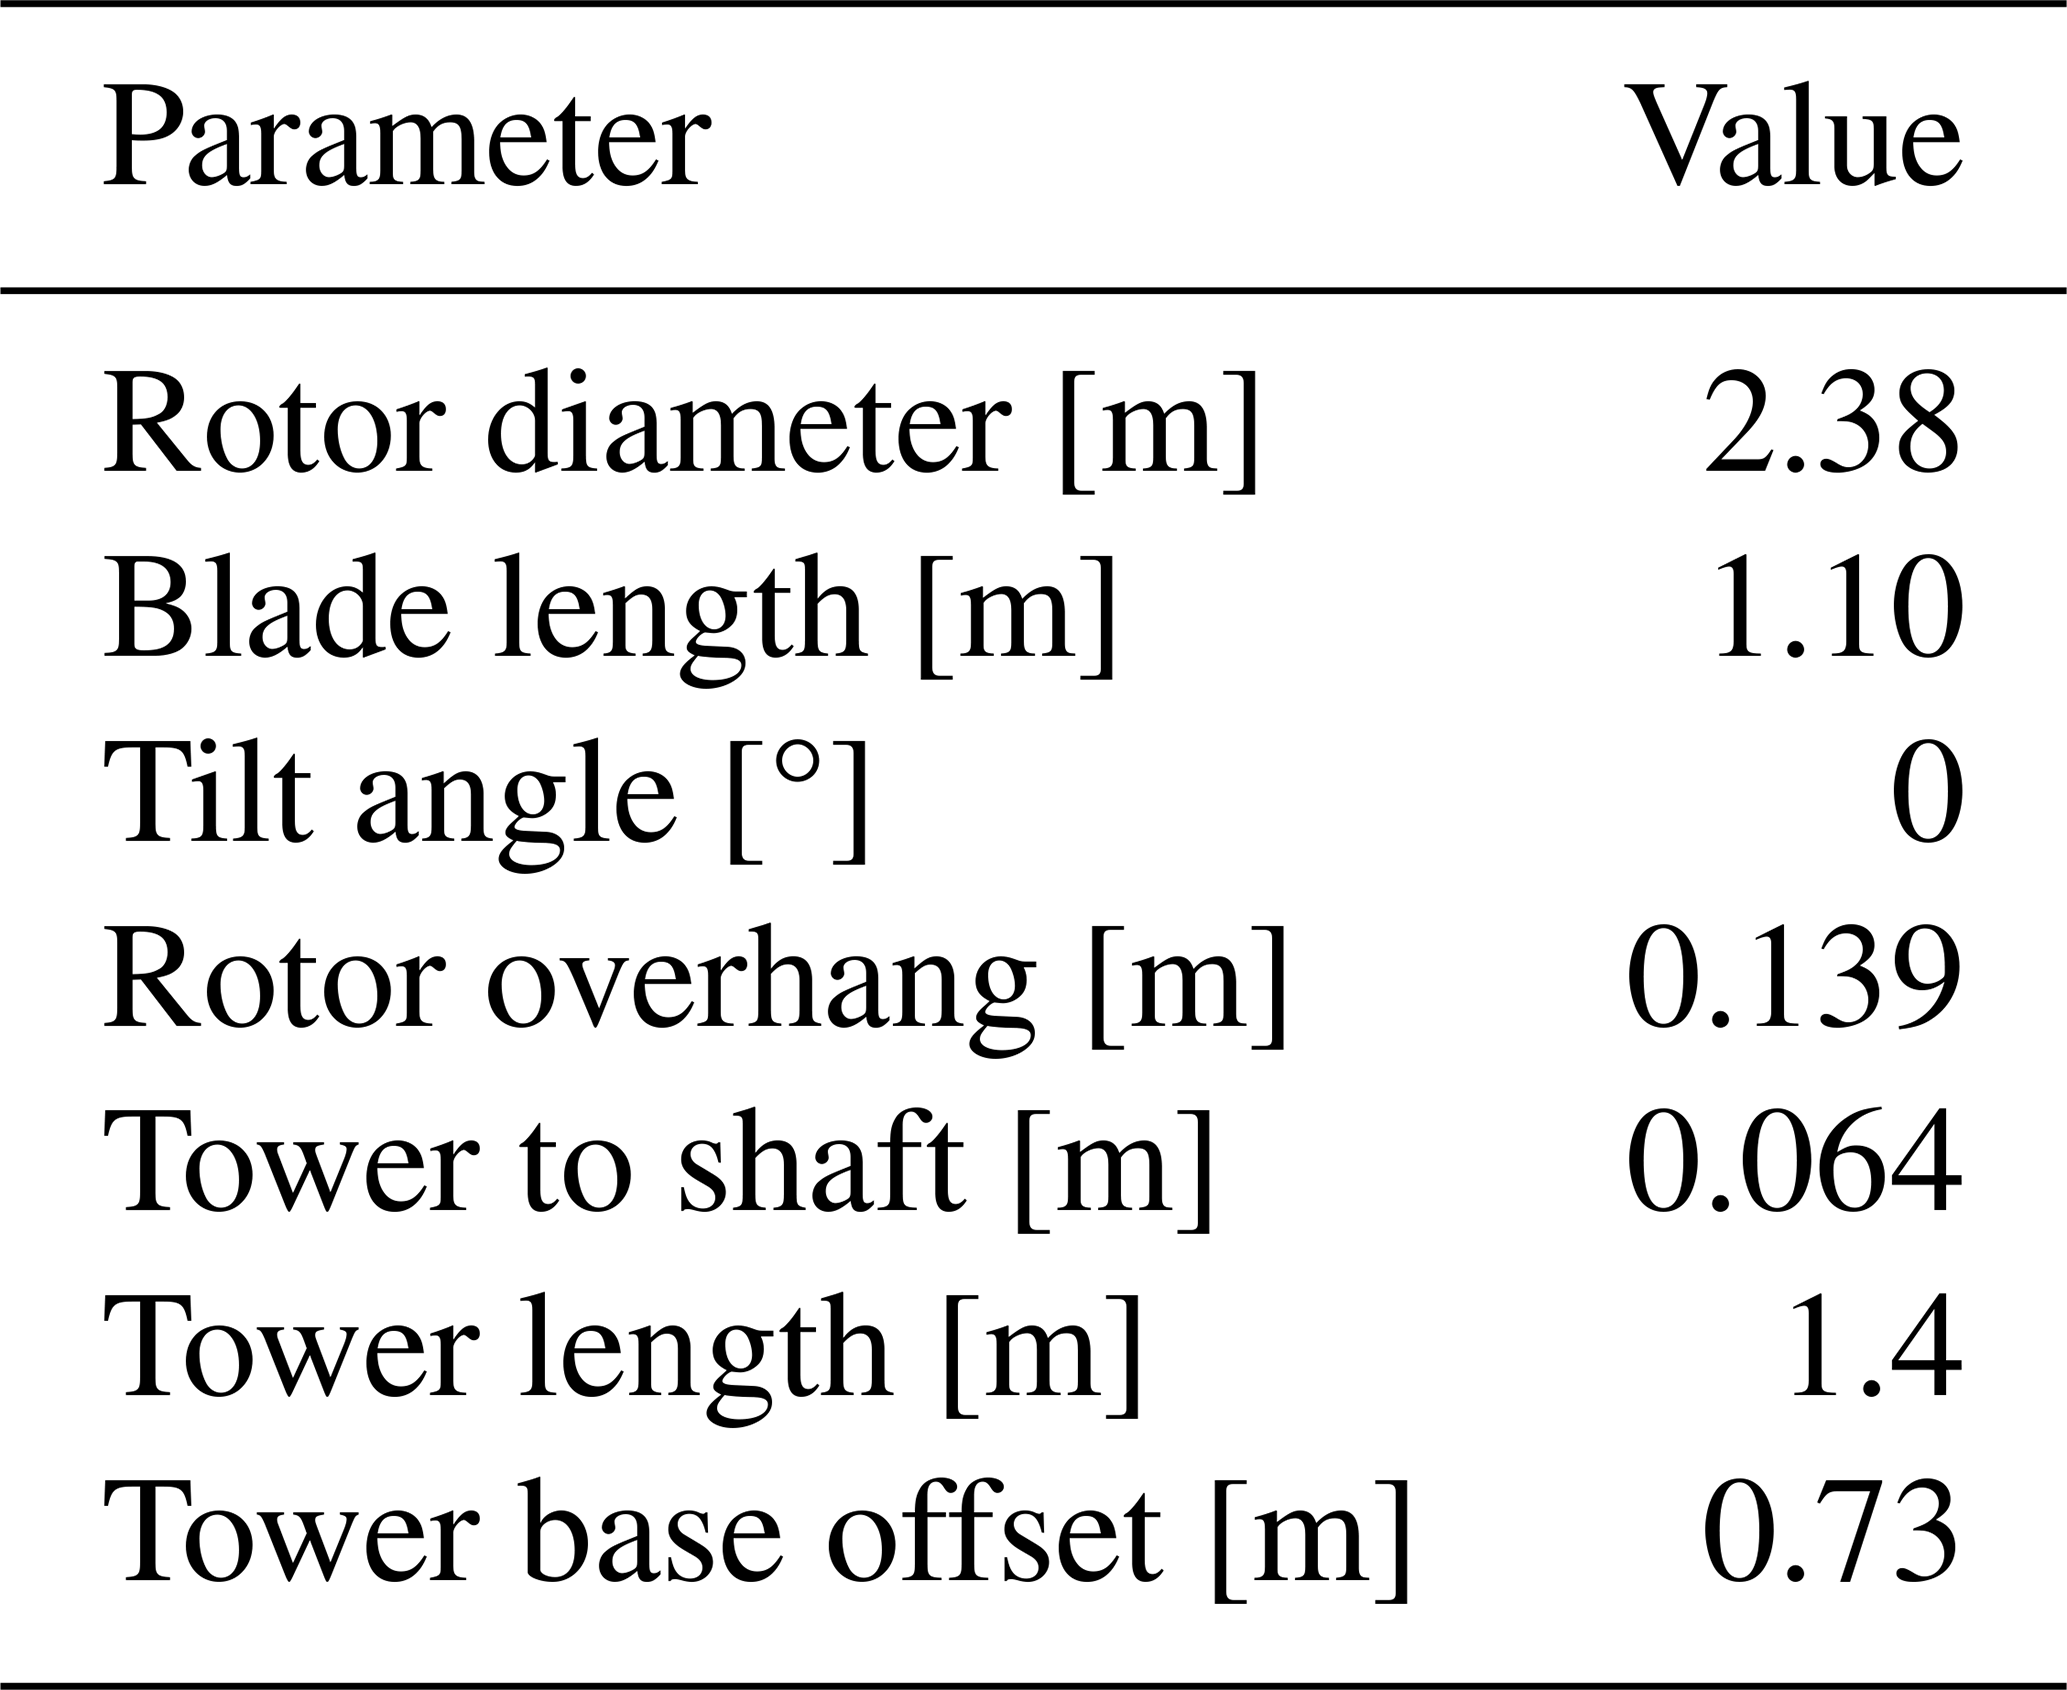
Table 2Main characteristics of the simulation runs.
n/a: not applicable.
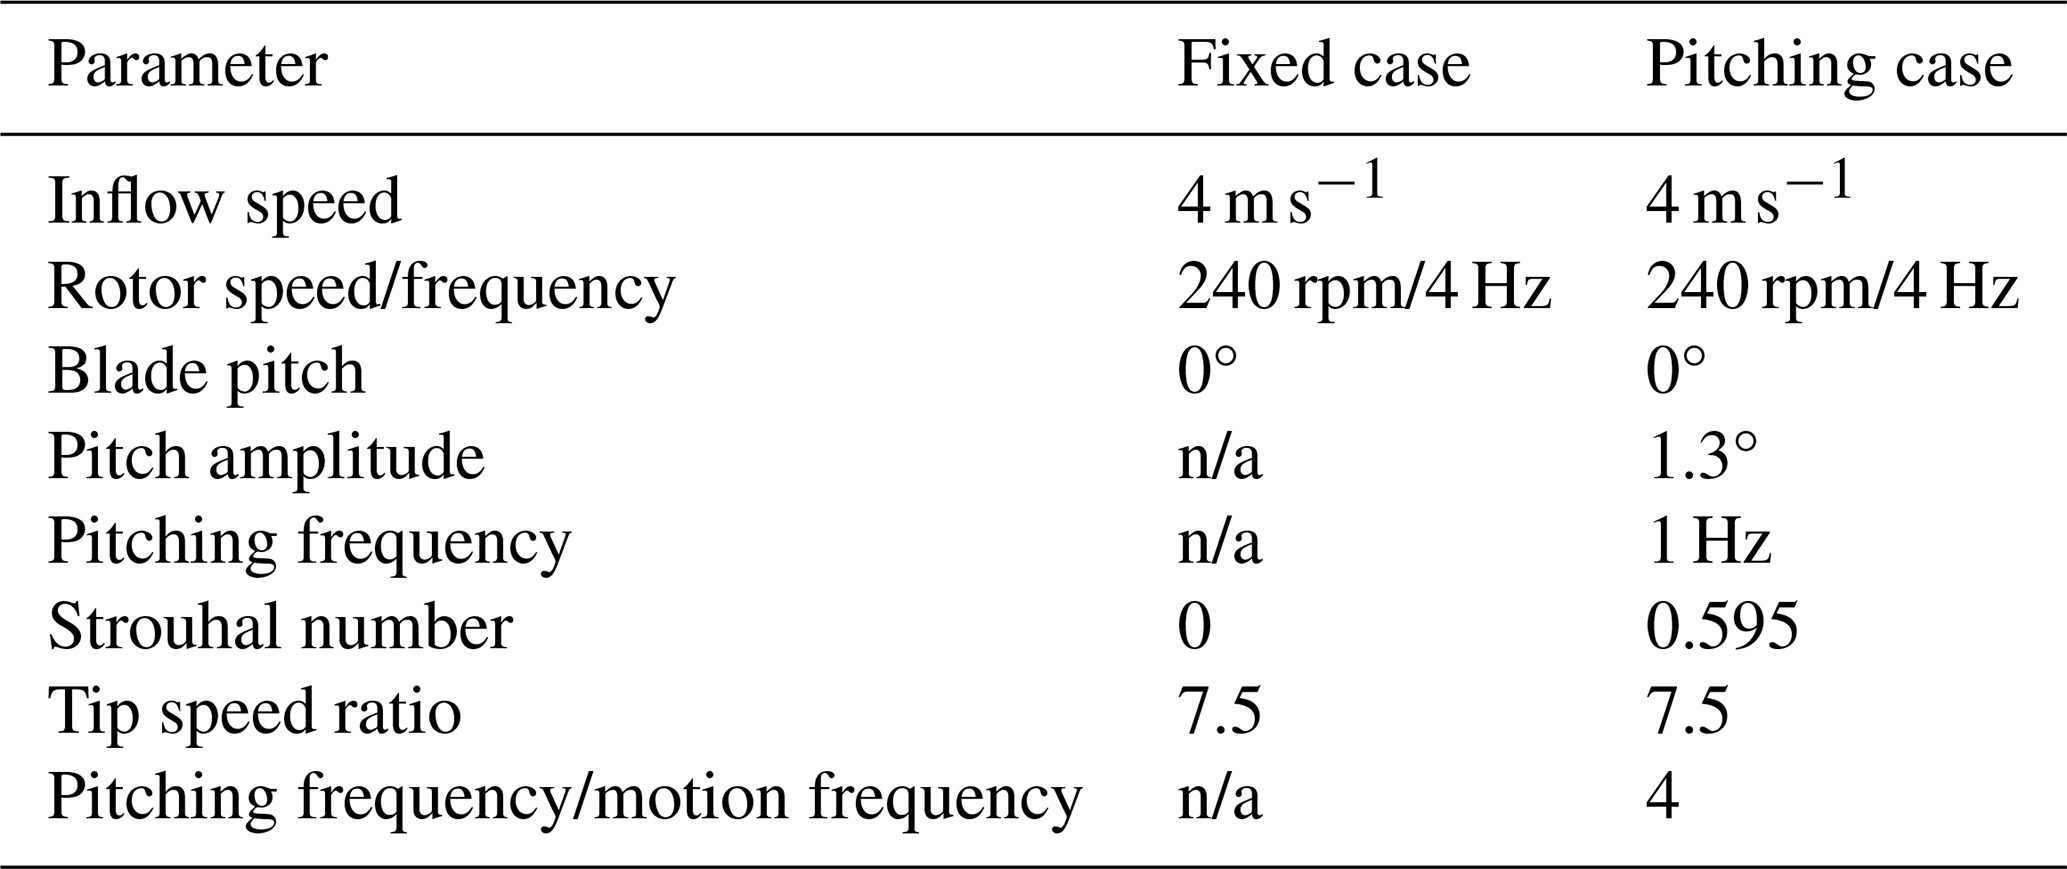
The wind turbine model was installed on a 6 DOF robot that can generate both translational and rotational motions with user-defined frequencies and amplitudes. The wind tunnel was operated while maintaining a constant undisturbed wind speed of 4 m s−1. For this velocity, the Reynolds number along the blade ranges between 8 × 10⁴ and 1 × 10⁵ for most of the blade span (from 30 % to 90 %) (Fontanella et al., 2021). Turbulence intensity at the rotor is approximately 1.5 %, and the air density (constantly measured during the tests) is 1.18 kg m−3 (the temperature inside the tunnel was kept in the range of 20 °C ± 1). Two cases were considered in the numerical campaign, with the rotor being fixed and in pitching motion, following a fixed sinusoidal law with 1.3° of oscillation amplitude and a frequency of 1 Hz. More details are shown in Table 2. The Strouhal number is defined as , where fp is the platform motion frequency, D is the rotor diameter, and U∞ is the undisturbed wind speed. If scaled based on the Strouhal number, the imposed oscillation would result in a 1.3° pitch oscillation with a 25 s period at full scale. This corresponds to a realistic oscillation at a frequency which is representative of the design natural frequency of many FOWT platforms (Behrens de Luna et al., 2024).
In the experiments, axial velocity was measured on two horizontal traverses downstream of the rotor plane at a distance of 3 and 5 D. For each traverse, velocity was measured in 35 equally spaced acquisition points, from −1.7 to +1.7 m with respect to the rotor center.
Two different numerical setups have been developed for the URANS and LES simulations in order to tailor the modeling strategy to the wake resolution method. Aspects such as mesh setup, turbulence model, and near-wall modeling have been treated according to each model's requirements. In addition, the URANS numerical setup was refined based on the free-stream turbulence imposition method that was adopted. In the following, we refer to URANS simulations when inflow turbulence is imposed by means of appropriate boundary conditions for the turbulence transport equations and URANS_stg when inflow turbulence is imposed by means of free-stream velocity fluctuations, generated through a synthetic turbulence generator (stg).
Simulations were run with the ALM feature within the finite-volume-based software Converge by Convergent Science (Richards et al., 2024). This simulation environment, ubiquitously known for its potential in the case of combustion processes and confined flows, indeed provides very interesting features that also make it attractive in turbomachines operating in external flows, with particular reference to wind turbines (Convergent Science, 2025). In particular, the software allows for autonomous meshing; i.e., it automatically creates the mesh at runtime and dynamically adapts the mesh throughout the simulation. This is a key factor in reducing the operator dependence of the results. The ALM within Converge was first introduced by Xie (2021). Converge solves the discretized governing transport equations of momentum, energy, and species on a Cartesian collocated mesh. The Rhie–Chow scheme is used to suppress the checkerboard effect. The equations of motion are solved in a segregated manner using the pressure-implicit with splitting of operators (PISO) algorithm for the velocity–pressure coupling. Multiple turbulence models are available in Converge for both Reynolds-averaged Navier–Stokes (RANS) and LES. While the original ALM formulation introduced a novel Lagrangian-averaged velocity sampling, the following collaboration with the University of Florence has further developed the code, switching to a velocity sampling based on the Line Average method (Melani et al., 2020): additional details on the code formulation can be found in Papi et al. (2021) and in Sect. 3.3. In the field of wind turbine simulation (bottom fixed and floating), the code has recently been applied successfully in IEA Tasks 47 and 30 (OC6) (Bergua et al., 2023; Cioni et al., 2023). In particular, the OC6 simulation effort involved the same turbine and wind tunnel used herein, thus providing an invaluable benchmark for model calibration.
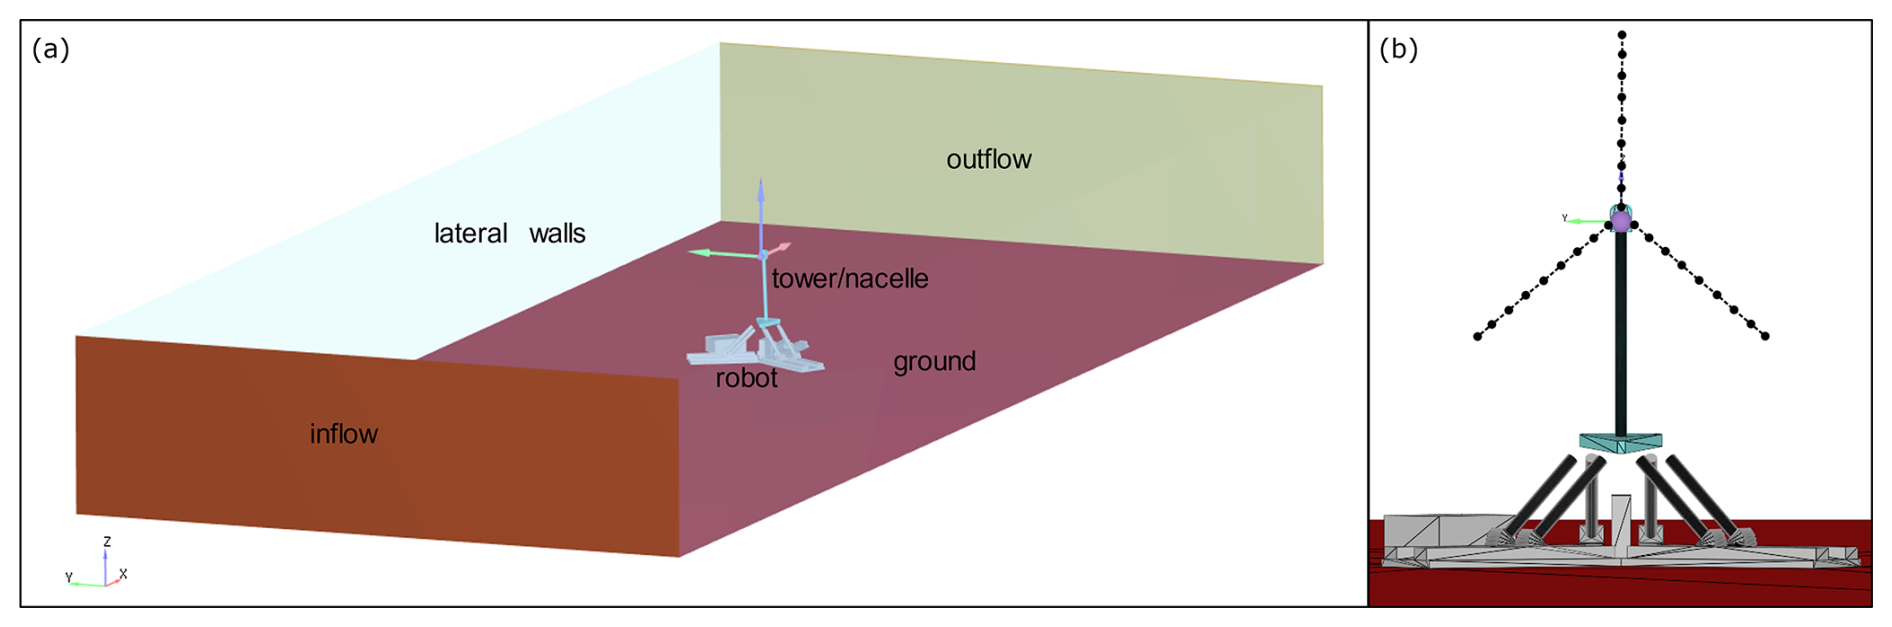
Figure 2CFD domain. Complete geometry (a), with a focus on the robot, tower, and nacelle geometries. (b) Rotor represented with fictitious ALM lines (number of nodes not consistent with the setup).
3.1 CFD solver settings
The CFD domain was set to represent the geometry of the wind tunnel test case and corresponds to the wind tunnel size (Fig. 2a). The robot, tower, nose, and nacelle (Fig. 2b) are included inside the wind tunnel domain. The wind tunnel inlet is placed 8.8 D upstream of the rotor, while the domain extends up to 6 D downstream. These boundary placements were defined based on the actual wind tunnel test section, which extends a corresponding amount upstream and downstream of the rotor, where the turning vanes of the closed circuit start. The lateral walls of the tunnel are placed 2.8 D away from the rotor center, again based on the physical dimensions of the wind tunnel. This is a meaningful element of novelty with respect to past similar studies, as the geometry of the nose cone, nacelle, tower, and robot is often neglected (Arabgolarcheh et al., 2022; Combette, 2023; Fang et al., 2020; Firpo et al., 2024), while, as discussed in Sect. 3.1, these components interact in a non-negligible way with the wake of the wind turbine. The blades are modeled using the ALM approach, explained in detail in Sect. 3.2. Dirichlet boundary conditions for velocity, temperature, and sub-grid turbulent kinetic energy are imposed at the inlet for the LES simulations, while turbulence intensity and length scale are imposed for the URANS simulations. In this second case, turbulence parameters are fine-tuned in order to compensate for the numerical decay along the computational domain so that the actual length scale and turbulence at the rotor are consistent with those of the experiments. In the LES and URANS_stg simulation, turbulence is accounted for by inserting velocity perturbations inside the flow field, as detailed in Sect. 3.3. A Dirichlet boundary condition is also imposed at the outlet for pressure, while a Neumann boundary condition is imposed for velocity, temperature, and sub-grid turbulent kinetic energy. The geometries of the ground, robot, tower, nose cone, and nacelle are set as no-slip walls, while lateral and upper walls are set as free-slip to avoid explicitly solving the boundary layer. In line with this choice, and similarly to what was done during the OC6 project (Bergua et al., 2023; Cioni et al., 2023), these walls have been moved slightly inward within the domain to account for boundary layer blockage of the free-stream flow. Regarding turbulence closure, the realizable k–ε model was chosen for the URANS simulations, with standard wall functions for the near-wall treatment. For LES simulations, a one-equation viscosity model, as formulated by Menon et al. (1996) and Yoshizawa and Horiuti (1985), was adopted, with the treatment of velocity profiles close to the walls (the so-called “law of the wall”) resolved according to the Werner and Wengle model, which best fits for internal flows and has been validated by simulating the flow around a cube on a plate channel (Werner and Wengle, 1993).
Focusing on numerical schemes, for the traditional URANS simulations, a first-order upwind scheme for turbulence equations and a second-order central difference scheme for momentum equations were adopted, with monotonicity that is guaranteed by a dedicated algorithm. For the LES and URANS_stg simulation, more accurate numerical schemes were necessary. More specifically, a MUSCL scheme (van Leer, 1974) blended with a 3 D slope limiter was employed. For the one-equation turbulence closure, a second-order upwind scheme was chosen. For additional details, refer to Xie (2021) and Convergent Science (2023).
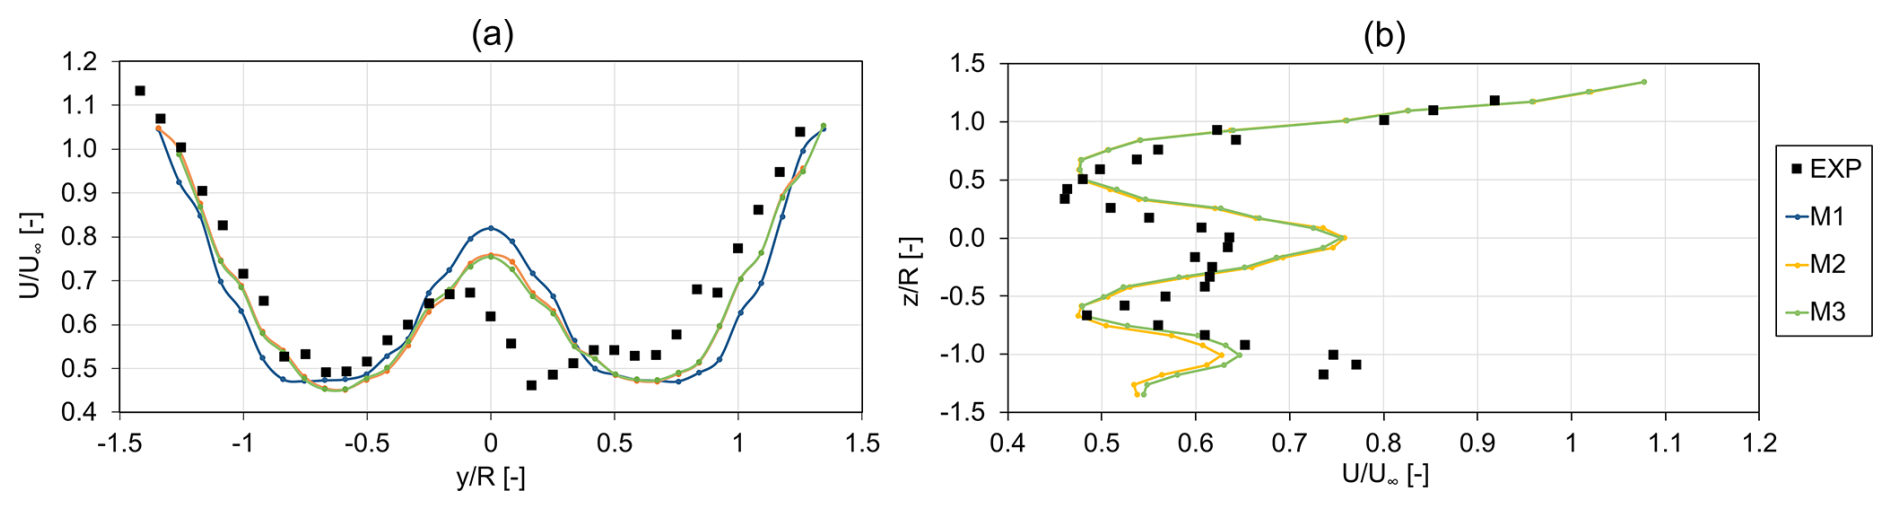
Table 3URANS meshes tested during the sensitivity analysis. The coefficients of determination (R2) are computed between each mesh and the experiments for the horizontal traverse 3 D from the rotor, shown in Fig. 4a.
3.2 Mesh sensitivity
As per software requirements, a Cartesian collocated mesh was created with progressive levels of refinement (embeddings) close to the rotor. For the sake of brevity, specific details of the mesh used in both the URANS and the LES simulations are not reported here; the reader is referred to Appendix B for a full presentation. A preliminary grid sensitivity study was performed in the rotor wake to ensure that wake characteristics are insensitive to the numerical resolution. Mesh refinement in the rotor region was not varied during such sensitivity analysis because the mesh size was already tuned in conjunction with the ALM setup during the OC6 project (Bergua et al., 2023; Cioni et al., 2023). Insensitivity of the wake profile was tested in terms of both convergence history in time and accuracy in comparison to experimental data, as shown in Fig. 3. This sensitivity analysis – performed with a 2 % turbulence intensity at the inlet, in accordance with preliminary estimations – led to a mesh of approximately 15 × 106 elements, indicated as M3 and described in Table 3. It has to be remembered that Converge features an automatic mesh refinement (AMR) feature, which allows for selective refinement of the computational grid based on gradients in field variables (Papi et al., 2021). For the simulations presented in this work, the criterion adopted for the AMR is based on the velocity field so that the mesh resolution is automatically enhanced where the gradients of velocity are higher than the user-specified threshold, which was fine-tuned during preliminary test runs to ensure additional cells were added to critical regions, such as the inner and outer shear layers of the wake, as shown in Fig. B1.
In this case, as demonstrated by the R2 values in Table 3, the reduction in the AMR activation threshold (Table 3) in M2 brought mean wake velocity in closer alignment with experimental data (Fig. 3a). On the other hand, a much smaller improvement can be seen when M2 and M3 are compared, which differ mostly in the vertical traverse (Fig. 3b). These differences, however, are mostly located in the bottom shear layer of the wake, which, as explained in the following sections, is heavily affected by the robot's wake. Despite minor differences with respect to M2, which would suggest that this setup is adequate, M3 was ultimately chosen. This was a precautionary choice and is justified by the desire to accurately solve wake structures in the pitching case as well. For the URANS_stg simulation discussed in Sect. 4.3, a similar mesh is adopted, except for the box embedding region required for the turbulence injection in front of the rotor, which is similar to the LES mesh setup. Moreover, AMR was deactivated, and a fixed embedding was set to obtain the same discretization of the wake.
LES simulations required a finer grid than their URANS counterparts. The mesh setup is shown and discussed in Appendix B and results in an element count of approximately 120 × 106, nearly 8 times the element number of the URANS setup, resulting in a non-negligible increase in computational cost. On a cluster with AMD EPYC 7413 24-core processors and approximately 200 GB RAM for each node, a single revolution run with the URANS approach requires a maximum of roughly 320 core hours per revolution on two nodes, while an LES simulation requires 2800 to 5000 core hours for the same revolution on a maximum of 10 nodes, depending on the complexity of the test case. It must also be considered that the number of revolutions required for convergence is not the same for all the simulations, as more time is required for the “statistical convergence” of turbulent LES simulations, further discussed in Sect. 3.4.
3.3 ALM blade model
The rotor blades are modeled with an ALM tool, implemented inside Converge. This method was first proposed from a theoretical point of view by Sørensen and Shen (2002), and it consists of replacing the physical geometry of the blade with dynamically equivalent momentum sources, evaluated through tabulated polar data given as input to the model. The other variables at hand are the velocity of the flow domain for the calculation of the angle of attack; the Reynolds number, which is sampled from the CFD domain through a sampling algorithm; and the properties of the distribution function, adopted to distribute the momentum sources back into the CFD domain, namely the regularization kernel (RK).
As anticipated in Sect. 3.1, in the current study, velocity sampling has been addressed through the Line Average (Jost et al., 2018), whereby the inflow velocity is obtained by averaging it over a circle at one chord around the ALM point (Melani et al., 2020). This approach has already been proven to provide reliable results for this test case (Cioni et al., 2023). Force insertion is instead done using a piecewise smearing function, for which details can be found in Xie (2021). While similar in shape to the more commonly used Gaussian function, the former has the benefit of being conservative in its formulation. The setup of the regularization kernel is particularly important for avoiding instabilities in the CFD code, as the insertion of point forces inside the domain would lead to instability issues. On the other hand, spreading the forces to a large volume would lead to a dispersion of the rotor effects, underestimating the induction on the incoming inflow. Therefore, the width of the regularization kernel is fine-tuned to the blade chord and mesh size. As explained in detail in Papi et al. (2021) and Xie (2021), the regularization kernel width varies along the blade span and is determined as ), where c is the local chord, Δ is the local mesh size, and ζ is a tuning factor. Different values of ζ were used in the LES and URANS setups to ensure consistency in kernel size, in particular, Δ = 0.01 m and ζ = 2.4 in the LES simulations and Δ = 0.015625 m and ζ = 1.6 in the URANS simulations. These values were chosen based on previous validation (Bergua et al., 2023; Cioni et al., 2023). In addition to ensuring consistency between the two simulation approaches, the chosen values ensure up to approximately 50 % of the rotor span while limiting the kernel size to ζΔ in the outer part of the blade to improve numerical stability.
The blade is discretized with 55 uniformly distributed sections. This choice, together with the RK calibration and the Line Average velocity sampling strategy, is the same used by the authors during the OC6 project (Bergua et al., 2023; Cioni et al., 2023). This choice ensures that the final rotor response simulated with the URANS approach is aligned with most of the other numerical codes in the OC6 project, as well as the experimental results.
As widely demonstrated (Dağ and Sørensen, 2020; Hodgson et al., 2022; Martínez-Tossas et al., 2018), accurately reconstructing tip effects in horizontal-axis wind turbine (HAWT) blades is key for the reliability of the integral rotor response. Converge can use the Dağ–Sørensen model (Dağ and Sørensen, 2020), recently used by some of the authors in the case of fixed-wing and vertical-axis wind turbines, and the model proposed by Meyer Forsting et al. (2019). It is a computationally efficient model based on a lifting-line theory approach for the correction of the angle of attack, with the aim of accounting for the downwash effects that are dissipated by the over-diffusion inherent to the ALM force smearing in the near-tip region. This latter method was used in the present study.
3.4 Turbulence insertion in scale-resolving simulations
In LES and URANS_stg simulations, rather than imposing fluctuations in flow velocity at the inlet, they are injected as volume forces close to the rotor to avoid numerical diffusion from the coarse mesh in front of the rotor. To this end, a distribution of momentum forces in front of the rotor was defined, with the module of each source defined as in Eq. (1) for each Cartesian component (here, only the x component is shown as an example):
where Δu is the desired velocity perturbation in the flow downstream of the insertion zone, Ux;∞ is the undisturbed inlet velocity and Ux is the local velocity at the insertion zone, ρ is the air density, and C(x) is an exponential distribution function that distributes the forces axially in the insertion zone. Additional details are shown in Appendix A. The desired perturbation Δu is obtained by subtracting the mean undisturbed velocity from the desired turbulent inflow velocity . The turbulent inflow velocity was generated from the turbulent spectrum measured in the wind tunnel (shown in Appendix A), with a maximum frequency of 100 Hz. In fact, very low energy was noted in the turbulent spectrum beyond this frequency. Therefore, an insertion frequency of 200 Hz was chosen, according to the minimum requirements in terms of signal reconstruction. From the turbulent spectrum a synthetic turbulent wind field was obtained using TurbSim (Jonkman, 2016) with the IEC Kaimal spatial coherence model. The generation zone extends along the entire test section in the vertical direction and for 5 m (≈ 2 D) in the horizontal direction to ensure the rotor and wake are completely immersed in the free-stream turbulence. This approach was inspired by the work of Gilling and Sørensen (2011), where an actuator disk approach is proposed for the turbulence injection. From this starting point, similarly to what was proposed in Spyropoulos (2024), the planar distribution of momentum sources has been extended in the axial direction through the definition of an exponential distribution function. The input velocity perturbations were calculated directly from the spectrum derived from the experimental velocity sampling and conveniently scaled to compensate for numerical dissipation in the insertion process. The choice of the insertion plane, in terms of dimensions, spatial and temporal discretization, and distance from the rotor, is key to obtaining the desired turbulent characteristics at the rotor plane. Some parameters have been found to be strongly related to each other, such as temporal and spatial discretization, which must be appropriately related to the turbulence spectrum characteristics and to the rotor size. Conversely, others have been found to be more setup dependent. For instance, the location of the insertion plane is suggested to be 1 R upstream of the rotor in Spyropoulos (2024), while in the IEA Task 29 – Phase IV project (Schepers et al., 2021, p. 29), turbulent fluctuations are inserted at a 320 m (≈ 4 D) distance from the NM80 turbine. In the present study, based on dedicated tests, the generation zone was positioned 2 D in front of the rotor. More details on the obtained turbulent characteristics at the rotor plane are shown in Appendix A.
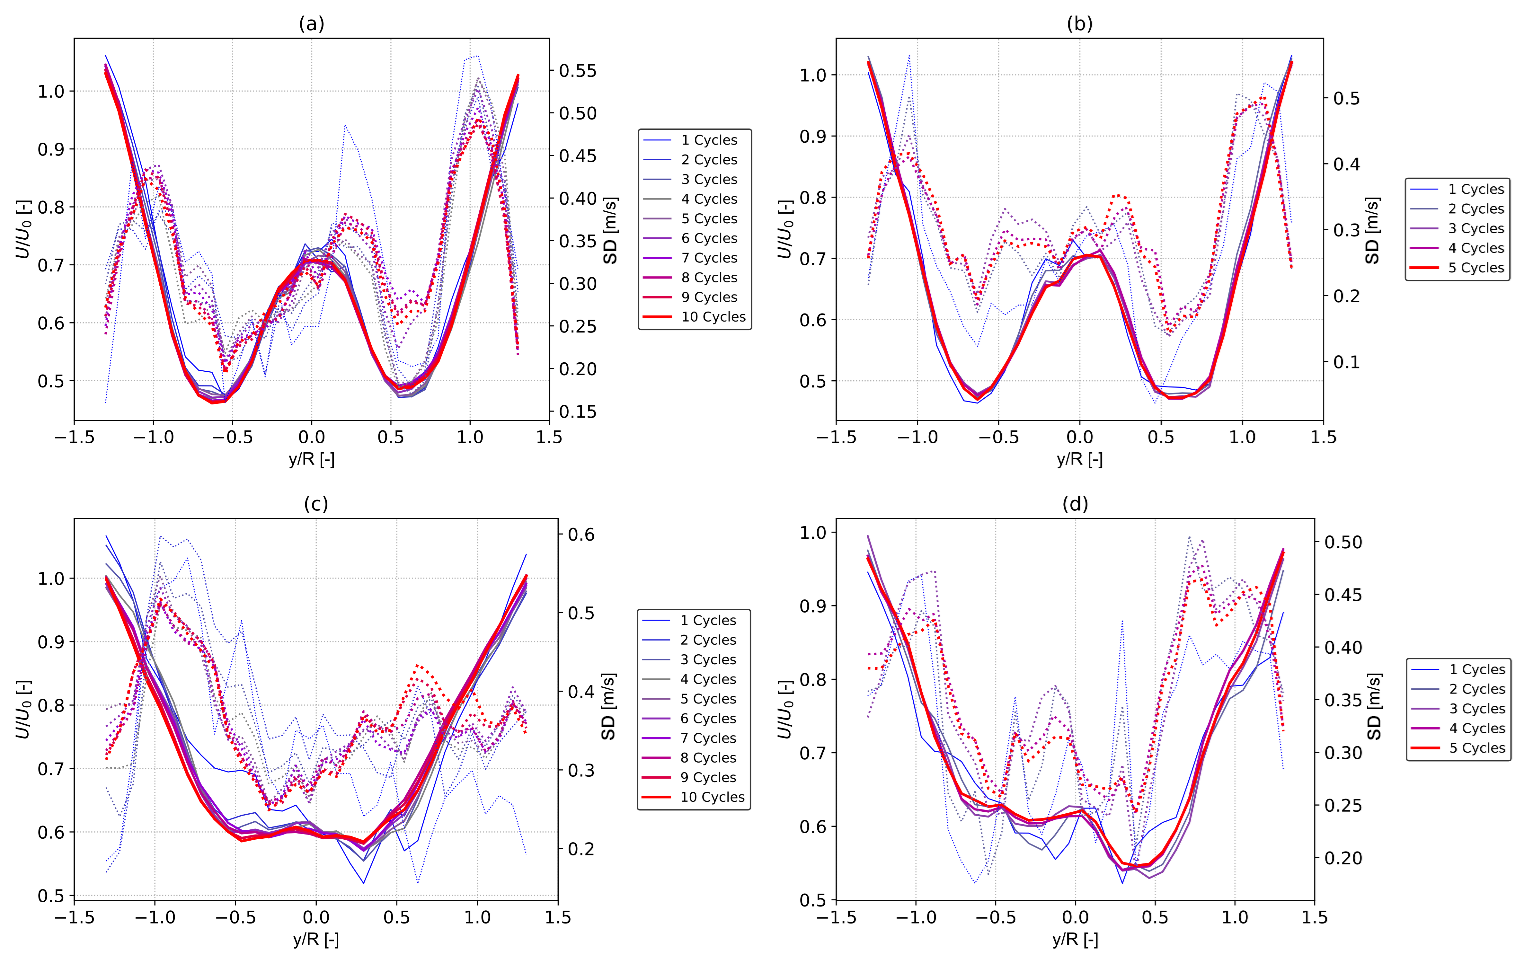
Figure 4Mean velocity profiles (solid lines – left axis) and standard deviations (dashed lines – right axis) for LES_t cases at (a) 3 D – pitching case, (b) 3 D – fixed case, (c) 5 D – pitching case, and (d) 5 D – fixed case.
3.5 Simulation length and statistical convergence in scale-resolving simulations
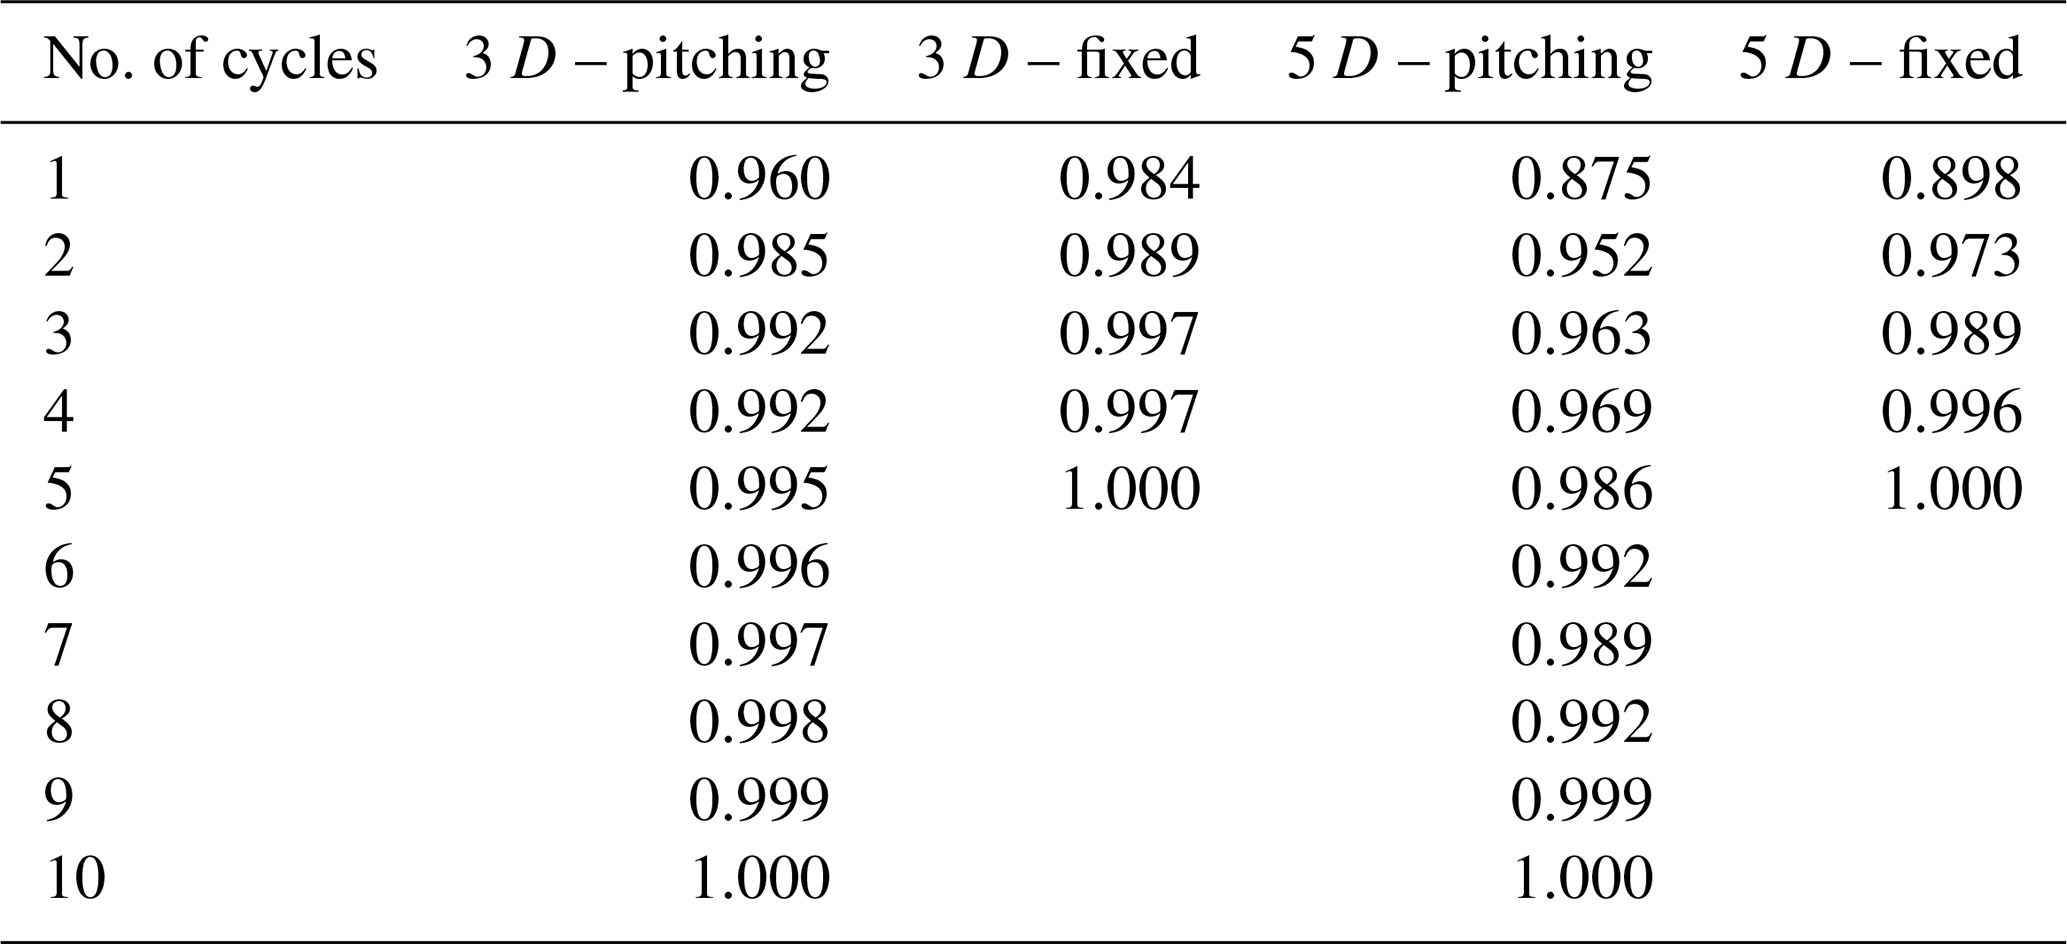
Convergence was checked for the main rotor performance metrics and wake profile. Once full convergence was reached, the simulation time recorded for data analysis was 5 s, corresponding to 5 pitching cycles in the pitching simulations and 20 rotor revolutions. This ensured that the variation in torque with respect to the previous revolution was less than 1 % in all cases. The only exception was represented by turbulent simulations using LES and pitching rotor, in which the varying inflow, coupled with platform motion, caused slow statistical convergence of mean wake values. In this case, a 10 s sampling window, corresponding to 10 pitch cycles, was necessary to ensure proper convergence 5 D downstream of the rotor plane, as shown in Table 4 and Fig. 4. In Fig. 4, the first two statistical moments, i.e., the mean and the standard deviation of the axial velocity sampled at 3 D and 5 D, are shown. For these two moments, which form the basis of the subsequent analyses in this study, good convergence can be noted. Selected sampling intervals are in good agreement with the suggestions provided by Martínez-Tossas et al. (2018). All numerical results are averaged over multiple rotor revolutions. Finally, due to the intrinsic stochasticity of the scale-resolving simulations, relevant cyclic results are phase averaged during one pitching cycle in order to obtain the mean response cycle for the quantity of interest.
Table 4Coefficients of determination (R2) for each number of pitching cycles taken for averaging, with reference to the wake averaged over the respective maximum number of cycles.
Simulations analyzed in this section consist of eight cases, characterized by a combination of the key metrics investigated in this study, i.e., a fixed or pitching platform, a laminar or turbulent inflow, and a URANS or an LES solution of the flow field. For the sake of brevity, simulations are referred to as follows throughout this section:
-
URANS_l (URANS simulation with laminar inflow)
-
LES_l (LES simulation with laminar inflow)
-
URANS_t (URANS simulation with turbulent inflow)
-
LES_t (LES simulation with turbulent inflow)
-
URANS_stg (URANS simulation with turbulent inflow; “stg” stands for “synthetic turbulence generator”, as indicated in Sect. 3.1).
Table 5Rotor thrust and torque for the fixed case and relative difference in thrust (ΔTh) and in torque (ΔTq) with respect to experimental results (EXP); for experimental results, the maximum and minimum variation in mean values recorded during different runs is reported.
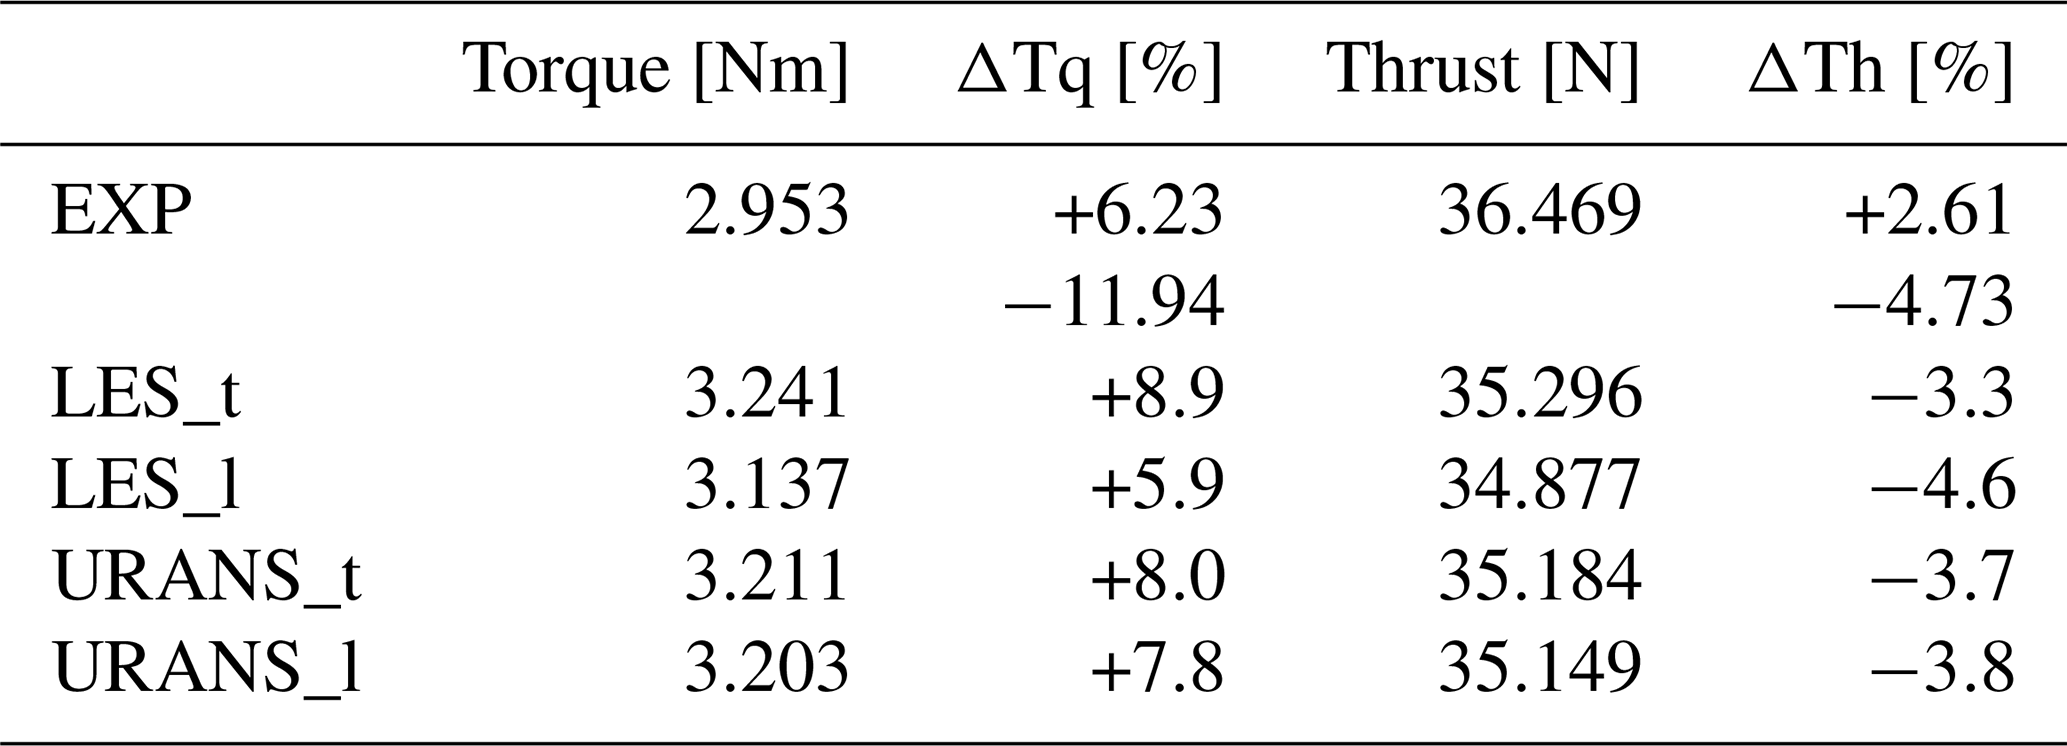
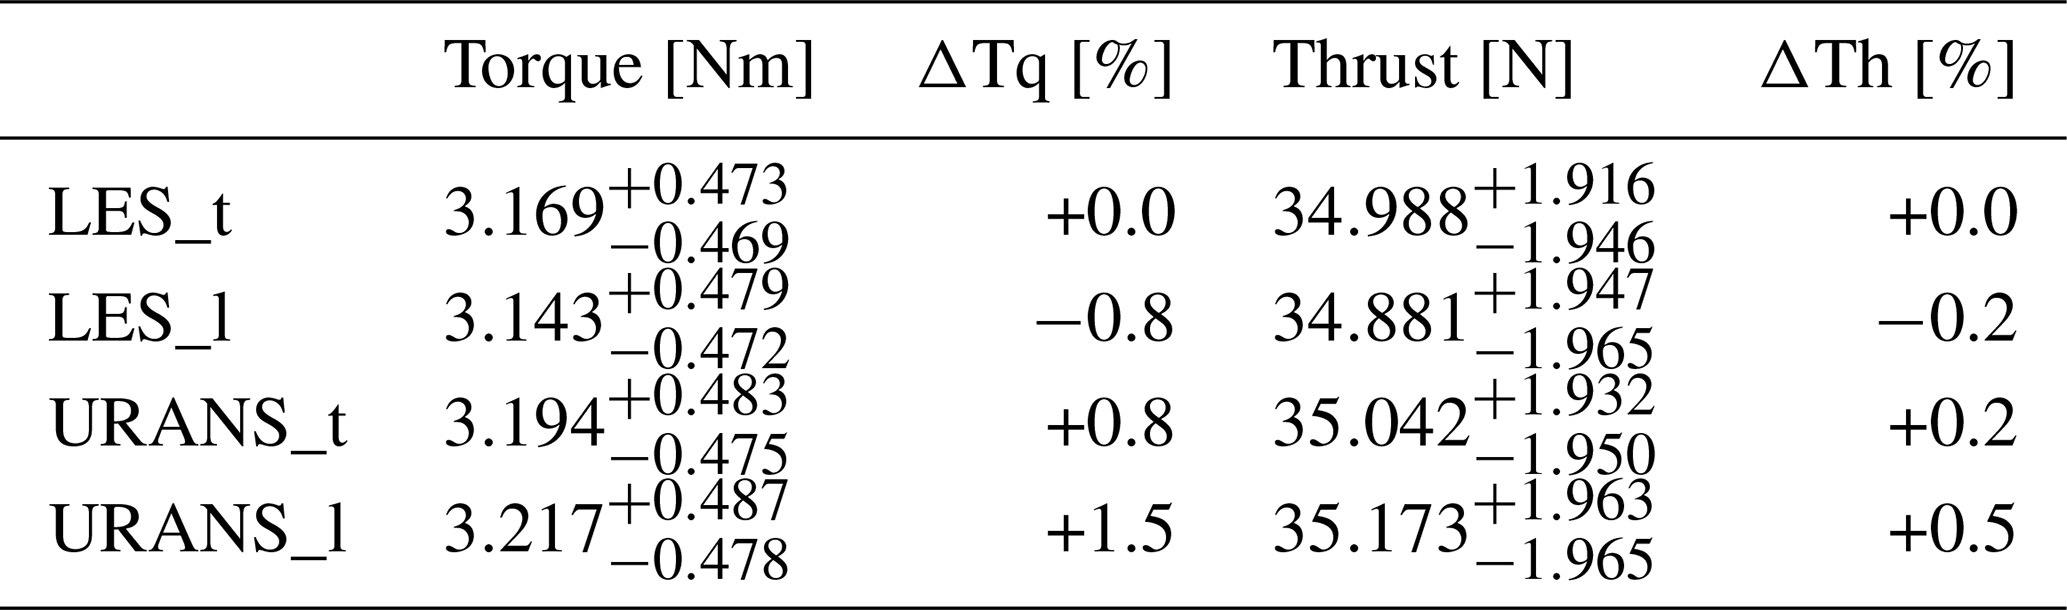
Table 6Pitching case: mean values and maximum and minimum deviations from the mean value for the phase-averaged variations in rotor thrust and torque; relative difference in the mean values of thrust (ΔTh) and in torque (ΔTq) from the LES simulation with turbulent inflow (LES_t).
4.1 Rotor performance
Good agreement can generally be noted for mean rotor quantities among all setups (Table 5) whenever no platform motion is included in the analysis, with numerical results highlighting higher torque and lower thrust than the experimental results. According to Fontanella et al. (2025), possible causes for these deviations are small differences in inflow velocity in the wind tunnel and small blade pitch errors in the experimental model. Importantly, for this study, all four numerical models are in close alignment with each other. Mean rotor forces, predicted by numerical models or measured in experiments with pitching motion, are shown in Table 6. For this case, details about the cyclic variations in thrust and torque during the pitch cycle are included. Similar to the fixed case, all numerical approaches are quite well aligned, with relative differences below 1 % for all quantities except for the URANS torque values.
4.2 Effects of turbulence on FOWT wake
This section analyzes the results from LES simulations, assumed to be the closest numerical reproduction of reality, to assess the effects of turbulence on the wake of FOWTs. Integral quantities, mean spanwise values, and contours of the most representative flow variables are shown, trying to highlight the most interesting differences between fixed-platform and pitching platform cases with either laminar or turbulent inflow.
.
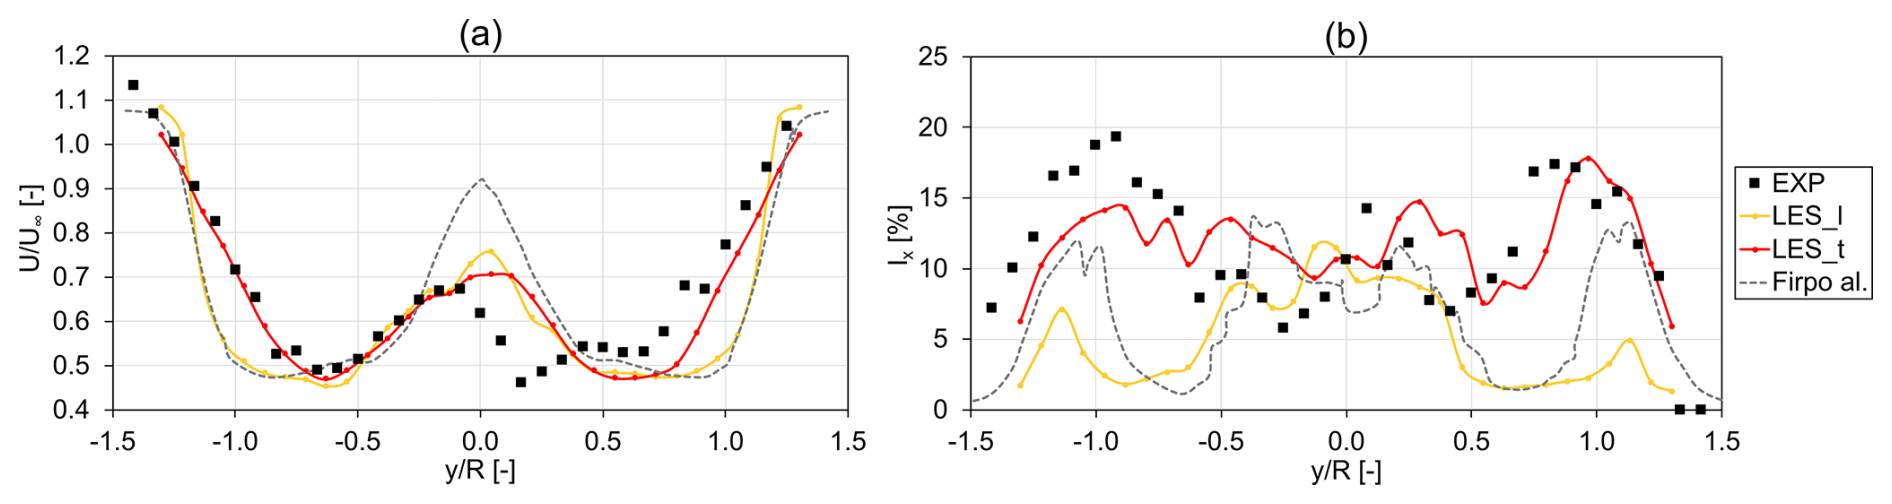
Figure 5Streamwise velocity (a) and turbulence intensity (b) sampled on a horizontal traverse at hub height located 3 D downstream of the rotor. Fixed-rotor LES results with turbulent and laminar inflow conditions compared to experimental data from the NETTUNO experiments (Fontanella et. al. 2024) and laminar LES results (Firpo et al. 2024)
Comparing the normalized streamwise velocity in Fig. 5a, a good match between experiments and numerical results can be noted, especially for the LES_t case, which closely matches the right-hand shear layer and maintains high accuracy on the left one. When the LES_t and LES_l cases are compared, the inclusion of free-stream turbulence apparently improves the agreement in the normalized mean velocity 3 D downstream of the rotor with respect to experiments in the outer shear layers. As shown in Fig. 5a, LES_l results are similar to those of Firpo et al. (2024), which were obtained with a similar LES–ALM model. The main difference between the previous study is in the center of the wake, and it can be ascribed to the absence of the tower and nacelle in the study by Firpo et al. (2024). A discrepancy with respect to experiments is still noticed in the center area of the wake for both the LES_l and the LES_t cases, where a different degree of symmetry clearly stands out. A possible explanation could be a discrepancy in the spanwise force distribution at the blade root between the experiments and numerical models; this hypothesis is still under investigation by the authors. The inclusion of inflow turbulence in the LES_t case clearly also reflects a change in turbulence intensity 3 D downstream, as can be observed in the plots of streamwise turbulence intensity (Fig. 5b). Turbulence intensity is computed as in Eq. (2):
As shown in Eq. (2), the resolved turbulence intensity (TI) is computed by normalizing the standard deviation of the velocity fluctuations ) by the mean velocity . When free-stream turbulence is considered, a noticeable improvement – in terms of agreement with experiments – is reached in the shear region, where the addition of approximately 1.5 % of free-stream TI causes an increase of 10 %–15 % in TI. Such an increase is due to the earlier wake transition that turbulence promotes. While present, this effect is less pronounced in the central part of the wake, presumably due to the fact that the closely spaced root vortices and turbulence generated by the hub and the nacelle already promote mixing in the laminar simulations.
It is also worth noting that the shape of the wake 3 D from the turbine for the laminar inflow case (Fig. 5a) greatly resembles that of previous numerical campaigns (Bergua et al., 2023). This is to be expected as inflow turbulence played a minor role in such numerical endeavors and was mostly neglected by those using lifting-line free vortex wake codes.
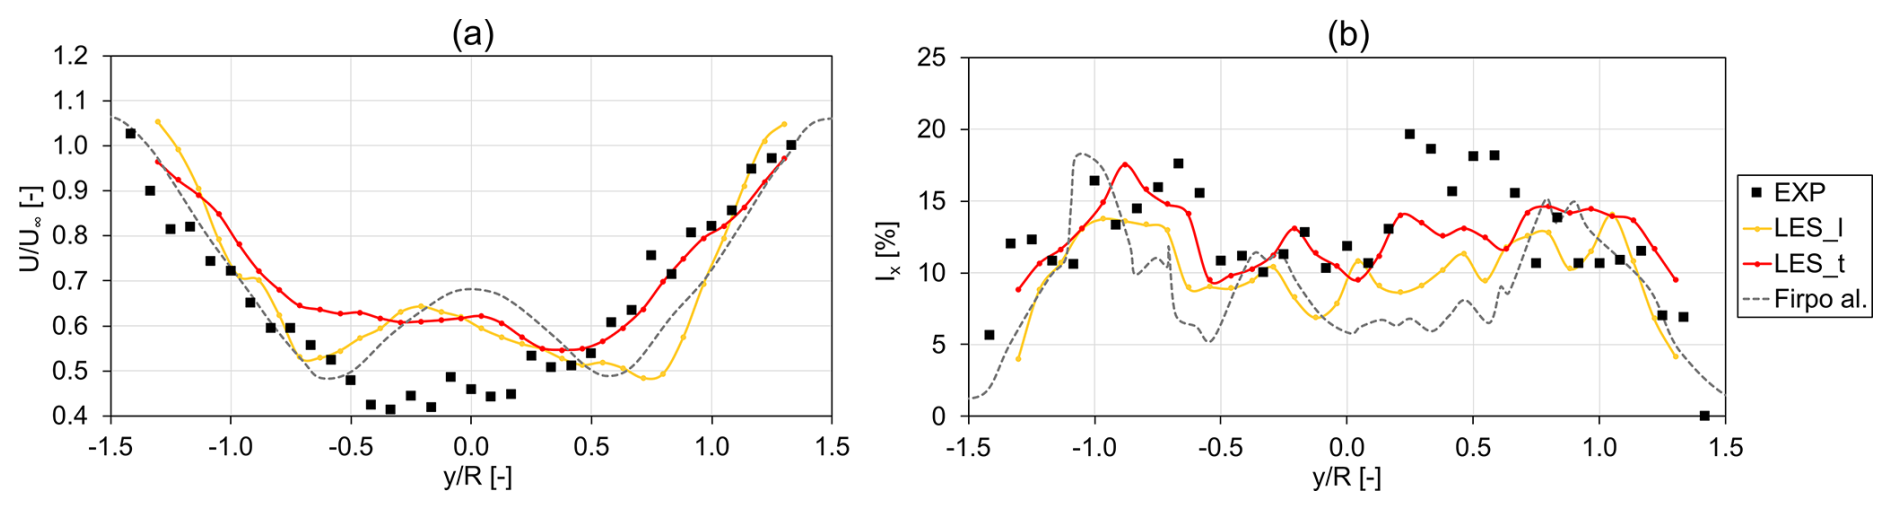
Figure 6Streamwise velocity (a) and turbulence intensity (b) sampled on a horizontal traverse at hub height located 5 D downstream of the rotor. Fixed-rotor LES results with turbulent and laminar inflow conditions compared to experimental data from the NETTUNO experiments (Fontanella et. al. 2024) and laminar LES results (Firpo et al. 2024).
If the same comparison of mean quantities is performed 5 D from the rotor (Fig. 6), the improved agreement with experiments of the LES_t simulation is still noticeable, especially for streamwise turbulence (Fig. 6b), but less apparent. Such a difference from 3 D to 5 D could indicate a different wake evolution trend, especially for negative values.
The overall effect of including free-stream turbulence on the mean velocity profiles is similar to what was observed 3 D from the rotor, with increased mixing and a larger shear layer when inflow turbulence is included, as shown in Fig. 6a. Moreover, the mean velocity profiles obtained with inflow turbulence more closely resemble a single-Gaussian wake deficit profile, which is characteristic of the far wake of a wind turbine, rather than the double-Gaussian deficit that is found in the near wake. This is the first indication of the fact that the inclusion of inflow turbulence has the effect of accelerating wake dissipation and near- to far-wake transition. The differences noted in the left part of the wake in Fig. 6a could be due to a different evolution of root vortices, which are incorrectly captured in the simulations even at 3 D (Fig. 5a).
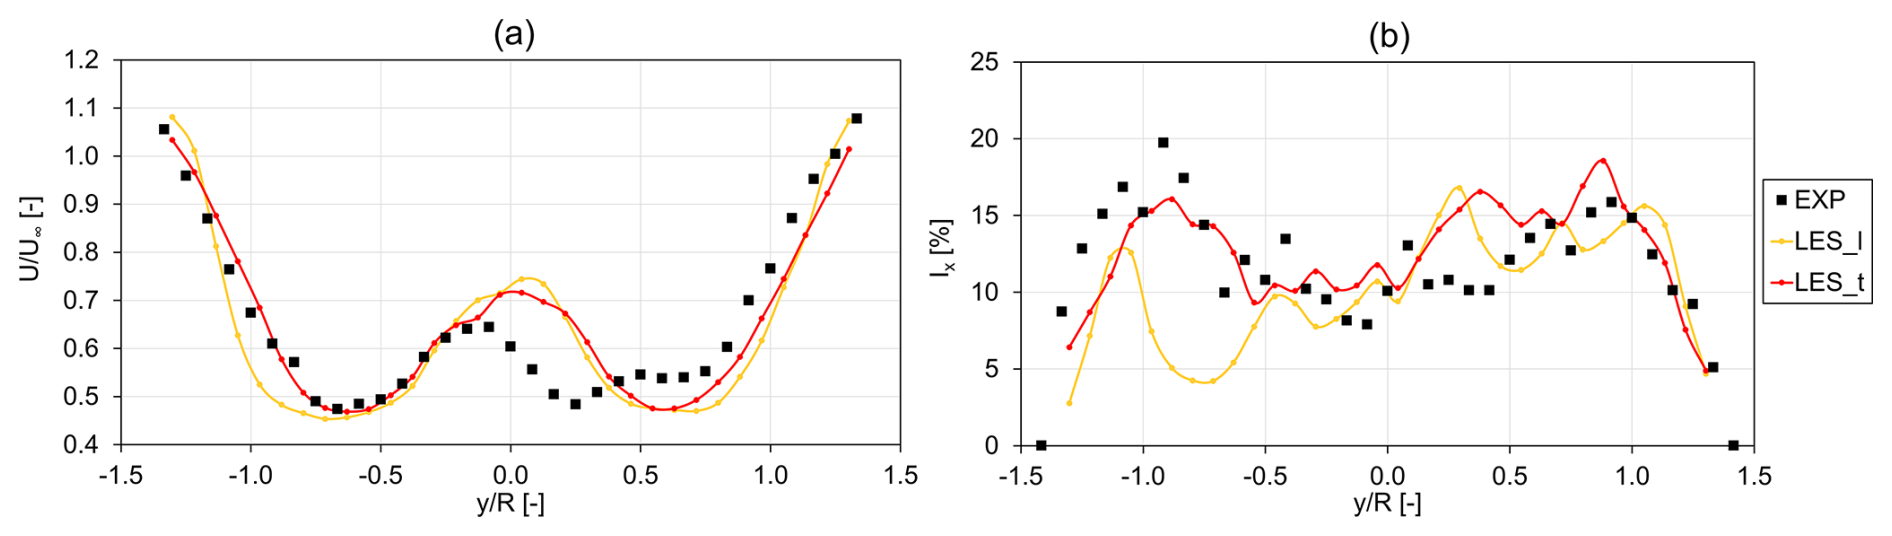
Figure 7Streamwise velocity (a) and turbulence intensity (b) sampled on a horizontal traverse at hub height located 3 D downstream of the rotor. Pitching-rotor LES simulations with turbulent and laminar inflow conditions compared to experimental data from the NETTUNO experiments (Fontanella et. al. 2024).
Figure 8Streamwise velocity (a) and turbulence intensity (b) sampled on a horizontal traverse at hub height located 5 D downstream of the rotor. Pitching-rotor LES simulations with turbulent and laminar inflow conditions compared to experimental data from the NETTUNO experiments (Fontanella et. al. 2024).
When platform pitching is included, similar conclusions can be drawn but with some notable differences. Starting from the wake profiles at a 3 D distance, good agreement – in absolute terms – is noted between LES_t and experiments. Similar to fixed cases (Fig. 7a), the inclusion of free-stream turbulence in the LES_t case still improves the agreement with the experiments but to a lesser degree. As the wake develops and moves to a 5 D distance (Fig. 8), LES simulations tend to coalesce to the same trend and become only marginally closer to the experiments (again, similar to what was noted in the fixed case in Fig. 6). Rotor pitching motion seems to have a very similar effect to free-stream turbulence, as it accelerates wake dissipation and moves the near- to far-wake transition point upstream. However, the two effects (i.e., inflow turbulence and rotor pitching) do not combine in a linear manner, as rotor motion does not significantly increase wake recovery when inflow turbulence is considered. Such a non-linear combination between inflow turbulence and platform motion is in agreement with recent observations from similar experimental test cases (Messmer et al., 2024b).
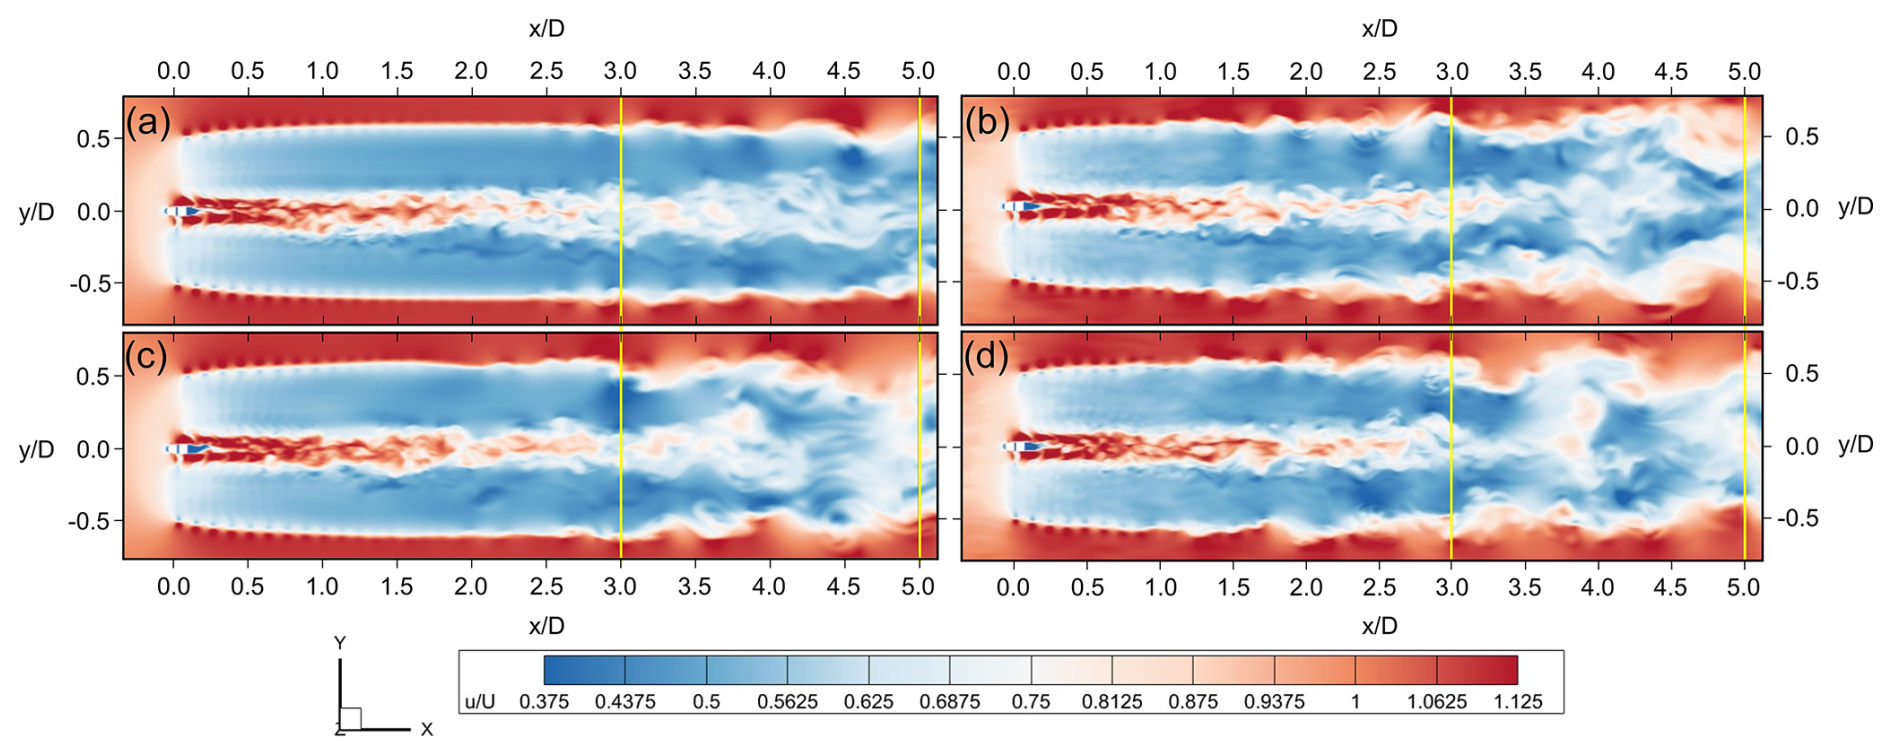
Figure 9Velocity contour for LES simulations of the fixed case with laminar (a) and turbulent (b) inflow and for the pitching case with laminar (c) and turbulent (d) inflow. Top view. Vertical lines at 3 D and 5 D. Distances are reported in diameters from the rotor center.
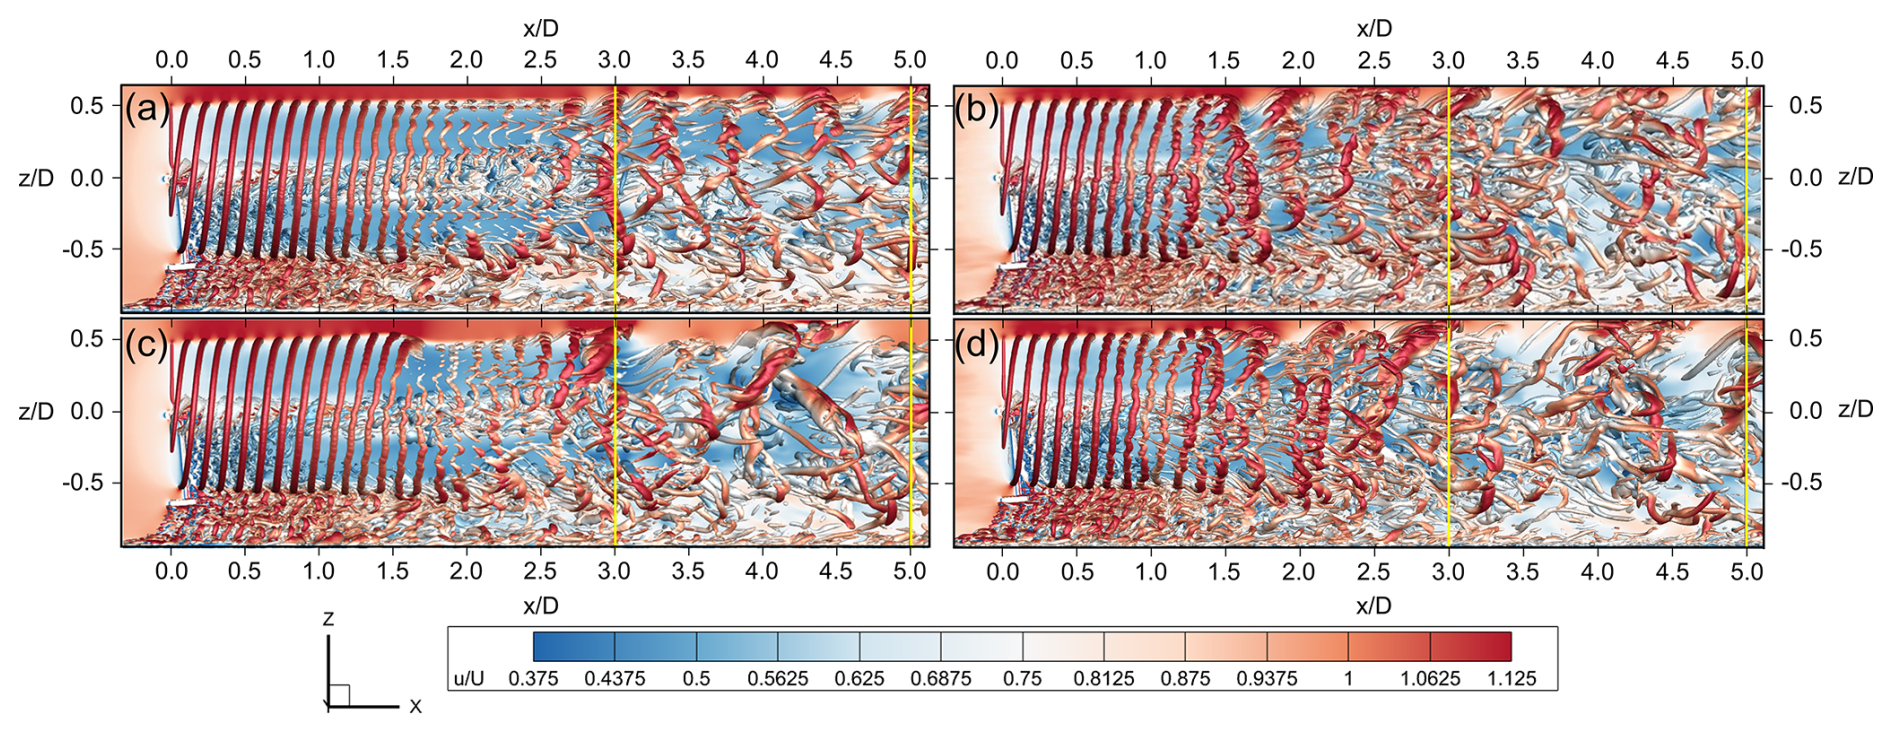
Figure 10Velocity contour and isosurfaces of the Q criterion for LES simulations of the fixed case with laminar (a) and turbulent (b) inflow and for the pitching case with laminar (c) and turbulent (d) inflow. Lateral view: vertical lines at 3 D and 5 D. Distances are reported in diameters from the rotor center.
To more clearly highlight the reasons underlying the observed differences between the LES_t and LES_l simulations, the instantaneous contours of velocity magnitude are shown in Fig. 9, while the isosurfaces of the Q criterion are shown in Fig. 10.
The effect of inflow turbulence on the wake structures of both the fixed and the pitching cases is evident in both figures. In particular, the LES results for the fixed cases (Figs. 9a, b and 10a, b) show that the tip vortex breakdown and the consequent transition from the near to the far wake are moved significantly upstream when inflow turbulence is considered. In fact, if we consider the laminar simulation (Fig. 10c), evenly spaced tip vortices can be observed up to approximately 1.8 D to 2 D downstream of the rotor. Some instabilities in these coherent structures can be seen from approximately 2 D to 3 D, where the wake starts its transition to the chaotic structures that can be seen from 3 D downstream. Such structures, appearing from 2 D onwards, appear to be somewhat similar to shortwave instabilities in the tip vortices. These instabilities have wavelengths that are similar in size to the vortex core and develop within the core itself, have been observed experimentally in helical vortices (Leweke et al., 2014), and depend on the presence of neighboring vortex filaments rather than on external perturbations on the vortex filament (Widnall, 1972, 1974). Despite these similarities, one should note that the most likely cause of the observed tip vortex structures is numerical. In fact, as discussed in Ribeiro et al. (2025), the use of a Cartesian grid could introduce small numerical disturbances, which eventually compound as the tip vortices are convected downstream. Moreover, resolving the tip vortex core, which is required to capture shortwave instabilities in ALM simulations, is extremely challenging. In fact, the vortex core radius was estimated to be approximately 2.5 % of the turbine radius for the current test case during a previous experimental campaign (Cioni et al., 2023). Resolving these structures with ALM requires an extremely fine grid resolution and an adequate kernel size, with a value of ζ=7 (see Sect. 3.3) recommended in Ribeiro et al. (2025). While the grid resolution of adopted in this study has been shown to be in line with the state of the art and is adequate to meet LES requirements in most of the domain (see Appendix B), due to the slenderness of the blade, simultaneously meeting the requirement of a small regularization kernel to generate a small tip vortex and adequate resolution in the insertion zone to avoid excessive numerical diffusion would result in an extremely significant increase in mesh elements. The actual presence of numerical instabilities in the LES_l case could be confirmed by running simulations with an increased grid resolution, which was not available for this study. Therefore, the results presented herein for the laminar case may not exactly match an equivalent experiment. Despite this uncertainty, as previously mentioned, good agreement in terms of mean streamwise velocity was found with respect to similar LES simulations (Firpo et al., 2024). The LES_l results also closely resemble numerical results from previous numerical campaigns on the current test case, where significant differences with respect to the experimental data were noted (Bergua et al., 2023). In the turbulent simulations, on the other hand, transition is significantly anticipated (Fig. 10b). Vortex pairing and leapfrogging driven by external instabilities, whereby two or more tip vortices interact and overlap with each other, can be seen at approximately 2 D downstream of the rotor and seem to be the main mechanisms that lead to earlier wake breakdown. Leapfrogging can be observed even if platform motion is included in the laminar case (Figs. 9c and 10c) and leads to an earlier and more abrupt wake breakdown than in the case where no motion is considered (Fig. 9a).
If the inflow turbulence is included in the pitching case (Figs. 9d and 10d), its influence on the behavior of the wake is noticeable even at a 1 D distance from the rotor, as can clearly be observed by the weakening of the tip vortex structures and the formation of leapfrogging vortex rings. Moreover, the behavior of the fixed and pitching case with turbulent inflow looks very similar over the first 3 D, with some minor differences in the vortex rings that arise in the far wake.
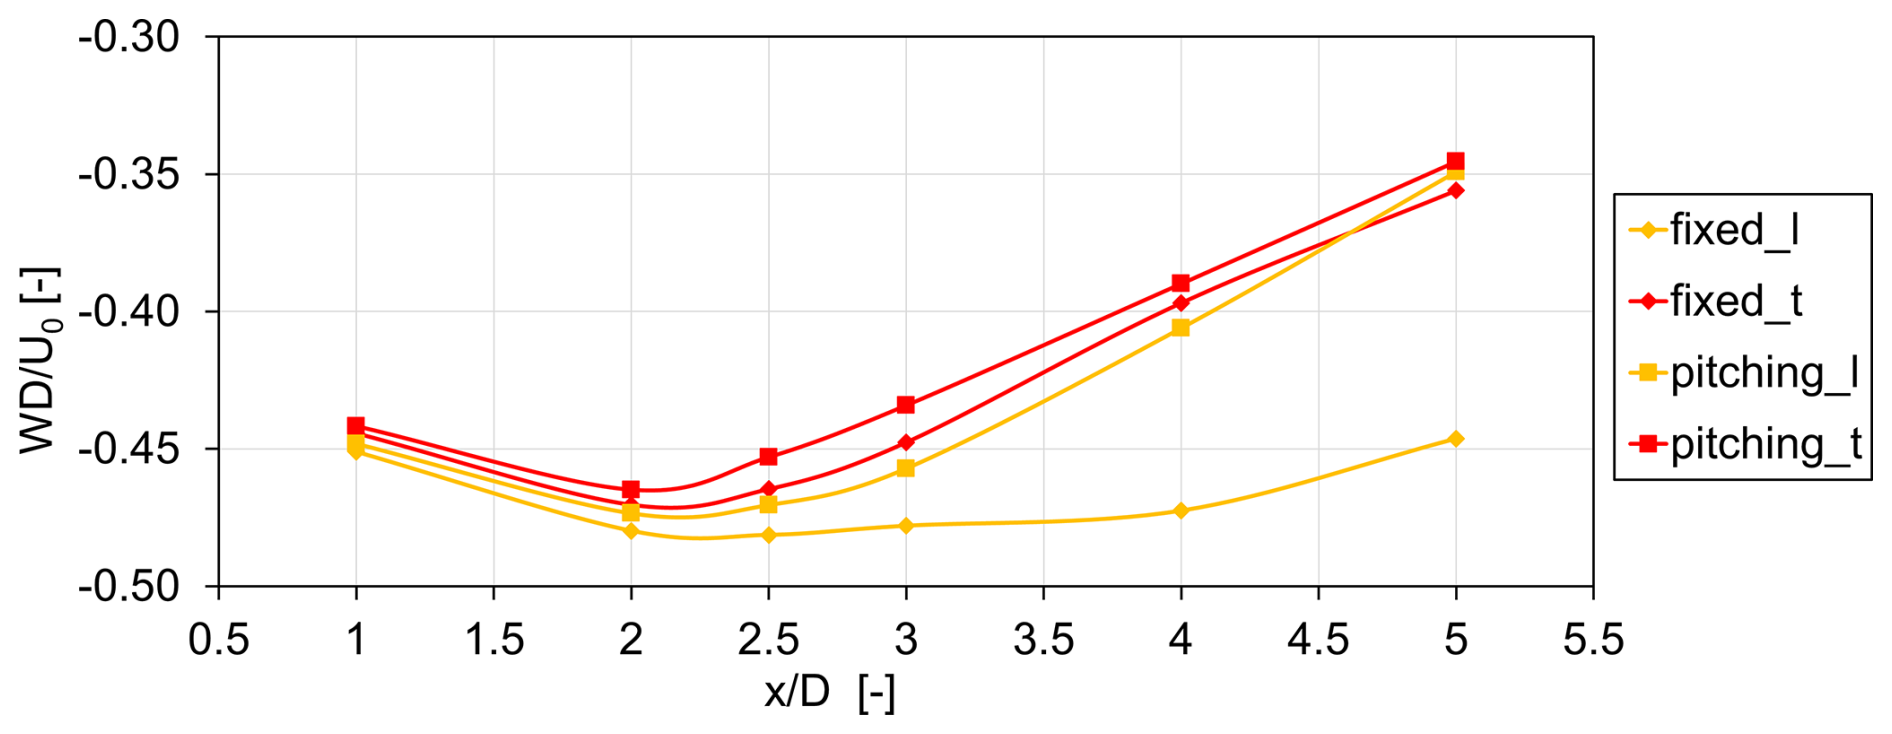
Figure 11Along-wake profile of normalized integral wake deficit with a comparison between results with a fixed platform and laminar (fixedl) or turbulent inflow (fixedt) and results with a pitching platform and laminar (pitchingl) or turbulent inflow (pitchingt).
A first conclusion from this contour is that the impact of turbulence on a floating turbine is more relevant in the first diameters of distance; beyond this length, the motion-induced turbulence governs the wake recovery. Further proof of this conclusion can be found in Fig. 11, where the integral values of the wake deficit over the entire rotor wake span at a distance of 1, 2, 2.5, 3, and 5 D from the rotor are calculated as per Eq. (3):
where the integrated area A is the rotor area.
For all numerical models, axial velocity downstream of the rotor reaches a minimum between 2 D and 3 D and then starts to recover. As expected, the laminar fixed case (fixed_l) shows the slowest recovery, with a roughly 7 % velocity increase from its minimum value at 2.5 D. It is important to note that, despite the minimum value being reached at 2.5 D, the axial minimum velocity stays roughly the same at 2.5 D and 3 D in the fixed_l case, and proper recovery starts from 4 D downstream. On the other hand, the point where axial velocity starts increasing and the wake starts recovering moves significantly upstream when inflow turbulence and rotor motion are included. In fact, the point where minimum velocity is recorded is moved upstream to 2 D for both the laminar and the turbulent pitching cases (pitching_l/pitching_t) and for the turbulent fixed case (fixed_t). Moreover, while rotor motion significantly increases wake recovery in laminar simulations, the effect is substantially diminished in turbulent cases. Indeed, when turbulent simulations are considered, rotor motion appears to move the wake transition point slightly upstream, but the trend in axial velocity increases downstream of this point is similar. Interestingly, if the pitching_l simulation is compared to turbulent cases, despite reaching a lower minimum speed at 2 D, it shows stronger recovery from 3 D downstream. This trend can be related to the behavior shown by the wake at 2 D and is highlighted by Fig. 10c: in fact, in the absence of free-stream turbulence, the wake breakdown is more abrupt, and, although it starts further downstream than in the turbulent cases, it shows steeper wake recovery.
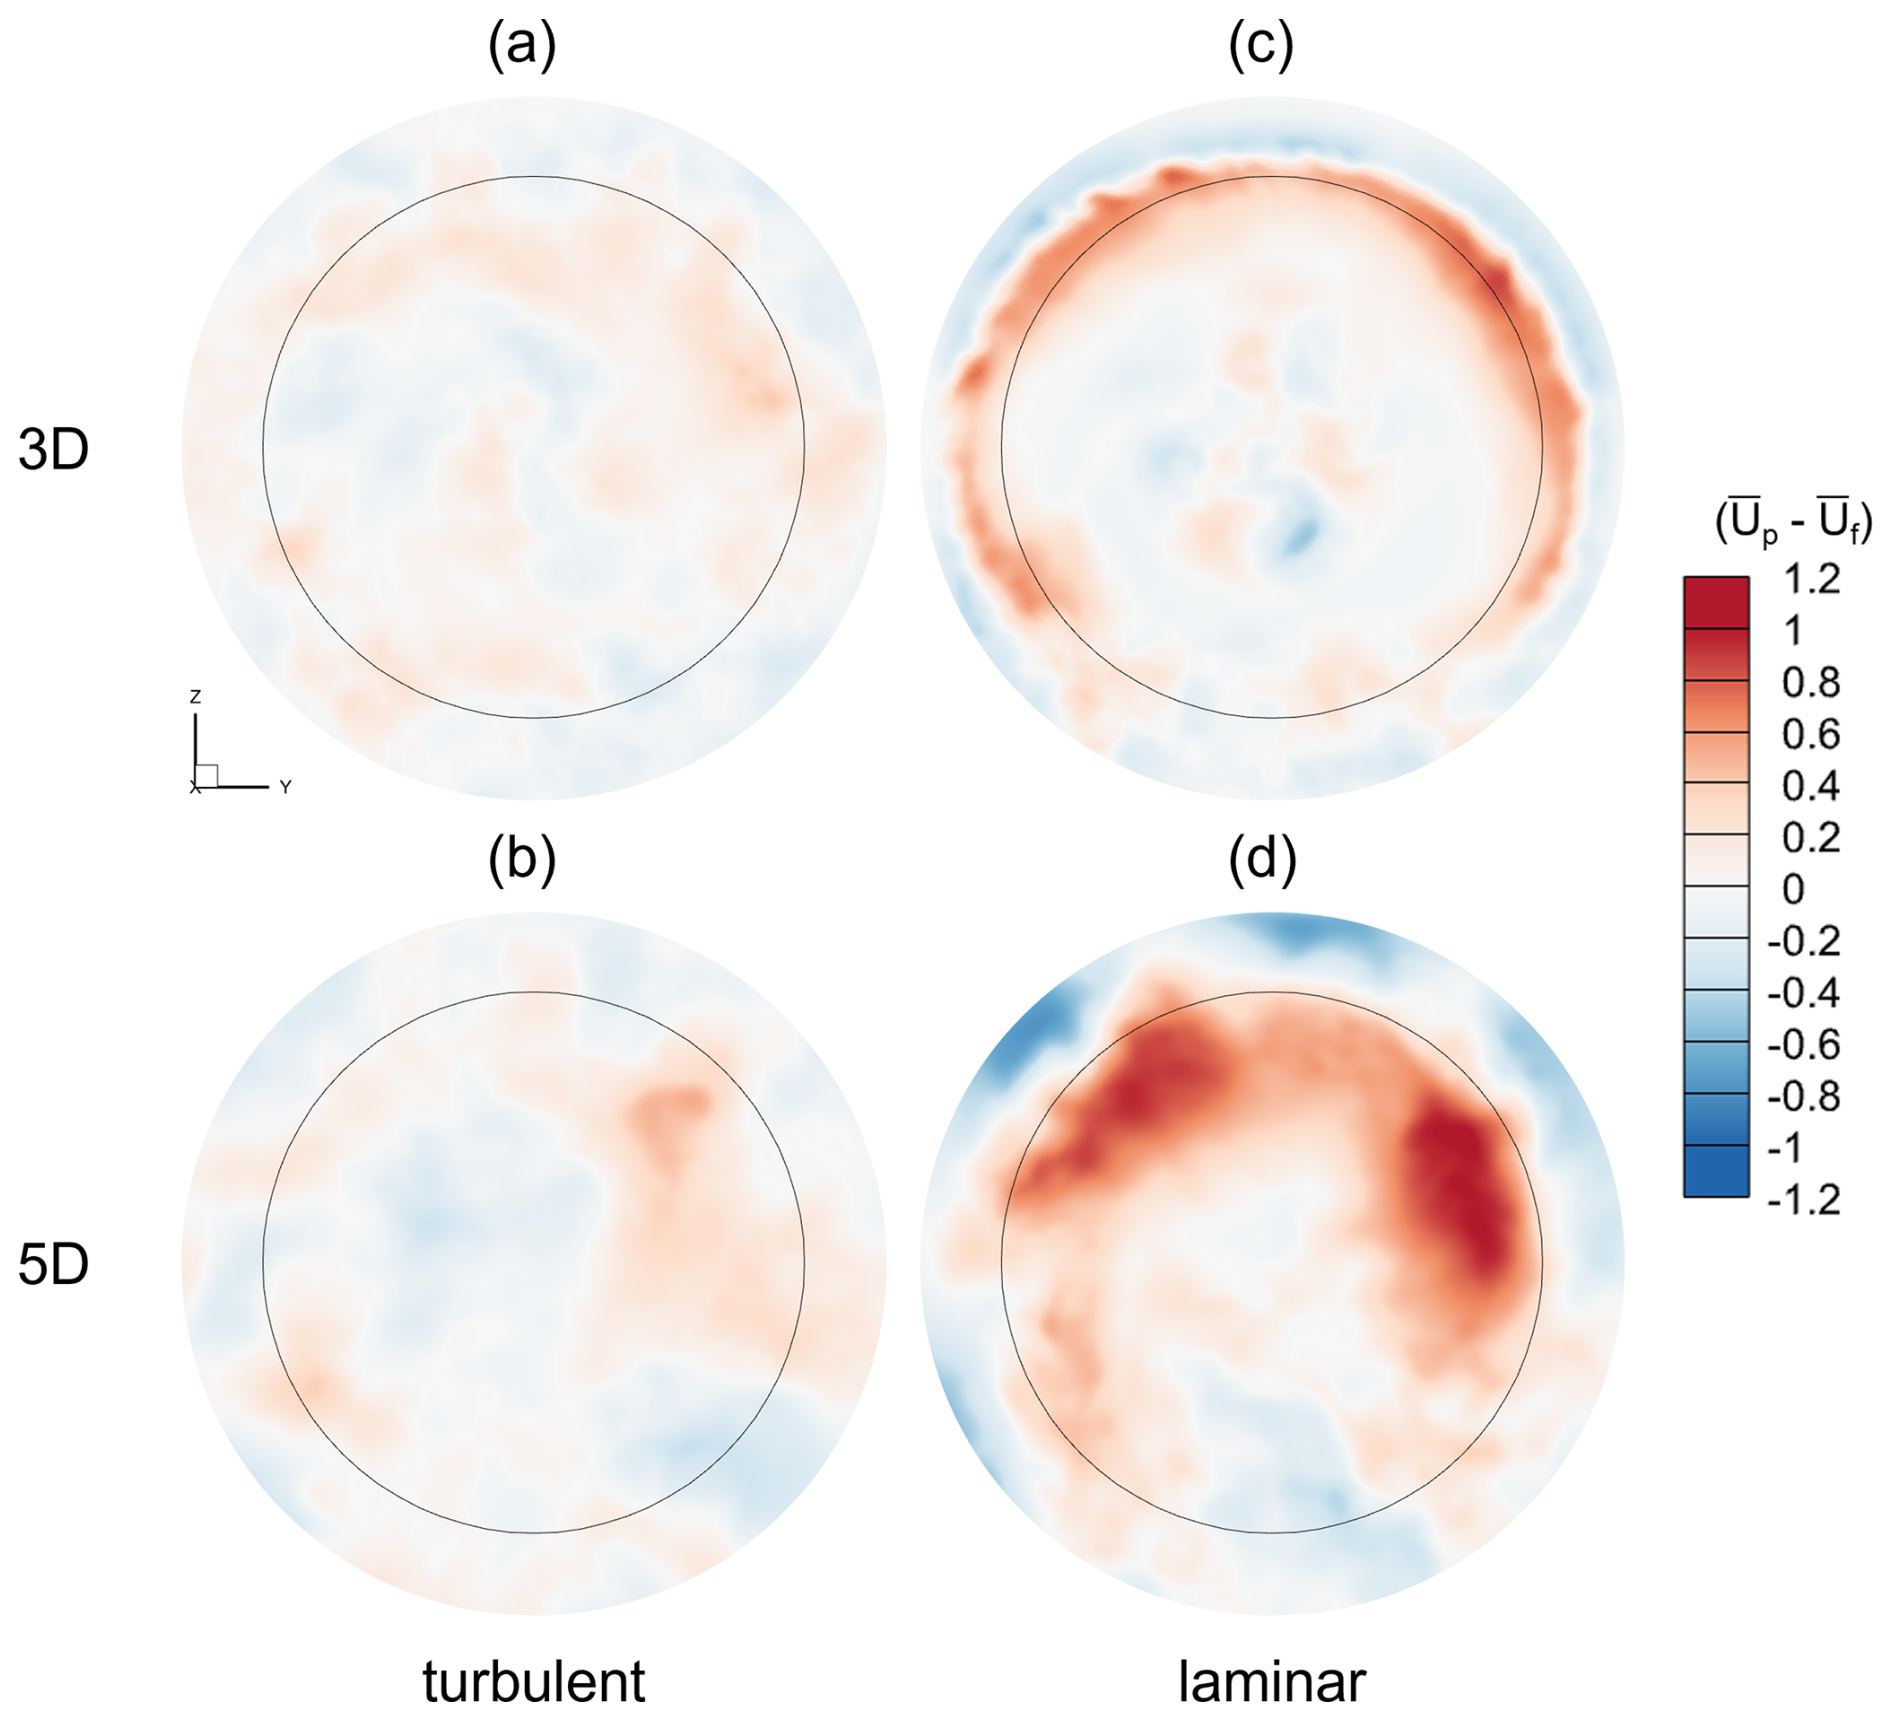
Figure 12Contours of differential wake deficit between the pitching and the fixed LES turbulent simulations, averaged over the last 5 s of the simulations for all the cases except the pitching turbulent one, which is averaged over the last six pitch cycles. The rotor trace is indicated with the black circle.
Additional insights can be provided by analyzing the spatial distribution of axial velocity, from which the integral values shown in Fig. 11 are derived. The difference in mean axial velocity between the pitching and the fixed-bottom cases with and without the inclusion of free-stream turbulence is shown in Fig. 12.
In laminar cases, a higher velocity for the pitching case can be seen in the shear layer at 3 D and in the upper part of the rotor area at 5 D. At 3 D, this is caused by the faster breakdown of the tip vortices, while at 5 D it indicates a faster transition from the near to the far wake. On the other hand, in the case of a turbulent inflow, the difference between the fixed and pitching cases is once again far weaker, with distributed spots of higher recovery for the pitching cases.
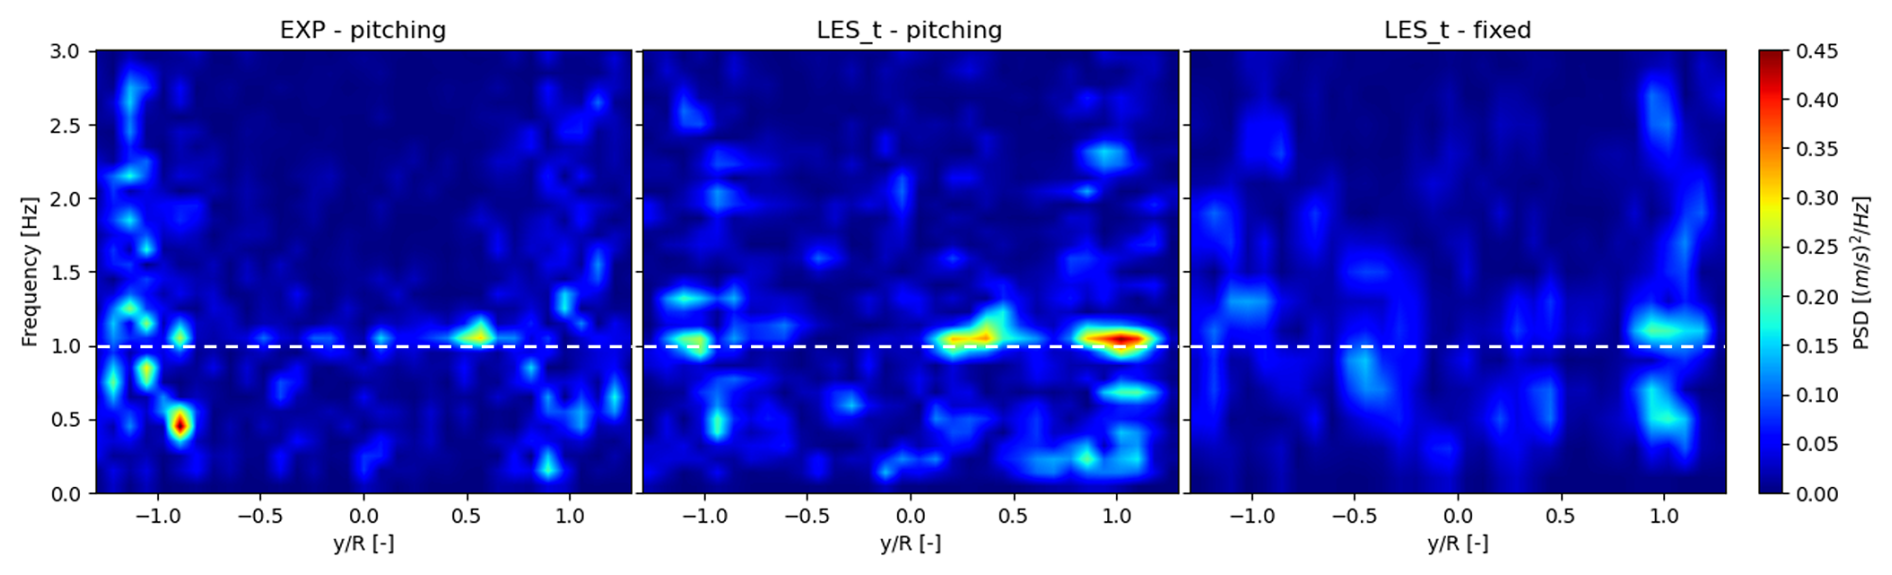
Figure 13Pitching case with contours of power spectral densities (PSDs) calculated from the velocity field sampled at the 3 D horizontal traverse; results from experiments (EXP – pitching) and LES with turbulent inflow (LES_t – pitching) compared to the fixed case (LES_t – fixed). The motion frequency is highlighted with the dashed lines.
While platform motion does not appear to have a significant impact in terms of mean velocity 3 D and 5 D downstream of the rotor plane, velocity oscillations in the wake appear to be significantly affected by motion. From the perusal of PSD contours (Fig. 13), a significant response at the motion frequency in the LES_t pitching case is apparent. In addition, the response is not symmetric if the PSDs for positive and negative values are compared. This trend can also be seen in experimental data. While a definitive explanation has not been determined, it is reasonable to assume that the asymmetry stems from the rotor pitching motion, which introduces variations in the angle of attack, depending on the blade azimuth and rotor position during the pitching cycle due to the clockwise rotation of the blades. These two factors combined results in different angle-of-attack variations on the left and right sides of the rotor, which may lead to the observed asymmetry. It must be noted that differences between the two sides of the wake are not limited to the velocity spectra, as slight differences in mean velocity values can also be noted at 3 D between the two sides of the rotor in Fig. 7. Nevertheless, oscillations at the frequency of 1 Hz – corresponding to the motion frequency of the platform – can be seen even in the LES_t fixed case, especially around , although they are much smaller than the oscillations in the pitching case. A 1 Hz peak is also noted in the inflow velocity spectrum, which may explain why this frequency can be seen in the fixed case. In addition, the superposition of the inflow velocity variation at 1 Hz with the platform motion at the same frequency may partially explain why 1 Hz rotor pitch oscillations were found to have a larger effect on wake characteristics than other frequencies in the NETTUNO experimental campaign (Fontanella et al., 2025) and in the UNAFLOW project (Fontanella et al., 2021). In fact, the highest velocity oscillations in the wake were observed when the rotor oscillated in surge at the frequency of 1 Hz in the UNAFLOW campaign, where the wind tunnel was operated under the same operating conditions as those used in this study. A possible interpretation is that a sort of resonance is produced by this superposition of wind turbulence and platform motion. No significant oscillations were noted at the rotor frequency of 4 Hz and at the blade-passing frequency of 12 Hz; as such, the spectrum is shown up to 3 Hz in Fig. 13. The evolution of the velocity spectra in the wake 5 D downstream of the rotor is discussed in Sect. 4.5 and shown in Fig. 30.
In conclusion, rotor pitching motion is found to significantly anticipate tip vortex breakdown and near- to far-wake transition when laminar inflow is considered. Despite the fact that the pitching motion introduces velocity oscillations in the wake, the benefits in terms of increased mixing and mean wind speed downstream of the rotor are clear. When inflow turbulence is considered, however, even with a moderate 1.5 % intensity, the effect of rotor pitching motion is found to be greatly diminished. In fact, inflow turbulence, similarly to rotor pitching, moves the near- to far-wake transition point upstream. In these conditions, the effect of rotor pitching is still noticeable but greatly diminished. Accounting for inflow turbulence in future analyses of FOWTs is therefore essential.
4.3 Solving FOWT wake under turbulence: LES or URANS?
LES-based results, discussed in Sect. 4.2, were able to provide insights into FOWT wake development in the presence of inflow turbulence but came at a significant computational expense; i.e., the pitching case with turbulent inflow required a total computation time of 37 d for 19 s of simulated physical time. Reducing computational costs while maintaining accuracy in reproducing the involved physics would enable future analyses, especially for industrial projects. Therefore, the following sections compare LES simulations to equivalent URANS simulations to evaluate to what extent these methods can still be used to resolve the complex wake dynamics of an FOWT in the presence of inflow turbulence.
Figure 14Fixed-case wake profiles of velocity at 3 D for horizontal (a) and vertical (b) traverses from URANS and LES simulations; comparisons with experiments (Fontanella et al. 2024).
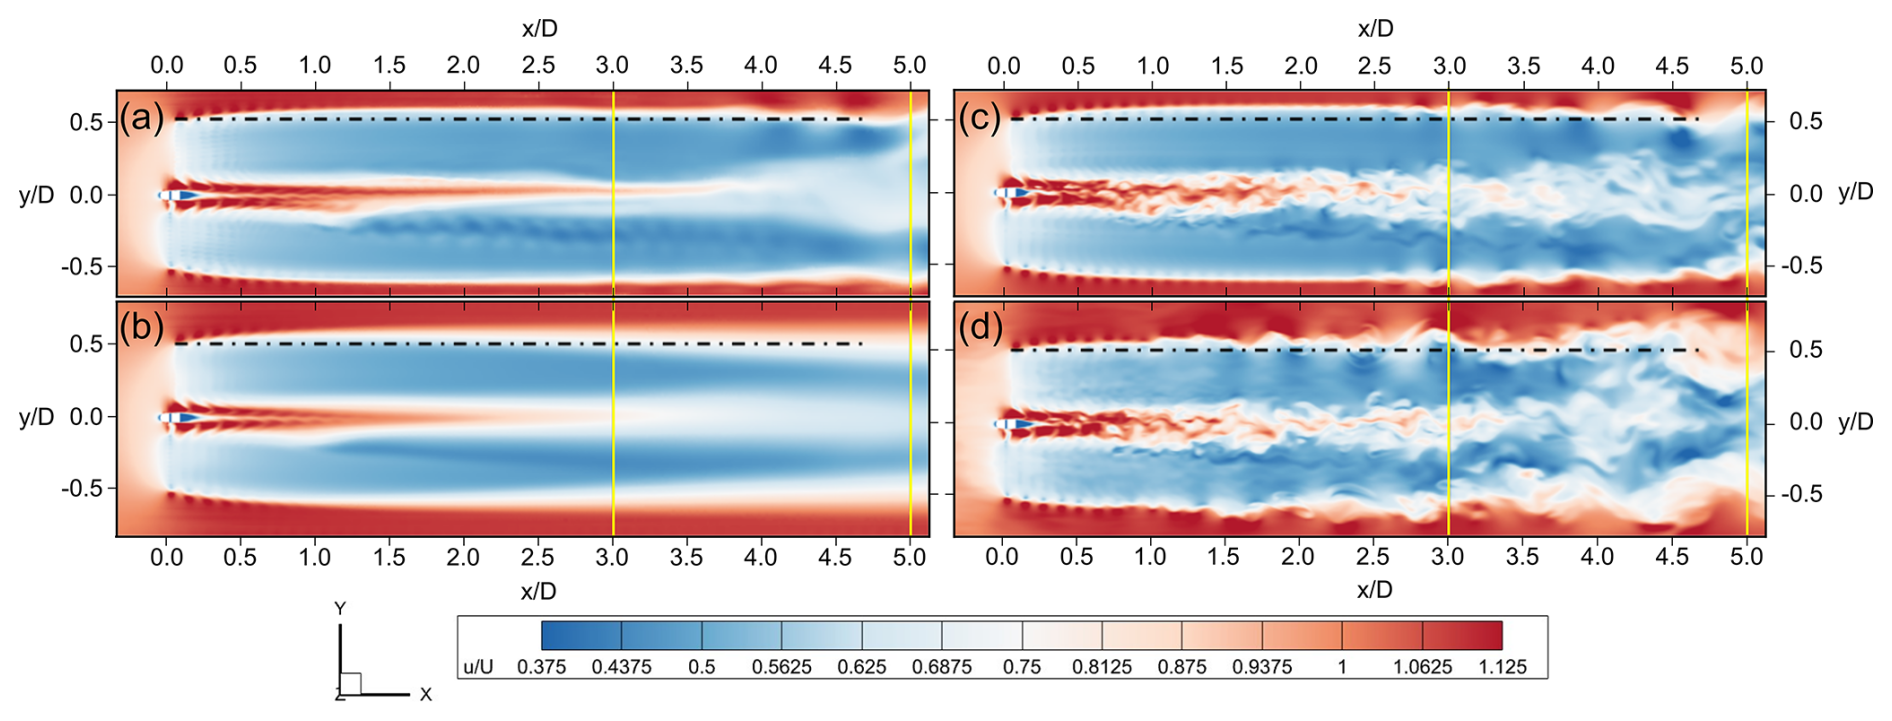
Figure 15Fixed case. Velocity contour for URANS with laminar (a) and turbulent (b) inflow and LES with laminar (c) and turbulent (d) inflow. Top view: vertical lines at 3 D and 5 D. The dashed line represents the upper limit of the turbine's swept area. Distances are reported in diameters from the rotor center.
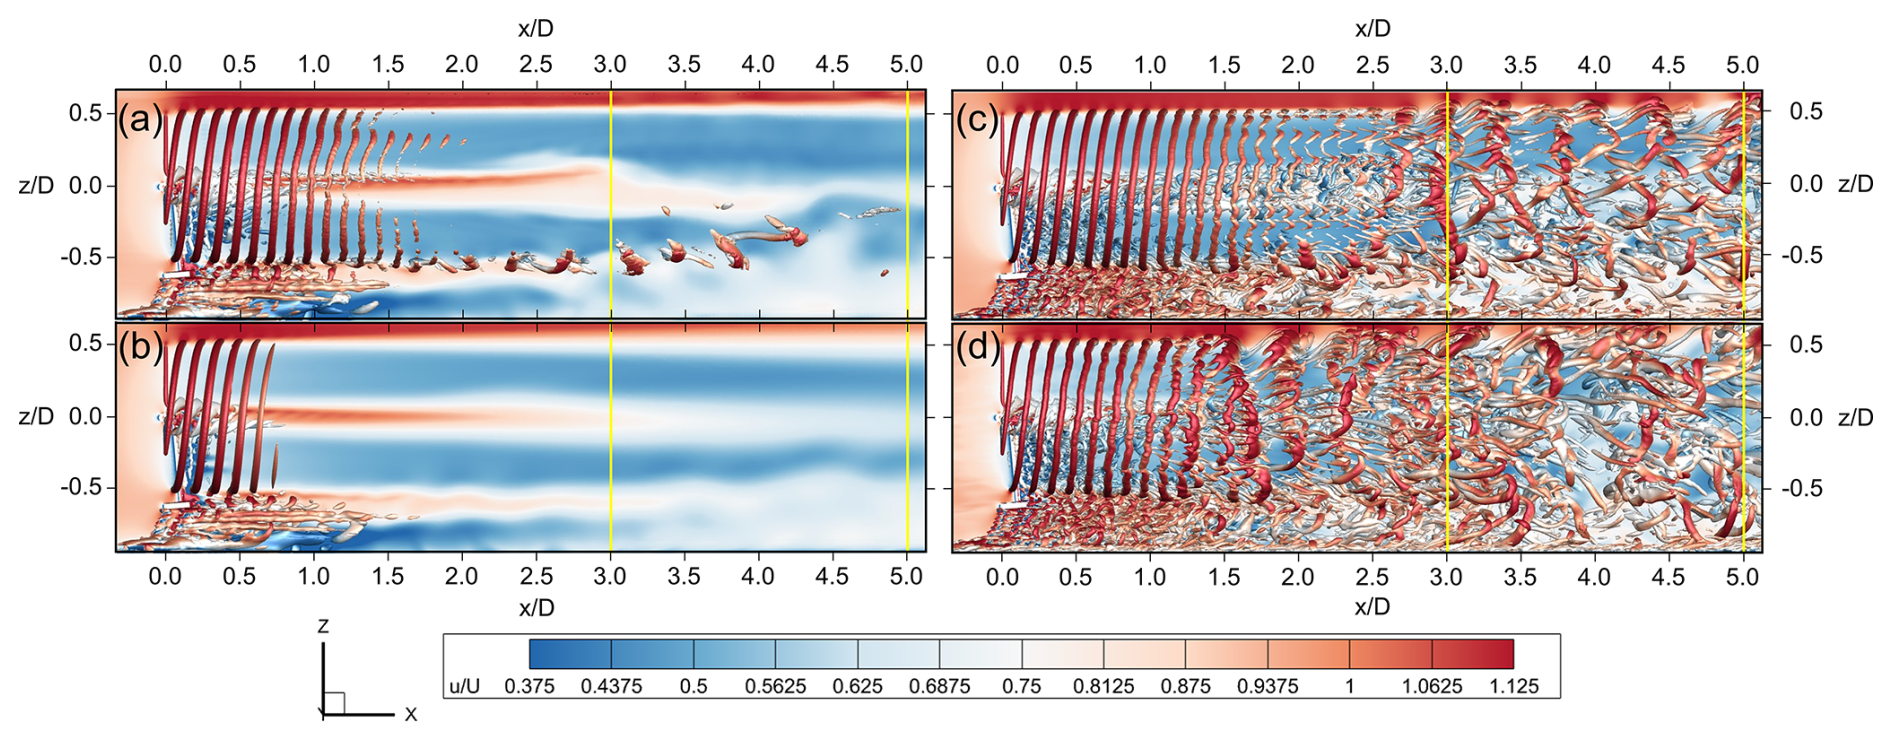
Figure 16Fixed case. Velocity contours and isosurfaces of the Q criterion for URANS with laminar (a) and turbulent (b) inflow and LES with laminar (c) and turbulent (d) inflow. Lateral view: vertical lines at 3 D and 5 D. Distances are reported in diameters from the rotor center.
4.4 Fixed case
Time-averaged wake velocity profiles along the horizontal (left) and vertical (right) axes are shown in Fig. 14, while contours of the flow field (in terms of velocity variation with respect to undisturbed flow) on the respective planes are shown in Figs. 15 and 16. Figure 14 shows that the URANS approach is able to qualitatively predict results similar to those generated by LES. Moreover, in this case, improved agreement with respect to experiments can in fact be observed when inflow turbulence is considered both in the horizontal direction (Fig. 14a) and in the vertical direction (Fig. 14b), especially in the top shear layer. Smaller differences between the models can instead be seen in the lower shear layer, where significant interaction between the rotor and robot wake takes place (as can be observed in more detail from the velocity contours in Fig. 16). Agreement between numerical models and experiments is nevertheless considered satisfactory in this region.
With this in mind, it is important to remark that the evaluation of the potential disturbance on the main rotor wake induced by a robot similar to the one used herein (needed to reproduce a floating-like motion in wind tunnels) is meaningful when it comes to accurately reproducing the experiments with simulations. From a broader perspective, such an effect is worth consideration in any FOWT system, where the substructure generally has considerable dimensions and a non-aerodynamic shape and is thus able to potentially influence the rotor wake.
Shifting attention to contours, good agreement can be observed between URANS and LES in laminar conditions (Fig. 15a and c). Despite the fact that URANS simulations appear to be able to capture the most relevant flow phenomena close to the rotor, they are apparently not able to preserve the same flow structures downstream of the rotor highlighted by LES. Similar considerations also apply to the turbulent case (Fig. 16a and b). However, interestingly, the effect of free-stream turbulence is also visible in the URANS simulations, with the tip vortices in Fig. 16a persisting in the flow much longer in the laminar case than in the turbulent one.
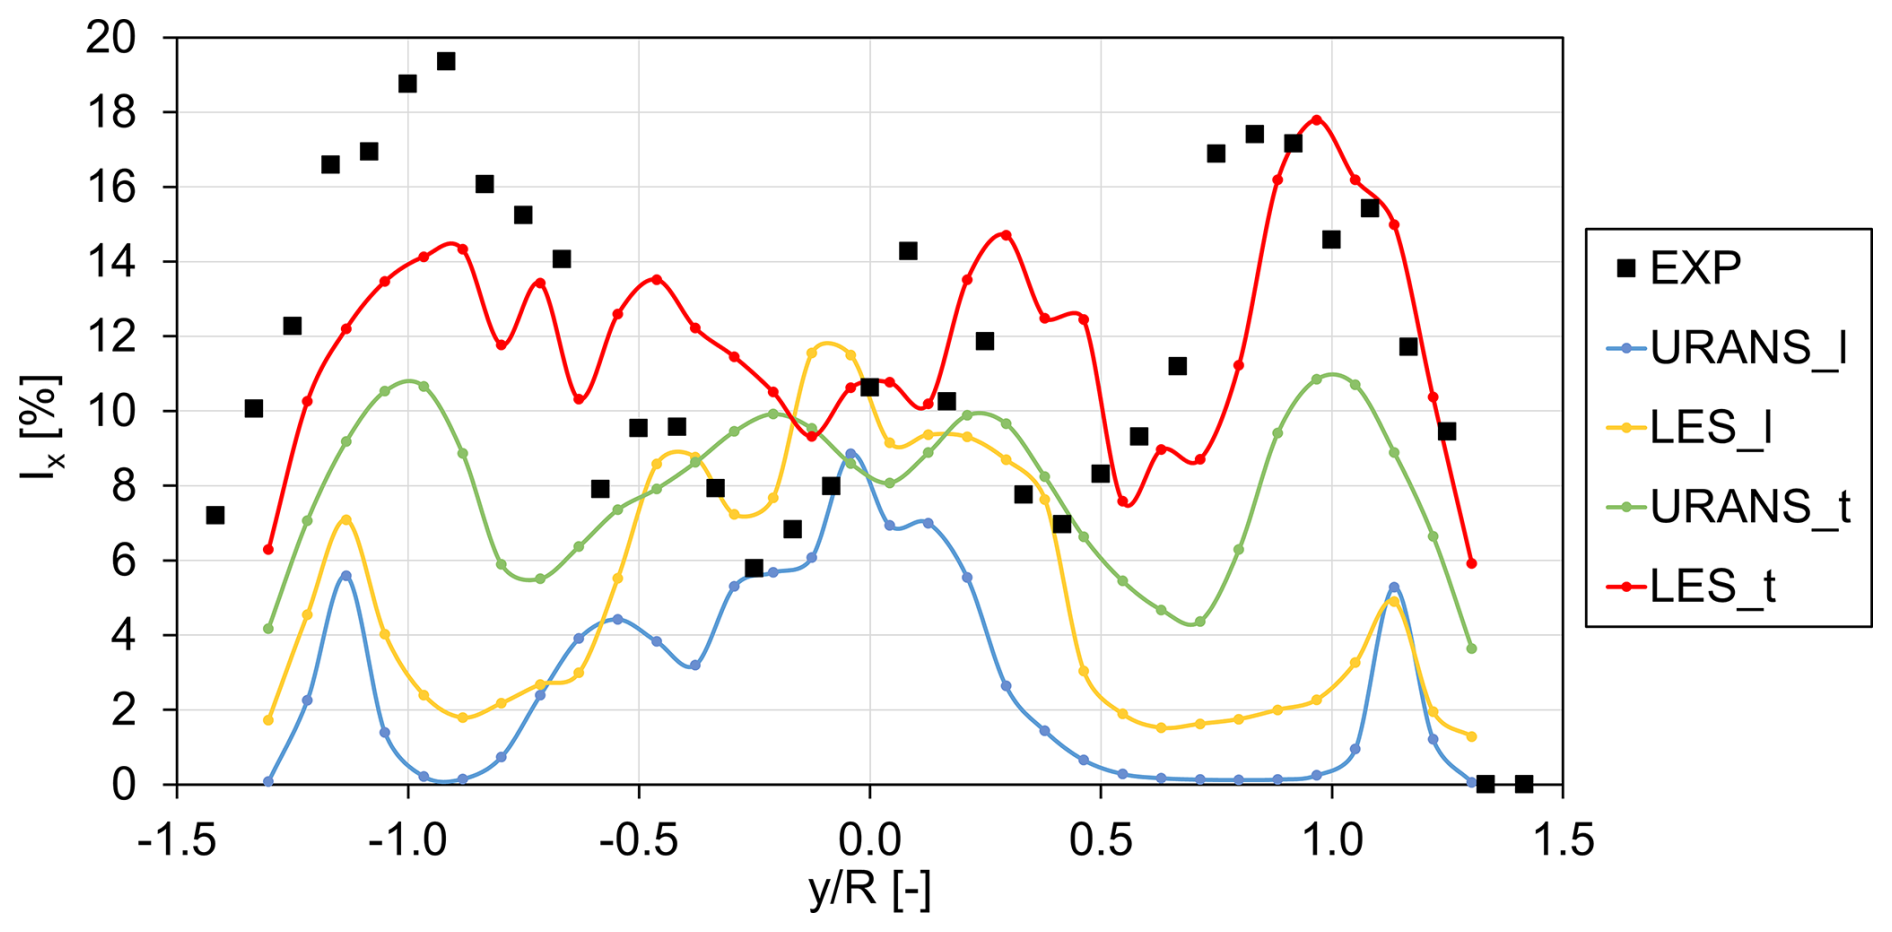
Figure 17Streamwise turbulence intensity at horizontal traverse at 3 D from the rotor plane in the fixed case; comparisons with experiments (Fontanella et al., 2024).
Additional evidence of the effects of including free-stream turbulence in numerical models can be gathered from Fig. 17, where the streamwise turbulence intensity Ix is compared with the values from LES calculated as per Eq. (2) and the ones from URANS calculated as per Eq. (4):
In the equation, the subscript res refers to resolved turbulence, calculated by normalizing the streamwise velocity fluctuations ) by the mean velocity , while mod refers to modeled turbulence, quantified based on RANS-based turbulent kinetic energy (TKE). The turbulence intensity calculated from LES simulations is indeed approximated to a fully resolved one, as the contribution of the sub-grid-scale kinetic energy on mean Ix is negligible (≈ 1 %). Upon examination of Fig. 17, the increase in Ix when free-stream turbulence is included in the URANS simulations is apparent. This trend matches the one noted in LES simulations but to a lesser extent, as Ix is underestimated in the outer shear layers in the URANS_t simulation.
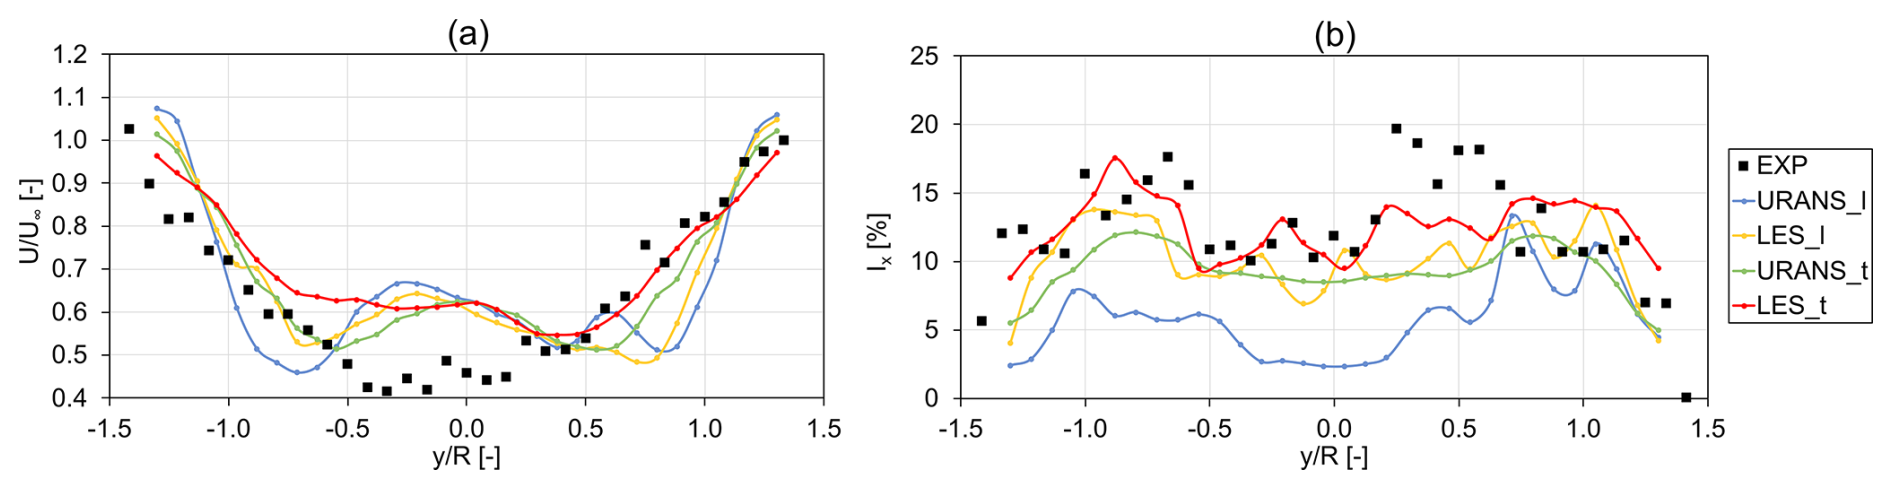
Figure 18Streamwise velocity (a) and turbulence intensity (b) sampled on a horizontal traverse at hub height located 5 D downstream of the rotor. Fixed-rotor LES and URANS simulations with turbulent and laminar inflow conditions compared to experimental data from the NETTUNO experiments (Fontanella et. al. 2024).
Significant differences in terms of the mean wake profile (Fig. 18a) between the numerical models and the experiments can finally be seen in the central portion of the wake between values of −0.5 and 0.5. In this area, URANS results are comparatively similar to LES ones, pointing out that some phenomena taking place in reality are here not captured by the numerical modeling per se.
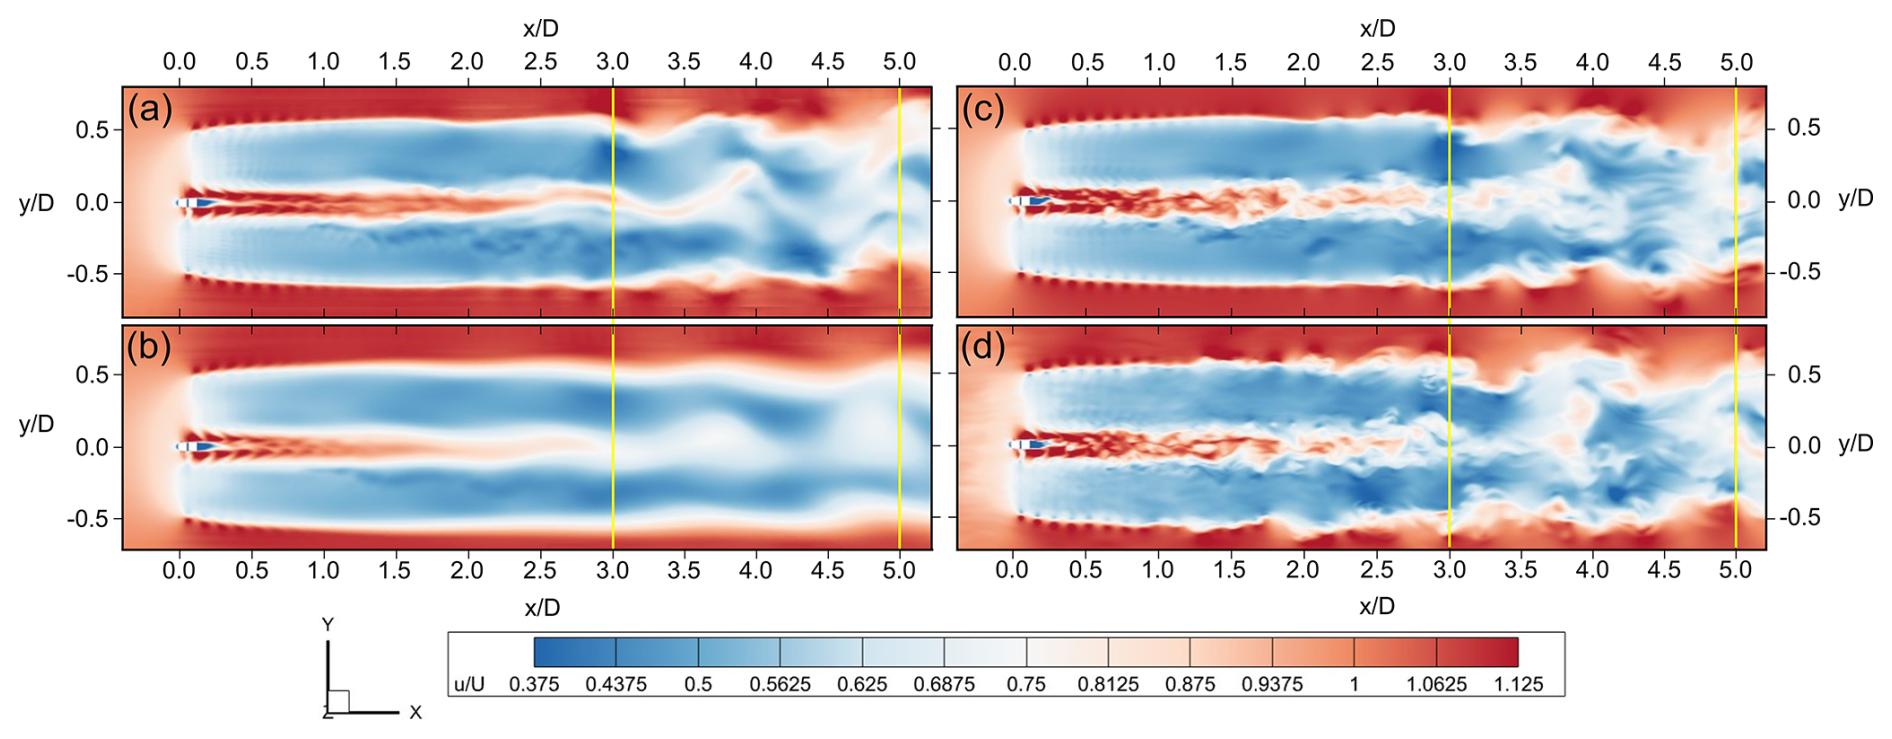
Figure 19Pitching case with velocity magnitude for URANS with laminar (a) and turbulent (b) inflow and LES with laminar (c) and turbulent (d) inflow at . Top view at hub height: vertical lines at 3 D and 5 D. Distances are reported in diameters from the rotor center.
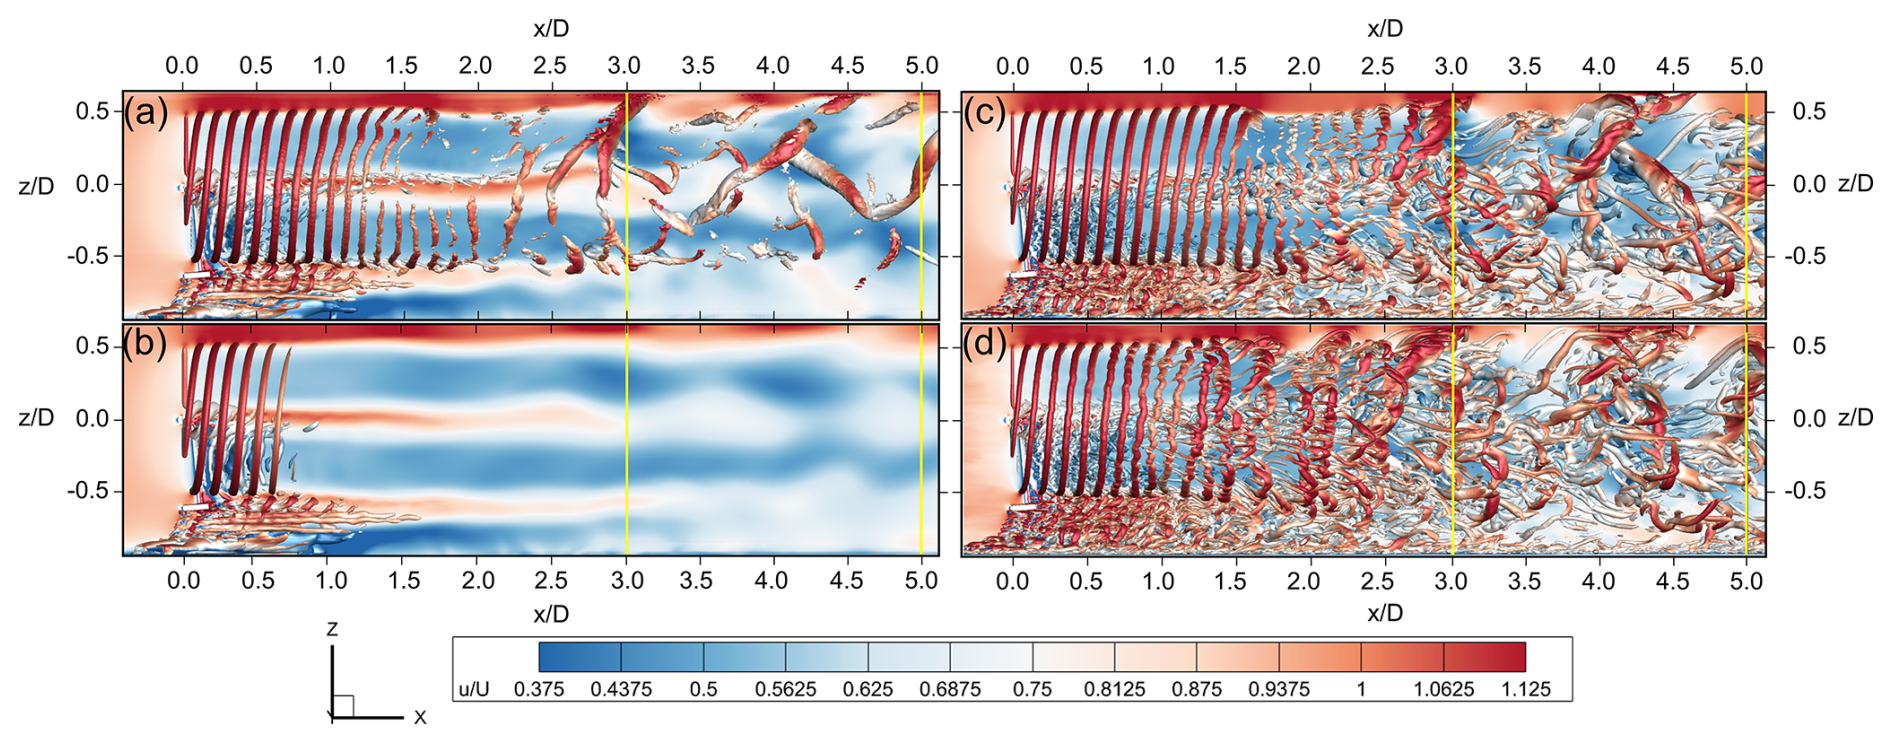
Figure 20Pitching case with velocity magnitude and isosurfaces of the Q criterion for URANS with laminar (a) and turbulent (b) inflows and LES with laminar (c) and turbulent (d) inflows. Lateral view: vertical lines at 3 D and 5 D. Distances are reported in diameters from the rotor center.
4.4.1 Pitching case
Analyses shown in Sect. 4.4 have shown that URANS simulations can still provide reliable results whenever mean quantities are concerned, even if turbulence is included. To evaluate whether these considerations hold true in the case of FOWT-like motions, simulations with the rotor undergoing pitching motions are compared in this section. Similar to the previous case, Figs. 19 and 20 first compare the contours of relative velocity, with and without turbulence, in the horizontal and vertical planes, respectively.
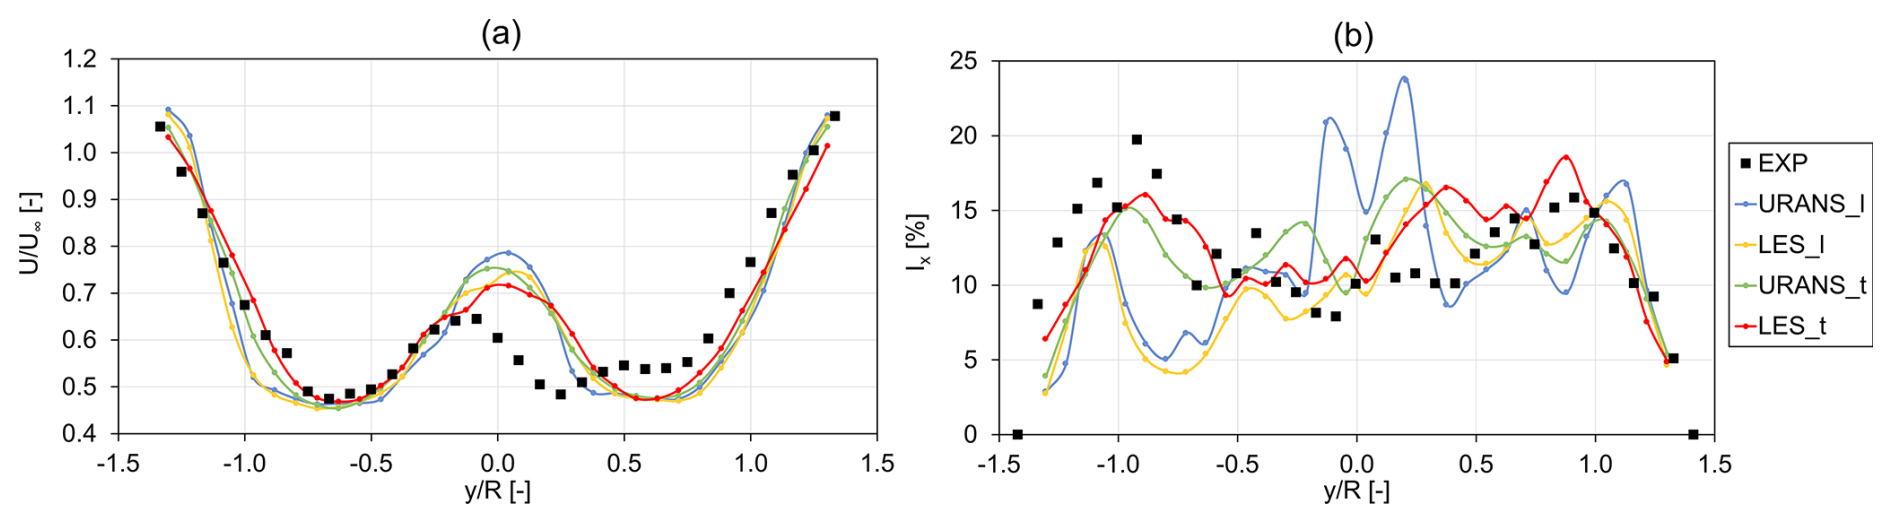
Figure 21Pitching case mean velocity (a) and turbulence intensity (b) profiles of the wake 3 D from the rotor; comparisons between experiments and simulations with turbulent and laminar inflows.
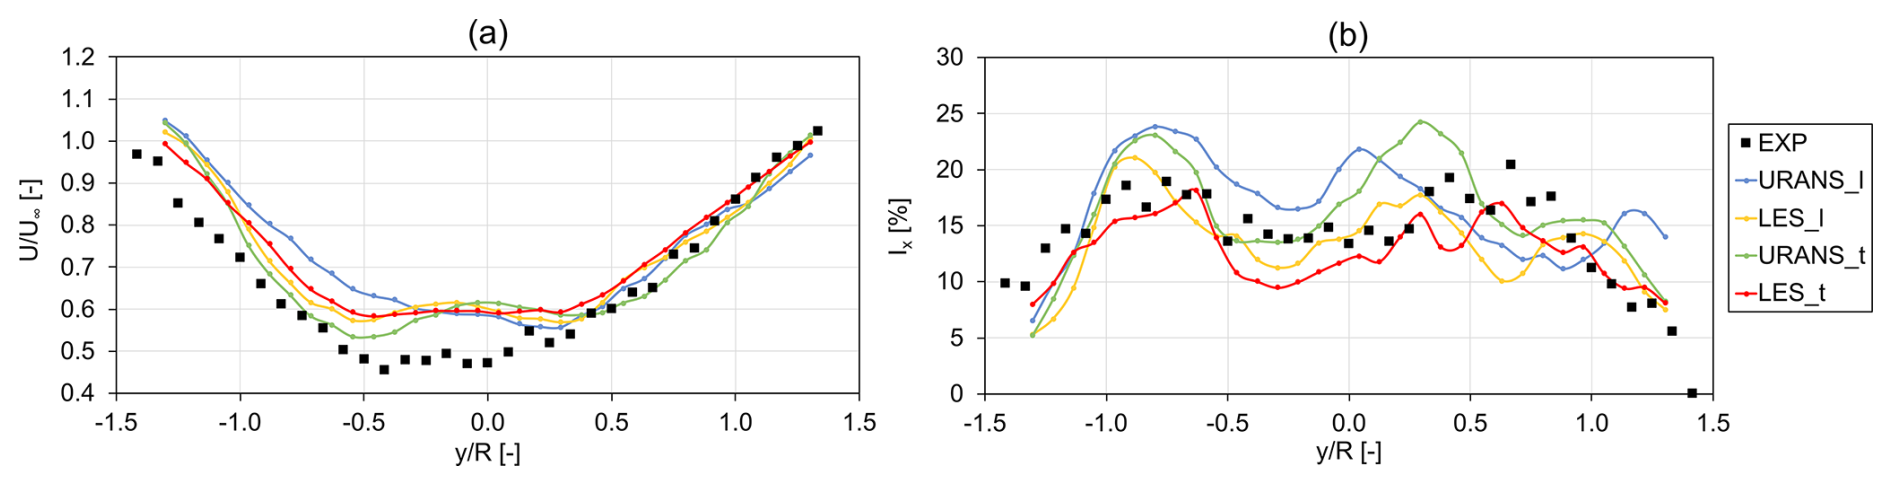
Figure 22Mean streamwise velocity (a) and turbulence intensity (b) at 5 D from the rotor plane for the pitching case; comparisons between experiments and simulations with turbulent and laminar inflows.
Upon examination of Fig. 19a and b, it is apparent how turbulence has a significant influence on the wake even in the case of URANS approaches, with the URANS_t case showing more significant mixing, a less abrupt shear layer, and a quicker decay of the vortical structures. In the URANS_l case, on the other hand, the absence of inflow turbulence leads to a slower vortex breakdown, with large macrostructures that persist throughout the wake; some of these structures are quite similar to those predicted by the LES_l cases (Fig. 20a–c), with the most recognizable ones being the upper vortex at 3 D and the two diagonal vortices between 3.5 D and 4.5 D. The persistence of such macrovortices could also explain the high localized radial gradients in the shear region, with regions with unexpectedly high speed like the one in the lower-right flow region of Fig. 19a. Looking at turbulent cases, one can notice instead the similarity between URANS and LES velocity contours (Fig. 19b–d) in the main wake patterns, with the exclusion of the external shear regions, where LES can model and resolve the interactions between the turbulent inflow and the pitching turbine wake in a more detailed way. These considerations are more evident if the isosurfaces of the Q criterion (Fig. 20b–d), i.e., the second invariant of the velocity gradient tensor as defined by Dallmann (1983), are compared. As a general remark, velocity contours in the case of a moving turbine look much more similar than those in the fixed case, as further proved by the mean profiles of velocity and turbulence intensity at 3 D and 5 D, shown by Figs. 21 and 22, respectively. Fair agreement is noted for all numerical models except for some regions (e.g., from −1 D to −0.5 D), where the inclusion of the free-stream turbulence brings results closer to the experiments.
Figure 23Standard deviation of streamwise velocity at 5 D from the rotor in the pitching case; comparisons between experiments and simulations with turbulent and laminar inflows.
Interestingly, as the wake develops and moves to a 5 D distance (Fig. 22b), URANS simulations tend to overestimate the turbulence intensity in most of the wake, while LES simulations are closer to experimental results. At first glance, this outcome could seem counterintuitive if compared with the fixed case, where the streamwise turbulence was always underestimated by URANS simulations. The turbulence induced by the platform motion, superimposed onto the modeled inflow turbulence of the URANS_t case, is accurate in terms of turbulence intensity in the near wake but causes overproduction in the far wake. Similar considerations apply for the URANS_l case, except for some localized overshoots and undershoots noticed at 3 D. In any case, in both LES and URANS approaches, relatively little difference is noted in the wake in terms of turbulence intensity between laminar and turbulent inflow conditions. In terms of mean velocity, the inclusion of free-stream turbulence improves agreement of URANS simulations with experiments at 3 D (Fig. 21a), while some inconsistencies on the left side of the wake for LES_t and the URANS_l simulation can be seen at 5 D (Fig. 2a). In particular, the higher wake recovery in the URANS_l simulation with respect to the URANS_t case is counterintuitive, as turbulence should increase recovery rather than diminish it. For a more in-depth analysis, the standard deviations of the axial velocity are shown in Fig. 23, splitting velocity variations from the modeled turbulence. The extrapolation of the standard deviations shows a high variability in the velocity in the −1.0 < < −0.5 region. Notably, the URANS_l case is much higher than the URANS_t case and more in line with the LES results. This peculiar behavior is likely linked to the steeper shear layer of the URANS_l case with respect to the URANS_t one, as shown in Fig. 19a. In fact, as the wake starts meandering and pulsing as a consequence of the rotor pitching motion, sampling points at the wake's edge start to move in and out of the wake, causing larger velocity fluctuations than in the case with inflow turbulence, where the wake shear layer is wider.
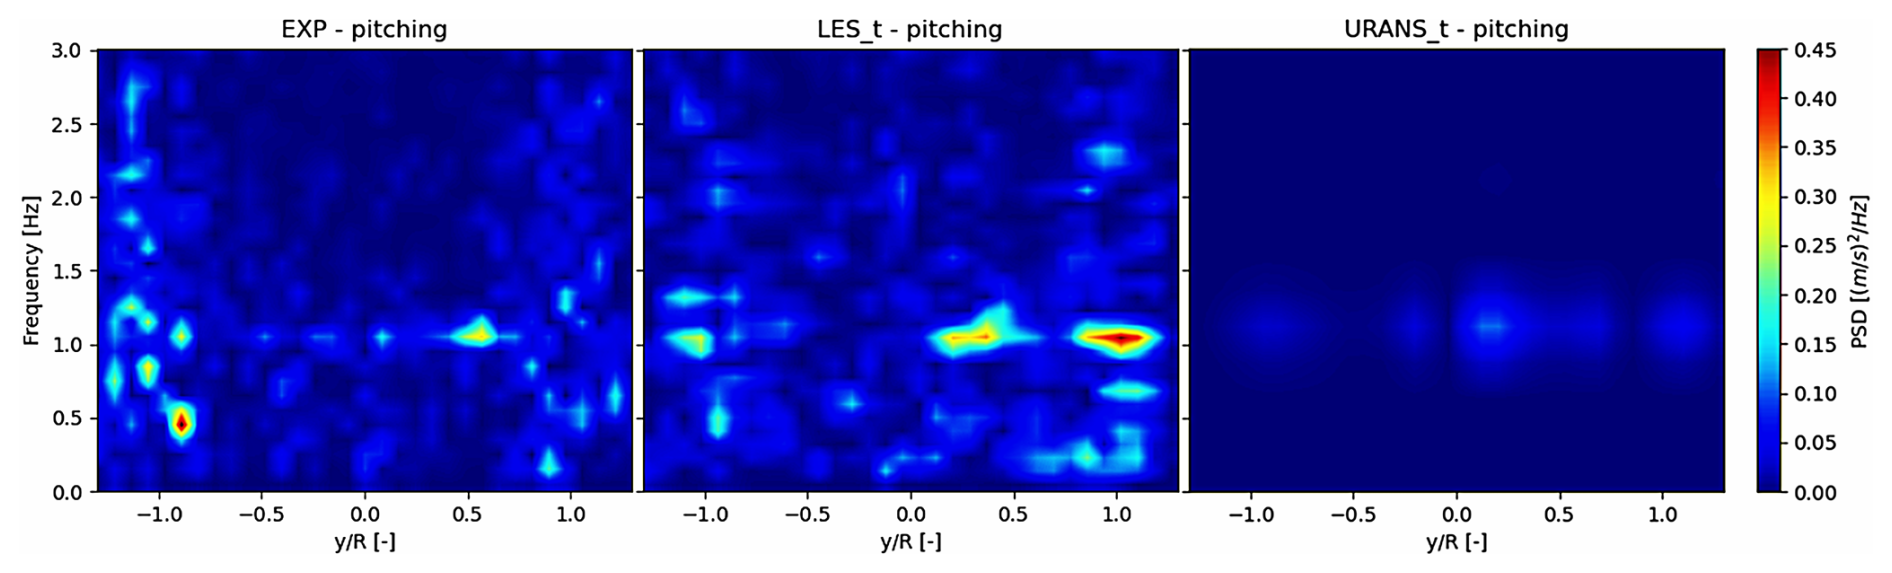
Figure 24Contours of PSD calculated from the velocity field sampled at the 3 D horizontal traverse in the pitching case; results from experiments (EXP – pitching), LES simulations (LES_t – pitching), and URANS simulations (URANS_t – pitching) with turbulent inflow. The x axis is the position on the horizontal traverse, and the y axis is the frequency of each PSD value (color map).
If the same velocity time series are analyzed in terms of PSD (Fig. 24), other significant differences are outlined between LES and URANS simulations. As already discussed in Sect. 4.2, LES is able to effectively capture the frequency response of the wake; on the other hand, URANS_t simulations show very low amplitudes, even if they are at the correct frequencies and positions. This evidence, coupled with the inaccurate wake development highlighted in Figs. 21–23, indicates that including the effect of inflow turbulence in URANS simulations by setting appropriate boundary conditions for the turbulence transport equations may not be sufficient for studying FOWT wakes. In fact, this approach eliminates all velocity fluctuations from the inflow, even those that a URANS approach is conventionally deemed capable of resolving. Indeed, as shown in detail in Appendix A, the inflow turbulence spectrum includes large-scale fluctuations comparable to or even larger than the flow features that the URANS approach is considered capable of resolving, such as tip vortices. These large-scale fluctuations may interact with the FOWT wake and with the structures created by the rotor motion in a significant way, and neglecting these interactions may be the cause of the incorrect trends highlighted throughout this section.
4.5 URANS approach with turbulence injection
To overcome the discussed limitations of URANS simulations, a novel approach is proposed here in an attempt to combine the strengths of the LES approach with the lower computational cost of the URANS simulations. Large-scale velocity fluctuations are inserted into the domain – similarly to LES simulations (Sect. 3.3 and Appendix A) – while maintaining the URANS grid requirements and solution. The mesh required for this case features a total cell count of 30 × 106 elements, roughly one-fourth of the cell count required for the resolution of turbulence in LES simulations. Only the pitching case is investigated in order to evaluate the ability of this method to model the wake structures of an FOWT.
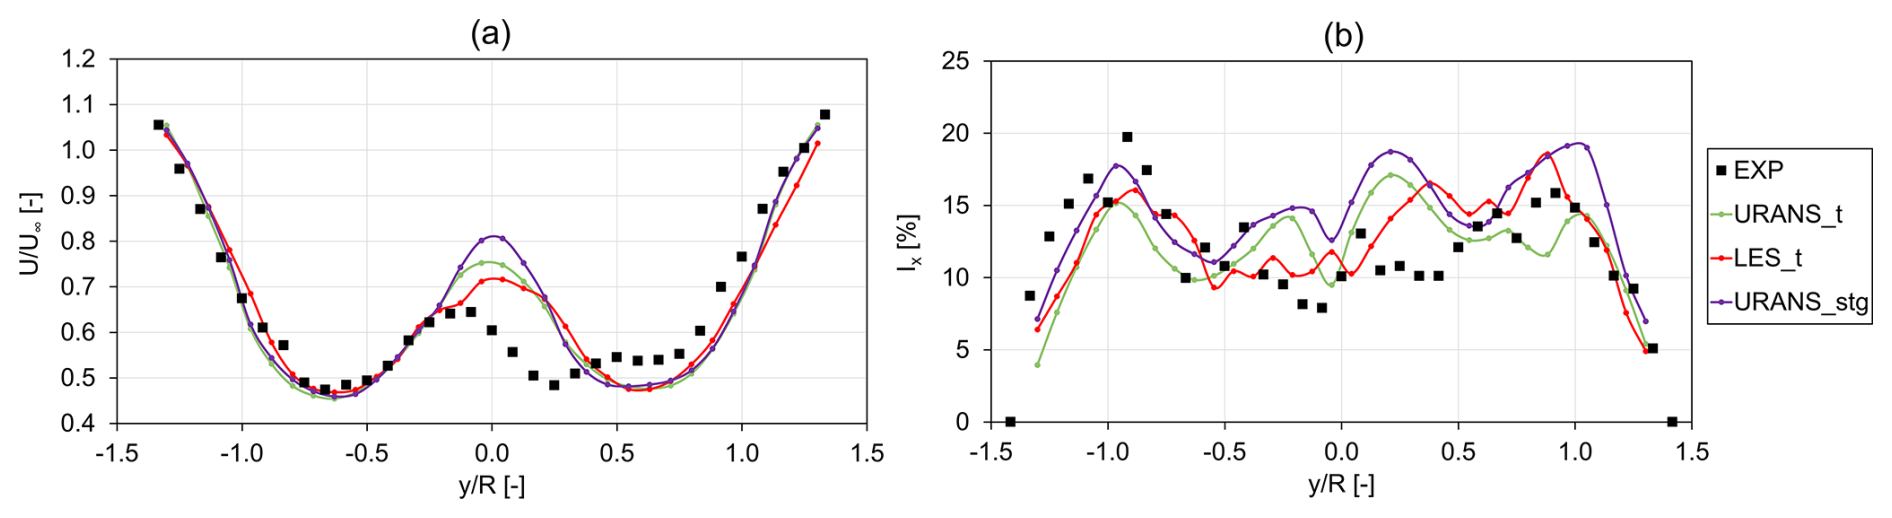
Figure 25Wake profiles of streamwise normalized velocity (a) and turbulence intensity (b) at 3 D for the pitching case: comparison between experiments (EXP), results from LES simulation with turbulent inflow (LES_t), and results from URANS simulation with (URANS_stg) and without (URANS_t) the same turbulence injection adopted for the LES.
Good agreement is confirmed with the adoption of this synthetic turbulence generator in terms of mean velocity at 3 D (Fig. 25a). The two URANS approaches are in good agreement regarding turbulence intensity (Fig. 25b), although Ix is slightly higher for URANS_stg, possibly due to some overproduction or some inaccurate estimations in the superposition of modeled and resolved turbulence in the inflow conditions.
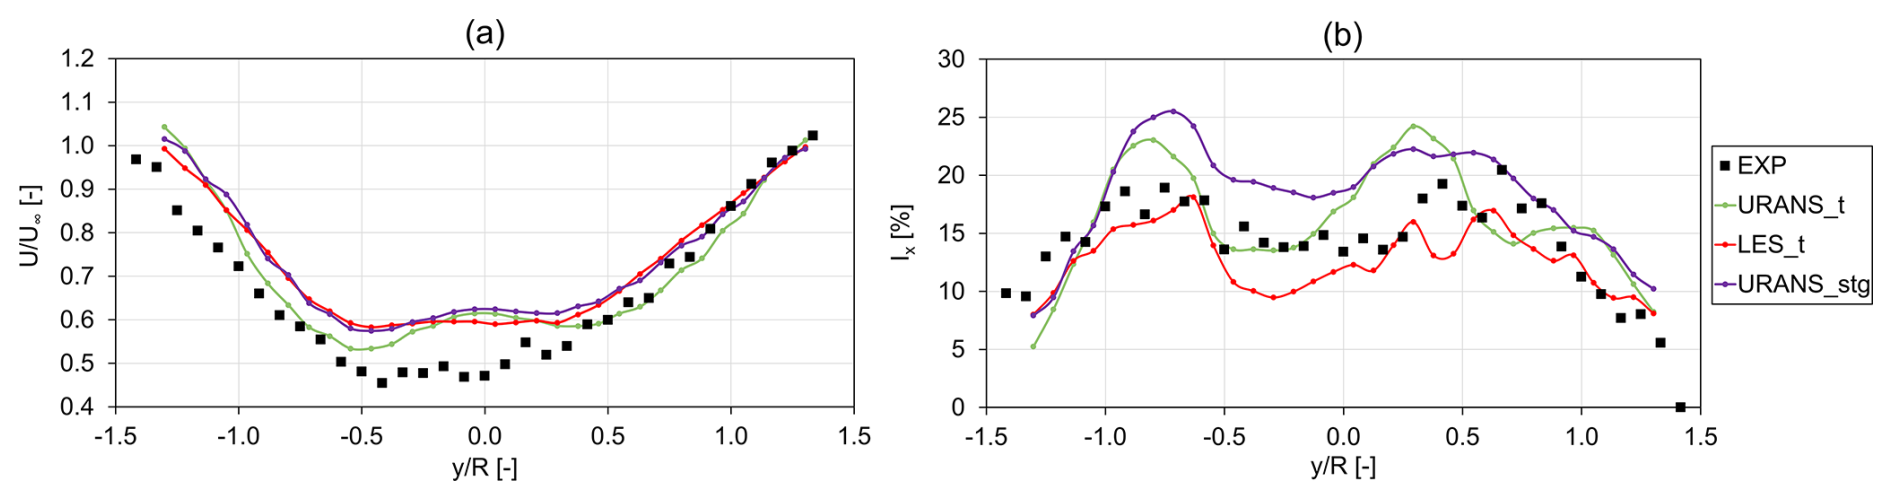
Figure 26Pitching case wake profiles of streamwise normalized velocity (a) and turbulence intensity (b) at 5 D: comparison between experiments (EXP), results from LES simulation with turbulent inflow (LES_t), and results from URANS simulation with (URANS_stg) and without (URANS_t) the same turbulence injection adopted for the LES.
Interestingly, at 5 D (Fig. 26a), the wake profile resulting from the URANS_stg simulation is more similar to the LES one. Regarding the streamwise turbulence intensity (Fig. 26b), Ix is even higher than in the classical URANS approach, although the trend on the axis is more in line with experiments.
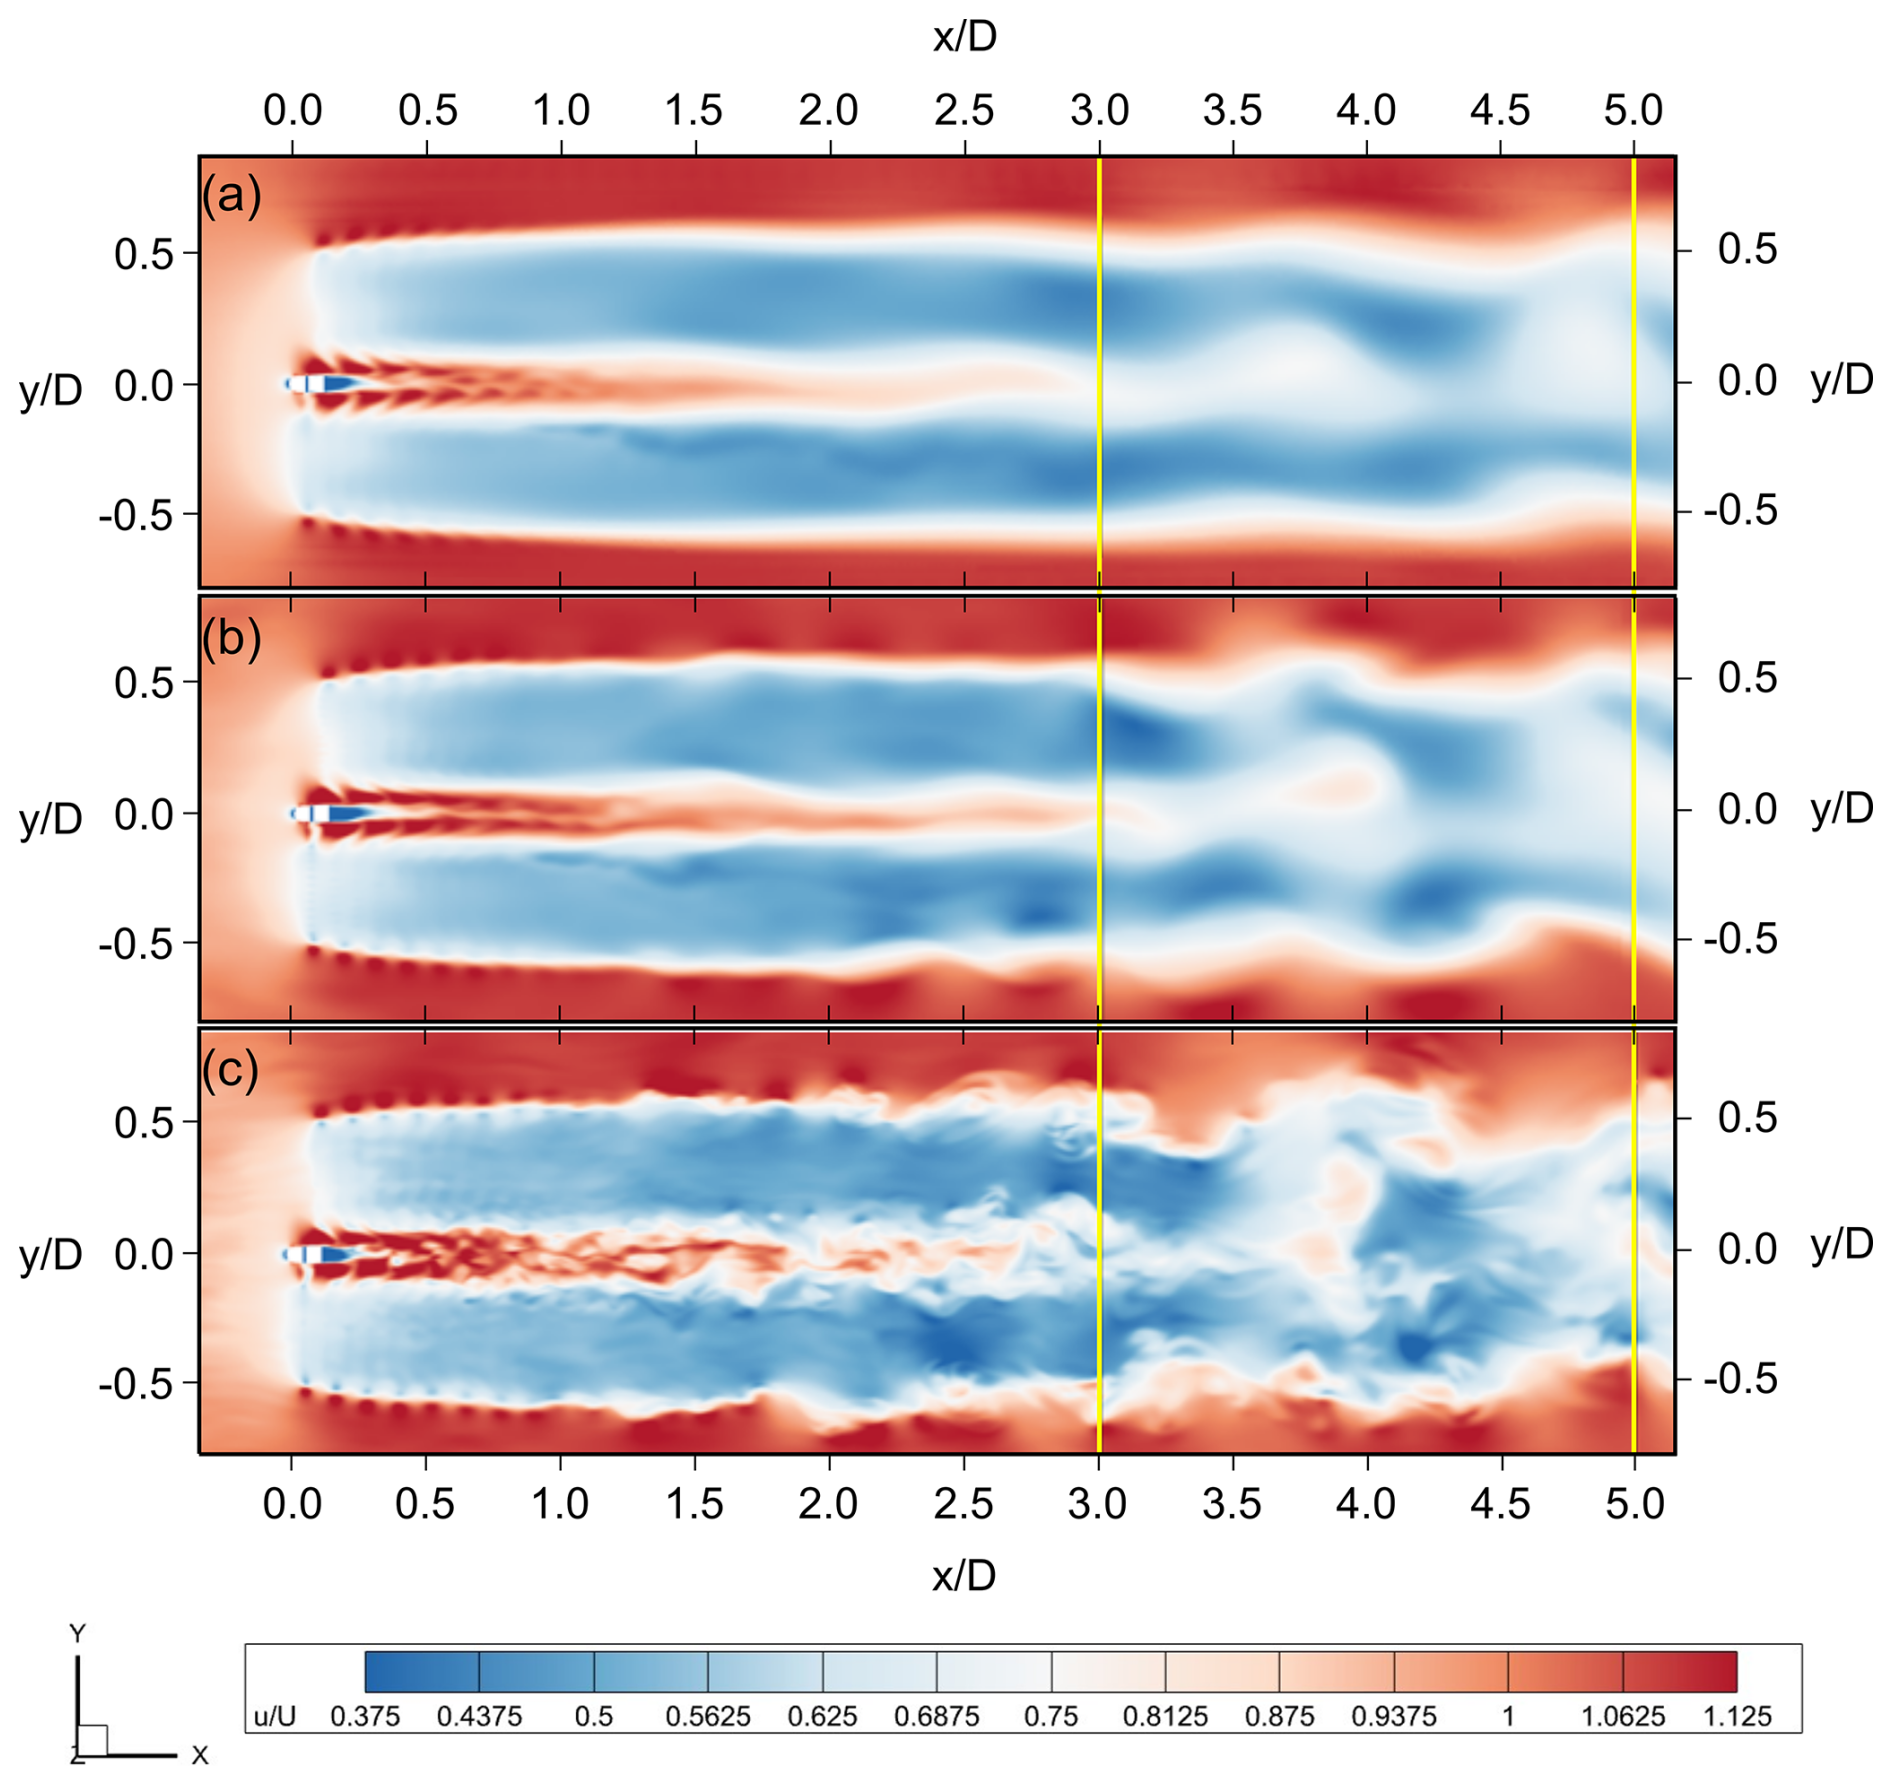
Figure 27Normalized velocity magnitude for the pitching case. (a) URANS, (b) URANS_stg, and (c) LES. Top view at hub height.
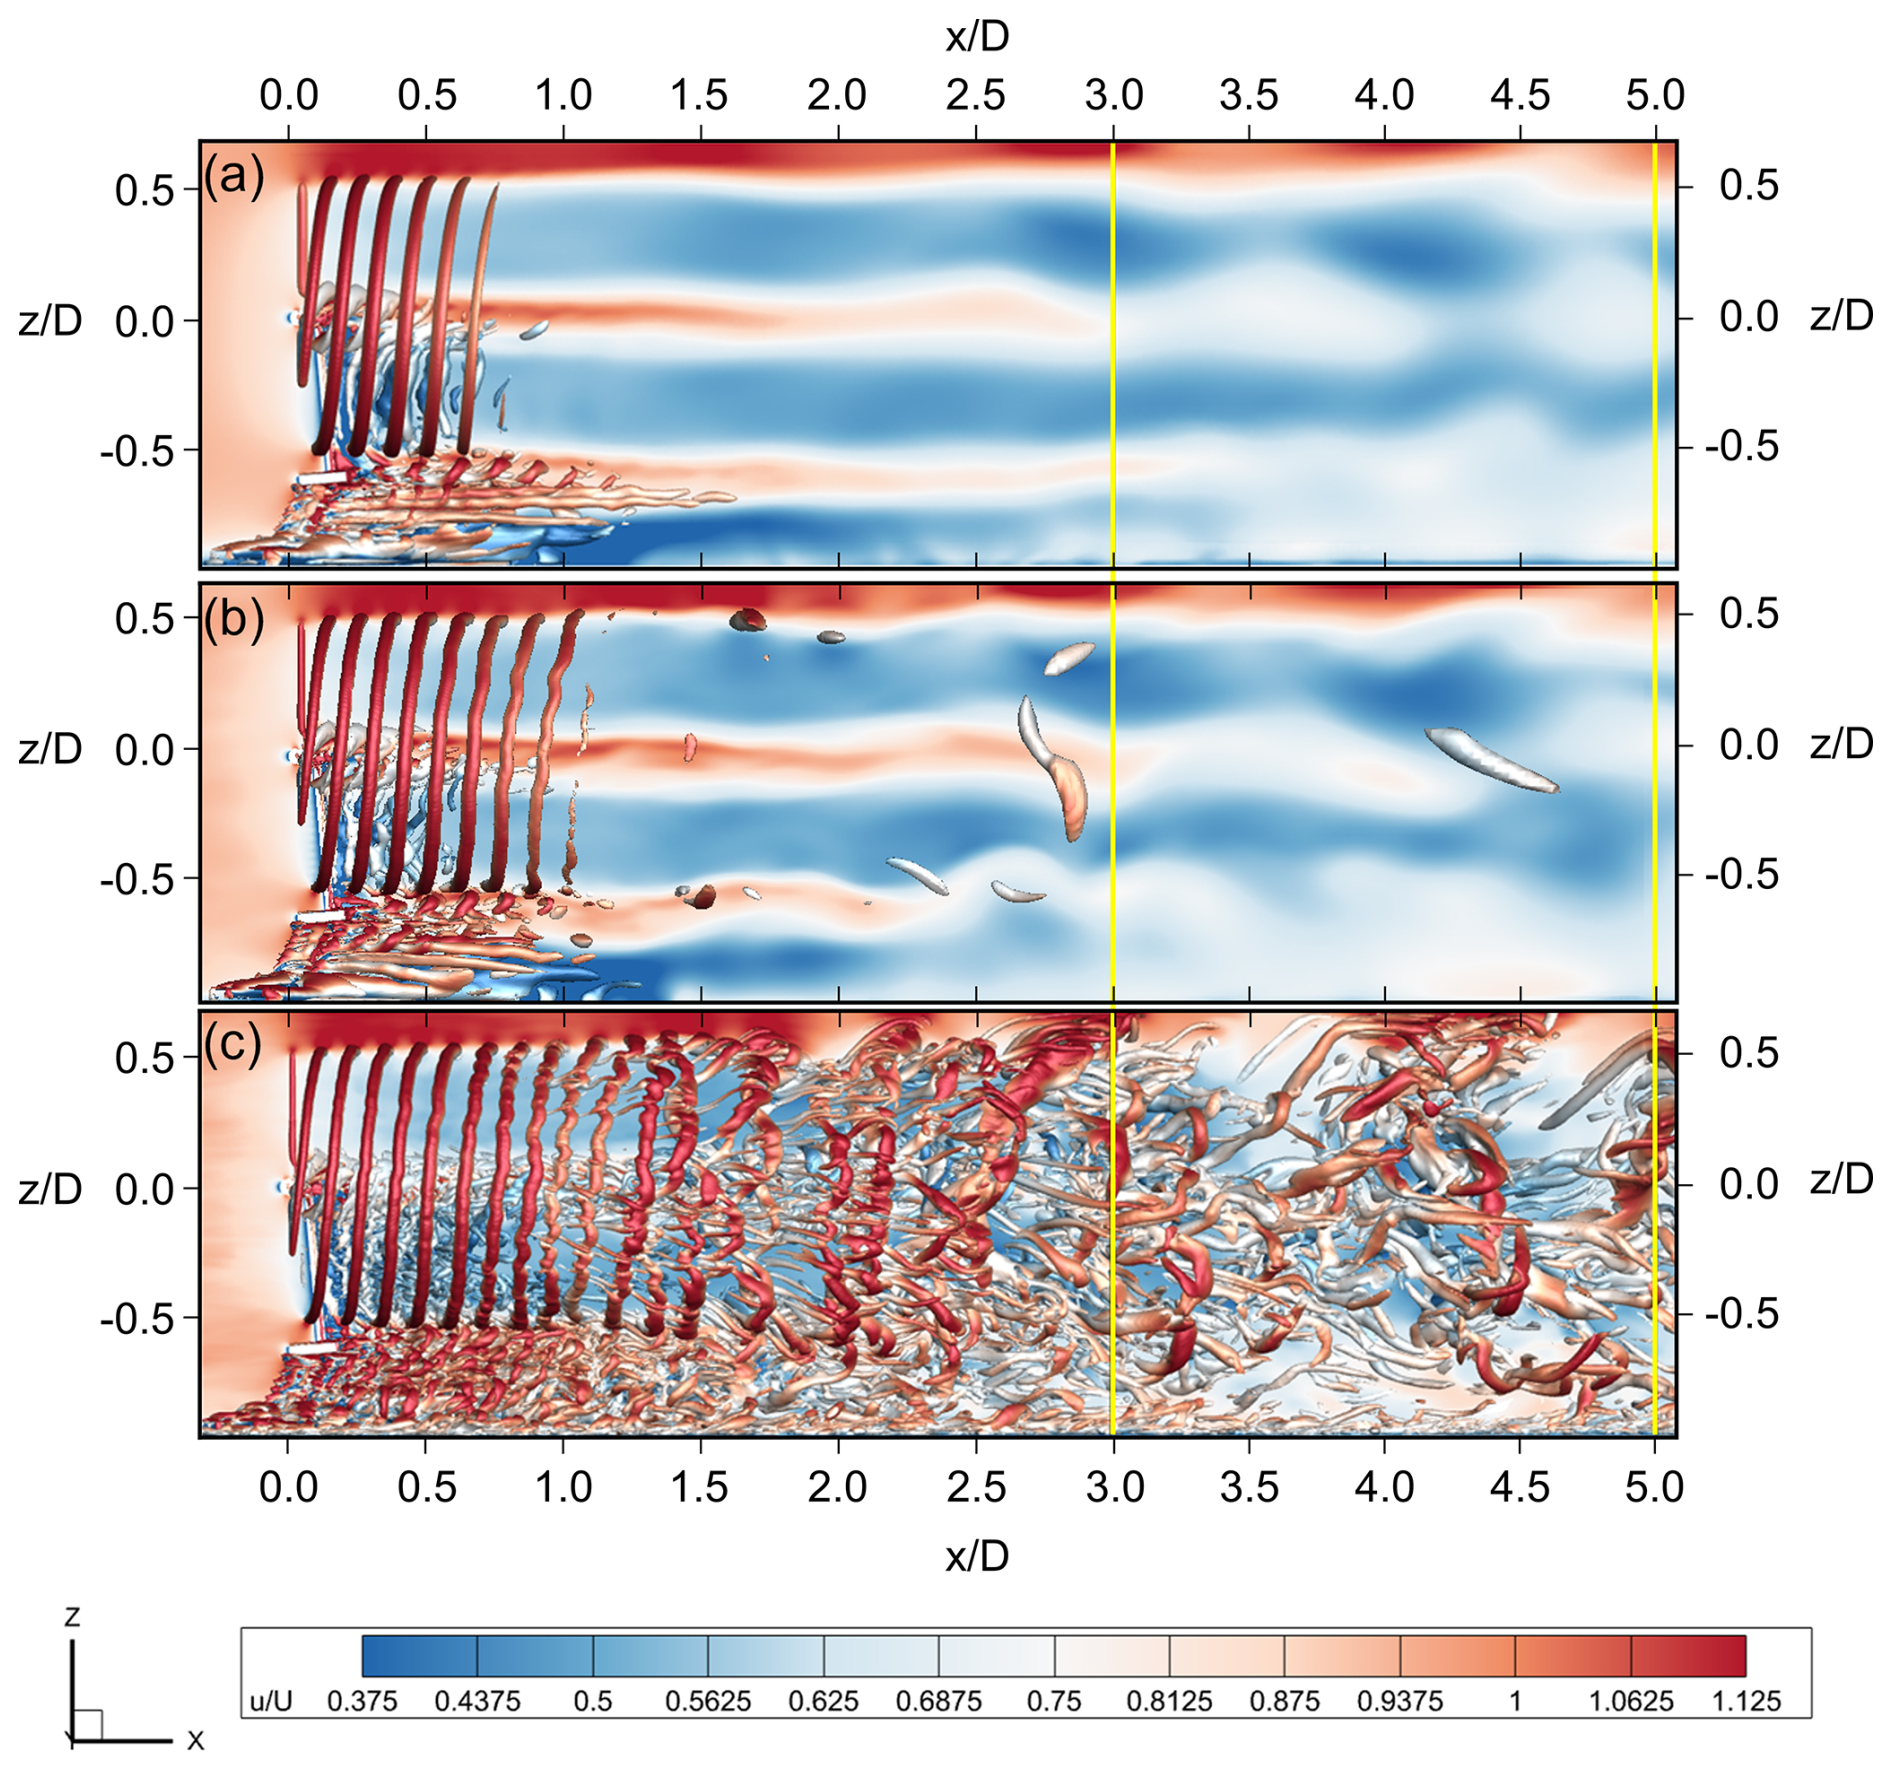
Figure 28Q criterion isosurface and velocity magnitude for the pitching case. (a) URANS, (b) URANS_stg, and (c) LES. Lateral view at turbine midplane.
Normalized velocity contours and Q criterion isosurfaces for the pitching case are shown in Figs. 27 and 28. Inserting free-stream velocity fluctuations into the URANS simulations (Fig. 27b) clearly improves agreement with the LES approach (Fig. 27c), as a clear resemblance in the main turbulent structures in the wake between 3 D and 5 D can be noted between the URANS_stg and LES simulations. The smaller turbulence scales are, however, still absent in the URANS_stg simulation. This can be seen clearly in Fig. 28, where the URANS_stg simulation, while adequately resolving the tip vortices in the near wake, appears to be unable to solve the smaller structures downstream at , despite once again more closely resembling LES (Fig. 28c).
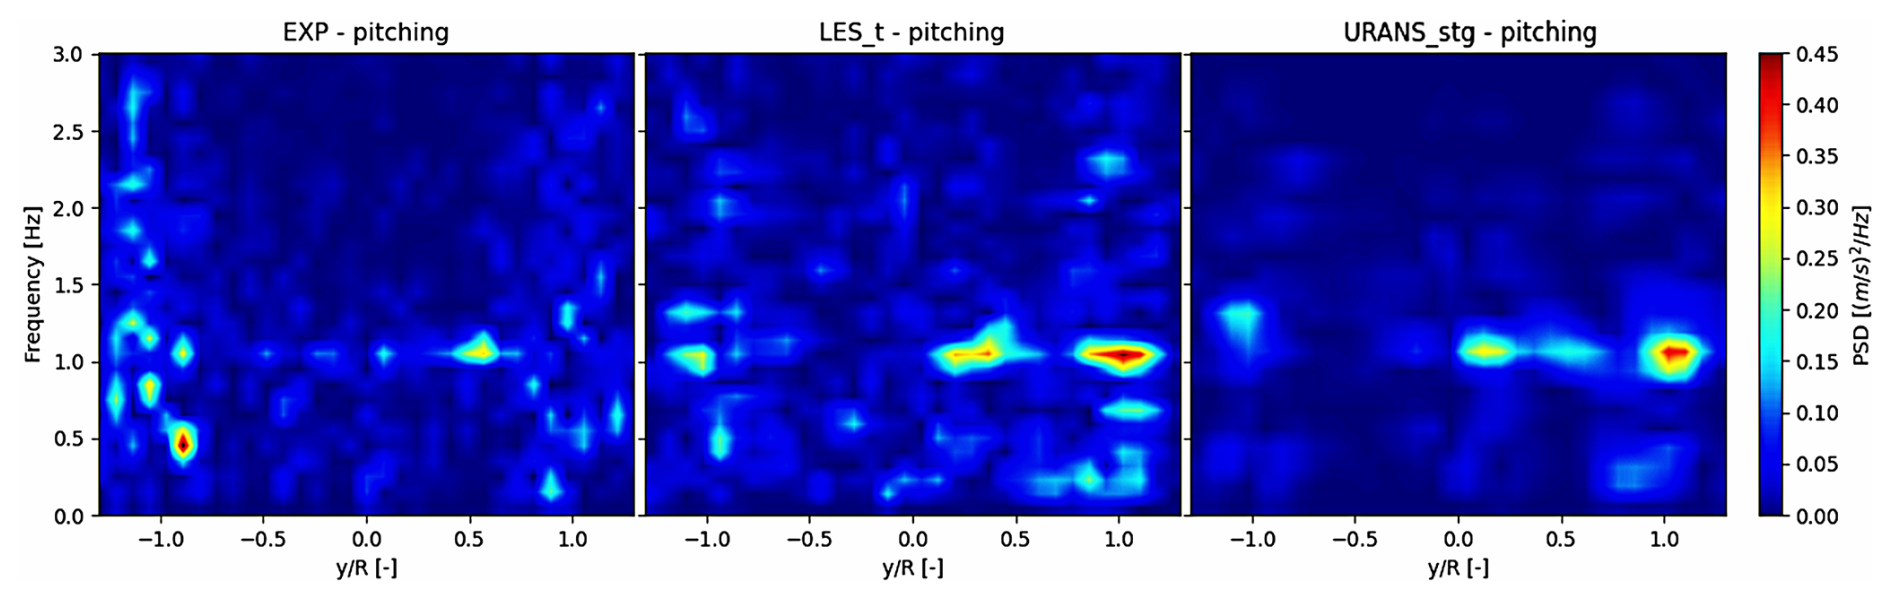
Figure 29Pitching case contours of PSD calculated from the velocity field sampled at the 3 D horizontal traverse. Results from experiments (EXP – pitching) and LES with turbulent inflow (LES_t – pitching) compared to the URANS case with imposed velocity fluctuations (URANS_stg – pitching).
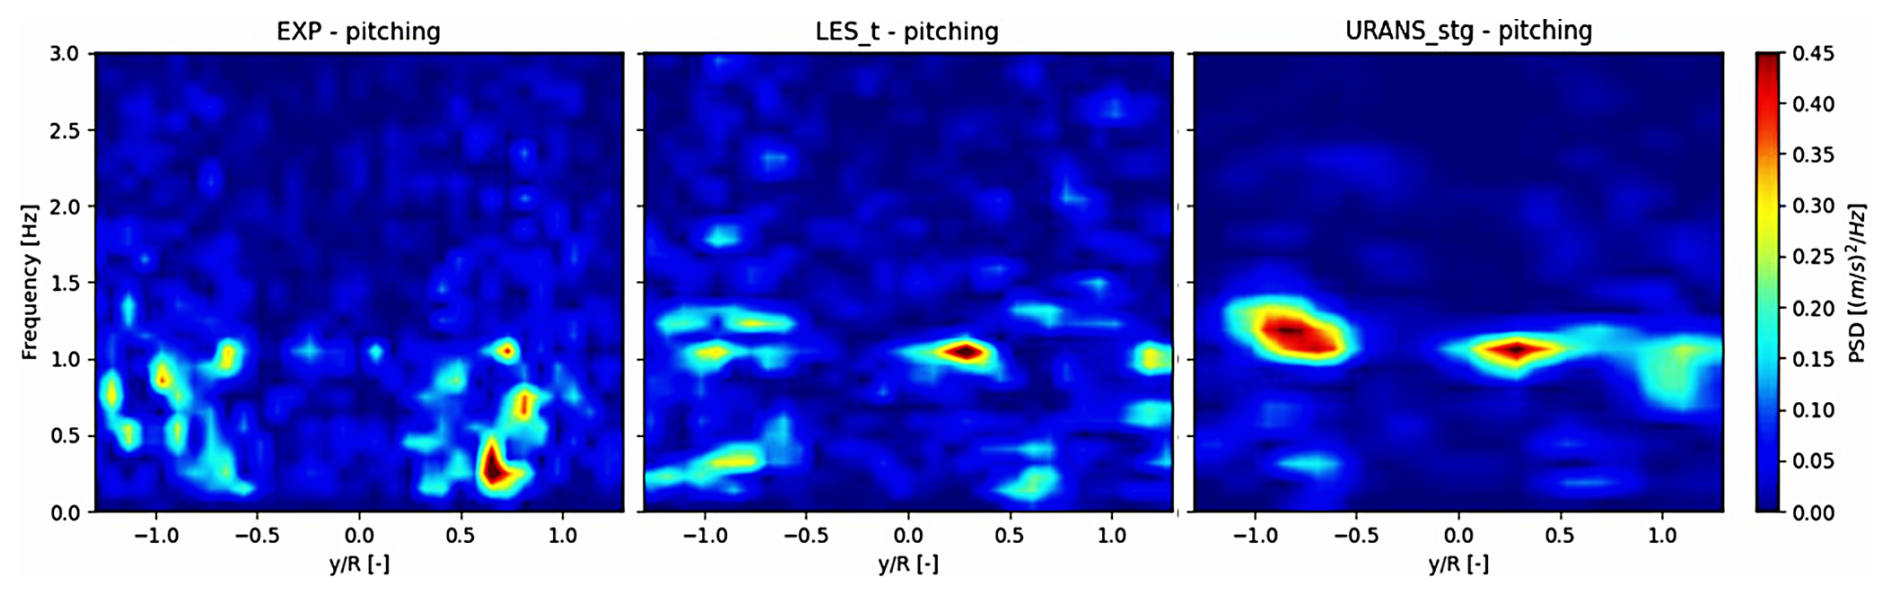
Figure 30Pitching case contours of PSD calculated from the velocity field sampled at the 5 D horizontal traverse. Results from experiments (EXP – pitching) and LES with turbulent inflow (LES_t – pitching) compared to the URANS case with imposed velocity fluctuations (URANS_stg – pitching).
The LES and URANS_stg approaches are compared in Fig. 29 in terms of the PSD of the velocity signal. The similarity with the corresponding LES case (central plot) is noticeable, especially in the main spectral components at 1 Hz. Moreover, spectral components in the 0–3 Hz range also appear and are qualitatively similar to the much more computationally expensive LES simulations. Moving to 5 D (Fig. 30), the main frequency response from wake structures is still captured in both space and frequency, but a general overestimation in terms of amplitude is noticed for URANS_stg. This result appears to be in agreement with the higher streamwise turbulence intensity noted from Fig. 26b. To better understand the implications of the differences in amplitude observed from Figs. 29 and 30, particularly at the motion frequency of 1 Hz, the mean values and amplitudes of the wake deficit have been calculated from the horizontal traverses at 3 D and 5 D according to Eq. (5) from Bergua et al. (2023):
The index in Eq. (5) refers to the measurement points in the horizontal traverses at 3 D and 5 D.
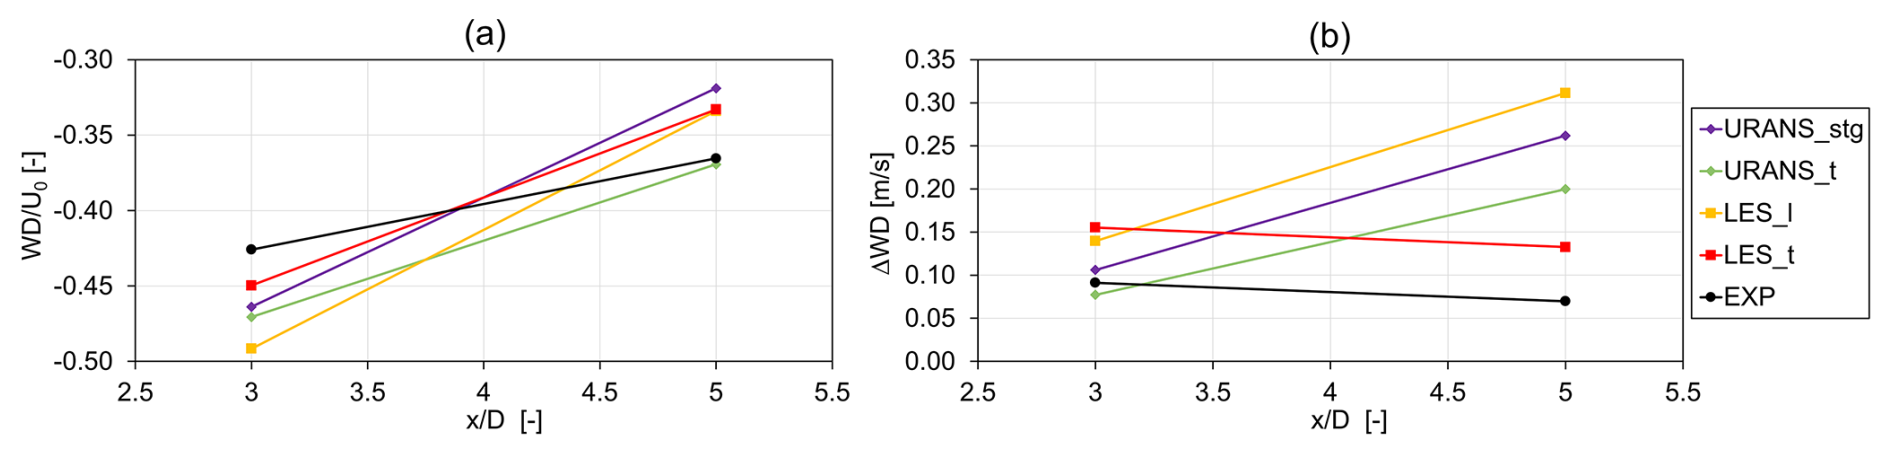
Figure 31Pitching case mean values (a) and amplitudes (b) of the wake deficit. Figures show a comparison between results from URANS simulation with turbulent inflow (URANS_stg), URANS with turbulent inflow (URANS_t), LES with laminar (LES_l) and turbulent (LES_t) inflow, and experiments (EXP). The amplitudes of the wake deficit are calculated from the phase-averaged cycle as , considering the entire sampling time interval adopted for each simulation.
In terms of mean quantities (Fig. 31a), all approaches seem to outline the same trend, despite some differences in the slope of the curve. Similarly to what is shown in Fig. 11, the wake deficit decreases from 3 D to 5 D, and this trend is consistent with the experiments, although it is overestimated in the numerical models. On the other hand, from the trend of wake deficit amplitude ΔWD, calculated as the variation in wake deficit during the phase-averaged cycle (Fig. 31b), some meaningful differences can be observed. In fact, while experiments show a slight decrease in wake deficit fluctuations (a trend which is well predicted by the LES_t simulation), all other numerical results predict an increase in the oscillation in the wake deficit. As also argued by Fontanella (Fontanella et al., 2025), the large coherent structures in the wake break down into smaller eddies as they move downstream, leading to lower overall oscillations in wake deficit at the motion frequency. That being said, two meaningful conclusions can be drawn from Fig. 31b. Firstly, the amplitude of wake deficit ΔWD is influenced by free-stream turbulence, as this value tends to decrease moving downstream in the LES_t results, while it increases in the LES_l result. Indeed, as discussed in Sect. 4.1, turbulence influences the large coherent structures at the motion frequency in the wake, which are more persistent in the laminar case, ultimately leading to the higher oscillations shown in Fig. 31b. Secondly, all URANS approaches, including URANS_stg, are unable to capture the experimental trend in ΔWD. Such inability is again linked to the incorrect prediction of the breakdown of the large eddies in the wake. In fact, as discussed in Sect. 4.2, the large coherent structures in the wake are more persistent in URANS simulations than they are in LES, meaning that some wake structures still dynamically influence the global wake recovery throughout the traverse span. This conclusion is of the highest importance within the scope of this work, as it finally demonstrates to what extent the refined resolution of each aspect of the wake – the vortex breakdown, the wake meandering, the turbulent inflow, and its resolution – is directly related to the final accuracy in the analysis of the wake development.
In summary, the simulation approach proposed and discussed here is able to provide meaningful information in terms of the mean wake development and resolve the most important frequency components in the wake at a reasonable computational cost compared to the LES approach. However, the breakdown of the large eddies in the wake, caused by rotor motion as they interact with free-stream turbulence, is inaccurate, and LES simulations appear to be more in line with experimental results.
In this study, a numerical investigation of the influence of turbulence on the characteristics of an FOWT wake is performed. Multiple fidelity CFD approaches are used to solve the wake, ranging from LES to URANS. Results are validated by comparing them to experimental results recently obtained in the Politecnico di Milano wind tunnel. In the numerical campaign, the 1:75 scale experimental rotor is simulated with and without inflow turbulence in fixed conditions and undergoing sinusoidal pitching motion. Numerical tools differ not only in their ability to resolve the wake structures but also in the way free-stream turbulence is accounted for. Indeed, the actual turbulent spectrum measured in the wind tunnel is modeled in the LES simulations, while only mean turbulence intensity and length scale can be included in the URANS approach.
Results have shown that free-stream turbulence affects FOWT wakes significantly. Once free-stream turbulence is included in the simulations, the slope of the outer shear layers, as recorded in the experimental campaign, were correctly predicted by all the numerical approaches. In the central part of the wake, while some differences remain between the numerical models and the experiments, most likely due to the approximate nacelle geometry in the simulations, free-stream turbulence improved agreement with the experiments by decreasing velocity differences in this wake region.
More importantly, the relatively low 1.5 % free-stream turbulence intensity for an offshore environment that was included in this campaign is found to greatly influence the effect of rotor motion on the wake. In fact, while rotor motion is found to accelerate near- to far-wake transition and promote faster wake recovery in the laminar case, its effect is almost nullified if free-stream turbulence is accounted for 3 D and 5 D downstream of the rotor. This result is consistent with experimental observations. Despite this, the signature of rotor motion remains visible in the wake at the reduced frequency of 0.595 that was tested herein.
This result reinforces other recent experimental observations and indicates that free-stream turbulence must be included in numerical simulations focused on FOWT wake development. Although not directly addressed in this study, this conclusion can also be applied – to a certain extent – to future studies on dynamic induction control of FOWTs, which can greatly benefit from inflow turbulence modeling.
In addition, the findings presented in this study suggest that higher turbulence intensities may influence floating wind turbine wakes to an even greater extent. More research is required in this regard to fully understand the effect of turbulence on the wake structures generated by floating wind turbine motion.
In terms of agreement with experimental results, LES simulations appeared to be the best among the tested approaches, although at a very high computational cost. LES with the addition of free-stream turbulence was able to predict mean wake velocity and streamwise turbulence intensity in the wake at 3 D and 5 D, and it was found to agree well with experiments frequency-wise, despite some differences emerging at 5 D. These differences are attributed to the aforementioned discrepancies in the center part of the wake, which develop downstream and could lead to different wake characteristics at 5 D. Despite this, LES is able to predict the correct wake deficit evolution in terms of both mean and oscillation at 3 D and 5 D, as long as the inflow turbulent spectrum is considered. In fact, it is worth remarking that noticeable differences may arise in this regard if a laminar inflow is assumed. In this regard, however, the reader should remember that simulation settings in the laminar case are very critical, as they themselves can induce spurious numerical dissipation, altering the physical wake breakdown.
On the other hand, URANS can be used to gain useful information at a fraction of the computational cost. In fact, despite its limitations, this approach is able to clearly highlight the effect of turbulence intensity on the mean wake profile 3 D and 5 D downstream of the rotor. Where the method falls short compared to its LES counterpart is in the prediction of the evolution of velocity oscillations in the wake, especially in the presence of free-stream turbulence. In fact, in terms of frequency content, the only oscillations that are preserved are those at the rotor motion frequency and at a lower intensity than in the experiments. The inclusion of the turbulence spectrum in the URANS simulations through an LES-inspired boundary condition represents a middle ground between the two approaches and brings URANS results more in line with LES, allowing it to resolve the most important frequencies in the wake. However, the method still falls short compared to LES if velocity oscillations at 5 D are concerned, and it appears unable to correctly predict the evolution and breakdown of the large eddies in the wake, as LES does.
In conclusion, this study has confirmed the strong influence of inflow turbulence on FOWT wakes and proved that numerical tools, if appropriately tuned, can model these effects with varying degrees of accuracy.
The wind tunnel velocity spectrum shown in Fig. A1 in terms of power spectral density (PSD) was sampled before the experimental campaign with the empty tunnel and then repeated with the turbine installed but with neither rotation nor platform motion. The sampling frequency was 2 kHz. The spectrum has been adopted for the URANS_stg and the LES turbulent simulations, presented and discussed in Sect. 4. The wind tunnel spectrum includes a peak at 1 Hz, which corresponds to the motion frequency investigated throughout the paper, although the two phenomena are not directly connected. The main frequency components extend to a frequency of 10 Hz, where the amplitude of PSD is decreased by a factor of with respect to the maximum value.
A graphical representation of the turbulence insertion zone and the adopted insertion kernel and strategy is shown in Fig. A1. The insertion function Sc can be fine-tuned by adjusting the value of a. For the URANS_stg and the turbulent LES simulations presented in this study, the value of 470 is adopted, after preliminary test runs. The turbulence intensity that is obtained at the rotor plane using this approach is shown in Fig. A2. The average turbulence intensity on the rotor disk is approximately 1.35 % in the LES case and 1.2 % in the URANS_stg case. The total turbulence intensity, which also accounts for the contribution of the sub-grid scales in the LES simulations and the modeled turbulence in the URANS simulations, is approximately 1.5 %.
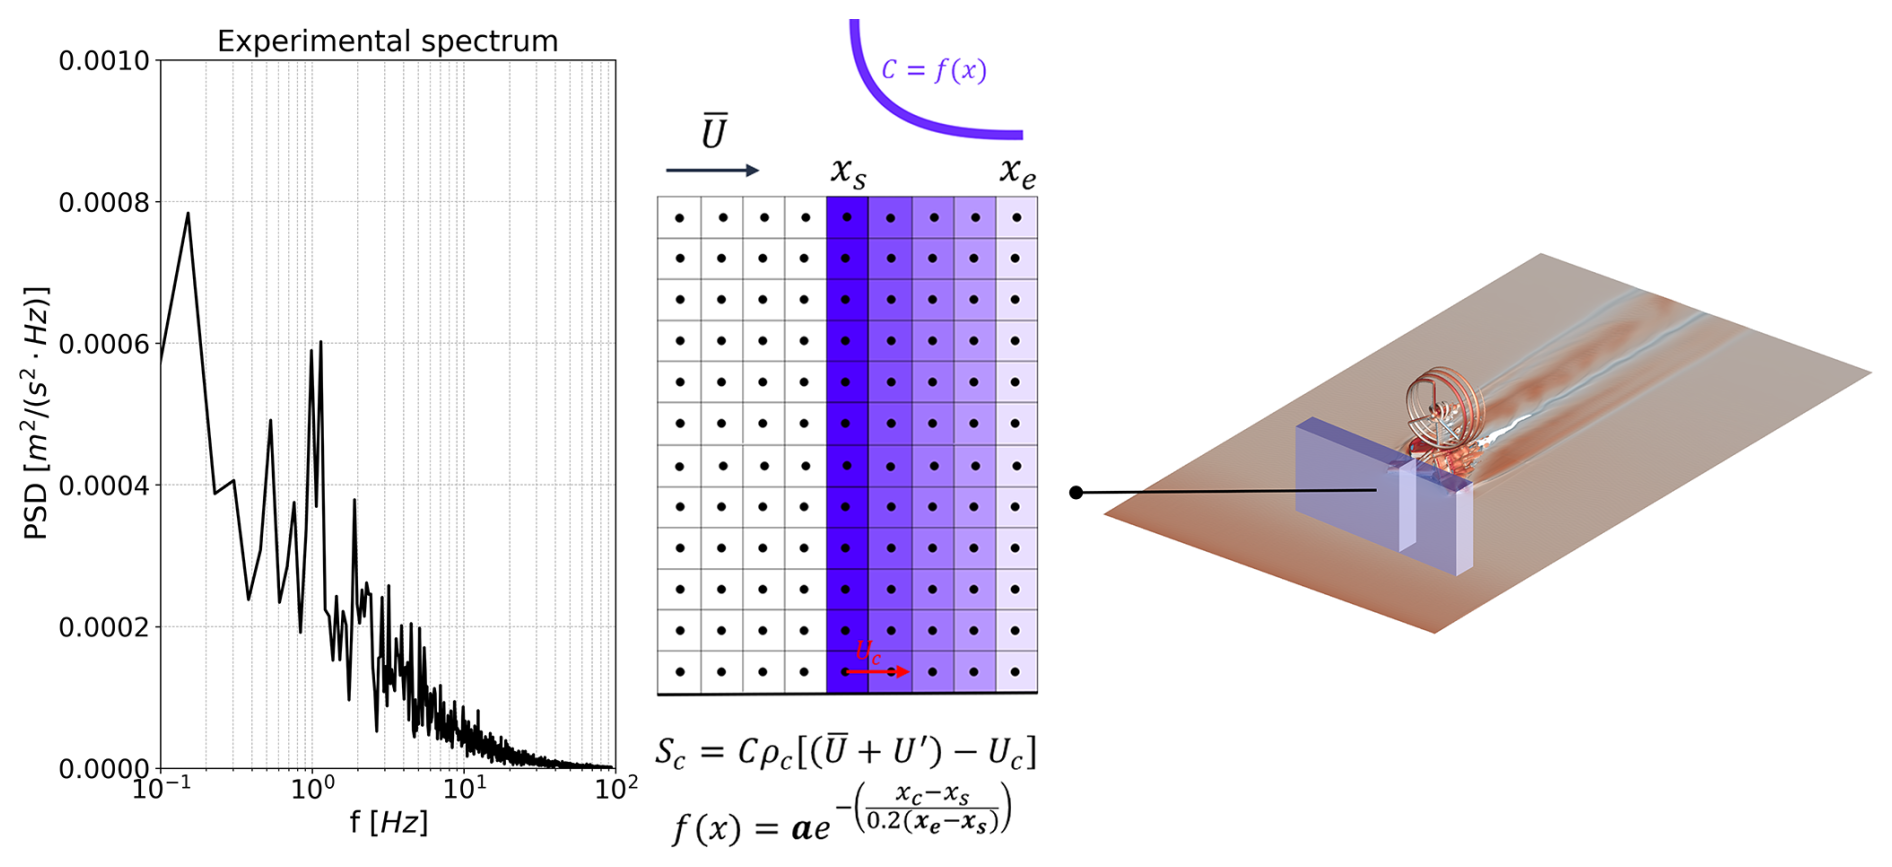
Figure A1Experimental spectrum adopted for the turbulence injection inside the LES simulations and graphical representation of the turbulence insertion box. A slice of the insertion box is represented to show the kernel smearing function C(x).
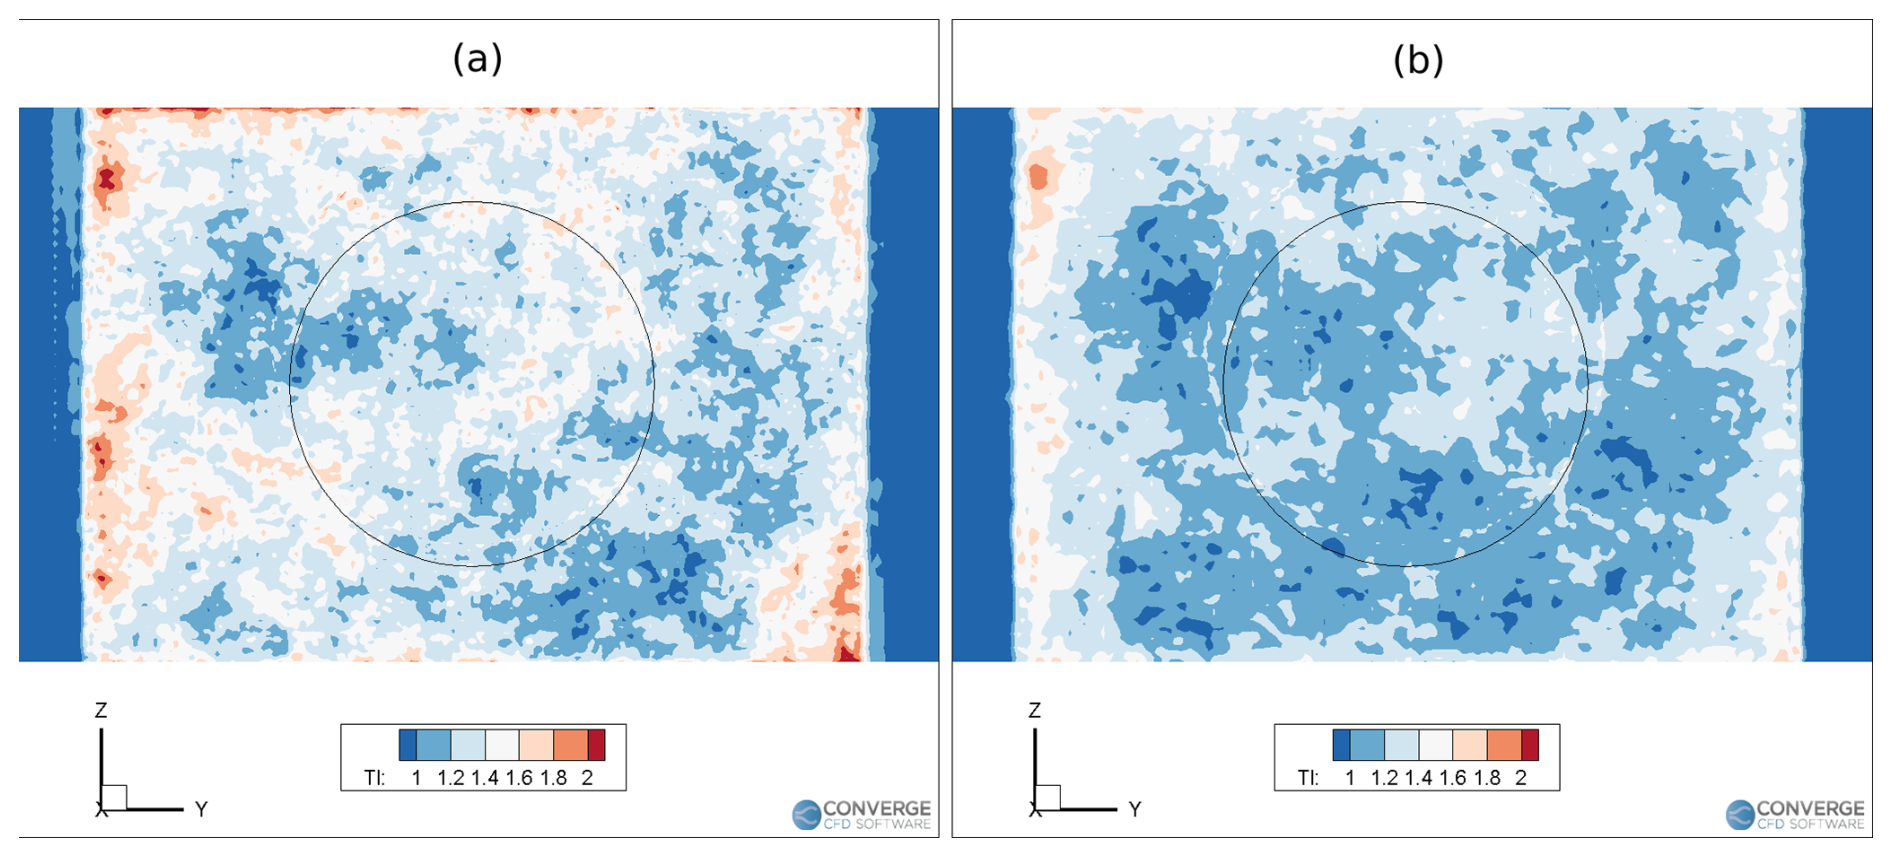
Figure A2Turbulence intensity () at the rotor plane in preliminary empty-box simulations without the rotor. (a) LES simulations and (b) URANS_stg simulations. The average turbulence intensity on the rotor disk is 1.35 % for the LES simulation and 1.2 % for the URANS_stg approach.
The domain adopted in this work is discretized using a Cartesian grid with progressive levels of refinement (embeddings) close to the rotor. For the URANS simulations (Fig. B1), the Cartesian grid with a base size of 0.25 m (≈ 0.1 D) was progressively refined up to the robot, rotor, wake regions, tower, nose, and nacelle. For the rotor and the rotor wake, the embeddings have a cylindrical shape, while for the robot, a box shape was chosen to completely envelop the entire geometry and accurately solve the wake. The adaptive mesh refinement (AMR) feature available in the flow solver was used to precisely refine the wake mesh according to the velocity gradient measured in each cell.
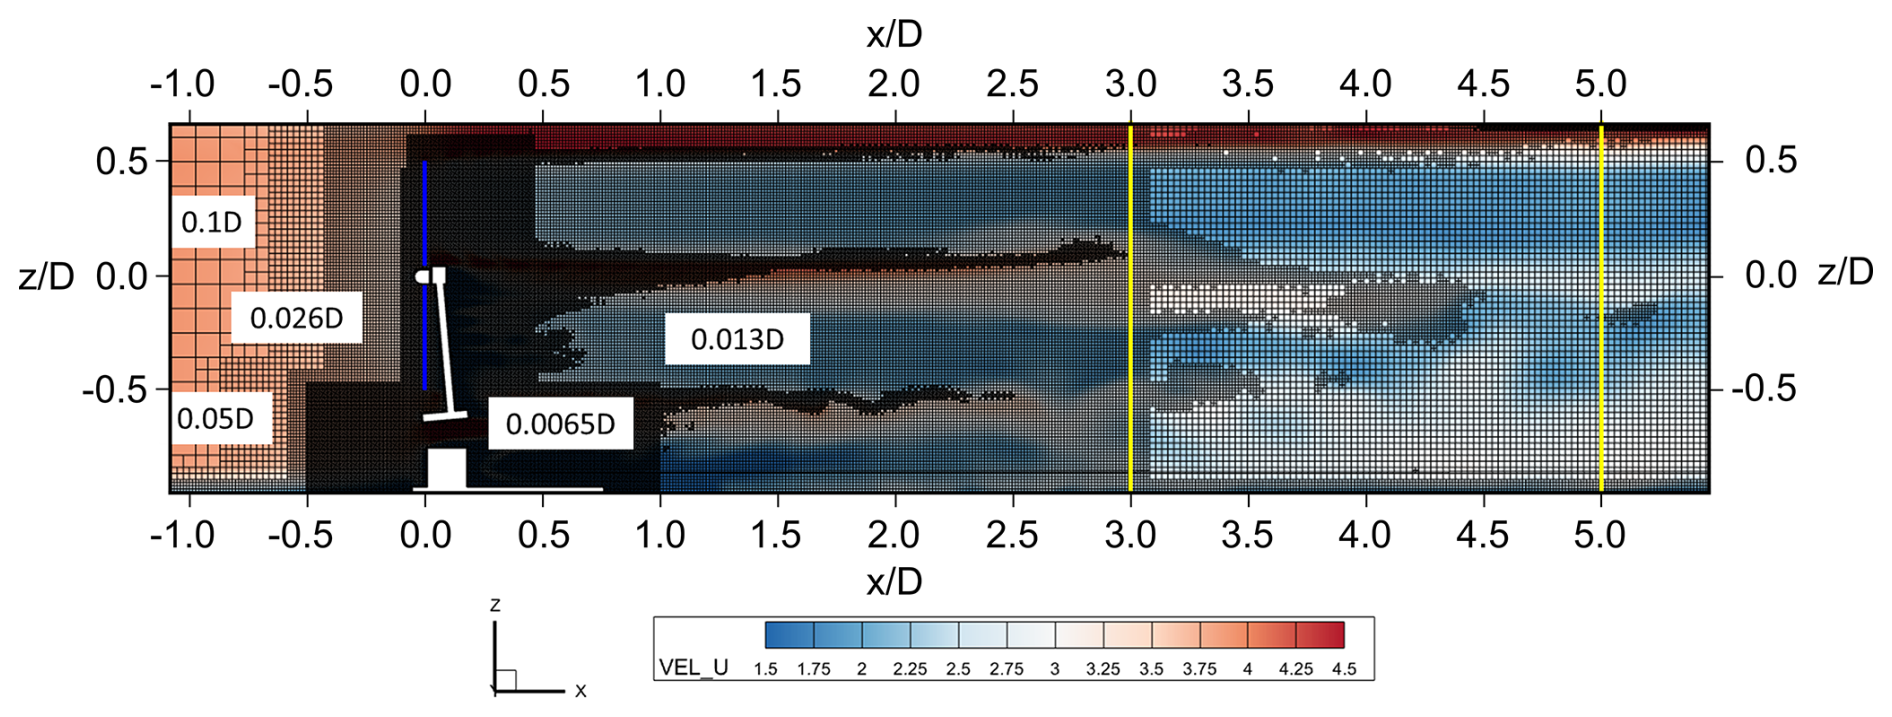
Figure B1Mesh setup adopted for URANS simulations. Lateral view: yellow vertical lines 3 D and 5 D from the rotor and mesh sizes indicated in the labels; red lines – rotor position.
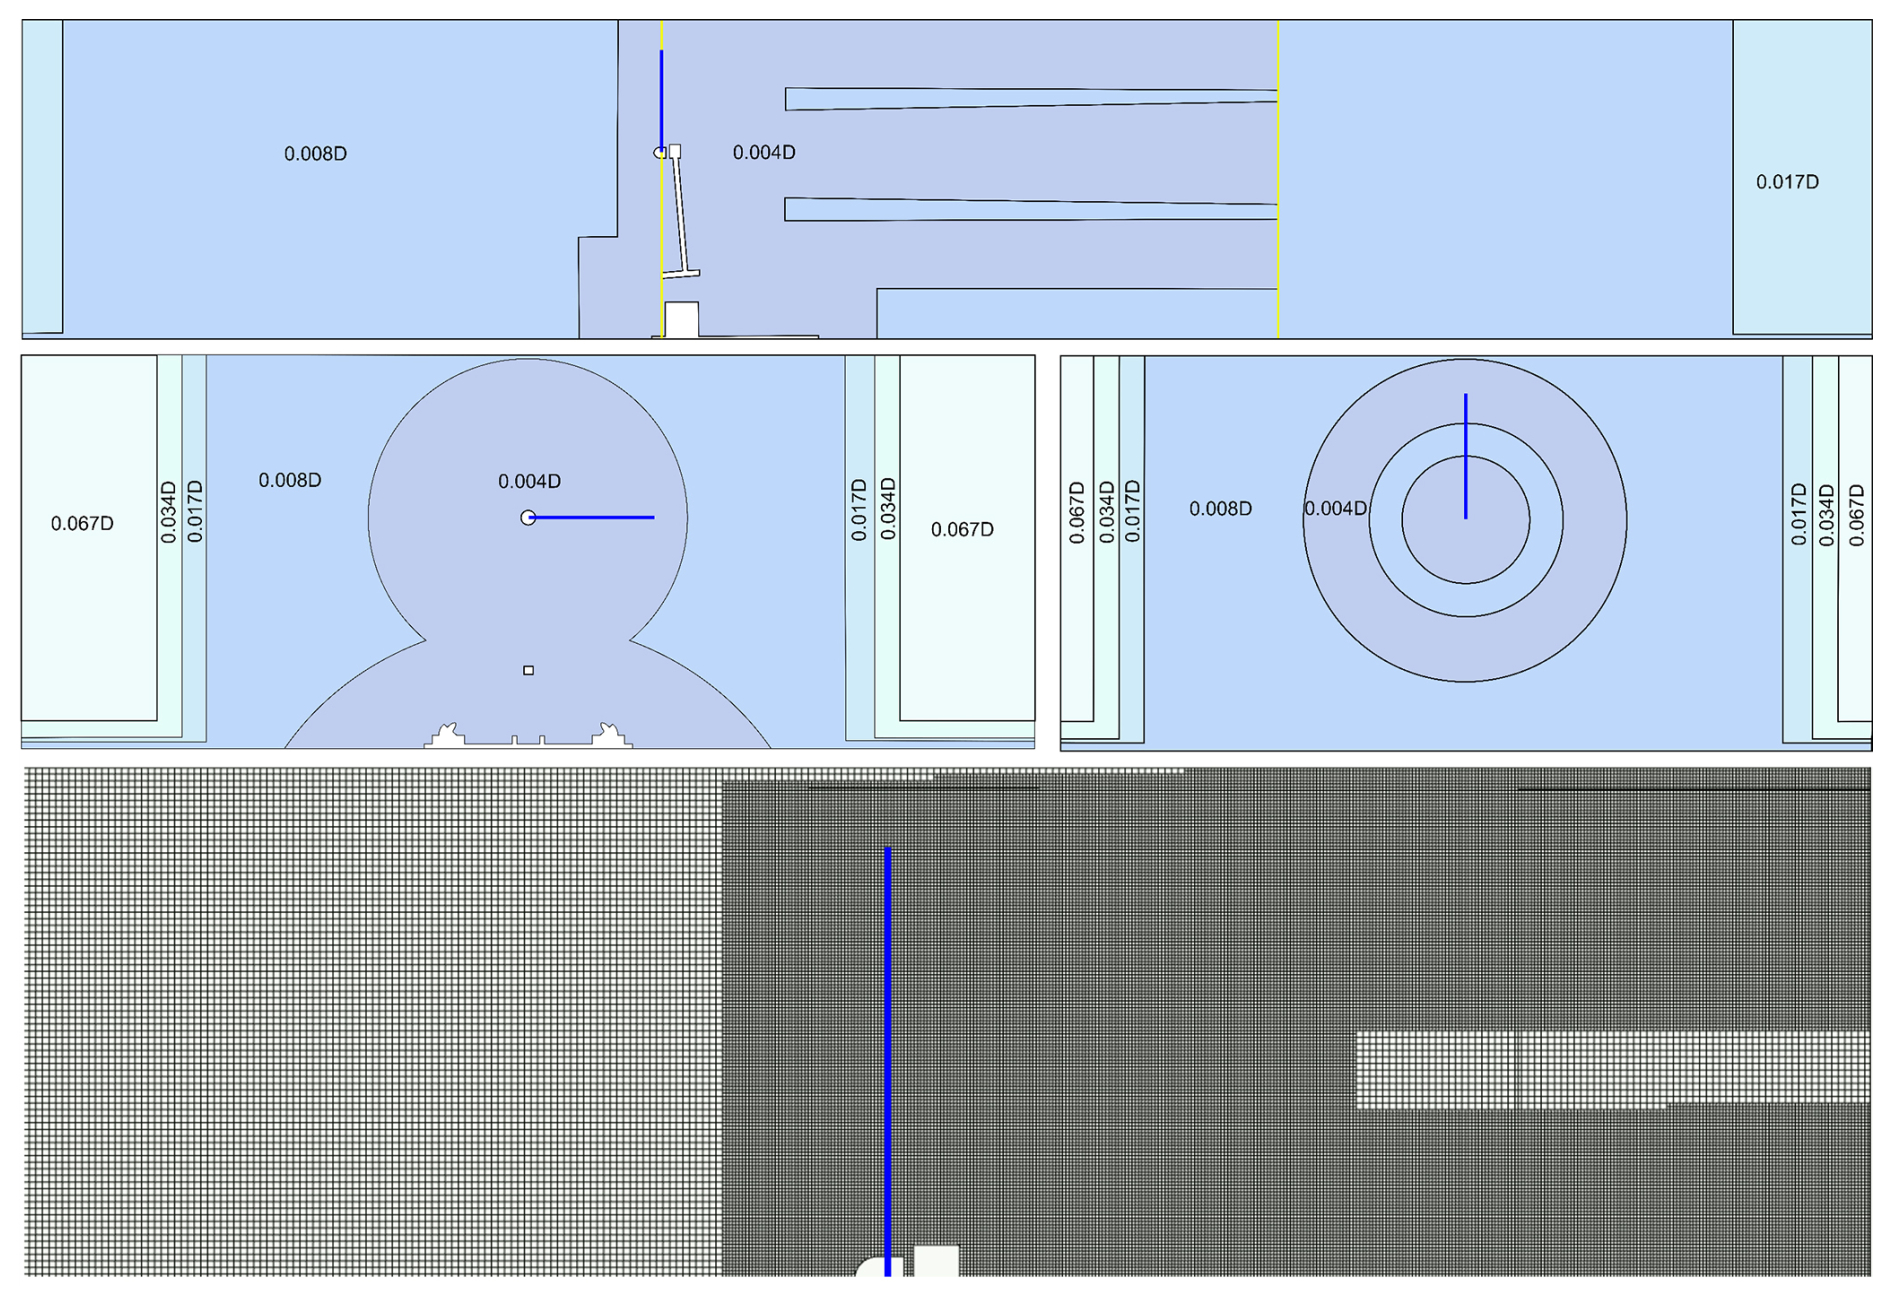
Figure B2Top-down view: lateral view of the mesh setup adopted for the LES simulations, with mesh zones divided by color. Front view of the sections (indicated by yellow lines in the lateral view); close-up of the mesh adopted for the rotor and near wake (blade radius in blue).
LES simulations required a finer grid than their URANS counterparts, as shown in Fig. B2. Starting from a base grid mesh of 0.32 m (≈ 0.13 D), cells were progressively refined up to 0.01 m (≈ 0.0042 D) in size around the rotor, tower, robot, and root and tip region. For the rotor, which is centered at the origin of the Cartesian reference frame, a cylindrical refinement region extending from −0.5 to 1.4 m (≈ 0.8 D) and with a radius of 1.5 m (≈ 0.625 D) was used. The mesh size in this region corresponds to a ratio equal to 119, which is consistent with the values adopted by other authors for these kinds of simulations. In fact, Nilsson et al. (2015) adopted a maximum resolution of at the tip region in the simulation of the MEXICO rotor, while in the context of NREL Phase VI, a uniform resolution of was adopted (Churchfield et al., 2017). In a more recent work (Blaylock et al., 2021), the ratio was also higher than 100.
The quality of the LES calculation was one of the key goals of this study. Several quality checks were made both in the sensitivity analyses carried out in preparation for the calculation and during the run. In particular, the resolution in the wake region, which represents the key element of the study, was monitored at every turbine revolution by analyzing the contours of the length-scale resolution (LSR) parameter. This parameter, introduced by Piscaglia et al. (2013) for these types of mesh topologies and solvers, aims to quantify whether the local filter size is small enough to solve the turbulent scales up to the viscosity range. Values up to 1 ensure that all the turbulent scales up to the viscosity range are resolved; as per the recommendation of Piscaglia et al. (2013), LSR values from 3–5 can be considered the limit within which the LES resolution can still be regarded as acceptable. Upon examination of Fig. B3, which reports a contour of LSR at the beginning of the last revolution simulated herein, in our LES simulation, LSR values are consistently lower than 1 almost everywhere in the domain, including in the critical areas of the near wake (within 3 D from the rotor) and in the tip vortex region. This corroborates the selection of conservative but computationally expensive settings for this study.
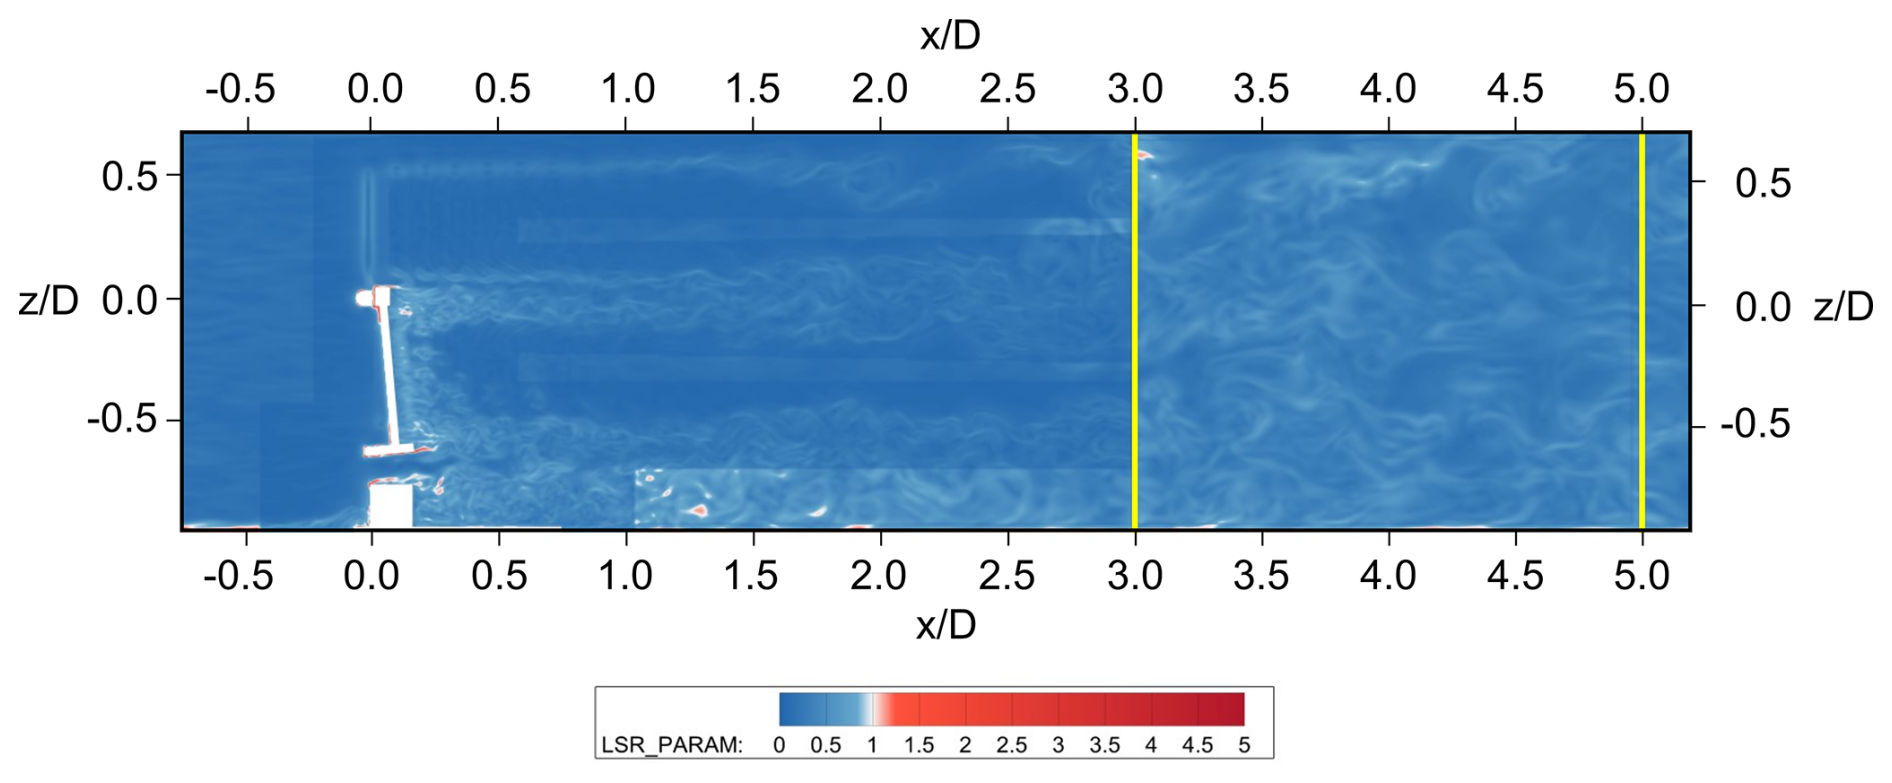
Figure B3Contour of LSR parameter at the beginning of the last turbine revolution simulated.
Finally, to ensure that the injected turbulence is preserved throughout the computational domain, a box with an internal mesh size of 0.02 m (0.03125 m for the URANS_stg case) starts from the window 2 D upstream of the rotor and extends over a distance of 5 D downstream. In the laminar cases, this region starts approximately 1.3 D in front of the rotor, with the same downstream end. To resolve the tip vortices, a toroidal refinement region, with internal and external radii of approximately 0.9 and 1.6 m, was defined and maintained from 1.4 m up to approximately 3 D. Similarly, a conical refinement region was defined for the hub region, starting at a distance of 1.4 m from the rotor. The mesh refinement around the robot, defined here with a cylindrical shape to best follow the geometry and to optimize the cell count, is again justified by the interest in investigating the possible interaction of the wake detaching from these surfaces with the rotor wake.
Experimental data are openly available at https://doi.org/10.5281/zenodo.13994980 (Fontanella et al., 2024). All data presented in the study are openly available upon request to the contact author. All simulations were performed using Converge v3.1 (https://convergecfd.com/blog/bibliography, Richards et al., 2024). Additional details regarding the numerical flow solver employed in this study can be found in the Converge user manual, which can be requested at https://convergecfd.com/support/user-resources (Convergent Science, 2023).
LP set up and performed all simulations, post-processed all results, prepared all figures and data, and contributed to data interpretation and the first draft. FP provided the baseline simulation setup, conceptualized the study, assisted with data analysis and interpretation, and contributed to the first draft. GC provided software support, contributed to the turbulence insertion function implementation, and contributed to data analysis. MB and AB supervised the project and contributed to conceptualization, data interpretation, and the manuscript draft. All authors reviewed the paper and contributed to the final draft.
At least one of the (co-)authors is a member of the editorial board of Wind Energy Science. The peer-review process was guided by an independent editor, and the authors also have no other competing interests to declare.
Publisher's note: Copernicus Publications remains neutral with regard to jurisdictional claims made in the text, published maps, institutional affiliations, or any other geographical representation in this paper. While Copernicus Publications makes every effort to include appropriate place names, the final responsibility lies with the authors.
The authors would like to acknowledge Convergent Science for providing the research license of Converge in the framework of Leonardo Pagamonci's PhD. Thanks are also due to Shengbai Xie from Convergent Science Inc. for providing the original ALM user-defined function and for consulting during data analysis; to Pier Francesco Melani for the original formulation of the Line Average sampling method and the Dağ–Sørensen model, both of which have been adapted and implemented in the Converge CFD framework by Leonardo Pagamonci; and to Francesco Balduzzi for the IT support in running the simulations and for consulting during data analysis. To conclude, many thanks also to Giovanni Ferrara for supervising Leonardo Pagamonci's PhD and for his support throughout the research project.
We received financial support under the National Recovery and Resilience Plan (NRRP), Mission 4, Component 2, Investment 1.1, call for tender no. 104 published on 2 February 2022, by the Italian Ministry of University and Research (MUR), funded by the European Union NextGenerationEU under the project titled “Understanding turbine–wake interaction in floating wind farms through experiments and multi-fidelity simulations (NETTUNO)” (grant assignment decree no. 961 adopted on 30 June 2023 by the Italian Ministry of University and Research (MUR)). The financial support covered the work of Alessandro Bianchini and Marco Belloli and the experiments used for the validation. The research fellow position of Francesco Papi was funded by the Italian Research Center on High Performance Computing, Big Data, and Quantum Computing (ICSC), funded by the European Union's NextGenerationEU project (CUP B83C22002830001).
This paper was edited by Jens Nørkær Sørensen and reviewed by two anonymous referees.
Arabgolarcheh, A., Jannesarahmadi, S., and Benini, E.: Modeling of near wake characteristics in floating offshore wind turbines using an actuator line method, Renew. Energ., 185, 871–887, https://doi.org/10.1016/j.renene.2021.12.099, 2022.
Behrens de Luna, R., Perez-Becker, S., Saverin, J., Marten, D., Papi, F., Ducasse, M.-L., Bonnefoy, F., Bianchini, A., and Paschereit, C.-O.: Quantifying the impact of modeling fidelity on different substructure concepts for floating offshore wind turbines – Part 1: Validation of the hydrodynamic module QBlade-Ocean, Wind Energ. Sci., 9, 623–649, https://doi.org/10.5194/wes-9-623-2024, 2024.
Bergua, R., Robertson, A., Jonkman, J., Branlard, E., Fontanella, A., Belloli, M., Schito, P., Zasso, A., Persico, G., Sanvito, A., Amet, E., Brun, C., Campaña-Alonso, G., Martín-San-Román, R., Cai, R., Cai, J., Qian, Q., Maoshi, W., Beardsell, A., Pirrung, G., Ramos-García, N., Shi, W., Fu, J., Corniglion, R., Lovera, A., Galván, J., Nygaard, T. A., dos Santos, C. R., Gilbert, P., Joulin, P.-A., Blondel, F., Frickel, E., Chen, P., Hu, Z., Boisard, R., Yilmazlar, K., Croce, A., Harnois, V., Zhang, L., Li, Y., Aristondo, A., Mendikoa Alonso, I., Mancini, S., Boorsma, K., Savenije, F., Marten, D., Soto-Valle, R., Schulz, C. W., Netzband, S., Bianchini, A., Papi, F., Cioni, S., Trubat, P., Alarcon, D., Molins, C., Cormier, M., Brüker, K., Lutz, T., Xiao, Q., Deng, Z., Haudin, F., and Goveas, A.: OC6 project Phase III: validation of the aerodynamic loading on a wind turbine rotor undergoing large motion caused by a floating support structure, Wind Energ. Sci., 8, 465–485, https://doi.org/10.5194/wes-8-465-2023, 2023.
Blaylock, M. L., Martinez-Tossas, L., Sakievich, P., Houchens, B. C., Cheung, L., Brown, K., Hsieh, A., Maniaci, D. C., and Churchfield, M. J.: Validation of Actuator Line and Actuator Disk Models with Filtered Lifting Line Corrections Implemented in Nalu-Wind Large Eddy Simulations of the Atmospheric Boundary Layer, in: AIAA SCITECH 2022 Forum, American Institute of Aeronautics and Astronautics, San Diego, CA Online, 3–7 January 2022, https://doi.org/10.2514/6.2022-1921, 2021.
Chen, P., Chen, J., and Hu, Z.: Review of Experimental-Numerical Methodologies and Challenges for Floating Offshore Wind Turbines, Journal of Marine Science and Application, 19, 339–361, https://doi.org/10.1007/s11804-020-00165-z, 2020.
Churchfield, M. J., Schreck, S. J., Martinez, L. A., Meneveau, C., and Spalart, P. R.: An Advanced Actuator Line Method for Wind Energy Applications and Beyond, in: 35th Wind Energy Symposium, Grapevine, Texas, 9–13 January 2017, https://doi.org/10.2514/6.2017-1998, 2017.
Cioni, S., Papi, F., Pagamonci, L., Bianchini, A., Ramos-García, N., Pirrung, G., Corniglion, R., Lovera, A., Galván, J., Boisard, R., Fontanella, A., Schito, P., Zasso, A., Belloli, M., Sanvito, A., Persico, G., Zhang, L., Li, Y., Zhou, Y., Mancini, S., Boorsma, K., Amaral, R., Viré, A., Schulz, C. W., Netzband, S., Soto-Valle, R., Marten, D., Martín-San-Román, R., Trubat, P., Molins, C., Bergua, R., Branlard, E., Jonkman, J., and Robertson, A.: On the characteristics of the wake of a wind turbine undergoing large motions caused by a floating structure: an insight based on experiments and multi-fidelity simulations from the OC6 project Phase III, Wind Energ. Sci., 8, 1659–1691, https://doi.org/10.5194/wes-8-1659-2023, 2023.
Convergent Science: CONVERGE 3.1 Manual, available upon request, Convergent Science Hub [data set], https://convergecfd.com/support/user-resources (last access: 15 May 2025), 2023.
Convergent Science: CONVERGE CFD Software Applications: Wind Turbines, web page, Convergent Science, https://convergecfd.com/applications/wind-turbines (last access: 16 May 2025), 2025.
Combette, R.: Large-Eddy Simulation of a Floating Offshore Wind Turbine with imposed motion, Master Thesis, TU Delft, Delft, Netherlands, https://resolver.tudelft.nl/uuid:c89f950b-22f6-4fb3-a390-8039237f15f8 (last access: 12 August 2025), 2023.
Dağ, K. O. and Sørensen, J. N.: A new tip correction for actuator line computations, Wind Energy, 23, 148–160, https://doi.org/10.1002/we.2419, 2020.
Dallmann, U.: Topological structures of three-dimensional vortex flow separation, in: 16th Fluid and Plasmadynamics Conference, American Institute of Aeronautics and Astronautics, Danvers, MA, U.S.A., 12–14 July 1983, https://doi.org/10.2514/6.1983-1735, 1983.
Fang, Y., Duan, L., Han, Z., Zhao, Y., and Yang, H.: Numerical analysis of aerodynamic performance of a floating offshore wind turbine under pitch motion, Energy, 192, 116621, https://doi.org/10.1016/j.energy.2019.116621, 2020.
Firpo, A., Sanvito, A. G., Persico, G., Dossena, V., Schito, P., and Zasso, A.: Multi-fidelity actuator-line modelling of FOWT wakes, J. Phys. Conf. Ser., 2767, 052050, https://doi.org/10.1088/1742-6596/2767/5/052050, 2024.
Fontanella, A., Bayati, I., Mikkelsen, R., Belloli, M., and Zasso, A.: UNAFLOW: a holistic wind tunnel experiment about the aerodynamic response of floating wind turbines under imposed surge motion, Wind Energ. Sci., 6, 1169–1190, https://doi.org/10.5194/wes-6-1169-2021, 2021.
Fontanella, A., Zasso, A., and Belloli, M.: Wind tunnel investigation of the wake-flow response for a floating turbine subjected to surge motion, J. Phys. Conf. Ser., 2265, 042023, https://doi.org/10.1088/1742-6596/2265/4/042023, 2022.
Fontanella, A., Fusetti, A., Menconi, F., Cioni, S., Papi, F., Muggiasca, S., Persico, G., Dossena, V., Bianchini, A., and Belloli, M.: NETTUNO Experiment 1 – Wake Development in Floating Wind Turbines, Zenodo [data set], https://doi.org/10.5281/zenodo.13994980, 2024.
Fontanella, A., Fusetti, A., Cioni, S., Papi, F., Muggiasca, S., Persico, G., Dossena, V., Bianchini, A., and Belloli, M.: Wake development in floating wind turbines: new insights and an open dataset from wind tunnel experiments, Wind Energ. Sci., 10, 1369–1387, https://doi.org/10.5194/wes-10-1369-2025, 2025.
Frederik, J. A., Doekemeijer, B. M., Mulders, S. P., and van Wingerden, J.-W.: The helix approach: Using dynamic individual pitch control to enhance wake mixing in wind farms, Wind Energy, 23, 1739–1751, https://doi.org/10.1002/we.2513, 2020.
Gilling, L. and Sørensen, N. N.: Imposing resolved turbulence in CFD simulations, Wind Energy, 14, 661–676, https://doi.org/10.1002/we.449, 2011.
Hodgson, E. L., Grinderslev, C., Meyer Forsting, A. R., Troldborg, N., Sørensen, N. N., Sørensen, J. N., and Andersen, S. J.: Validation of Aeroelastic Actuator Line for Wind Turbine Modelling in Complex Flows, Front. Energy Res., 10, 864645, https://doi.org/10.3389/fenrg.2022.864645, 2022.
Jonkman, B. J.: TurbSim User's Guide v2.00.00, Technical Report, National Renewable energy Laboratory, Golden (CO), USA, https://www.nrel.gov/docs/libraries/wind-docs/turbsim_v2-00-pdf.pdf?sfvrsn=5a0a30f8_1 (last access: 12 August 2025), 2016.
Jost, E., Klein, L., Leipprand, H., Lutz, T., and Krämer, E.: Extracting the angle of attack on rotor blades from CFD simulations, Wind Energy, 21, 807–822, https://doi.org/10.1002/we.2196, 2018.
Kleine, V. G., Franceschini, L., Carmo, B. S., Hanifi, A., and Henningson, D. S.: The stability of wakes of floating wind turbines, Phys. Fluids, 34, 074106, https://doi.org/10.1063/5.0092267, 2022.
Larsen, T. and Hanson, T.: A method to avoid negative damped low frequent tower vibrations for a floating, pitch controlled wind turbine, J. Phys. Conf. Ser., 75, 012073, https://doi.org/10.1088/1742-6596/75/1/012073, 2007.
Leweke, T., Quaranta, H., U., Bolnot, H., Blanco-Rodríguez, F. J., and Le Dizès, S.: Long- and short-wave instabilities in helical vortices, J. Phys. Conf. Ser., 524, https://doi.org/10.1088/1742-6596/524/1/012154, 2014.
Martínez-Tossas, L. A., Churchfield, M. J., Yilmaz, A. E., Sarlak, H., Johnson, P. L., Sørensen, J. N., Meyers, J., and Meneveau, C.: Comparison of four large-eddy simulation research codes and effects of model coefficient and inflow turbulence in actuator-line-based wind turbine modeling, J. Renew. Sustain. Ener., 10, 033301, https://doi.org/10.1063/1.5004710, 2018.
McCann, J.: Annual Report, Tech. rep., International Energy Agency (IEA), https://www.iea.org/reports/world-energy-outlook-2016 (last access: 16 May 2025), 2016.
Melani, P. F., Balduzzi, F., Ferrara, G., and Bianchini, A.: How to extract the angle attack on airfoils in cycloidal motion from a flow field solved with computational fluid dynamics? Development and verification of a robust computational procedure, Energ. Convers. Manage., 223, 113284, https://doi.org/10.1016/j.enconman.2020.113284, 2020.
Menon, S., Yeung, P.-K., and Kim, W.-W.: Effect of subgrid models on the computed interscale energy transfer in isotropic turbulence, Computers & Fluids, 25, 165–180, https://doi.org/10.1016/0045-7930(95)00036-4, 1996.
Messmer, T., Hölling, M., and Peinke, J.: Enhanced recovery caused by nonlinear dynamics in the wake of a floating offshore wind turbine, J. Fluid Mech., 984, A66, https://doi.org/10.1017/jfm.2024.175, 2024a.
Messmer, T., Peinke, J., and Hölling, M.: Wind tunnel investigation on the recovery and dynamics of the wake of a floating offshore wind turbine subjected to low inflow turbulence, J. Phys. Conf. Ser., 2767, 092083, https://doi.org/10.1088/1742-6596/2767/9/092083, 2024b.
Meyer Forsting, A. R., Pirrung, G. R., and Ramos-García, N.: A vortex-based tip/smearing correction for the actuator line, Wind Energ. Sci., 4, 369–383, https://doi.org/10.5194/wes-4-369-2019, 2019.
Musial, W., Beiter, P., Spitsen, P., Nunemaker, J., Gevorgian, V., Cooperman, A., Hammond, R., and Shields, M.: Offshore Wind Technology Data Update (2019) [Slides], United States, National Renewable Energy Laboratory, Golden (CO), USA, https://doi.org/10.2172/1677477, 2020.
NETTUNO: Understanding turbine-wake interaction in floating wind farms through experiments and multi-fidelity simulations, NETTUNO, https://www.nettuno-project.it/ (last access: 12 August 2025), 2025.
Nilsson, K., Shen, W. Z., Sørensen, J. N., Breton, S.-P., and Ivanell, S.: Validation of the actuator line method using near wake measurements of the MEXICO rotor, Wind Energy, 18, 499–514, https://doi.org/10.1002/we.1714, 2015.
Papi, F., Melani, P. F., Xie, S., Perrone, C., Scienza, P., Balduzzi, F., and Bianchini, A.: Development and Validation of an Advanced Actuator Line Model for Wind Turbines, E3S Web Conf., 312, 08004, https://doi.org/10.1051/e3sconf/202131208004, 2021.
Papi, F., Jonkman, J., Robertson, A., and Bianchini, A.: Going beyond BEM with BEM: an insight into dynamic inflow effects on floating wind turbines, Wind Energ. Sci., 9, 1069–1088, https://doi.org/10.5194/wes-9-1069-2024, 2024.
Piscaglia, F., Montofano, A., and Onorati, A.: Towards the LES Simulation of IC Engines with Parallel Topologically Changing Meshes, SAE International Journal of Engines, 6, 926–940, https://doi.org/10.4271/2013-01-1096, 2013.
Ramos-García, N., Kontos, S., Pegalajar-Jurado, A., González Horcas, S., and Bredmose, H.: Investigation of the floating IEA Wind 15 MW RWT using vortex methods Part I: Flow regimes and wake recovery, Wind Energy, 25, 468–504, https://doi.org/10.1002/we.2682, 2022.
Ribeiro, A. F. P., Leweke, T., Abraham, A., So?rensen, J. N., Mikkelsen, R. F.: Blade-resolved and actuator line simulations of rotor wakes, Computers & Fluids, 287, https://doi.org/10.1016/j.compfluid.2024.106477, 2025.
Richards, K. J., Senecal, P. K., and Pomraning, E.: CONVERGE 3.0*, Convergent Science, Madison, WI, 2024 – TheThis reference indicates a closed-source commercial software, Convergent Science [software], https://convergecfd.com/blog/bibliography (last access: 12 February 2025), 2024.
Robertson, R.: Offshore Code Comparison Collaboration, Continuation, with Correlation and uncertainty (OC6), technical report, technology collaboration programme, International Energy Agency, https://iea-wind.org/wp-content/uploads/2022/12/IEA_Wind_TCP_AR2021_Task30.pdf (last access: 12 August 2025), 2025.
Schepers, J. G., Boorsma, K., Madsen, H. A., Pirrung, G. R., Bangga, G., Guma, G., Lutz, T., Potentier, T., Braud, C., Guilmineau, E., Croce, A., Cacciola, S., Schaffarczyk, A. P., Lobo, B. A., Ivanell, S., Asmuth, H., Bertagnolio, F., Sørensen, N. N., Shen, W. Z., Grinderslev, C., Forsting, A. M., Blondel, F., Bozonnet, P., Boisard, R., Yassin, K., Hoening, L., Stoevesandt, B., Imiela, M., Greco, L., Testa, C., Magionesi, F., Vijayakumar, G., Ananthan, S., Sprague, M. A., Branlard, E., Jonkman, J., Carrion, M., Parkinson, S., and Cicirello, E.: IEA Wind TCP Task 29, Phase IV: Detailed Aerodynamics of Wind Turbines, Zenodo, https://doi.org/10.5281/zenodo.4813068, 2021.
Sørensen, J. N. and Shen, W. Z.: Numerical Modeling of Wind Turbine Wakes, J. Fluid. Eng.-T. ASME Journal of Fluids Engineering, 124, 393–399, https://doi.org/10.1115/1.1471361, 2002.
Spyropoulos, N.: Development of Computational Methods for the Aeroelastic Analysis of Rotors using Grid Based and/or Particle Techniques, Application to Wind Turbine and Helicopter Rotors, PhD Thesis, National Technical University of Athens, Athens, Greece, https://doi.org/10.26240/heal.ntua.26482, 2024.
van den Berg, D., de Tavernier, D., and van Wingerden, J.-W.: Using The Helix Mixing Approach On Floating Offshore Wind Turbines, J. Phys. Conf. Ser., 2265, 042011, https://doi.org/10.1088/1742-6596/2265/4/042011, 2022.
van den Berg, D., de Tavernier, D., and van Wingerden, J.-W.: The dynamic coupling between the pulse wake mixing strategy and floating wind turbines, Wind Energ. Sci., 8, 849–864, https://doi.org/10.5194/wes-8-849-2023, 2023.
Vanelli, T., Rinker, J., and Zalkind, D. S.: Aeroservoelastic stability of a floating wind turbine, J. Phys. Conf. Ser., 2265, 042001, https://doi.org/10.1088/1742-6596/2265/4/042001, 2022.
van Leer, B.: Towards the Ultimate Conservative Difference Scheme II. Monotonicity and Conservation Combined in a Second Order Scheme, J. Comput. Phys., 14, 61–370, https://doi.org/10.1016/0021-9991(74)90019-9, 1974.
Veers, P., Dykes, K., Lantz, E., Barth, S., Bottasso, C. L., Carlson, O., Clifton, A., Green, J., Green, P., Holttinen, H., Laird, D., Lehtomäki, V., Lundquist, J. K., Manwell, J., Marquis, M., Meneveau, C., Moriarty, P., Munduate, X., Muskulus, M., Naughton, J., Pao, L., Paquette, J., Peinke, J., Robertson, A., Sanz Rodrigo, J., Sempreviva, A. M., Smith, J. C., Tuohy, A., and Wiser, R.: Grand challenges in the science of wind energy, Science, 366, eaau2027, https://doi.org/10.1126/science.aau2027, 2019.
Veers, P., Bottasso, C. L., Manuel, L., Naughton, J., Pao, L., Paquette, J., Robertson, A., Robinson, M., Ananthan, S., Barlas, T., Bianchini, A., Bredmose, H., Horcas, S. G., Keller, J., Madsen, H. A., Manwell, J., Moriarty, P., Nolet, S., and Rinker, J.: Grand challenges in the design, manufacture, and operation of future wind turbine systems, Wind Energ. Sci., 8, 1071–1131, https://doi.org/10.5194/wes-8-1071-2023, 2023.
Wang, C., Campagnolo, F., Canet, H., Barreiro, D. J., and Bottasso, C. L.: How realistic are the wakes of scaled wind turbine models?, Wind Energ. Sci., 6, 961–981, https://doi.org/10.5194/wes-6-961-2021, 2021.
Werner, H., Wengle, H.: Large-Eddy Simulation of Turbulent Flow Over and Around a Cube in a Plate Channel, in: Turbulent Shear Flows 8, edited by: Durst, F., Friedrich, R., Launder, B. E., Schmidt, F. W., Schumann, U., and Whitelaw, J. H., 155–168 pp., Springer, Berlin, Heidelberg. https://doi.org/10.1007/978-3-642-77674-8_12, 1993.
Widnall, S. E.: The stability of a helical vortex filament, J. Fluid Mech., 54, 641–663, 1972.
Widnall, S. E.: The instability of short waves on a vortex ring, J. Fluid Mech., 66, 35–47, 1974.
Xie, S.: An actuator-line model with Lagrangian-averaged velocity sampling and piecewise projection for wind turbine simulations, Wind Energy, 24, 1095–1106, https://doi.org/10.1002/we.2619, 2021.
Xu, S., Yang, X., Zhao, W., and Wan, D.: Numerical analysis of aero-hydrodynamic wake flows of a floating offshore wind turbine subjected to atmospheric turbulence inflows, Ocean Eng., 300, 117498, https://doi.org/10.1016/j.oceaneng.2024.117498, 2024.
Yoshizawa, A. and Horiuti, K.: A Statistically-Derived Subgrid-Scale Kinetic Energy Model for the Large-Eddy Simulation of Turbulent Flows, J. Phys. Soc. Jpn., 54, 2834–2839, https://doi.org/10.1143/JPSJ.54.2834, 1985.
Yu, Z., Ma, Q., Zheng, X., Liao, K., Sun, H., and Khayyer, A.: A hybrid numerical model for simulating aero-elastic-hydro-mooring-wake dynamic responses of floating offshore wind turbine, Ocean Eng., 268, 113050, https://doi.org/10.1016/j.oceaneng.2022.113050, 2023.
- Abstract
- Introduction
- Case study
- Numerical setup
- Results
- Conclusions
- Appendix A: Wind tunnel velocity spectrum
- Appendix B: Mesh resolution in URANS and LES simulations
- Data availability
- Author contributions
- Competing interests
- Disclaimer
- Acknowledgements
- Financial support
- Review statement
- References