the Creative Commons Attribution 4.0 License.
the Creative Commons Attribution 4.0 License.
 | 07 Oct 2025
On the wake re-energization of the X-Rotor vertical-axis wind turbine via the vortex-generator strategy
Andrea Sciacchitano
Carlos Ferreira
Wake losses are a significant source of inefficiency in wind farm arrays, hindering the development of high-energy-density wind farms offshore. Studies have demonstrated the potential of vertical-axis wind turbines (VAWTs) to achieve high-energy-density configurations, due to their increased rate of wake recovery compared with their horizontal-axis counterparts. Recent works have demonstrated a wake control technique for VAWTs that utilizes blade pitch to accelerate the wake recovery, hereinafter referred to as the “vortex-generator” method. The present work is an experimental investigation of the wake topology using this control technique for the novel X-Rotor VAWT. The time-averaged wake topology of the X-Rotor has been measured by stereoscopic particle-image velocimetry at three fixed-pitch conditions of the top blades, namely pitch-in, pitch-out, and a baseline case with no pitch applied. The results demonstrate the wake recovery mechanism linked to the streamwise vorticity system of the rotor and the mechanisms that lead to a streamwise momentum recovery, where the pitched-in case injects high-momentum flow from above the rotor while ejecting the wake from the sides. In contrast, the pitched-out case operates in a mirrored fashion, with high-momentum flow injected into the wake from the sides while low-momentum flow is ejected out axially above the rotor. These modes of operation demonstrate a significant increase in the available power for hypothetical downstream turbines, reaching as high as a factor of 2.2 two rotor diameters downstream compared with the baseline case. The pitched-in case exhibits a higher rate of momentum recovery in the wake, compared with the pitch-out configuration.
- Article
(12134 KB) - Full-text XML
- BibTeX
- EndNote


Given the increasing demand for renewable energy, researchers and operators are exploring ways to increase the efficiency of wind farms. Wake loss is a critical component that contributes to the under-performance of a wind farm, where turbines in deep array configurations often operate in regions of low-momentum flow imparted by upwind turbines, leading to power losses of the order of 10 %–23 %. depending on the farm layout and location (Barthelmie et al., 2010; Pryor et al., 2021). Wake steering is a popular method for increasing the net efficiency of a wind farm. It entails the intentional misalignment of select turbines with the incoming wind direction through yaw control, deflecting the wake away from potential downstream turbines (Fleming et al., 2017, 2019, 2020). Several experimental and numerical studies have been conducted to understand the underlying physics of the wake steering strategy to develop effective and efficient control strategies for farm-scale applications (Houck, 2022). The conclusion is that the driving mechanism for the wake recovery of a yawed horizontal-axis wind turbine (HAWT) is a counter-rotating vortex pair (CVP) that enhances the vertical and lateral momentum flux and deflects the wake (Howland et al., 2016; Bastankhah and Porté-Agel, 2016; Bossuyt et al., 2021). Additionally, more advanced wake recovery techniques are being developed, such as the helix (Frederik et al., 2020; van der Hoek et al., 2024) and pulse (van den Berg et al., 2023) methods, which rely on dynamic induction control.
Offshore wind energy has gained attention due to favorable wind resources and fewer social and environmental restrictions (Wang et al., 2015, Esteban et al., 2011). However, economically viable offshore spaces are limited, requiring shallow waters, proximity to coastal demand, and minimal interference with shipping and fishing (Ruijgrok et al., 2019). Additionally, technical challenges like high installation costs, balance of plant expenses, and upscaling of HAWTs increase the levelized cost of energy (LCOE), hindering development (Chaviaropoulos et al., 2014). To maximize offshore wind potential within these constraints, wake recovery strategies and technologies to enhance wind farm power densities are essential.
In light of this, vertical-axis wind turbines (VAWTs) have gained popularity again, due to their potential to achieve higher power densities, compared with HAWTs, in wind farm settings (Dabiri, 2011). This is primarily credited to their faster wake recovery (Rolin and Porté-Agel, 2018) and reduced sensitivity to flow turbulence (Chatelain et al., 2017). Additionally, VAWTs have advantages in the context of offshore deployment, such as independence from wind direction (Jain and Saha, 2019) and a lower center of gravity (Griffith et al., 2016), which can be critical for floating applications. The wake dynamics of VAWTs have been widely studied, with consensus emphasizing the critical role of the trailing vortex system in wake topology and recovery rate (Huang et al., 2023b; Tescione et al., 2014; De Tavernier et al., 2020; Dabiri, 2011). Huang et al. (2023b) demonstrated the link between rotor loading and vorticity, using the actuator cylinder model (De Tavernier et al., 2020) to define quadrant-resolved loading and its connection to blade tip CVPs. Additionally, Huang et al. (2023b) also explored a technique for enhanced wake recovery beyond their intrinsic benefit, namely through passive blade pitch. By modifying quadrant loading, this technique strengthens streamwise vortices, accelerating wake momentum flux and re-energization. Experimental results showed a 13 % thrust increase for a downstream turbine using pitch-controlled upwind rotors (Huang et al., 2023c) and a 40 % improvement in VAWT array power performance via validated numerical models. To overcome the hurdle of high installation and maintenance costs for offshore deployment while maintaining the favorable wake recovery characteristics of VAWTs, a novel turbine geometry named the X-Rotor (Leithead et al., 2019) has been introduced. A consortium funded by a European Union Horizon 2020 grant named XROTOR has been assembled to advance the aforementioned concept further.
The X-Rotor is an innovative VAWT design aimed at reducing the LCOE for offshore applications. Its unique feature is the integration of blade-tip-mounted horizontal-axis wind turbines, or secondary rotors, on an ”X”-shaped primary rotor. This concept functions as an aerodynamic gearbox, where the primary rotor captures mechanical power and the secondary rotors generate electricity (Bensason et al., 2024a). The upper and lower blades of the primary rotor are coned to form the “X”-shape, which is intended to increase the swept volume and hence the extracted energy from the wind, as described by Morgan et al. (2025). The upper blades are pitchable to regulate the performance and the bottom blades are fixed while housing the secondary rotors. Early studies indicate a 20 % reduction in energy costs, compared with traditional HAWTs (Leithead et al., 2019; Flannigan et al., 2022), driven by lightweight direct-drive generators, the elimination of gearboxes, and reduced maintenance costs due to proximity to sea level, avoiding costly jack-up vessel operations (McMorland et al., 2022; Flannigan et al., 2022). Studies of the wake dynamics of the X-shaped primary rotor have been conducted experimentally (Bensason et al., 2023) and numerically (Giri Ajay et al., 2024). However, given recent advancements in using tilt and pitch control for accelerated wake recovery in VAWTs (Huang et al., 2023b; Guo and Lei, 2020; Ribeiro et al., 2024), similar strategies should be evaluated for the X-Rotor. Numerical studies revealed a power performance penalty of up to 20 % for fixed-pitch primary rotor blades, depending on the tip-speed ratio (Giri Ajay et al., 2024), but the wake dynamics associated with pitched blades were not explored. A recent experimental study (Bensason et al., 2024b) tested the “vortex-generator” wake recovery concept on a 1:100 scaled X-Rotor in a wind tunnel, demonstrating the feasibility of this method for the novel geometry. Positive pitch (pitched-in) ejected the wake laterally, drawing free stream flow axially, while negative pitch (pitched-out) featured an axial wake expansion and lateral contraction. The study was limited to near-wake measurements (up to 1.6 D) and only the upper section of the rotor, covering about a third of the total wake. To fully evaluate the “vortex-generator” strategy’s effects on wake topology, trailing vorticity, power availability, and recovery, downstream measurements of the complete wake are necessary.
This work aims to quantify the wake recovery potential and process of the X-Rotor with and without the “vortex-generator” mode. Hence, this study builds on the promising results of Bensason et al. (2024b) by scaling the primary rotor model down to 1:250 so that the entire wake farther downstream can be measured. The secondary rotors are omitted from this study to focus on the role of the “vortex-generator” mode in the recovery of the primary rotor wake. The vorticity system stemming from the unique rotor geometry is hypothesized in Sect. 2. Cross-plane wake measurements are collected in an open-jet wind tunnel using a stereoscopic particle image velocimetry setup up to six diameters away from the rotor, as described in Sect. 3. The wake topology at different modes of operation is presented in Sect. 4.1, followed by an assessment of the available power in the wake in Sect. 4.2. The aforementioned vorticity system is verified in Sect. 4.3 and linked to the modified wake shapes. The dominant role of the vortex system is further elucidated in Sect. 4.4 by predicting the wake recovery modes using a simplified point-vortex model. Finally, the mean kinetic energy replenishment process is detailed in Sect. 4.5. The main conclusions and outlook on future work are discussed in Sect. 5.
The load distribution of VAWTs can be modeled using the actuator cylinder (AC) approach (Madsen et al., 2014; De Tavernier et al., 2020; Giri Ajay et al., 2024). Modifying blade loading through passive or active blade pitch has been demonstrated experimentally (LeBlanc and Ferreira, 2022b; Le Fouest and Mulleners, 2024) and computationally using the actuator cylinder method (De Tavernier et al., 2020). Huang et al. (2023b) showed that passive blade pitch can alter actuator loading, trailing vorticity, and wake topology, enabling faster wake recovery. A schematic for the X-Rotor’s loading characteristics, adapted from Bensason et al. (2024b), is shown in Fig. 1. The rotor cycle is divided into four quadrants: upwind windward (UW), upwind leeward (UL), downwind leeward (DL), and downwind windward (DW). Arrows represent the magnitude and direction of normal blade loads, assuming uniform load distribution within upwind and downwind halves, with higher loads upwind under zero pitch (De Tavernier et al., 2020). Due to the X-Rotor’s coned blades, local tip-speed ratios and loading profiles vary along the span, introducing unsteady effects. Quadrants are color-coded (red and blue) to indicate counter-clockwise and clockwise trailing vortex rotation, respectively, linked to blade loading and bound circulation, which reverses at θ=0 and 180°. This cyclic trailing vorticity variation has been observed experimentally (Tescione et al., 2014; Bensason et al., 2023).
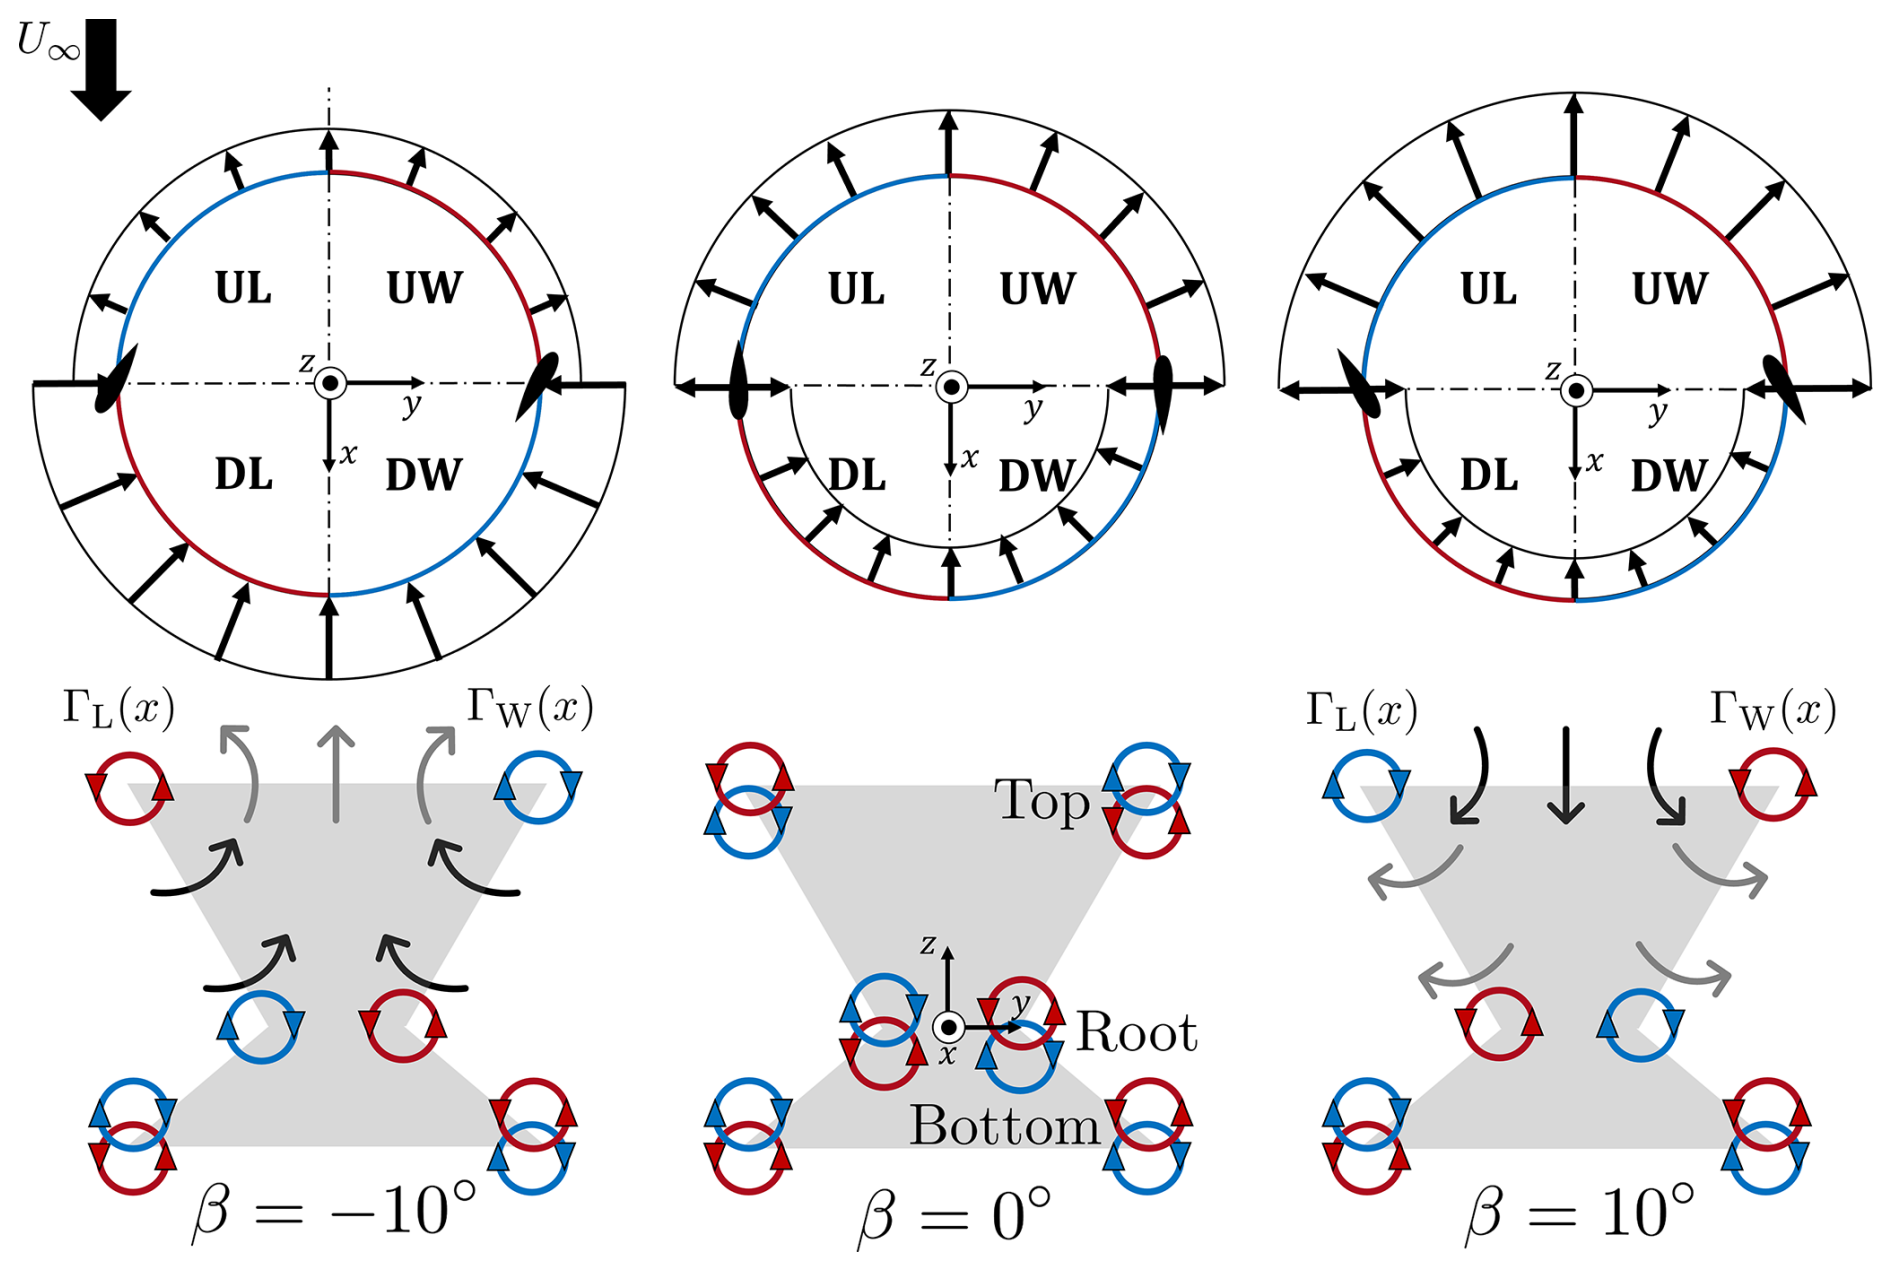
Figure 1Schematic representation of the simplified force fields of the actuator cylinder for the three pitch cases (β) adapted from Bensason et al. (2024b). The blades are exaggerated in size and are located at θ=0 and 180°. Each quadrant of the cylinder is labeled, with 0° , and corresponding to upwind windward (UW), upwind leeward (UL), downwind leeward (DL), and downwind windward (DW), respectively. The rotor cylinder edges are color-coded red and blue based on the direction of the trailing vortex, counter-clockwise and clockwise, respectively, for the upper blade tips. The corresponding frontal area of the rotor (gray-shaded) at a generic plane in the wake is shown for each pitch case. The dominant trailing vortices (round arrows) stemming from the top, bottom, and root sections of the blades are illustrated, along with the induced cross-plane movement in the flow, with low-momentum wake and high-speed flow indicated by gray and black arrows, respectively. The streamwise-dependent circulations of the windward and leeward vortices from the top blades are denoted ΓW(x) and ΓL(x), respectively, for the pitched cases.
Below each idealized actuator load schematic, the projected frontal area of the rotor is shown via a shaded region at a generic downstream position. The intersections in the wake plane of the dominant vortex pairs for each pitch case are represented via circular arrows, color-coded by their directions at the upper blade tips. Black and gray arrows correspond to the directions of high- and low-momentum flow, stemming from the free stream and wake, respectively. Each case is described as follows.
-
Baseline case β= 0°. For the baseline pitch case, the blade will operate in its own wake in the downwind half of the cycle, leading to an intrinsic higher load in the upwind half (LeBlanc and Ferreira, 2022b). However, in the near wake, vortex structures stemming from both the upwind and downwind halves of the rotor will be visible (red and blue), consistent with the observations of Tescione et al. (2014) and Huang et al. (2023b). The directions of rotation of the tip vortices of the bottom blade will be mirrored to that of the upper tips with a circulation. As the bottom blades are shorter and coned at a different angle, they will experience a different cyclic flow variation and, subsequently, loading profile. Following Helmholtz's theorem, the instantaneous circulation of the vortex shed at the root will be a function of those shed at the top and bottom tips. For the baseline case, the loads generated by the upper and lower blades are similar in magnitude between the windward and leeward quadrants, with the largest differences in the peak loads close to θ= 90° (Giri Ajay et al., 2024), and would hence result in a weak root vortex in the streamwise direction. Further, assuming a symmetric load between the windward and leeward sides of the rotor, the strengths and directions of the structures will be mirrored.
-
Pitched-in β= 10°. In this case, the load is shifted toward the upwind half of the rotor, as seen by the increase in length of the vectors on the AC. Subsequently, the trailing vortices generated in the upwind quadrants of the upper blades would be strengthened, and they are shown as the dominant counter-rotating vortex pair (CVP) on the tip of the projected frontal area. These induce a downwash in the wake, where high-momentum free stream flow is injected from above the rotor, while the low-momentum wake is ejected laterally from the sides. The idealized symmetric behavior of this wake morphing is linked to the assumption that the loads on the upwind half of the cycle are symmetric (constant). However, as observed by Bensason et al. (2024b), the vortex on the windward side of the rotor is more dominant as the blade loading on the UW quadrant is higher than in the UL, as confirmed via blade load measurements of LeBlanc and Ferreira (2022b). This phenomenon is intrinsic to VAWTs, as the effective angles of attack experienced by the blade in the UW quadrant are higher than in the UL. The resulting asymmetry in the wake was also observed by Huang et al. (2023b) for an H-type VAWT, resulting in the wake being ejected more dominantly on the windward side. Assuming that the circulation of the bottom blade remains constant (as it is not pitched), the direction of the root vortex will be opposite to that of the upper blade tip.
-
Pitched-out °. In this mode, the load is shifted toward the downwind half of the rotor. As a result, the directions of the dominant CVP are flipped, as the downstream trailing vortices are energized on the upper blades. These are in opposing directions to the positive pitch case and, in turn, induce an upwash in the wake, with low-momentum flow being ejected from above the rotor while high-speed free stream flow is injected from the sides. Similar to the positive pitch case, the symmetry is linked to the assumption that the load is evenly distributed along the downwind half of the rotor. However, as observed by Bensason et al. (2024b), the loads in the DW quadrant are higher in magnitude compared with the DL, leading to a stronger vortex on the windward side and asymmetry in the topology. As before, assuming an unchanged circulation of the bottom blade, the root vortices will be in the opposite direction to those generated in the upper blade tips.
The exploratory work of Bensason et al. (2024b) suggests a significant dependence of the pitched recovery modes on the dominant CVP of the top blades. Hence, a simple model using Lamb–Oseen vortices is used to model the axial flow component at the top of the rotor as a function of downstream location. At a discrete downstream measurement plane (x), the vortex cores (), point-vortex circulations (ΓW,L), and viscous length scale (ηW,L) are considered for both the windward and leeward vortices, denoted with subscripts W and L, respectively. The axial velocities induced by the windward and leeward vortices are denoted and , respectively, and are expressed as (Anderson, 2011)
Here, the radial distances from the vortex core to the measurement point are and for the two vortices. The net-induced axial flow component is the sum of the two and is denoted Uz(y,z):
3.1 Wind tunnel and turbine model
The experiments were carried out in the Open-Jet Facility (OJF) of the TU Delft Aerospace Engineering faculty. This tunnel has been used extensively for scaled VAWT tests (Huang et al., 2023b; Tescione et al., 2014; LeBlanc and Ferreira, 2022a) and features an octagonal outlet with a cross-section of 2.85 × 2.85 m2, as shown in Fig. 2. This closed-loop wind tunnel has a contraction ratio of 3:1 and a jet stream bound by shear layers, with a semi-angle of 4.7° and a reported turbulence intensity of 0.5 % within the testing region (Lignarolo et al., 2014). The region of uniform flow extends 6 m beyond the outlet of the tunnel, which encompasses the measurement area for this experiment. The tunnel houses a 2 m × 3 m table with an adjustable height.
The X-Rotor model is an in-house designed geometrically scaled 1:250 version introduced by Leithead et al. (2019), which is mounted on the adjustable table, as shown in Fig. 2. The rotor solidity is 0.15, where ∑cLN is the sum of the products of the blade height and chord for each of the four blades (N) and A= 0.2057 m2 is the projected frontal area of the rotor. This solidity is close to that of the full-scale model, which is σ=0.17 (Giri Ajay et al., 2024), with the difference due to the use of a straight blade rather than tapered. A detailed schematic of the rotor system is provided in Fig. 3. The X-Rotor geometry is mounted on a 1.2 m long shaft with a diameter of 15 mm. This shaft passes through an aluminum tower of constant external and internal diameters of 50 and 20 mm, respectively. The tower houses a roller bearing with an internal diameter of 15 mm at the top and bottom of the rotor tower to increase the stability of the shaft while minimizing any deflections. Finally, this tower is mounted on a rotor stand, which connects to an in-house designed three-component balance, with a maximum range of ±50 N and maximum error of ≤0.1 %. Prior to the flow-field measurements, the scaled rotor model thrust performance was tested as a function of the tip-speed ratio in the OJF using this balance. Details of the balance design are provided by Huang et al. (2023b) and yield cycle-averaged streamwise and lateral thrust measurements.
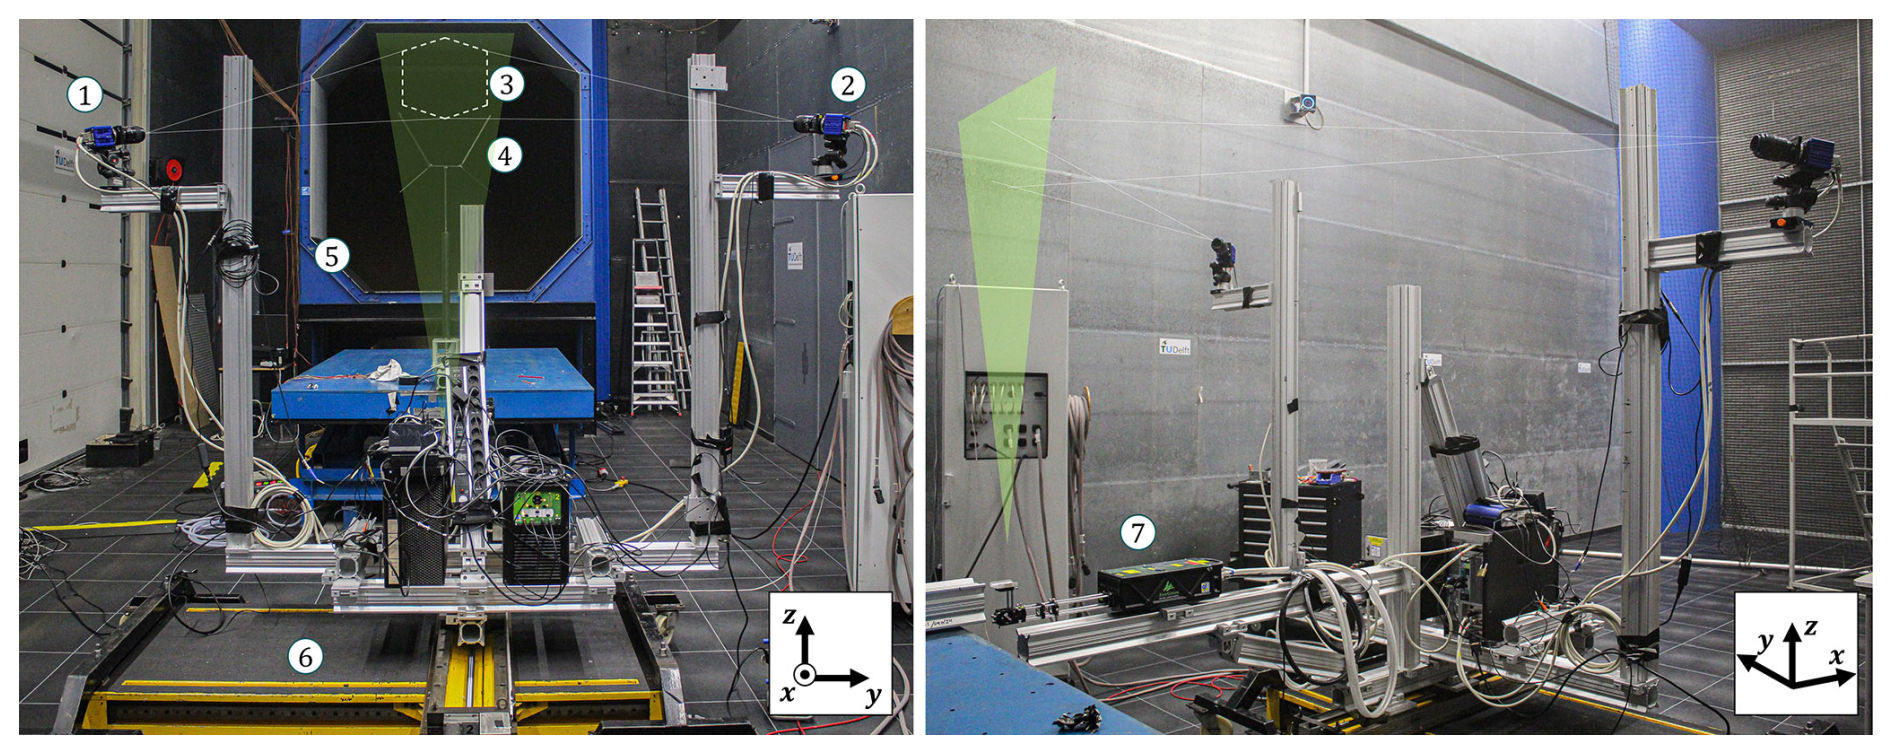
Figure 2Experimental setup in the OJF from two different viewing angles. A visualization of the measurement plane (green triangle) is provided, along with a representation of the camera viewing direction. Main components: ① Camera 1, ② Camera 2, ③ field of view, ④ X-Rotor model, ⑤ OJF outlet, ⑥ traversing system, ⑦ laser.
The X-Rotor model consists of four blades, which are mounted to a cross-beam at the root, as shown in Fig. 3. The rotor has a tip diameter of D=0.6 m on both the bottom and top halves. The blades on the upper and lower halves of the rotor are 0.375 and 0.238 m, with coning angles of 60 and 40°, respectively, yielding a total length of 0.4 and 0.26 m when including the extruded profile of the adapters at the root. All blades are made in-house using a carbon-fiber hand layup technique. They are untwisted and untapered with a constant NACA0021 profile with a chord c= 0.03 m and a hollow section of the same profile with a wall thickness of approximately 1 mm. The cross-beam is 0.2 m long and has the same profile and chord as the blades, with the direction of the leading edge flipping at the center point (connection with the extruded rod), so that it faces the direction of rotation for a counter-clockwise rotating system. Different fixed-pitch adjustments are realized by interchanging modular adapter pieces within the root section of the cross-beam, as shown in Fig. 3. For this experiment, fixed-pitch adapters for β= −10, 0, and 10° are designed to allow qualitative comparison with previous works by Bensason et al. (2024b) and Huang et al. (2023b). As the bottom blades are not pitched, they are not modular and are fixed in the design of the cross-beam at a constant pitch angle of β= 0°. The cross-beam and modular pitch adapters are 3D-printed in AlSi10Mg with a layer thickness of 50 µm and a tolerance of 0.2 mm. The surface roughness is of the order of 1–3 µm after tumbling. All components of the X-Rotor are painted black to minimize laser reflections. The wind-tunnel blockage ratio is 0.03, considering the projected frontal area of the rotor.
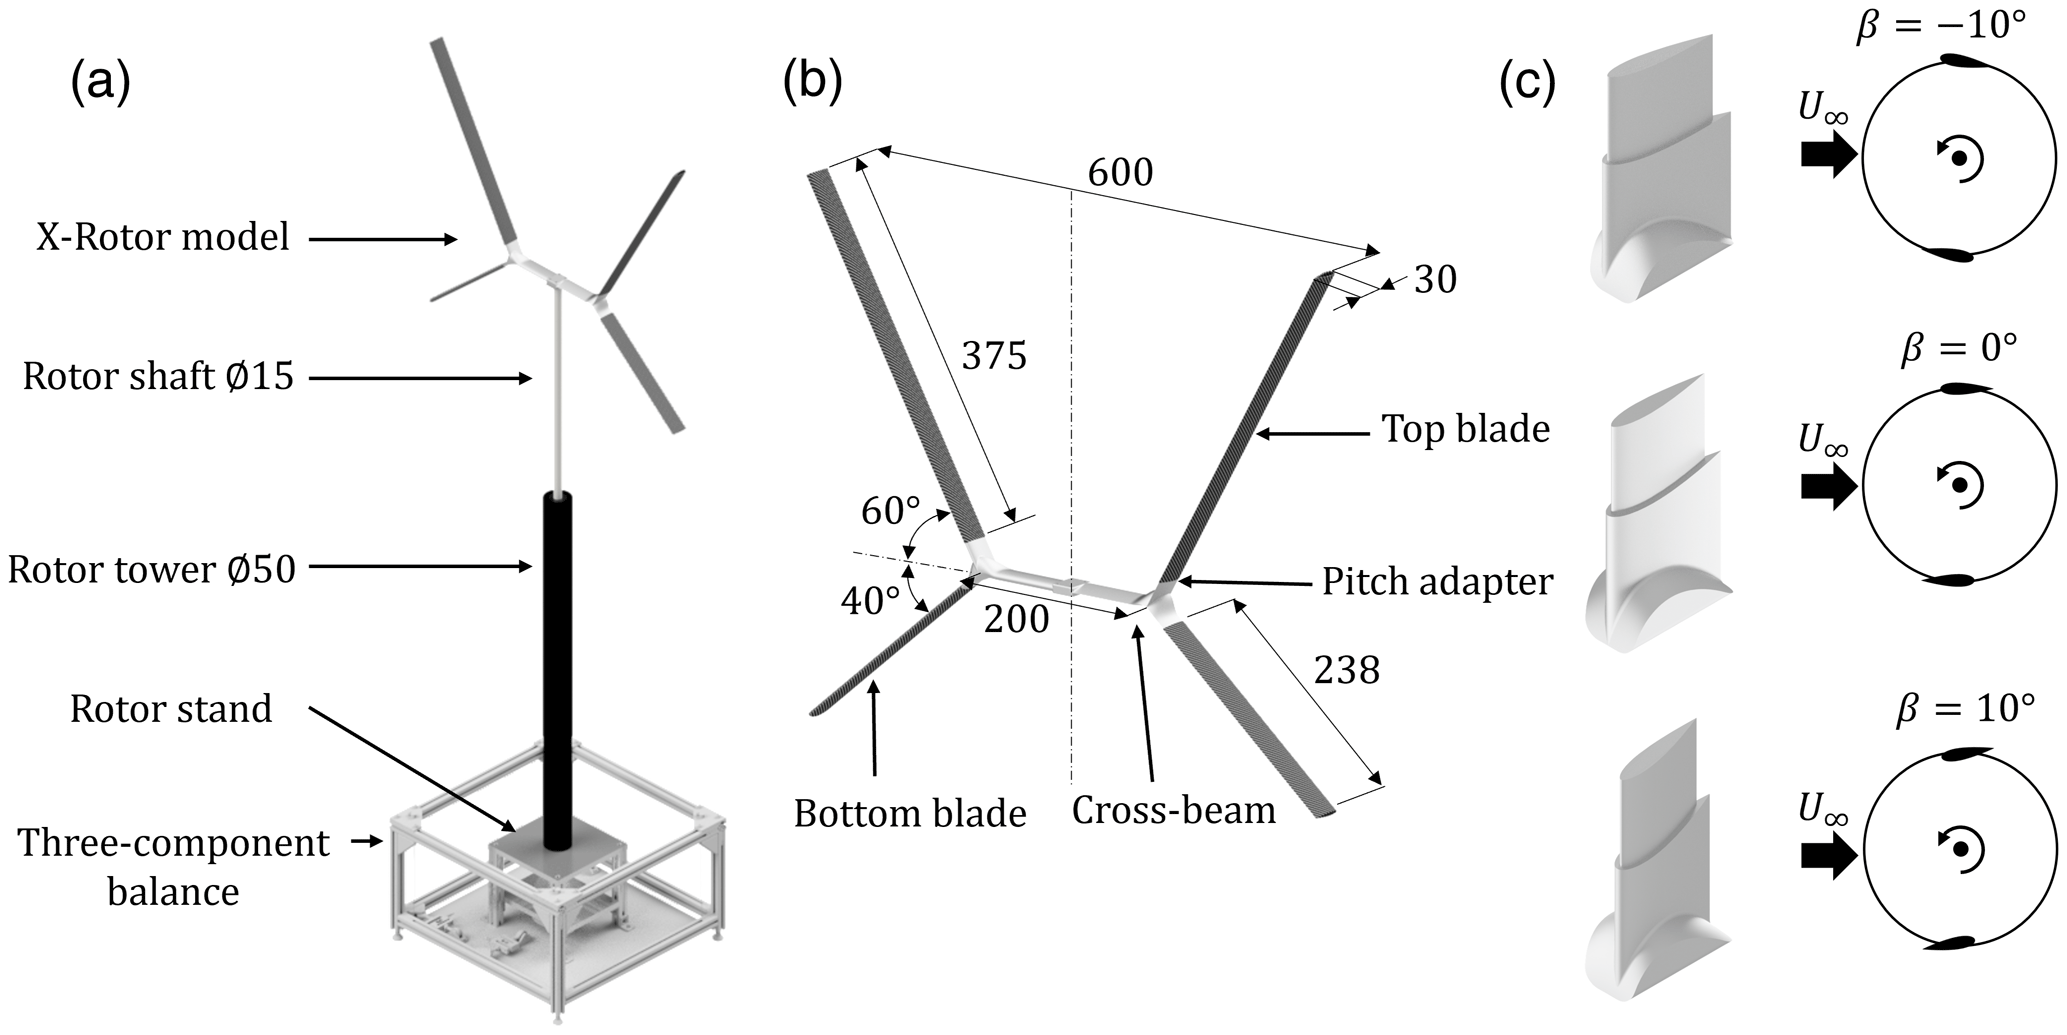
Figure 3(a) Rendered schematic of the X-Rotor model mounted to the three-component balance, with the main components labeled. (b) Dimensioned and labeled schematic of the scaled X-Rotor model. (c) Rendering of the three pitch adapters, with a top-view representation of the pitch direction convention, with positive and negative pitching in and out toward the tower, respectively. All dimensions are in millimeters.
The streamwise and lateral thrusts, CT,x and CT,y, respectively, are given by
where Tx and Ty are the measured streamwise and lateral thrusts [N], respectively, and ρ= 1.225 kg m−3 is the air density. The averages and standard deviations measured over five trials (each with 10 s at 1600 Hz) are shown in Table 1. The behavior in the cycle-averaged thrusts is similar to that reported by Huang et al. (2023b), with a decrease and increase in streamwise thrust for the pitch cases and β=10°, respectively, of +2 % and −14 %. A decrease in streamwise thrust when applying a negative pitch is attributed to the decrease in effective angle of attack experienced by the blade in the upwind passage of the blade, as highlighted by the discussion of Huang et al. (2023b) and by load and flow-field blade-level measurements of LeBlanc and Ferreira (2022a, b) for lab-scale H-type Darrieus VAWTs. Conversely, the increase in streamwise thrust for the positively pitched case is due to the increase in the effective angle of attack in the upwind passage, as commented on by LeBlanc and Ferreira (2022b). Similar to the trend in streamwise thrust, the lateral thrust for the negative pitch decreases by 8 % in magnitude. However, for the positive pitch case, the force increases by over one order of magnitude. This increase is attributed to the significant increase in blade load in the UW quadrant and, subsequently, the lateral imposed force of the actuator on the flow, as visualized by the increased normal forces shown in Fig. 1.
Table 1Measured streamwise (x) and lateral (y) thrust coefficients CT.
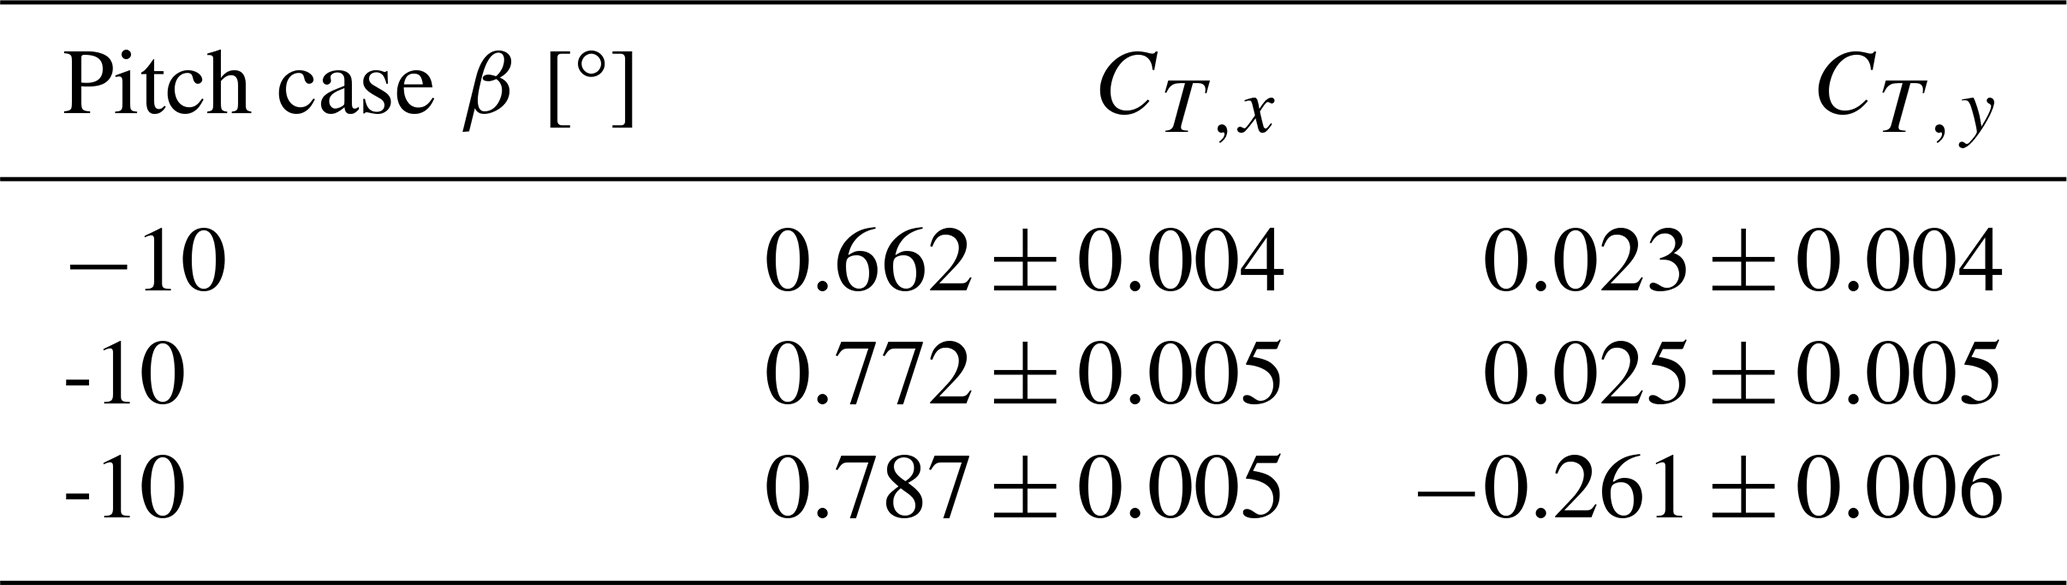
For the baseline case of β= 0°, the lateral thrust is of the order of 30× lower than the streamwise thrust, whereas in the case reported by Huang et al. (2023b) the lateral thrust was of a similar order to that of the streamwise component, being only 5× smaller. This can be attributed to the larger tip-speed ratio in this experiment, yielding a higher degree of symmetry.
3.2 Flow measurement system
The velocity fields in the wake were obtained using a stereoscopic particle image velocimetry (PIV) approach. The seeding was generated using a SAFEX smoke generator, yielding smoke particles with an average particle diameter of 1 µm and a particle density of 103 kg m−3. The particles were illuminated via a Quantel Evergreen double-pulsed Nd:YAG laser with a sheet thickness of approximately 4 mm, using a dual pulse scheme with a wavelength of λL= 532 nm and 200 mJ of pulse energy. Images were recorded at 15 Hz using two LaVision sCMOS cameras with a sensor and pixel size of 2560 px × 2160 px and 6.5 µm, respectively. Images were recorded from the downwind side of the laser sheet, as shown in Fig. 2. Both cameras had lenses of 105 mm focal length, set at a numerical aperture of f#=8. The stereoscopic angles of Camera 1 and Camera 2 were 42 and 46° relative to the normal to the measurement plane, respectively, and the cameras were positioned approximately 2.3 and 2.4 m from the plane, resulting in a field of view (FOV) of approximately 31 cm × 30 cm and a digital image resolution of 7.5 px mm−1. A time separation of 200 µs between image pairs was used. Given the numerical aperture and the magnification factor of the images of M=0.04, the diffraction diameter of the particle images can be calculated using
as ddiff=10.8 µm. This results in a ratio of particle image diameter to pixel diameter of 1.6, resulting in limited peak locking errors (Raffel et al., 2018).
The images were acquired and processed using LaVision's DaVis 8 software. First, background removal was applied to the image pairs by subtracting a minimum time filter with a length of five images. Next, the image pairs were processed using a cross-correlation-based image interrogation algorithm with window deformation, with a window size of 64 px and an overlap factor of 75 %, resulting in a vector spacing of 2.1 mm (0.004 D). Finally, the resulting velocity fields were averaged over time. A total of 300 vector field images were acquired for each measurement plane. Given the rotational frequency of the rotor and acquisition frequency, this results in approximately 160 rotor revolutions.
The camera and laser systems were rigidly connected and mounted on a traversing system, as shown in Fig. 2. This enabled a translation range in the streamwise and lateral directions of 1 and 1.5 m, respectively. Hence, several FOVs were acquired and stitched together in post-processing without re-calibrating the acquisition system, as highlighted in Sect. 3.3.
3.3 Measurement cases
The wind tunnel was operated at a constant wind speed of U∞= 2.7 m s−1. The rotational frequency of the rotor was maintained at ω= 49.95 rad s−1, resulting in a tip-speed ratio of and a diameter-based Reynolds number of ReD=1.1 × 10⁵. Prior studies have investigated the wakes of VAWTs at comparable Reynolds numbers (Bachant and Wosnik, 2016; Rolin and Porté-Agel, 2018; Huang et al., 2023b), finding that the wake structure is largely unaffected by changes in Reynolds number. These findings support the conclusions of Wei et al. (2021), who reported similar wake features between a full-scale VAWT operating under real-world conditions and water-channel experiments conducted at Reynolds numbers 2 orders of magnitude lower.
The time-averaged wake of the X-Rotor was measured using the aforementioned measurement system. The wake was measured at two streamwise positions, Plane 1 and Plane 2, as marked in Fig. 4, which are separated by 1 D from each other. The X-Rotor model was shifted between three positions (Positions 1, 2, and 3), each separated by 2 D in the streamwise direction. In this way, the wake is measured in the region 1 6 at increments of 1 D, where the origin is defined as the center of the tower and cross-beam structure, and the y and z directions are defined as lateral and axial, respectively.
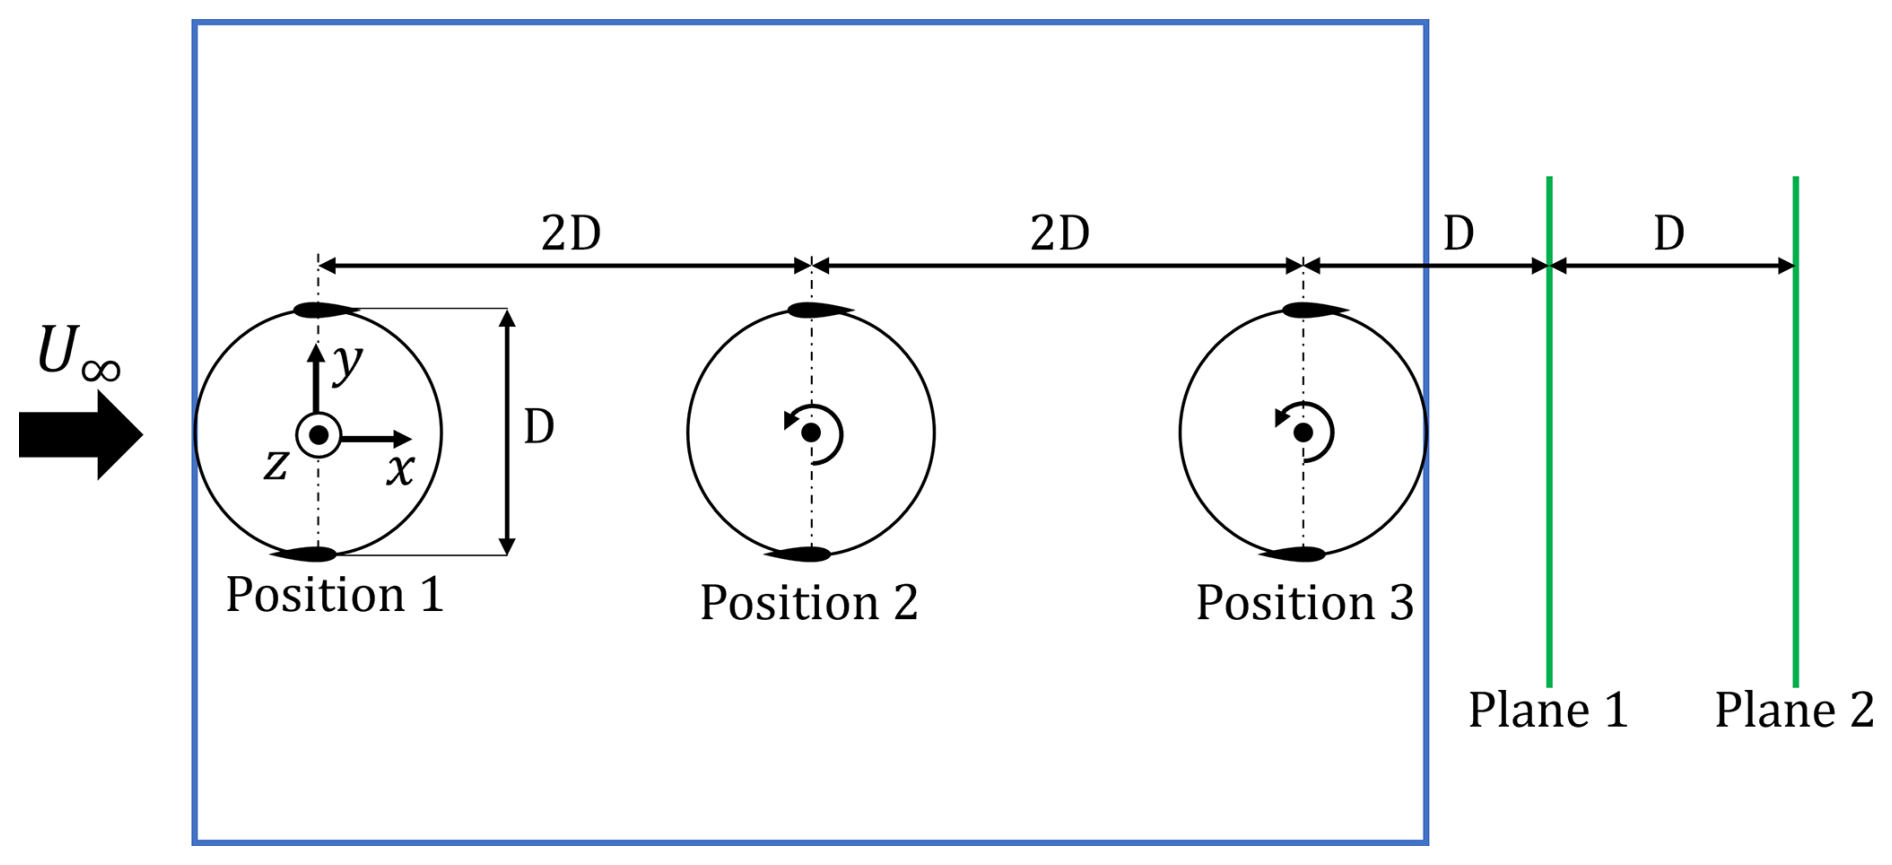
Figure 4Top view of experimental setup, with the coordinate system at the bottom left. The three positions of the X-Rotor on top of the OJF adjustable table are shown, along with the normalized spacings. The two measurement planes, Plane 1 and Plane 2, are shown via solid green lines, with their spacing. The rotor trajectories are shown via solid black lines, with the rotation direction marked. The blade profile sizes are exaggerated for clarity.
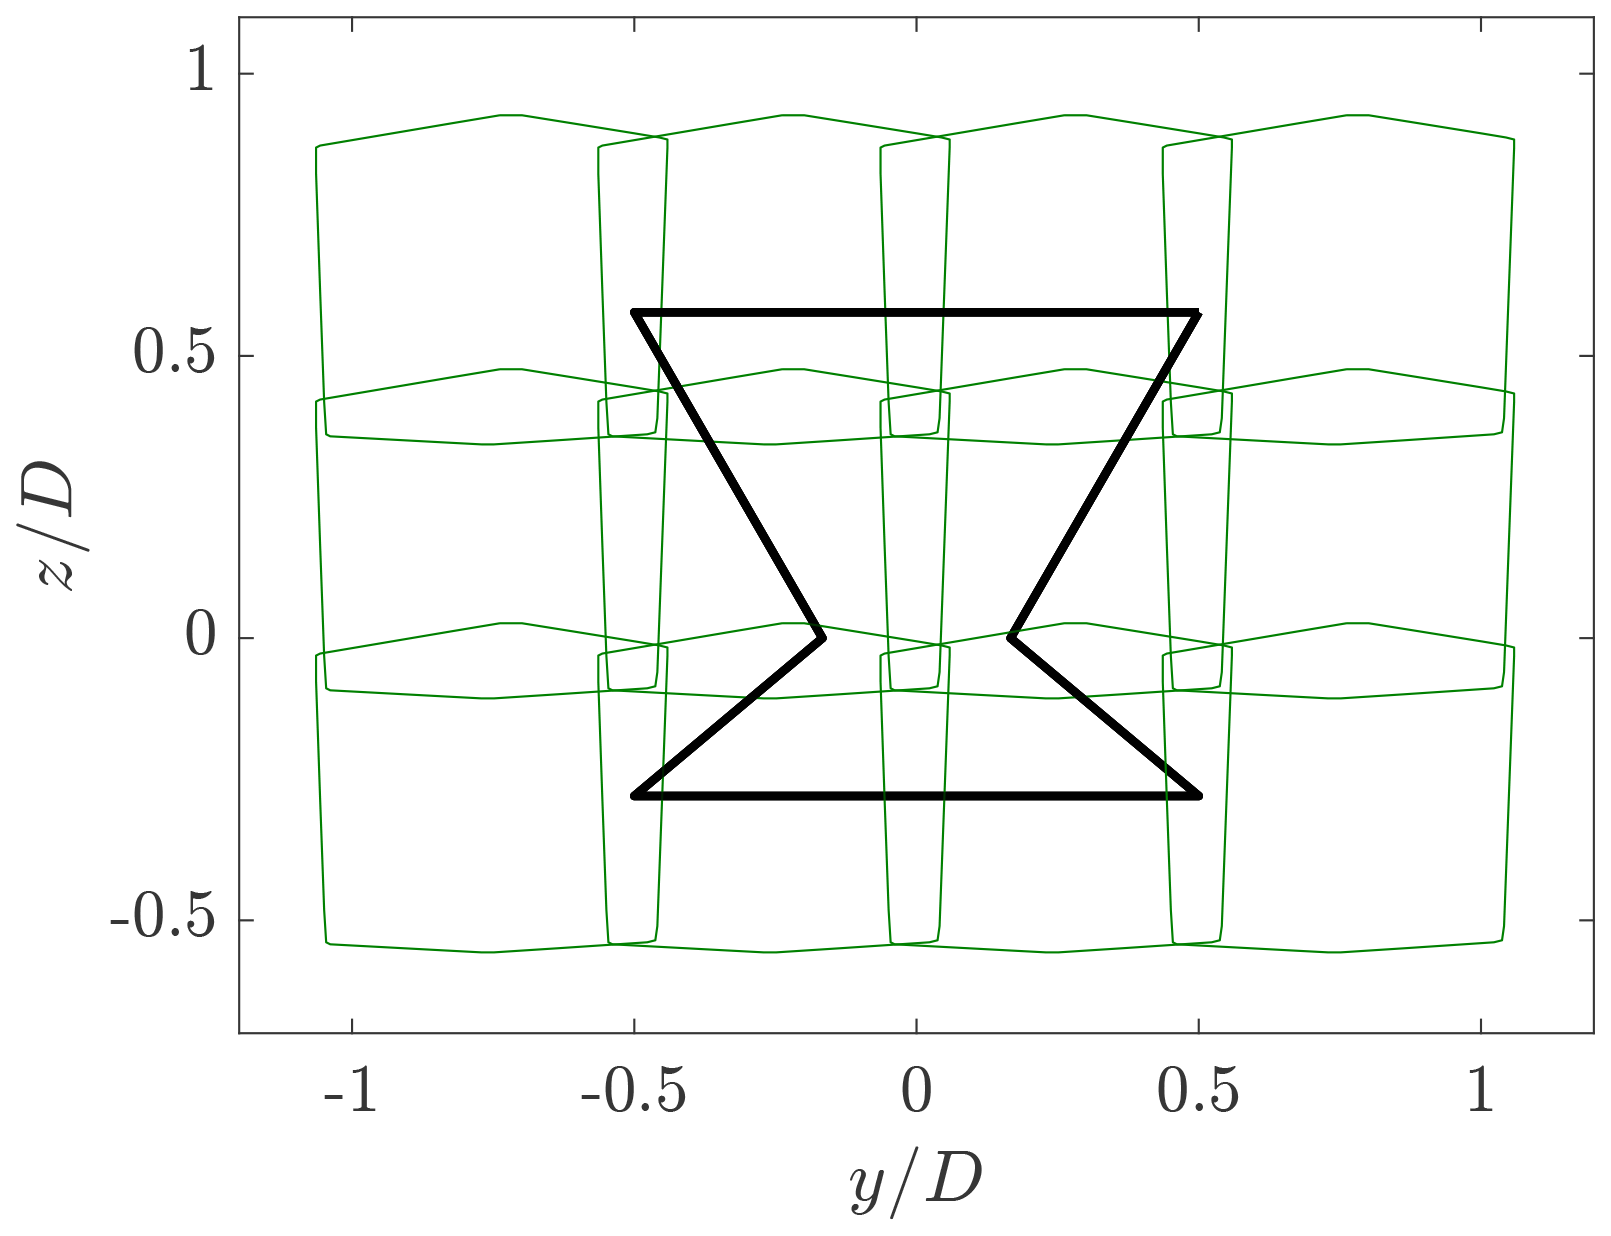
As stated in Sect. 3.2, several fields of view were measured at a given streamwise plane by traversing the PIV system laterally (in the y-direction) using a traversing system having an accuracy of ±0.01 mm. A total of four lateral planes were measured at a given height and streamwise wake position. Furthermore, different measurement heights (z-direction) are realized by adjusting the height of the table to which the rotor is mounted. A total of three heights were acquired for each streamwise wake position. An overview of the measurement planes at a streamwise location of is shown in Fig. 5 for pitch case β=0°. The overlap between planes is approximately 74 and 70 mm in the lateral and axial directions, respectively. The measurement domain is more symmetric for the baseline pitch case β= 0°, while those for the positive (β= 10°) and negative (β= −10°) cases are weighted more on the upper half of the rotor. This is to capture more of the momentum transfer above the rotor caused by the adjusted pitch on the upper blades, as highlighted in previous studies by Bensason et al. (2024b). The velocities in the overlapping regions of the individual measurement planes are treated using a weighted average.
3.4 Measurement uncertainty
Following the work of Sciacchitano and Wieneke (2016) and Huang et al. (2023b), the expanded uncertainty of the velocity for time-averaged measurements can be expressed as
where σU is the standard deviation of the velocity component in the streamwise (x), lateral (y), and axial (z) directions over N=300 samples. This ratio is multiplied by the coverage factor k=1.96 to expand the standard uncertainty to a 95 % confidence level. Across all pitch cases, the maximum uncertainty occurs at the most upwind measurement plane, of along the shear layer of the wake, consistent with the observations of Huang et al. (2023b). The maximum standard deviation occurs for the lateral velocity component of the positive pitch case, with 0.59 m s−1, resulting in a expanded uncertainty of 0.07 m s−1.
The uncertainty of the streamwise vorticity component is calculated as (Sciacchitano and Wieneke, 2016)
where is the standard uncertainty in either the lateral or axial direction, the grid spacing of the interrogation window is denoted d, and ρ(2d) is the cross-correlation coefficient of the spatially correlated velocities. Given the final interrogation window size of 64 px and a scaling factor of 7.454 px mm−1, d= 4.3 mm. The cross-correlation coefficient is approximated to be ρ(2d)≈ 0.45 (Sciacchitano and Wieneke, 2016). Using the maximum expanded uncertainty of 0.07 m s−1, the uncertainty of the streamwise vorticity is computed as 11.9 s−1. This value drops by a factor close to 10 outside the shear layer of the wake.
4.1 Wake topology
The time-averaged normalized streamwise wake contours are shown in Fig. 6 for the three modes. For the baseline case, the wake maintains the X-shape up to , as it is still expanding, consistent with the results shown in Bensason et al. (2023). Further downwind, the wake features a lateral contraction near the upper and lower blade tips and expansion near the center of the cross-beam. Meanwhile, the wake is expanding axially above and below the rotor.
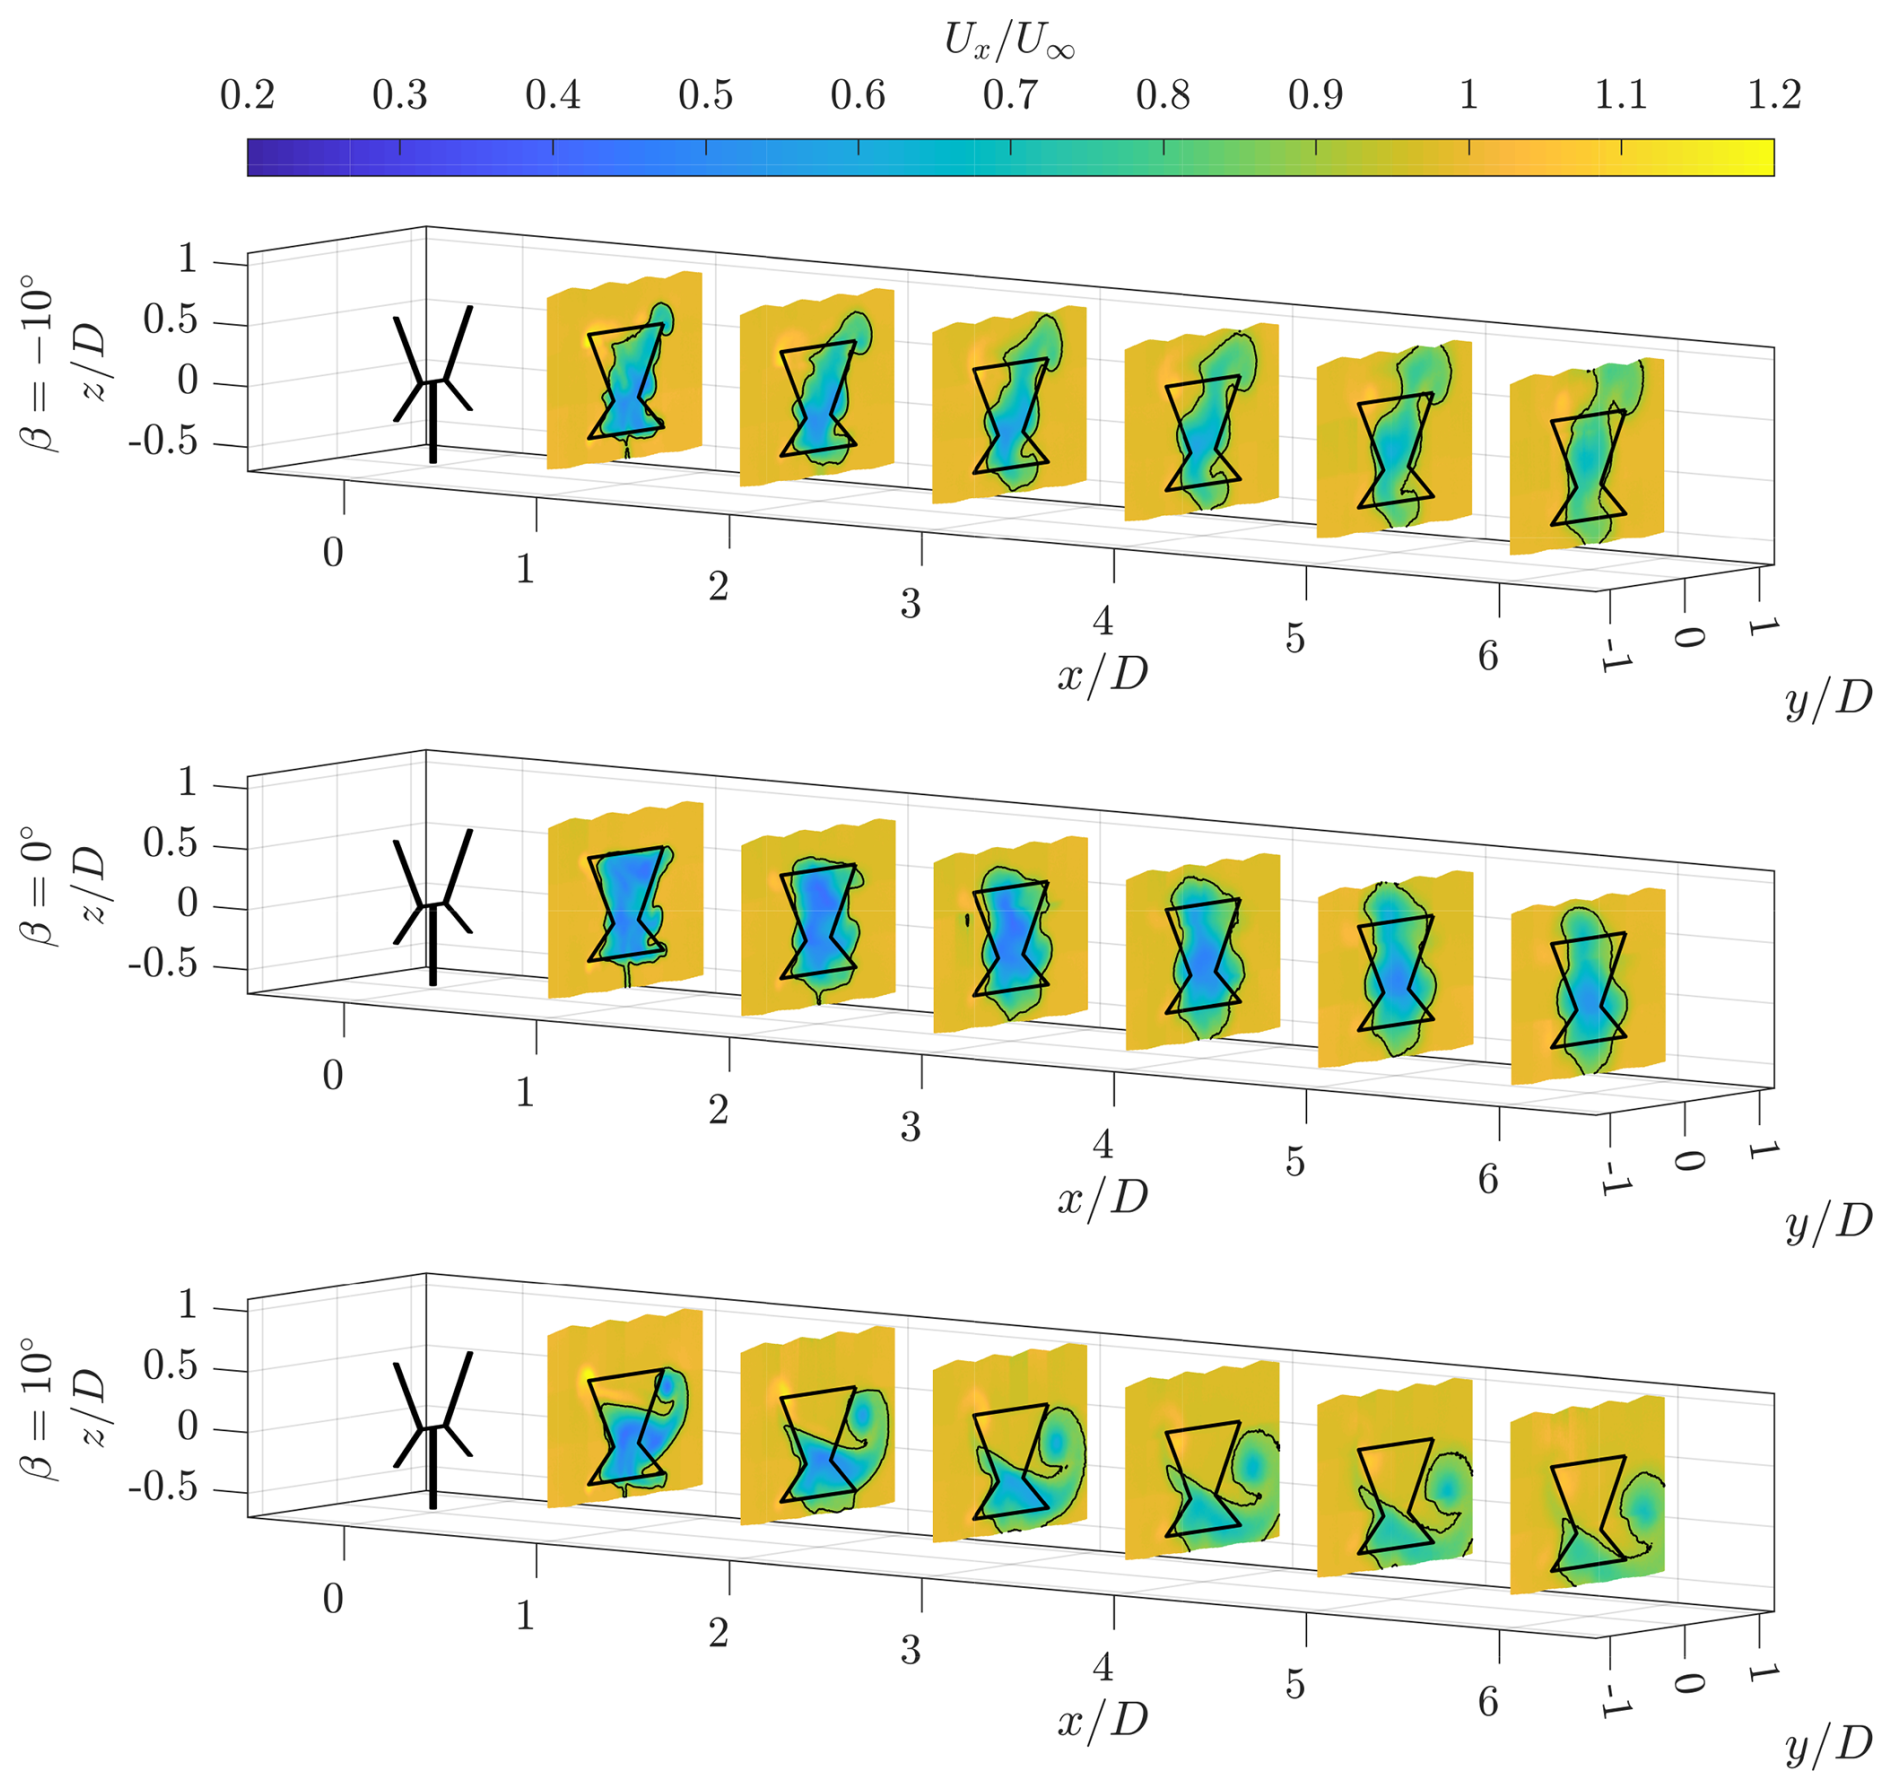
Figure 6Normalized streamwise flow component () at discrete cross-stream planes. The solid black line shows the frontal area of the rotor at an azimuth of 0° with a black contour line showing where . The scale in the streamwise direction is doubled to have the planes more spaced apart for observation.
The negative pitch mode shows a distinctly different topology from the baseline case. The wake shape suggests a vertical stretch and lateral contraction of the wake, compared with the baseline case. This deformation is consistent with that predicted in Sect. 2, with low-momentum flow ejected axially while high-energy free stream flow is injected from the sides. An asymmetry in the deformation is evident, with the wake ejection favoring the windward side of the rotor. This is attributed to the intrinsically higher blade loading experienced by the blade during its windward passage, leading to asymmetric strengths and topologies in the streamwise vortices, discussed further in Sect. 4.3.
For the positive pitch mode, the wake exhibits a substantial deformation, with a large portion of the projected frontal area of the rotor subject to free stream flow. The wake contracts axially while being ejected laterally on the windward side of the rotor, similar to the results of Bensason et al. (2024b). Furthermore, this is consistent with the significant lateral thrust component shown in Table 1. This substantial downwash of the wake is consistent with the movement predicted in Sect. 2. Once again, there is a notable asymmetry, with a larger downwash on the windward side of the rotor. As in the negative pitch case, this is due to the higher blade load on the windward passage. This asymmetry is linked to the streamwise vortex strength, discussed further in Sect. 4.3.
To further quantify the wake deformation of the X-Rotor, the wake center, area, and perimeter are presented in Figs. 7 and 8, respectively. The wake center is computed using the “center-of-mass” approach in the lateral (y) and axial directions (z). This approach is widely accepted as an experimental method for tracking the wake center for VAWTs (Huang et al., 2023b; Wei et al., 2021) and HAWTs (Trujillo et al., 2011), as well as low-order models (Howland et al., 2016). At each streamwise measurement location, the wake center is defined as
where . The integrals are computed over the entire available measurement area at each streamwise location. The wake center development in the lateral and axial directions is plotted for each pitch case in Fig. 7a, and 7b, respectively.
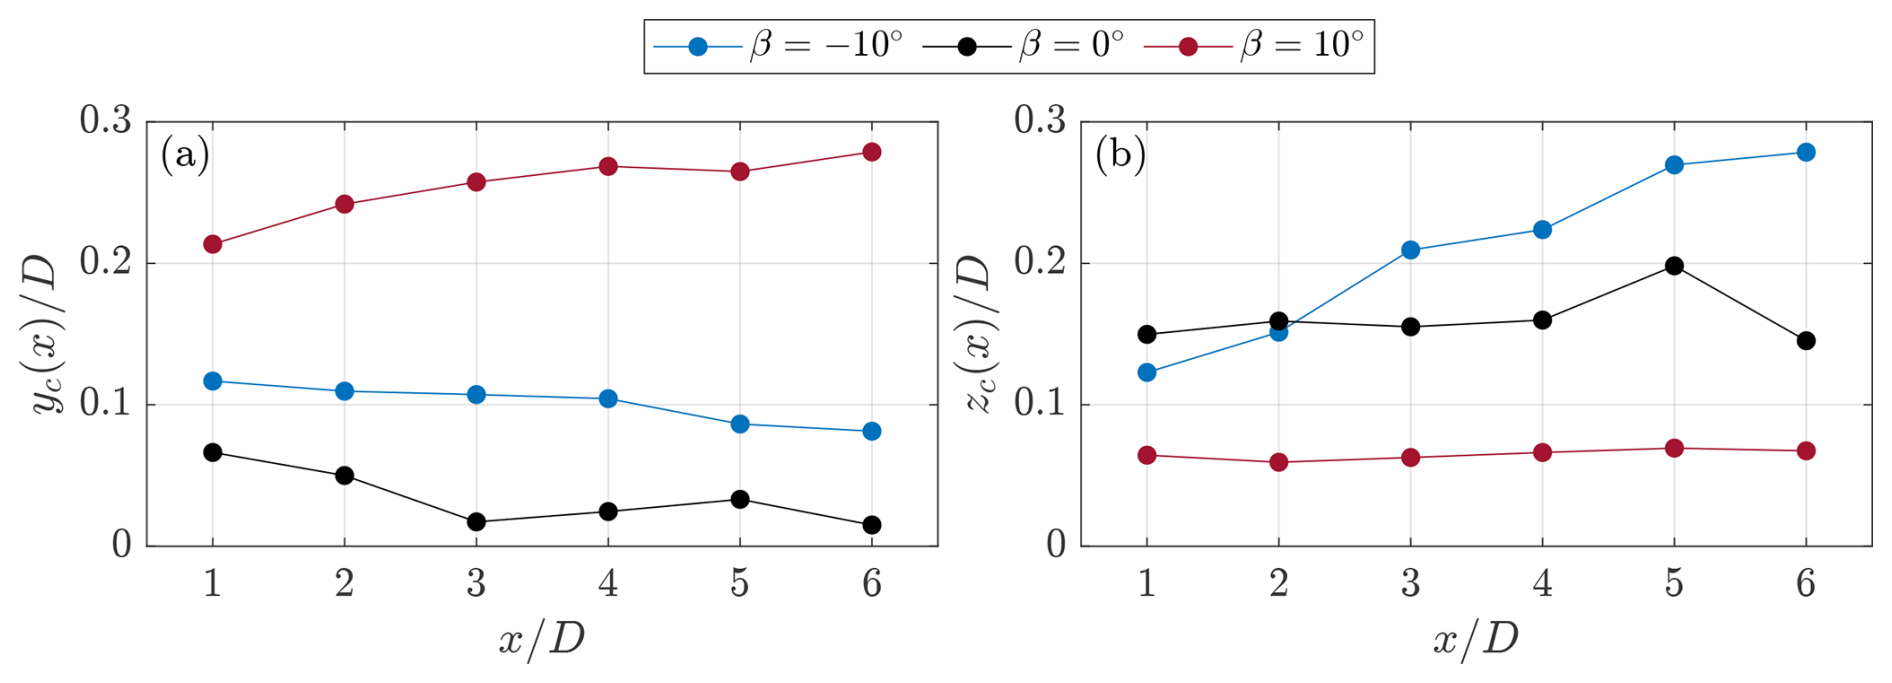
Figure 7Normalized wake center development for the three pitch cases computed using Eq. (7) in (a) the lateral direction and (b) the axial direction .
For the baseline case, a seemingly symmetric axial expansion of the wake is observed, while the lateral flow deficit is concentrated more on the windward side of the rotor. However, as the wake develops, the wake center moves toward the center. The axial movement of the wake center is minimal, due to the aforementioned symmetry. The center of the wake sits around the geometric center of the rotor of .
For the positive pitch case, the wake center is laterally displaced toward the windward side of the rotor by a factor of approximately 4, compared with the baseline case at the most upwind measurement plane . This is consistent with the foregoing discussion and the significant increase in the lateral thrust coefficient reported in Table 1. This lateral displacement increases as the wake evolves, due to the strong advection imposed by the windward vortex, which moves laterally outward. In this case, the wake center's axial position remains constant at a lower position, compared with the other two pitch cases. This can be attributed to the large-scale windward vortex, which remains above the cross-beam height.
Finally, in the negative pitch case, the wake center follows a similar trend to the baseline case in the lateral direction, with a systematically higher wake center toward the windward side of the rotor. Visually, this is consistent with the foregoing discussion, where the wake is contracted and pushed more toward the windward side of the rotor. The axial location of the wake center steeply increases downstream as the wake is ejected out axially above the rotor in an asymmetric fashion between the upper and lower halves of the rotor, unlike the baseline pitch case.
The wake areas and perimeters for the different modes are shown in Fig. 8b. The wake boundary is defined as , as visualized by the black contour lines in Fig. 6. The perimeter is computed by taking the sum of the Euclidean distances between the boundary coordinates. The work of Huang et al. (2022) highlighted the importance of the ratio between the wake perimeter and area () toward the streamwise momentum recovery rate for an actuator surface of generic shape. This link has been numerically and experimentally observed for both HAWTs and VAWTs, where turbulent contributions toward the energy recovery in the wake are concentrated along the shear layer (Bastankhah and Porté-Agel, 2016; Rolin and Porté-Agel, 2018).
The wake area for the three modes increases moving downstream, as shown in Fig. 8a. The baseline case exhibits systematically higher areas than the pitched modes of operation. The positive pitch case shows a local maximum at , which is an artifact of the wake movement outside the measurement domain, as shown in Fig. 6 (indicated via open circles). Similarly, the wakes for the negative and baseline cases begin to exit the measurement domain at . The negative pitch case exhibits the smallest areas across the measurement planes, presumably due to the lower streamwise thrust. In the near wake (), the positive pitch case has the longest perimeter, which decreases substantially at as it leaves the measurement domain. The negative pitch case has a shorter perimeter only at , compared with the baseline case. As will be discussed in Sect. 4.3, the onset of the deformation induced by the streamwise vorticity system of the negative mode is delayed, compared with the other modes, as it relies on the loading of the downwind half of the rotor. The ratio between the perimeter and the wake area is a critical metric, as discussed by Huang et al. (2022), who established the linear dependence between and the rate of streamwise momentum recovery, and is shown in Fig. 8c. Both the negative and positive pitched modes of operation yield systematically higher magnitudes at this ratio, highlighting their favorable tendency toward streamwise momentum recovery.
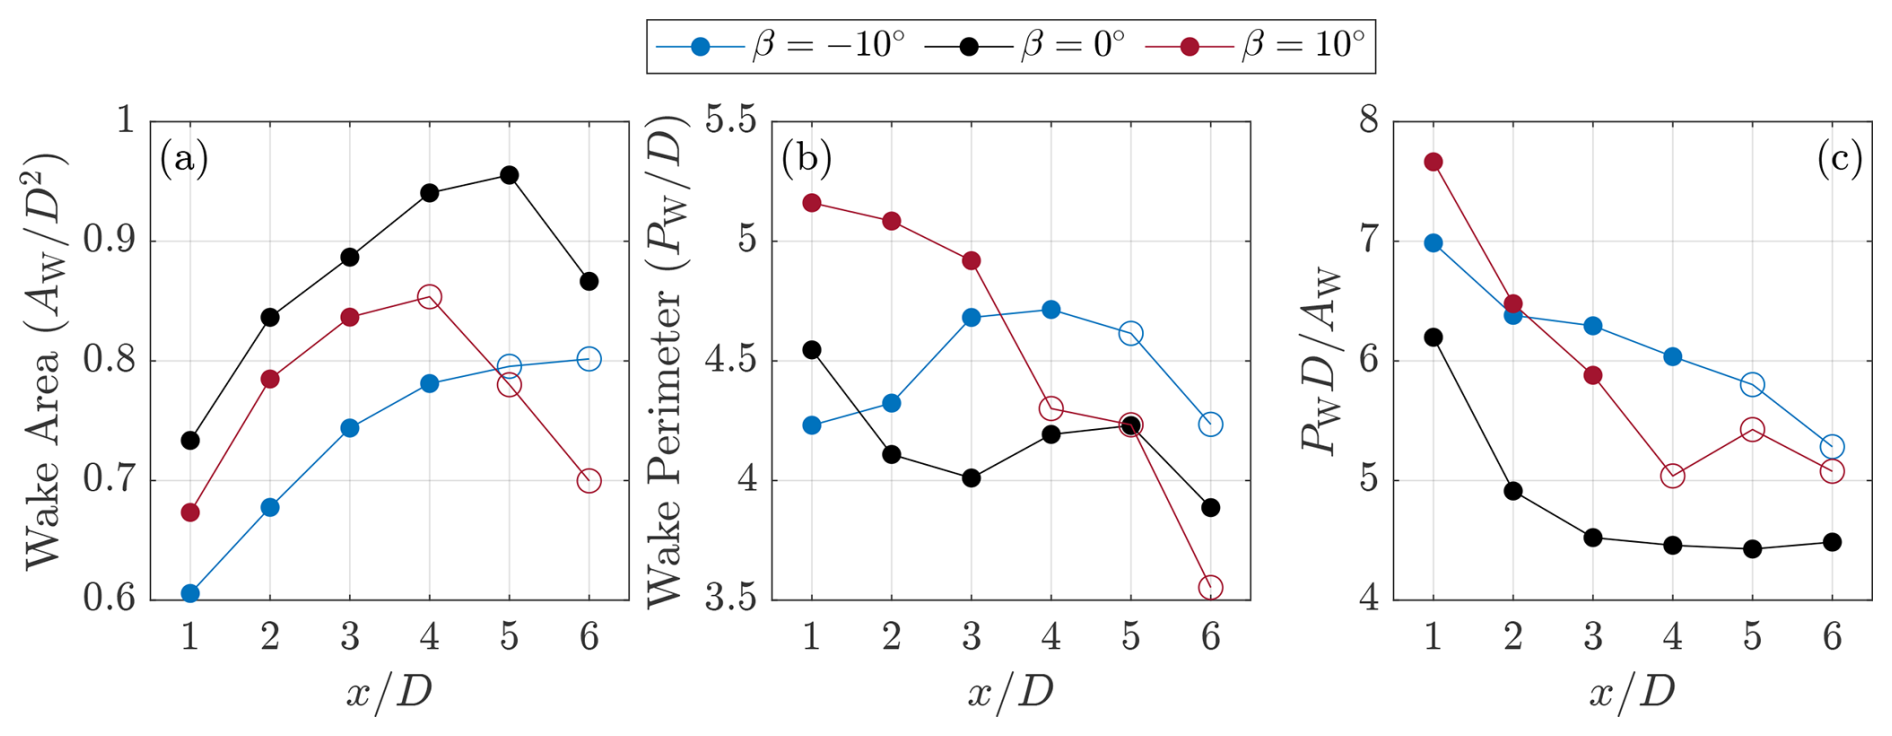
Figure 8(a) The normalized wake area AW and (b) the perimeter PW for the three modes of operation across all measurement planes and (c) the ratio between the perimeter and area. The wake areas are defined as the boundary where , as visualized in Fig. 6. Open circles indicate measurement planes where the complete wake is not captured.
4.2 Available power
The turbine's frontal areas at the streamwise locations in the wake shown in Fig. 6 visually suggest a significant increase in the high-momentum flow available for downstream turbines, which are in line with the upstream rotor. The available power in the wake is quantified at each cross-stream location using the coefficient of available power fAP, expressed as
A similar analysis has been performed by Bossuyt et al. (2021) and Huang et al. (2023b). As in these previous studies, the power performance of the pitching rotor was not measured in this investigation and hence is not considered in the subsequent available power analysis. However, the numerical study of Giri Ajay et al. (2024) concluded a 15 % penalty in performance for a full-scale X-Rotor with at a tip-speed ratio of λ=5; this can be used as a ballpark figure of the penalty when evaluating the relative impacts of the ”vortex-generator” strategy on the wake recovery.
The ratio is the available streamwise wind power at a given measurement plane x. The surface-integrated value is taken within the projected frontal area of the rotor (S) centered at y0,z0. The available power coefficient across all measurement planes is shown in Fig. 9 for each pitch case. The coefficient is computed over a frontal area centered at (directly in line with the upstream rotor) for each case.
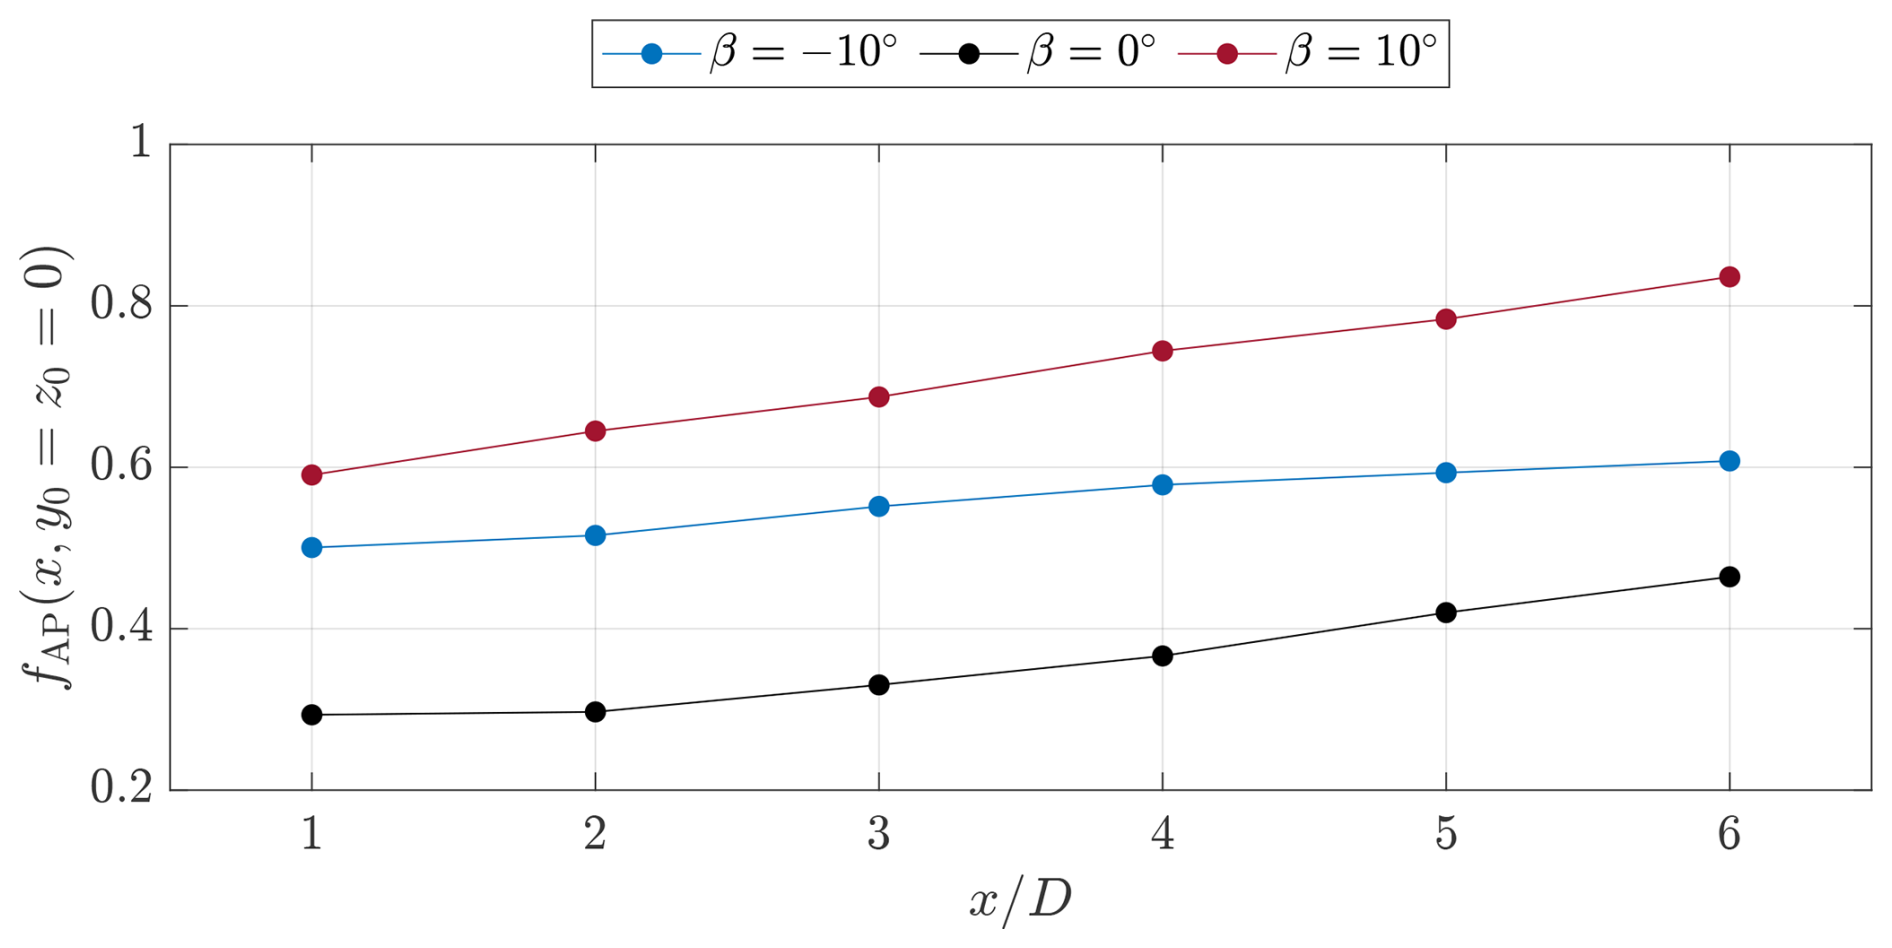
Figure 9Available power for each of the pitch cases calculated using Eq. (8) over the projected frontal area of the rotor on the measurement planes centered at the normalized lateral coordinate (directly downstream without any lateral offset).
For the baseline case, the available power steadily increases as the wake develops, due to the inherent recovery and diffusion. The available power increases by 58 % between and . Both of the wake control strategies increase the available power across all streamwise measurement locations. For the negative pitch case (), the available power increases by 70 % and 31 % at and , respectively, compared with the baseline case (β=0°). The net increase between the two extreme measurement planes for the negative pitch case is 22 %. Consistent with the previously discussed results, the positive pitch case (β=10°) exhibits the higher recovery of available power in the wake between the two pitch cases. In this case, the coefficient increases by 103 % and 83 % at and , respectively, compared with the baseline case (β=0°). The net gain in available power of the positive pitch case is also higher than its negative counterpart, with an increase of 40 % between the two extreme measurement planes. Although the power loss of the rotor is not measured in this study, previous numerical simulations by Giri Ajay et al. (2024) report a decrease in power coefficient of the order of 15 % for the aforementioned pitch cases at a tip-speed ratio of λ=5.
To further understand potential optimal placements of downwind turbines that could have lateral offset to that upwind, the available power coefficient is computed with a sliding integration window and shown in the form of a contour plot in Fig. 10 for each pitch case. Dashed and solid lines indicate the positions where fAP=0.5 and 0.75, respectively.
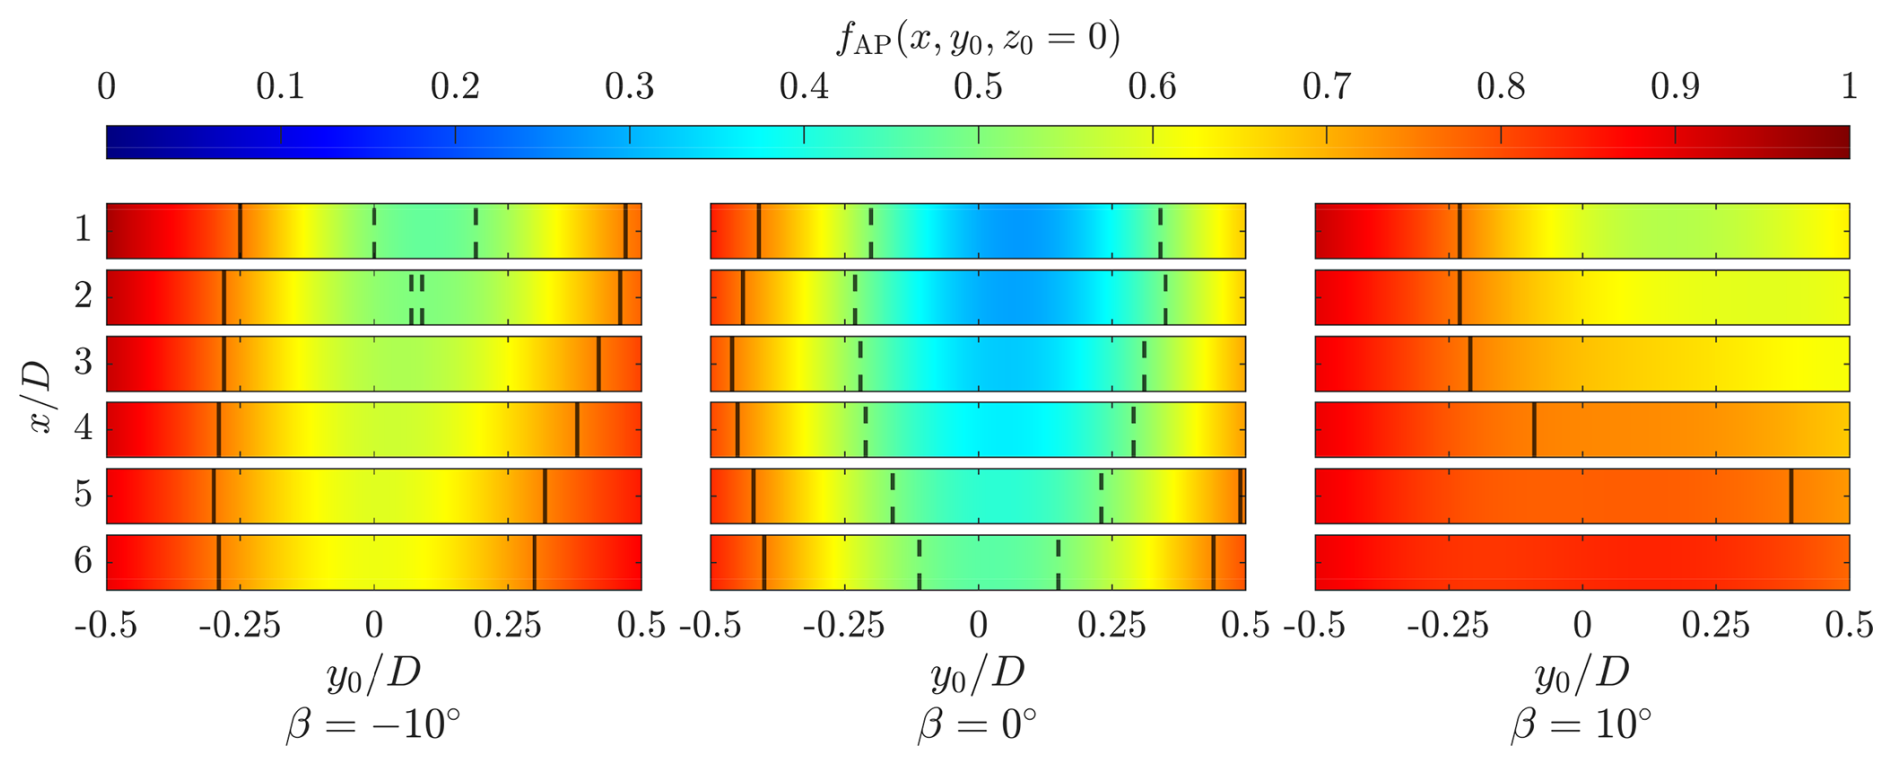
Figure 10Available power distribution for each of the pitch cases integrated within the projected frontal area of the rotor (Eq. 8) centered at the normalized lateral coordinate . Note that, within a band for a given wake position , the values are constant, with no interpolation between measurement planes in the wake. The dashed and solid lines correspond to lateral positions where fAP=0.5 and 0.75, respectively.
For the baseline case, the available power deficit is concentrated directly downstream of the rotor with a slight asymmetry, evident by the availability of fAP>0.75 across all downstream positions around y0= −0.4 on the leeward side. This asymmetry is consistent with the discussion in Sect. 4.1 and can be attributed to the asymmetric loading profile of the rotor. This would suggest a favorable placement of a hypothetical downstream turbine on the leeward side of the rotor, consistent with the results of Huang et al. (2023b).
The negative pitch case exhibits a similar shape to the baseline case, with systematically higher coefficients in available power. In this mode, the wake is ejected above the rotor, as discussed in Fig. 7. As the control volume is not shifted in height (z0=0), the available power deficit remains concentrated more directly downstream of the rotor. In this case, coefficients fAP>0.75 are available on both the leeward and windward sides of the rotor. Similar to the pitch case β=0°, there is an asymmetry in the wake, with a more significant deficit on the windward side. The recovery fAP>0.5 is realized across all lateral positions beyond , once again highlighting the wake recovery re-energizing potential of the negative pitch case.
Finally, the positive pitch case has shown the most significant potential for downstream turbines. In this mode, the wake is ejected laterally toward the windward side of the rotor, as discussed in Fig. 7. This is also evident by the available power perceived by potential downstream turbines, where the deficit is skewed toward centers positioned on the windward side, consistent with the results of Huang et al. (2023b). Coefficients fAP>0.75 are available across all measurement planes on the leeward side of the rotor, starting at at . By , all possible locations feature fAP>0.75 across all leeward positions up to y0=0.38 on the windward side. Unlike the negative pitch case, fAP>0.5 is realized across all measurement planes and lateral center locations.
4.3 Vortex system validation
The normalized streamwise vorticity system is presented in Fig. 12 for all measurement planes. The most upstream measurement plane of is isolated in Fig. 11 for a comparison with the proposed vorticity system presented in Sect. 2. Selected vorticity structures are labeled with the corresponding quadrant in which they were generated based on Fig. 1, with subscripts T, R, and B corresponding to those stemming from the top blade tip, root, and bottom tip, respectively.
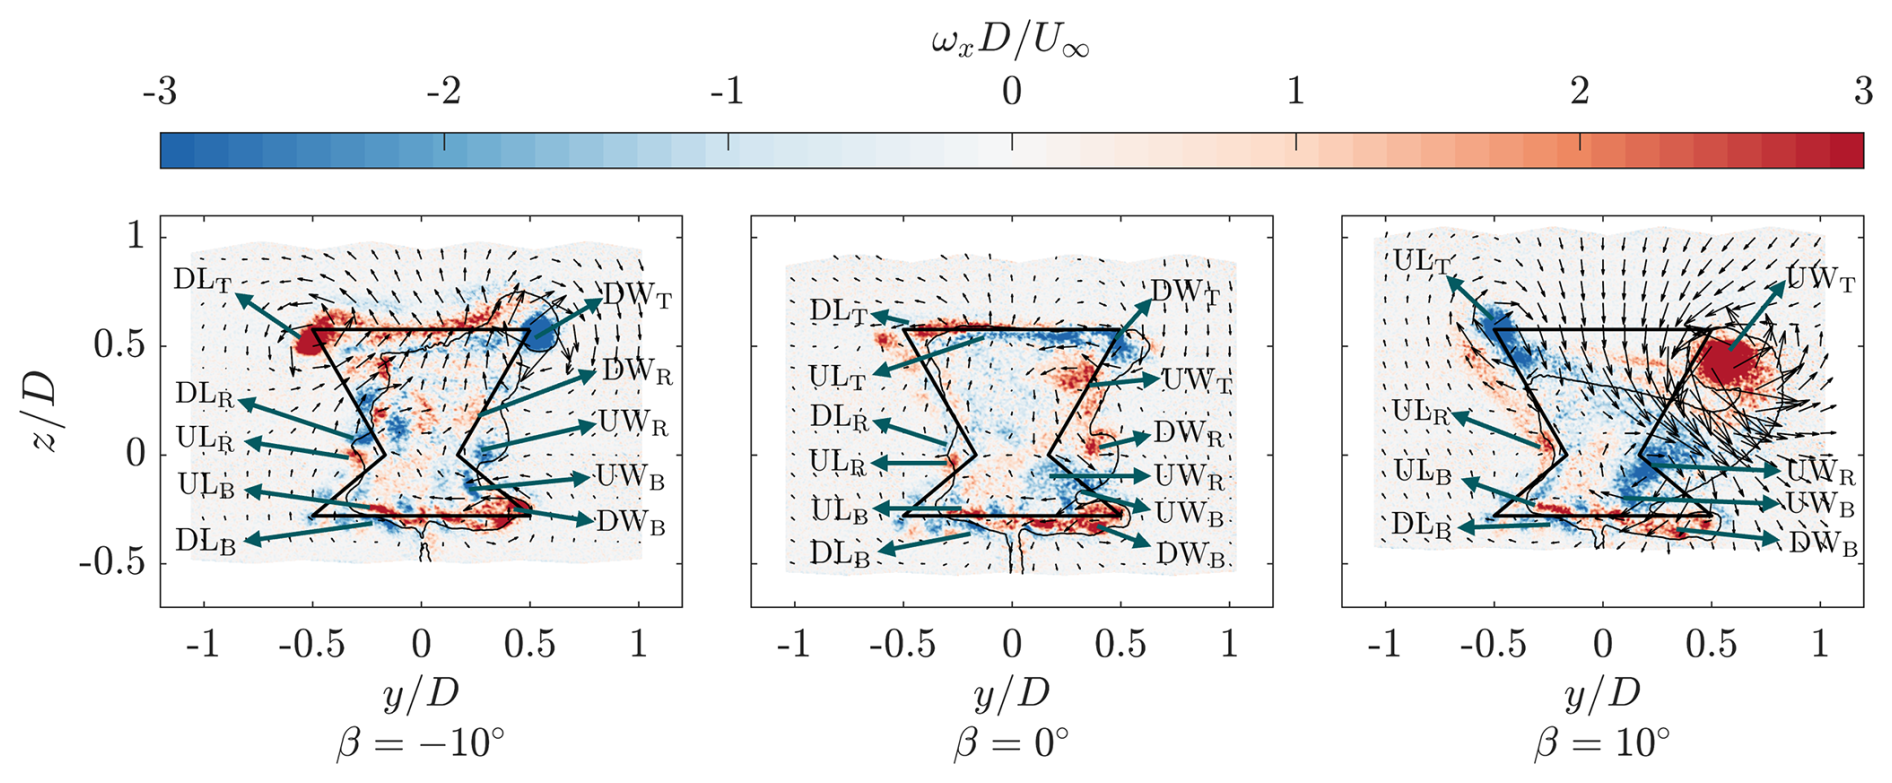
Figure 11Normalized streamwise vorticity at for the three pitch cases. The solid black line shows the frontal area of the rotor at an azimuth of 0°, with a black contour line showing where . The vectors show the in-plane velocity. The identifiable vortex structures are marked corresponding to Fig. 1, with subscripts T, R, and B corresponding to structures generated by the top, root, and bottom blades, respectively.
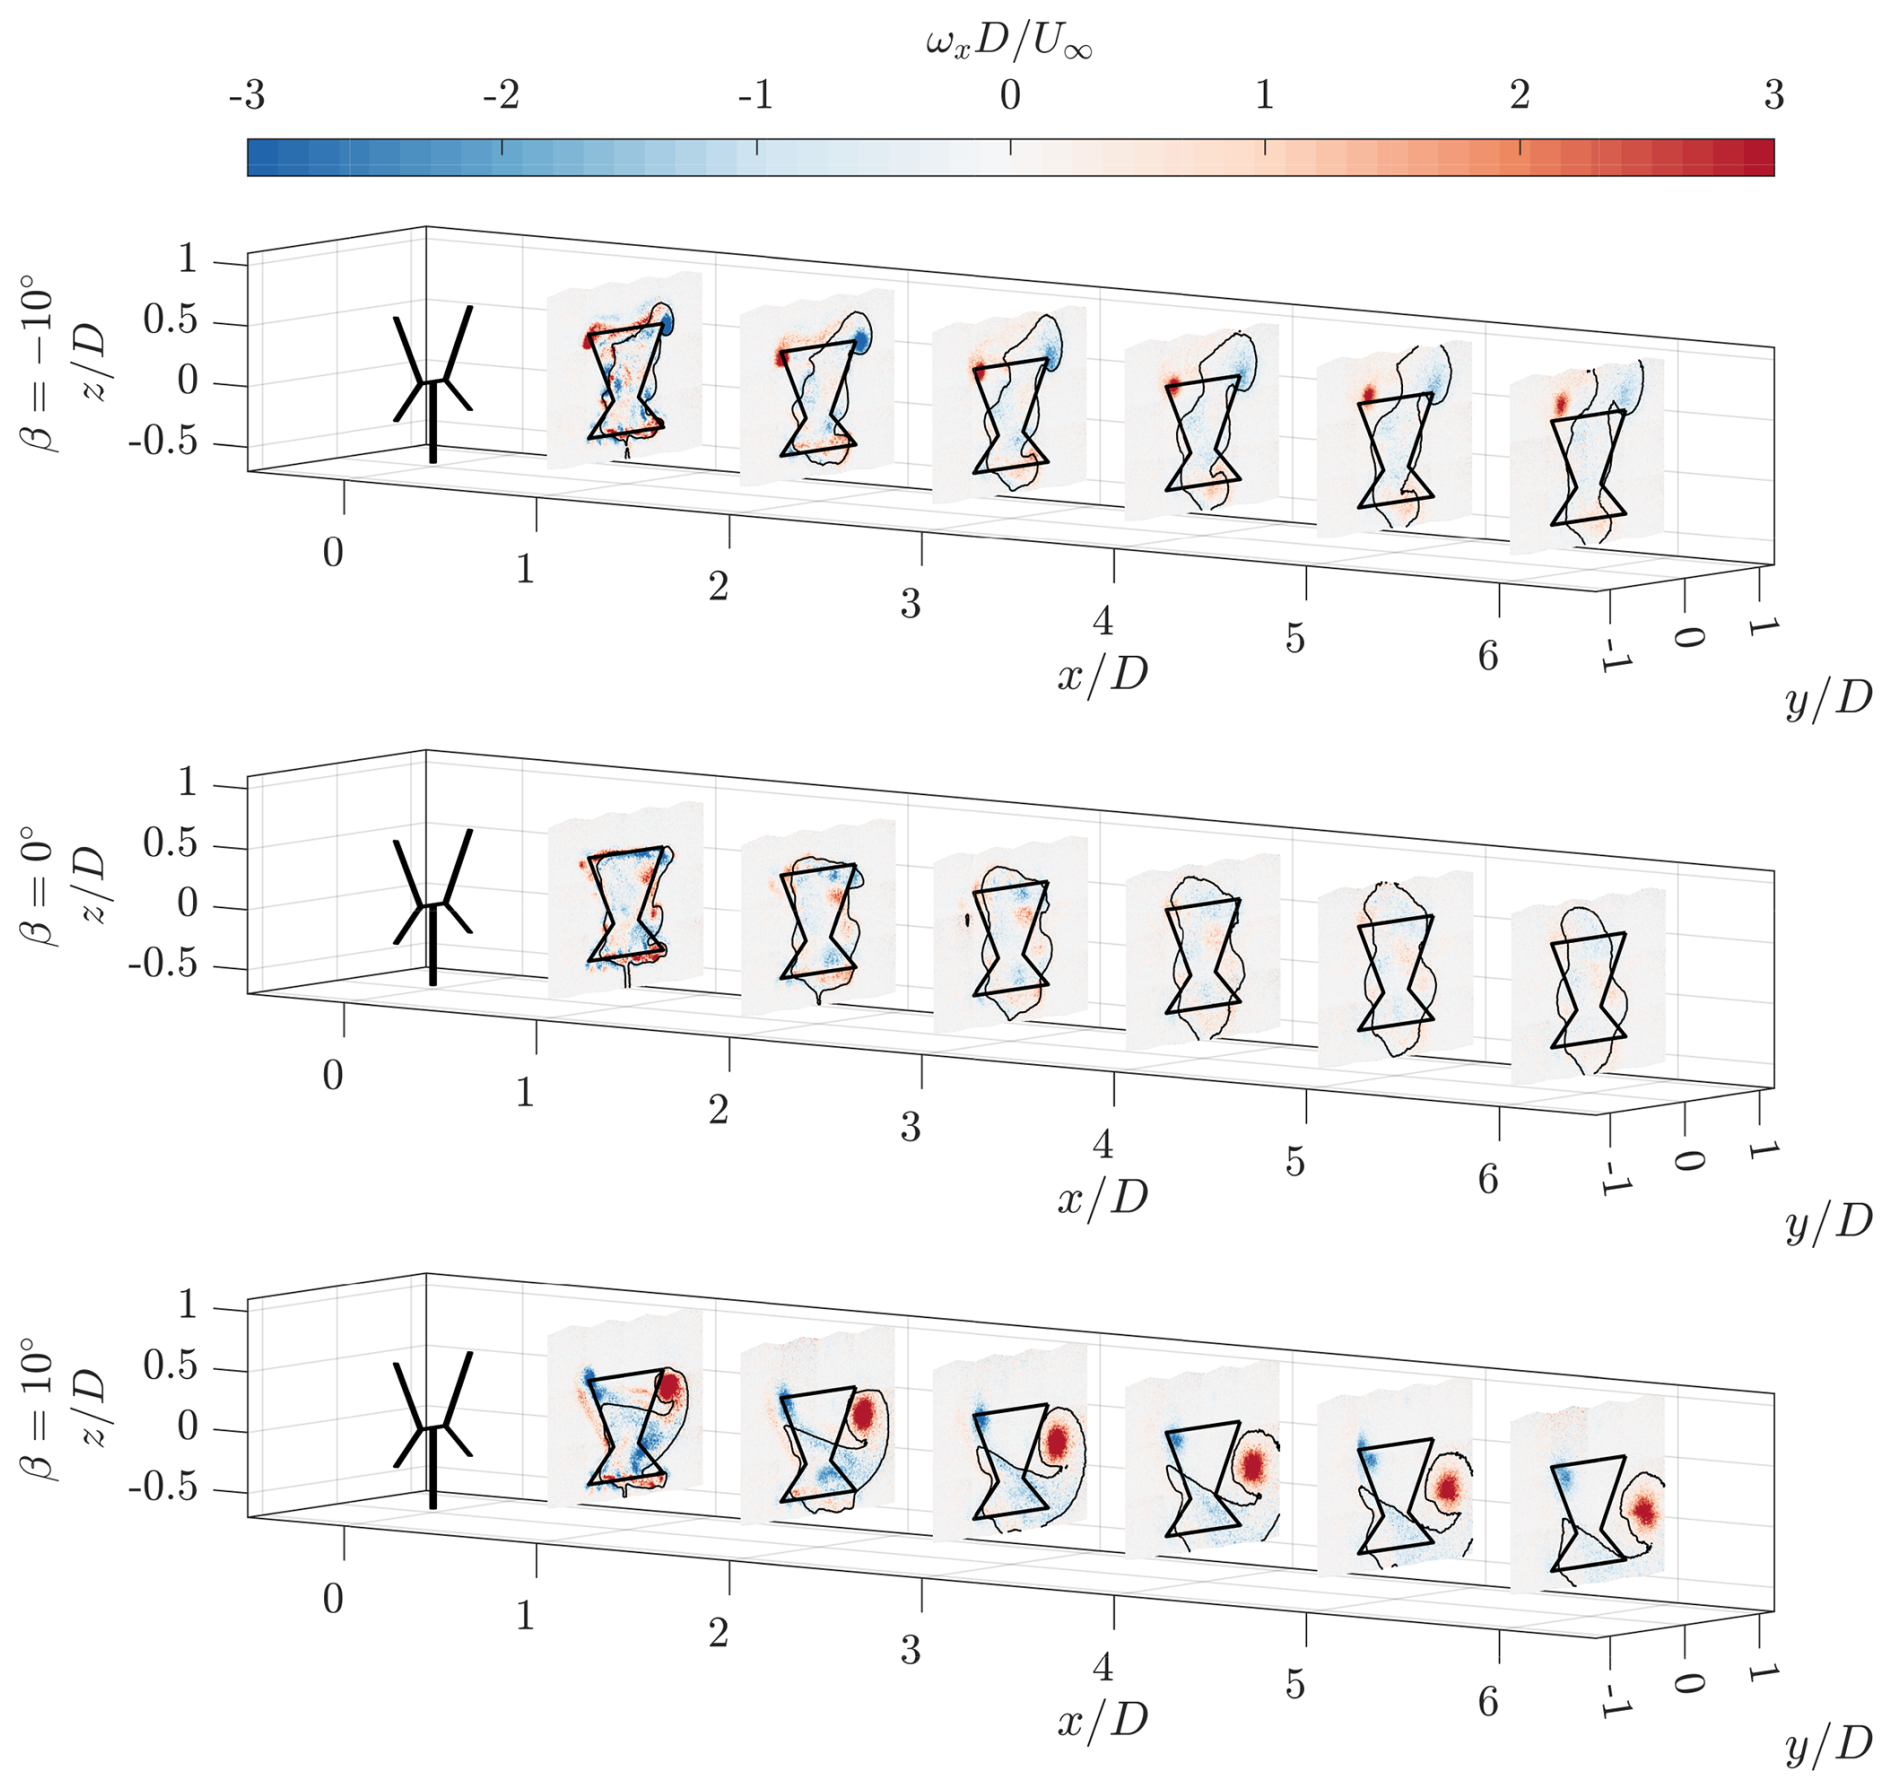
Figure 12Normalized streamwise vorticity component ωx at discrete cross-stream planes. The solid black line shows the frontal area of the rotor at an azimuth of 0°, with a black contour line showing where . The scale in the streamwise direction is doubled to have the planes more spaced apart for observation.
Consistent with the results of Huang et al. (2023b), Wei et al. (2021), and Tescione et al. (2014), the streamwise vortex structures are predominantly generated at the blade tips, according to Helmholtz's theorem. Given that the results are time-averaged, no coherent vortical structures shed by the blades are visible in the near wake at the baseline pitch case of β= 0°. Alternating patches of positive and negative vorticity stem from different quadrants, due to the periodic changes in inflow conditions perceived by the blade (Bensason et al., 2023). These vortical structures diffuse rapidly in the wake, becoming almost indistinguishable beyond = 3, as seen in Fig. 12. The structures stemming from the upper blade tips are as hypothesized in Fig. 1. The structures arising from the downwind quadrants (DWT, DLT) appear above those generated in the upwind quadrants (UWT, ULT), due to their direction of rotation, where the vortices about the periphery of the rotor induce inboard and outboard velocities in the upwind and downwind halves, respectively. The structures stemming from the roots are weaker on the leeward half of the rotor, compared with the windward half, consistent with the intrinsic asymmetric loading of a VAWT. The structures from the bottom blade tips mirror those to the top blades, in location and direction, as hypothesized in Fig. 1.
For the negative pitch case, a dominant CVP is visible, due to the increased blade load and subsequent circulation on the downwind passage. These results are consistent with the trailing vorticity system theorized by Huang et al. (2023b) for a straight-bladed VAWT. However, as the X-Rotor is not symmetric and the bottom blades are not pitching, a complementary CVP is absent on the bottom tips. The structure with positive vorticity on the leeward side of the rotor convects inward toward the center of the rotor, while both migrate upward. The shift in load toward the downwind half energizes the streamwise vortices DLT and DWT. This CVP induces an upwash in the wake, evident by the in-plane vectors, while entraining free stream flow from the sides of the rotor. The in-plane vectors suggest a similar strength between the two structures, indicating a close to idealized balance between the DW and DL quadrants, as shown in Fig. 1 and the minimal measured lateral thrust coefficient in Table 1. In the root region, both the UL and DL vortices have the same orientation as for the baseline pitch case. The DLR shows a higher magnitude in vorticity compared with the baseline case, consistent with the shift in load downstream, as hypothesized in Sect. 2. On the windward side, the upwind vortex UWR shows a similar magnitude to that of the baseline case, while that from the downwind half DWR shows a notable decrease. This is a discordance with the expected behavior shown in Fig. 1, suggesting a higher load produced on the lower blade compared with the upper blade when pitched. As the bottom blades are not pitched, the trailing vorticity system stemming from the bottom tips remains similar to the baseline pitch case.
The positive pitch case also shows a dominant CVP stemming from the upper blade tips in a mirrored direction to the negative case. This is consistent with the results of Huang et al. (2023a) and is due to the shift of rotor load toward the upwind half of the cycle. The vortex generated on the windward side of the rotor is larger and stronger than that on the leeward side. This is consistent with the load distribution among the UW and UL quadrants of the cycle, discussed in Sect. 2. The windward vortex moves down considerably toward the lower half of the rotor and outward laterally. Meanwhile, the leeward vortex remains close to the tip of the projected frontal areas, with slight movement in the same direction as the windward vortex. The vortex stemming from the UW quadrant (UWT) has convected downward and laterally out, while that generated in the UL quadrant (ULT) remains close to the blade tip of the projected area. As described in Sect. 2, this CVP induces a significant downwash in the wake, while convecting high-momentum streamwise flow from above the rotor and ejecting the wake out from the side. The in-plane vectors suggest that the UWT is stronger than the ULT, departing from the simplification made in Sect. 2 regarding the uniform load distribution in the upwind half of the rotor. This is further highlighted by the asymmetric wake deformation, which favors the windward side. This is consistent with the load measurements presented in Table 1, where a significant lateral thrust is measured for the positive pitch case. Similar to the tip vortices, the root vortices are also energized on the upwind passage on the windward (UWR) and leeward (ULR) sides. As hypothesized, these are in the opposing direction to that of the upper blade tip. Following the same reasoning as the tip vortex, the root vortex on the windward side is more dominant than that on the leeward side, due to the asymmetric loading between the upwind quadrants. Finally, the trailing vorticity stemming from the bottom blade tips remains similar to the baseline pitch case β= 0°, as these blades are not pitched. On the windward side, the vorticity stemming from the UW quadrant (UWB) has merged with the root vortex UWR, as they are co-rotating.
4.4 The role of the dominant CVP
The hypothesized vortex system was verified in Sect. 4.3 and linked to the wake deformation presented in Sect. 4.1. This section demonstrates the strong dependence between the dominant CVP observed for the pitched modes of operation and their modes of recovery, using the simplified point-vortex model described in Sect. 2.
First, the vortex cores are evaluated for the two pitched cases at all downstream locations, as shown in Fig. 13a. The cores are identified using the maxima Γ1, as introduced by Graftieaux et al. (2001). Previous studies have used this method (Bossuyt et al., 2021) for vortex tracking of wind-tunnel scale wind turbine models. The arrows indicate the direction of motion of the vortex cores between the measurement planes. Consistent with the observations in Fig. 12, the windward vortex of the positive pitch case moves the most in the downward and outward direction. The lateral deflection of this vortex is consistent with the high lateral load of the rotor resulting from the heavily loaded UW quadrant. Similarly, the leeward vortex moves downward and toward the center of the rotor. For the negative pitch case, the directions of rotation of the vortices are mirrored with respect to the positive case, as seen in Fig. 12. With the flipped direction of the CVP, the windward and leeward trailing vortices convect above the rotor. The displacement, however, is not as large as in the positive pitch case, due to the lack of a strong lateral force component of the rotor in this mode of operation.
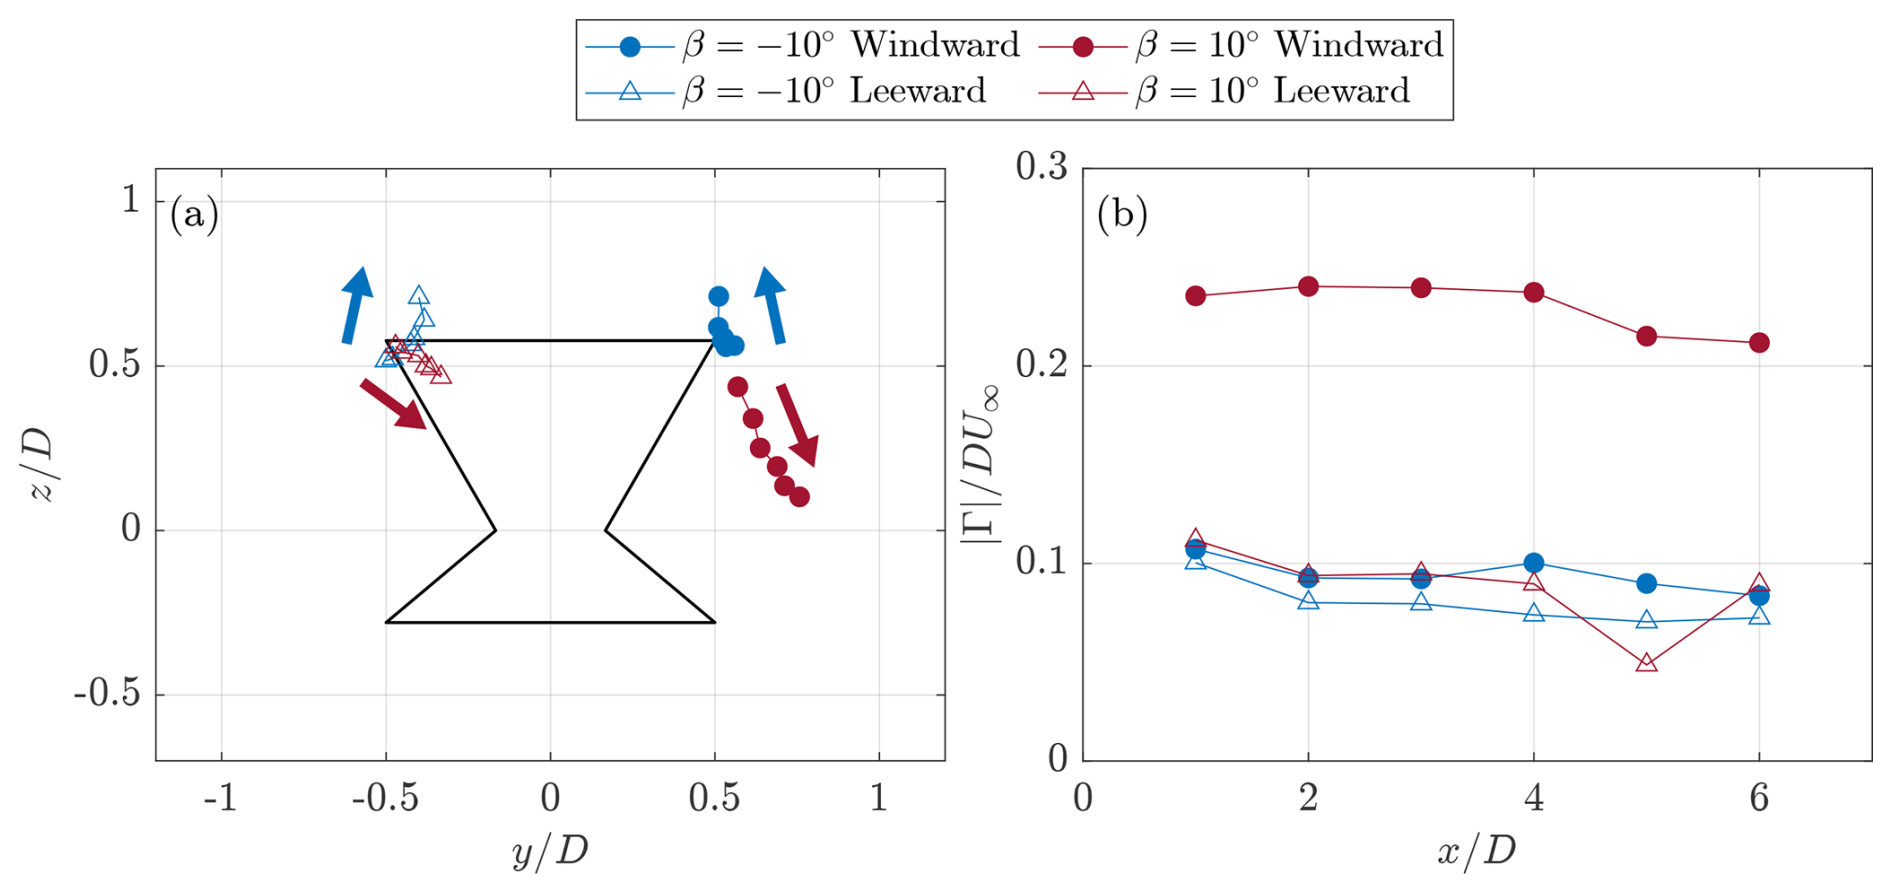
Figure 13(a) Trajectories of the dominant CVP cores for each pitch case. Arrows show the direction of movement of the vortical structures in the wake. (b) Evolution of vortex circulation magnitude integrated over patches identified using the Γ2 defined by Graftieaux et al. (2001). Circles and triangles correspond to the structures generated on the windward and leeward sides, respectively.
Next, the circulations of the tip vortices are shown in Fig. 13b, computed by taking the outline of the vortex core where , as defined by Graftieaux et al. (2001). Across all cases, the circulation decreases slightly when progressing further downstream, due to turbulent diffusion, but is conserved for the most part, due to the low inflow turbulence. Consistent with the induced in-plane velocities discussed in Sect. 4.3, the circulation of the windward vortex of the positive pitch case is the largest, around 2.5× greater than the rest, while that from the leeward side averages around . The strengths of the vortices of the negative pitch case are similar in magnitude across all measurement planes around . However, those stemming from the windward side of the rotor are systemically higher, due to the asymmetric loading of the rotor.
The maximum streamwise vorticity magnitude of the vortex core is shown in Fig. 14a for the two pitch cases. Due to diffusion, the maximum magnitude decreases further downstream in the wake. For the positive pitch case, the trailing vortex from the windward side has a higher peak vorticity magnitude across all measurement planes, consistent with the topology shown in Sect. 4.3. Meanwhile, the opposite is true for the negative pitch case, where, beyond the wake position, the leeward side vortex demonstrates a larger maximum vorticity magnitude than the windward side. This is visually consistent with the topology shown in Sect. 4.3, where the leeward vortex remains more constant in size and strength, while that on the windward side diffuses. The magnitude of these two structures stabilizes to a constant value beyond around and 1.7 for the leeward and windward vortex, respectively.
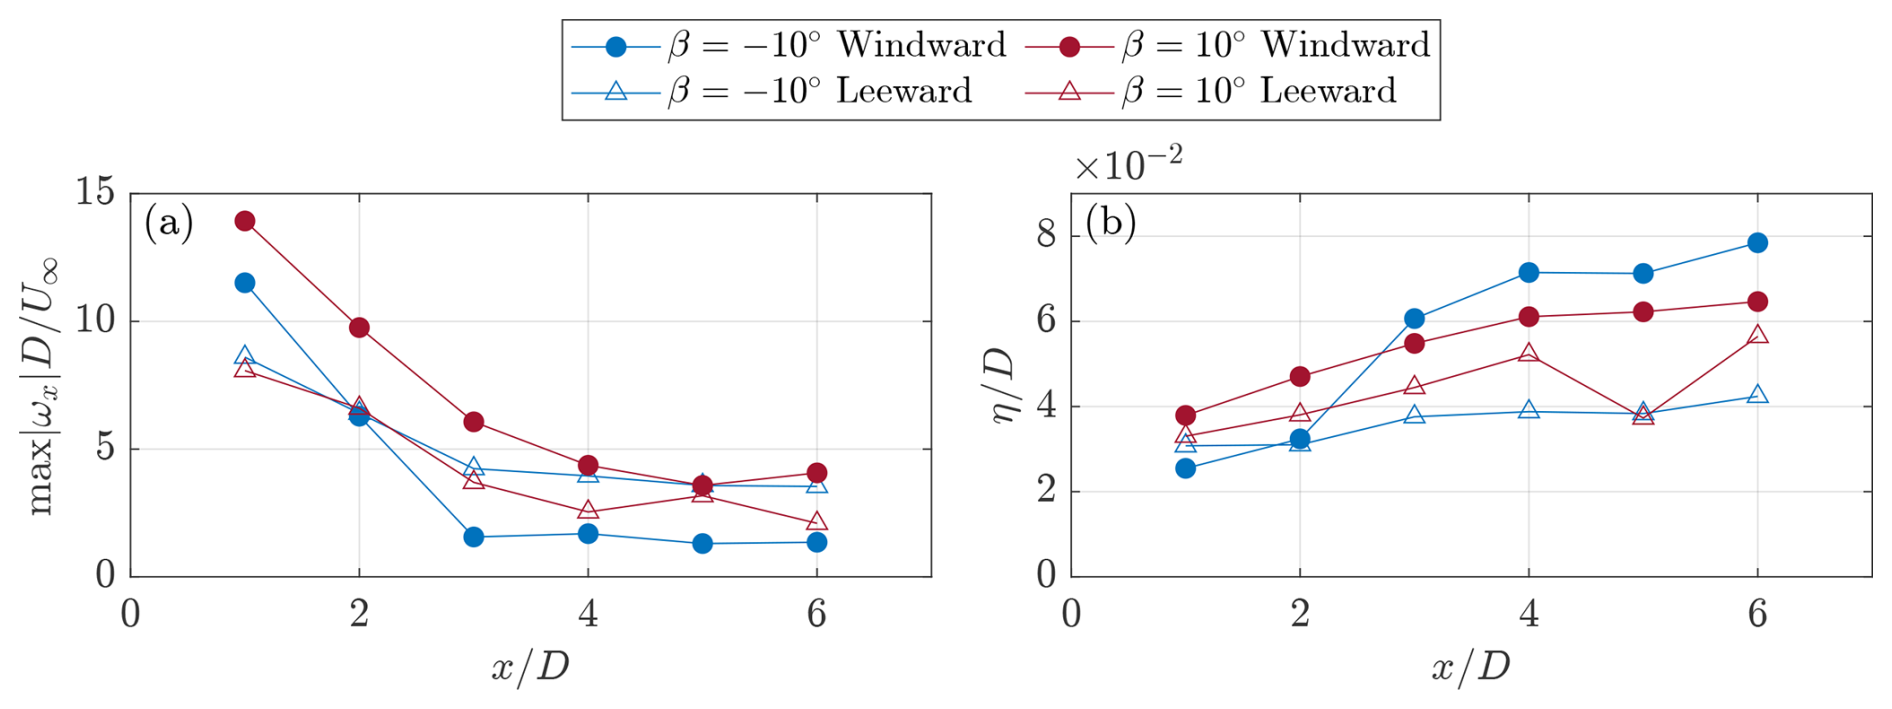
Figure 14(a) Evolution of the maximum normalized streamwise vorticity magnitude, max at the vortex core. (b) Normalized viscous length scale as a function of downstream position. The definition is given with Eq. (9).
Finally, η(x) is the viscous length scale of the vortex defined by Shapiro et al. (2020) as the integral of the eddy viscosity. This length scale is used to quantify how a vortex spreads over time due to diffusion, as demonstrated by Bossuyt et al. (2021). A similar approach is taken to that of the aforementioned work by considering the dominant CVP for the vortex-generator cases as idealized Lamb–Oseen vortices, defined as (Saffman, 1995)
where Γ is the circulation of the vortex and is the radial location from the vortex core, with yc,zc defined as vortex cores, as shown in Fig. 13a. In this work, the length scale is solved for by re-arranging Eq. (9) as
where and Γ(x) is the circulation of the vortex cores, as presented in Fig. 13. The curve-fitter tool in MATLAB is used with this pre-described relation to evaluate the constant k, given the experimental distributions of streamwise vorticity about the dominant CVP cores, using a non-linear least-squared approach. An overview of the curve-fitted distributions is shown in Appendix A. Given the k(x) values from the curve-fitting procedure, the viscous length scale can be calculated as a function of downstream location for each of the dominant CVP, as . The normalized length scale is shown in Fig. 14b for each of the dominant vortices as a function of downstream location. The diffusion rates of the windward and leeward vortices of the positive and negative pitch cases are similar. The leeward vortex of the negative pitch case has the lowest length scale, consistent with its shape and strength, as shown in Fig. 12. Meanwhile, the diffusion of the windward vortex for the negative pitch case demonstrates a large jump in magnitude between and , consistent with the contours shown in Fig. 12. The leeward vortex for the positive pitch case has an outlier at , due to the outlier in the input circulation, as shown in Fig. 13b.
With the vortex core locations, circulations, and viscous length scale defined, the axial induced velocity of the dominant CVP can be calculated using Eq. (2). The distribution of Uz(y,z) as a function of downstream plane at the height of the blade tips is presented in Fig. 15. The solid and dashed lines correspond, respectively, to the experimentally measured and analytically obtained results for the two pitch settings.
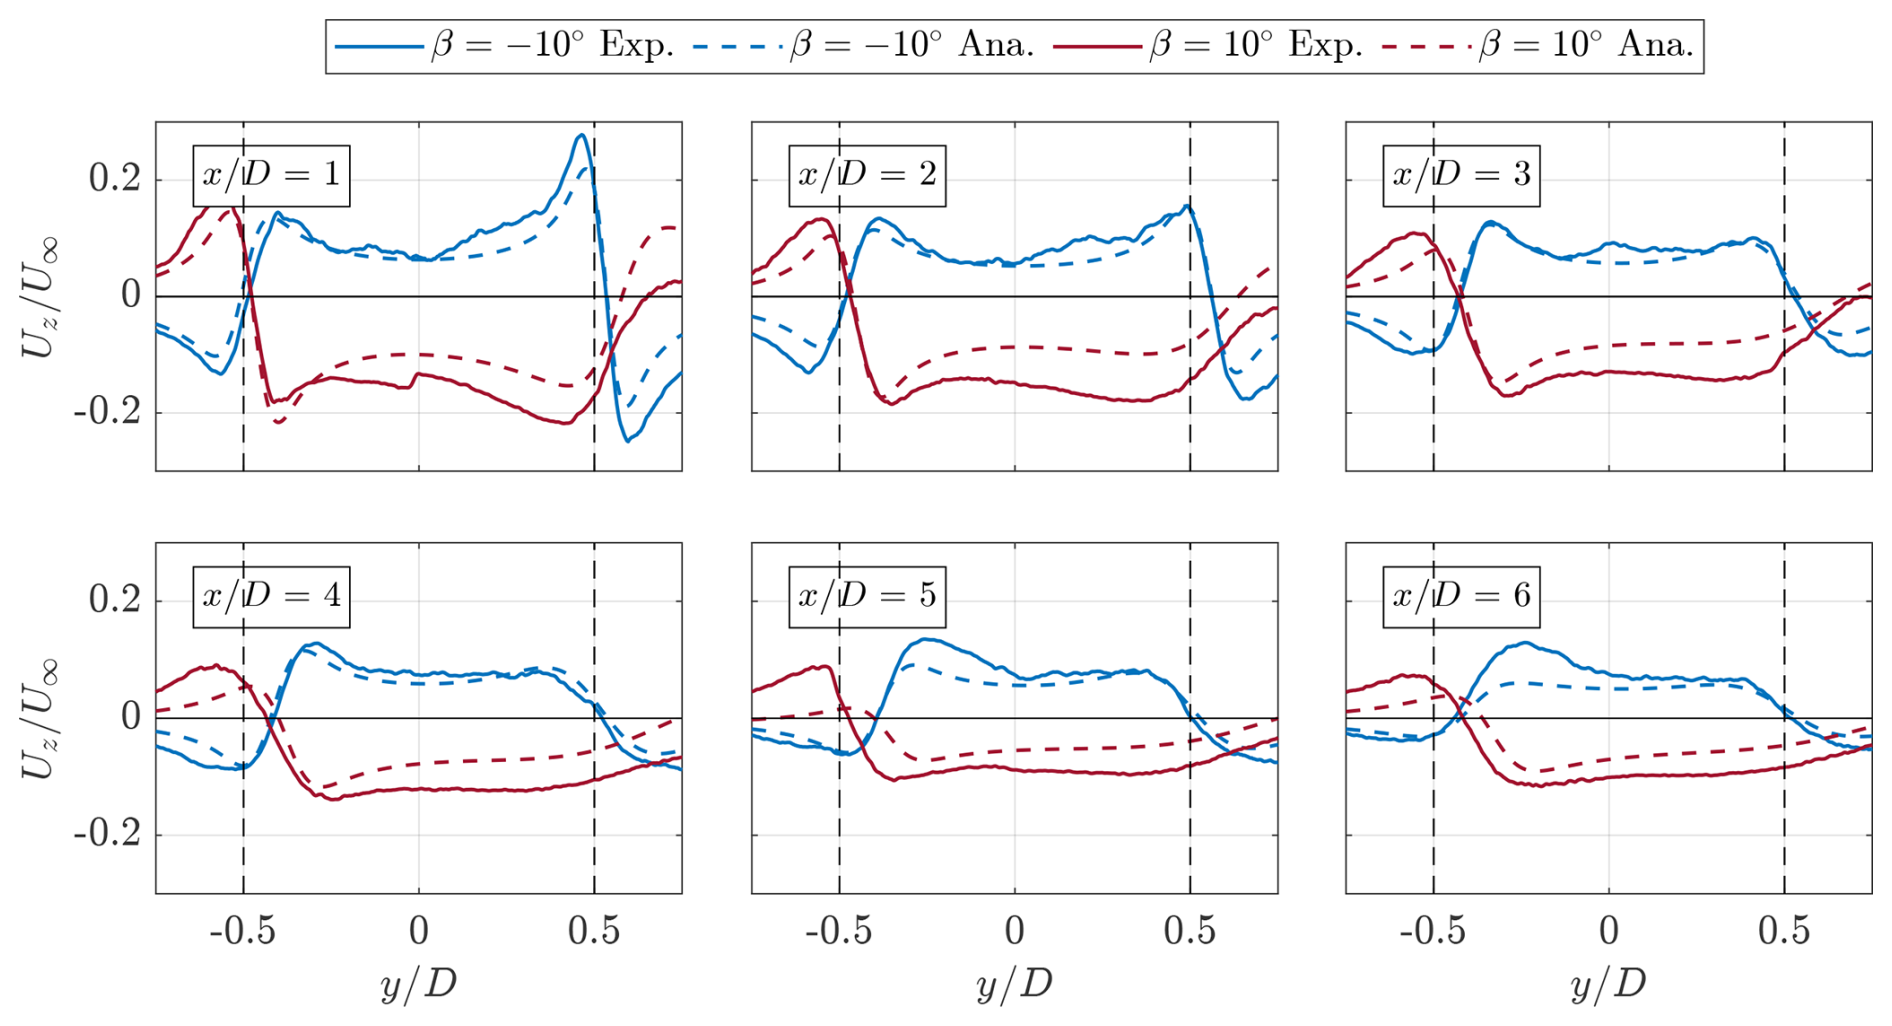
Figure 15Comparison of experimental (solid lines) and analytical (dashed lines) axial velocity distribution at .
The distributions between the experimental and analytical curves for the negative pitch case have a good match across all downstream planes. Up to , the flow close to the leeward vortex is consistent between the two, reaching percentage differences of approximately 4 % of the free stream flow. The flow close to the windward vortex remains in good agreement throughout the wake, suggesting an accurate quantification of the vortex circulation and diffusion rate, with differences around 1 %. The average differences within the bounds of the projected frontal area of the rotor denoted by the dashed black lines range from 1 % to 3 % of the free stream flow at and , respectively.
The positive pitch distributions show higher discrepancies from the analytical model, compared with the aforementioned case. There is a closer agreement on the leeward side of the rotor within the area of the rotor before gradually deviating toward the windward side. A large discrepancy is visible at , again due to the outlier in vortex circulation, as discussed in Appendix A, concerning Fig. A1. The average difference in velocity normalized by the free stream component ranges from 6 % to 3 % at and , respectively. The disagreements between the curves when approaching the windward side of the rotor can be attributed partly to the quality of the curve-fitted values and to neglect of the root vortex when predicting the induced flow. As shown in Fig. 11, the root vortex from the upwind windward passage for the positive pitch case is more dominant than the negative pitch operation mode. A further consideration is the importance of the three-dimensionality of the flow of a VAWT, which is further magnified when the blades are pitched. The windward vortex for the positive pitch case convects the most, as highlighted in Fig. A1. The resulting misalignment between the vortex core and the measurement plane is a common feature in experimental studies of helicopter aerodynamics (van der Wall and Richard, 2006; Kato et al., 2003). A correction angle is applied based on the swirl and out-of-plane flow derivative component, which is not measured in this study. Nonetheless, the predicted axial flow components at the top of the rotor match the experimental results well, highlighting the importance and dominance of the main CVP toward the wake deformation and deflection and, in turn, the momentum recovery.
4.5 Mean kinetic energy replenishment
Thus far, the ability of the modified vortex system to entrain high-energy flow in the wake has been discussed through qualitative observation in Sect. 4.1 and the increase in available power in Sect. 4.2. However, the main contributions toward this streamwise recovery have yet to be quantified. Previous studies have used the mean kinetic energy (MKE) equation to isolate the advective and turbulent contributions toward the wake recovery (Hezaveh and Bou-Zeid, 2018; Cortina et al., 2016; Rolin and Porté-Agel, 2018). The MKE equation is written as (Cortina et al., 2016)
where is the mean kinetic energy and is the mean static pressure. The overbars and primes denote time-averaged and fluctuating quantities. The time-dependent term () is omitted, as the results are time-averaged. Furthermore, as in the works of Huang et al. (2023b) and Bossuyt et al. (2021), the viscous term is omitted, given the sufficiently high Reynolds number. The terms are grouped by A, ϕ, P, and ϵ, which correspond to terms regarding the advection of MKE, the turbulent flux of MKE, work due to the mean pressure field, and the dissipation of MKE via turbulence, respectively. The MKE equation is further simplified and expanded as
where the MKE advection term A is split in each direction, . As the pressure was not measured in this study, it is omitted from the subsequent analysis. The terms are arranged so that the contributions toward the streamwise advection of MKE are isolated, as in the studies of Hezaveh and Bou-Zeid (2018) and Huang et al. (2023b). The terms of Eq. (12) are presented as contour plots at a cross-stream position of for the three fixed-pitch cases in Fig. 16. The in-plane spatial derivatives and are calculated using a second-order central difference scheme. Similarly, the term including the streamwise gradients () is approximated using a second-order central difference scheme across all measurement planes. Given the rearrangement of the terms in Eq. (12), red and blue in Fig. (16) are sources and sinks in the streamwise MKE contribution.
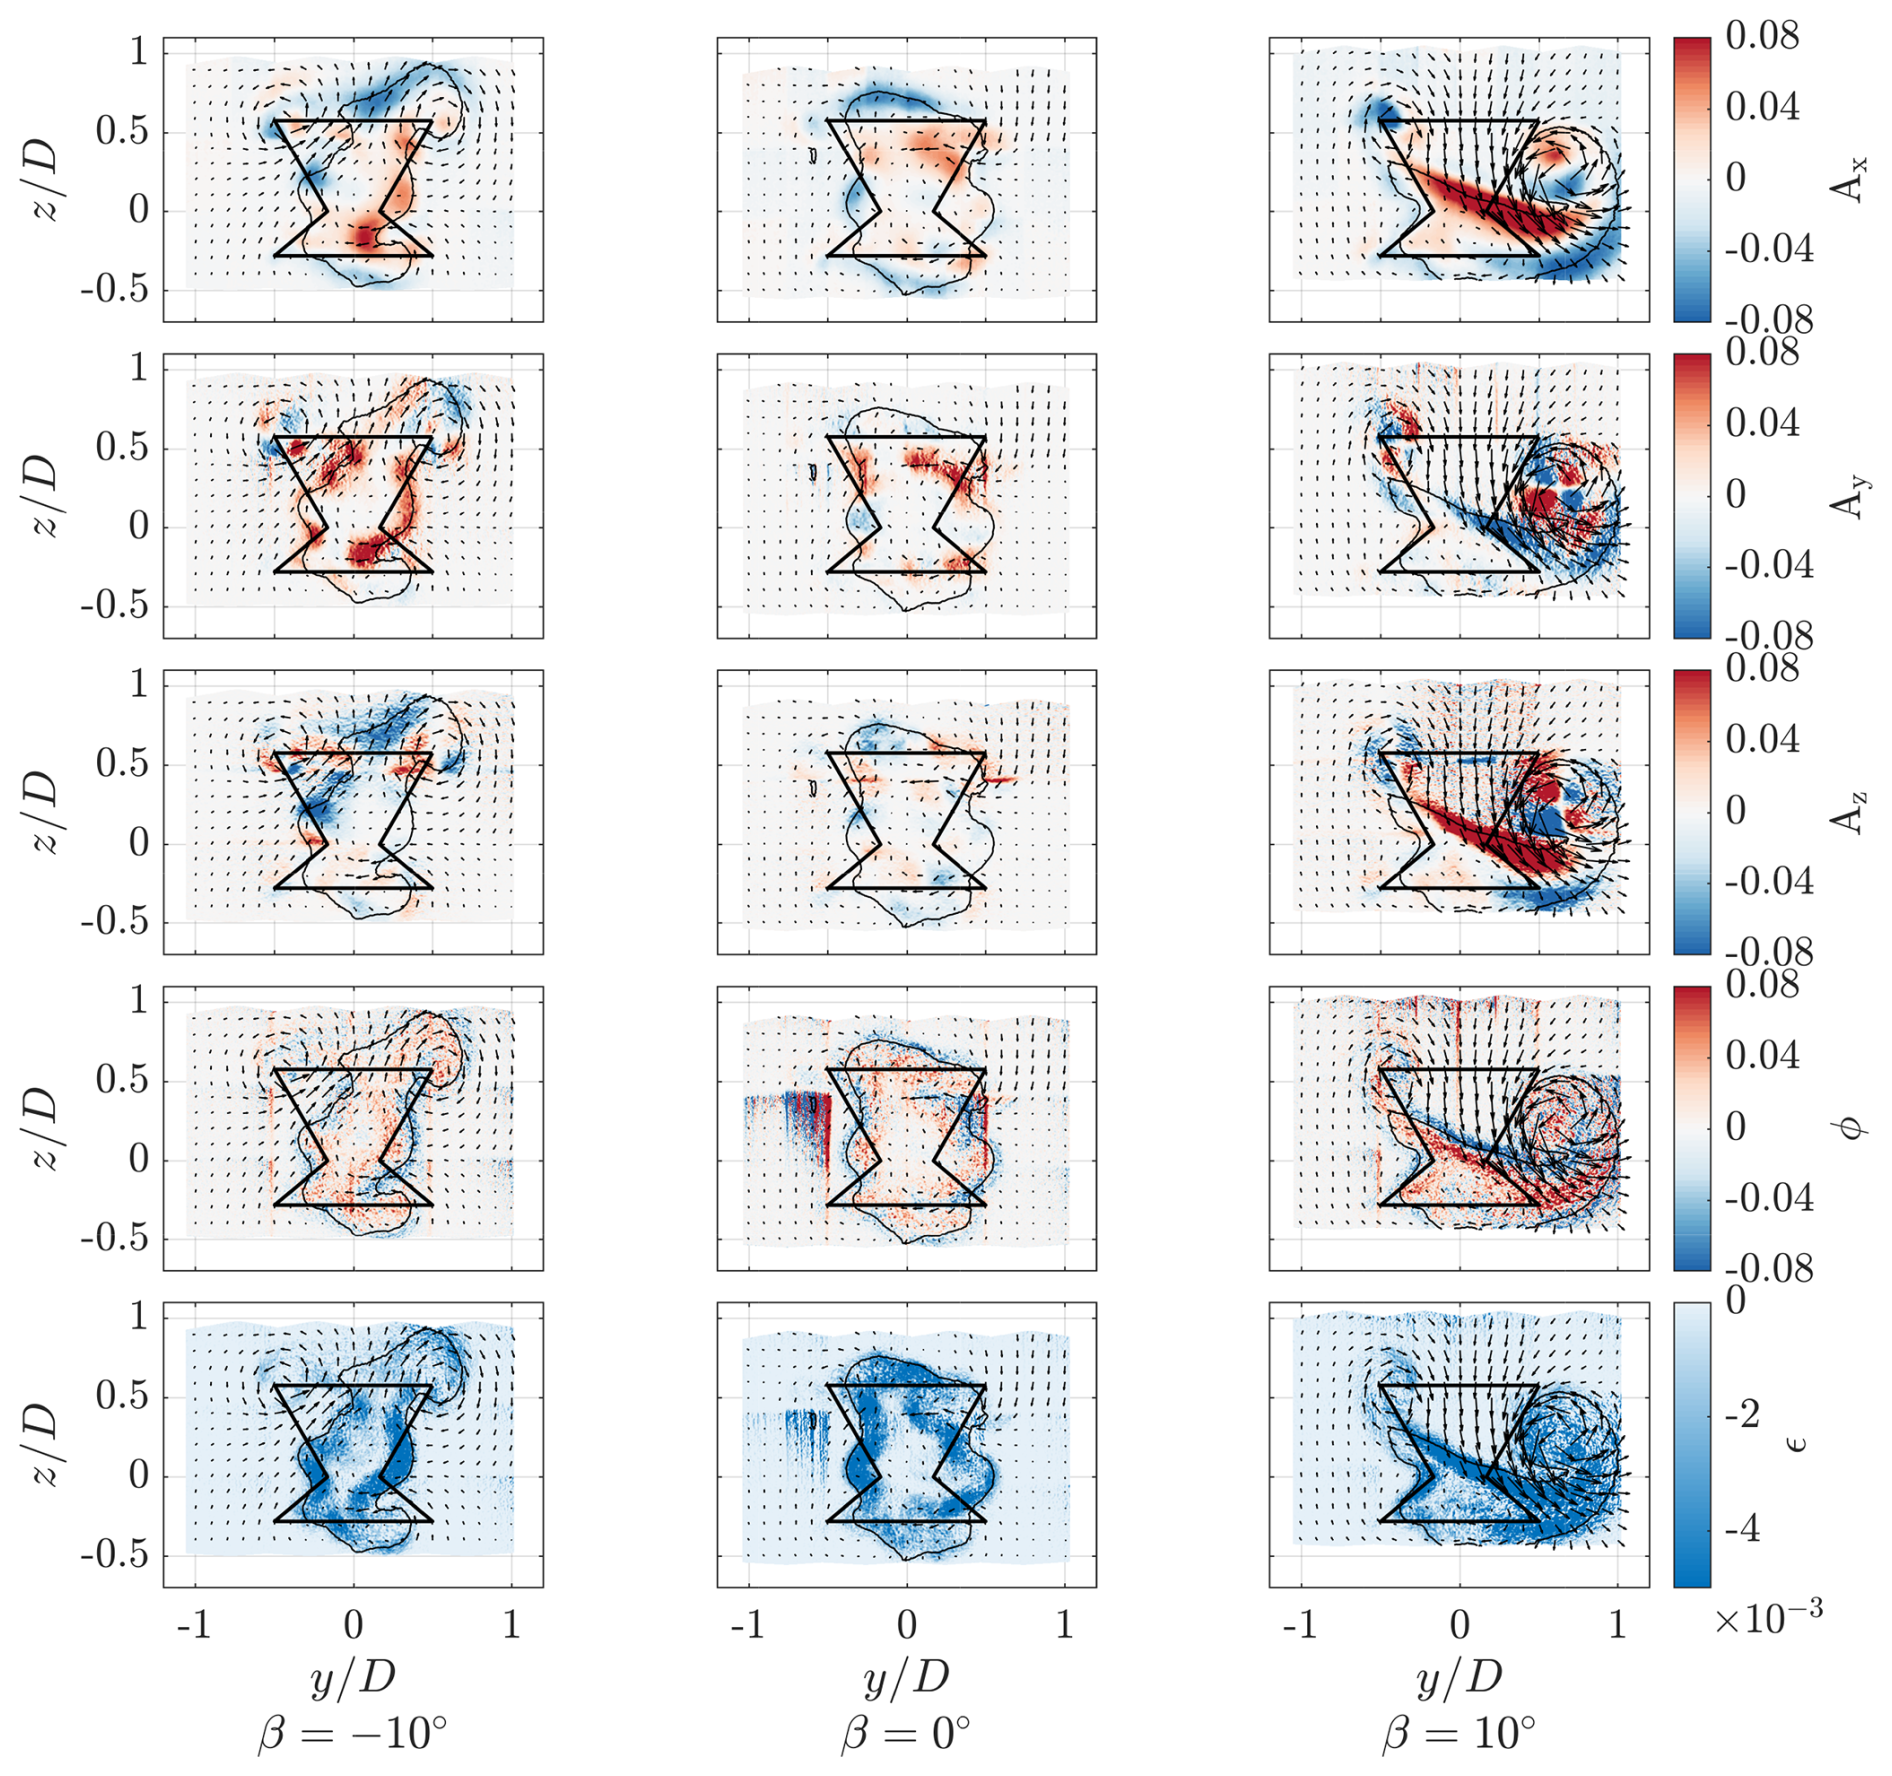
Figure 16Spatial distributions of the terms in Eq. (12) for the three modes of operation at . All terms are normalized by ; the vectors correspond to the in-plane velocity vectors The solid black line shows the frontal area of the rotor at an azimuth of 0°, with a black contour line showing where .
As the negative pitch case has a lateral contraction and axial expansion of the wake, the wake perimeter shows shades of red and blue for Ay and Az, respectively. This implies an influx of energy from the sides of the rotor, which contributes to an increase in streamwise MKE Ax, while the wake is being ejected axially, leading to a decrease in Ax above the rotor. Conversely, the axial advective term Az for the positive pitch case shows a large red region at the top of the wake, as free stream flow is injected into the wake. Meanwhile, blue-shaded regions are concentrated on the bottom of the wake as local MKE decreases outside the rotor surface. The lateral advective component Ay is predominantly negative in the wake area, as flow is ejected, with a red region visible close to coinciding with the core. Nonetheless, the magnitude of K injected axially dominates the net effect within, as seen by the Ax contour. The baseline pitch case exhibits similar behavior to the negative pitch case, with a lateral contraction near the upper and lower blade tips, leading to a red Ay distribution. Unlike the negative case, the root region shows a local expansion with a blue region. Meanwhile, Az shows a concentration of blue at the top and bottom of the rotor as the MKE of the free stream flow is slowed by the ejected wake. The net effect on the streamwise MKE term Ax is similar to that of the negative pitch case, with regions of increased streamwise advection along the lateral perimeter of the wake and decreases above the rotor.
The turbulent flux of MKE, ϕ, is concentrated along the wake perimeters. Huang et al. (2023b) observed similar trends for an H-type VAWT; these are due to the turbulent mixing within the shear layer. Although the magnitudes are lower than the advective MKE terms (A), this highlights the importance of increasing the wake perimeter for accelerated MKE recovery, as discussed in Sect. 4.1. Similarly, the dissipation of MKE due to turbulence, ϵ, is concentrated along the shear layer of the wake perimeter. These are an order of magnitude lower than the other terms, due to the low inflow turbulence, and hence play a minor role in the wake recovery process.
To condense the relative contributions of the aforementioned distributions to a single number for the three cases across all measurement planes, the spatial average within the projected rotor frontal area of each term from Eq. (12) is shown in Fig. 17. Additionally, a residual term is included, where , in accordance with Eq. (11).
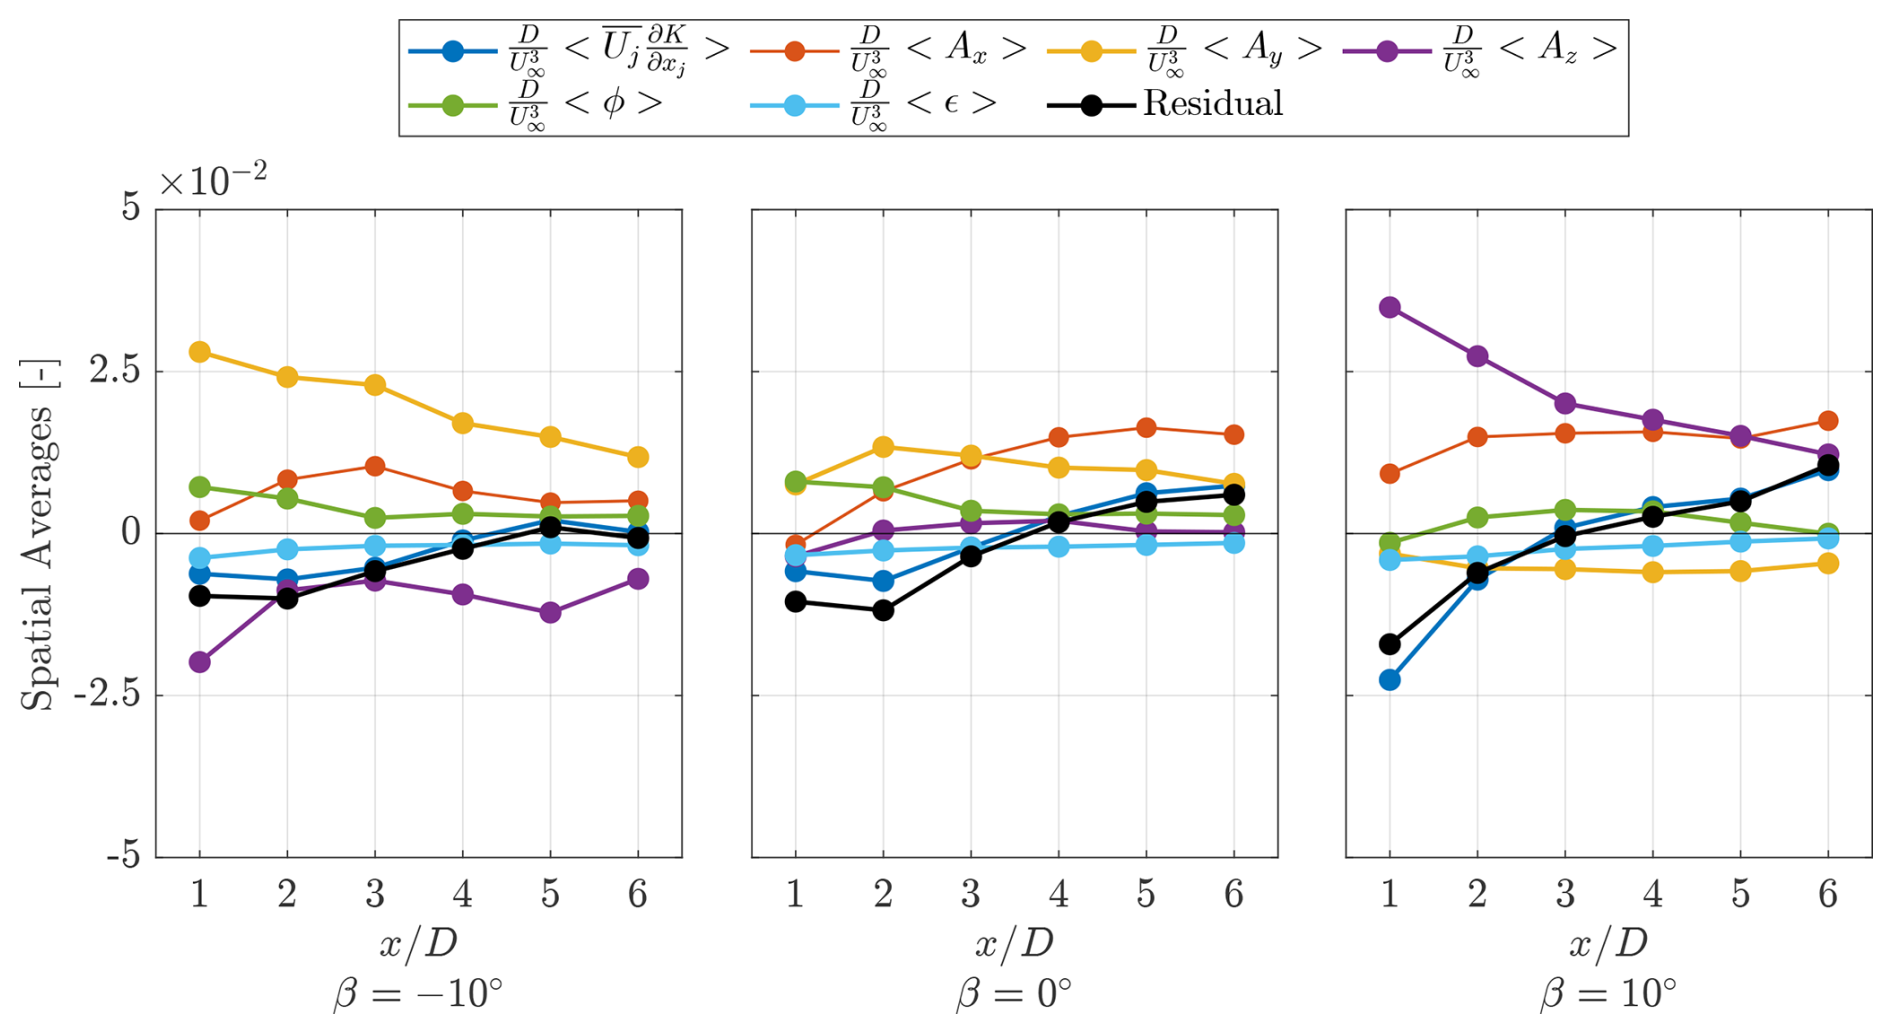
Figure 17Section averaged term from Eq. (12) for the three pitch cases across all measurement planes. Note: the sum of the advective flux terms A is shown along with the discretized terms in . All terms are normalized by .
Consistent with the contours shown previously, the dominant term for the negative pitch case is Ay, as flow is injected from the sides of the rotor. Meanwhile, the dominant term for the positive pitch case is Az, as flow is injected from above the rotor plane. A gradual increase is evident in the streamwise advection of MKE for the baseline case. In the near wake, , the negative pitch case has higher magnitudes than the baseline case, reaching a maximum of , before decreasing. This is probably due to the rapid diffusion of the windward vortex and plateau in maximum vorticity, as discussed in Sect. 4.4. Meanwhile, the positive pitch case shows a steadily high magnitude of .
Finally, the flux of MKE is evaluated using a control volume approach, with a schematic of the volume shown in Fig. 18. The control volume lateral surfaces on the windward and leeward sides are denoted S3 and S4, respectively. Finally, the bottom and top control surfaces in the axial direction of the control volume are denoted S5 and S6, respectively. The top and bottom surfaces are taken at the heights of the upper and low blade tips, and , respectively. The lateral surfaces are taken at the edges of the projected frontal area of the rotor, . Note that the surface normals to the inflow and outflow of the volume (S1,S2) are not evaluated.
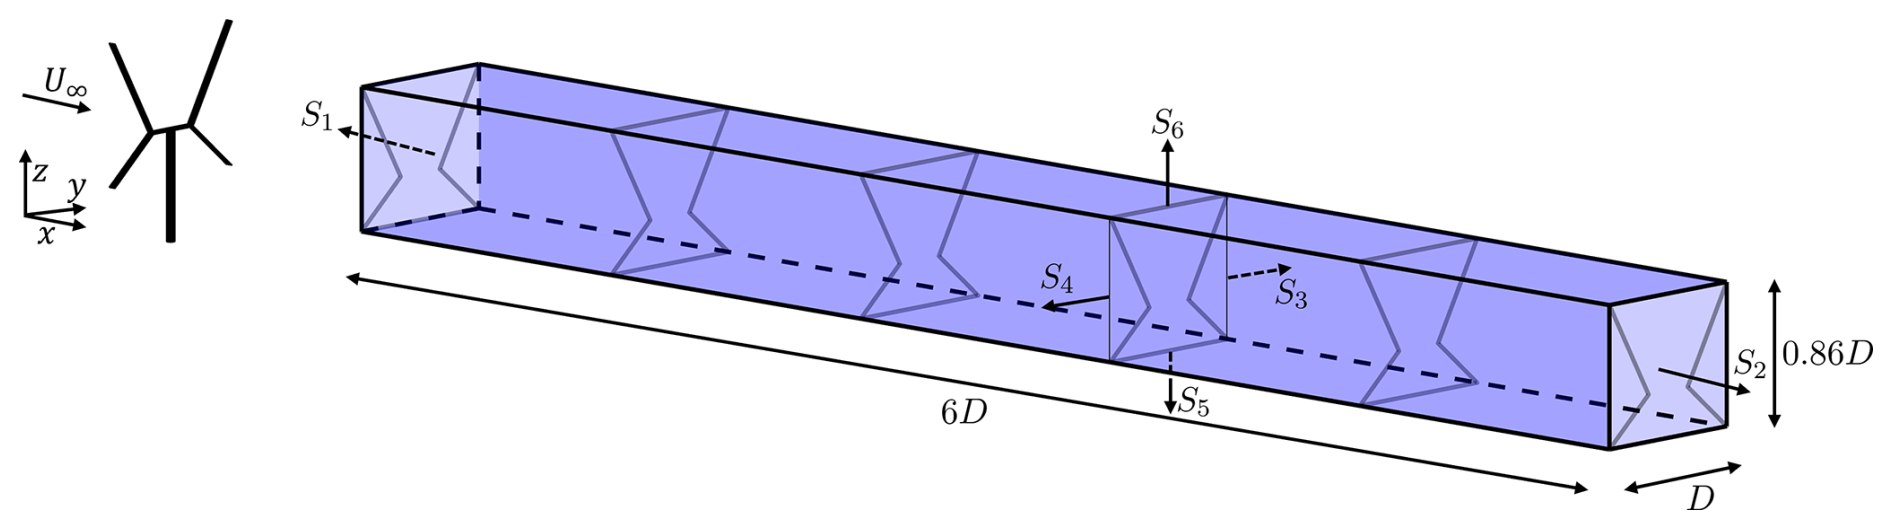
Figure 18Finite-length control volume encapsulating the rotor frontal area (solid gray lines). The control volume surfaces (shaded blue) are denoted Si, where i indicates the surface number (ranging from 1 to 6). The size of the control volume is denoted by the diameter-normalized length, with the respective coordinate system provided and the mean flow direction indicated.
Upon taking the volume integral of Eq. (12), the divergence theorem can be applied to re-write the terms in a surface integral form (Cortina et al., 2016). This is simplified, as velocity components tangent to the control volume surfaces do not contribute to the flux. Furthermore, as the streamwise component is the dominant contributor to the MKE (Ux≫Uy and Uz), the subsequent analysis focuses on the streamwise budget, as in Hezaveh and Bou-Zeid (2018). Hence, the fluxes through the lateral and axial surfaces S, as denoted in Fig. 18, can be expressed as
Positive and negative magnitudes correspond to flux outside and inside the control column, respectively. The distribution of the flux terms across each surface, as defined, is shown in Fig. 19. The faint lines are the distributions across each measurement plane, while the thick solid lines are the mean across each wake position. The vertical and horizontal dashed black lines denote the edges of the control surface, as defined by the maximum edges of the projected frontal area of the rotor. The sums are normalized by the free stream flow component.
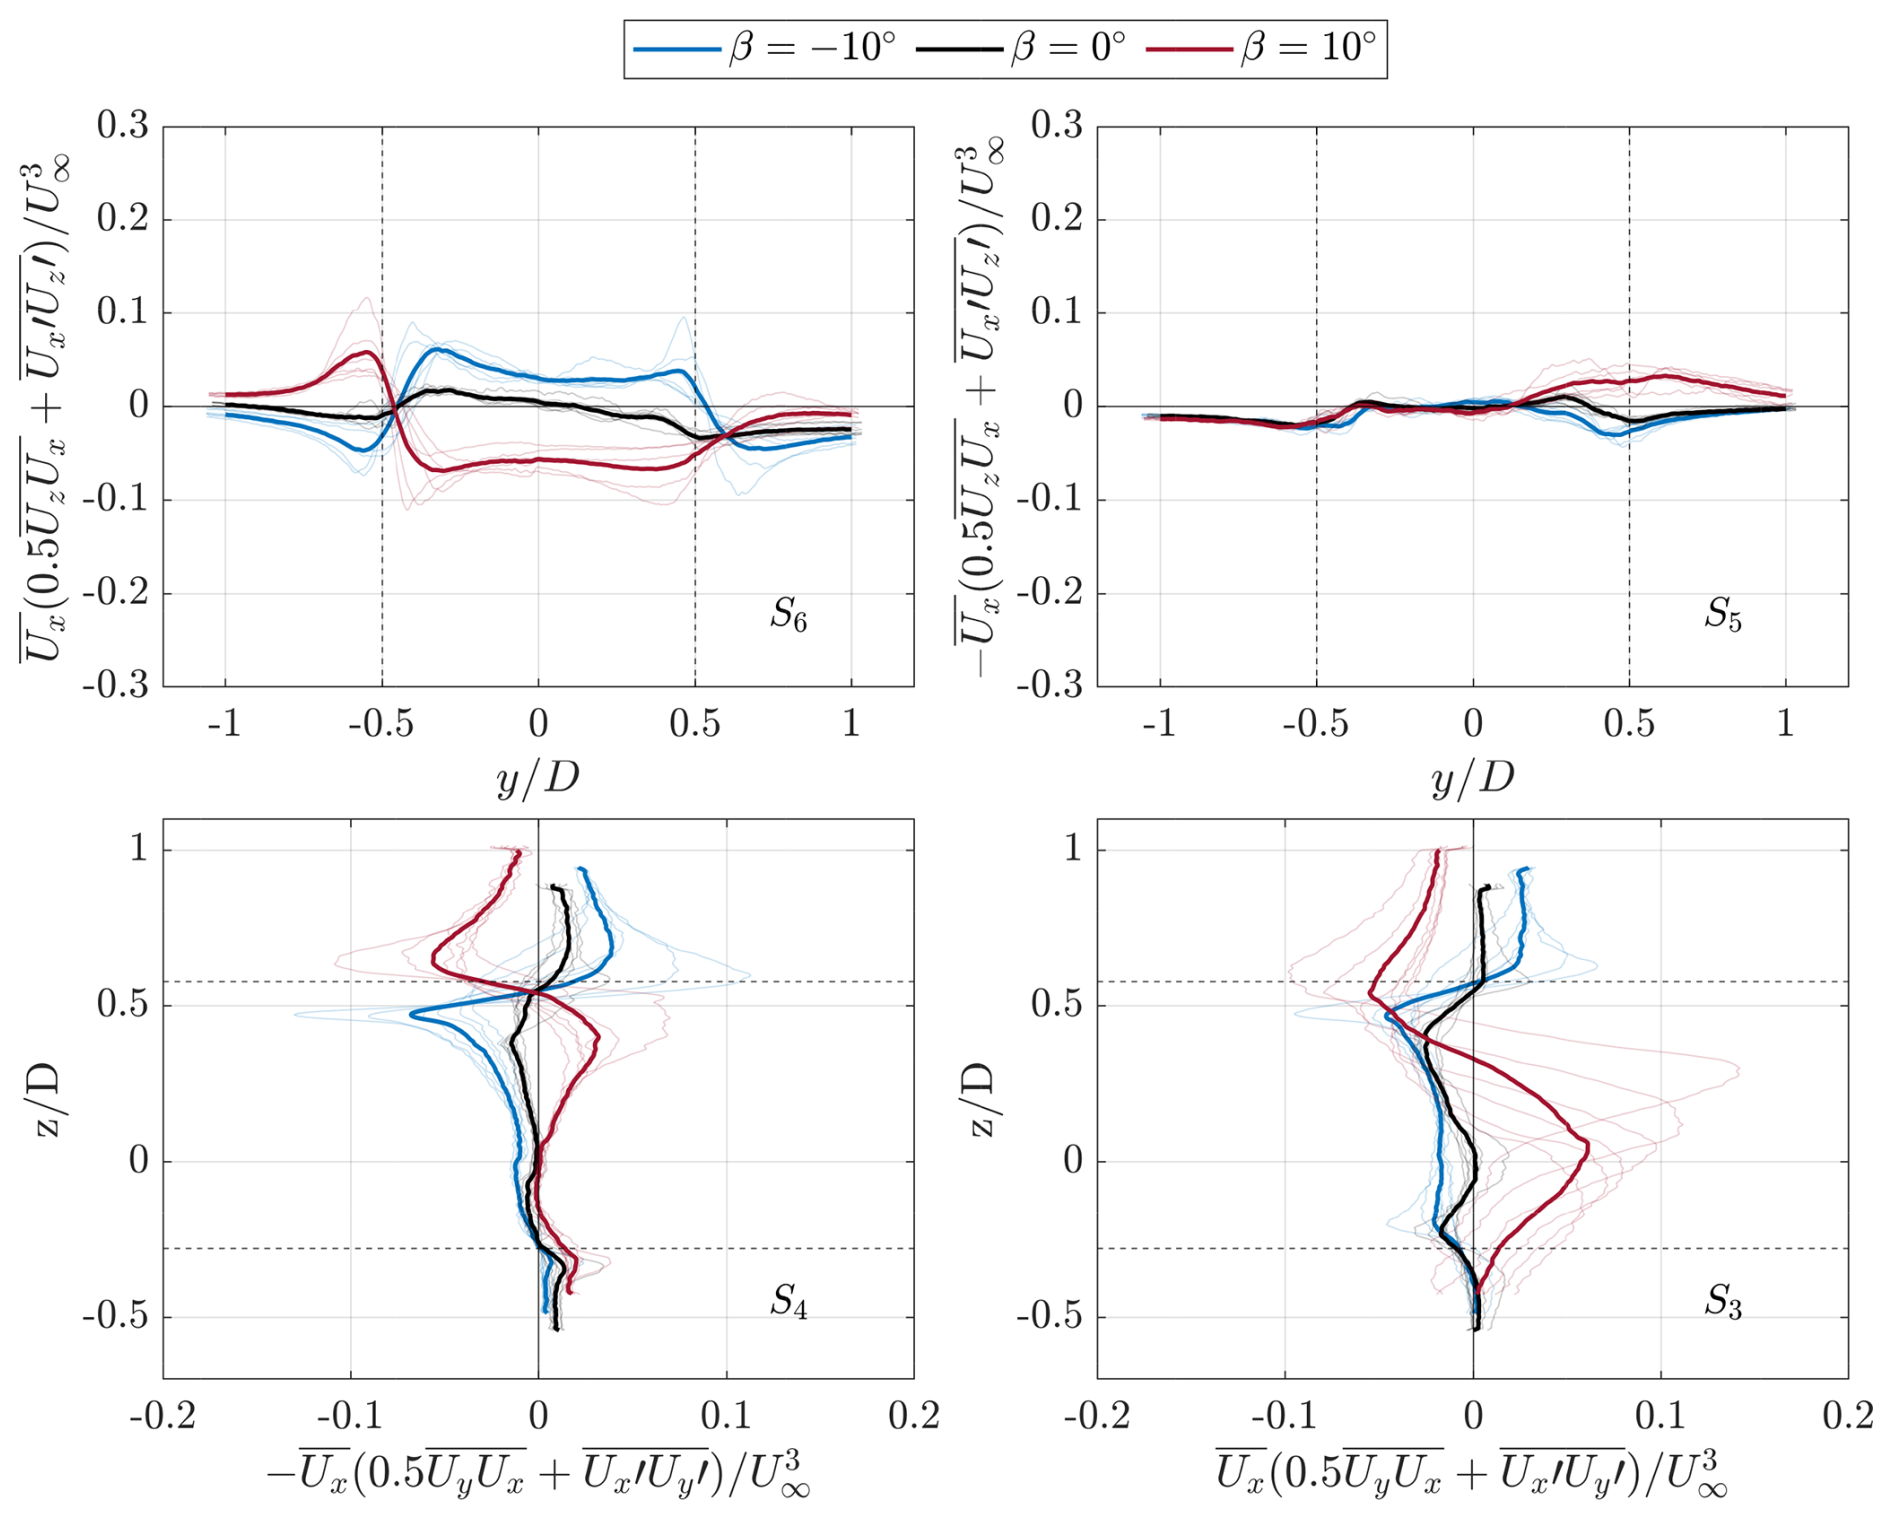
Figure 19Axial and lateral components of the time-averaged streamwise MKE equation shown in Eq. (11) for the three pitch cases, normalized by the free stream flow component. Faint lines show the distributions along the control volume surfaces at each measurement location in the wake and thick solid lines show the mean across all positions. The vertical and horizontal dashed black lines show the edges of the control volume, as shown in Fig. 18. The labels toward the bottom right of the figures correspond to the control surfaces.
The baseline case exhibits a negative flux along the upper surface S6 due to the expansion of the wake. There is minimal flux across the bottom surface S5, given the lack of a dominant CVP. A small negative flux is evident on both lateral surfaces of the control volume (S3,S4), signifying an injection of free stream flow within the volume. The magnitudes are higher on the windward side (S3) of the rotor, due to the asymmetric load profile and subsequent trailing vorticity system, as highlighted in Sect. 4.3. Furthermore, the mean curves demonstrate higher peak flux magnitudes on the upper half rotor on both the windward and leeward sides. This mode of operation is consistent with the wake topology shown in Fig. 6, where a substantial area of the wake is axially contracted while expanding in the lateral direction and some thinner regions of wake deficit are expanding above and below the frontal of the rotor, forming a peanut shape.
The negative pitch case demonstrates a dominant positive flux along the upper surface S6, consistent with the large upwash induced by the CVP. Beyond the frontal area, the flux reverses when crossing the vortex cores. The maximum magnitude of the average flux is higher on the leeward blade tip (S4), consistent with the accelerated diffusion of the windward vortex shown in Fig. 14. The magnitudes are lower along the bottom surface, S5, following a similar distribution to the baseline case. The fluxes on the lateral surfaces follow a similar trend to the baseline case with higher magnitudes. On the windward surface, S3, the injection of flow is highest on the upper half of the rotor, due to the dominant CVP. Near the root region, the magnitude is also higher than the baseline case, due to the modification of the root vortex, as discussed in Sect. 4.3, before overlapping again with the baseline case beyond the lower blade tip. On the leeward surface, S4, the flux reaches a peak magnitude near the upper blade tip, due to the strong trailing vortex, before steadily decreasing in magnitude toward the lower surface.
Finally, the positive pitch case exhibits a significant negative flux along the upper surface, S6, of the control volume, due to the injection of free stream flow in the wake induced by the dominant CVP. On the bottom surface, S5, the average flux remains positive beyond the blade tip on the windward side, due to the significant movement of the vortex, as highlighted in Fig. 13, exposing the wake to a consistent downwash. Conversely, the distribution of flux near the leeward tip on the bottom surface is similar to the aforementioned pitch cases, due to the lack of a dominant CVP and asymmetric load profile. On the windward surface, S3, the flux is predominantly positive, as the wake is ejected from the control volume. The cross-stream specific curves show a gradually decreasing maximum magnitude, which occurs lower in the rotor as the wake progresses and the tip vortex convects downward. On the leeward surface, S4, the flux remains positive as the wake expands laterally, with larger magnitudes concentrated along the upper half of the rotor, due to the induction of the tip vortex.
Given the lack of volumetric data and the large spacing between the measurement planes, the surface integrals for the axial and lateral surfaces cannot be computed. Instead, a line-integrated value across the surfaces of the projected frontal areas of the rotor is presented in Fig. 20. The line integrals are computed along the defined surfaces, with lengths of D for S5 and S6 and 0.86 D for S3 and S4. These boundaries correspond to the dashed boundaries shown in Fig. 19. The trends confirm the mechanism highlighted previously, where the major sources of MKE flux are through the upper surface, S6. The positive and negative pitch cases exhibit an increased flux by factors of 20 and 10, respectively, compared with the baseline case at . Meanwhile, along the bottom surface (S5), minimal deviations from the baseline case are present, as discussed previously. Consistent with the distributions shown in Fig. 19, the positive pitch case shows a gradual increase of MKE flux, starting at as the induced downwash of the downward convecting tip vortex becomes prevalent. Unlike the top and bottom surfaces, the lateral surfaces (S3 and S4) demonstrate similar magnitudes in flux for each pitch case. Both the negative and positive pitch cases show the largest differences in flux in the near wake before gradually converging. The positive pitch case demonstrates larger differences up to , due to the significant difference in circulation of the CVP.
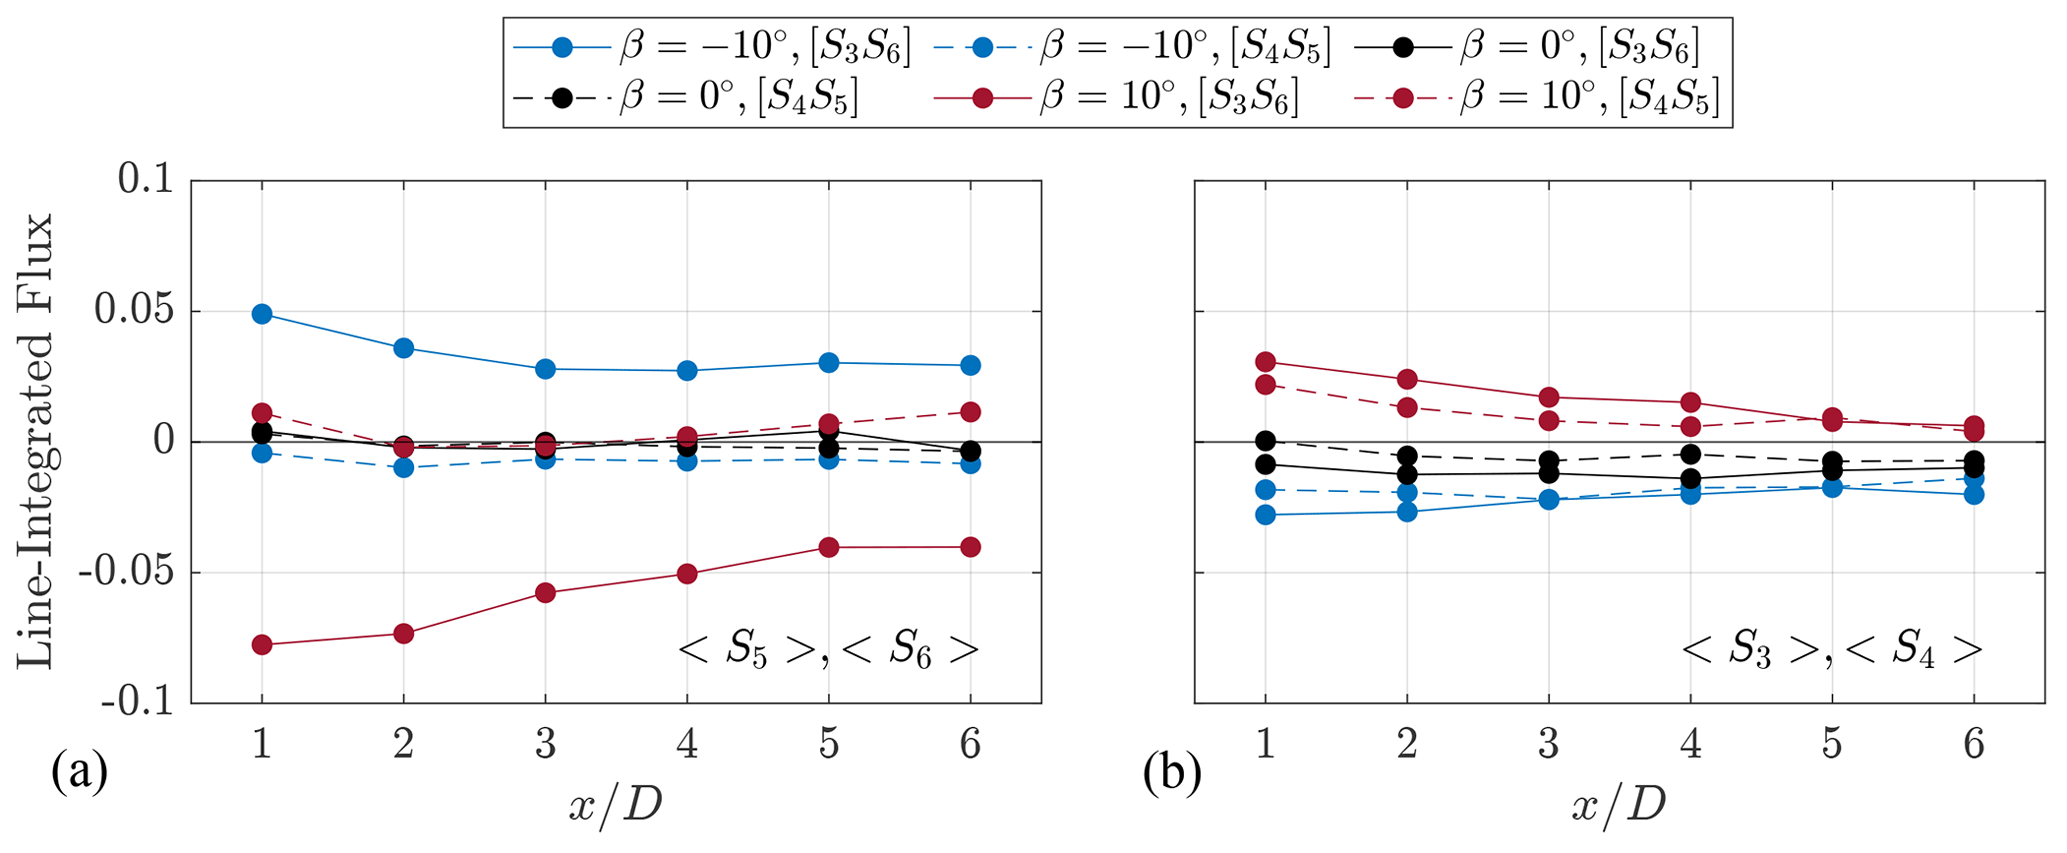
Figure 20Line-integrated MKE flux through the respective surfaces shown in Fig. 18 for each pitch case: (a) axial surfaces, (b) lateral surfaces. Solid and dashed lines correspond to the bottom axial surface and leeward sides (S5, S4) and top axial and windward sides (S6, S3), respectively. Line integrals are normalized by the product of the free stream velocity and the length of the integration domain, , where the subscripts a and l refer to the axial and lateral surface lengths, respectively. In this case, La=D and Ll=0.86 D.
This study presents cross-plane stereoscopic PIV measurements of the wake of the X-Rotor VAWT, using the “vortex-generator” wake control strategy using passive blade pitch, elucidating the distinct wake deflections and deformations attributable to the streamwise vorticity field. The results confirm the formation of a dominant CVP that is mirrored when pitching the blade in (positive) or out (negative), linked to the shift of the idealized AC rotor loading downwind and upwind, respectively. The results are consistent with a previous application of this strategy to a straight-bladed VAWT (Huang et al., 2023b) but are distinctive to this case due to the X-shaped nature of the rotor, leading to a deeper level of asymmetry in the wake modulation characteristics between the upper and lower halves of the rotor.
The available power coefficient for hypothetical in-line turbines shows a systematically higher available power across all measurement planes for the pitched modes, compared with the baseline case. The positive pitch case yields the highest potential, with an increase as high as 117 % at , compared with an increase of 74 % at the same measurement plane for the negative case. Furthermore, the available power coefficient for downstream rotors with lateral offsets highlights the asymmetry in the wake, with a potential for higher power on the leeward side of the rotor for all pitch cases. The authors re-iterate that the power penalty associated with the pitched turbine was not measured. Hence, the balance between power lost by the rotor and gained in the wake is not evaluated. Nonetheless, these results demonstrate a proof of concept of the vortex-generator mode for the X-Rotor VAWT and the possible potential of its application at a farm scale.
The trailing-vortices system is hypothesized using the AC theory and verified using the experimental results. The baseline pitch case shows minimal wake deformation due to the lack of dominant CVP pairs in the wake. A dominant CVP is formed on the upper blade tips; it injects high-speed flow from above the rotor into the wake while ejecting low-speed wake from the side when pitching the blades inward. Conversely, when pitched outward, the dominant CVP draws high-speed flow from the sides of the rotor while ejecting the wake axially upward. As only the upper blades are pitched, the CVP is formed only on the upper half of the rotor, while the trailing vorticity system stemming from the bottom blades remains similar between the three pitch cases. The strengths of the root vortices are also modified when pitching the upper blade tips, as they are a function of the circulation balance between the upper and lower blades. However, in the context of the wake topology modulation, these play a minimal role compared with the dominant CVP upper blades. The experimentally derived circulations, trajectories, and diffusion rates of the dominant CVP stemming from the upper blades are used to model the axial flow component above the rotor using a simple point-vortex approach. The predicted distributions match the experimental values very well, highlighting the dominance of the modified trailing vorticity on the wake recovery modes.
An analysis of the contributions of each term from the MKE equation further highlights the differences between the different pitch cases. The contributions of the transport of MKE due to turbulence are minimal for the pitched cases, compared with advective terms, highlighting the dominance of the advective process of the trailing vortices on the wake recovery mechanisms of the X-Rotor. A spatial average of the terms within the projected frontal area of the rotor across all measurement planes in the wake demonstrates the importance of the axial advective component for the positive pitch case, while the negative case relies mainly on the lateral contribution. The mechanisms are further highlighted by an analysis of the flux of MKE in and out of a control volume around the rotor.
It can be concluded that the vortex-generator technique using passive blade pitch applied to the X-Rotor VAWT is an effective technique to accelerate the wake recovery, which is essential for achieving high-energy-density wind farms. Future efforts should be applied to quantify the trade-offs between the available power in the wake and that forfeited by the upwind rotor. This could guide several promising research directions, such as the optimum layout for wake control and active pitching schemes to balance wake recovery and power performance. Furthermore, future experimental and numerical studies should build upon the present findings by examining the effects of more realistic wind farm conditions, such as turbulent and sheared inflow. Finally, the results from this study serve as an experimental benchmark for ongoing and future development of numerical models for VAWT wake aerodynamics.
As described in Sect. 4.4, the diffusion length scale parameter η is evaluated by fitting a curve described by Eq. (10). A comparison between the measured and curve-fitted streamwise vorticity distributions through the vortex core for the UW vortex for the positive pitch case is shown in Fig. A1 at each measurement plane. The solid and dashed lines correspond to the measured and fitted data, respectively. For clarity, the centers of the vortex cores, as defined in Fig. 13, are translated to coincide at . Consistent with the trend shown in Fig. A1, the peak vorticity decreases when progressing downstream in the wake. As it decreases, the size of the vortex structure increases, as evidenced by the increasing width of the curves. This is highlighted by the vertical dashed lines, which correspond to the radial position y from the vortex core, where is 50 % of its peak magnitude. Given the decrease in peak magnitude, this radius increases as the wake progresses.
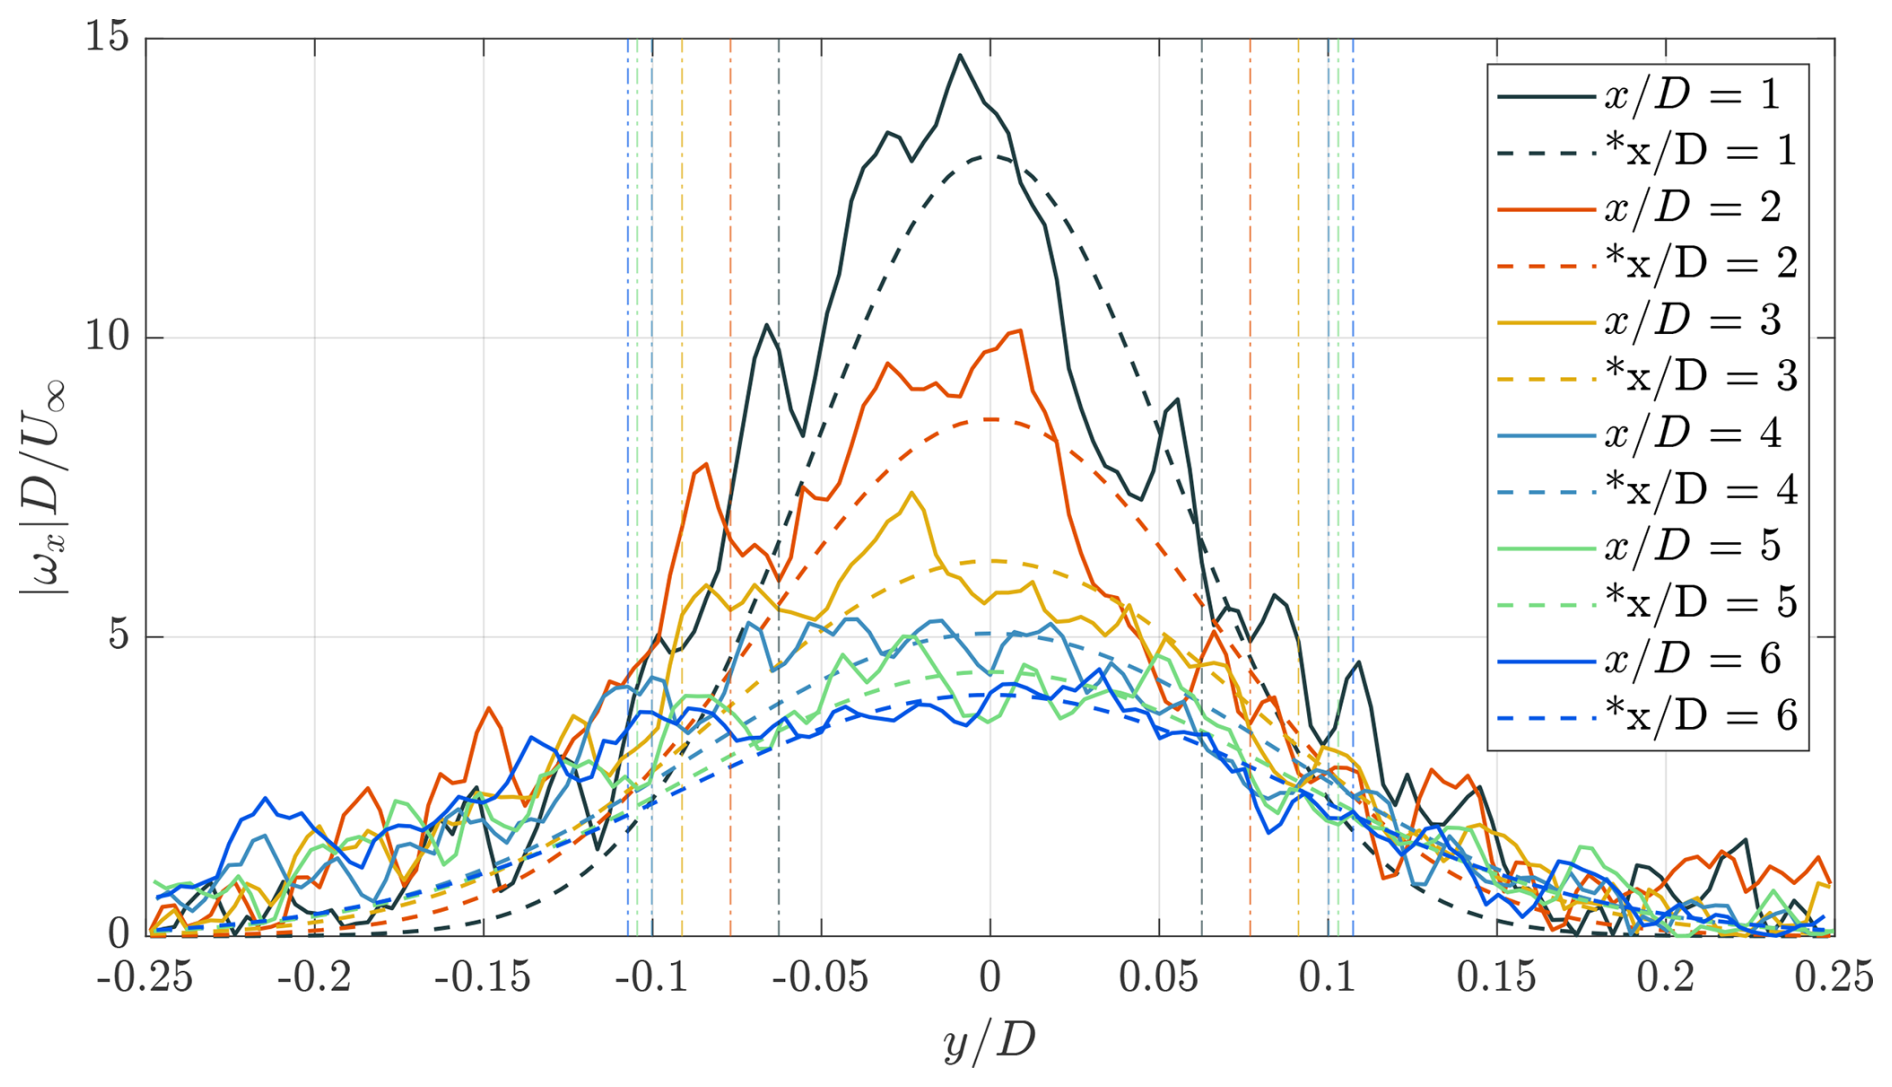
Figure A1Normalized streamwise vorticity magnitude of the windward vortex of the positive pitch case β= 10°. The lateral coordinate is normalized so that = 0 is the center of the vortex core at each measurement plane. Solid lines are the raw data, and dashed lines, marked with *, are the fitted curves using Eq. (10). The vertical dash-dotted lines indicate the lateral coordinate at 50 % of the maximum of the fitted curve.
The data supporting this study's findings are openly available in 4TU ResearchData at https://doi.org/10.4121/fa5aa65d-7619-4424-b921-e82f7d12a5fb (Bensason et al., 2025).
DB developed the methodology, carried out the experiment, performed the analysis, and wrote the manuscript. AS revised the manuscript and provided scientific supervision during the experiment, analysis, and documentation phase. CF provided guidance toward the methodology, experiment, and analysis phase.
The contact author has declared that none of the authors has any competing interests.
Publisher’s note: Copernicus Publications remains neutral with regard to jurisdictional claims made in the text, published maps, institutional affiliations, or any other geographical representation in this paper. While Copernicus Publications makes every effort to include appropriate place names, the final responsibility lies with the authors.
We wish to acknowledge the support of Ed Roessen and Rob van der List (Dienst Elektronische en Mechanische Ontwikkeling – AE Faculty) for the design and manufacture of the rotors.
This research has been supported by the funding received from the European Union's Horizon 2020 research and innovation program under grant agreement no. 101007135 as part of the XROTOR project.
This paper was edited by Oguz Uzol and reviewed by two anonymous referees.
Anderson, J.: Fundamentals of Aerodynamics (SI units), McGraw Hill, ISBN 978-1-259-01028-7, 2011. a
Bachant, P. and Wosnik, M.: Effects of Reynolds number on the energy conversion and near-wake dynamics of a high solidity vertical-axis cross-flow turbine, Energies, 9, 73, https://doi.org/10.3390/en9020073, 2016. a
Barthelmie, R. J., Pryor, S. C., Frandsen, S. T., Hansen, K. S., Schepers, J., Rados, K., Schlez, W., Neubert, A., Jensen, L., and Neckelmann, S.: Quantifying the impact of wind turbine wakes on power output at offshore wind farms, Journal of Atmospheric and Oceanic Technology, 27, 1302–1317, https://doi.org/10.1175/2010JTECHA1398.1, 2010. a
Bastankhah, M. and Porté-Agel, F.: Experimental and theoretical study of wind turbine wakes in yawed conditions, Journal of Fluid Mechanics, 806, 506–541, https://doi.org/10.1017/jfm.2016.595, 2016. a, b
Bensason, D., Sciacchitano, A., and Ferreira, C.: Near wake of the X-Rotor vertical-axis wind turbine, in: Journal of Physics: Conference Series, vol. 2505, p. 012040, IOP Publishing, https://doi.org/10.1088/1742-6596/2505/1/012040, 2023. a, b, c, d
Bensason, D., Sciacchitano, A., and Ferreira, C.: Experimental study of the impact of blade-tip mounted rotors on the X-Rotor vertical-axis wind turbine, in: Journal of Physics: Conference Series, vol. 2767, p. 072016, IOP Publishing, https://doi.org/10.1088/1742-6596/2767/7/072016, 2024a. a
Bensason, D., Sciacchitano, A., Giri Ajay, A., and Simao Ferreira, C.: A Study of the Near Wake Deformation of the X-Rotor Vertical-Axis Wind Turbine With Pitched Blades, Wind Energy, 27, 1388–1411, https://doi.org/10.1002/we.2944, 2024b. a, b, c, d, e, f, g, h, i, j
Bensason, D., Sciacchitano, A., and Simao Ferreira, C.: Supporting data belonging to publication: “On the wake re-energization of the X-Rotor vertical-axis wind turbine via the vortex-generator strateg”, Version 1, 4TU.ResearchData [dataset], https://doi.org/10.4121/fa5aa65d-7619-4424-b921-e82f7d12a5fb.v1, 2025. a
Bossuyt, J., Scott, R., Ali, N., and Cal, R. B.: Quantification of wake shape modulation and deflection for tilt and yaw misaligned wind turbines, Journal of Fluid Mechanics, 917, A3, https://doi.org/10.1017/jfm.2021.237, 2021. a, b, c, d, e
Chatelain, P., Duponcheel, M., Zeoli, S., Buffin, S., Caprace, D.-G., Winckelmans, G., and Bricteux, L.: Investigation of the effect of inflow turbulence on vertical axis wind turbine wakes, in: Journal of Physics: Conference Series, vol. 854, p. 012011, IOP Publishing, https://doi.org/10.1088/1742-6596/854/1/012011, 2017. a
Chaviaropoulos, P. K., Natarajan, A., and Jensen, P. H.: Key performance indicators and target values for multi-megawatt offshore turbines, in: European Wind Energy Conference, https://findit.dtu.dk/en/catalog/673de89bcfe47a27a8f23177 (last access: 10 October 2024), 2014. a
Cortina, G., Calaf, M., and Cal, R. B.: Distribution of mean kinetic energy around an isolated wind turbine and a characteristic wind turbine of a very large wind farm, Physical Review Fluids, 1, 074402, https://doi.org/10.1103/PhysRevFluids.1.074402, 2016. a, b, c
Dabiri, J. O.: Potential order-of-magnitude enhancement of wind farm power density via counter-rotating vertical-axis wind turbine arrays, Journal of Renewable and Sustainable Energy, 3, https://doi.org/10.1063/1.3608170, 2011. a, b
De Tavernier, D., Ferreira, C., Paulsen, U., and Madsen, H.: The 3D effects of a vertical-axis wind turbine: rotor and wake induction, in: Journal of Physics: Conference Series, vol. 1618, p. 052040, IOP Publishing, https://doi.org/10.1088/1742-6596/1618/5/052040, 2020. a, b, c, d, e
Esteban, M. D., Diez, J. J., López, J. S., and Negro, V.: Why offshore wind energy?, Renewable Energy, 36, 444–450, https://doi.org/10.1016/j.renene.2010.07.009, 2011. a
Flannigan, C., Carroll, J., and Leithead, W.: Operations expenditure modelling of the X-Rotor offshore wind turbine concept, in: Journal of Physics: Conference Series, vol. 2265, p. 032054, IOP Publishing, https://doi.org/10.1088/1742-6596/2265/3/032054, 2022. a, b
Fleming, P., Annoni, J., Shah, J. J., Wang, L., Ananthan, S., Zhang, Z., Hutchings, K., Wang, P., Chen, W., and Chen, L.: Field test of wake steering at an offshore wind farm, Wind Energ. Sci., 2, 229–239, https://doi.org/10.5194/wes-2-229-2017, 2017. a
Fleming, P., King, J., Dykes, K., Simley, E., Roadman, J., Scholbrock, A., Murphy, P., Lundquist, J. K., Moriarty, P., Fleming, K., van Dam, J., Bay, C., Mudafort, R., Lopez, H., Skopek, J., Scott, M., Ryan, B., Guernsey, C., and Brake, D.: Initial results from a field campaign of wake steering applied at a commercial wind farm – Part 1, Wind Energ. Sci., 4, 273–285, https://doi.org/10.5194/wes-4-273-2019, 2019. a
Fleming, P., King, J., Simley, E., Roadman, J., Scholbrock, A., Murphy, P., Lundquist, J. K., Moriarty, P., Fleming, K., van Dam, J., Bay, C., Mudafort, R., Jager, D., Skopek, J., Scott, M., Ryan, B., Guernsey, C., and Brake, D.: Continued results from a field campaign of wake steering applied at a commercial wind farm – Part 2, Wind Energ. Sci., 5, 945–958, https://doi.org/10.5194/wes-5-945-2020, 2020. a
Frederik, J. A., Doekemeijer, B. M., Mulders, S. P., and van Wingerden, J.-W.: The helix approach: Using dynamic individual pitch control to enhance wake mixing in wind farms, Wind Energy, 23, 1739–1751, https://doi.org/10.1002/we.2513, 2020. a
Giri Ajay, A., Morgan, L., Wu, Y., Bretos, D., Cascales, A., Pires, O., and Ferreira, C.: Aerodynamic model comparison for an X-shaped vertical-axis wind turbine, Wind Energ. Sci., 9, 453–470, https://doi.org/10.5194/wes-9-453-2024, 2024. a, b, c, d, e, f, g
Graftieaux, L., Michard, M., and Grosjean, N.: Combining PIV, POD and vortex identification algorithms for the study of unsteady turbulent swirling flows, Measurement Science and Technology, 12, 1422, https://doi.org/10.1088/0957-0233/12/9/307, 2001. a, b, c
Griffith, D. T., Paquette, J., Barone, M., Goupee, A. J., Fowler, M. J., Bull, D., and Owens, B.: A study of rotor and platform design trade-offs for large-scale floating vertical axis wind turbines, Journal of Physics: Conference Series, 753, 102003, https://doi.org/10.1088/1742-6596/753/10/102003, 2016. a
Guo, J. and Lei, L.: Flow characteristics of a straight-bladed vertical axis wind turbine with inclined pitch axes, Energies, 13, 6281, https://doi.org/10.3390/en13236281, 2020. a
Hezaveh, S. H. and Bou-Zeid, E.: Mean kinetic energy replenishment mechanisms in vertical-axis wind turbine farms, Physical Review Fluids, 3, 094606, https://doi.org/10.1103/PhysRevFluids.3.094606, 2018. a, b, c
Houck, D. R.: Review of wake management techniques for wind turbines, Wind Energy, 25, 195–220, https://doi.org/10.1002/we.2668, 2022. a
Howland, M. F., Bossuyt, J., Martínez-Tossas, L. A., Meyers, J., and Meneveau, C.: Wake structure in actuator disk models of wind turbines in yaw under uniform inflow conditions, Journal of Renewable and Sustainable Energy, 8, https://doi.org/10.1063/1.4955091, 2016. a, b
Huang, M., Ferreira, C., Sciacchitano, A., and Scarano, F.: Wake scaling of actuator discs in different aspect ratios, Renewable Energy, 183, 866–876, https://doi.org/10.1016/j.renene.2021.11.045, 2022. a, b
Huang, M., Sciacchitano, A., and Ferreira, C.: Experimental and numerical study of the wake deflections of scaled vertical axis wind turbine models, Journal of Physics: Conference Series, 2505, 012019, https://doi.org/10.1088/1742-6596/2505/1/012019, 2023a. a
Huang, M., Sciacchitano, A., and Ferreira, C.: On the wake deflection of vertical axis wind turbines by pitched blades, Wind Energy, https://doi.org/10.1002/we.2803, 2023b. a, b, c, d, e, f, g, h, i, j, k, l, m, n, o, p, q, r, s, t, u, v, w, x, y, z
Huang, M., Vijaykumar Patil, Y., Sciacchitano, A., and Ferreira, C.: Experimental study of the wake interaction between two vertical axis wind turbines, Wind Energy, 26, 1188–1211, https://doi.org/10.1002/we.2863, 2023c. a
Jain, S. and Saha, U.: The State-of-the-Art Technology of H-Type Darrieus Wind Turbine Rotors, Journal of Energy Resources Technology, 142, https://doi.org/10.1115/1.4044559, 2019. a
Kato, H., Watanabe, S., Kondo, N., and Saito, S.: Application of stereoscopic PIV to helicopter rotor blade tip vortices, in: 20th International Congress on Instrumentation in Aerospace Simulation Facilities, ICIASF'03, IEEE, 179–189, https://doi.org/10.1109/ICIASF.2003.1274867, 2003. a
Le Fouest, S. and Mulleners, K.: Optimal blade pitch control for enhanced vertical-axis wind turbine performance, Nature Communications, 15, https://doi.org/10.1038/s41467-024-46988-0, 2024. a
LeBlanc, B. and Ferreira, C.: Estimation of blade loads for a variable pitch vertical axis wind turbine from particle image velocimetry, Wind Energy, 25, 313–332, https://doi.org/10.1002/we.2674, 2022a. a, b
LeBlanc, B. and Ferreira, C.: Estimation of blade loads for a variable pitch Vertical Axis Wind Turbine with strain gage measurements, Wind Energy, 25, 1030–1045, https://doi.org/10.1002/we.2713, 2022b. a, b, c, d, e
Leithead, W., Camciuc, A., Amiri, A. K., and Carroll, J.: The X-rotor offshore wind turbine concept, in: Journal of Physics: Conference Series, vol. 1356, p. 012031, IOP Publishing, https://doi.org/10.1088/1742-6596/1356/1/012031, 2019. a, b, c
Lignarolo, L., Ragni, D., Krishnaswami, C., Chen, Q., Ferreira, C. S., and Van Bussel, G.: Experimental analysis of the wake of a horizontal-axis wind-turbine model, Renewable Energy, 70, 31–46, https://doi.org/10.1016/j.renene.2014.01.020, 2014. a
Madsen, H. A., Paulsen, U. S., and Vitae, L.: Analysis of VAWT aerodynamics and design using the Actuator Cylinder flow model, in: Journal of Physics: Conference Series, vol. 555, p. 012065, IOP Publishing, https://doi.org/10.1088/1742-6596/555/1/012065, 2014. a
McMorland, J., Flannigan, C., Carroll, J., Collu, M., McMillan, D., Leithead, W., and Coraddu, A.: A review of operations and maintenance modelling with considerations for novel wind turbine concepts, Renewable and Sustainable Energy Reviews, 165, 112581, https://doi.org/10.1016/j.rser.2022.112581, 2022. a
Morgan, L., Amiri, A. K., Leithead, W., and Carroll, J.: Effect of blade inclination angle for straight-bladed vertical-axis wind turbines, Wind Energ. Sci., 10, 381–399, https://doi.org/10.5194/wes-10-381-2025, 2025. a
Pryor, S. C., Barthelmie, R. J., and Shepherd, T. J.: Wind power production from very large offshore wind farms, Joule, 5, 2663–2686, 2021. a
Raffel, M., Willert, C. E., Scarano, F., Kähler, C. J., Wereley, S. T., and Kompenhans, J.: Particle image velocimetry: a practical guide, Springer, ISBN 978-3-319-68851-0, 2018. a
Ribeiro, A. F., Ferreira, C. S., and Casalino, D.: Vertical axis wind turbine wake steering by pitched struts and blades, in: Journal of Physics: Conference Series, vol. 2767, p. 092004, IOP Publishing, https://doi.org/10.1088/1742-6596/2767/9/092004, 2024. a
Rolin, V. F. and Porté-Agel, F.: Experimental investigation of vertical-axis wind-turbine wakes in boundary layer flow, Renewable Energy, 118, 1–13, https://doi.org/10.1016/j.renene.2017.10.105, 2018. a, b, c, d
Ruijgrok, E. C. M., van Druten, E. J., and Bulder, B. H.: Cost Evaluation of North Sea Offshore Wind Post 2030, Tech. rep., TNO, Witteveen+Bos Raadgevende ingenieurs B.V. Leeuwenbrug 8, P.O. Box 233, 7400 AE Deventer, the Netherlands, https://northseawindpowerhub.eu/files/media/document/Cost-Evaluation-of-North-Sea-Offshore-Wind-1.pdf (last access: 10 October 2024), 2019. a
Saffman, P. G.: Vortex dynamics, Cambridge University Press, ISBN 9780511624063, https://doi.org/10.1017/CBO9780511624063, 1995. a
Sciacchitano, A. and Wieneke, B.: PIV uncertainty propagation, Measurement Science and Technology, 27, 084006, https://doi.org/10.1088/0957-0233/27/8/084006, 2016. a, b, c
Shapiro, C. R., Gayme, D. F., and Meneveau, C.: Generation and decay of counter-rotating vortices downstream of yawed wind turbines in the atmospheric boundary layer, Journal of Fluid Mechanics, 903, R2, https://doi.org/10.1017/jfm.2020.717, 2020. a
Tescione, G., Ragni, D., He, C., Simao Ferreira, C., and van Bussel, G. G.: PIV-Based Analysis of 2D and 3D Flow Phenomena of Vertical Axis Wind Turbine Aerodynamics, in: 32nd ASME Wind Energy Symposium, p. 1080, https://doi.org/10.2514/6.2014-1080, 2014. a, b, c, d, e
Trujillo, J.-J., Bingöl, F., Larsen, G. C., Mann, J., and Kühn, M.: Light detection and ranging measurements of wake dynamics. Part II: two-dimensional scanning, Wind Energy, 14, 61–75, https://doi.org/10.1002/we.402, 2011. a
van den Berg, D., de Tavernier, D., and van Wingerden, J.-W.: The dynamic coupling between the pulse wake mixing strategy and floating wind turbines, Wind Energ. Sci., 8, 849–864, https://doi.org/10.5194/wes-8-849-2023, 2023. a
van der Hoek, D., den Abbeele, B. V., Simao Ferreira, C., and van Wingerden, J.-W.: Maximizing wind farm power output with the helix approach: Experimental validation and wake analysis using tomographic particle image velocimetry, Wind Energy, https://doi.org/10.1002/we.2896, 2024. a
van der Wall, B. G. and Richard, H.: Analysis methodology for 3C-PIV data of rotary wing vortices, Experiments in Fluids, 40, 798–812, 2006. a
Wang, J., Qin, S., Jin, S., and Wu, J.: Estimation methods review and analysis of offshore extreme wind speeds and wind energy resources, Renewable and Sustainable Energy Reviews, 42, 26–42, https://doi.org/10.1016/j.rser.2014.09.042, 2015. a
Wei, N. J., Brownstein, I. D., Cardona, J. L., Howland, M. F., and Dabiri, J. O.: Near-wake structure of full-scale vertical-axis wind turbines, Journal of Fluid Mechanics, 914, A17, https://doi.org/10.1017/jfm.2020.578, 2021. a, b, c