the Creative Commons Attribution 4.0 License.
the Creative Commons Attribution 4.0 License.
 | 13 Oct 2025
Scour variability across offshore wind farms (OWFs): identifying site-specific scour drivers as a step towards assessing potential impacts on the marine environment
Christian Jordan
Gregor Melling
Alexander Schendel
Mario Welzel
Torsten Schlurmann
The development of offshore wind farms (OWFs) is critical to meeting renewable energy targets, but predicting scour around offshore wind energy structures (OWESs) and the associated potential impacts on marine ecosystems remains a challenge. Using high-resolution bathymetry data, this study analyses field-measured scour depths at 460 monopiles at nine British OWFs. The analysis reveals a large spatial variability in relative scour depth () between OWF sites, but also within individual wind farms. Principal component analysis (PCA) is used to identify significant drivers of this variability. When the entire dataset is considered, results indicate that the relative water depth (), the relative median grain size (), the Keulegan–Carpenter number (KC99), and the sediment mobility parameter MOB () are the most important influencing factors for the variability in relative scour depth. Other parameters investigated, such as pile Reynolds number (Re99), flow intensity , and Froude number (Fr99), were found to have a less clear influence. Further sediment-specific analysis shows that relative water depth () is a particularly relevant driver of scour at sites with fine ( 200 µm) and medium sands ( 630 µm), with larger relative scour depth occurring at shallower relative water depths.
Findings from this study provide new insights into scour behaviour across a range of spatial and environmental scales and lay a foundation for the transferability of scour prediction frameworks to new OWF sites. In the future, findings and datasets from this study are suggested to be used to estimate scour-induced sediment transport and thereby to provide a step towards the assessment of potential impacts of OWF expansion scenarios in the marine environment. By addressing the broader implications for regional sediment dynamics, this research contributes to the sustainable development of offshore wind energy.
- Article
(10394 KB) - Full-text XML
- BibTeX
- EndNote


The expansion of renewable energy is crucial for a sustainable and independent energy supply. In order to meet the European Union's targets for expanding offshore wind energy (European Commission, 2020), it is necessary to develop areas with previously unveiled metoceanic and geophysical conditions. To this end, existing knowledge gaps about the interaction of individual offshore wind energy structures (OWESs) or entire offshore wind farms (OWFs) with the marine environment must be closed. In general, the disturbance of the flow by an offshore structure causes scour, which not only might affect the structure's stability (Saathoff et al., 2024), but the mobilized sediment may also contribute to the overall regional sediment transport (Vanhellemont et al., 2014; Baeye and Fettweis, 2015; Rivier et al., 2016), with potential impacts on the marine environment.
The scour process itself is a multivariate process and is dependent on a combination of complex hydrodynamic and geotechnical drivers. Early studies focused on the understanding of the scour process around a pile under simplified isolated hydraulic conditions, such as steady flow (e.g. Sheppard et al., 2004; Zhao et al., 2012; Sarkar, 2014; Baykal et al., 2015), unsteady and bidirectional tidal currents (e.g. Escarameia and May 1999; McGovern et al., 2014; Yao et al., 2016; Schendel, 2018), and waves (e.g. Sumer et al.,1992; Carreiras et al., 2001; Stahlmann, 2013). With the availability of more sophisticated experimental facilities and numerical models, research is increasingly shifting toward more complex hydrodynamic loads consisting of a combination of waves and currents, as in the studies of Sumer and Fredsøe (2001), Qi and Gao (2014), Schendel et al. (2020), Lyu et al. (2021), and Du et al. (2022), and also towards studies addressing complex offshore structures (Welzel, 2021; Welzel et al., 2024; Sarmiento et al., 2024; Chen et al., 2025).
Despite those advances in scour research, uncertainties remain in current scour prediction methods (Chen et al., 2025). Matutano et al. (2013) demonstrated the challenges of applying empirical formulas for maximum scour depth by comparing different methods with data from 10 European OWFs, revealing overpredictions in all but two cases. The comparison highlights the fundamental challenge of accounting for complex marine flow conditions, characterized by the combined effect of multiple influencing factors, such as flow velocity, sediment coarseness, and wave–current interactions, in the prediction of scour processes using existing models (Gazi et al., 2020; Harris et al., 2022). Compared to laboratory experiments focusing on scour processes, rather few studies are based on in situ data, which represent the actual scour development under complex flow conditions. These studies assessed the scour at individual structures, such as monopiles (Walker, 1995; Noormets et al., 2003; Harris et al., 2004; Rudolph et al., 2004; Louwersheimer et al., 2009) and jackets (Bolle et al., 2012; Baelus et al., 2018), or dealt with larger datasets from entire offshore wind projects (DECC, 2008; Carroll et al, 2010; Whitehouse et al., 2010, 2011; Melling, 2015), covering both the spatial and temporal evolution of scour under different hydrodynamic regimes and seabed types across the North Sea and British continental shelf. In general, the amount and variety of field data collected have increased with the gradual installation of OWESs. Focusing specifically on the correlation between scour and on-site conditions, Melling (2015) analysed the relationships between the variations in scour hole dimension within OWFs and both sedimentological and hydrodynamic parameters of 281 OWESs in the Outer Thames Estuary. The study of Melling (2015), although only covering three OWFs, represents one of the most comprehensive investigations of field-related scour to date, with the highest number of structures examined so far. By comparing field data with physical modelling experiments and the literature, the study provided valuable insights into the range of observed scour and its controlling structural, hydrodynamic, and sedimentological parameters.
In addition to local scour at individual structures, the cumulative effect of multiple structures in an OWF can alter ocean dynamics (Christiansen et al., 2022), mixing (Schultze et al., 2020), and sediment mobility, resulting in changes to suspended sediment concentrations and wave-induced turbidity plumes (Vanhellemont and Ruddick, 2014). This can also lead to dynamic interactions with migrating seabed features, such as sand waves (Matthieu and Raaijmakers, 2013). Increased velocities and turbulence induced by OWFs also have the potential to affect the marine environment, potentially leading to global erosion around the structures as well as habitat loss or gain for benthic flora and fauna (Shields et al., 2011; Wilson and Elliott, 2009; Welzel et al., 2019). Concerns over the potential impacts of OWF installations on local ecosystems further include collision risks, noise pollution, electromagnetic fields, and the introduction of invasive species (Lloret et al., 2022; Bailey et al., 2014; Teilmann and Carstensen, 2012; Watson et al., 2024). As the size and scale of OWFs increase, the risk of significant cumulative effects arising is also expected to increase (Brignon et al., 2022; Guşatu et al., 2021). The drivers and interdependencies of these large-scale processes are not yet well understood, and the precise impact of scour-induced sediment transport on the marine environment remains uncertain, highlighting the need for interdisciplinary research utilizing field data.
In order to gain a better understanding of the geophysical changes following the installation of OWFs and potential impacts on the marine environment arising from it, this study analyses the scour development at OWESs as a first step. This study builds its analysis on field data, including high-resolution bathymetry scans from British OWFs, which have recently been made publicly available. This provides an opportunity to extend the understanding of scour evolution and its key drivers using a cross-regional dataset. A total of 460 monopiles were analysed to obtain local scour depth and their spatial distribution depending on the selected hydrodynamic and geological drivers.
Understanding scour development is a critical first step in assessing potential environmental impacts. It will help determine whether OWESs and entire OWFs contribute to regional sediment mobilization and provide a foundation for future research into the long-term morphological footprint of OWF installations and their broader ecological effects. To contribute to the overarching goal of reducing uncertainty in scour predictions at OWESs, this study analyses field data from 460 monopiles across 9 OWFs, situated in diverse marine regimes with current velocities from 0.54 to 1.77 m s−1 (99th percentile), significant wave heights from 1.5 to 2.7 m (99th percentile), water depths from 5 to 35 m, and grain sizes ranging from cohesive sediment (51.54 µm) to medium gravel (19872 µm). The spatial distribution and variability in relative scour depth across and within these OWFs are determined and correlated with selected hydrodynamic and sedimentological parameters using principal component analysis (PCA). This analysis aims to (1) identify universal drivers of scour across all sites, (2) assess sediment-specific correlations by grain size (d50), and (3) evaluate site-specific variability at the level of three selected OWFs (Robin Rigg, Lynn and Inner Dowsing, and London Array). The site-specific analysis in Sect. 3.5 assesses the robustness of the global correlations under local conditions and provides insight into how local conditions influence scour behaviour. Collectively, these efforts aim to decrease uncertainty in relative scour depth prediction by assessing the contribution of the main drivers of scour development from multivariable field data.
This paper is organized as follows: Sect. 2 describes the study area and methodology, in which the methods used to obtain the relative scour depth and selected on-site parameters are explained in detail (Sect. 2.2–2.4). Additionally, the application of the PCA to identify the primary correlation between these parameters and scour development is explained (Sect. 2.5). The results are presented in Sect. 3, followed by a discussion (Sect. 4) and ending with the conclusions (Sect. 5).
2.1 Study area
The research area, located in British waters, is illustrated in Fig. 1, showing the specific locations of the nine studied OWFs. Figure 1a provides a general overview, while Fig. 1b pinpoints the positions of the OWFs, labelled 1 to 9. These OWFs correspond to Robin Rigg, Barrow, Teesside, Humber Gateway, Lincs, Lynn and Inner Dowsing, Greater Gabbard, London Array, and Gunfleet Sands, respectively. Figure 1c and d display the 99th percentiles of the significant wave heights (Hs,99) and current velocity magnitudes (U99) at the nine locations, respectively.
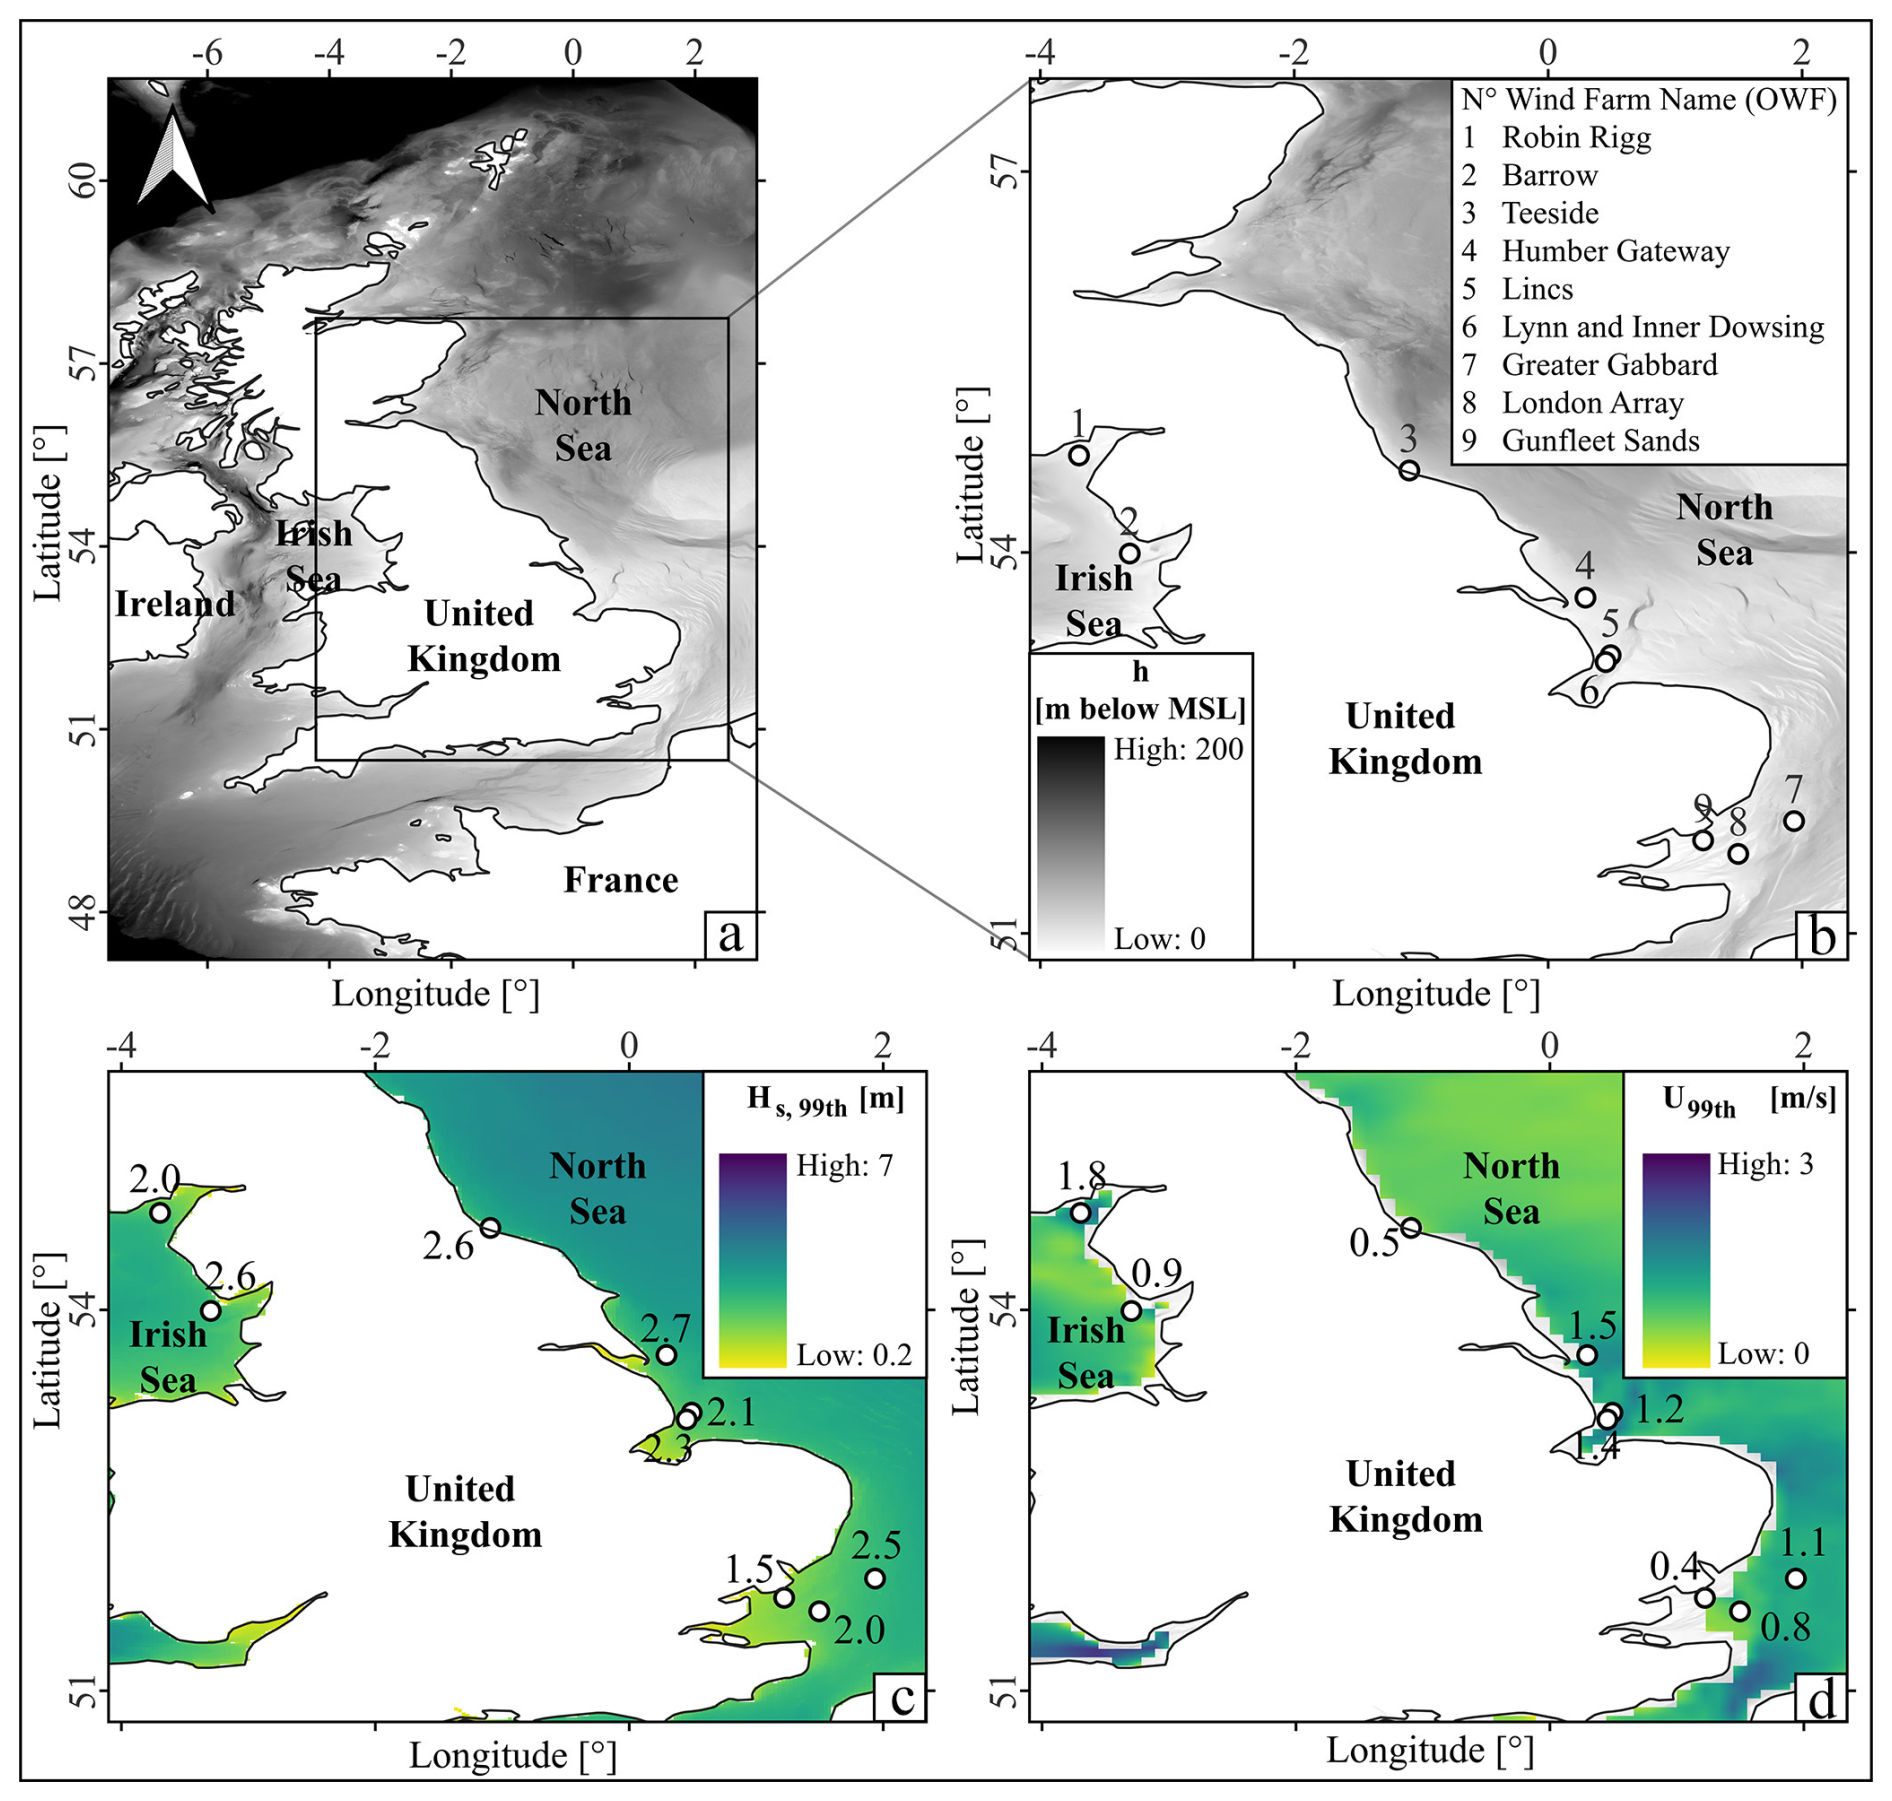
Figure 1(a) Study area. (b) Location of the nine studied OWFs. The bathymetry data shown originate from EMODNET (https://emodnet.ec.europa.eu/en/bathymetry, last access: 29 September 2025). (c) The 99th percentile of significant wave heights (Hs) based on data for the year 2012. (d) The 99th percentile of current velocity magnitudes (U) based on data for the year 2012.
Notably, wind farms such as Robin Rigg and Barrow are situated in the Irish Sea, while the remaining seven are located in the North Sea at the east coast of the UK (Fig. 1b). Water depths (h) ranging from 5 to 35 m can be found across the nine OWFs. Depth data (h) were obtained from EMODNET (https://emodnet.ec.europa.eu/en/bathymetry, last access: 29 September 2025). The OWF located in the shallowest water depth is Robin Rigg, with h ranging from 1 to 14 m (Fig. 1b). Conversely, the OWF with the deepest water depth is Greater Gabbard, with h ranging from 21 to 35 m (Fig. 1b).
The maximum significant wave height (99th percentile) of Hs = 2.7 m was found at the Humber Gateway OWF, while the minimum value of Hs = 1.5 m was found at the Gunfleet Sands OWF. These OWFs are located at the mouths of the Humber and Thames estuaries, respectively (Fig. 1c). Regarding current velocities, the maximum value of Uc= 1.8 m s−1 was found at the Robin Rigg OWF, while the minimum value of Uc= 0.4 m s−1 was found at the Gunfleet Sands OWF (Fig. 1d).
Depending on the locations of the OWFs, the seabed conditions vary from sandbanks featuring a variety of bedforms to intertidal mudflats. Accordingly, the sediment also varies from silt to coarse and very coarse gravel, with the sediment at the Teesside OWF consisting of fine and silty sands and that at Humber Gateway consisting of sandy gravel and boulders. In contrast, OWFs such as London Array and Greater Gabbard are located in the Outer Thames Estuary with sandbanks and channels, while others such as Barrow and Robin Rigg have distinct geological features such as megaripples, mudflats, and deposits from different geological eras.
2.2 Data description
Bathymetric datasets from the nine OWFs considered in this study were collected via a multibeam echosounder (MBES) before, during, and after the construction of the OWFs and were afterwards made available by their operators via the Marine Data Exchange (MDE).
In total, 460 OWESs (of 680 available) with monopile foundations were analysed in this study. For the correlation between scour and hydrodynamic conditions at the nine studied OWFs, metocean hindcast datasets (i.e. significant wave height, Hs, and velocity magnitude, U) by the Copernicus Marine Service (CMEMS) (https://marine.copernicus.eu/, last access: 29 September 2025) were used (CMEMS, 2023a, b).
Table 1Overview of studied OWFs with hydrodynamic and sedimentological site conditions.
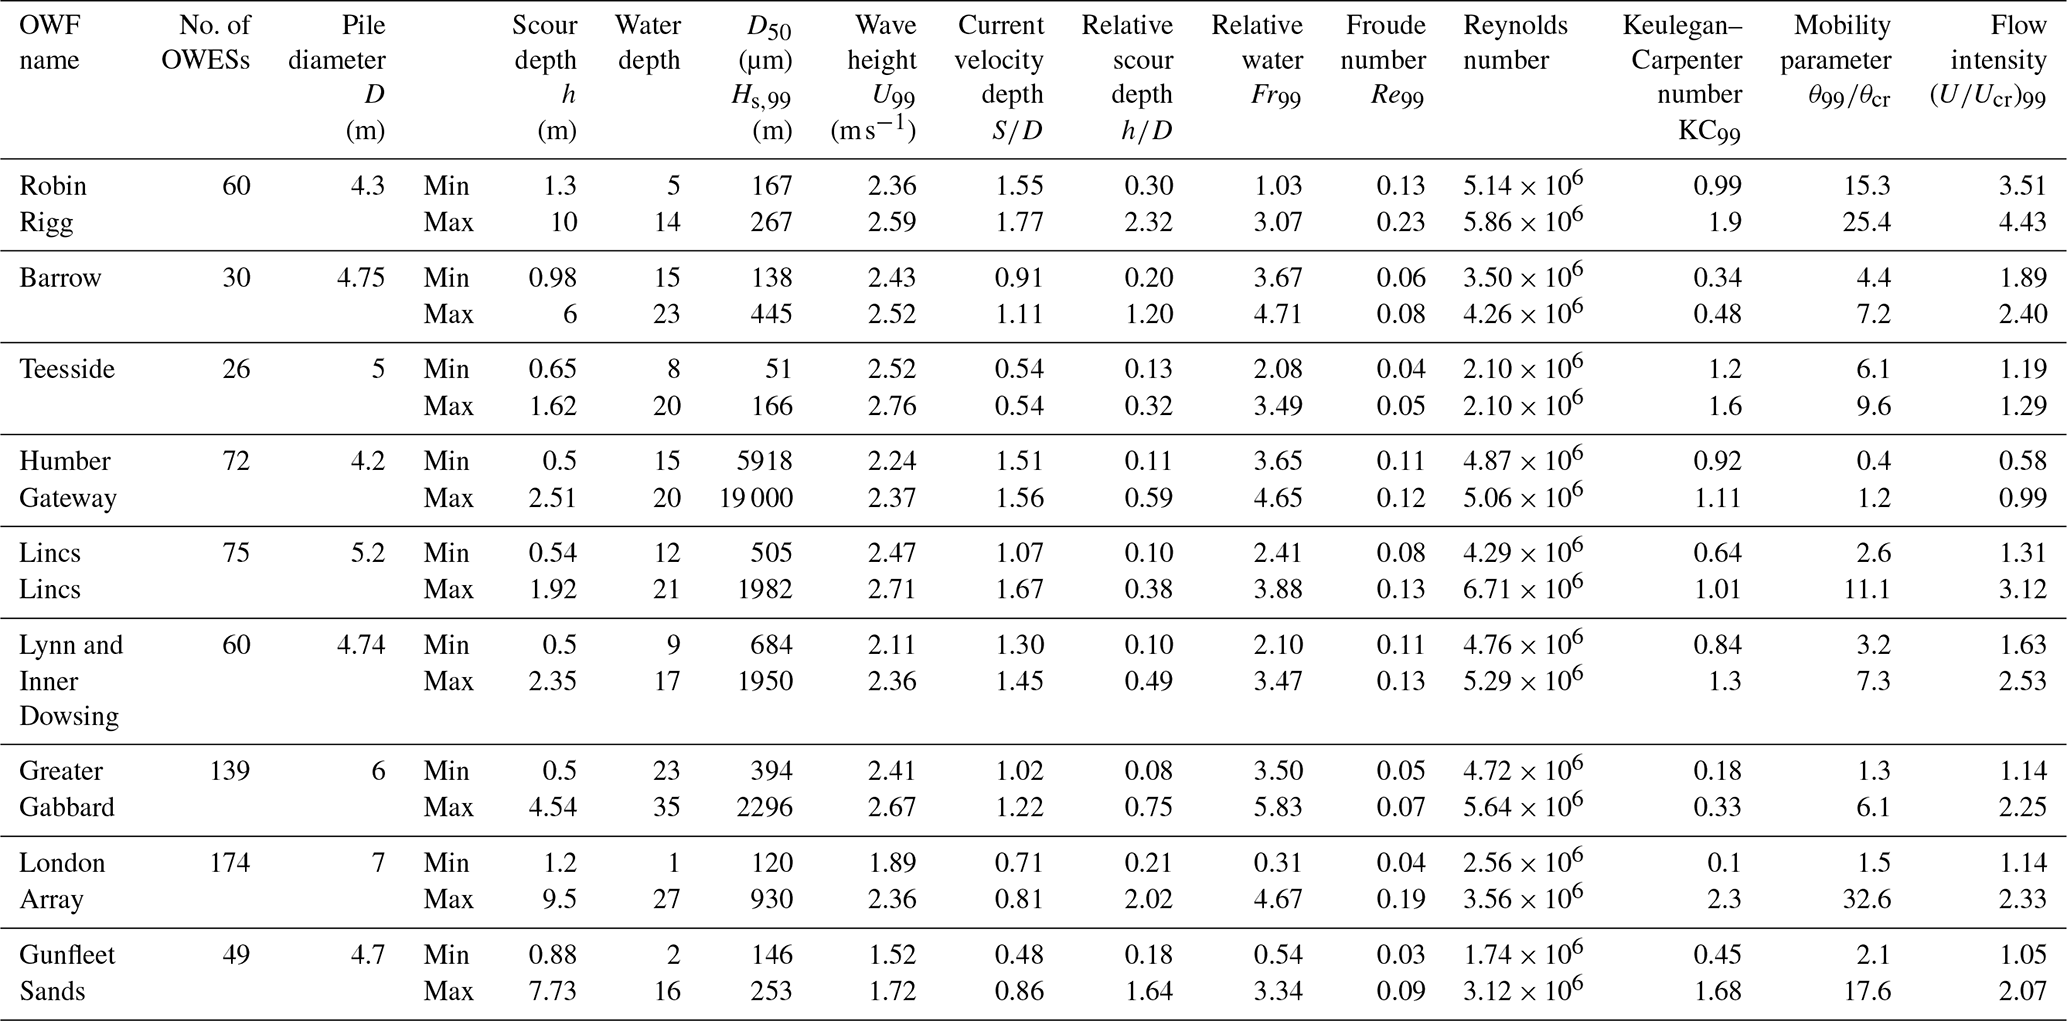
Table 1 shows the OWFs considered in this study and provides an overview of their structural characteristics as well as the hydrodynamic and geotechnical site conditions. Pile diameters (D) were obtained from Negro et al. (2017), water depths (h) are based on EMODnet Bathymetry Consortium (2020), and d50 represents the median grain diameter of the sediment. The sediment data shown in Table 1 were obtained in Phi units from each OWF's benthic reports, then converted to d50 values in micrometres (µm) according to Bunte and Abt (2001). The scour depth S represents the deepest scour at an individual OWES. The number of OWESs varies from 26 OWESs installed at the Teesside OWF to 174 OWESs installed at the London Array OWF, indicating the different operational scales. For some OWFs, including Lynn and Inner Dowsing, extensive bathymetric data spanning over 10 years were available. In contrast, others, such as Humber Gateway, had more limited bathymetric data, with a coverage duration of 4 years. The highest grid resolutions of the bathymetric datasets found at each OWF varied from 0.2 to 0.5 m, with the highest resolution of the bathymetries found at each OWF being used. The earliest bathymetry was collected at the Barrow OWF in 2005, and the most recent was collected at Lynn and Inner Dowsing in 2017, highlighting the long-term monitoring efforts at the wind farms. However, in this study only scour depth obtained from the pre- and the first post-construction bathymetries was considered. The shortest period between pre- and post-bathymetries was found at the Lincs OWF, with 377 d between August 2010 and August 2011, while the longest period between scans was detected at the Greater Gabbard OWF, with 2902 d (∼ 8 years) between June 2005 and May 2013.
Furthermore, environmental and hydrodynamic conditions associated with each OWF are also shown in Table 1. These are essential for understanding how different variables contribute to scour around monopiles. These variables include the 99th-percentile significant wave height (Hs,99), representing the average height of the highest third of waves. The wave height has a direct influence on the wave-induced current velocity near the seabed and thus strongly determines the bed shear stresses and the formation of the vortex system around the OWES (Sumer and Fredsøe, 2002; Schendel, 2018). The 99th-percentile current velocity magnitude (U99) indicates the resultant eastward (u0) and northward (v0) tidal flow components; those represent the depth-averaged velocity magnitude, whereas Ucr depicts the critical flow velocity for sediment entrainment. Their ratio, the flow intensity , is a key parameter in describing the general sediment mobility and has a large impact () on the formation of the horseshoe vortex in such a way that the size of the horseshoe vortex is reduced as the flow depth decreases, resulting in a reduction in the relative scour depth. At greater relative water depth () the relative scour depth becomes almost independent of relative water depth (Sumer and Fredsøe, 2002).
The Froude number (Fr99) and pile Reynolds number (Re99) are used to characterize the flow conditions around the pile, and their calculations are shown in Table 2 and Eqs. (2) and (3). The Froude number indicates whether the flow is dominated by gravitational or inertial forces. With increasing Froude number, stronger inertial forces produce more pronounced pressure gradients at the upstream face of the monopile. Promoting early boundary layer separation enhances the strength of the horseshoe vortex system near the seabed, which increases local bed shear stress and accelerates sediment erosion. As shown by Hu et al. (2021), these dynamics are key in amplifying scour. Similarly, Corvaro et al. (2016) found that higher Froude numbers lead to larger vortex structures and increased bed shear stress, resulting in deeper equilibrium scour depth. On the other hand, the Reynolds number provides information on whether the flow is laminar or turbulent and determines the characteristics of the vortex system around the pile.
Additionally, the Keulegan–Carpenter number (KC99) is a dimensionless parameter that determines the relative influence of drag and inertia forces in oscillatory flows. It has a direct impact on vortex formation and sediment transport potential (Sumer and Fredsøe, 2002). The mobility parameter () is considered a key controlling factor for scour, as it represents the degree to which the bed shear stress exceeds the critical threshold for sediment motion under given flow conditions (Soulsby, 1997; Whitehouse, 2000). The calculations of those two parameters are shown in Table 2 and Eqs. (9) and (20). The datasets were obtained between pre- and post-construction bathymetries. The data were collected over a 1-year period, prior to the post-construction bathymetry.
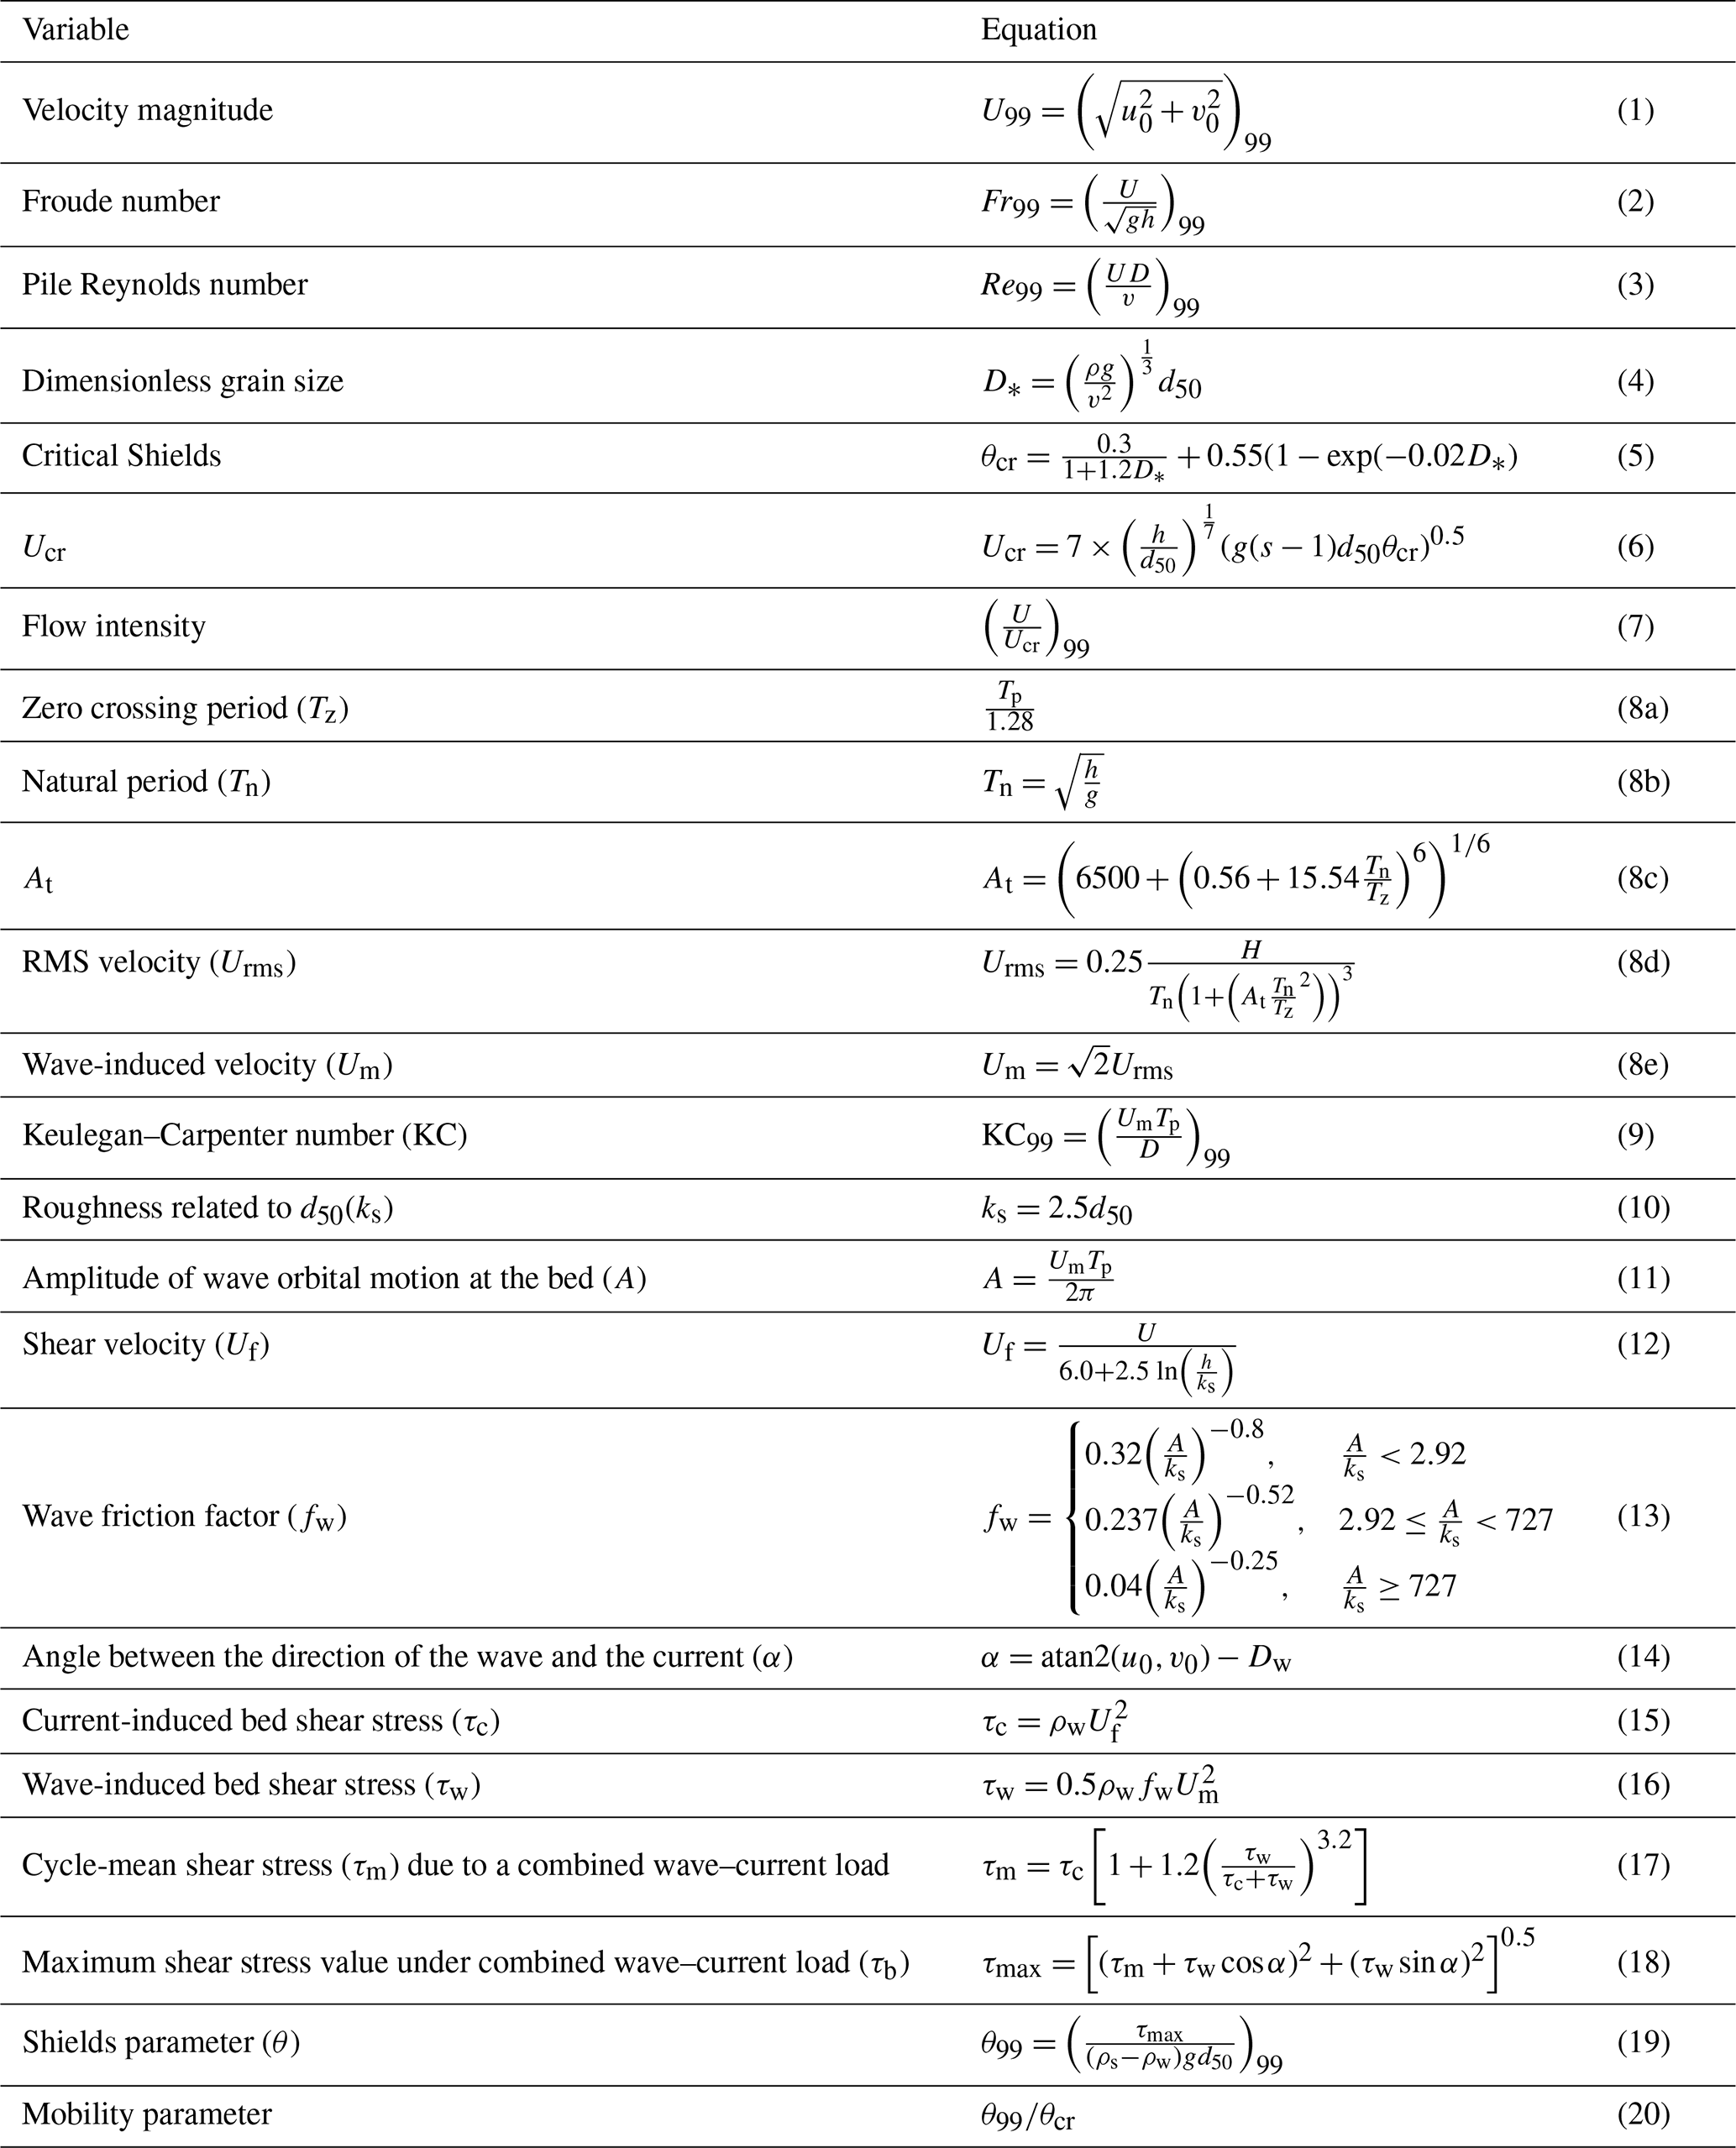
Dimensionless parameters as given in Table 1 were calculated based on the equations summarized in Table 2.
The values assumed for all OWF sites are ρs = 2650 kg m−3 (sediment density, based on Soulsby, 1997), ρw = 1027 kg m−3 (water density), ν = 1.3 × 10⁻⁶ m2 s−1 (kinematic viscosity), and g = 9.8 m s−2 (gravitational acceleration). Equation (4) was calculated based on van Rijn (1984), where D∗ is the non-dimensional grain diameter that is used to calculate the critical Shields parameter (θcr), which represents the threshold for initiation of motion at the bed, as proposed by Soulsby (1997). Equation (5) is taken from Soulsby and Whitehouse (1997), where s () represents the specific gravity of sediment grains. The d50 represents the median sediment grain size.
In Eq. (18), the maximum bed shear stress value (τmax) was calculated following Roulund et al. (2016), which builds upon Soulsby (1997) by combining current- and wave-induced shear stress through a directional correction. The Shields parameter (θ99) is derived using Eq. (19), based on the maximum bed shear stress (τmax) under combined wave and current conditions. The Keulegan–Carpenter number is defined in Eq. (10), where Tp is the peak wave period and D the monopile diameter.
Equation (20) provides the calculation of the mobility parameter to assess sediment mobility, providing a dimensionless indicator of whether the hydrodynamic forcing was sufficient to initiate sediment motion. All relevant equations are summarized in Table 2.
2.3 Pre-processing of bathymetric data
Figure 2 shows the workflow used in this study, starting with the acquisition of bathymetric datasets, originally obtained from the Marine Data Exchange, and their conversion to Ordnance Datum Newlyn (ODN). This was followed by the generation of 100 m × 100 m tiles for each available bathymetric dataset, centred on each turbine location. If bathymetric scans with different spatial resolutions were available for the same date, only the one with the highest resolution was used. In addition, some turbine locations could not be further analysed due to missing pre-construction scans or poor data quality. Tiles with more than 50 % empty cells were discarded because a high percentage of missing data increases the likelihood that important areas, such as the scour region, are poorly captured. Tests were conducted with lower missing cell thresholds (10 % and 25 %), but even with 50 % missing data, valuable information for scour analysis was retained. Using a stricter 25 % threshold, too many tiles were lost, including those that still contained useful data. As a result, 460 OWESs across the 9 OWFs were analysed in this study.
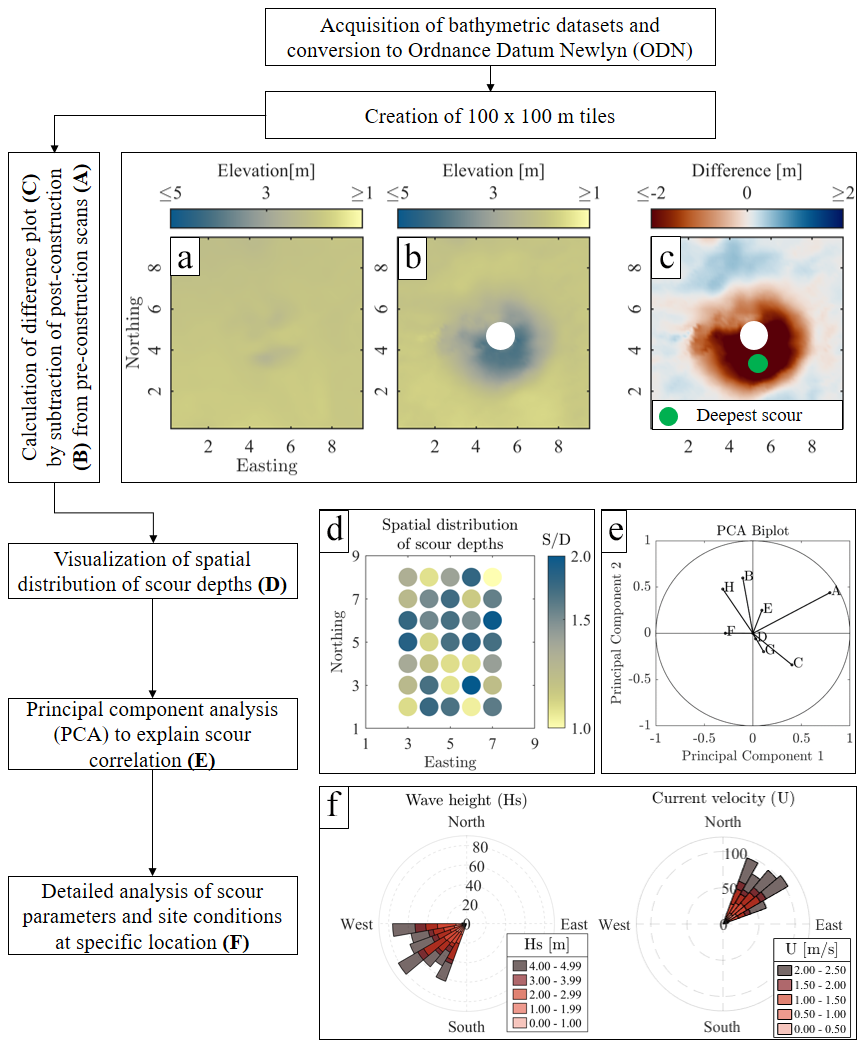
Figure 2General workflow and methodology used to assess the scour distribution and evolution as well as the correlation between scour parameters and site conditions. (a) Pre-installation scan. (b) Post-installation scan. (c) Difference plot after subtraction of (a) from (b). (d) Map of spatial distribution of relative scour depth. (e) Principal component analysis (PCA). (f) Site conditions of wave heights and current velocities.
The difference in bed elevation at turbine sites between the pre-construction (Fig. 2a) and post-construction surveys (Fig. 2b) was used for extracting scour information. The deepest scour at each turbine site was then extracted from the difference plot (Fig. 2c). A detailed description of this part of the workflow is provided in Sect. 2.4.
2.4 Calculation of scour parameters
First, to eliminate outliers, a threshold based on the 99th percentile was used to filter out extreme values, ensuring that outliers did not skew subsequent analyses or visualizations. Subsequently, to address potential offsets between pre- and post-construction, a median filter was applied to both datasets. The difference in medians, excluding the presumed scour area, was considered the offset. This offset was then applied while calculating the difference plot between the pre- and post-construction bathymetries (Fig. 2a–c). To remove additional outliers close to the turbine, an area equivalent to 110 % of the pile's footprint area was excluded from the centre of the difference plot.
The deepest scour depth (see green dot in Fig. 2c) was then extracted from the difference plot (Fig. 2c). The calculated relative scour depth was then visualized to show the spatial distribution across the nine OWFs (Fig. 2d).
2.5 Principal component analysis (PCA)
In the case of field data, the correlation of the scour process with hydrodynamic and geotechnical variables is complicated by the simultaneous change in several of these variables. In order to reduce the complexity and simplify this multivariate problem, PCA was used in a next step (Fig. 2e). PCA works by transforming the data into a set of new variables called principal components, which are linear combinations of the original variables (Jolliffe and Cadima, 2016). These components are ordered based on how much variance they explain, with the first principal component (PC1) explaining the maximum variance in the data, followed by the second principal component (PC2). Each component also has an eigenvalue, which shows the amount of variation it captures. Generally, the PCA is able to handle lots of independent variables and helps to simplify the data without losing important information (Harasti et al., 2022).
In this study, the PCA was applied to a dataset of 692 OWESs, including 460 from our analysis and an additional 232 OWESs from the London Array and Thanet OWFs, based on the data of Melling (2015). The PCA was then performed using eight independent variables that contributed to the principal components. Those dimensionless variables were the relative water depth (), Keulegan–Carpenter number (KC99), mobility parameter (), Reynolds number (Re99), Froude number (Fr99), relative sediment size (), flow intensity (), and the relative scour depth (). Following this, the data were organized into a matrix, with each row representing a specific OWES and each column representing a selected dimensionless variable. All the variables were extracted as representative values specific to the OWES, with the focus on the 99th percentile to capture extreme hydrodynamic conditions. Scour processes are more likely to occur in these extreme conditions because maximum scour depth usually develops during storm-induced events, rather than under mean or median values. Subsequently, the variables were standardized to ensure the comparability of the results.
In some studies, the PCA is used for reducing the number of dimensions (Harasti et al., 2022) or to help develop predictive models grouped by soil classes (Annad et al., 2023). However, the aim of this study was to keep all the principal components. This approach enabled the full exploration of the interdependence between physical drivers and scour response across sites. To interpret the relationships among the variables, a principal component analysis biplot was generated (Gabriel, 1971). In the biplot, variables are represented as vectors, and the angle between vectors indicates the degree of correlation. The strength of the correlation was quantified using the cosine of the angle (Jolliffe and Cadima, 2016), enabling us to assess the strength of association between each variable and scour variability across different OWF sites. Similar to previous studies that applied PCA for parameter selection in bridge pier or scour formula development (Harasti et al., 2022; Annad at al., 2023), this multivariate analysis provides a clearer understanding of which parameters dominate the scour process under real offshore conditions.
An additional approach to reducing the complexity of multivariate datasets is to initially group the data based on a selected key variable. Accordingly, the PCA was also applied to the dataset after it had been grouped by grain size (d50 diameter) class (Annad et al., 2021), given that the sediment characteristics of the seabed play a significant role in local scour (Qi et al., 2016). This approach facilitated a more precise estimation of local scour, thereby reducing uncertainties related to sediment.
3.1 Spatial distribution of relative scour depth
To illustrate the variability in relative scour depth between the nine studied OWFs and within single OWFs, Fig. 3 shows the spatial distribution of relative scour depth. There are clear differences between OWFs in both the magnitude of and variability in relative scour depth. For example, at the Robin Rigg OWF (Fig. 3a), the highest relative scour depths were identified; the values range from to . This OWF is characterized by fine and medium sands. In contrast, the smallest relative scour depth occurred at the OWF of Lynn and Inner Dowsing (Fig. 3f), with values from to , which is possibly linked to coarse sands presented at this site. Furthermore, the highest variabilities (σ=0.44) in relative scour depth were detected at the London Array (Fig. 3h) and Barrow (Fig. 3b) OWFs, likely influenced by the complex seabed morphologies and sediment compositions in these areas. On the other hand, the significant variability at London Array may be explained by the presence of the Long Sand and Kentish Knock sandbank. This illustrates how different site characteristics can result in various scour distributions, even within a single OWF.
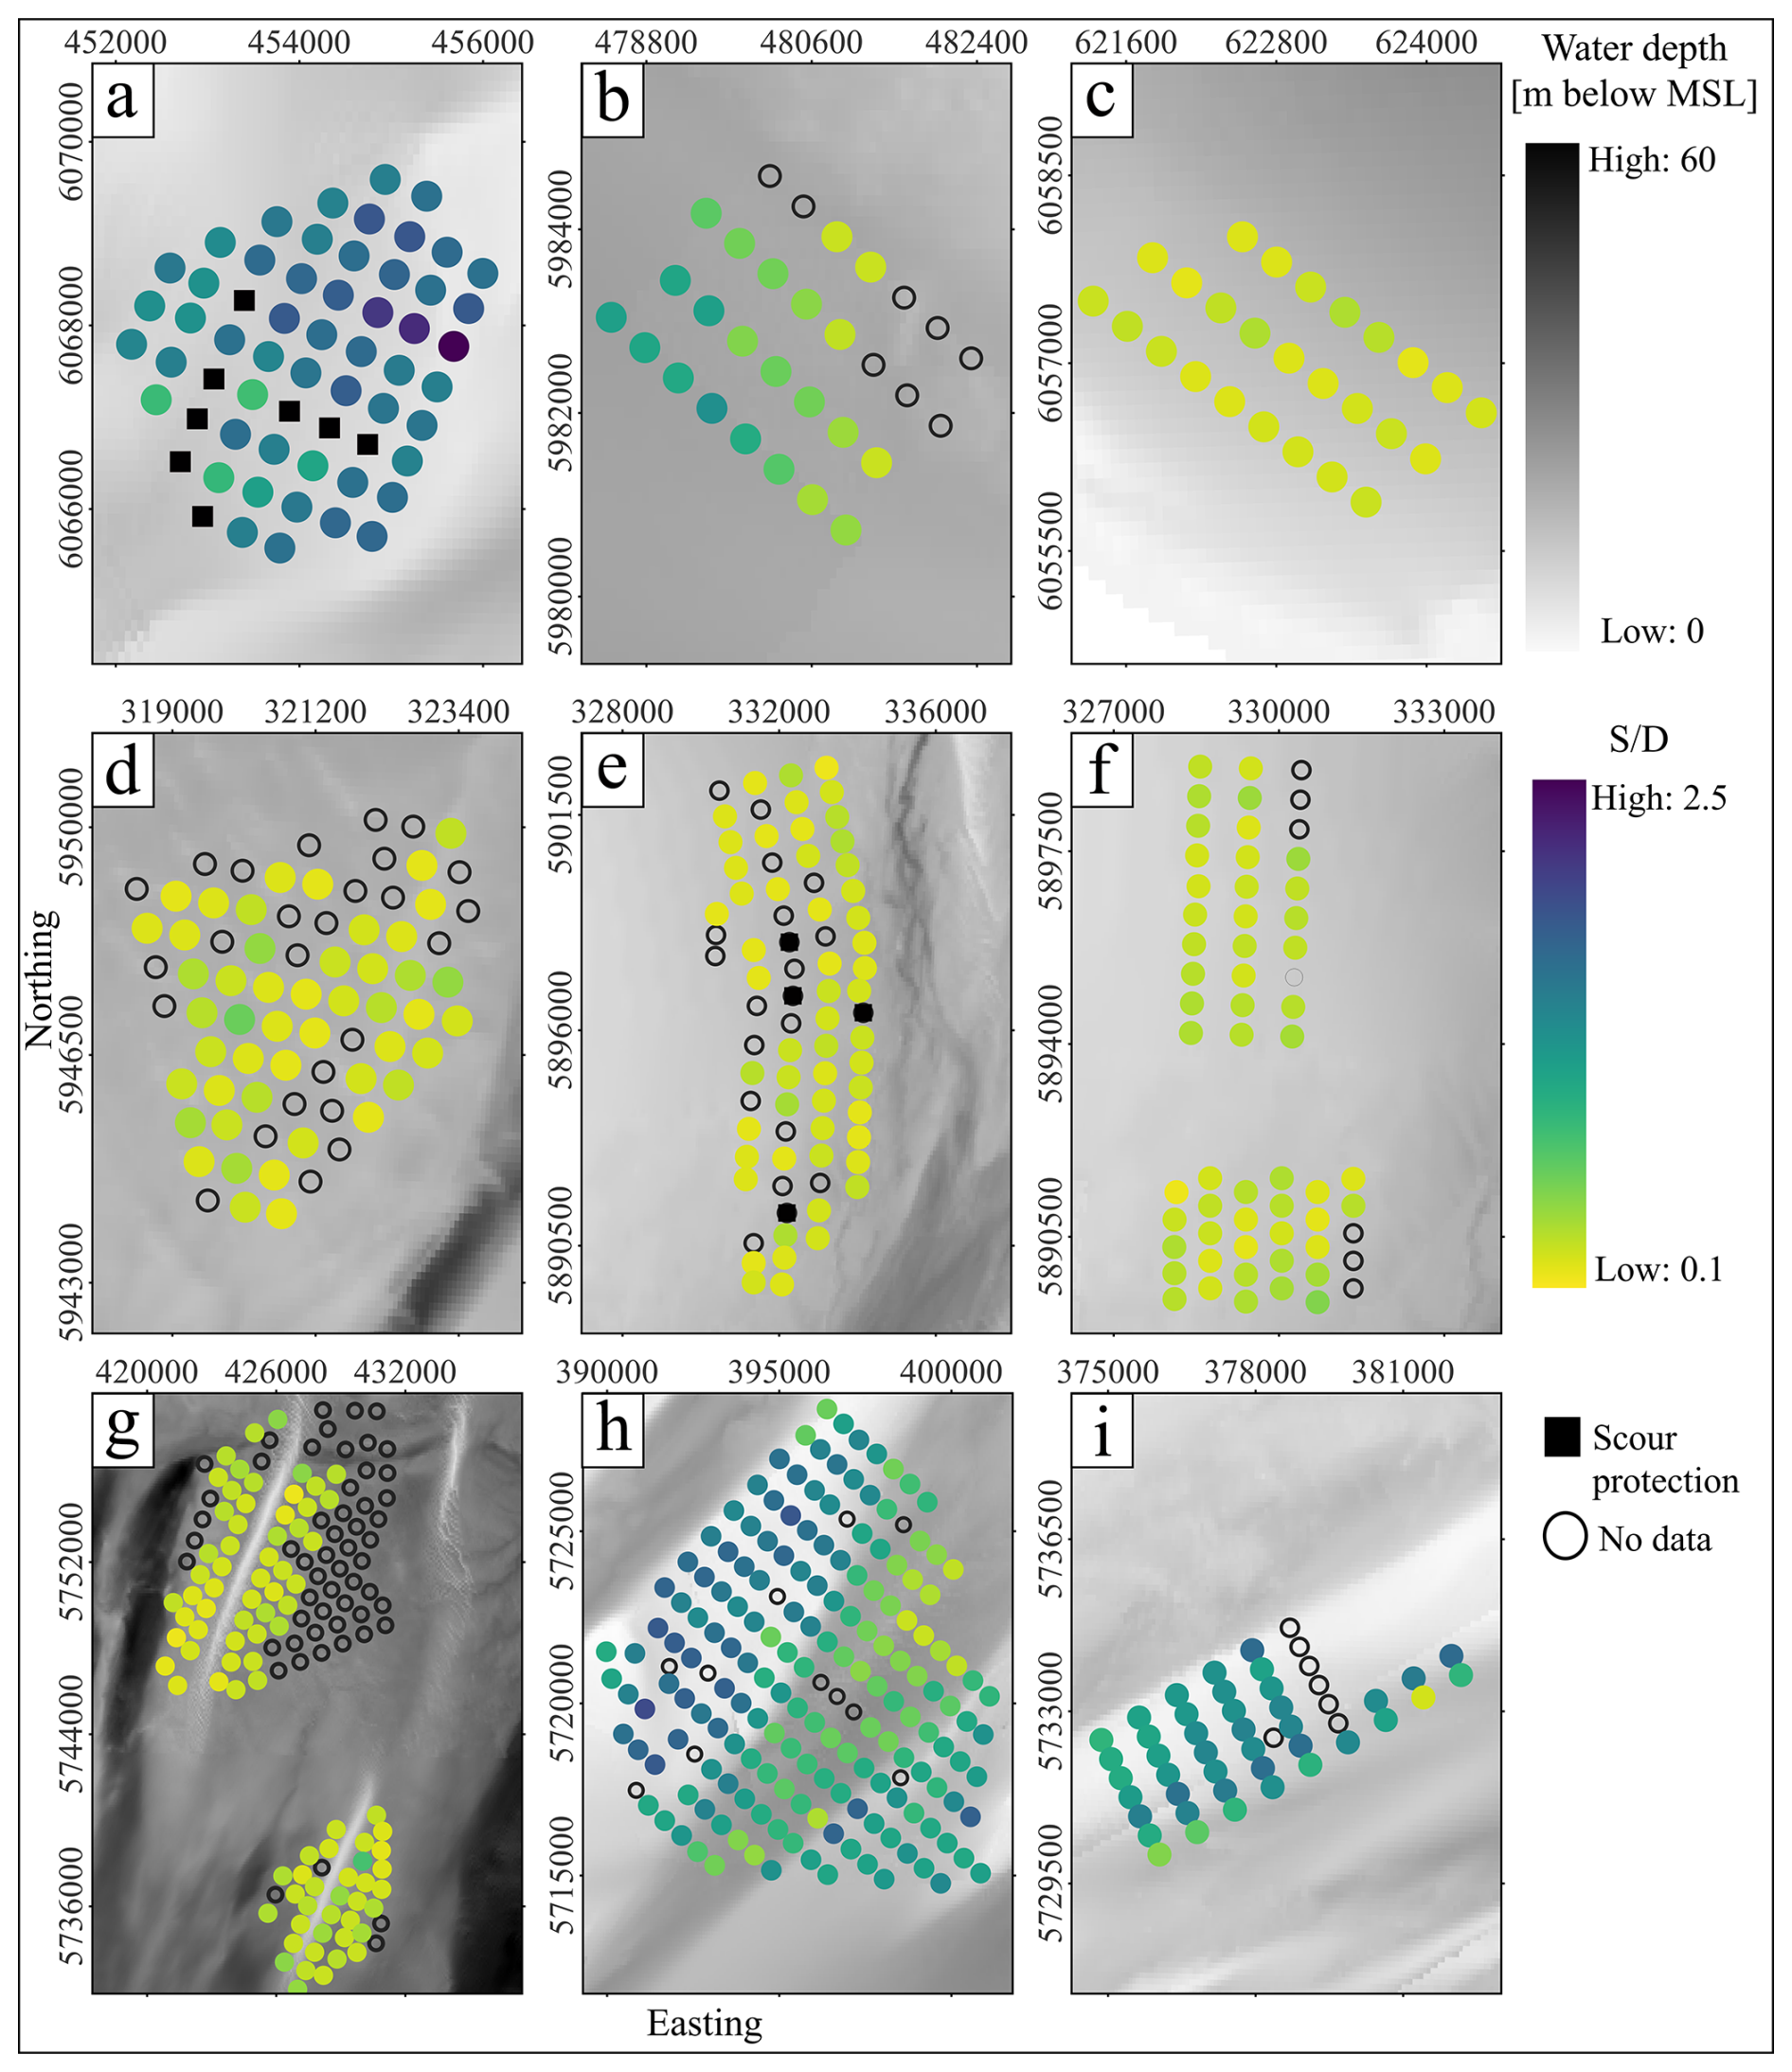
Figure 3Spatial distribution of relative scour depth at the nine studied OWFs. Letters (a)–(i) denote the locations of the Robin Rigg, Barrow, Teesside, Humber Gateway, Lincs, Lynn and Inner Dowsing, Greater Gabbard, London Array, and Gunfleet Sands OWFs, respectively. The upper colour map represents water depth, with darker shades indicating deeper water. The lower colour map indicates relative scour depth, with the darker blue colour indicating the largest scour. Filled black squares represent OWESs with scour protection, while empty circles denote missing data. The bathymetry data shown originate from EMODNET (https://emodnet.ec.europa.eu/en/bathymetry, last access: 29 September 2025).
The remaining OWFs showed relatively low relative scour depth and little spatial variability, even though site conditions were significantly different, as indicated by their seabed conditions from very fine sand for Teesside (Fig. 3c) to coarse and very coarse gravel for Humber Gateway (Fig. 3d).
3.2 Principal component analysis (PCA)
The analysis of Fig. 3 reveals notable variations in relative scour depth across individual OWFs. This variance underscores the need for a more detailed examination of specific wind farm characteristics to identify the drivers of scour. To this end, a PCA was conducted to correlate relative scour depth and selected parameters by identifying and quantifying their relationships. The PCA biplot presented in Fig. 4 illustrates these correlations between relative scour depth and the studied variables and provides a comprehensive view of how different factors interact and influence relative scour depth.
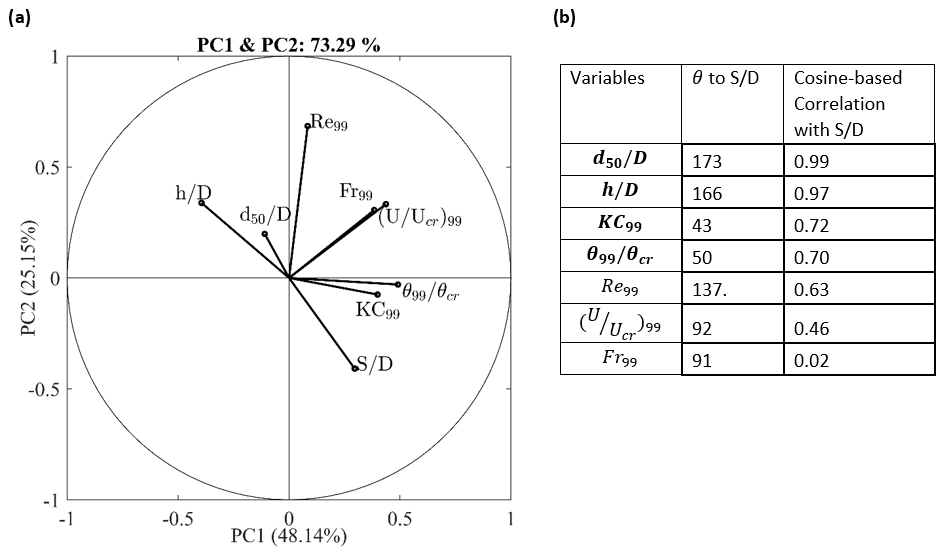
Figure 4(a) PCA biplot, illustrating the correlation between variables and relative scour depth. (b) The table detailing the angles between the relative scour depth and the other variables (in degrees), along with the magnitude of the cosine-based correlation (values from 0 to 1), where values closer to 1 indicate stronger correlation. Boldface highlights the variables with the strongest correlation with relative scour depth.
As shown in the biplot, PC1 and PC2 account for 73.29 % of the variation in the dataset. This high percentage indicates that these two components capture most of the significant patterns in the data, allowing for a meaningful interpretation of the relationships among the variables. In the biplot, each vector stands for a variable, with the direction and magnitude of the vector reflecting its contribution to the principal components. The variables that contribute the most to the variance in PC1 are the mobility parameter, the Froude number, and the Keulegan–Carpenter number, with shares of 0.49, 0.43, and 0.39, respectively. In contrast, the variance in PC2 is primarily explained by the pile Reynolds number, the relative water depth, and the Froude number, with shares of 0.68, −0.34, and 0.33, respectively. This significant contribution of the mobility parameter, the Froude number, and the Keulegan–Carpenter number to PC1 suggests that variations in these hydrodynamic parameters are critical in shaping the principal dynamics of the dataset. The table (Fig. 4b) next to the biplot provides further insight by showing the angular distances between the vector and each of the other variables, as well as their respective correlation coefficients. One of the key observations is that the relative scour depth has the strongest negative correlation of 0.99 with the relative grain size. This highlights the critical influence of sediment size on scouring processes, even though it does not account for much of the variance captured by the first two principal components. This observation can be explained by the underlying physical processes that affect scour depths. As noted by Whitehouse et al. (2010) for non-cohesive sediments, larger sediment sizes are more resistant to erosion, resulting in reduced scour depths. Therefore, while relative grain size is strongly correlated with scour depths, it does not explain the broader variability in the data that is influenced by other factors. The next strongest correlation is with the relative water depth, with a correlation factor of 0.97, which underscores the critical role of water depth in governing scour intensity. Shallower relative depths concentrate flow energy at the bed, intensifying near-bed velocities and shear stresses that promote deeper scour holes (Smith and McLean, 1977; Whitehouse et al., 2010).
Furthermore, a significant positive correlation was found with the Keulegan–Carpenter number, with a correlation factor of 0.72, indicating the importance of oscillatory flow conditions in scour development. A higher Keulegan–Carpenter number directly leads to greater relative scour depth (Sumer and Fredsoe, 2002). This is driven by the onset of the horseshoe vortex and lee-wake eddy shedding (Sumer et al., 1992; Zanke et al., 2011), with increased permanence of the horseshoe vortex and amplification of bed shear stresses at higher KC values (Sumer et al., 1997). In addition, the mobility parameter exhibits a strong positive correlation (0.70) with the relative scour depth. The mobility parameter quantifies the instantaneous capacity of the flow to exceed the entrainment threshold, driving rapid sediment entrainment when significantly above unity (Soulsby, 1997; van Rijn et al., 1993). Variables such as the pile Reynolds number, the flow intensity, and the Froude number, although less correlated with relative scour depth, contribute more to the total variance. This suggests that these flow-related variables influence relative scour depth through more complex or non-linear interactions with other hydrodynamic conditions and sediment characteristics.
Given that the initial PCA indicates the strongest negative correlation between the relative grain size and relative scour depth, and since seabed sediment characteristics play a significant role in local scour (Qi et al., 2016), the PCA was applied again to the same dataset but pre-clustered into different soil classes (Annad et al., 2021). By reducing the uncertainties related to grain size (d50), this analysis should provide a better estimation of the local scour. This classification also facilitates the identification of parameters that are more influential in estimating scour for specific soil classes, rather than uniformly across different types. After the clustering, six soil classes were obtained: cohesive sediment (d50≤ 63 µm) with 5 data points, fine sand ( 200 µm) with 203 data points, medium sand ( 630 µm) with 249 data points, coarse sand ( 2000 µm) with 170 data points, fine gravel ( 6300 µm) with 18 data points, and medium gravel (d50≥ 6300 µm) with 49 data points.
3.3 Principal component analysis (PCA) by clustered soil classes
Building on the initial PCA, which emphasized the significant influence of grain size on relative scour depth, a more detailed investigation was conducted by categorizing the dataset into six soil classes: cohesive sediment (d50≤ 63 µm) with 5 data points, fine sand ( 200 µm) with 203 data points, medium sand ( 630 µm) with 249 data points, coarse sand ( 2000 µm) with 170 data points, fine gravel ( 6300 µm) with 18 data points, and medium gravel (d50≥ 6300 µm) with 49 data points.
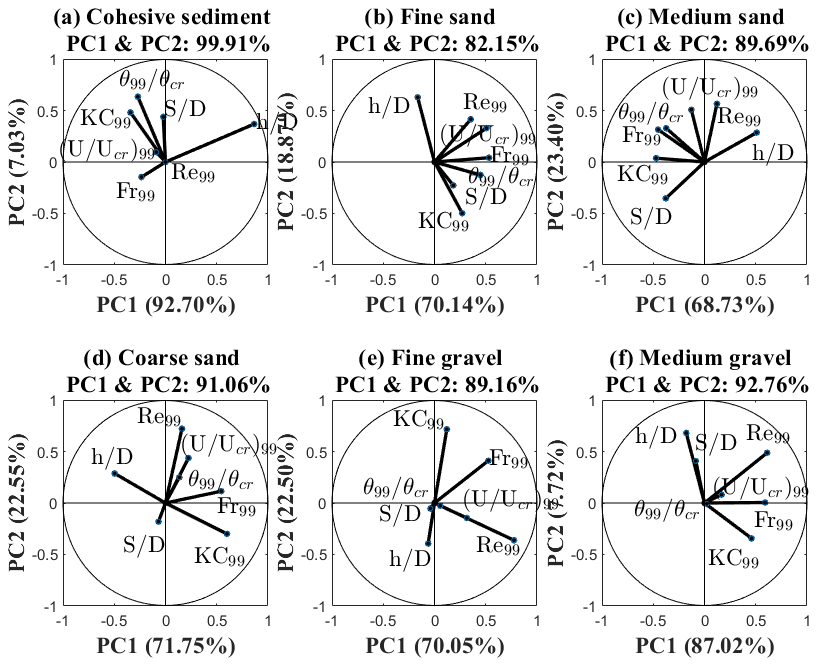
Figure 5PCA correlation by clustered soil classes based on the grain size (d50); the remaining parameters that are shown in the biplots are explained in the data description (Sect. 2.2). (a) Cohesive sediment (d50≤ 63 µm). (b) Fine sand ( 200 µm). (c) Medium sand ( 630 µm). (d) Coarse sand ( 2000 µm). (e) Fine gravel ( 6300 µm). (f) Medium gravel (d50≥ 6300 µm). Clustering of the grain size (d50) was based on Annad et al. (2021).
Figure 5 shows PCA biplots for each soil class, illustrating the relationships between relative scour depth, the relative water depth, the Keulegan–Carpenter number, the mobility parameter, the pile Reynolds number, the flow intensity, and the Froude number. The first two principal components (PC1 and PC2) explain between 82 % and 99 % of the variance within each class, thus describing more of the variance in comparison to when the PCA was applied to all data. Data complexity seems to be greatly reduced by just removing the effect of sediment. In the cohesive sediment soil class (Fig. 5a), relative scour depth is positively correlated with the mobility parameter. However, the calculation of the mobility parameter might contain larger uncertainties for cohesive soils (Soulsby, 1997), so the results should be treated with caution.
In contrast, relative water depth has a strong negative correlation with relative scour depth in fine sand (Fig. 5b) and medium sand (Fig. 5c). This indicates that as relative water depth increases, relative scour depth tends to decrease in these finer soil classes. From a physical view, Melling (2015) found out that in similar substrates, relative scour depth agrees well between different geographic locations and showed that OWESs located in sandy sediments exhibit a strong influence of relative water depth on scour, suggesting that geotechnical factors are less influential in coarser sediments. Although the observation that relative scour depth decreases as relative water depth increases might initially seem counterintuitive, this behaviour is best explained through the transition between shallow-water and deep-water flow regimes. As flow approaches a pile, stagnation pressure develops on its upstream face, causing the flow to separate into an up-flow and a down-flow component. The down flow is directed toward the bed and promotes the formation of a horseshoe vortex. Flow separation occurs at the stagnation point, defined as the location of maximum energy from the approaching flow at the pile face. The energy of the approach flow consists of hydrostatic and kinetic components, whose vertical distribution is governed by the boundary layer. In shallow water, the kinetic component dominates over hydrostatic pressure, resulting in a stagnation point located higher up the pile, near the water surface. This enhances down-flow and vortex activity, intensifying scour processes (Melville, 2008). Additionally, shallower water often features thinner boundary layers with higher velocity gradients near the seabed, potentially leading to greater bed shear stresses and increased sediment mobility. In contrast, in deeper water, hydrostatic pressure becomes more influential, leading to a more uniform pressure field across the pile face and shifting the stagnation point closer to the bed. This results in weaker down-flow and reduced vortex strength, thereby diminishing the scour depth (Arneson et al., 2012; Harris and Whitehouse, 2014). Furthermore, Link and Zanke (2004) observed that maximum relative scour depth tends to develop more slowly and reach lower values in deeper water, even under constant average flow velocity, due to reduced shear velocity over the undisturbed bed. This highlights that the relationship between relative water depth and scour is not necessarily linear.
The dynamics observed in coarse sand (Fig. 5d) and fine gravel (Fig. 5e) are different from the finer sediments. In these classes, the flow intensity and the Froude number show significant negative correlations with relative scour depth, indicating that higher values of these parameters correspond to reduced relative scour depth. However, these soil classes are also characterized by comparatively small relative scour depth, which makes the relationship less prominent.
For medium gravel (Fig. 5f), relative water depth has a positive correlation with relative scour depth, meaning that greater relative water depth is associated with greater relative scour depth in coarser sediments. The data points in the cluster can be attributed to the Humber Gateway OWF, which is the only OWF that features clear-water conditions. Given the large grain sizes, a smaller influence of flow parameters on the variability in relative scour depth should be expected.
3.4 Correlation of scour depth with main drivers
Following the PCA (Fig. 5), which identified the primary variables influencing relative scour depth across soil classes, a Pearson correlation analysis was performed to quantify the strength and direction of these relationships. Figure 6 shows the Pearson correlation results for each cluster and the variable with the strongest correlation, with the red lines representing the linear regression fit and the correlation coefficients shown in red text. The Pearson correlation was calculated by the following equation:
Considering the small number of data points in this sediment cluster, relative scour depth at locations with cohesive sediments (Fig. 6a) shows a moderate correlation between scour with the mobility parameter. For the fine and medium sand clusters, the PCA revealed a similarly strong dependence of relative scour depth on relative water depth. Plotting relative scour depth against relative water depth now shows a clearer correlation with and hence dependence on the medium sand sites (Fig. 6c) than the fine sand sites (Fig. 6b). The Pearson coefficients of −0.57 and −0.86 confirm this difference in the dependence of relative scour depth on relative water depth. The correlations of the fine and medium sand clusters are supported by a larger number of data points, increasing the reliability of the findings.
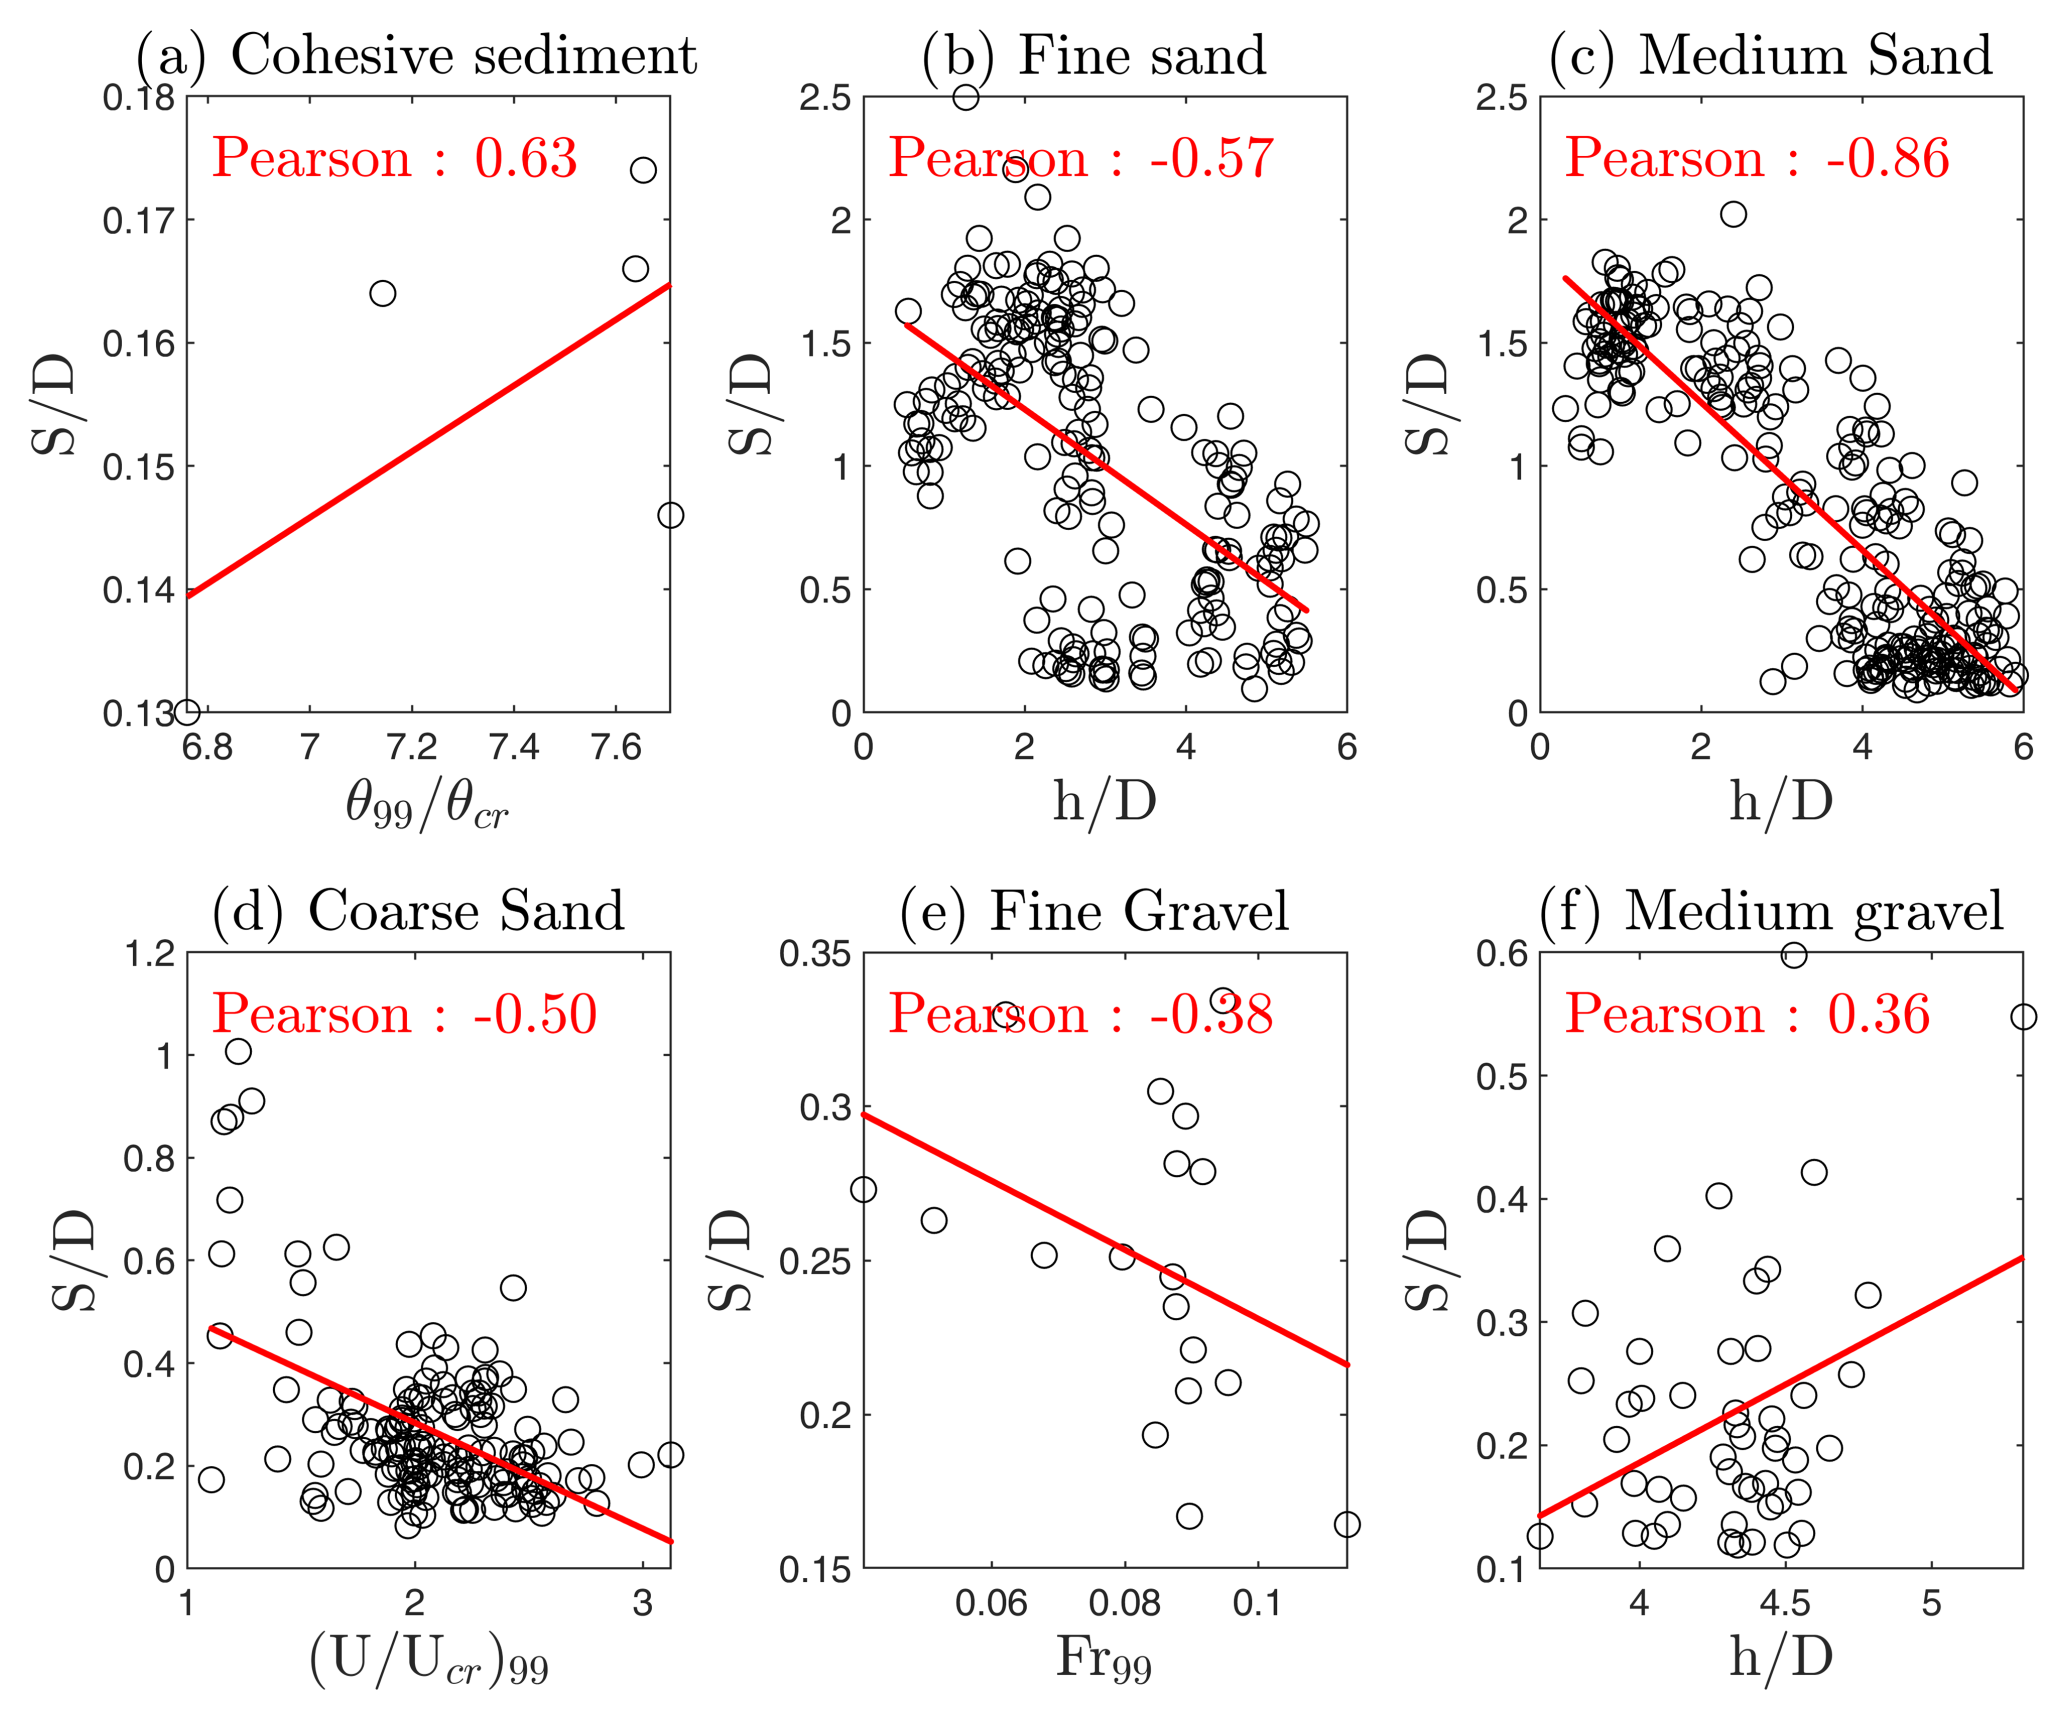
Figure 6Pearson correlation of representative variables obtained by PCA with relative scour depth across different soil classes. (a) Cohesive sediment (d50≤ 63 µm). (b) Fine sand ( 200 µm). (c) Medium sand ( 630 µm). (d) Coarse sand ( 2000 µm). (e) Fine gravel ( 6300 µm). (f) Medium gravel (d50≥ 6300 µm).
For the coarse sand (Fig. 6d), the PCA revealed a negative correlation between relative scour depth and flow intensity. This result directly aligns with the established understanding of live-bed scour behaviour in coarse-grained sediments. Once flow intensity surpasses the critical threshold (), the sediment mobilizes, establishing live-bed conditions. In such scenarios, the development of large, well-defined scour holes is consistently observed to be suppressed. This suppression occurs because the continuous transport and replenishment of sediment into the scour region actively works against deep erosion. This dynamic equilibrium of the seabed results in shallower, or inherently more unstable, scour holes when compared to clear-water conditions. In clear water, where sediment remains immobile, scouring is driven purely by flow-induced vortex action around the structure (Sumer and Fredsøe, 2002; Whitehouse et al., 2011). Consequently, the negative correlation observed in this soil class accurately reflects the inherent limitation of scour growth under the highly mobile conditions characteristic of coarse sandy beds.
For fine gravel (Fig. 6e), the PCA suggests a correlation between relative scour depth and the Froude number, but this is difficult to confirm visually due to the small sample size and narrow Froude number range. Since relative scour depth is comparatively small in this class, relationships are less clear, and parameters like the Froude number come to the foreground that were not as prominent in finer sediments. A broader distribution of Froude number values would be necessary to confirm this more conclusively.
Finally, medium gravel (Fig. 6f) displays a positive correlation between relative scour depth and relative water depth, with a Pearson coefficient of 0.36. This indicates that larger relative water depth corresponds to increased scour depth, although the range of this increment remains small (between and ). This variation in scour depth is small compared to the correlations observed in fine and medium sands, where changes in relative water depth yield more pronounced differences in relative scour depth. The smaller impact on medium gravel may be attributed to the generally greater resistance of larger sediments to scour, even with increasing relative water depth.
The most significant correlations emerge from the fine sand (Fig. 6b) and medium sand (Fig. 6c), where strong negative correlations between relative scour depth and relative water depth are observed. This suggests that significant scour occurs in shallower waters with finer sediments. Such findings highlight the importance of relative water depth as a key factor influencing scour processes in specific sediment types, emphasizing that scour management and predictions for offshore structures should take sediment characteristics and relative water depth into account. These results are consistent with the studies from Melling (2015) and Harris and Whitehouse (2014), which also show a decrease in relative scour depth in finer sediments as relative water depth increases. This negative correlation can be explained by the reduction in bed shear stress with increasing relative water depth, which limits sediment mobilization, particularly in fine and medium sands (Sumer and Fredsøe, 2002; Sumer, 2014). However, those results disagree with experimental work where scour around a monopile weakens with reducing relative water depth (e.g. May and Willoughby, 1990; Whitehouse, 1998). Consequently, relative water depth is included as a parameter in many empirical formulas, especially for scour around bridge piles with limited water depth (e.g. Laursen, 1963; Hancu, 1971; Breusers et al., 1977; May and Willoughby, 1990; Richardson et al., 2001). Besides that, these insights from field data are critical for the accurate assessment and planning of offshore infrastructure installations, particularly in regions with varying sediment characteristics.
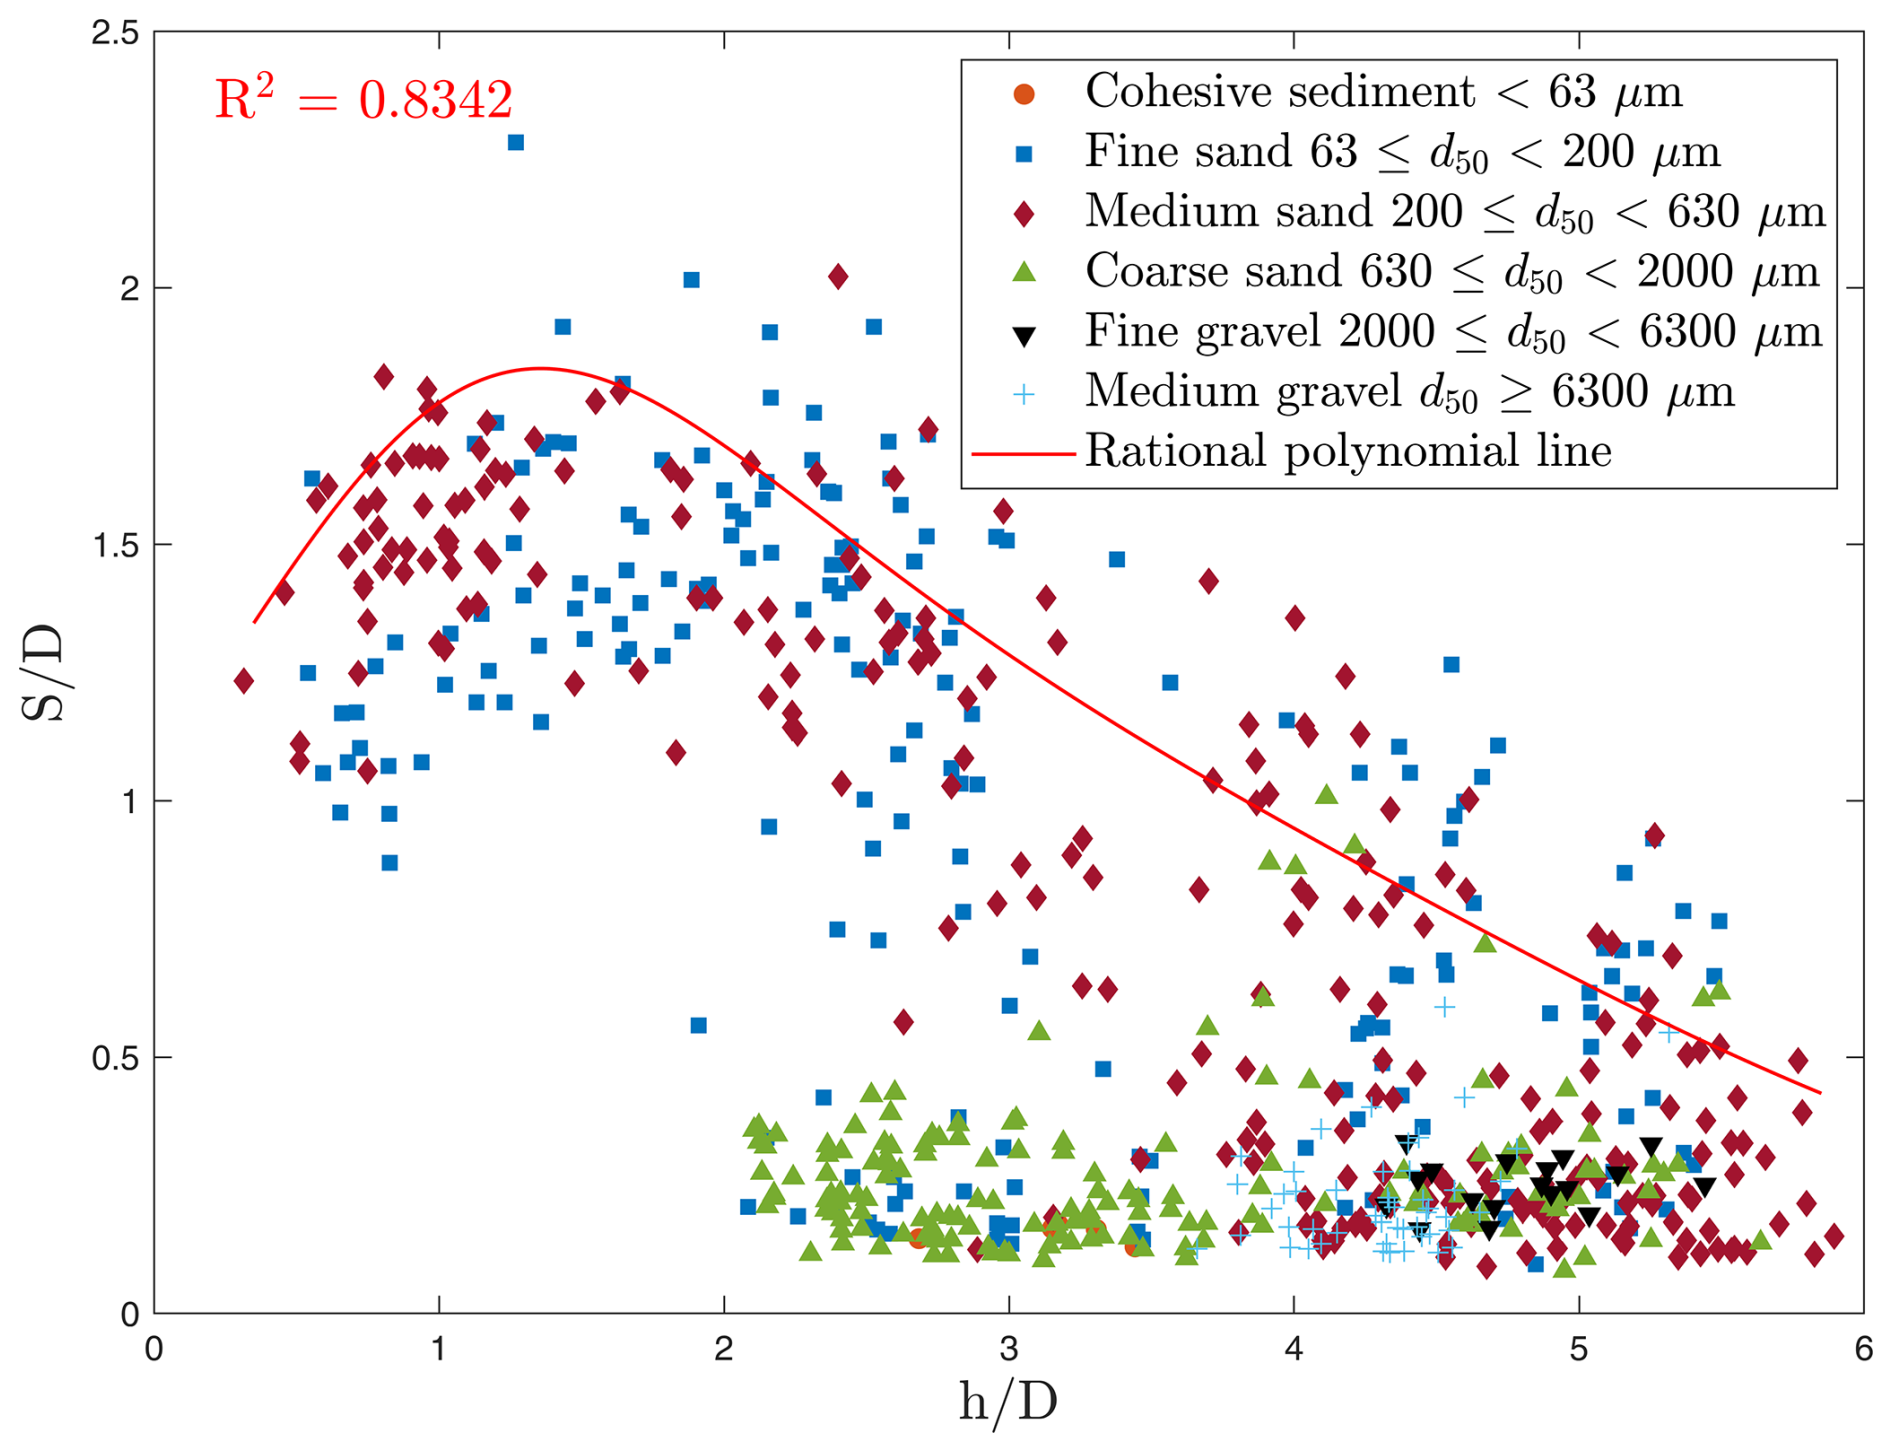
Figure 7Relative scour depth vs. relative water depth and soil class. The solid red curve represents a rational polynomial fit to the 99th percentile of relative scour depth. Data points for the London Array and Thanet OWFs are included from Melling (2015).
Figure 7 summarizes the findings from the PCA (Fig. 4) by plotting the relationship between the relative scour depth and the relative water depth. Relative water depth has been shown to be one of the parameters with the largest correlation influencing relative scour depth. However, it should be noted that relative water depth has a direct effect on other hydrodynamic parameters. For example, not only is the Froude number formed with the water depth, but relative water depth also significantly determines the potential influence of waves on the development of scour, which in this study has also been considered by the Keulegan–Carpenter number. Therefore, it remains unclear whether the influence of relative water depth on relative scour depth is a direct causal factor or an indicator of broader changes in hydrodynamic conditions. Nevertheless, Fig. 7 illustrates the comprehensive correlation between the relative scour depth and the relative water depth, with different markers (colour and shape) representing the studied soil classes. The solid red curve shows a correlation between relative scour depths across all relative water depths, independent of sediment class. This curve was systematically developed by fitting a rational polynomial function to the 99th-percentile values of relative scour depth, computed within uniform relative water depth intervals (e.g. 0.1).
The correlation observed in Fig. 6b and c is reaffirmed in Fig. 7. A distinct relationship exists between the relative scour depth and relative water depth in these two sediment types; i.e. both fine sand ( 200 µm) and medium sand ( 630 µm) show that the relative scour depth decreases with increasing relative water depth. This correlation appearing throughout the bigger dataset emphasizes a strong negative correlation between relative water depth and relative scour depth for those soil classes. This behaviour is consistent with findings from previous analyses that identified relative water depth as a critical factor in shaping scour dynamics (Whitehouse et al., 2010; Melling, 2015).
In contrast, for sediments with median grain diameters above coarse sands (d50≥ 630 µm) the relative scour depth remains relatively constant and shows little variability. Figure 7 suggests a generally stable relationship between relative scour depth and relative water depth for these soil classes, where changes in relative water depth do not significantly alter relative scour depth. However, there are a few exceptions. For example, some locations with coarse sand located in deeper water exhibit unexpectedly large relative scour depth. These outliers might stem from site-specific conditions such as dynamic sandbanks and highly variable bathymetry, as seen at the London Array OWF (Sturt et al., 2009). These unique environments, characterized by flow recirculation and sediment mobility, can lead to deviations from expected scour behaviour (Melling, 2015). The results for fine and medium sands suggest a potential influence of relative water depth in reducing relative scour depth. Although these results are preliminary, they provide a first step in understanding how OWESs could affect sediment redistribution in regions dominated by these sediment types and small relative water depths.
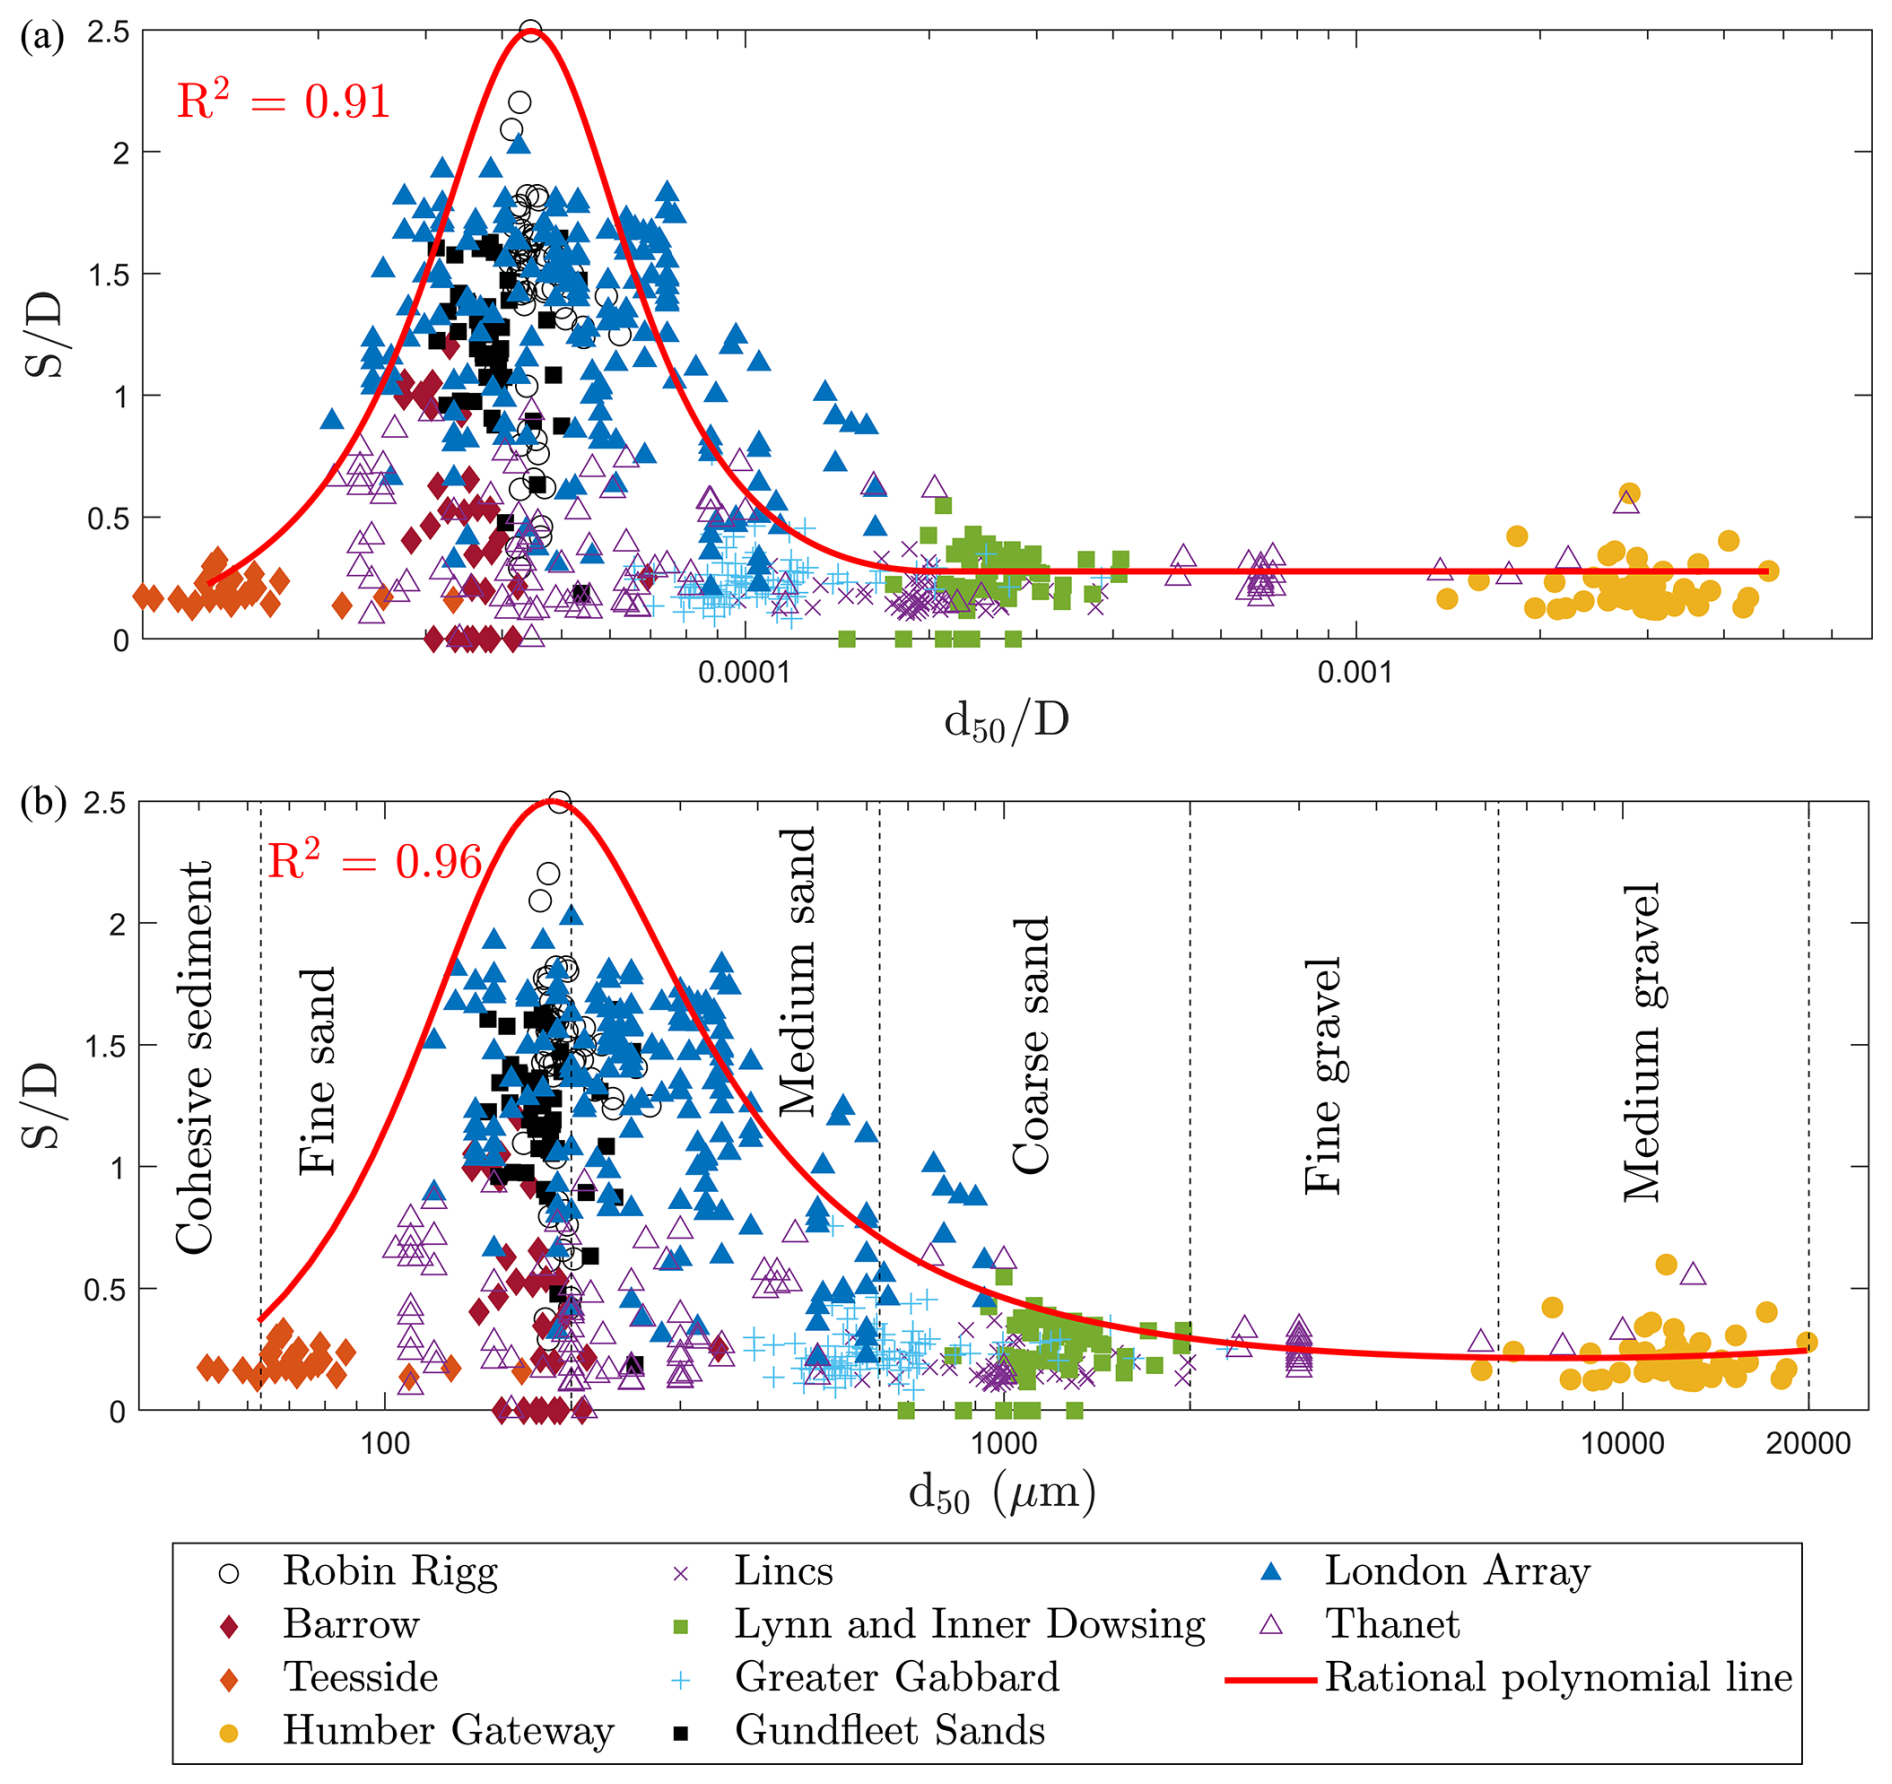
Figure 8Relative scour depth against (a) the relative grain size and (b) grain size. The solid red curves represent the rational polynomial line fits to the 99th percentile of relative scour depth for various relative grain sizes and grain sizes. Data points for the London Array and Thanet OWFs are included from Melling (2015).
Figure 8a summarizes the findings from the PCA (Fig. 4) by plotting the relationship between the relative scour depth and relative grain size across all the sampled locations. Figure 8b is also shown here to support Fig. 8a by representing the data in terms of the grain size, allowing the comparison of dimensional and non-dimensional relative grain size. Figure 8a and b illustrate a discernible correlation where the largest relative scour depth occurs predominantly in fine to medium sands, as indicated by the rational polynomial line, which approximates the upper limit of relative scour depth for various relative grain sizes (Fig. 8a) and grain sizes (Fig. 8b). Similar to the correlation presented in Fig. 7, this curve approximates the upper limit of , and it was derived by fitting a rational polynomial function to the 99th-percentile values of relative scour depth, computed within a uniform interval of relative grain size (e.g. 0.00001) and grain size (e.g. 25 µm). The correlations shown in Fig. 8a and b are well explained. In general, the mobility potential of the sediments decreases with increasing grain size, which leads to lower relative scour depth for coarser sediments. Very fine sediments, on the other hand, are subject to the influence of cohesion forces that reduce their erodibility, which also leads to lower relative scour depth. Therefore, fine and medium sandy sediments have the largest scour potential, which is reflected in the data of Fig. 8b. The different symbols represent the OWF, highlighting the geographic spread and variability within the dataset. However, it is important to note that most of the data points fall within the range of fine to medium sands, potentially skewing the interpretation.
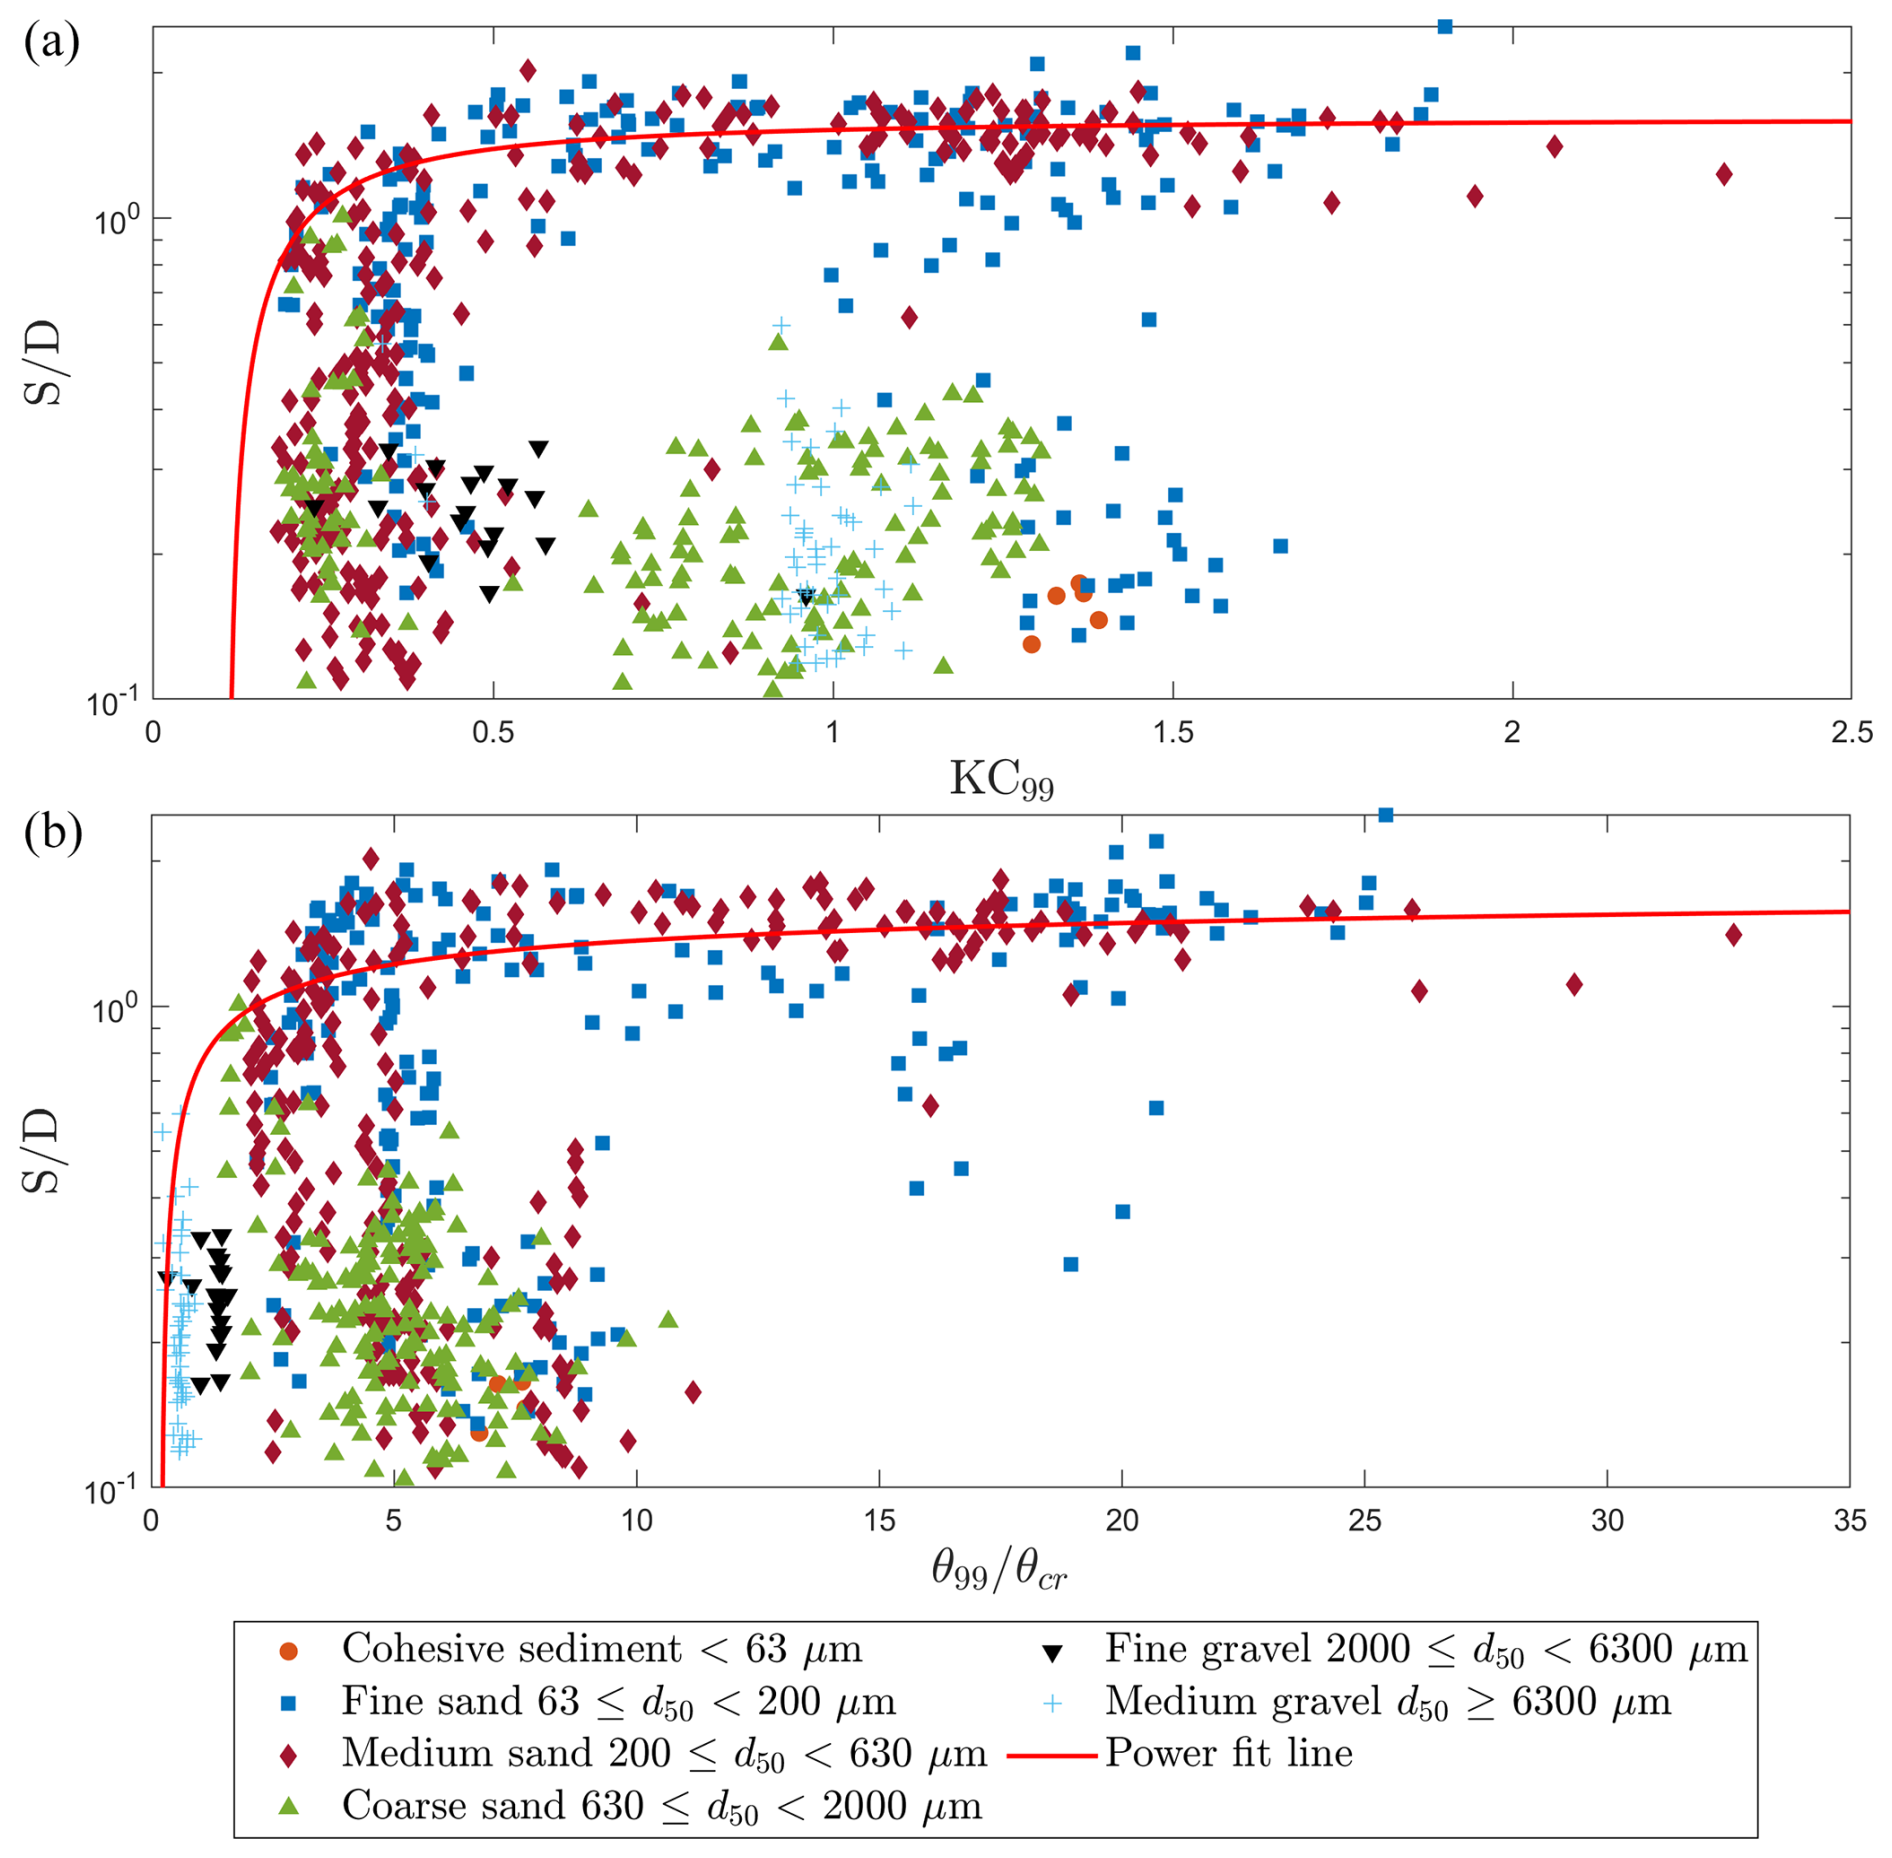
Figure 9Relative scour depth against the (a) Keulegan–Carpenter number and (b) the mobility parameter. The red line gives the power fit line based on the 99th percentile of the data of relative scour depth for various grain sizes. Data points for the London Array and Thanet OWFs are included from Melling (2015).
The third and fourth parameters, which correlate with the relative scour depth, are the Keulegan–Carpenter number and the mobility parameter, as identified by the PCA. Figure 9a shows the correlation between the relative scour depth and the Keulegan–Carpenter number, revealing a distinct increase in relative scour depth with increasing Keulegan–Carpenter number up to KC99=0.5. Above this value, relative scour depth shows little variation with a further increase in the Keulegan–Carpenter number, which reaches a maximum value of 2.5 in this field dataset. Those results are generally consistent with findings from previous studies (e.g. Qu et al., 2024; Sumer and Fredsøe, 2002), which indicate that scour development is strongly dependent on KC99 at lower values but becomes less sensitive as KC99 increases. However, experimental studies often focus on wave regimes with KC numbers greater than 6, since it has been established that this is the threshold for generating a horseshoe vortex. Despite considering the 99th percentile of KC numbers over the time period in question, the KC numbers are much smaller for the field conditions presented herein. This strengthens the argument for further scour research to focus on boundary conditions with low KC values.
Figure 9b shows the correlation between relative scour depth and mobility parameter, comparing the Shields parameter with its critical threshold for sediment motion and revealing a distinct increase in relative scour depth with increasing mobility parameter up to approximately . At higher mobility values (typically above 5–10), the increase in scour depth tends to stabilize. This correlation aligns with experimental observations from Sumer et al. (2013), Chiew and Melville (1987), and others, which describe similar stabilization of scour depth under fully mobile conditions. Notably, the response also varies with sediment type: coarser sediments exhibit low relative scour depth values even at high mobility ratios, likely due to their higher resistance to entrainment and potential armouring effects. In contrast, finer sediments (e.g. d50 < 200 µm) show a steeper increase in scour depth, reflecting their greater susceptibility to hydrodynamic conditions.
Overall, Fig. 9a and b emphasize the non-linear and sediment-dependent nature of scour formation. The separation of correlations by soil class supports the need for sediment-specific scour prediction models, as also suggested in previous studies (e.g. Whitehouse et al., 2011; Sumer and Fredsøe, 2002). The results provide empirical evidence of this dependency using field-scale data, bridging a critical gap between controlled experiments and real-world conditions.
3.5 Detailed analysis of scour patterns for selected OWFs
Following the observed overall correlation shown in Fig. 7, this section moves on to examine scour patterns within individual OWFs, such as Robin Rigg, Lynn and Inner Dowsing, and London Array. This specific analysis will assess whether the global relationship between relative scour depth d50 and relative water depth holds under the unique environmental conditions of each site. This section aims to further our understanding of the dynamics between sediment characteristics and scour processes by a detailed analysis of the variation within each wind farm to determine if these global correlations are consistent at the local scale or if there are deviations due to site-specific factors.
3.5.1 Robin Rigg OWF
Robin Rigg is presented and discussed in this section, as this OWF has the largest overall relative scour depth of all the OWFs. This detailed analysis will help to investigate whether the negative correlation between relative scour depth and relative water depth observed globally in Fig. 7 holds true under variable geotechnical conditions, taking into account that sediment grain sizes range from fine to medium sands.
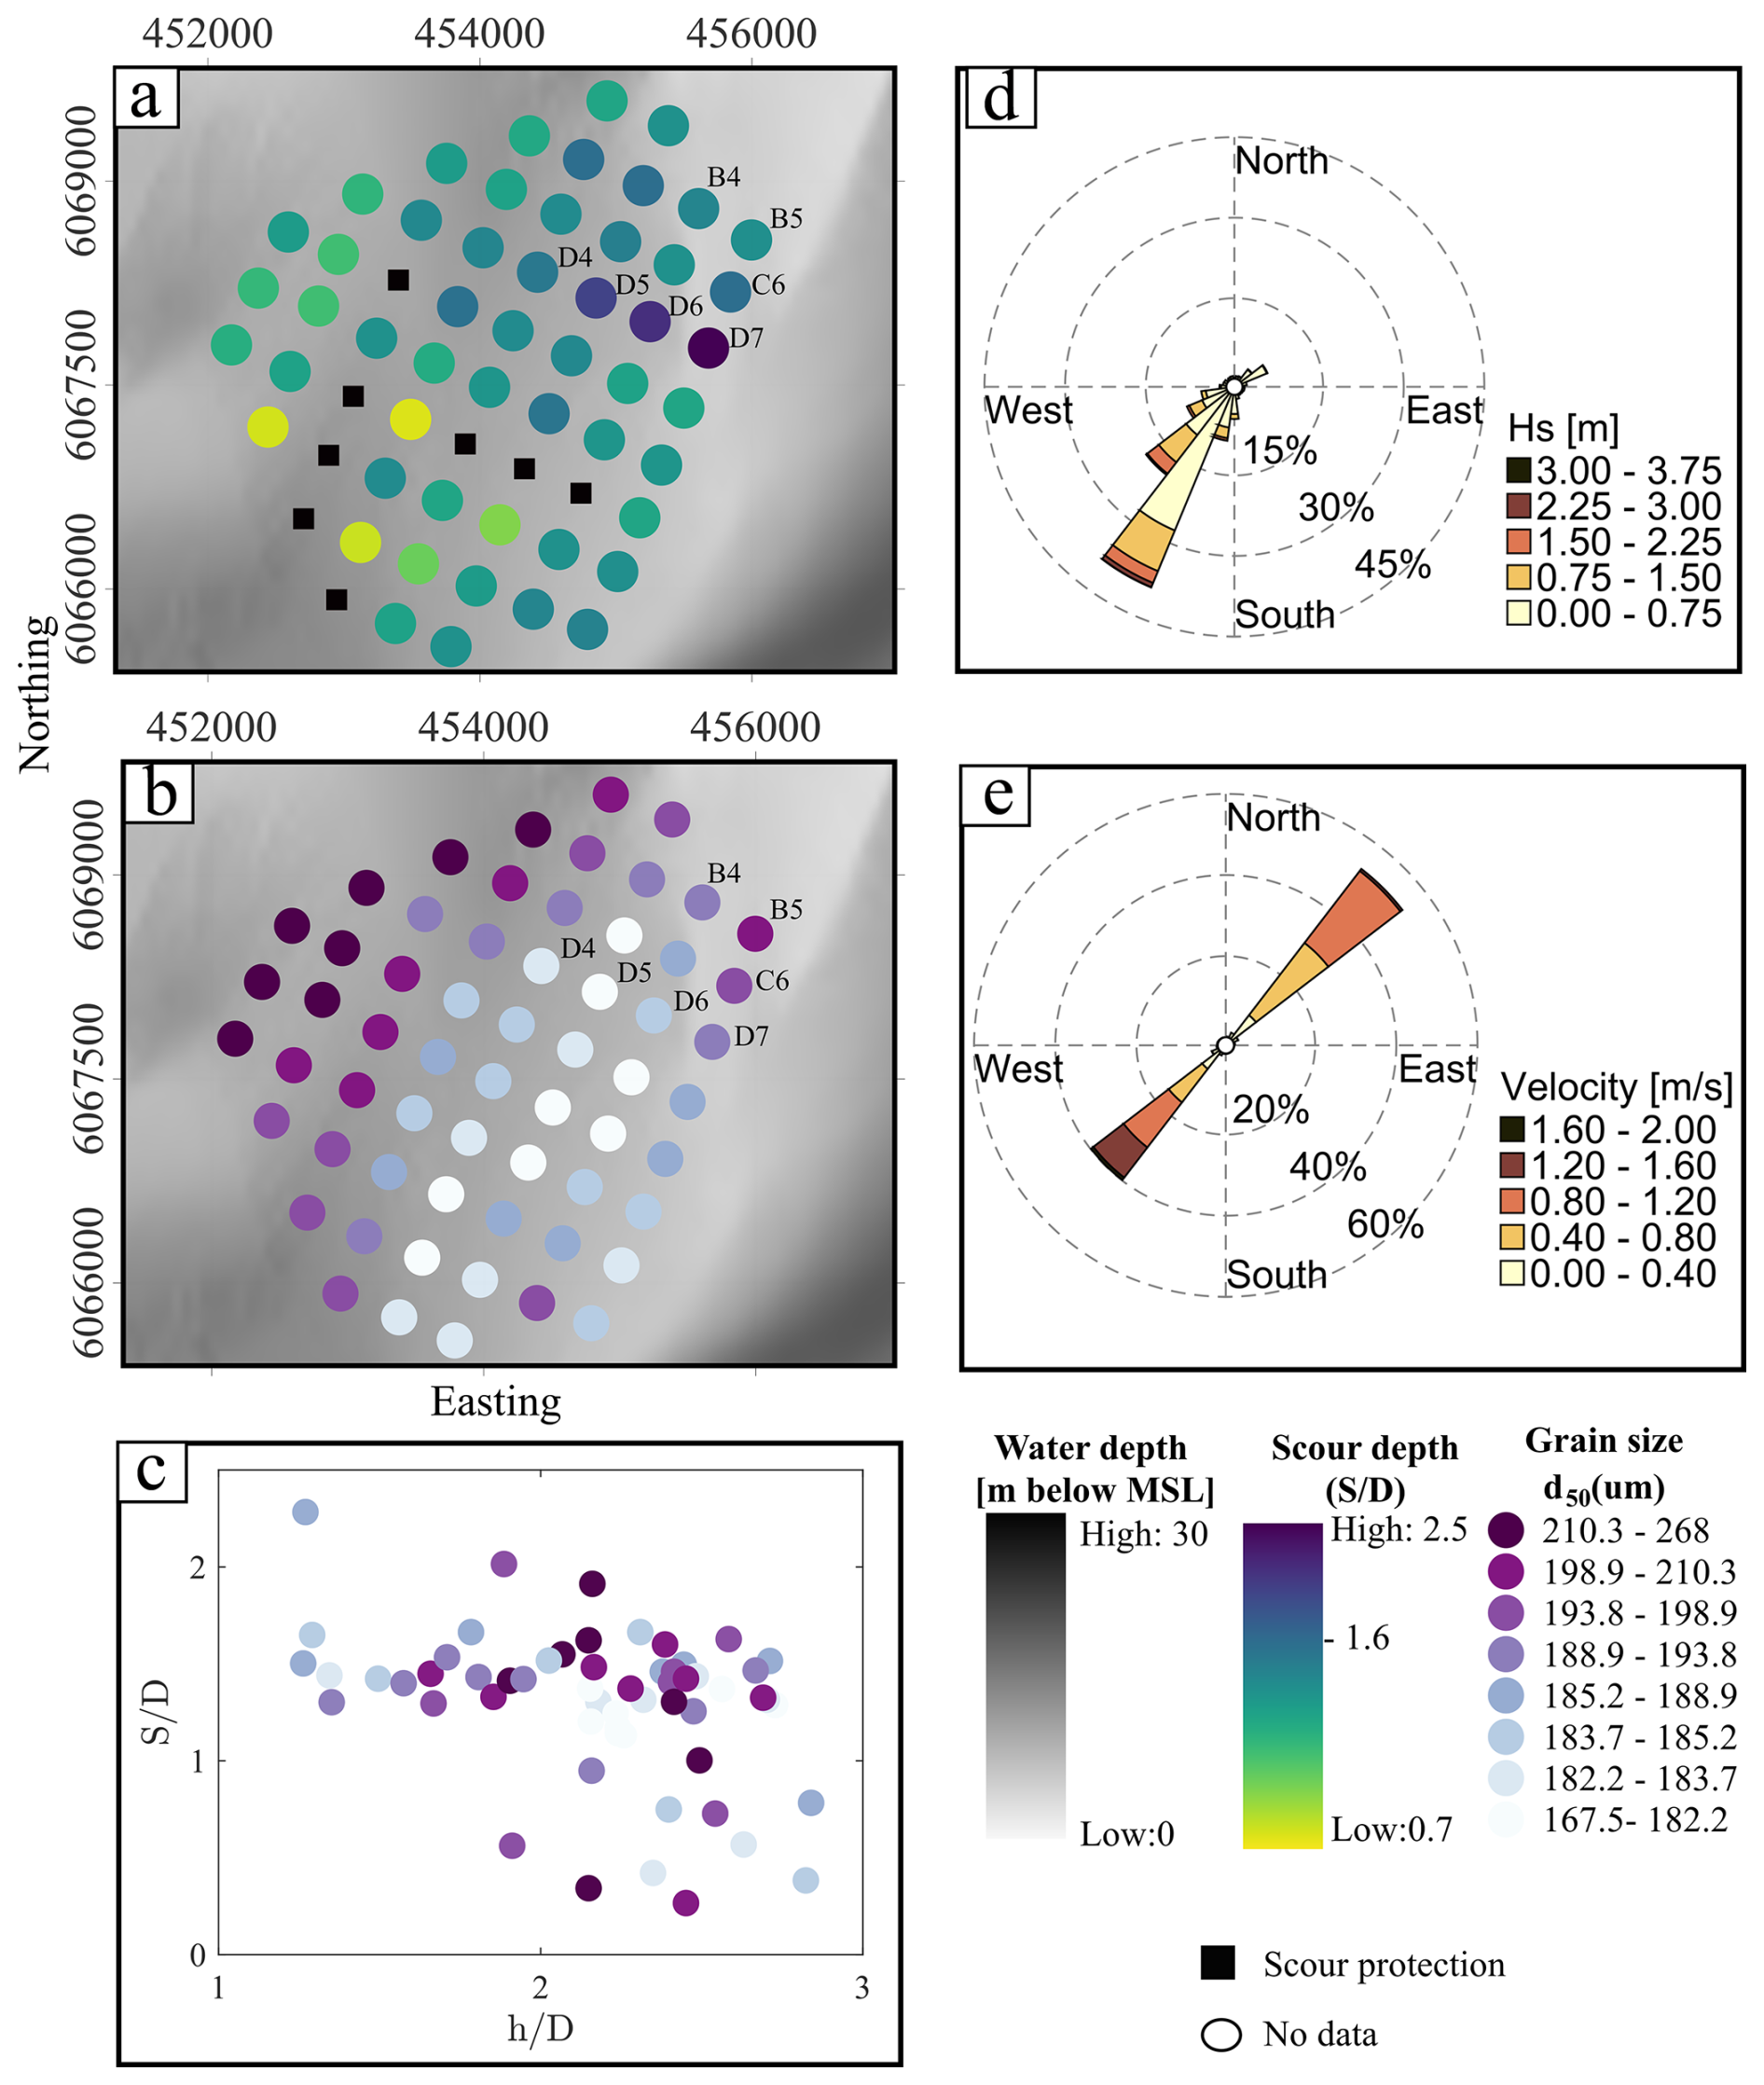
Figure 10(a) Spatial distribution of relative scour depth from 2008–2009 at the Robin Rigg OWF. (b) Grain size distribution. (c) Relative scour depth vs. relative water depth and grain size classification. (d) Significant wave heights and (e) current velocities.
Figure 10 shows the distribution of relative scour depth at Robin Rigg in relation to the variable geotechnical and hydrodynamic site conditions. This sequence begins with Fig. 9a, showing the spatial distribution of scours measured 1 year after turbine installation. A significant variation in relative scour depth in different areas of the OWF can be observed, with the deeper relative scour depth mainly located in the north-eastern part, particularly around OWES D7, C6, B5, and B4, which are located in the shallowest waters. Figure 10b shows the spatial distribution of the median grain diameter d50 in the uppermost sediment layer in 2005, with sediment sizes predominantly in the range of fine to middle sand (182 to 268 µm). OWESs in areas with finer sands, such as D4, D5, and D6, are observed to generally experience the large scour, consistent with previous observations by Whitehouse et al. (2006) that finer sand substrates are more susceptible to scour.
Figure 10c shows the correlation of relative scour depth and relative water depth, classified by coloured points which represent sediment grain size from Fig. 9b. Contrary to the clear negative correlation between relative scour depth and relative water depth observed globally in Fig. 8, Fig. 10c shows a wide distribution of data points with no clear correlation, suggesting that local factors in addition to relative water depth and sediment type have an influence on scour at this site.
For additional insight, Fig. 10d and e show the distribution of the directions of significant wave heights, as well as the directions of current velocity magnitudes in a 1-year period, prior to the post-scan. The highest wave heights came predominantly from the south-west, which should influence sediment mobility and thus scour structures along this direction and especially in shallow relative water depths, where wave-induced shear stresses should be higher. Similarly, the tidal current, with its main directions of south-west and north-east, should result in a change in relative scour depth along this main axis. However, a clear correlation of relative scour depth changing in this direction is not given for Robin Rigg.
This comprehensive analysis using Fig. 10a to e shows that while correlations obtained from global findings provide a useful baseline for understanding scour, the actual scour observed at Robin Rigg does not necessarily follow those correlations. While the distribution of relative scour depth appears to be strongly influenced by local environmental conditions such as sediment type, waves, and currents, the dominant influence among these cannot be clearly identified; rather, the distribution of relative scour depth appears to be due to the interaction of all influences.
The discrepancies between the local scour behaviour at Robin Rigg and the broader correlations observed in Fig. 7 underscore the need for site-specific assessments. Such detailed analyses are critical to the development of effective scour management and mitigation strategies tailored to the unique conditions of each offshore wind farm.
3.5.2 Lynn and Inner Dowsing OWF
The Lynn and Inner Dowsing OWF was chosen as a further example as this OWF had the lowest relative scour depth of all the OWFs investigated and is also characterized by coarse to very coarse sands. Figure 11 provides the same analysis as Fig. 10 by providing insight into how local conditions compare to the global correlation seen in Fig. 7. Figure 10a shows the spatial distribution of relative scour depth measured from 2007 to 2010. Figure 11a shows that the largest relative scour depths are mainly concentrated in the Inner Dowsing area, especially around OWES ID1, ID2, ID8, ID9, ID12, ID24, and ID30, except for turbine L21, which has the deepest relative scour depth in the entire wind farm and which is located at the south-eastern end. The significant relative scour depths observed at certain locations (e.g. D30, L21) are related to cable exposure (EGS Ltd, 2012; EGS Ltd, 2013), while smaller relative scour depths are more common in the southern region. Overall, the spatial distribution shows a slight correlation of increasing relative scour depth from south to north.
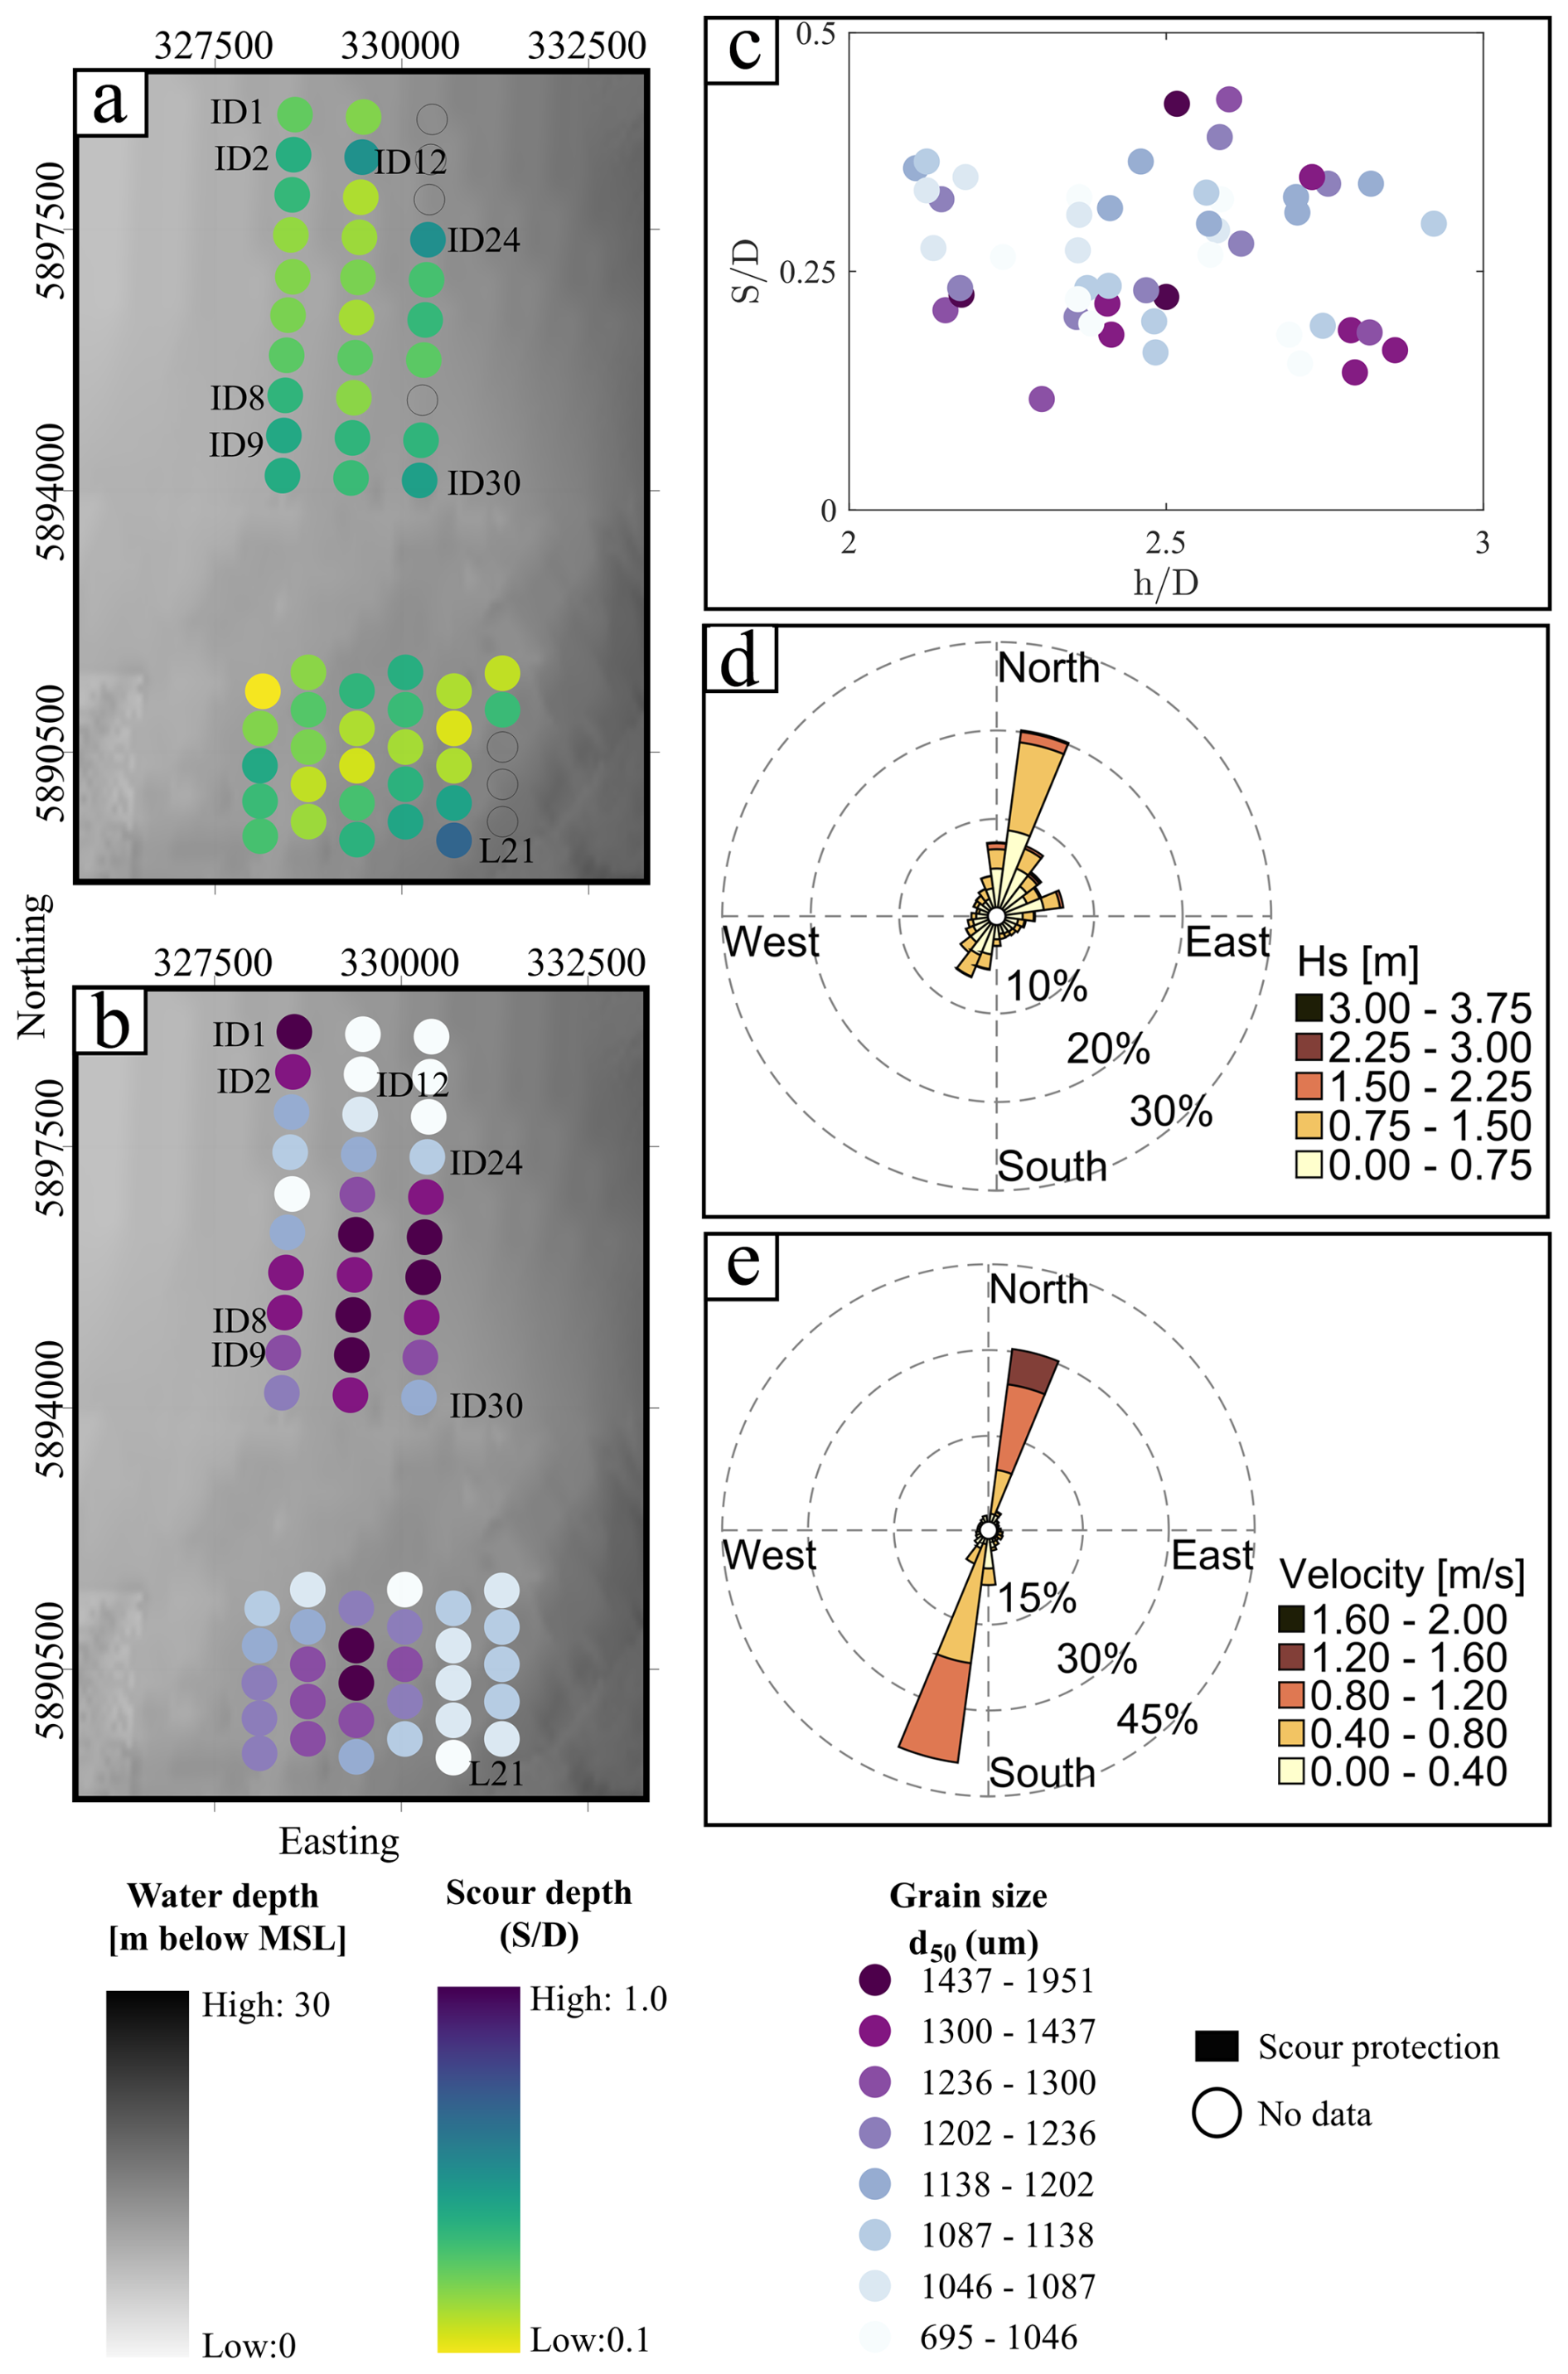
Figure 11(a) Spatial distribution of relative scour depth at the Lynn and Inner Dowsing OWF from 2007–2010. (b) Grain size distribution. (c) Relative scour depth vs. relative water depth and grain size classification. (d) Significant wave heights and (e) current velocities.
Continuing with the spatial overview, Fig. 11b introduces the spatial distribution of d50 median grain sizes, which shows a range from coarse to very coarse sands (695 to 1951 µm). The correlation between relative scour depth and relative water depth is examined in Fig. 11c. Similar to Robin Rigg, this OWF does not display the negative correlation, as seen globally in Fig. 7, suggesting that additional local factors may significantly influence relative scour depth.
Consequently, the significant wave heights and current velocities from hindcast data are shown in Fig. 10d and e. The highest wave heights, observed from the north-east, and strong tidal currents flowing from south-west to north-east highlight the dynamic environmental forces at play. The presence of the largest relative scour depth in the Inner Dowsing area aligns with the direction of the highest tidal current velocities (Fig. 11e) recorded in the north-eastern part, as well as the main direction of waves. Therefore, the direction of both tidal current and waves likely plays a significant role for the scour development in these wind farms, as the seabed conditions and relative water depth locally do not exhibit a distinct correlation.
3.5.3 London Array OWF
Following the previous results, the analysis for the London Array OWF shows a wide range of relative scour depth, from to . This variability differs markedly from the consistently larger relative scour depth observed at Robin Rigg and the limited maximum depth of up to at Lynn and Inner Dowsing. The area of the London Array OWF is characterized by an alternating pattern of deep channels (Black Deep, Knock Deep) and sandbanks (Long Sands, Kentish Knock). These topographic features significantly contribute to the local scour patterns. Water depth at this site range from 0 to 30 m, with Long Sands known for its significant variations in bed elevation but general stability of position. Meanwhile, Knock Deep is notable for its eastward shift over time, which has widened the channel and maintained a constant bed level.
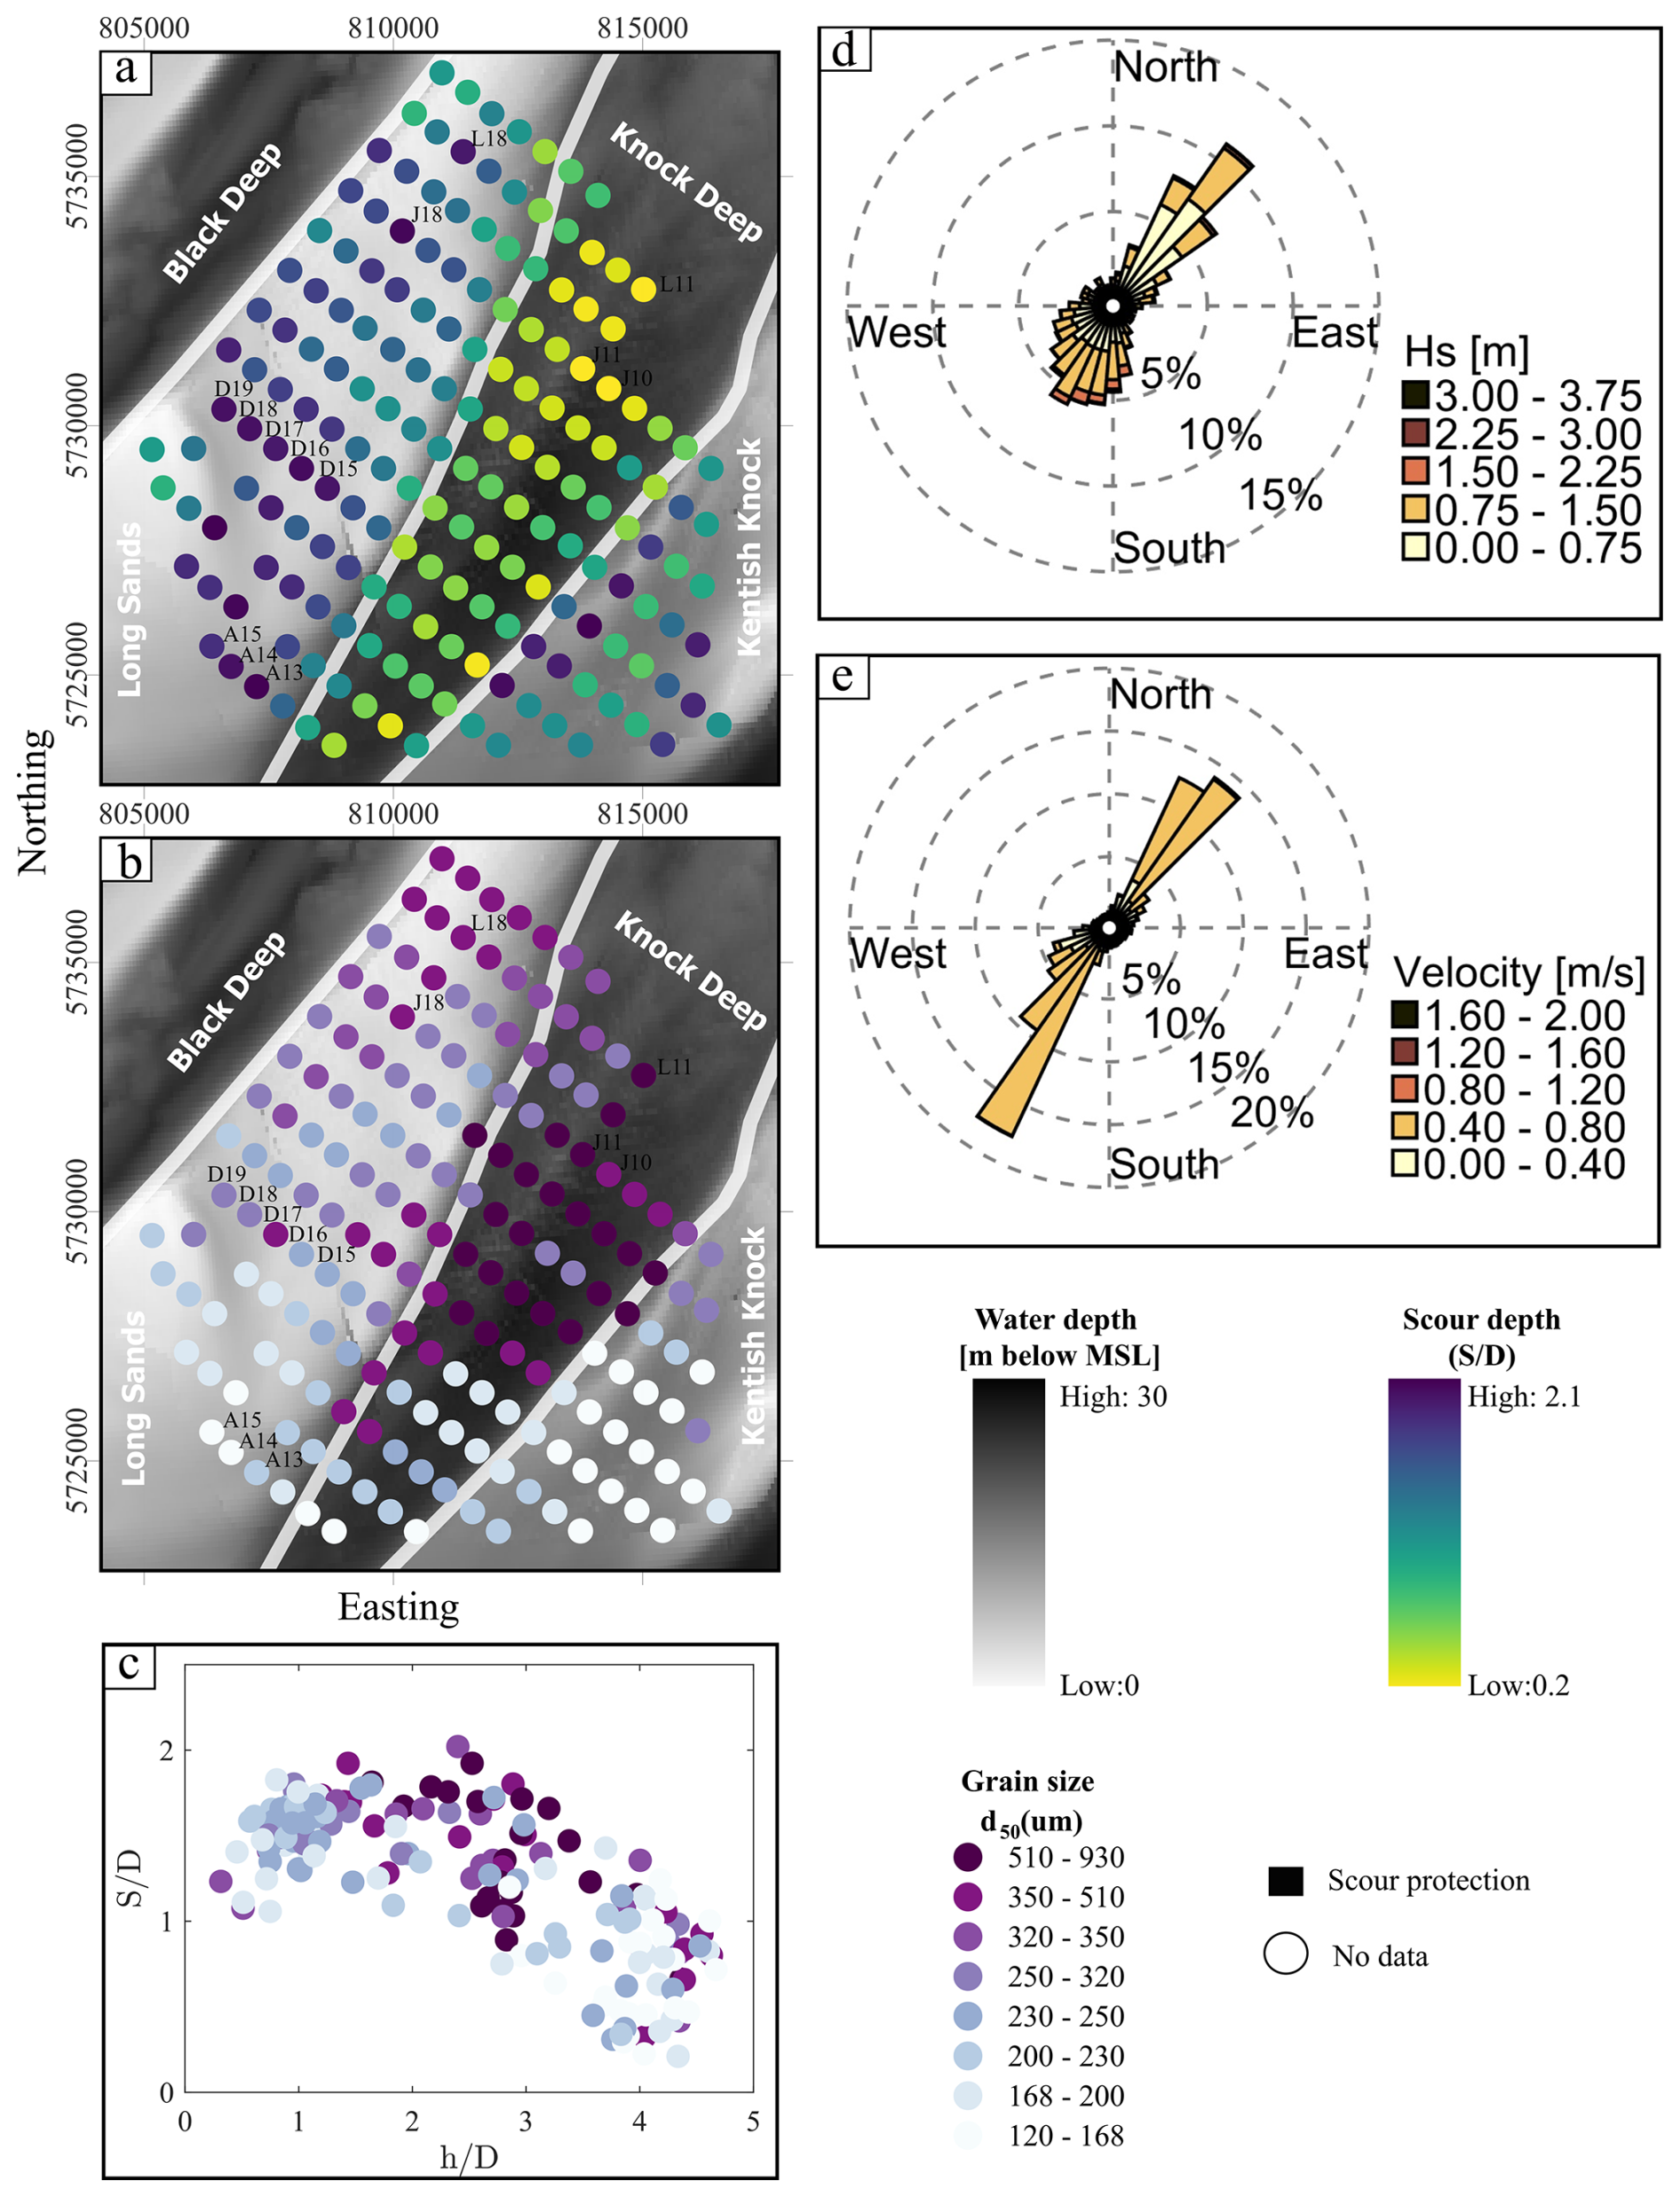
Figure 12(a) Spatial distribution of relative scour depth at the London Array OWF from 2010–2014. (b) Grain size distribution. (c) Relative scour depth vs. relative water depth and grain size classification. (d) Significant wave heights and (e) current velocities. Relative scour depth and grain size data are used from Melling (2015).
In Fig. 12a, the distribution of relative scour depth shows that the variation in scour is strongly influenced by the underlying topography, with significantly greater relative scour depth on the sand banks compared to the channel. Additionally, a correlation of increasing relative scour depth is observed from north-east to south-west, which is particularly notable in the channel area. The smallest scour is observed in the northern part of Knock Deep, with a ratio of , and the largest in the southern part of Long Sands, with . The differences in relative scour depth can be derived directly from the seabed topography, with the greatest average relative scour depth found in the Long Sands at , followed by Kentish Knock () and then Knock Deep () with the smallest average. The sediment distribution across this OWF, shown in Fig. 12b, ranges from very fine to coarse sands. Coarse sands can be found in Knock Deep, where generally the smallest relative scour depths are seen (e.g. L11, J10, and J11). Furthermore, the largest relative scour depths are found in the southern part of Long Sands (e.g. A13–A15, D15–D19, J18, and L18), where the sediment varies from very fine to fine–medium sands. There is therefore a reasonable correlation between grain size and relative scour depth, which is consistent with the previously observed global correlation. Additionally, Fig. 12c shows a negative correlation between relative scour depth and relative water depth, aligning with the global correlation observed in Fig. 7; i.e. shallower relative water depth can be associated with deeper scour, while deeper waters tend to have reduced relative scour depth. This correlation may be explained by the findings of Hjorth (1975), who demonstrated that bed shear stress decreases with increasing relative water depth for the same flow and structure diameter, potentially leading to reduced scour at greater depth. However, as the relative water depth in the London Array OWF changes simultaneously with the sediments (i.e. coarser grained sediments are present in the deeper water of Knock Deep) the cause of the different relative scour depth cannot be clearly attributed to either the sediments or the water depth. Other hydrodynamic, environmental, and topographic factors also play a critical role in shaping these patterns at this OWF, underscoring the complexity of the influences involved.
Significant wave heights and current velocities, as shown in Fig. 12d and e, provide important insights into the scour dynamics at the London Array. These figures show that, in addition to relative water depth and sediment grain sizes, wave and current dynamics might be critical factors at this wind farm. The predominant direction of both waves and currents is north-east to south-west, consistent with the estuarine influence of the area, where river discharge also significantly affects hydrodynamic conditions. This influence is particularly evident at the Long Sands and Kentish Knock sandbanks, which are shaped by the combined action of waves and currents (London Array Ltd, 2005).
Figure 12d shows that the highest wave heights are observed coming from the north-east, with values exceeding 3.0 m, and lower wave heights propagating from the south-west. This gradient in wave height suggests a correlation with increased relative scour depth in regions exposed to higher wave energy, suggesting a strong link between wave dynamics and seabed modification. However, estimated KC99 numbers remained relatively low across most sites, indicating limited wave-induced orbital motion near the seabed. This suggests that wave action plays a secondary role in scour development compared to currents. Similarly, Fig. 12e highlights a larger number of strong currents coming from the south-east. These higher velocities correspond to areas with more pronounced relative scour depth, highlighting the role of strong currents in influencing sediment transport and depositional patterns.
In addition, the local tidal dynamics vary significantly across the wind farm, with the flood tide dominating the southern banks and the ebb tide more influential on the northern banks (Kenyon and Cooper, 2005). This variation is due to the sheltering effect of the sandbanks, which are slightly offset from the orientation of the ebb tide, and is particularly pronounced at Long Sands (London Array Ltd, 2005). The interplay of river discharge, wind stress, tidal surge, and density-driven currents follows the pathways created by the existing topography, further complicating the hydrodynamic environment and its effect on scour at the London Array OWF.
After analysing the relative scour depth at nine wind farms and with different ranges of relative scour depth, the variation in relative scour depth can also be found in individual OWFs, as is the case for the London Array OWF.
4.1 Implications for scour predictions for OWFs
Overall, this study extends the investigation of scour dynamics to a regional scale by analysing correlations between relative scour depth and site conditions across multiple OWFs to identify consistent scour patterns and correlations. The PCA highlights a significant negative correlation between relative scour depth with relative water depth, suggesting that relative water depth plays a critical role in scour processes and confirming the correlations observed with previous studies by Whitehouse et al. (2010) and Melling (2015) for field data. The decrease in the relative scour depth with decreasing relative water depth seems unexpected and contradicts common scour prediction approaches such as Breusers et al. (1977), which however are often derived for flow conditions with shallow relative water depth. Harris and Whitehouse (2014) argued that in deeper water, a weaker downflow and hence a weaker horseshoe vortex can be expected, ultimately leading to smaller scour depth. This finding implies that scour prediction approaches should place greater emphasis on relative water depth, particularly in offshore environments where deeper-flow conditions dominate.
A second notable correlation was identified between the relative scour depth and the relative grain size. This broad correlation, consistent across different geographic locations and environmental conditions, reinforces the fundamental role of sediment size in scour processes, as documented in the extensive work of Vanhellemont and Ruddick (2014) and Rivier et al. (2016).
However, the analysis also indicates that the sediment erodibility alone cannot fully account for the observed variability in relative scour depth. The PCA further reveals a positive correlation between the relative scour depth and both the Keulegan–Carpenter number and the sediment mobility parameter. The strong positive correlation with KC99 supports previous studies (Sumer and Fredsøe, 2001; Qu et al., 2024), highlighting the importance of flow unsteadiness that is typical in tidal and wave-dominated environments. Similarly, the positive association with the mobility parameter underscores its relevance as a key indicator of sediment entrainment and a useful metric for distinguishing between different sediment transport regimes.
These findings underscore a complex dynamic that is frequently oversimplified in existing models. The results indicate a necessity to incorporate non-linear hydrodynamic models into scour prediction frameworks. The results of the PCA reveal the necessity for a diversified approach to the modelling of scour in complex field conditions, which extends beyond the scope of traditional uniform applications.
This analysis demonstrates that individual OWFs exhibit unique environmental and sediment conditions, which can either amplify or moderate broader correlations. The London Array OWF serves as a prime example of the predictive reliability of observed regional correlations, as local data closely mirror general correlations. Conversely, sites such as Robin Rigg and Lynn and Inner Dowsing exhibit deviations from these correlations due to their distinct sediment compositions and hydrodynamic conditions, underscoring the necessity for site-specific adjustments to scour prediction models. These findings underscore the intricacy of employing global models on a local scale and underscore the significance of site-specific data in validating and refining these models to enhance their accuracy and applicability.
4.2 Limitations and future research
Although this study provides a detailed analysis of relative scour depth at nine OWFs, certain limitations must be addressed to improve the interpretation of the findings. Although the dataset spans multiple years, it represents snapshots in time and may not fully capture the dynamic evolution of scour processes under fluctuating metocean conditions (Matutano et al., 2013; Carpenter et al., 2016). Hindcast data, while valuable for long-term correlations, are often based on limited spatial resolution that may underestimate short-term extreme events such as storm surges or localized current variations (Whitehouse et al., 2010; Sturt et al., 2009).
Using PCA is effective in identifying dominant linear relationships between relative scour depth and key variables; however, it may miss critical non-linear interactions that drive scour processes (Schendel et al., 2020; Lyu et al., 2021). While this study incorporates parameters such as the Keulegan–Carpenter number and the mobility parameter, the accuracy of these parameters is limited by temporal resolution and data availability. The inclusion of hydrodynamic forcing provided valuable insight into sediment mobility; however, more detailed and site-specific input data are required to fully exploit their predictive potential (Sheppard et al., 2004; Zhao et al., 2012).
The next step in this research is to develop data-driven models and investigate the broader implications for regional sediment dynamics. Future studies will focus on OWFs located in fine and medium sands where significant scour activity is observed. By focusing on these environments, we aim to improve prediction capabilities and better understand the mechanisms that drive scour, particularly in areas that are susceptible to substantial sediment mobilization.
Finally, while the present study focused on localized scour processes, the cumulative effects of OWF structures on regional sediment transport and marine ecosystems remain a significant knowledge gap (Christiansen et al., 2022; Schultze et al., 2020). Future research must employ interdisciplinary methodologies to rigorously assess the ecological impacts of sediment mobility and scour on marine habitats. By integrating regional sediment transport models with comprehensive ecological assessments, we can optimize offshore wind energy development to meet both sustainability and environmental protection goals, ensuring long-term benefits for infrastructure resilience and marine ecosystem health.
Achieving the European Union's (EU) offshore wind energy targets requires development of OWFs in regions with diverse and often poorly understood metoceanic and geophysical conditions. However, this demand underscores critical knowledge gaps regarding the interaction of these installations with the marine environment, particularly with respect to scour processes and sediment mobilization. A comprehensive understanding of scour dynamics is essential not only to ensure structural integrity but also to assess potential impacts on regional sediment transport and broader ecosystem functions.
In this study, high-resolution bathymetry data were used to analyse field-measured relative scour depths of 460 monopiles across 9 British OWFs. The analysis included a PCA in which eight hydrodynamic and geotechnical variables were considered to identify the dominant driver influencing relative scour depth variability. This analysis provided a basis for understanding the primary correlations between relative scour depth and metocean site conditions but also highlighted the complexity of these relationships, requiring further refinement.
The main conclusions can be summarized as follows.
-
Universal drivers of scour. Across all nine OWFs, the PCA identified relative water depth, relative grain size, the Keulegan–Carpenter number, and the mobility parameter as the most influential variables governing scour depth variability. Among these, the relative water depth showed the strongest correlation (Fig. 7), where greater relative scour depth occurred in shallower waters, particularly at locations with sediments composed of fine sand ( 200 µm) and medium sand ( 630 µm). In shallow waters the increased kinetic energy promotes stronger down-flow and vortex activity around the pile, enhancing scour, whereas in deeper water, hydrostatic pressure dominates, weakening these effects (Melville, 2008; Arneson et al., 2012), Furthermore, inclusion of the relative grain size captures the effect of grain-pile scaling, while the Keulegan–Carpenter number and the mobility parameter reflect the influence of flow unsteadiness and sediment mobility thresholds, reinforcing their relevance in realistic scour prediction frameworks.
-
Sediment-specific correlations. In order to explore the variability within soil classes, the dataset was clustered according to d50, and a PCA was applied to each cluster. For fine sand (63 to 200 µm) and medium sand (200 to 630 µm), relative water depth was found to be the dominant driver of relative scour depth, demonstrating the sensitivity of these sediment types to hydrodynamic forcing in shallower relative water depths. For coarser sediments, such as coarse sands (630 to 2000 µm) and fine gravels (2000 to 6300 µm), the correlations were less pronounced, reflecting a greater resistance to scour. This sediment-specific analysis highlights the importance of considering sediment type when assessing scour susceptibility and designing OWFs and how different sediment types can influence sediment transport patterns.
-
Site-specific variability. Due to local factors such as sediment conditions, hydrodynamic conditions, and topography, individual OWFs exhibited unique relative scour depth patterns. For example, London Array (Fig. 12c) showed correlations similar to the global results (Fig. 7), with relative water depth and site topography as the primary influences on scour, followed by current and wave conditions. In contrast, OWFs such as Robin Rigg and Lynn and Inner Dowsing showed no discernible correlations between relative scour depth and the key drivers obtained from the global PCA, highlighting the need for individual analyses to account for local complexities.
This study also highlights the potential environmental impacts of scour-induced sediment transport. While the primary focus was on identifying the physical drivers of scour, the findings could provide a first step in assessing potential impacts of OWF on the marine environment due to a changed regional sediment mobility. The entrainment of eroded sediment into the water column, with subsequent long-range transport, raises concerns about sediment deposition and potential impacts on benthic habitats and marine wildlife in far-field regions. Future research should prioritize the refinement of predictive scour models that incorporate temporal data and expanded hydrodynamic parameters to improve accuracy in diverse sedimentary environments. In addition, integrated approaches that combine regional sediment transport modelling with ecological assessments are critical for evaluating the cumulative impacts of OWF facilities on marine ecosystems. These efforts will facilitate the development of sustainable OWF designs that minimize environmental disturbance while advancing renewable energy goals.
The dataset used in this study is available on the Marine Data Exchange (MDE) (https://www.marinedataexchange.co.uk/, last access: 29 September 2025) and from the Copernicus Marine Service (CMEMS) (https://marine.copernicus.eu/, last access: 29 September 2025), as well as from https://doi.pangaea.de/10.1594/PANGAEA.984839 (Garcia et al., 2025).
KG: writing (original draft preparation), visualization, formal analysis, conceptualization, methodology. CJ: writing (review and editing), supervision, conceptualization, project administration. GM: writing (review and editing), resources. AS: writing (review and editing), methodology. MW: writing (review and editing), supervision. TS: writing (review and editing), funding acquisition, supervision.
The contact author has declared that none of the authors has any competing interests.
Publisher's note: Copernicus Publications remains neutral with regard to jurisdictional claims made in the text, published maps, institutional affiliations, or any other geographical representation in this paper. While Copernicus Publications makes every effort to include appropriate place names, the final responsibility lies with the authors. The responsibility for the content of this publication lies with the authors.
This work contributes to the DAM research mission sustainMare and the project CoastalFutures.
This research has been supported by German Federal Ministry of Education and Research (BMBF) under grant no. 03F0911G.
The publication of this article was funded by the open-access fund of Leibniz Universität Hannover.
This paper was edited by Erin Bachynski-Polić and reviewed by two anonymous referees.
Annad, M., Lefkir, A., Mammar-Kouadri, M., and Bettahar, I.: Development of a local scour prediction model clustered by soil class, Water Pract. Technol., 16, 1159–1172, https://doi.org/10.2166/wpt.2021.065, 2021.
Annad, M., Zourgui, N. H., Lefkir, A., Kibboua, A., and Annad, O.: Scour-dependent seismic fragility curves considering soil-structure interaction and fuzzy damage clustering: A case study of an Algerian RC Bridge with shallow foundations, Ocean Engineering, 275, 114157, https://doi.org/10.1016/j.oceaneng.2023.114157, 2023.
Arneson, L. A., Zevenbergen, L. W., Lagasse, P. F., and Clopper, P. E.: Evaluating scour at bridges (HEC-18, Publication No. FHWA-HIF-12-003, Fifth Edition), U.S. Department of Transportation, Federal Highway Administration, Washington, D.C., USA, 340 pp., ISBN 978-1329667099, 2012.
Baelus, L., Bolle, A., and Szengel, V.: Long-term scour monitoring around on a sandy seabed, in: Scour and Erosion IX: Proceedings of the 9th International Conference on Scour and Erosion (ICSE 2018), 5–8 November, 2018, Taipei, Taiwan, edited by: Yeh, K.-C., CRC Press, Boca Raton, FL, USA, pp. 383–392, https://doi.org/10.1201/9780429020940, 2018.
Baeye, M. and Fettweis, M.: In situ observations of suspended particulate matter plumes at an offshore wind farm, southern North Sea, Geo-Mar. Lett., 35, 247–255, https://doi.org/10.1007/s00367-015-0404-8, 2015.
Bailey, H., Brookes, K. L., and Thompson, P. M.: Assessing environmental impacts of offshore wind farms: lessons learned and recommendations for the future, Aquat. Biosyst., 10, 1–13, https://doi.org/10.1186/2046-9063-10-8, 2014.
Baykal, C., Sumer, B. M., Fuhrman, D. R., Jacobsen, N. G., and Fredsøe, J.: Numerical investigation of flow and scour around a vertical circular cylinder, Philos. Trans. R. Soc. A, 373, 20140104, https://doi.org/10.1098/rsta.2014.0104, 2015.
Bolle, A., Mercelis, P., Goossens, W., and Haerens, P.: Scour monitoring and scour protection solution for offshore gravity based foundations, in: Scour and Erosion: Proceedings of the Sixth International Conference on Scour and Erosion (ICSE-6), Paris, France, ASCE, Reston, VA, USA, 27–31 August 2012, 491–500, https://doi.org/10.1061/41147(392)47, 2012.
Breusers, H. N. C., Nicollet, G., and Shen, H. W.: Local scour around cylindrical piers, J. Hydraul. Res., 15, 211–252, https://doi.org/10.1080/00221687709499645, 1977.
Brignon, J. M., Lejart, M., Nexer, M., Michel, S., Quentric, A., Thiebaud, L.: A risk-based method to prioritize cumulative impacts assessment on marine biodiversity and research policy for offshore wind farms in France, Environ. Sci. Pol., 128, 264–276, https://doi.org/10.1016/j.envsci.2021.12.003, 2022.
Bunte, K., and Abt, S. R.: Sampling surface and subsurface particle-size distributions in wadable gravel- and cobble-bed streams for analyses in sediment transport, hydraulics, and streambed monitoring, U.S. Department of Agriculture, Forest Service, Rocky Mountain Research Station, RMRS-GTR-74, Fort Collins, CO, USA, https://doi.org/10.2737/RMRS-GTR-74, 2001.
Carpenter, J. R., Merckelbach, L., Callies, U., Clark, S., Gaslikova, L., and Baschek, B.: Potential impacts of offshore wind farms on North Sea stratification, PLOS ONE, 11, https://doi.org/10.1371/journal.pone.0159512, 2016.
Carreiras, J., Larroudé, P., Seabra-Santos, F., and Mory, M.: Wave scour around piles, in: Coastal Engineering 2000, Proceedings of the 27th International Conference on Coastal Engineering (ICCE), 16–21 July 2000, Sydney, Australia, ASCE, Reston, VA, USA, 1860–1870, https://doi.org/10.1061/40549(276)145, 2001.
Carroll, B., Cooper, B., Dewey, N., Whitehead, P., Dolphin, T., Rees, J., Judd, A., Whitehouse, R., and Harris, J.: A further review of sediment monitoring data, COWRIE Ltd., commissioned project ScourSed-09, ISBN 978-0-9561404-8-7, 2010.
Chen, H., Zhang, J., Guo, Y., Cui, L., Guan, D., and Jiang, L.: Laboratory modelling study on the scour characteristics around a jacket foundation subjected to combined wave-current loading, Renew. Energy, 122443, 2025.
Chiew, Y. M. and Melville, B. W.: Local scour around bridge piers, J. Hydraul. Res., 25, 15–26, https://doi.org/10.1080/00221688709499285, 1987.
Christiansen, N., Daewel, U., Djath, B., and Schrum, C.: Emergence of large-scale hydrodynamic structures due to atmospheric offshore wind farm wakes, Front. Mar. Sci., 64, https://doi.org/10.3389/fmars.2022.818501, 2022.
CMEMS: Atlantic – European North West Shelf – Ocean Physics Reanalysis, CMEMS [dataset], https://doi.org/10.48670/moi-00059, 2023a.
CMEMS: Atlantic – European North West Shelf – Wave Physics Reanalysis, CMEMS [dataset], https://doi.org/10.48670/moi-00060, 2023b.
Corvaro, S., Mancinelli, A., and Brocchini, M.: Flow dynamics of waves propagating over different permeable beds, Coastal Engineering Proceedings, 35, 35–35, https://doi.org/10.9753/icce.v35.waves.35, 2016.
DECC: Dynamics of scour pits and scour protection – Synthesis report and recommendations (Milestones 2 and 3), Department of Energy and Climate Change and Department for Environment, Food and Rural Affairs, Final Report, https://tethys.pnnl.gov/sites/default/files/publications/Whitehouse-et-al-2008.pdf, 2008.
Du, S., Wu, G., Zhu, D. Z., Wang, R., Lu, Y., and Liang, B.: Experimental study of local scour around submerged square piles in combined waves and current, Ocean Eng., 266, 113176, https://doi.org/10.1016/j.oceaneng.2022.113176, 2022.
EGS (International) Ltd.: Lynn and Inner Dowsing Offshore Wind Farms, Year 3 Post-Construction Survey (2011), Phase 1 – Geophysical Survey, Job No. 4918, Final Report – Rev 7, CREL Reference No LD-O-EV-013-0000-000000-368-D, Marine Data Exchange, https://www.marinedataexchange.co.uk/details/TCE-1041/2011-egs-lynn-and-inner-dowsing-year-3-post-construction-survey-phase-1—geophysical-survey/summary (last access: 18 September 2025), 2012.
EGS (International) Ltd.: Lynn and Inner Dowsing Offshore Wind Farms (October 2012), Job No. 5038, Final Report – Rev1, Marine Data Exchange, https://www.marinedataexchange.co.uk/details/TCE-1076/2012-egs-lynn-and-inner-dowsing-offshore-wind-farms-post-construction-hydrographic-and-geophysical-survey/summary (last access: 18 September 2025), 2013.
EMODnet Bathymetry Consortium: EMODnet Digital Bathymetry (DTM 2020), EMODnet Bathymetry Consortium, https://doi.org/10.12770/bb6a87dd-e579-4036-abe1-e649cea9881a, 2020.
Escarameia, M. and May, R.: Scour around structures in tidal flows, Technical Report SR 521, HR Wallingford, Wallingford, UK, http://eprints.hrwallingford.com/id/eprint/436 (last access: 9 October 2025), 1999.
European Commission: An EU Strategy to harness the potential of offshore renewable energy for a climate-neutral future, European Commission, Communication COM/2020/741 final, European Commission, Brussels, Belgium, 27 pp., https://eur-lex.europa.eu/legal-content/EN/TXT/?uri=CELEX:52020DC0741 (last access: 29 September 2025), 2020.
Gabriel, K. R.: The Biplot Graphic Display of Matrices with Application to Principal Component Analysis, Biometrika, 58, 453–467, https://doi.org/10.1093/biomet/58.3.453, 1971.
Garcia, K., Jordan, C., Melling, G., Schendel, A., Welzel, M., and Schlurmann, T.: Scour depth, sediment characteristics, and hydrodynamic conditions dataset at British offshore wind farms, 2005–2014, PANGAEA [dataset], https://doi.pangaea.de/10.1594/PANGAEA.984839, 2025.
Gazi, A. H., Purkayastha, S., and Afzal, M. S.: The equilibrium scour depth around a pier under the action of collinear waves and current, J. Mar. Sci. Eng., 8, 36, https://doi.org/10.3390/jmse8010036, 2020.
Guşatu, L. F., Menegon, S., Depellegrin, D., Zuidema, C., Faaij, A., and Yamu, C.: Spatial and temporal analysis of cumulative environmental effects of offshore wind farms in the North Sea basin, Sci. Rep., 11, 1–18, https://doi.org/10.1038/s41598-021-89537-1, 2021.
Hancu, S.: Sur le calcul des affouillements locaux dans la zone des piles de ponts, in: Proceedings of the 14th IAHR Congress: La recherche hydraulique et son impact sur l’environnement, International Association for Hydraulic Research, Société hydrotechnique de France, Paris, France, 29 August–3 September 1971, vol. 3, pp. 299–313, https://catalog.hathitrust.org/api/volumes/oclc/726174.html (last access: 29 September 2025), 1971.
Harasti, A., Gilja, G., Adžaga, N., and Škreb, K. A.: Principal Component Analysis in development of empirical scour formulae, in: Proceedings of the 7th IAHR Europe Congress, edited by: Stamou, A. I., and Tsihrintzis, V., Athens, Greece, 7–9 September 2022, 271–272, ISBN 978-618-85675-3-5, 2022.
Harris, J. and Whitehouse, R. J. S.: Scour prediction in non-uniform soils: Undrained shear strength and erodibility, in: Scour and Erosion: Proceedings of the 7th International Conference on Scour and Erosion (ICSE-7), Perth, Australia, edited by: Cheng, L., Draper, S., and An, H., CRC Press, Boca Raton, FL, USA, 2–4 December 2014, 267–274, ISBN 9781138027329, 2014.
Harris, J. M., Herman, W. M., and Cooper, B. S.: Offshore windfarms: an approach to scour assessment, in: Proceedings of the 2nd International Conference on Scour and Erosion, edited by: Chiew, Y. M., Lim, S.-Y., and Cheng, N.-S., Stallion Press, Singapore, 283–291, https://hdl.handle.net/20.500.11970/99946 (last access: 9 October 2025), 2004.
Harris, J. M., Tavouktsoglou, N. S., Couldrey, A., Whitehouse, R. J., and Klapper, J.: Scour prediction in cohesive marine soils: a hybrid approach, ISSMGE Int. J. Geoeng. Case Histories, 7, 59–75, https://doi.org/10.4417/IJGCH-07-04-06, 2022.
Hjorth, P.: Studies on the nature of local scour, Bulletin Series A, No. 46, Department of Water Resources Engineering, Lund Institute of Technology, Lund, Sweden, 1975.
Hu, R., Wang, X., Liu, H., and Lu, Y.: Experimental study of local scour around tripod foundation in combined collinear waves-current conditions, Journal of Marine Science and Engineering, 9, 1373, https://doi.org/10.3390/jmse9121373, 2021.
Jolliffe, I. T. and Cadima, J.: Principal component analysis: a review and recent developments, Philosophical Transactions of the Royal Society A: Mathematical, Physical and Engineering Sciences, 374, 20150202, https://doi.org/10.1098/rsta.2015.0202, 2016.
Kenyon, N. and Cooper, B.: Sand banks, sand transport and offshore wind farms, ABP Marine Environmental Research Ltd., Southampton, UK, https://doi.org/10.13140/RG.2.1.1593.4807, 2005.
Laursen, E. M.: An analysis of relief bridge scour, J. Hydraul. Div., Proc. ASCE, 89, 93–118, https://doi.org/10.1061/JYCEAJ.0000896, 1963.
Link, O. and Zanke, U.: On the time-dependent scour-hole volume evolution at a circular pier in uniform coarse sand, in: Proc. 2nd International Conference on Scour and Erosion (ICSE-2), Singapore, edited by: Chiew, Y.-M., Lim, S.-Y., and Cheng, N.-S., Nanyang Technological University, Singapore, 14–17 November 2004, https://hdl.handle.net/20.500.11970/99984 (last access: 9 October 2025), 2004.
Lloret, J., Turiel, A., Solé, J., Berdalet, E., Sabatés, A., Olivares, A., Gili, J.-M., Vila-Subirós, J., and Sardá, R.: Unravelling the ecological impacts of large-scale offshore wind farms in the Mediterranean Sea, Sci. Total Environ., 824, 153803, https://doi.org/10.1016/j.scitotenv.2022.153803, 2022.
London Array Ltd.: Environmental Statement Volume 1: Offshore Works, Technical report, London Array Ltd., Crown Estate via Marine Data Exchange, https://www.marinedataexchange.co.uk/details/TCE-992/2003-2005-eon-london-array-environmental-statement (last access: 29 September 2025), 2005.
Louwersheimer, W. F., Verhagen, H. J., and Olthof, J.: Scour around an offshore wind turbine, in: Coastal Structures 2007 – Proceedings of the 5th Coastal Structures International Conference, CST07, Venice, Italy, World Scientific Publishing Company, Singapore, 2–4 July 2007, 1903–1912, https://doi.org/10.1142/9789814282024_0168, 2009.
Lyu, X., Cheng, Y., Wang, W., An, H., and Li, Y.: Experimental study on local scour around submerged monopile under combined waves and current, Ocean Eng., 240, 109929, 2021.
Matthieu J. and Raaijmakers T.: Interaction between Offshore Pipelines and Migrating Sand Waves, in: Proceedings of the ASME 2012 31st International Conference on Ocean, Offshore and Arctic Engineering (OMAE 2012), Rio de Janeiro, Brazil, American Society of Mechanical Engineers (ASME), New York, NY, USA, 1–6 July 2012, OMAE2012-83875, 203–209, https://doi.org/10.1115/OMAE2012-83875 (last access: 9 October 2025), 2013.
Matutano, C., Negro, V., López-Gutiérrez, J.-S., and Esteban, M. D.: Scour prediction and scour protections in offshore wind farms, Renew. Energy, 57, 358–365, https://doi.org/10.1016/j.renene.2013.01.048, 2013.
May, R. P. and Willoughby, I.: Local scour around large obstructions, Technical Report SR 240, HR Wallingford, Wallingford, UK, http://eprints.hrwallingford.com/id/eprint/270 (last access: 9 October 2025), 1990.
McGovern, D. J., Ilic, S., Folkard, A. M., McLelland, S. J., and Murphy, B. J.: Time development of scour around a cylinder in simulated tidal currents, J. Hydraul. Eng., 140, 04014014, https://doi.org/10.1061/(ASCE)HY.1943-7900.0001023, 2014.
Melling, G. J.: Hydrodynamic and geotechnical controls of scour around offshore monopiles, Ph.D. thesis, University of Southampton, Ocean and Earth Science, Southampton, UK, 250 pp., http://eprints.soton.ac.uk/id/eprint/378992 (last access: 9 October 2025), 2015.
Melville, B. W.: The physics of local scour at bridge piers, in: Proceedings of the 4th International Conference on Scour and Erosion (ICSE-4), edited by: Sekiguchi, H., The Japanese Geotechnical Society, Tokyo, Japan, 5–7 November 2008, 28–40, https://hdl.handle.net/20.500.11970/100095 (last access: 9 October 2025), 2008.
Negro, V., López-Gutiérrez, J.-S., Esteban, M. D., Alberdi, P., Imaz, M., and Serraclara, J.-M.: Monopiles in offshore wind: preliminary estimate of main dimensions, Ocean Eng., 133, 253–261, https://doi.org/10.1016/j.oceaneng.2017.02.011, 2017.
Noormets, R., Ernstsen, V., Bartholoma, A., Flemming, B., and Hebbeln, D.: Local scour in a tidal environment: a case study from the Otzumer Balje tidal inlet, southern North Sea, preliminary results, in: River, Coastal and Estuarine Morphodynamics: RCEM 2003, edited by: Sánchez-Archilla, A., and Bateman, A., IAHR, 1134–1136, ISBN 90-805649-6-6, 2003.
Qi, M., Li, J., and Chen, Q.: Comparison of existing equations for local scour at bridge piers: parameter influence and validation, Nat. Hazards, 82, 2089–2105, https://doi.org/10.1007/s11069-016-2287-z, 2016.
Qi, W. G. and Gao, F. P.: Physical modeling of local scour development around a large-diameter monopile in combined waves and current, Coast. Eng., 83, 72–81, https://doi.org/10.1016/j.coastaleng.2013.10.007,, 2014.
Qu, L., An, H., Draper, S., Watson, P., Zhao, M., Harris, J., Whitehouse, R., and Zhang, D.: A review of scour impacting monopiles for offshore wind, Ocean Engineering, 301, 117385, https://doi.org//10.1016/j.oceaneng.2024.117385, 2024.
Richardson, M. D., Valent, P., Briggs, K., Bradley, J., and Griffin, S.: NRL mine burial experiments, in: Proceedings of the 2nd Australian-American Joint Conference on the Technologies of Mines and Mine Countermeasures, Sydney, Australia, 27–29 March 2001, 1–23, https://share.google/yobgPo9mN7uk6hqxt (last access: 29 September 2025), 2001.
Rivier, A., Bennis, A. C., Pinon, G., Magar, V., and Gross, M.: Parameterization of wind turbine impacts on hydrodynamics and sediment transport, Ocean Dyn., 66, 1285–1299, https://doi.org/10.1007/s10236-016-0983-6, 2016.
Roulund, A., Sutherland, J., Todd, D., and Sterner, J.: Parametric equations for Shields parameter and wave orbital velocity in combined current and irregular waves, in: Proceedings of the 8th International Conference on Scour and Erosion (ICSE-8), Oxford, UK, 12–15 September 2016, HR Wallingford, http://eprints.hrwallingford.com/id/eprint/1134 (last access: 9 October 2025), 2016.
Rudolph, D., Bos, K. J., Luijendijk, A. P., Rietema, K., and Out, J. M. M.: Scour around offshore structures – Analysis of field measurements, in: Proceedings of the 2nd International Conference on Scour and Erosion, edited by: Chiew, Y. M., Lim, S.-Y., and Cheng, N.-S., Stallion Press, Singapore, 400–407, https://hdl.handle.net/20.500.11970/99960 (last access: 9 October 2025), 2004.
Saathoff, J. E., Goldau, N., Achmus, M., Schendel, A., Welzel, M., and Schlurmann, T.: Influence of scour and scour protection on the stiffness of monopile foundations in sand, Appl. Ocean Res., 144, 103920, https://doi.org/10.1016/j.apor.2024.103920, 2024.
Sarkar, A.: Scour and flow around submerged structures, in: Proceedings of the Institution of Civil Engineers-Water Management, 167, 65–78, Thomas Telford Ltd., https://doi.org/10.1680/wama.12.00117, 2014.
Sarmiento, J., Guanche, R., Losada, I. J., Rosendo, E. M., Guindo, A., and de Guevara, J. L.: Scour processes around pile clusters of jacket foundations under steady currents, Ocean Eng., 313, 119502, https://doi.org/10.1016/j.oceaneng.2024.119502, 2024.
Schendel, A.: Wave-current-induced scouring processes and protection by widely graded material, Dissertation, Leibniz University Hannover, https://doi.org/10.15488/4453, 2018.
Schendel, A., Welzel, M., Schlurmann, T., and Hsu, T.-W.: Scour around a monopile induced by directionally spread irregular waves in combination with oblique currents, Coast. Eng., 161, 103751, https://doi.org/10.1016/j.coastaleng.2020.103751, 2020.
Schultze, L. K. P., Merckelbach, L. M., Horstmann, J., Raasch, S., and Carpenter, J. R.: Increased mixing and turbulence in the wake of offshore wind farm foundations, J. Geophys. Res.-Oceans, 125, e2019JC015858, https://doi.org/10.1029/2019JC015858, 2020.
Sheppard, D. M., Odeh, M., and Glasser, T.: Large scale clear-water local pier scour experiments, J. Hydraul. Eng., 130, 957–963, https://doi.org/10.1061/(ASCE)0733-9429(2004)130:10(957), 2004.
Shields, M. A., Woolf, D. K., Grist, E. P., Kerr, S. A., Jackson, A. C., Harris, R. E., and Side, J.: Marine renewable energy: The ecological implications of altering the hydrodynamics of the marine environment, Ocean Coast. Manag., 54, 2–9, https://doi.org/10.1016/j.ocecoaman.2010.10.036, 2011.
Smith, J. D. and McLean, S. R.: Spatially averaged flow over a wavy surface, J. Geophys. Res., 82, 1735–1746, https://doi.org/10.1029/JC082i012p01735, 1977.
Soulsby, R.: Dynamics of Marine Sands: A Manual for Practical Applications, Thomas Telford Publishing, London, UK, ISBN 072772584X, 1997.
Soulsby, R. L. and Whitehouse, R. J. S.: Threshold of sediment motion in coastal environments, in: Pacific Coasts and Ports '97: Proceedings of the 13th Australasian Coastal and Ocean Engineering Conference and the 6th Australasian Port and Harbour Conference, Vol. 1, Centre for Advanced Engineering, University of Canterbury, Christchurch, NZ, 145–150, ISBN 0908993153, 1997.
Stahlmann, A.: Numerical and experimental modeling of scour at foundation structures for offshore wind turbines, in: Proceedings of the 10th ISOPE Ocean Mining & Gas Hydrates Symposium, Szczecin, Poland, 22–26 September 2013, International Society of Offshore and Polar Engineers (ISOPE), Cupertino, CA, USA, ISBN 9781880653920, 2013.
Sturt, F., Dix, J. K., and EMU Ltd.: The Outer Thames Estuary Regional Environmental Characterisation, Marine Aggregate Levy Sustainability Fund, 09/J/1/06/1305/0870, Technical report, Marine Aggregate Levy Sustainability Fund, 2009.
Sumer, B. M.: Liquefaction around marine structures (with CD-ROM), Vol. 39, World Scientific Publishing Co. Pte. Ltd., Singapore, 159 pp., ISBN 9789814329316, 2014.
Sumer, B. M. and Fredsøe, J.: Scour around pile in combined waves and current, J. Hydraul. Eng., 127, 403–411, https://doi.org/10.1061/(ASCE)0733-9429(2001)127:5(403), 2001.
Sumer, B. M., Fredsøe, J., and Christiansen, N.: Scour around vertical pile in waves, J. Waterway Port Coastal Ocean Eng., 118, 15–31, https://doi.org/10.1061/(ASCE)0733-950X(1992)118:1(15), 1992.
Sumer, B. M. and Fredsøe, J.: The mechanics of scour in the marine environment, World Scientific Publishing Co. Pte. Ltd., Singapore, 552 pp., ISBN 9810249306, 2002.
Sumer, B. M., Christiansen, N., and Fredsøe, J.: The horseshoe vortex and vortex shedding around a vertical wall-mounted cylinder exposed to waves, J. Fluid Mech., 332, 41–70, https://doi.org/10.1017/S0022112096003898, 1997.
Sumer, B. M., Petersen, T. U., Locatelli, L., Fredsøe, J., Musumeci, R. E., and Foti, E.: Backfilling of a scour hole around a pile in waves and current, J. Waterway Port Coastal Ocean Eng., 139, 9–23, https://doi.org/10.1061/(ASCE)WW.1943-5460.0000161, 2013.
Teilmann, J. and Carstensen, J.: Negative long term effects on harbour porpoises from a large scale offshore wind farm in the Baltic – evidence of slow recovery, Environ. Res. Lett., 7, https://doi.org/10.1088/1748-9326/7/4/045101, 2012.
Van Rijn, L. C.: Sediment transport, part I: bed load transport, J. Hydraul. Eng., 110, 1431–1456, https://doi.org/10.1061/(ASCE)0733-9429(1984)110:10(1431), 1984.
Van Rijn, L. C., Soulsby, R., Hoekstra, P., and Davies, A. G.: Transport of fine sands by currents and waves, J. Waterway Port Coastal Ocean Eng., 119, 123–143, https://doi.org/10.1061/(ASCE)0733-950X(1993)119:2(123), 1993.
Vanhellemont, Q. and Ruddick, K.: Turbid wakes associated with offshore wind turbines observed with Landsat 8, Remote Sens. Environ., 145, 105–115, https://doi.org/10.1016/j.rse.2014.01.009, 2014.
Walker, W.: Field measurements of local pier scour in a tidal inlet, MSc, University of Florida, 1995.
Watson, S. C., Somerfield, P. J., Lemasson, A. J., Knights, A. M., Edwards-Jones, A., Nunes, J., and Beaumont, N. J.: The global impact of offshore wind farms on ecosystem services, Ocean Coast. Manag., 249, 107023, https://doi.org/10.1016/j.ocecoaman.2024.107023, 2024.
Welzel, M.: Wave-current-induced scouring processes around complex offshore structures, Ph.D. thesis, Leibniz University Hannover, Hannover, Germany, https://doi.org/10.15488/11225, 2021.
Welzel, M., Schendel, A., Schlurmann, T., and Hildebrandt, A.: Volume-based assessment of erosion patterns around a hydrodynamic transparent offshore structure, Energies, 12, 3089, https://doi.org/10.3390/en12163089,, 2019.
Welzel, M., Schendel, A., Satari, R., Neuweiler, I., and Schlurmann, T.: Spatio-temporal analysis of scour around complex offshore foundations under clear water and live bed conditions, Ocean Eng., 298, 117042, https://doi.org/10.1016/j.oceaneng.2024.117042, 2024.
Whitehouse, R.: Dynamics of estuarine muds, Thomas Telford Ltd., London, UK, ISBN 0727728644, 2000.
Whitehouse, R. J. S.: Scour at marine structures: a manual for practical applications, Thomas Telford Ltd., London, UK, ISBN 0727726552, 1998.
Whitehouse, R. J. S., Harris, J. M., Mundon, T. R., and Sutherland, J.: Scour at offshore structures, in: Proceedings of the 5th International Conference on Scour and Erosion, San Francisco, CA, USA, 11–20, https://doi.org/10.1061/41147(392)2, 2010.
Whitehouse, R. J. S., Harris, J. M., Sutherland, J., and Rees, J.: The nature of scour development and scour protection at onshore wind farm foundations, Mar. Pollut. Bull., 62, 73–88, 2011.
Whitehouse, R. J. S. and Harris, J.: Scour prediction offshore and soil erosion testing, in: Proceedings of the ASME 2014 33rd International Conference on Ocean, Offshore and Arctic Engineering (OMAE2014), San Francisco, CA, USA, 8–13 June 2014, Volume 8B, Ocean Engineering, Paper No. OMAE2014-24271, V08BT06A044, 10 pp., ASME, https://doi.org/10.1115/OMAE2014-24271, 2014.
Whitehouse, R. J. S., Sutherland, J., and O’Brien, D.: Seabed scour assessment for offshore windfarm, in: Proceedings of the 3rd International Conference on Scour and Erosion (ICSE-3), Gouda, the Netherlands, HR Wallingford, 3–5 July 2006, http://eprints.hrwallingford.com/id/eprint/595 (last access: 9 October 2025), 2006.
Wilson, J. C. and Elliott, M.: The habitat-creation potential of offshore wind farms, Wind Energy, 12, 203–212, https://doi.org/10.1002/we.324, 2009.
Yao, Y., Chen, Y., Zhou, H., and Yang, H.: Numerical modeling of current loads on a net cage considering fluid–structure interaction, J. Fluids Struct., 62, 350–366, https://doi.org/10.1016/j.jfluidstructs.2016.01.004, 2016.
Zanke, U. C. E., Hsu, T.-W., Roland, A., Link, O., and Diab, R.: Equilibrium scour depths around piles in noncohesive sediments under currents and waves, Coastal Eng., 58, 986–991, https://doi.org/10.1016/j.coastaleng.2011.05.011, 2011.
Zhao, M., Zhu, X., Cheng, L., and Teng, B.: Experimental study of local scour around subsea caissons in steady currents, Coast. Eng., 60, 30–40, https://doi.org/10.1016/j.coastaleng.2011.08.004, 2012.