the Creative Commons Attribution 4.0 License.
the Creative Commons Attribution 4.0 License.
 | 17 Oct 2025
How do convective cold pools influence the atmospheric boundary layer near two wind turbines in northern Germany?
Gerard Kilroy
Norman Wildmann
With increasing wind energy in the German energy grid, it is crucial to better understand how particular atmospheric phenomena can impact wind turbines and the surrounding atmospheric boundary layer. Deep convection is one source of uncertainty for wind energy prediction, with the near-surface convective outflow (i.e., cold pool) causing rapid kinematic and thermodynamic changes that are not adequately captured by operational weather models. Using 1 min meteorological mast and remote sensing vertical profile observations from the WiValdi research wind park in northern Germany, we detect and characterize 120 convective cold-pool passages over a period of 4 years in terms of their temporal evolution and vertical structure. We particularly focus on variations in wind-energy-relevant variables (wind speed and direction, turbulence strength, shear, veer, and static stability) within the turbine rotor layer (34–150 m height) to isolate cold-pool impacts that are critical for wind turbine operations. Near hub height (92 m) during the gust front passage, there are relatively increased wind speeds of up to +4 m s−1 in addition to the background flow, a relative wind direction shift of up to +15°, and increased turbulence strength for a median cold pool. Given hub-height wind speeds lying within the partial load region of the power curve for the detected cases, there is an increase in estimated power of up to 50 %, which lasts for 30 min. We find a “nose shape” in relative wind speeds and virtual potential temperature (θv) at hub height during gust front passages, with larger wind direction changes closer to the surface. This manifests as asymmetric fluctuations in positive shear, negative veer, and static stability across the rotor layer, with relative variations below hub height at least twice as large compared with above hub height and temporarily opposite signs for stability that have complex implications for turbine wakes. Doppler wind lidar profiles indicate that kinematic changes associated with the gust front extend to a height of 700–800 m, providing an estimate for cold-pool depth and highlighting that cold-pool impacts would typically extend beyond the height of current onshore wind turbines. After the cold-pool gust front passage, there is gradually increasing static stability, with a median decrease in near-surface θv of −2.7 K, a gradual decrease in hub-height turbulence strength, and faster recovery of wind speed than wind direction.
- Article
(5013 KB) - Full-text XML
- BibTeX
- EndNote


With the share of wind energy in the German power grid increasing from 1.7 % in 2000 to 34 % over the first half of 2024 (BMWK, 2024; Fraunhofer ISE, 2024), the density of wind turbines across Germany is increasing. This indicates that smaller-scale phenomena can impact a greater number of wind turbines and that the German energy sector is becoming more susceptible to shorter-duration power fluctuations. The stability and balancing of the German electrical grid operate on lead times down to 5 min, which increases the utility of minute-scale wind power forecasting for energy trading and wind turbine control (Würth et al., 2019). Despite the identified importance of short-term wind power forecasting, there are continuing uncertainties in power forecasts. The median annual wind energy production still tends to be overpredicted globally, with uncertainties of ∼ 6 % (Lee and Fields, 2021). Over Germany, larger day-ahead power forecast errors have been associated with various meteorological events, with a 1 %–3 % installed capacity day-ahead forecast error in any given month indicating a wide range of meteorological causes possibly affecting the forecasting errors (Steiner et al., 2017). Meteorological impacts on power production are therefore one noteworthy consideration for limiting the power prediction uncertainty, with reductions in wind speed (U) uncertainty having an outsized improvement on predicted power (P) since P∼U3 (Lee and Fields, 2021). As such, improving our understanding of short-term low-level wind speed variations associated with meteorological events is crucial for reducing short-term wind power forecasting uncertainties.
Rapid changes in the wind profile over the lowest few hundred meters of the atmospheric boundary layer (ABL) on timescales ranging from a few minutes to a few hours (e.g., wind ramps) are an important driver of variations in wind power. Wind ramps can be produced by a range of meteorological phenomena, including mid-latitude cyclones, low-level jets, sea breezes, and deep convection, and therefore wind ramps can occur across a range of timescales and spatial scales (Gallego-Castillo et al., 2015). Past work on wind ramps over Europe has largely focused on turbine impacts without providing a detailed verification of the meteorological cause of wind ramps (Vincent et al., 2011; Kelly et al., 2021; Lochmann et al., 2023). When meteorological causes of wind ramps have been identified, the focus was on synoptic-scale weather phenomena (Valldecabres et al., 2020) or specifically mid-latitude cyclones (Steiner et al., 2017). Steiner et al. (2017) additionally found that 18 % of analyzed wind ramps could be related to convective systems or unresolved downward mixing, but this wind ramp category was not investigated in detail, and deeper evaluation would have been limited by the ∼ 7 km horizontal resolution of the numerical weather prediction (NWP) model used in their study. Beyond this “convective system” wind ramp category broadly outlined in Steiner et al. (2017), we are not aware of additional work concerning wind power fluctuations induced by convective wind ramps over Europe.
In this regard, quantification of short-term thunderstorm impacts using wind-energy-relevant variables, specifically related to thunderstorm near-surface outflow, has rarely been performed. For example, Lombardo et al. (2014), Gunter and Schroeder (2015), and Canepa et al. (2020) each analyzed strong thunderstorm outflow events (i.e., downbursts) using wind-energy-relevant variables with a limited sample size (10 or fewer), but they did not investigate a larger sample of cases or the broader range of thunderstorm outflow intensities that can occur. Mature-stage deep convection produces a precipitation-induced downdraft with descending cold air that spreads outward once reaching the surface (Byers and Braham, 1948). This “cold pool” has a low-level outflow boundary at its periphery known as a gust front, which is typically characterized by increased horizontal wind speeds, a wind direction shift, and increased turbulence relative to the background environment (Benjamin, 1968; Goff, 1976; Wakimoto, 1982; Droegemeier and Wilhelmson, 1987). As thunderstorm gust front winds tend to maximize within the height range of the turbine rotor layer (Lombardo et al., 2014; Gunter and Schroeder, 2015; Canepa et al., 2020) and thunderstorm ramp-up events typically occur on timescales from 1–5 min (Lombardo et al., 2014), gust fronts are simultaneously crucial for assessing short-term wind-turbine-related impacts and are under-resolved by NWP models both spatially and temporally. This limitation is potentially exacerbated by the fact that NWP models tend to underestimate extreme winds due to mesoscale smoothing, with this effect especially pronounced on the sub-hourly timescale (Larsén et al., 2012). High-frequency kinematic observations encompassing the turbine rotor layer are thus a promising tool for accurately characterizing rapid variations in wind power caused by convective cold pools and their associated gust fronts.
The gust front is not the only aspect of convective cold pools relevant to wind energy applications. Near-surface thermal stability changes in the ABL, such as those that occur after a cold-pool gust front passage, also have notable implications for variations in wind turbine power generation. A convective (stable) boundary layer is associated with higher (lower) turbulence (Stull, 1988), which contributes to the amount of turbulent mixing in the wind turbine wake region. Decreased wind speed deficits (i.e., faster wake recovery and shorter wake length) and greater turbulence downstream of wind turbines occur in convective conditions compared with a neutral boundary layer (Zhang et al., 2013; Iungo and Porté-Agel, 2014; Abkar and Porté-Agel, 2014), generally leading to decreased power deficits for wind farms depending on turbine spacing (Hansen et al., 2012). In short, the ABL stability affects the turbulence strength, which then influences how quickly the turbine wake recovers (Wildmann et al., 2018) and whether the turbine wake impacts power generation of downstream turbines. With short-term increases in turbulence accompanying the cold-pool gust front (e.g., Droegemeier and Wilhelmson, 1987; Lombardo et al., 2014; Canepa et al., 2020) and short-term increases in near-surface stability occurring within the cold-pool interior, passages of convective cold pools over wind turbines provide a unique opportunity to examine the complex interactions between ABL stability regimes and wind power production.
With a particular focus on convective cold-pool impacts within the turbine rotor layer, we investigate short-term kinematic and thermodynamic variations near two utility-scale wind turbines within the WiValdi research wind farm1 in northern Germany from 2020–2024. The flat terrain and vast array of in situ and remote sensing instrumentation available at this research site provide a unique opportunity for isolating and characterizing convective cold-pool impacts relevant for wind energy. We extend the WiValdi climatological work of Wildmann et al. (2022) by highlighting thunderstorm-related environmental effects, with this region of northern Germany notably having a relatively high frequency of convective cells (Wilhelm et al., 2023) and density of wind turbines (Bouchard and Romanic, 2023). Given the 1–5 min timescale of thunderstorm ramp-up events and the importance of minute-scale forecasting for the German wind power sector, we utilize high-frequency (1 min) measurements from meteorological mast, Doppler wind lidar velocity azimuth display (VAD) scans (Wildmann et al., 2020), and microwave radiometer instrumentation at WiValdi to analyze the near-surface environmental changes associated with cold pools. Radar composite datasets from the German Meteorological Service (DWD) provide verification of the parent convective cells. Using summertime cold-pool studies focused on the Netherlands (Kruse et al., 2022) and northern Germany (Kirsch et al., 2021, 2024) as a foundation, we examine year-round cold-pool events with particular emphasis on wind-energy-relevant variables. The primary research questions guiding this work are as follows:
-
How much does the wind speed, wind direction, and temperature change in the ABL during observed convective cold-pool passages near the WiValdi wind turbines?
-
To what extent do wind-energy-relevant variables (wind speed and direction, turbulence strength, wind shear, wind veer, static stability) change throughout the turbine rotor layer during these convective cold-pool passages?
-
Is there a significant variation in estimated wind power production at turbine hub height during these convective cold-pool passages?
Section 2 outlines our observational datasets, instrumentation, and cold-pool detection methodology. Sections 3 and 4 describe the temporal evolution and vertical structure of cold-pool characteristics, respectively. Section 5 highlights changes throughout the turbine rotor layer and estimates of wind power increase during cold-pool passages. Section 6 contains a summary of our findings along with the conclusions for this study.
2.1 WiValdi instrumentation
The WiValdi research wind farm operated by the German Aerospace Center (DLR) in Krummendeich, Germany, is located in coastal flatlands near the mouth of the Elbe in the North Sea (Fig. 1a). This large-scale research facility contains two 4.2 MW Enercon E-115 wind turbines (Fig. 1b) that have hub heights of 92 m and rotor diameters D of 116 m, are separated by approximately 500 m (i.e., 4.3 rotor blade diameters = 4.3 D), and are aligned along the primary west-southwesterly wind direction (Wildmann et al., 2024). One 150 m meteorological mast located 2 D in front of the westernmost turbine (i.e., T1) provides inflow conditions at multiple heights throughout the turbine rotor layer (see Table 1). On this “inflow mast”, ultrasonic anemometers (hereafter, sonic) lie at heights of 34, 62, 85, 120, and 149 m, while temperature and relative humidity sensors are located at 34, 62, 85, 120, and 143 m. Barometers are only located at 10 and 85 m, so pressure values at other heights are obtained via the hypsometric equation starting at 10 m. Using 1 min averaged measurements, the inflow meteorological mast observations, which are available starting from 14 November 2022, are used in this study to validate the remote sensing vertical profiles and characterize the convective cold-pool impacts within the rotor layer (i.e., 34–150 m). As a measure for turbulence, the 1 min turbulent kinetic energy (TKE) dissipation rate ε is calculated from the second-order structure function according to Bodini et al. (2019) using the 85 m sonic anemometer observations that have a temporal frequency of 20 Hz. We use this variable to characterize turbulence strength since it can be calculated for short time periods and can thus provide information about rapid changes during gust front passages.
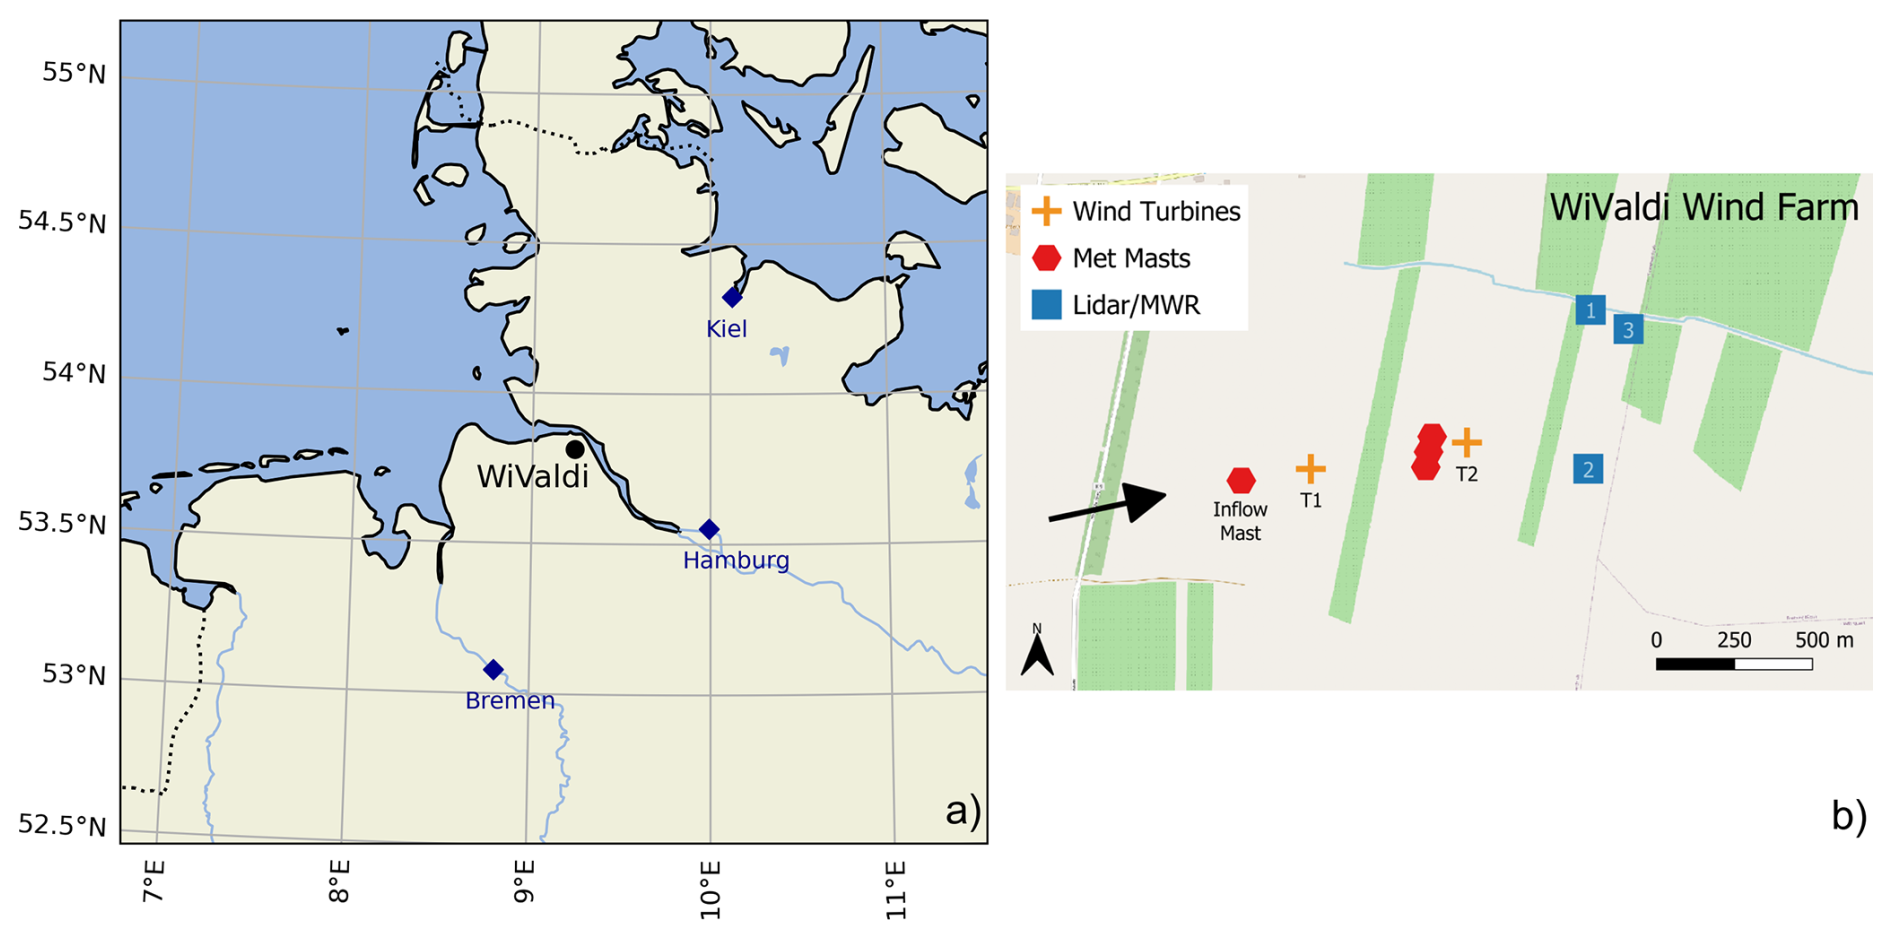
Figure 1(a) Map of northern Germany centered on the location of the WiValdi wind farm. Blue diamonds indicate nearby major cities, while dashed lines indicate country borders. (b) Detailed layout of WiValdi, indicating the locations of the wind turbines, meteorological masts, MWR, lidar, and underlying simple terrain. The blue squares represent the location of both the lidar and the MWR, with the overlaid numbers indicating their different positions in chronological order: November 2020–March 2022 (1), October 2022–May 2024 (2), and May 2024–present (3). The black arrow indicates the primary west-southwesterly wind direction at WiValdi. Background map: © OpenStreetMap contributors 2025. Distributed under the Open Data Commons Open Database License (ODbL) v1.0.
Vertical profiles of wind speed and direction are provided by a Leosphere WindCube 200S pulsed Doppler wind lidar that was installed on 4 November 2020 approximately 400 m to the east of the easternmost turbine (i.e., T2). This lidar has a pulse length of 200 ns, a measurement range for radial velocities between −30 and 30 m s−1, and a minimum observing line-of-sight distance of 100 m (2 times the minimum range gate length). Radial velocity retrievals from a Doppler wind lidar are more greatly attenuated by precipitation and low cloud cover (e.g., fog).
This lidar has the capability to perform horizontal plan-position indicator (PPI) scans, vertical range–height indicator scans, and fixed-direction scans. A sub-category of PPIs is conical scans at a constant elevation angle, known as velocity–azimuth display (VAD) scans, which allow for determinations of the horizontal wind components using the so-called VAD technique. We perform VAD scans at two different elevation angles: 35.3 and 75°. The 75° VAD scan (VAD75) has a higher vertical range and a smaller horizontal footprint, whereas the 35.3° scan (VAD35) can be used to determine TKE (Kropfli, 1986; Wildmann et al., 2020). In both cases, an averaged profile of the 3D wind vector is measured horizontally across the cone at each range gate (i.e., every height), with a complete scan lasting ∼ 72 s. Each VAD scanning pattern is run for 30 min every hour, with 25 scans per elevation angle. Given a minimum measurement height of 57 and 96 m for the VAD35 and VAD75 scans, respectively, we obtain “hub-height” lidar winds at 100 m to have consistent coverage during both scanning patterns. Lidar data are linearly interpolated to 1 min temporal resolution throughout the vertical profile to capture rapid wind variations associated with convective cold pools, but we limit interpolation to within surrounding reliable measurements (signal-to-noise ratio from 0 to −25) and do not interpolate across more than one missing value.
Table 1Summary of WiValdi instrumentation, measurement heights, and time periods used in this study. Measurement temporal resolution reflects the native output frequency of each instrument, while 1 min averaged data are used throughout our analyses unless otherwise indicated.
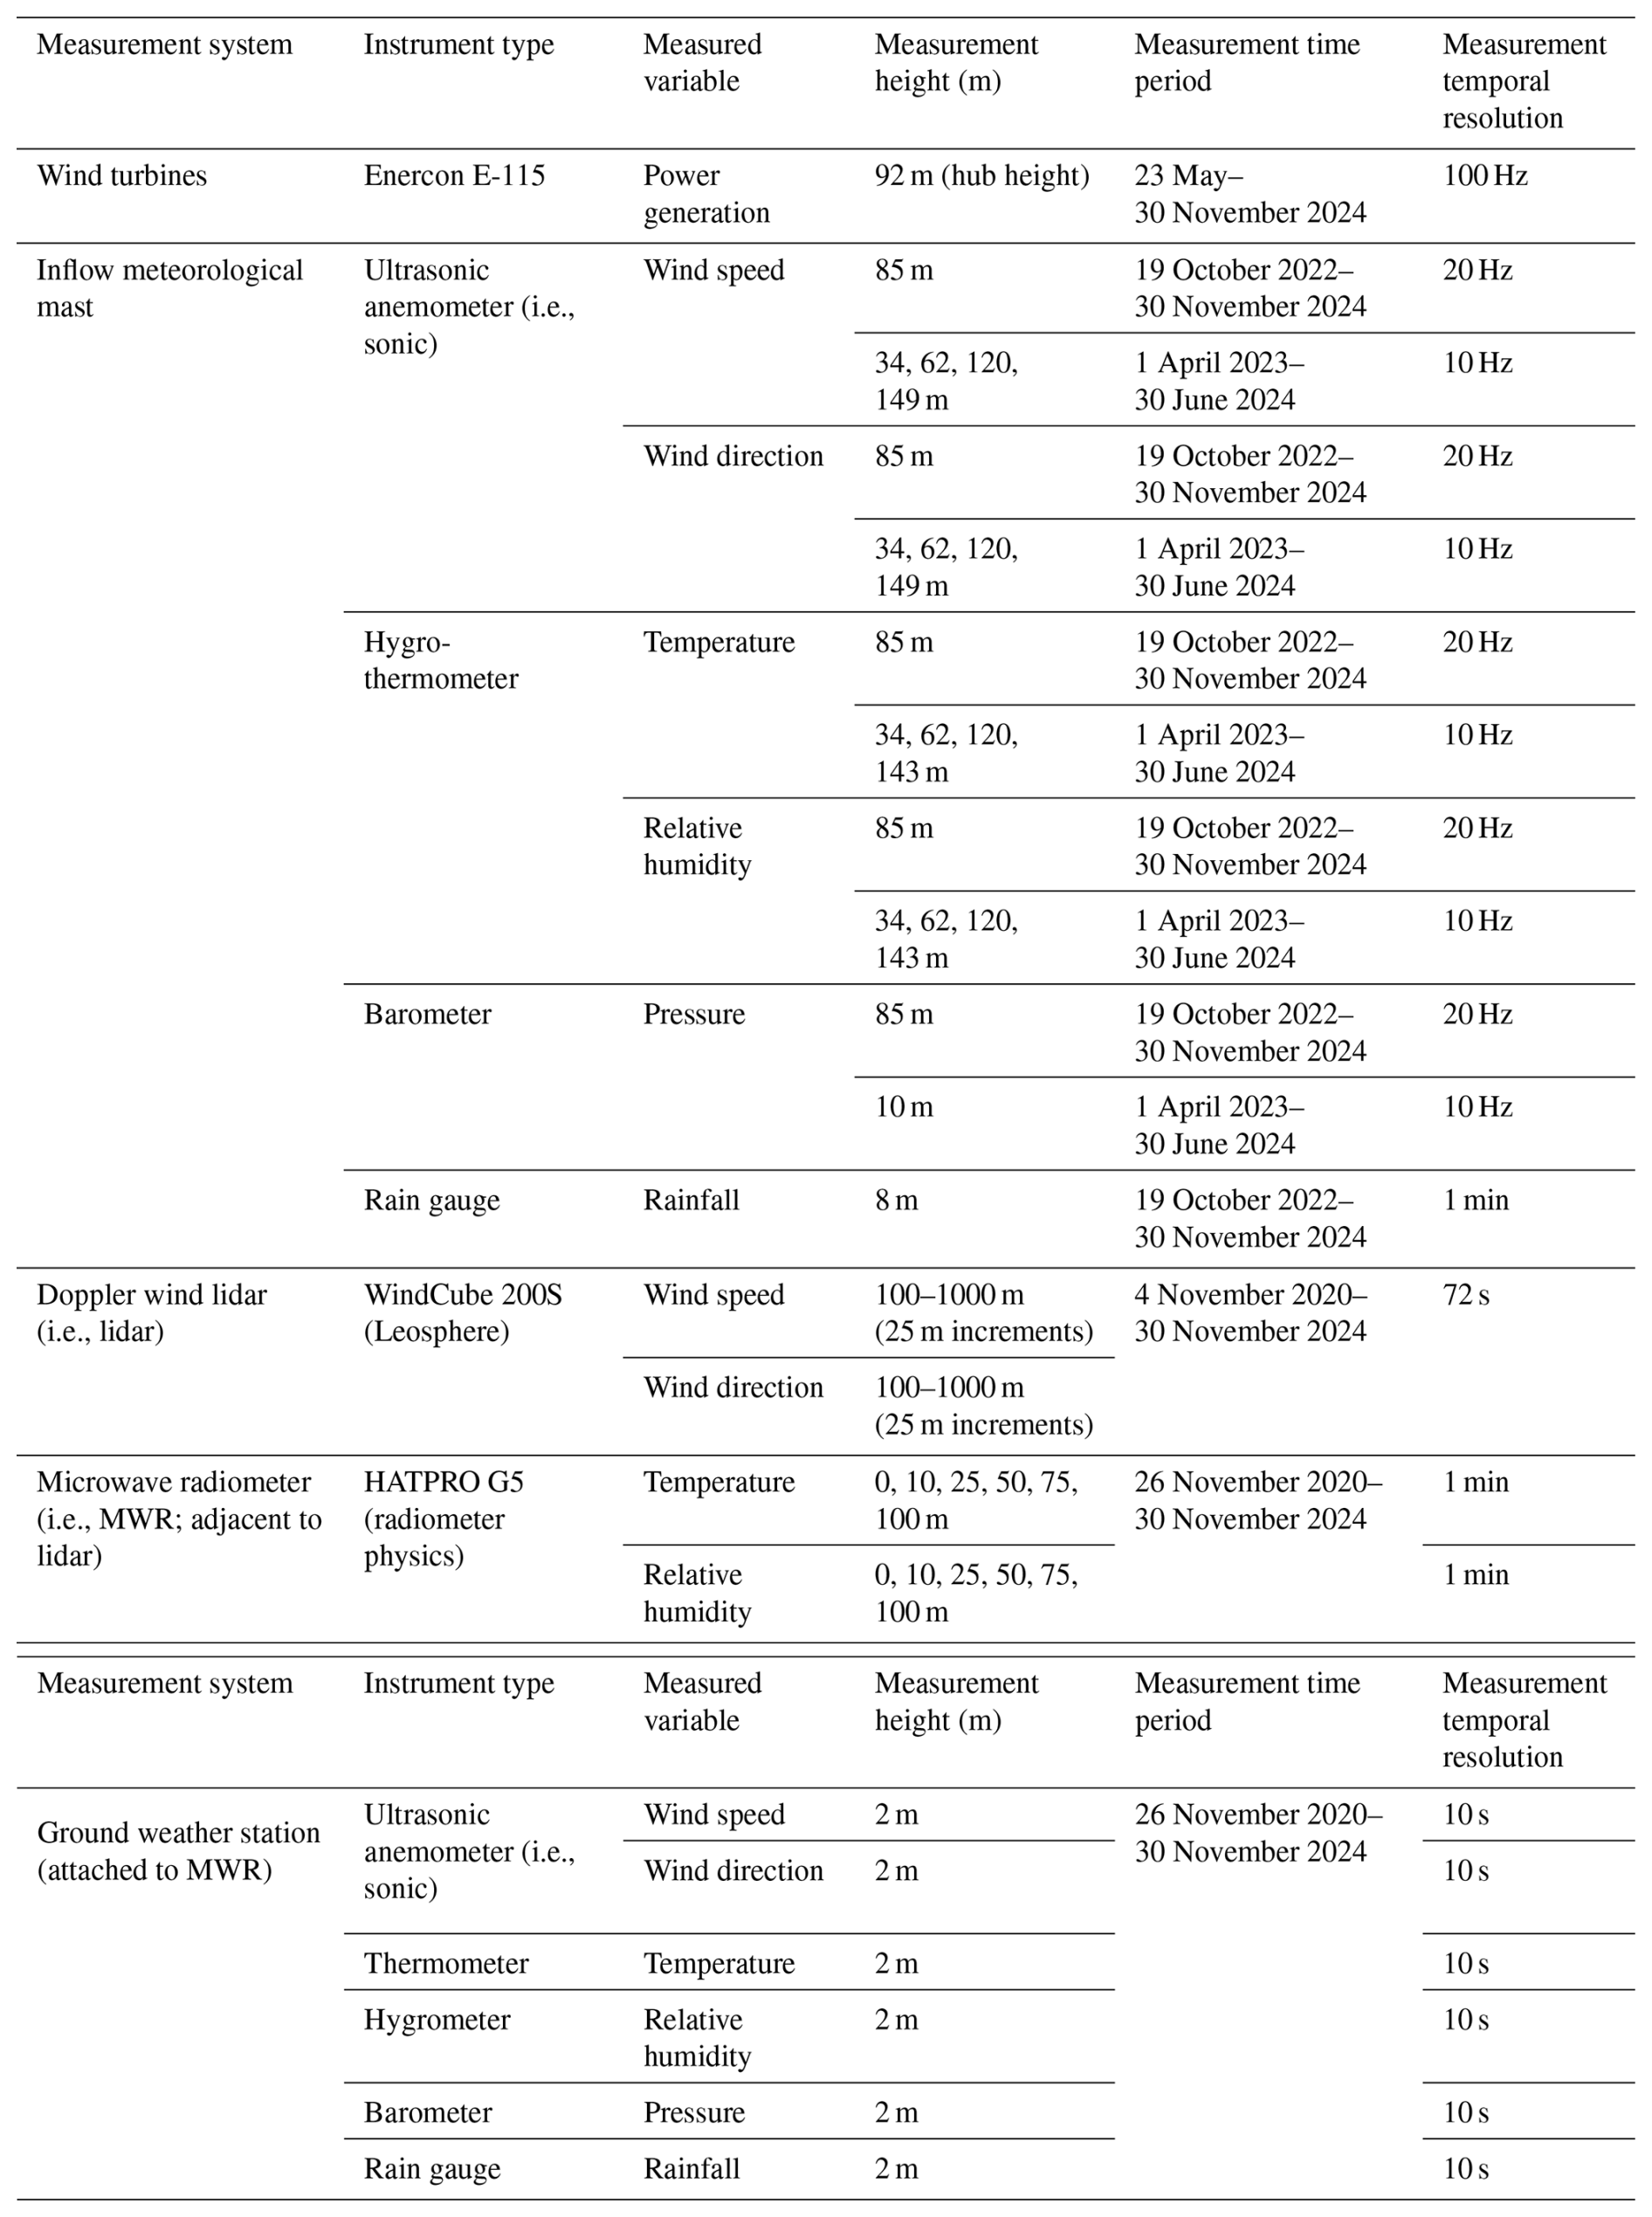
Adjacent to the lidar, there is a passive HATPRO G5 microwave radiometer (MWR; Rose et al., 2005), manufactured by Radiometer Physics GmbH, which was installed on 26 November 2020 and which provides vertical profiles of temperature and humidity. We note that the lidar and MWR were slightly moved within the wind park every couple of years (Fig. 1b, blue squares) but were moved on the same days, kept adjacent to each other, and remained east of the T2 turbine by approximately the same distance. With an associated ground weather station for obtaining surface environmental conditions, an MWR passively retrieves vertical profiles through the use of multiple brightness temperature measurements within the oxygen and water vapor absorption bands. Absolute calibration using liquid nitrogen is performed about every half year, with a gain calibration using the internal hot target being carried out every 30 min, and noise calibration is automatically performed internally with high frequency during normal operations.
The HATPRO G5 MWR can perform zenith and boundary-layer scans to obtain temperature profiles, while humidity profiles are determined only from the zenith scans. Zenith scans point directly upwards and retrieve measurements up to 10 km altitude, with a general decrease in spatial resolution with increasing height (especially above 2 km). Boundary-layer scans are performed at 10 different elevation angles ranging from 4–90° up to 1.2 km altitude towards the south (185° azimuth), which can more accurately capture vertical gradients in temperature and humidity than zenith scans. The MWR at WiValdi performs a boundary-layer scan lasting about 100 s every 10 min. Otherwise, the instrument measures at zenith (90° elevation) to obtain 1 min temperature and humidity. To better capture rapid environmental variations associated with convective cold-pool passages, we use the 1 min zenith vertical profile data for this study.
2.2 Cold-pool detection algorithm
Following guidance from recent European cold-pool studies (Kirsch et al., 2021; Kruse et al., 2022; Kirsch et al., 2024), we identify convective cold pools at WiValdi using 1 min time series data. High-frequency observations on the minute-scale are crucial for capturing the rapid environmental changes associated with cold pools, while near-surface observations ensure identification of the cold-pool thermodynamical signal, which is the strongest near the surface (e.g., Barnes and Garstang, 1982; Kirsch et al., 2021). Using 2 m in situ measurements from the ground weather station attached to the MWR across 4 years (26 November 2020–30 November 2024), we detect cold-pool passages throughout the year using the following procedure:
-
We smooth the 2 m virtual potential temperature (θv) time series using 11 min rolling averages, following Kruse et al. (2022), which extends the methodology of de Szoeke et al. (2017). This smoothing reduces the effect that random θv fluctuations could have on misidentifying the starting time of a cold-pool passage, while θv rather than temperature is used to account for pressure and moisture variations.
-
We isolate time periods of continuous 2 m θv decreases to further minimize misidentification caused by random θv fluctuations and which follows from the observed cold-pool horizontal structure, where temperature decreases approximately linearly from the edge to the center (Kirsch et al., 2024).
-
We identify the time step when the smoothed 2 m θv continuously decreases by at least 0.5 K as “T0”, following Kirsch et al. (2021).
-
Continuous-θv-decrease time periods include at least one time step of measurable rainfall exceeding 1 mm h−1 and a positive wind speed anomaly relative to the daily mean wind speed within ±10 min of T0. This rainfall threshold is used to remove instances of very weak convection or possible rainfall measurement error, while the wind speed anomaly is inspired by Kruse et al. (2022) and verifies a more significant cold-pool gust front strength compared with the background flow conditions (given our interest in quantifying cold-pool impacts on wind turbines).
-
There is no rainfall from T0−30 to T0−10 min to reduce environmental contamination by recent or nearby convection and to reduce false positive cases that could actually be related to cold fronts with along-frontal precipitation.
-
θv continuously decreases by at least 1.5 K. This θv threshold is chosen to match the temperature decrease threshold of Kruse et al. (2022), with their study in the Netherlands being similarly situated in coastal flatlands. We have increased the threshold to −1.5 K from −2 K used in Kirsch et al. (2021) due to WiValdi's coastal location and greater environmental moisture, which would likely reduce the amount of evaporative cooling.
-
A θv drop of at least 1.5 K occurs within 30 min of T0. This θv gradient threshold ensures a more robust cold-pool passage while minimizing occurrences of more gradual cooling associated with phenomena outside the scope of this study (i.e., sea breezes and diurnal cycle). The 30 min time constraint is similar to that of past work (20 min for Kirsch et al., 2021, and Kruse et al., 2022). For context, changing this time constraint to 20 or 60 min would decrease or increase detected cases by one-third, respectively.
-
Finally, we prescribe that θv must increase after reaching its minimum value and that this increase occurs within 60 min of T0. This aligns with known cold-pool horizontal structure (Kirsch et al., 2024) and further reduces false positives associated with cold frontal passages. The inclusion of this criterion only removes a few cases from our dataset, but visual inspection reveals that these removed cases resemble cold fronts (not shown).
Cold-pool events are included in our dataset if they meet the above criteria. As we require rainfall to be detected at WiValdi for a cold pool to be counted, we exclude cold-pool cases where the parent convective cell's rainfall misses WiValdi but the cold-pool periphery crosses over the wind park. We conservatively define the “pre-cold-pool environment” as the environmental conditions present at T0−30 min, with findings by Kirsch et al. (2021) and Kruse et al. (2022) indicating that near-surface environmental conditions do not significantly change until at least T0−15 min. The 1 min averaged environmental conditions at T0−30 min from the MWR, lidar, and mast data provide a proxy for the background environment prior to each of the detected cold-pool passages.
2.3 Convective cell tracking
While weather station and meteorological mast observations can and have been used to identify convective cold pools (e.g., Kirsch et al., 2021; Hoeller et al., 2024), additional radar measurements can be useful to (1) confirm the presence of a parent convective cell linked to the ground-based cold pool (Kruse et al., 2022) and (2) provide comparison between radar-derived convection characteristics and near-surface cold-pool characteristics. Therefore, to supplement the WiValdi observational network, we track convective cells associated with the detected cold-pool cases using DWD radar composite datasets.
We utilize the radar reflectivity (WN) composite dataset from DWD, which has 1 km × 1 km horizontal resolution and 5 min temporal resolution over Germany. This dataset is derived from 5 min terrain-following scans of the German C-band radar network with a range resolution of 1 km and azimuth resolution of 1° (Wapler, 2021; Wilhelm et al., 2023). We then employ the Tracking and Analysis of Thunderstorms (TATHU) toolset (Uba et al., 2022; Sena et al., 2024) to systematically detect and track convective systems within the WN dataset. With TATHU, convective elements, or objects, are identified using a chosen threshold from a given 2D field from which a corresponding bounded polygon is drawn. Given the polygon boundary at each time step and a user-provided polygon overlap area percentage, identified convective elements can be linked in time, including whether storms undergo splitting or merging during their life cycle. Convective element characteristics (weighted centroid position, shape, size) are provided at each time step, and statistical quantities of the given 2D field related to each convective element can be obtained.
For this study, we define a convective cell as a contiguous area of at least 15 km2 with a minimum radar reflectivity of 19 dBZ, with a 10 % polygon overlap criterion used to connect convection snapshots in time. While the size threshold is identical to the DWD detection and nowcasting tool KONRAD, the reflectivity threshold of 19 dBZ is much lower than the 46 dBZ chosen by recent studies (Wapler, 2021; Wilhelm et al., 2023). Goudenhoofdt and Delobbe (2013) proposed a minimum 40 dBZ threshold to identify convective precipitation over Belgium, suggesting that lower thresholds could lead to a higher potential for storms to be classified as splitting or merging due to closer proximity to nearby convection. However, to ensure identification of a precipitating convective cell close in time to the observed cold pool (which is detected without any convection-type rainfall classification), as well as to more fully capture a convective cell's life cycle from early development to late decay, we employ this lower 19 dBZ reflectivity threshold for cell tracking.
3.1 Near surface
Using the detection criterion outlined in Sect. 2.2, we identify 120 convective cold pools impacting WiValdi from 26 November 2020–30 November 2024. Table 2 highlights the non-uniform distribution of cold-pool events throughout the year, with generally more cases in the warmer months of May through October. However, the lower availability of 1 min ground station observations in warmer months indicates a likely under-count of cold-pool passages in total. The greater pre-event surface saturation deficit (qsat−q) during May–October indicates a likelihood for greater evaporative cooling of rainfall during warmer months, though WiValdi generally has a lower saturation deficit during summer months than the 4.7 g kg−1 median saturation deficit found by Kirsch et al. (2021) during summer months farther inland near Hamburg. With the near-surface temperature perturbation previously found to have a relatively strong inverse relationship with pre-event saturation deficit (Kirsch et al., 2021), we expected that the reduced saturation deficit at WiValdi would lead to weaker cold pools on average (in terms of surface temperature decrease) than those observed near Hamburg. Although this is somewhat borne out by the decreases in θv (relative to T0−30) for the warmest months of July and August, we do not find a strong relationship between saturation deficit and cold-pool temperature decreases for other months. Various factors could influence this finding of a weak relationship, including the lower variability of environmental conditions at WiValdi due to its coastal location, the convection types associated with the cold pools identified by our detection algorithm, the cold-pool region sampled at WiValdi (e.g., the coldest part may not have passed over the site), and the lower data availability for the ground weather station during summer months.
Table 2Monthly climatology of detected cold-pool cases; 1 min ground station data availability; 2 m median pre-event environmental conditions (30 min before detected cold-pool passage; e.g., T0−30) in terms of θv (°C), saturation deficit (qsat−q, g kg−1), and total wind speed (m s−1); and 2 m median environmental changes during cold-pool events (relative to T0−30) in terms of minimum θv (°C), maximum rainfall rate (mm h−1), and maximum total wind speed (m s−1). The pre-event environment provides a proxy for the background environment. Gray shading indicates the warm season at WiValdi, as shown by θv.
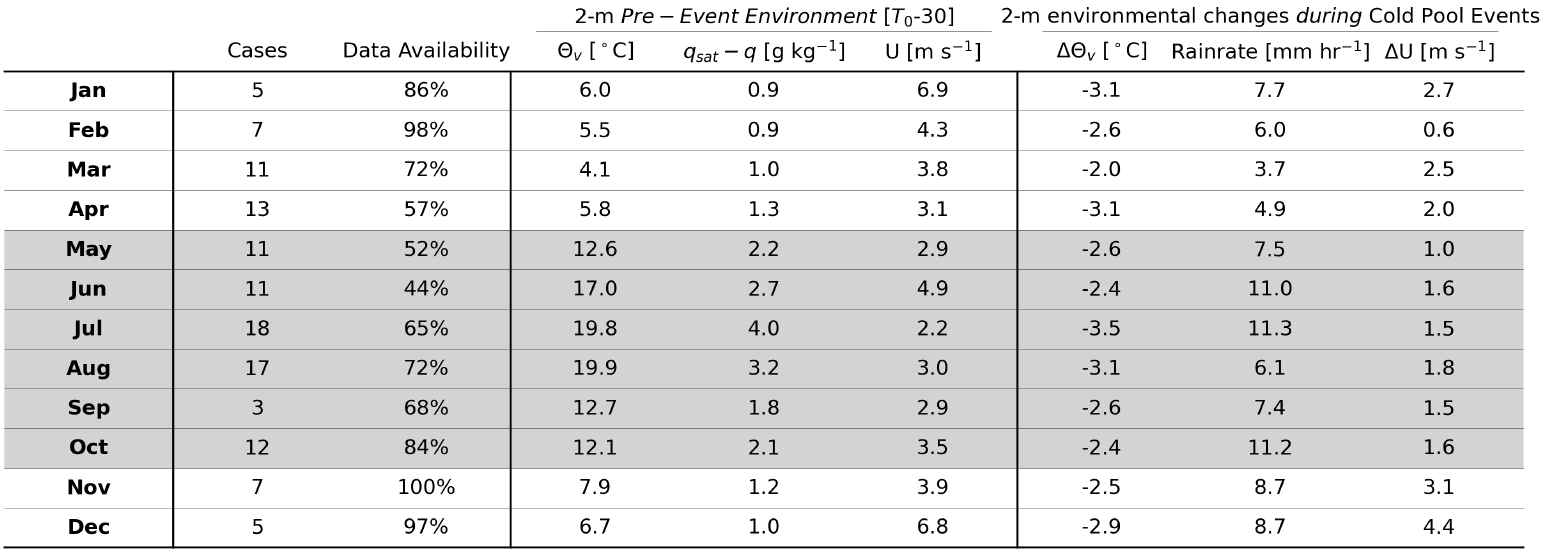
Similar to the monthly θv variations, the median of the maximum rain rates during cold-pool events tends to be larger in warmer months, indicating that more intense convective precipitation occurs in warmer months, as would be expected. However, higher maximum rain rate does not uniformly correlate with a stronger cold pool (except perhaps for July), in agreement with the weak relationship () found by Kirsch et al. (2021). Past work over Germany has noted that accumulated rainfall, rather than maximum rain rate, has a stronger influence on the observed near-surface temperature drop (Kirsch et al., 2024). Beyond the thermodynamic monthly climatology, we generally find higher background wind speeds in winter months, notably December and January, in agreement with long-term wind climatologies over Europe (e.g., Molina et al., 2021). Given this wind pattern and the positive daily wind anomaly criterion that we use in our detection methodology, it is not unexpected that the maximum near-surface wind speeds associated with the cold-pool gust fronts tend to be larger during colder months. Nevertheless, there are still notable increases in 2 m wind speeds during warmer months of the order of 1–1.5 m s−1.
As with the monthly variability of pre-event environments and cold-pool events, there is a variety of parent convective cells associated with the detected cold pools across all seasons, which are represented by the radar reflectivity snapshots in Fig. 2 from the nearest radar times to their respective T0 times. To better contextualize the monthly climatologies and these convection snapshots, we provide a brief case study for a cold pool that was detected on 15 June 2024 at 08:54 UTC that is at the stronger end of the range of detected cold-pool events. This cold pool occurred on a convectively active day and was associated with a mesoscale convective system in northern Germany (Fig. 2c). Stratiform rainfall preceded the cold-pool passage, and additional cold pools were detected at WiValdi later that morning (not shown). As the gust front approached, there was an increase in wind speeds from 7 to 14 m s−1 (Fig. 3a) alongside a wind direction shift from 195 to 235° (Fig. 3b) over the course of a few minutes. A significant increase in TKE dissipation rate ε (see Sect. 3.2) from T0−30 min to T0 highlights the greater turbulence strength associated with this gust front passage relative to the background flow (Fig. 3c). Immediately after the gust front, there was a relative drop in θv of almost 3 K at the surface and 2.5 K at hub height over the course of 10–15 min, alongside intense rainfall up to 18 mm h−1, which lasted until T0+25 min (Fig. 3d). Wind speeds quickly subsided with the near-surface stabilization, while wind direction and ε more gradually shifted back towards their pre-event values. After 1 h, the kinematic and thermodynamic near-surface atmosphere remained altered from the pre-event environment, though changes beyond about T0+30 min were likely also impacted by subsequent convection occurring on this day.
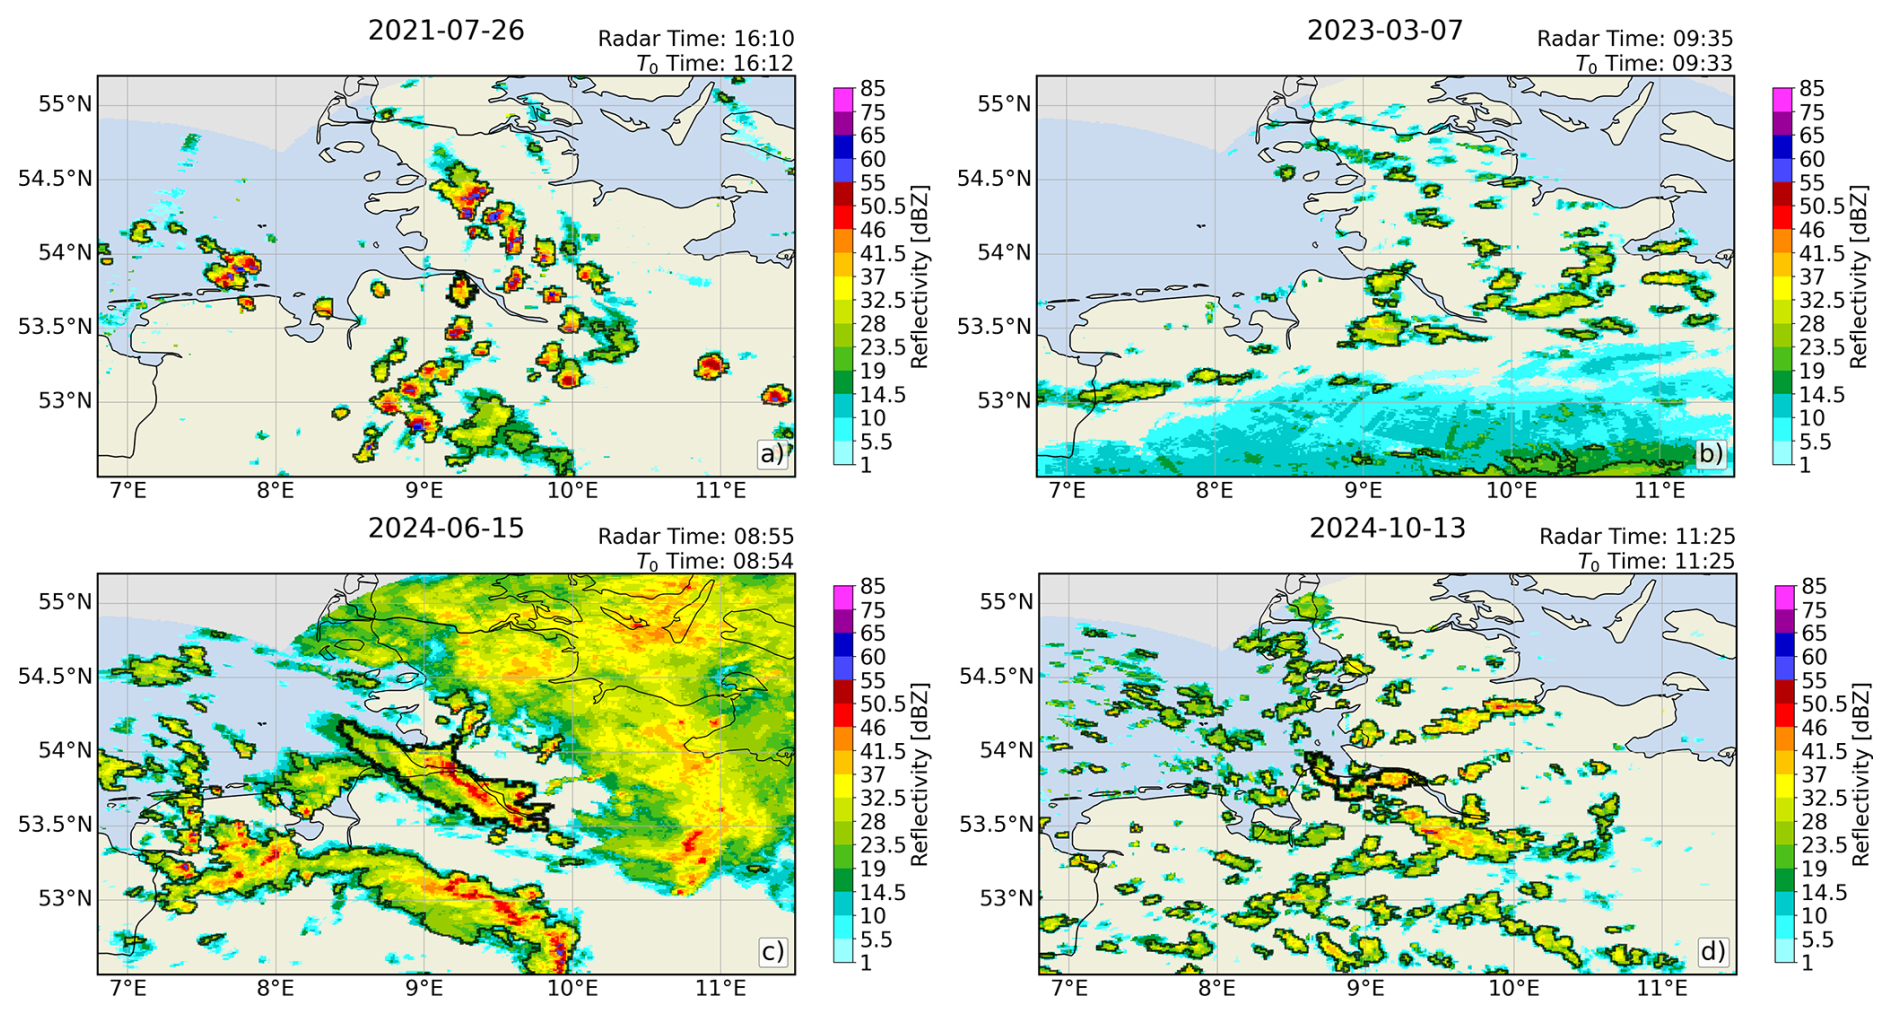
Figure 2Snapshots of convection situations over northern Germany centered on WiValdi, showing the radar reflectivity (dBZ, colors) for four parent convective cells that represent the convection variability associated with the detected cold-pool cases. Black contours denote polygon outlines for tracked cells. Bolded polygon outlines reflect when a tracked cell overlaps with WiValdi (a, c, d).
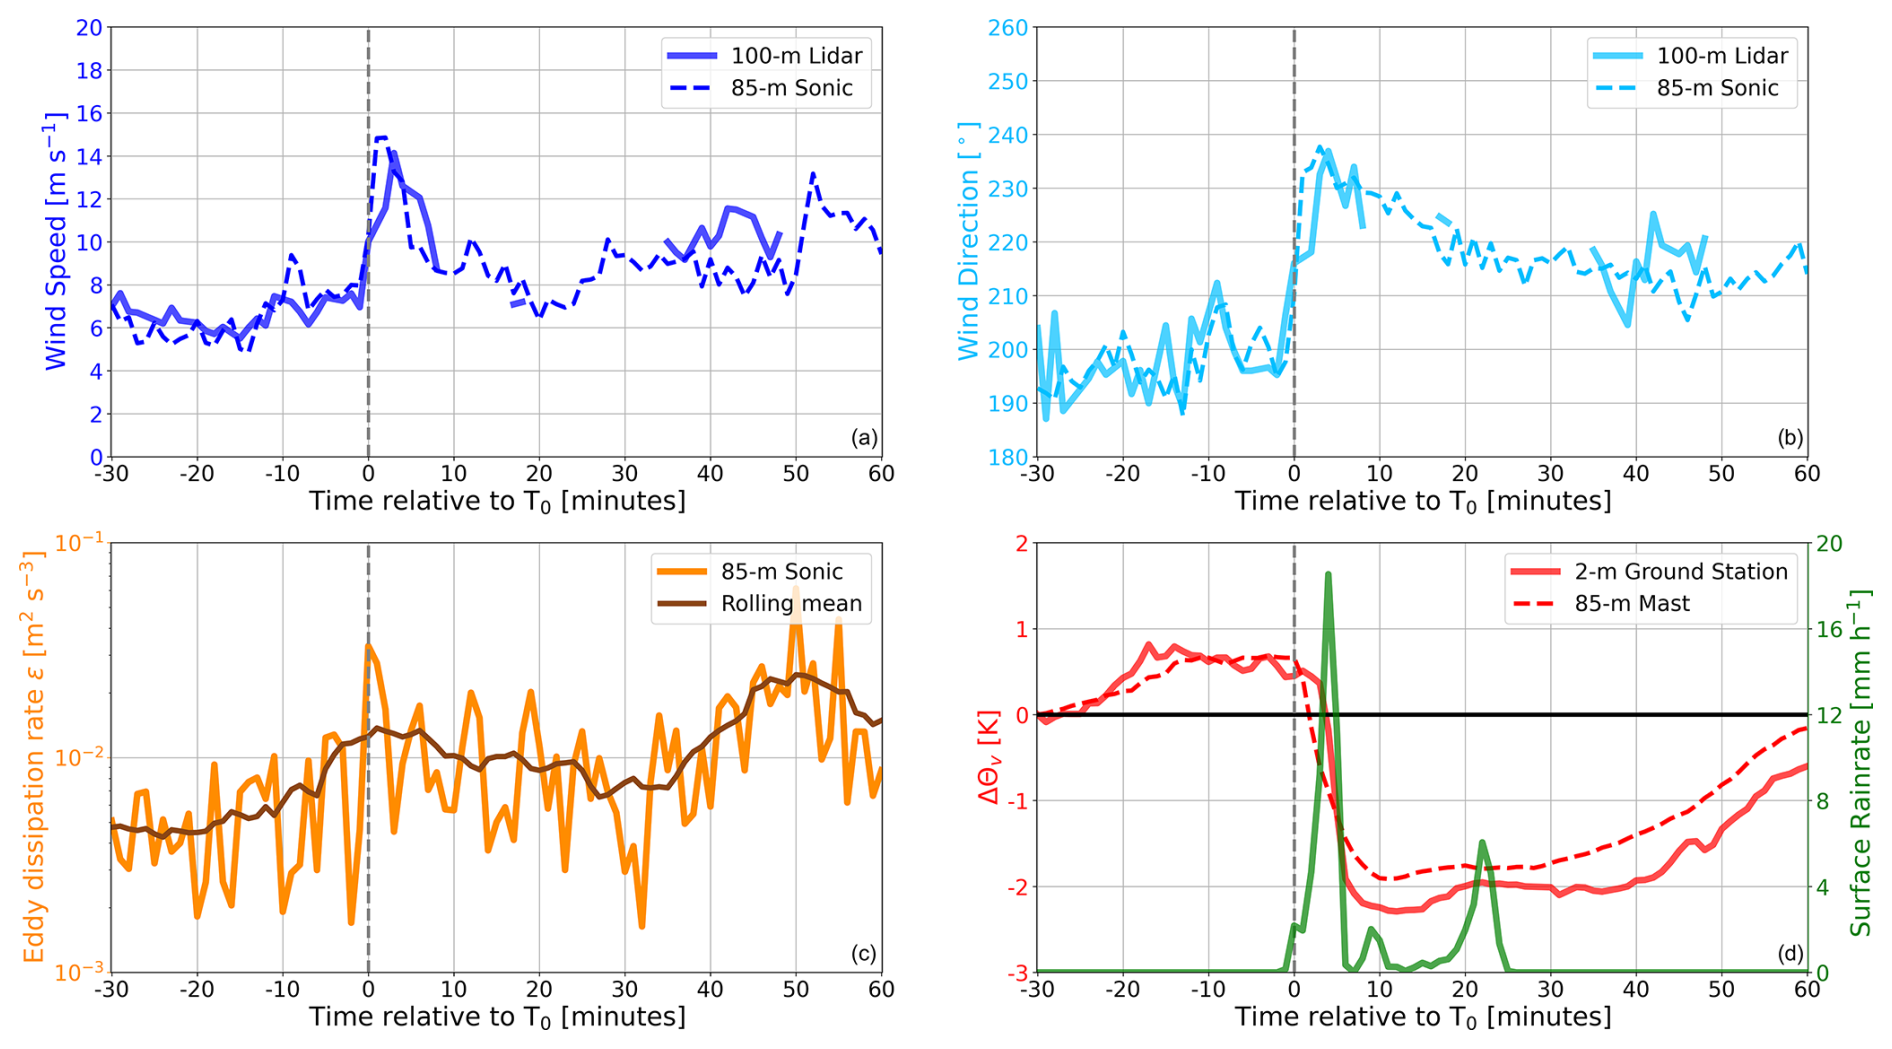
Figure 3Case study on 15 June 2024 for T0 = 08:54 UTC. (a) Wind speed (m s−1; dark blue), (b) wind direction (°; light blue), (c) TKE dissipation rate ε (m2 s−3; orange), and (d) Δθv (K; red) and rainfall (mm h−1; green). Solid colored lines indicate 100 m lidar (a–b), 85 m sonic (c), and 2 m ground station (d) data. The solid brown line in (c) is the 11 min rolling mean ε. Dashed colored lines indicate 85 m sonic (a–b) and 85 m mast (c) observations. Lidar data with a signal-to-noise ratio below −25 and above 0 dB have been excluded from (a) and (b).
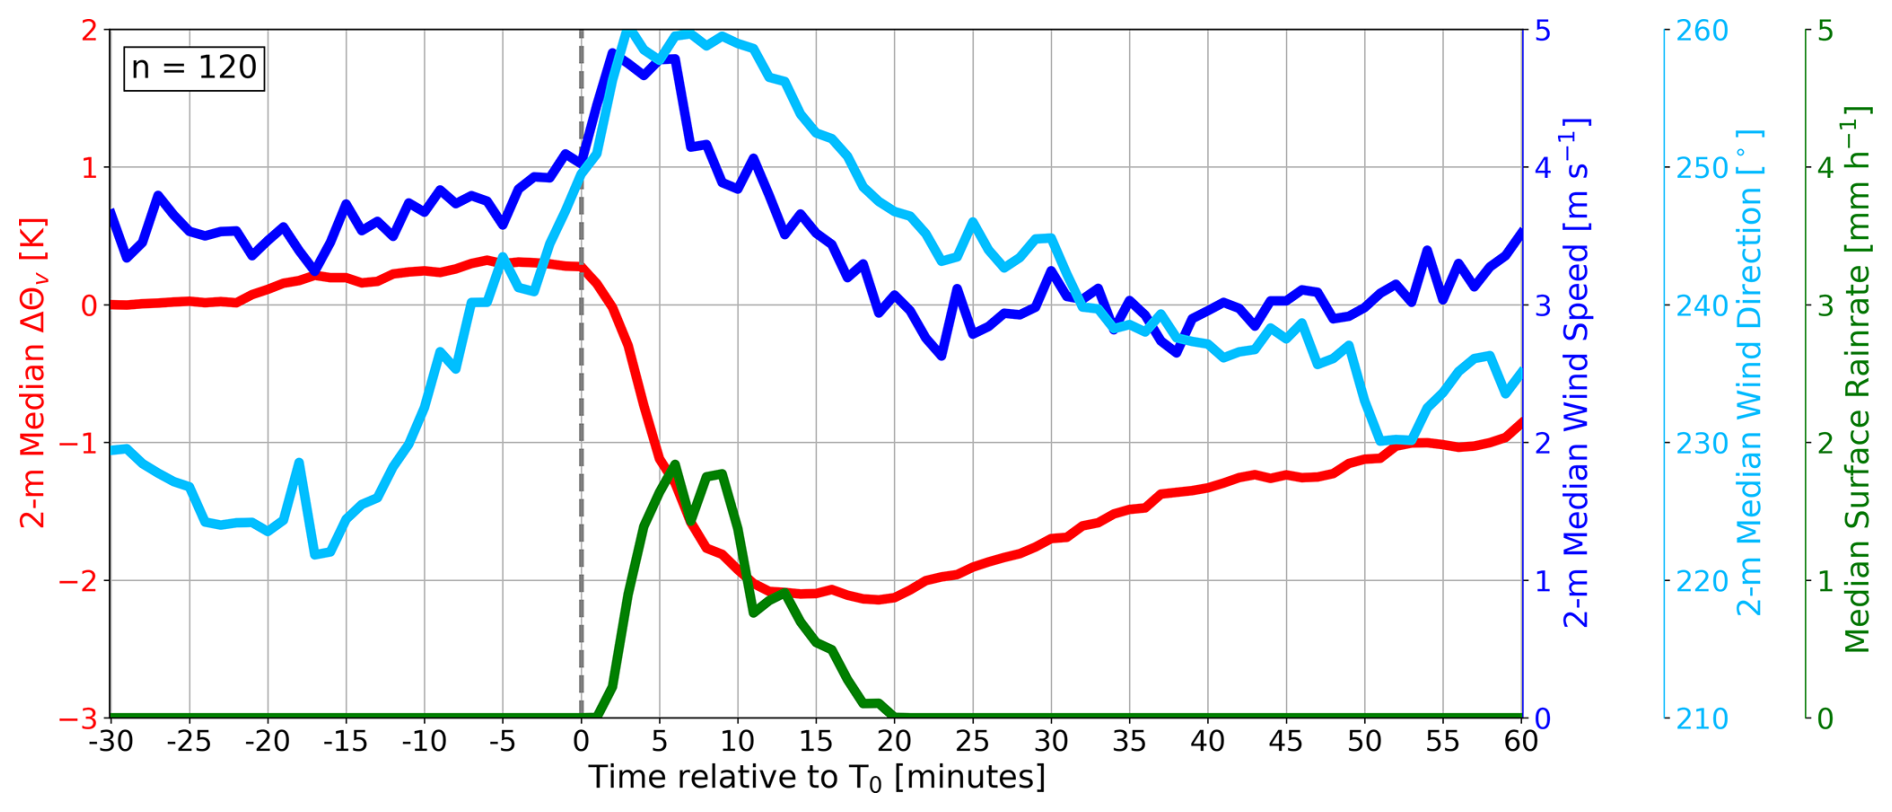
Figure 4Median near-surface characteristics of the detected cold-pool cases, as measured by the 2 m ground station attached to the MWR relative to T0 (dashed gray line), in terms of Δθv from T0−30 min (K; red), wind speed (m s−1; dark blue), wind direction (°; light blue), and rainfall (mm h−1; green). Detected cold-pool sample size is given in the upper-left corner.
To gain an understanding of how the bulk near-surface atmospheric conditions change during the cold-pool passages, we next examine median time series from the 2 m ground weather station observations (Fig. 4) for T0−30 min to T0+60 min. The median wind speed increases (dark blue) and the wind direction shifts more westerly (light blue) starting around T0−15 min, with a more rapid increase in wind speed after T0−5 min. This closely follows the temporal evolution of wind speed observed by Kirsch et al. (2021), with a relative increase of 1–1.5 m s−1 by T0+5 min being similar to their 2 m relative increase of 1.5 m s−1. The median surface wind direction shifts towards westerly by up to 40° during the detected events. With T0−30 min being a proxy for the pre-event environment, we find a median relative decrease in θv of 2.7 K (red) during the cold-pool passages that occurs in the span of ∼ 20 min, starting at T0−5 min and reaching a minimum around T0+15 to T0+20 min. As in Kirsch et al. (2021), the θv drop onset slightly precedes T0 by a few minutes due to our chosen detection thresholds. Shortly after this onset, measurable rainfall is observed, which peaks near 2 mm h−1 and lasts ∼20 min. With a surface wind speed increase, wind direction shift, θv decrease, and measurable rainfall, the quintessential convective cold-pool characteristics are observed at WiValdi.
After the cold-pool gust front passage, which is strongly indicated by the rapid wind speed increase and θv drop onset at T0−5 min, the near-surface wind speed gradually weakens to below the pre-event value, and the near-surface wind direction gradually shifts back towards ∼ 230° as the cold-pool interior and parent convective cell pass by. The near-surface θv similarly recovers towards its pre-event state, though notably remains 1 K colder by T0+60 min than at T0−30. This may suggest that cold pools still propagate past WiValdi even 1 h after the leading gust front or, at minimum, that there is a lasting effect from the observed cold pools on the near-surface environment of at least 1 h. Kruse et al. (2022) noted that temperature recovery typically occurred only after 2 h for their cases in the Netherlands. So, while the kinematic changes accompanying the gust front are rapid (5–10 min) and would thus likely have an impact on turbine structural loads, the thermodynamic environment changes more gradually, with longer-lasting implications for turbine wakes and power generation.
3.2 Hub height
Moving above the surface to turbine hub height, we want to quantify how much the kinematic and thermodynamic environment changes from the pre-event state. For wind speed and direction (Fig. 5a–b), we perform comparisons between 100 m lidar winds and an 85 m sonic on the inflow meteorological mast (west of T1), noting a decreased sample size of detected cold-pool events from those observed by the ground station (Fig. 4). Both measurement systems similarly find a relative wind speed increase of 4 m s−1 on top of the background flow that peaks around T0+5 min (Fig. 5a), with recovery to the pre-event wind speed typically by T0+20 min. The 10th and 90th percentiles show a similar spread of wind speed changes, indicating that the 1 min lidar scans are able to reasonably capture both the median and the range of observed cold-pool-associated hub-height wind speed variations. Of note, the timing of the gust front and recovery to the background flow, as captured by the sonic, tend to slightly precede those of the lidar by a couple of minutes, which can largely be explained by the ∼ 1 km instrument separation (with the more westward sonic likely being impacted by cold-pool passages before the lidar in most instances). Wind direction comparisons show similar agreement between the lidar and sonic (Fig. 5b). There is a peak wind direction change of +15° between T0 and T0+10 min, which then gradually decreases, though the median relative wind direction change for both instruments does not recover to its pre-event value even after 1 h. Though there is a sample size difference between the sonic and lidar, the relative magnitude and spread of kinematic variations during cold-pool passages at WiValdi are remarkably consistent between the in situ and remote sensing observations.
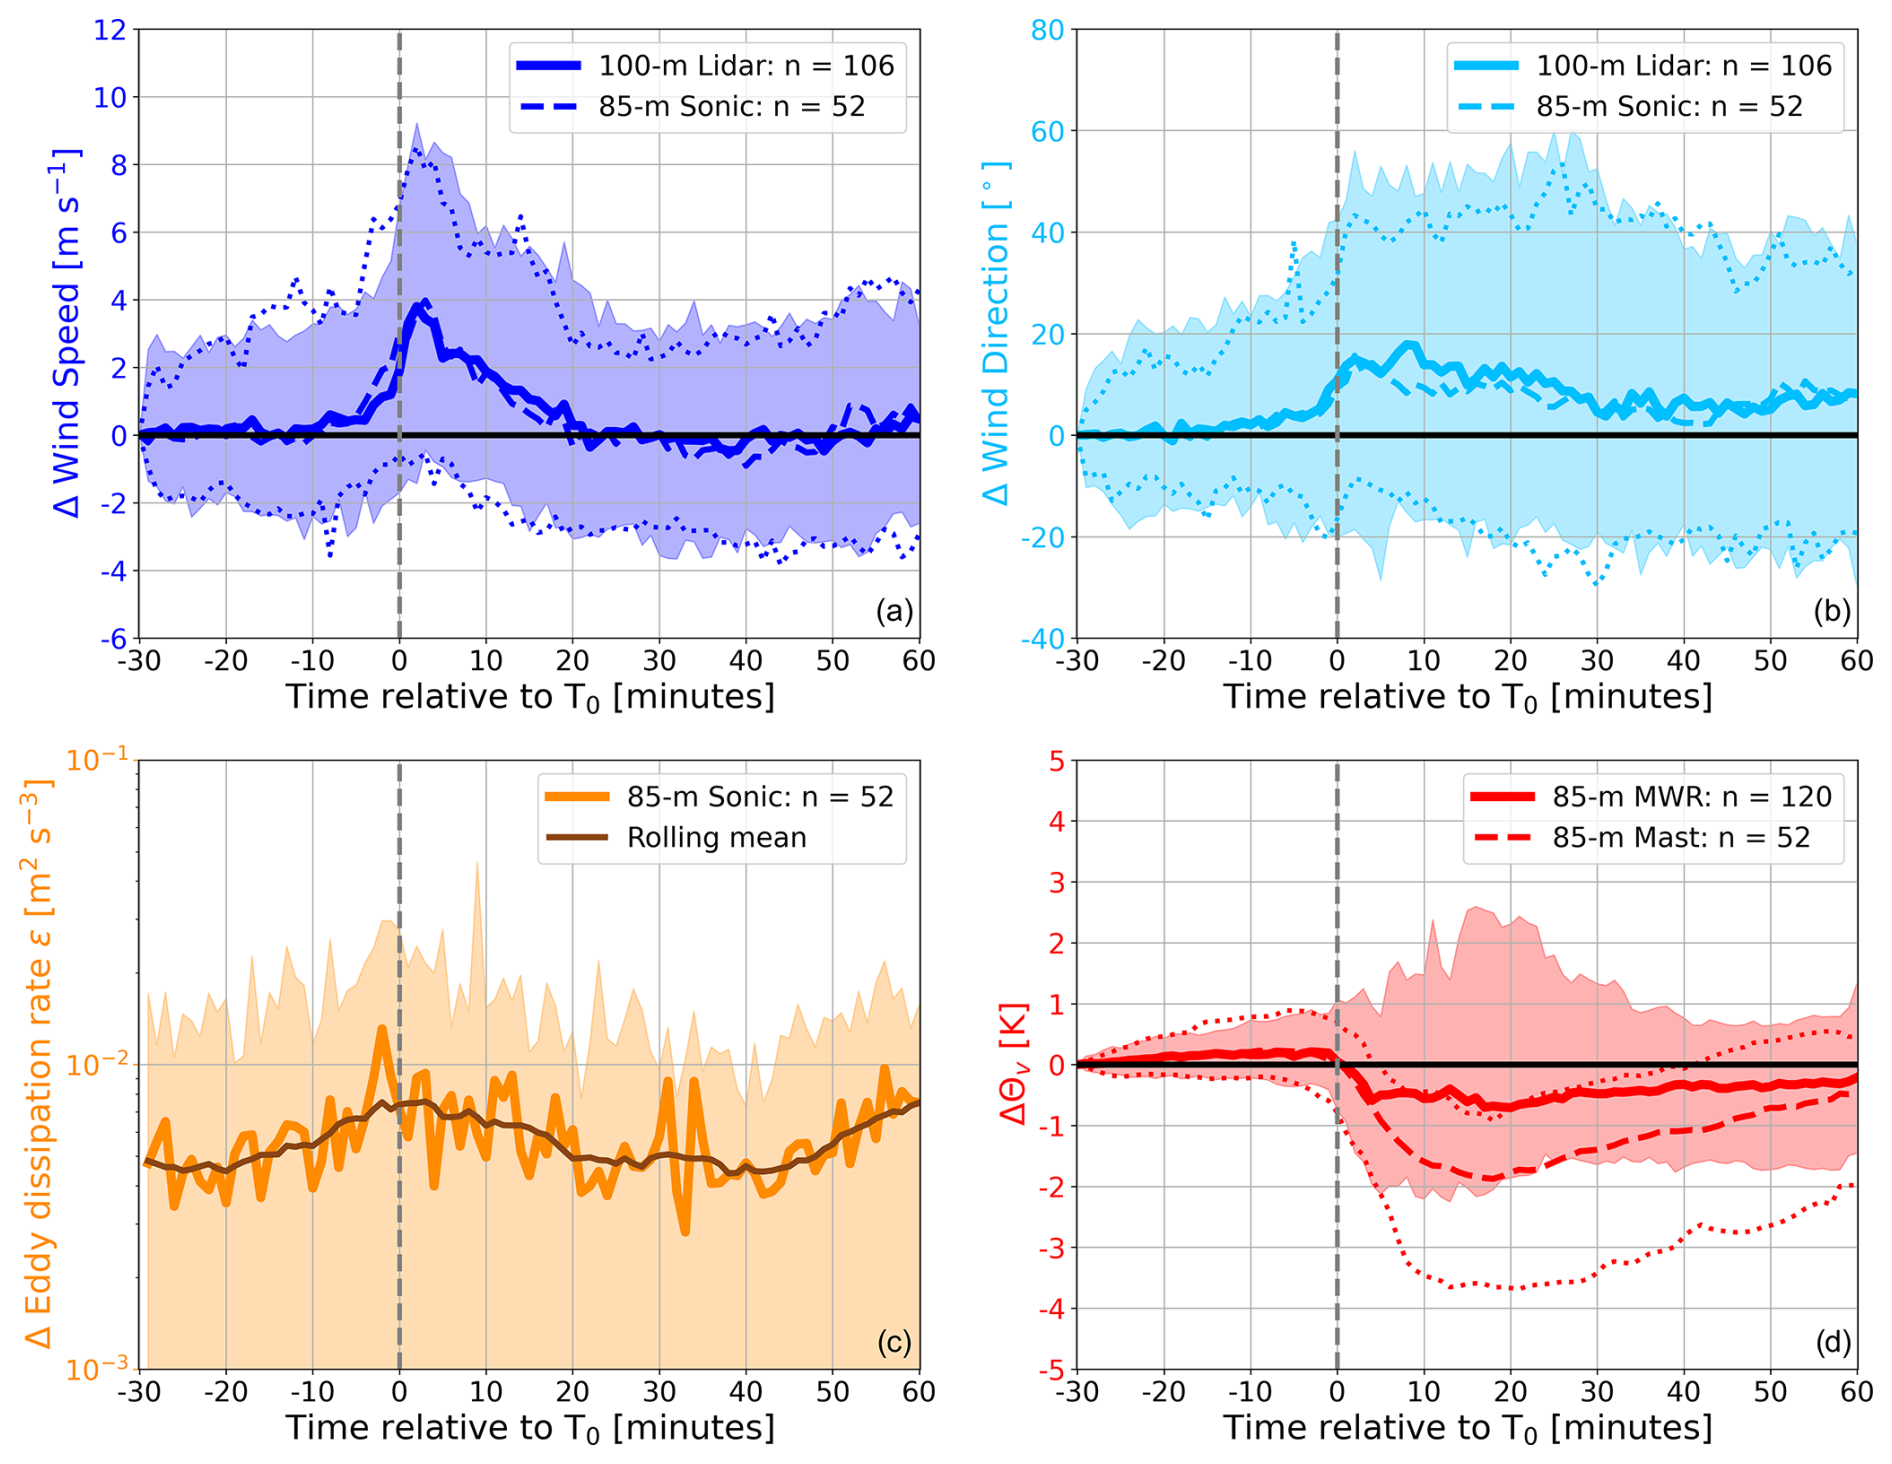
Figure 5Hub-height variations relative to the pre-event environment (T0−30 min) and relative to T0 (dashed gray line) for (a) wind speed (m s−1; dark blue), (b) wind direction (°; light blue), (c) TKE dissipation rate ε (m2 s−3; orange), and (d) θv (K; red). Solid colored lines indicate 100 m lidar (a–b), (c) 85 m sonic ε, and (d) 85 m MWR, while dashed colored lines in (a–b, d) indicate 85 m in situ inflow mast observations. The solid brown line in (c) is the 11 min rolling mean ε; otherwise the darker solid and dashed colored lines indicate median values. Shading and thinner dashed colored lines indicate the 10th–90th percentile spread. Detected cold-pool sample sizes are given in the upper-right corner for each instrument.
As past cold-pool studies have noted an increase in turbulence associated with the gust front (Droegemeier and Wilhelmson, 1987; Lombardo et al., 2014; Canepa et al., 2020) and since turbulence strength correlates with stability regime and impacts turbine structural stress (e.g., Abkar and Porté-Agel, 2014; Englberger and Doernbrack, 2018), assessing short-term variations in turbulence is relevant for both convective cold pools and wind energy applications. The TKE dissipation rate ε is a metric for quantifying the turbulence strength and is estimated herein every 1 min using high-frequency (20 Hz) observations from the 85 m sonic on the inflow mast. Following Bodini et al. (2019), the theoretical turbulence model of Kolmogorov (Kolmogorov, 1941) is fit to the second-order structure function calculated from the sonic data using a range of time lags τ between 0.15 and 1.05 s. Data inspection confirms that the sonic measurements within this time interval closely follow the Kolmogorov slope () and hence lie within the inertial subrange of the turbulence energy spectrum. During the detected cold-pool passages, there is a relative increase in median ε from the pre-event environment up to 10−2 around T0, indicating an increase in turbulence strength associated with the cold-pool gust front (Fig. 5c). As turbulence tends to be greater during daytime hours and summertime months (Bodini et al., 2019), which is also when most thunderstorms and thus convective cold-pools would occur, the positive change in ε during the gust front would be in addition to this greater background turbulence pattern. After T0, there is a decrease in ε, coinciding with the subsidence in wind speeds (Fig. 5a) and cooling of the near-surface atmosphere (Fig. 5d).
In contrast to the kinematic variations (Fig. 5a–b), the hub-height thermodynamic variations have noticeable disagreements in terms of θv between 1 min inflow mast instrumentation and 1 min MWR zenith retrievals at 85 m (Fig. 5d). While the median and 10th–90th percentile spread of relative θv changes follow a similar trend until the θv drop onset, a sizable proportion of MWR profiles remains warmer than the pre-event environment after T0, in contrast to the in situ observations. The 85 m MWR measurements are able to capture the first minutes of cooling after the gust front passage, but then the median values from the mast and MWR deviate from each other starting around T0+5 min after a relative cooling to −0.5 K. The median mast observations indicate additional cooling to nearly −2 K by T0+20 min, while the MWR profiles remain largely constant. This decrease in median mast θv at 85 m (Fig. 5d) shows a slightly weaker signal than near the surface (Fig. 4), which is consistent with previous studies (e.g., Kirsch et al., 2021). As surface rainfall rates also typically increase within this time period from T0+5 to T0+20 min (Fig. 4), it is likely that raindrops on the MWR radome interfere to some extent with the zenith retrievals for the measured frequencies in the microwave spectrum, particularly those in the water vapor absorption band. Foth et al. (2024) note that MWR retrieval algorithms generally decrease in accuracy for greater rainfall rates, with the zenith elevation angle having the largest positive brightness temperature biases (>3 K) across most measured frequencies compared with lower elevation angles. Additionally, as the thermodynamic vertical gradient between the surface and turbine hub height also increases between T0 and T0+20 min (see Fig. 7) and since MWR zenith scans are less capable of capturing large vertical gradients, the MWR is expected to have less accuracy during the time period of greatest cooling, even if rainfall did not occur. Both measurement systems show some recovery towards the pre-event state after T0+20 min, though the MWR observations for most detected cold-pool cases tend to have a persistent warm bias through T0+60 min. Overall, the meteorological mast shows good agreement with the temporal evolution of θv given by the ground station (Fig. 4), while the MWR profile measurements tend to underestimate the observed cooling within the cold-pool interior. As such, we exclude the MWR profiles from our subsequent analyses.
As the wind speeds induced by cold pools often maximize above the surface within the height range of onshore wind turbines, we isolate the vertical structure associated with the peak gust front strength, as shown in Figs. 4 and 5, using vertical profiles up to 1 km height averaged from T0 to T0+5 min. Vertical profiles of relative wind speed from the lidar (Fig. 6a) highlight the increased winds associated with the cold-pool gust front, with the largest relative increases occurring just above 100 m. The median wind speed shows a relative increase from the pre-cold-pool environment up to about 800 m height, which provides a rough estimate for the median gust front depth at WiValdi. The relative wind direction profiles indicate a maximum shift of +15° (e.g., more westerly on average) also around 100–150 m height (Fig. 6b), with lower heights still typically exceeding +10°. As the median relative wind direction vertical profile shows a positive wind direction shift up to 700 m height, this provides additional support for an approximate cold-pool gust front depth of between 700–800 m. Notably, Kirsch et al. (2021) found an estimated median cold-pool depth of 750 m near Hamburg using perturbation pressure extrapolation of mast data, which closely aligns with the zero-crossing height of the kinematic relative vertical profiles using the lidar at WiValdi.
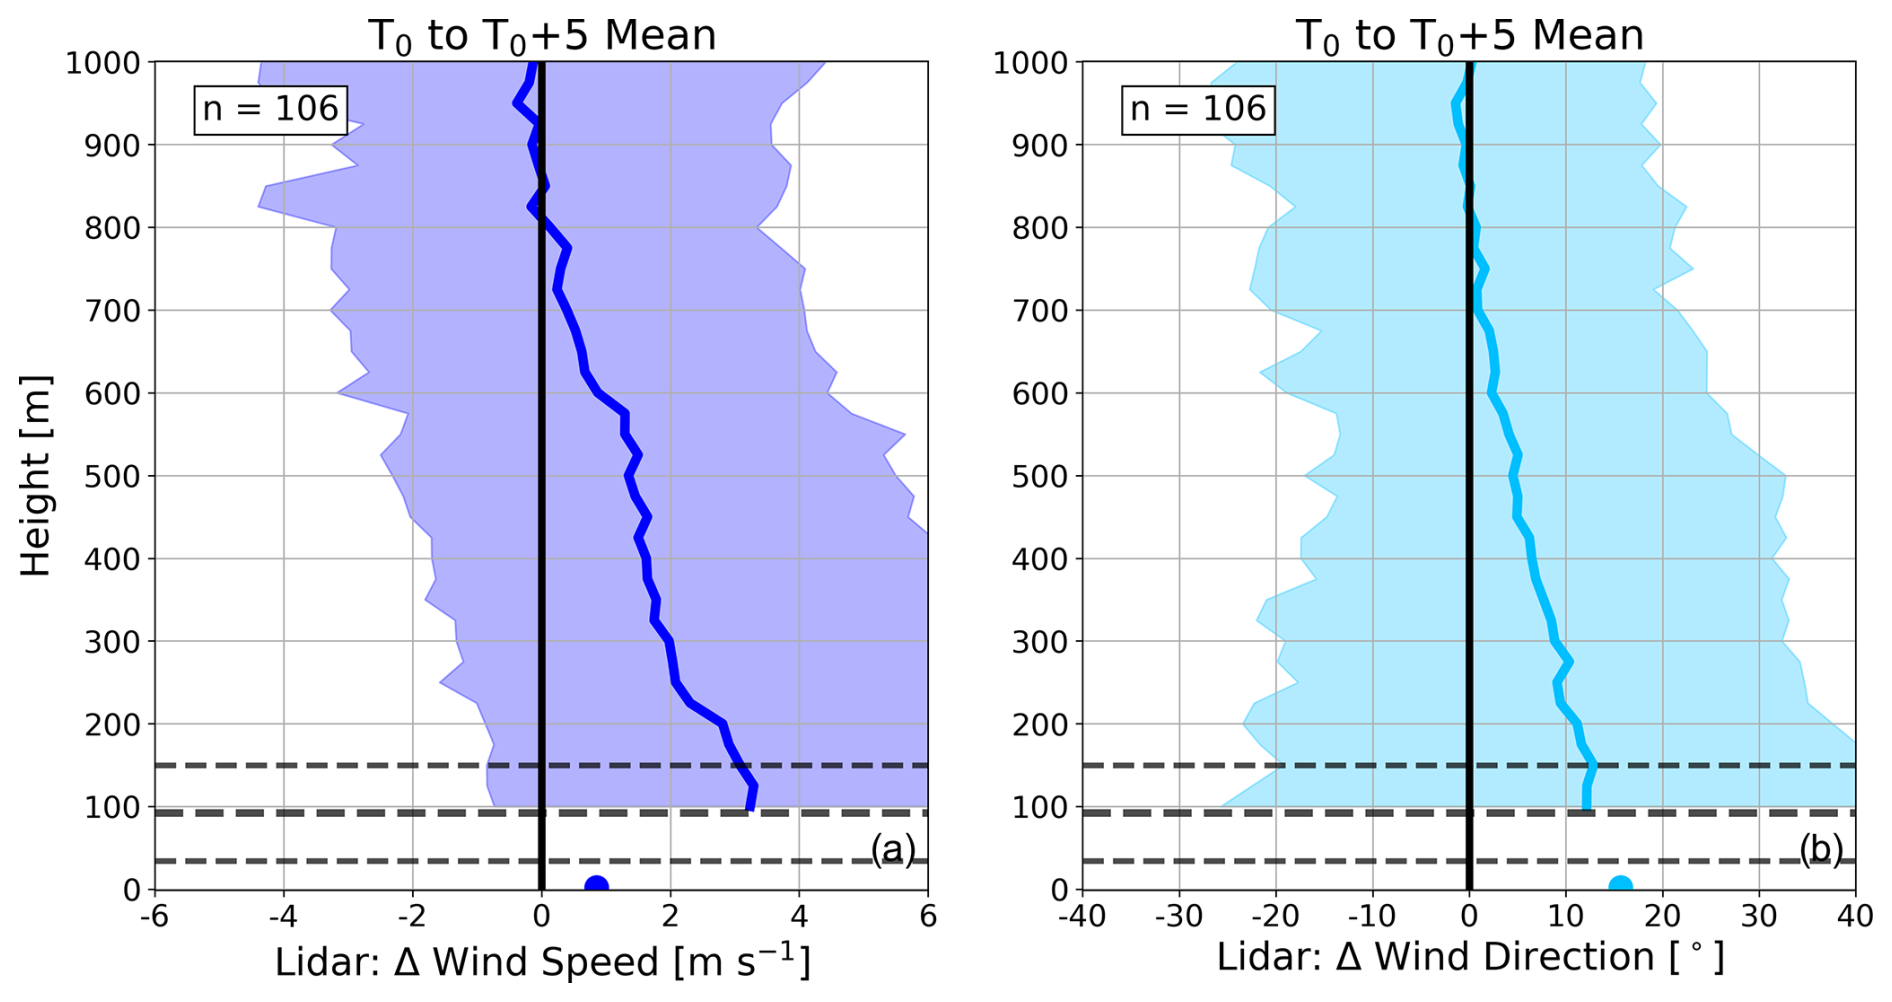
Figure 6Mean vertical profiles over the given time periods relative to the pre-event environment (T0−30 min) for (a) wind speed (m s−1; dark blue) and (b) wind direction (∘; light blue). Dots correspond to the median 2 m ground station observations averaged over the given time periods. Solid colored lines indicate the median conditions, while shading indicates the 10th–90th percentile spread. Horizontal dashed black lines indicate the turbine bottom (34 m), hub (92 m), and top (150 m). Detected cold-pool sample size is given in the upper-left corner.
Focusing on the height region of the WiValdi turbines, we want to obtain a more detailed understanding of the vertical profile variations associated with the detected convective cold pools. There is a more limited sample size when all inflow mast instrumentation heights are available (Table 1), but the mast provides sufficient context for comparing with the remote sensing vertical profiles. A typical gust front peaks in strength around the turbine hub height at +3 m s−1 (Fig. 7a), exhibiting a nose shape within the turbine rotor layer (34–150 m; dashed black lines), as has been observed by past work on convective winds (Lombardo et al., 2014; Gunter and Schroeder, 2015; Canepa et al., 2020), with the vast majority of WiValdi cases showing increased wind speeds compared with the background flow. Indeed, both Kirsch et al. (2021) and Kruse et al. (2022) similarly observe positive wind speed perturbations associated with cold-pool gust fronts maximizing around 100 m. While it appears that some gust fronts at WiValdi do not cause an increase in wind speed, this is actually a result of kinematic variations between T0−30 and T0 (see 10th percentile in Fig. 5a), which complicates the quantification of localized relative wind speed changes during the short time period of the gust front passage. Nevertheless, there is good agreement in the vertical shape and spread of wind speed above hub height for the mast and lidar, further validating the remotely sensed wind speeds. Notably, the mast data capture a greater wind speed change with height over the lower half of the rotor layer than over the upper half. For the relative wind direction (Fig. 7b), a peak of +15° occurs close to the surface, in contrast to the wind speed peak that occurs near hub height. The lidar relative wind direction changes between about 100–150 m are roughly comparable to the mast observations between these heights, qualitatively indicating that the lidar captures the maximum wind direction changes accompanying the gust front reasonably well. While there is a slightly greater wind direction change over the lower half of the rotor layer, similar to the wind speed, the difference from the upper half is not quite as significant. The “nose” in θv (Fig. 7c), with a smaller relative change at hub height compared to above and below, corresponds to the nose-like shape found in the wind speeds. Kirsch et al. (2021) find a similar “nose” in θe at 110 m using mast observations at specific heights near Hamburg; however, this thermodynamic feature is not observed by Kruse et al. (2022) for cold pools over the Netherlands. We speculate that a θv “nose” could perhaps be a manifestation of increased mixing in the gust front nose with the warmer background air ahead of the advancing cold pool, but we can not definitively identify the cause of this thermodynamic “nose” feature, and so we leave this determination to future work.
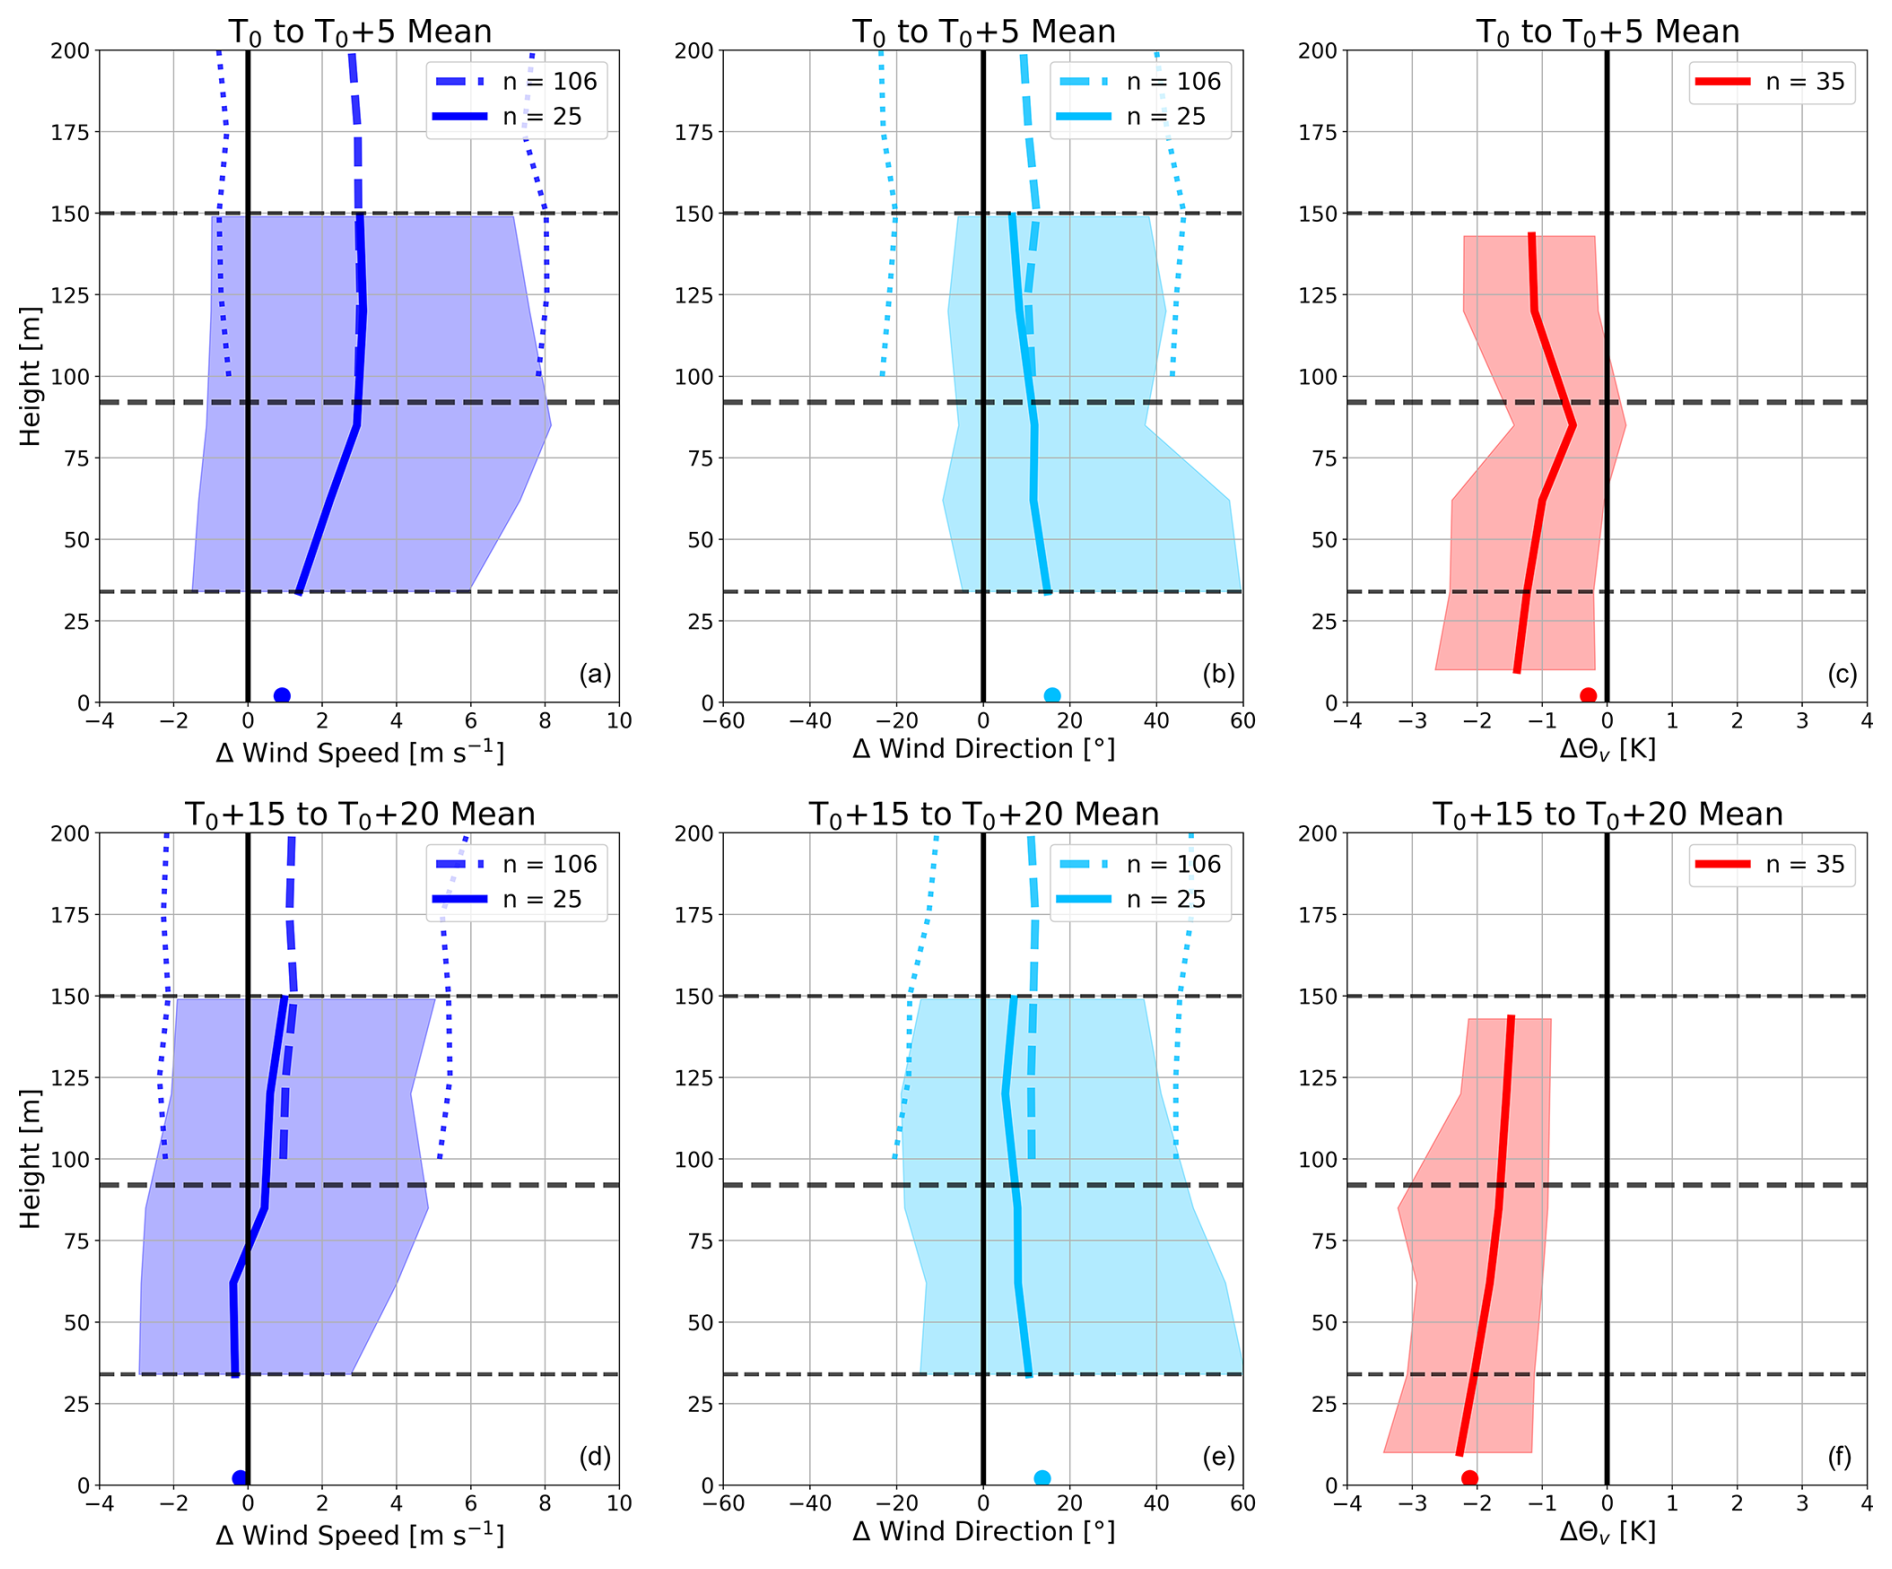
Figure 7Mean vertical profiles within the turbine rotor layer over the given time periods for (a, d) wind speed (m s−1; dark blue), (b, e) wind direction (°; light blue), and (c, f) θv (K; red) changes relative to T0−30 min using inflow mast (solid) and lidar (a–b, d–e; dashed) measurements. Horizontal dashed black lines indicate the turbine bottom (34 m), hub (92 m), and top (150 m). In situ ground station measurements are shown as dots at 2 m. Median values are shown in bold and thicker dashed colored lines, with the 10th and 90th percentiles shown in shading and smaller dotted colored lines. Detected cold-pool sample sizes per instrument are given in the upper-right corner.
By the time of maximum cold-pool cooling (T0+15 to T0+20 min), the wind speeds have largely relaxed back towards the pre-event flow below hub height, though they remain increased by 1 m s−1 at the turbine top (Fig. 7d). The wind direction adjustment is comparatively more subtle, with some reduction in direction shift (Fig. 7e) but still being 5–10° more westerly on average from T0−30 min throughout the rotor layer, indicating that the wind direction typically takes longer to recover than the wind speed after cold-pool gust front passages. Since the gust front time period (Fig. 7c), the relative θv shows greater cooling at all mast heights (Fig. 7f), being the greatest near the surface at −2 to −2.5 K, in agreement with the known vertical structure of the cold-pool thermodynamical signal (e.g., Barnes and Garstang, 1982; Kirsch et al., 2021). The 1 min ground station observations seem to adequately capture the short-term environmental variations associated with the cold pools, with the possible exception of the initial near-surface θv drop (Fig. 7c), which is due to the inflow mast being impacted by the cold pool before the ground weather station (Fig. 1b). The observed rotor-layer cooling suggests stabilization throughout the profile within the cold-pool interior, which is explicitly quantified in the following section.
Now that we have examined how the temporal evolution and vertical structure of the background kinematic and thermodynamic environment are affected by convective cold pools at WiValdi, we next investigate variations in more derived quantities that affect power output and structural loads across the rotor layer associated with cold-pool passages using inflow mast observations. As indicated by the wind speed nose near hub height around T0 to T0+5 min (Fig. 7a), there is increased lower-rotor-layer shear from the pre-event environment of 1.5 m s−1 (over a depth of 51 m) associated with the gust front alongside comparatively negligible changes in upper-rotor-layer shear (Fig. 8a). Therefore, the total-rotor-layer shear changes (over a depth of 115 m) induced by the cold-pool gust front are almost exclusively encapsulated by shear changes below hub height. Upper-rotor-layer shear increases more thereafter, peaking at 1 m s−1 (over a depth of 64 m) about 30 min after the gust front. The total-rotor-layer shear remains increased by at least 1 m s−1 even 1 h after T0, indicating that relative increases in shear-induced loads on the turbines would likely persist well after the cold-pool leading edge. Similar to wind shear, the wind veer shifts the greatest around the time period of the gust front (Fig. 8b), noting that the relative wind veer is negative during WiValdi cold-pool passages owing to greater wind direction changes closer to the surface (Fig. 7b). Veer across the lower part of the turbine rotor peaks at −6° around T0, with the total-rotor-layer veer reaching −8° and the upper-layer veer peaking a few minutes later at −4°. Overall, the largest change in rotor-layer veer is associated with the cold-pool leading edge, but a median shift in rotor-layer veer of −4° remains even after 1 h. Given the “nose” in relative θv around turbine hub height (Fig. 7c), there is a relative increase in static stability of 14 K km−1 over the lower rotor layer and relative decrease in stability (greater instability) of 7 K km−1 over the upper rotor layer (143–85 m), associated with the cold-pool gust front (Fig. 8c). This asymmetric change in stability across the entire rotor layer continues until T0+15 min, but it is unclear how the turbine wake would behave in this complex stability regime environment. Over the course of a thunderstorm passage, there is a general trend towards increasing stability compared with the pre-event environment as the near-surface cooling persists, remaining 7 K km−1 more stable (0.8 K across the turbine rotor) after 1 h. This longer-term stabilization throughout the rotor layer would tend to lengthen turbine wakes in the streamwise direction (Abkar and Porté-Agel, 2014), increasing the potential for downstream turbines to experience velocity deficits, decreased turbulence, and less power production.
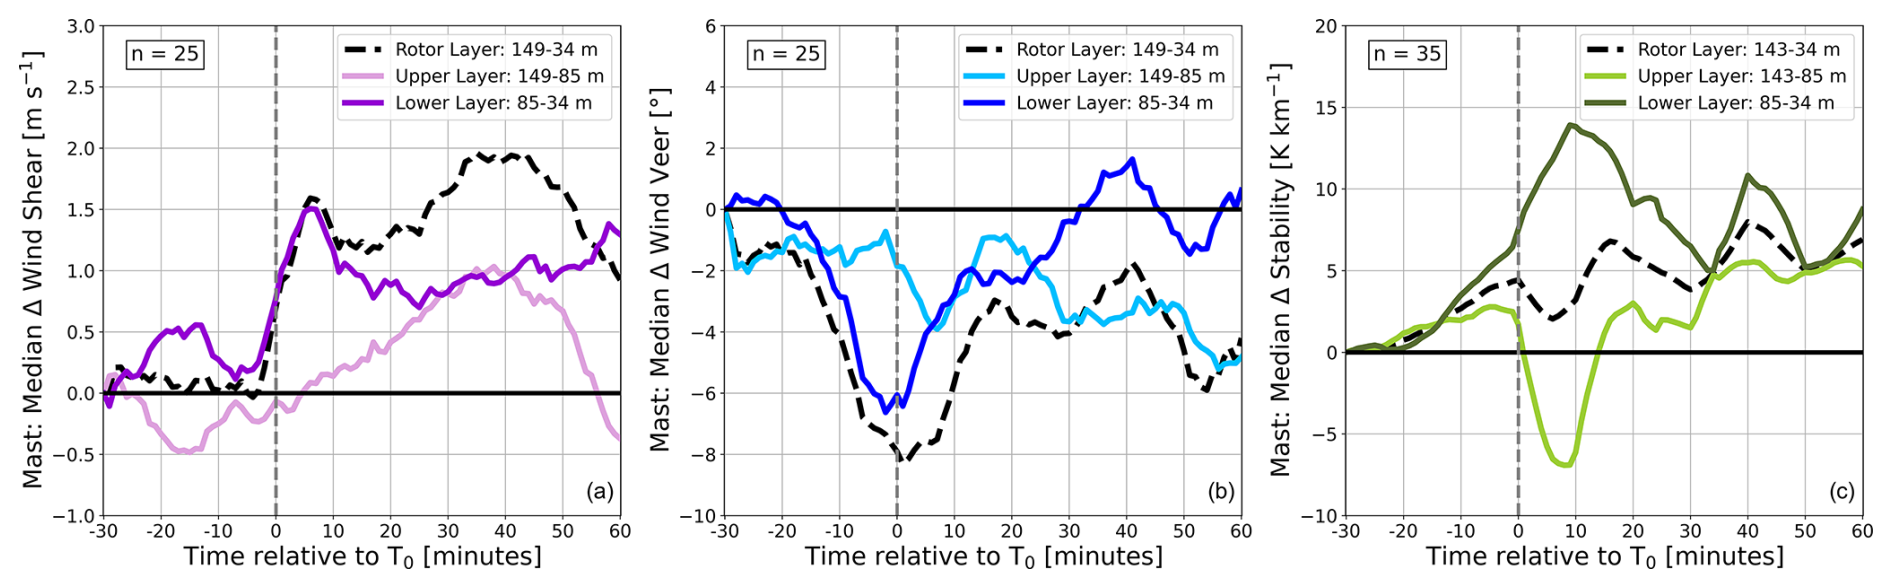
Figure 8Median changes in inflow mast (a) wind shear (m s−1), (b) wind veer (°), and (c) static stability (K km−1) relative to the pre-event environment (T0−30 min) over the lower layer (85–34 m; darker lines), upper layer (149–85 m, a–b, 143–85 m, c; lighter lines), and full rotor layer (149–34 m; dashed). Sample sizes are given in the upper-left corner.
Beyond shear and veer variations, we also seek to quantify the change in power generation that would be expected for a standalone turbine impacted by a cold pool. This has been modeled using a simple piecewise wind speed–power relationship (Wildmann et al., 2022), wherein the cut-in, rated, and cut-out hub-height wind speeds are provided alongside the maximum turbine power output to obtain the “estimated” power generation. Estimated power is taken to linearly increase between the cut-in and rated wind speeds (i.e., partial load range), and we do not consider impacts from turbine operational adjustments (e.g., pitching, yawing) on the power output. For the 4.2 MW WiValdi wind turbines, we have 2.5 m s−1 cut-in, 13.1 m s−1 rated, and 25 m s−1 cut-out wind speeds. With the 100 m lidar wind speeds being used as the hub-height wind input for this power estimate calculation, it is important to first determine where the background winds lie on the power curve to understand how much the subsequent cold-pool wind speed perturbations may cause fluctuations in power generation. The 100 m pre-event environment typically has wind speeds of 9 m s−1, with the 10–90th percentiles ranging from 4–15 m s−1 (Fig. 9a). Therefore, background hub-height winds are generally above the cut-in wind speed and within the partial load part of the power curve, indicating that most detected cold-pool gust fronts would likely cause an increase in power output. When considering the climatological wind speeds at WiValdi (dashed lines, Fig. 9a), the pre-event flow is already elevated, suggesting that convective conditions before the cold-pool time periods are already associated with a potential for greater-than-average power output. Lidar median wind speeds rise by 4 m s−1 in addition to the background flow during gust front passages (Fig. 5a), reaching the rated wind speed, and gust front amplitudes range from 3–6 m s−1. As noted by Kelly et al. (2021), wind ramps starting below the rated wind speed and ending above the rated wind speed significantly contribute towards increased turbine structural loads, which closely aligns with the typical WiValdi cold pool. Using the above-mentioned power estimation and 100 m winds, we estimate a median increase in power output up to 50 % around T0 to T0+5 min associated with the gust front (Fig. 9b). Estimated power increases can exceed 100 % (for cases starting from weak background flow), and power generation remains larger than the pre-event environment for about 30 min. We have a limited sample size of observed power output during the detected cold pools, but power observations from the westernmost WiValdi turbine (T1; Fig. 1b) during warmer months in 2024 broadly agree with having a significant peak associated with the gust front and increased power lasting about 30 min. After the gust front maximum, there is some indication of a relative reduction in observed wind power compared with the pre-event state, likely stemming from a relative decrease in hub-height wind speeds alongside the near-surface atmosphere stabilization. As the observed power changes are complicated by continued turbine testing during the available time period and since this turbine was not always allowed to produce up to the rated power output, a larger observed power climatology in the future is needed to more reliably contextualize the estimated power generation. Nevertheless, we determine that noteworthy wind power increases would be expected for T1 due to the majority of cold-pool gust fronts in the vicinity of WiValdi.
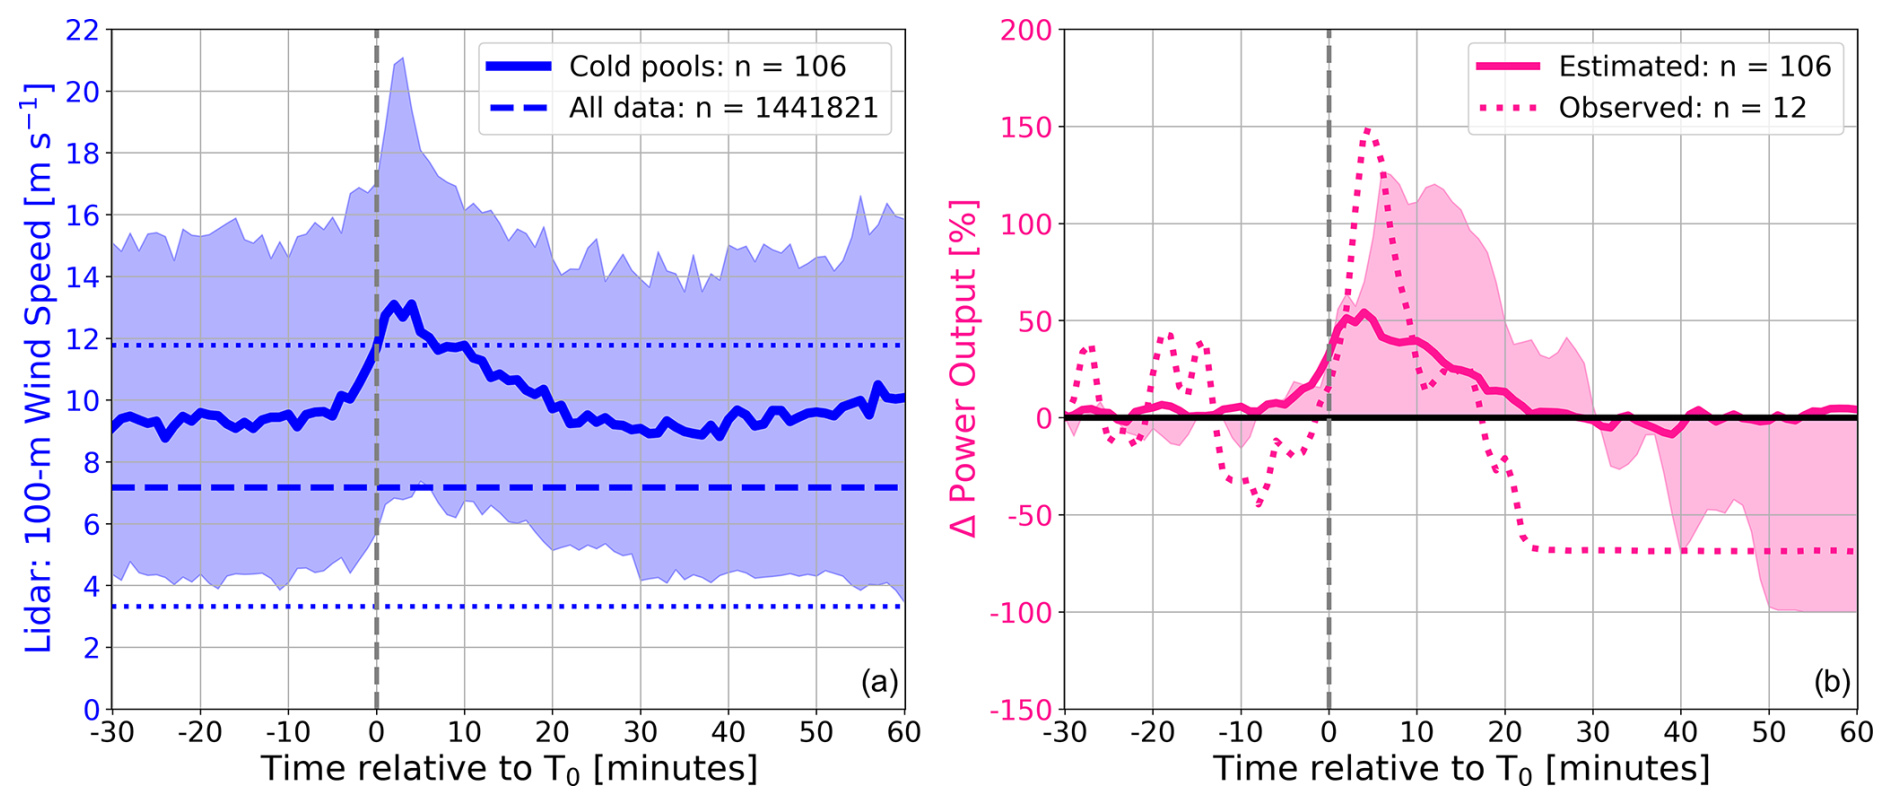
Figure 9Time series relative to T0 for (a) 100 m lidar wind speed (m s−1; dark blue) and (b) power output change relative to T0−30 min (%; pink). Solid lines indicate (a) median wind speeds around cold-pool time periods and (b) median estimated power change. Thicker dashed lines indicate (a) 100 m climatological median wind speed and (b) observed median power change for the T1 turbine, with shading in (a, b) and thinner dashed lines in (a) indicating the 10–90th percentile spreads. Sample sizes are given in the upper-right corner.
With the increasing amount of wind energy in Germany and remaining uncertainties regarding wind power prediction, it is crucial to better understand how particular atmospheric phenomena can impact wind turbines. Past literature has identified deep convection as one such phenomenon linked to wind power prediction errors (Steiner et al., 2017), with the associated convective outflow (i.e., cold pool) causing rapid changes in boundary-layer winds that are notoriously difficult for conventional forecasting models to characterize with sufficient spatial and temporal accuracy. To this end, we quantify the impact of convective cold-pool passages on short-term environmental variations near two utility-scale onshore wind turbines in northern Germany at DLR's WiValdi research wind park. We make extensive use of 1 min meteorological mast and remote sensing vertical profiles (Doppler wind lidar, MWR) in order to reliably capture the minute-scale ramp-up of thunderstorm winds (Lombardo et al., 2014) and associated thermodynamic fluctuations. Cold-pool events are identified from ground weather station data using thresholds for a continuous decrease in near-surface virtual potential temperature (θv), a positive daily wind anomaly, and measurable rainfall following the methodologies of Kirsch et al. (2021) and Kruse et al. (2022). Of note, we define “T0” as a proxy for the start of the cold-pool passage, similar to Kirsch et al. (2021), though the actual cold-pool leading edge would precede this time by a few minutes due to the chosen threshold criterion. With the 120 detected cold-pool cases across 4 years (November 2020–November 2024), we primarily focus on kinematic and thermodynamic changes within the turbine rotor layer (34–150 m) associated with the cold-pool leading edge (i.e., gust front) and the subsequent thermal stabilization within the cold-pool interior.
A typical WiValdi convective cold pool follows the quintessential sequence of environmental changes: surface wind speeds increase, and the wind direction shifts for a few minutes before a drop in near-surface θv, which is then followed by rainfall 5–10 min later that peaks near 2 mm h−1. Of greater importance for wind energy is the fact that the median wind speeds increase relatively by up to 4 m s−1 just above 100 m height compared with the pre-event flow (taken as T0−30 min) during the time period from T0 to T0+5 min, with a relative increase in wind speeds for about 30 min. The hub-height wind direction shifts more westerly on average than the background flow by +15°, with full recovery to the background wind direction not reached even after 1 h. Turbulence strength, which we quantify using the dissipation rate of turbulent kinetic energy calculated from high-frequency ultrasonic anemometer measurements, similarly shows a relative increase around the gust front time period. After the kinematic variations associated with the passage of the cold-pool gust front, the near-surface atmosphere cools for 20 min until reaching a minimum relative θv decrease of −2.7 K from its maximum value, with a relative decrease of −0.5 to −1 K still remaining after 1 h. We determine that the gust front ramp-up starts from T0−5 to T0 min and peaks from T0 to T0+5 min, while the minimum θv (i.e., maximum cooling), which would be approximately the cold-pool center (Kirsch et al., 2024), is reached by T0+15 to T0+20 min. This yields a time from the cold-pool leading edge to the cold-pool center of the order of 20–25 min. The peak wind speed and maximum cooling time periods are used for subsequent analyses to isolate the largest environmental changes associated with the cold-pool passages.
Using available vertical profiles from a Doppler wind lidar for 106 of the 120 cases, we estimate a median cold-pool depth of 700–800 m, over which relative kinematic changes induced by the cold-pool gust front are detectable. This is in good agreement with a median cold-pool depth of 750 m found by Kirsch et al. (2021) using pressure perturbation extrapolation of meteorological mast data and highlights that a typical cold-pool depth would exceed the height of current onshore wind turbines. As this lidar can not provide consistent temporal coverage below 100 m height due to the scanning pattern, we leverage in situ instrumentation on an inflow meteorological mast to provide greater vertical coverage within the turbine rotor layer, though with a more limited sample size. We find a “nose shape” in increased wind speeds near hub height during the gust front passages, in line with past observational work focused on convective winds (Lombardo et al., 2014; Gunter and Schroeder, 2015; Canepa et al., 2020), which is associated with a smaller relative decrease in θv at hub height compared to above and below hub height. The relative wind direction and θv changes maximize near the surface, though a shift in direction of +5 to 15° during the gust front and cooling of 1.5–2 K from T0+15 to T0+20 min are still observed on average throughout the rotor layer. In terms of the bulk cold-pool characteristics (strength, temporal evolution, vertical structure) related to kinematic and thermodynamic variations, we are in broad agreement with other European cold-pool studies (Kirsch et al., 2021; Kruse et al., 2022). However, the “nose” in θv near hub height is one cold-pool feature also found by Kirsch et al. (2021) that is not observed by Kruse et al. (2022). As such, additional observational work is needed to determine if this aspect of the cold-pool vertical structure is commonly found, since its impact on wind turbine wakes in terms of static stability is crucial for assessing the net impact of convective cold pools on wind power production across entire wind farms.
We extend beyond typical cold-pool analyses by investigating fluctuations in shear, veer, and static stability, which are important for wind power prediction and are more commonly studied in the wind energy community. The environmental variations as the gust front impacts WiValdi produce rapid increases in relative wind shear of 1.5 m s−1 and negative relative wind veer of 8° over the entire turbine rotor layer, with an increase in static stability of a few K km−1. However, these changes are not uniform across the turbine but are rather asymmetric. The relative changes below turbine hub height noticeably exceed those above hub height: upper-rotor-layer shear is negligible, with the relative wind veer and stability magnitudes being twice as large below hub height compared to above hub height. Also, while there is an increase in stability below hub height, there is a temporary decrease in stability above hub height. With these vertical asymmetries, we would expect temporarily opposite fluctuations in static stability along with differential turbine structural loads across the rotor plane during cold-pool gust front passages. Gradually increasing stabilization over the following hour across the whole rotor layer would have longer-lasting implications for turbine wake lengths, which can significantly affect downstream power output depending on wind farm configurations. Similarly, as wind direction shifts back toward the pre-event flow more slowly than wind speed, there would be longer-lasting effects on turbine yawing and structural loading from rotor-layer veer.
As the pre-event winds typically lie above the cut-in wind speed (2.5 m s−1) and below the rated wind speed (13.1 m s−1), we expected that cold pools would produce some wind power variations. To better quantify the potential power changes, we use the 100 m lidar wind speeds, a linear wind speed–power relationship within the partial load region of the power curve, and the operational settings of the WiValdi turbines. We estimate a median relative power increase of up to 50 % associated with the cold-pool gust front for the first WiValdi turbine impacted by the cold pools (e.g., T1), with a positive change in estimated power lasting 30 min. Although with just a handful of available power cases, the observed power variations qualitatively support a gust front peak and increased power occurring over approximately 0.5 h. The median estimated percentage change in power due to the detected cold-pool cases is noteworthy; however, the real-world significance of such a power change depends upon a number of factors beyond the scope of this study, including how many turbines are affected, whether the cold pool occurs during a power transition period (e.g., early evening), and whether cold pools affect entire wind parks. As such, the determination of the net impact of cold pools on observed wind power changes is left for future work. Greater investigation relating observed cold-pool characteristics to parent convective cell characteristics is needed to reduce wind power forecasting uncertainties related to deep convection.
Throughout our analyses, we highlight the remarkable capabilities of a vertically scanning Doppler wind lidar to capture both the temporal evolution and the vertical structure of short-term wind speed and direction changes associated with convective cold pools in terms of both the median and the 10th–90th percentile spread. Conversely, we note an underestimation of the hub-height θv variations by the 1 min MWR zenith scans, particularly during periods of rainfall. Future studies should investigate whether rainfall corrections and/or different 1 min MWR scanning patterns could remedy this limitation during convective cold-pool passages. While we have a sufficient sample size of detected cold pools from the meteorological mast observations to support our conclusions regarding the kinematic and thermodynamic variations at WiValdi, additional mast measurements up to heights of 100–200 m over a larger number of locations would be beneficial for capturing the vertical structure of cold pools within the turbine rotor layer. A greater density of operational weather stations, in combination with more meteorological masts, would allow for more accurate quantification of cold-pool sizes and thus how many wind turbines a given cold pool could impact. Given that our cold-pool observations are from an onshore wind park, we take care not to generalize our findings to offshore wind farms. Future work should be mindful when applying the cold-pool impacts described herein to offshore platforms or farther inland locations as the saturation deficit will likely cause differences in cold-pool strength and vertical structure compared with those we observe at our coastal location.
As this study deals with the intersection of convective cold pools and wind energy, we would like to suggest some possible additions to analysis done within each respective community from our understanding of past literature included in this work. Cold-pool studies should also quantify turbulence variables, shear, veer, and static stability (where possible) when the vertical structure of cold pools is analyzed since these quantities are very beneficial for the wind energy community and wind energy applications. Conversely, wind ramp research should focus on both kinematic and thermodynamic changes occurring alongside wind ramps, as wind ramps linked to meteorological phenomena are often also associated with thermal variations and since both aspects are important for assessing turbine structural loads, turbine wake characteristics, and wind power generation.
Currently, the code is not publicly available.
The authors can be contacted regarding data access.
All authors conceived of the paper idea. JT created the cold-pool detection methodology. NW and JT collected and processed the lidar and microwave radiometer data. GK collected the radar data and performed the analysis. JT performed all other observational data analyses, with constructive insights from GK and NW. The paper was primarily written by JT, with edits done by GK and NW.
The contact author has declared that none of the authors has any competing interests.
Publisher's note: Copernicus Publications remains neutral with regard to jurisdictional claims made in the text, published maps, institutional affiliations, or any other geographical representation in this paper. While Copernicus Publications makes every effort to include appropriate place names, the final responsibility lies with the authors. Views expressed in the text are those of the authors and do not necessarily reflect the views of the publisher.
We would like to particularly thank those that helped with the construction and implementation of the WiValdi research wind park, from where we obtained the majority of our data. We also acknowledge Martin Hagen for help with the microwave radiometer data collection and processing, as well as helpful comments on this paper. We are grateful to the two anonymous reviewers for their thoughtful and thorough reviews of the original manuscript. This work used resources of the Deutsches Klimarechenzentrum (DKRZ) granted by its Scientific Steering Committee (WLA) under project ID bd1069.
This research was partially funded within the DFWind2 project (FKZ 0325936A) under the German Federal Ministry for Economic Affairs and Climate Action (BMWK) based on a resolution of the German Bundestag.
The article processing charges for this open-access publication were covered by the German Aerospace Center (DLR).
This paper was edited by Claudia Brunner and reviewed by two anonymous referees.
Abkar, M. and Porté-Agel, F.: Influence of atmospheric stability on wind-turbine wakes: a large-eddy simulation study, Phys. Fluids, 27, 035104, https://doi.org/10.1063/1.4913695, 2014.
Barnes, G. M. and Garstang, M.: Subcloud layer energetics of precipitating convection, Mon. Wea. Rev., 110, 102–117, https://doi.org/10.1175/1520-0493(1982)110<0102:SLEOPC>2.0.CO;2, 1982.
Benjamin, T. B.: Gravity currents and related phenomena, Journal of Fluid Mechanics, 31, 209–248, 1968.
BMWK: Time series for the development of renewable energy sources in Germany based on statistical data from the Working Group on Renewable Energy-Statistics (AGEE-Stat) (Status: September 2024), Report, 25 pp., https://www.bmwk.de/Redaktion/DE/Downloads/Energie/zeitreihen-zur-entwicklung-der-erneuerbaren-energien-in-deutschland-1990-2023-en.pdf (last access: 9 October 2025), 2024.
Bodini, N., Lundquist, J. K., Krishnamurthy, R., Pekour, M., Berg, L. K., and Choukulkar, A.: Spatial and temporal variability of turbulence dissipation rate in complex terrain, Atmos. Chem. Phys., 19, 4367–4382, https://doi.org/10.5194/acp-19-4367-2019, 2019.
Bouchard, R. and Romanic, D.: Monte Carlo modeling of tornado hazard to wind turbines in Germany, Nat. Hazards, 116, 3899–3923, https://doi.org/10.1007/s11069-023-05843-z, 2023.
Byers, H. R. and Braham, R. R.: Thunderstorm Structure and Circulation, J. Meteorol., 5, 71–86, https://doi.org/10.1175/1520-0469(1948)005<0071:TSAC>2.0.CO;2, 1948.
Canepa, F., Burlando, M., and Solari, G.: Vertical profile characteristics of thunderstorm outflows, J. Wind Eng. Ind. Aerod., 206, 104332, https://doi.org/10.1016/j.jweia.2020.104332, 2020.
de Szoeke, S. P., Skyllingstad, E. D., Zuidema, P., and Chandra, A. S.: Cold pools and their influence on the tropical marine boundary layer, Journal of the Atmospheric Sciences, 74, 1149–1168, 2017.
Droegemeier, K. and Wilhelmson, R.: Numerical simulation of thunderstorm outflow dynamics. Part I: Outflow sensitivity experiments and turbulence dynamics, Journal of the Atmospheric Sciences, 44, 1180–1210, https://doi.org/10.1175/1520-0469(1987)044<1180:NSOTOD>2.0.CO;2, 1987.
Englberger, A. and Doernbrack, A.: Impact of the Diurnal Cycle of the Atmospheric Boundary Layer on Wind-Turbine Wakes: A Numerical Modelling Study, Boundary-Layer Meteorol., 166, 423–448, 2018.
Foth, A., Lochmann, M., Saavedra Garfias, P., and Kalesse-Los, H.: Determination of low-level temperature profiles from microwave radiometer observations during rain, Atmos. Meas. Tech., 17, 7169–7181, https://doi.org/10.5194/amt-17-7169-2024, 2024.
Fraunhofer ISE: German Net Power Generation in First Half of 2024: Record Generation of Green Power, Generation from Fossil Fuels Continues Decline, https://www.ise.fraunhofer.de/en/press-media/press-releases/2024/german-net-power-generation-in-first-half-2024-record-generation-of-green-power-generation-from-fossil-fuels-continues-decline.html (last access: 3 July 2024), 2024.
Gallego-Castillo, C., Cuerva-Tejero, A., and Lopez-Garcia, O.: A review on the recent history of wind power ramp forecasting, Renew. Sustain. Energy Rev., 52, 1148–1157, https://doi.org/10.1016/j.rser.2015.07.154, 2015.
Goff, R. C.: Vertical structure of thunderstorm outflows, Monthly Weather Review, 104, 1429–1440, 1976.
Goudenhoofdt, E. and Delobbe, L.: Statistical Characteristics of Convective Storms in Belgium Derived from Volumetric Weather Radar Observations, J. Appl. Meteor. Climatol., 52, 918–934, https://doi.org/10.1175/JAMC-D-12-079.1, 2013.
Gunter, W. S. and Schroeder, J. L.: High-resolution full-scale measurements of thunderstorm outflow winds, J. Wind Eng. Ind. Aerod., 138, 13–26, https://doi.org/10.1016/j.jweia.2014.12.005, 2015.
Hansen, K. S., Barthelmie, R. J., Jensen, L. E., and Sommer, A.: The impact of turbulence intensity and atmospheric stability on power deficits due to wind turbine wakes at Horns Rev wind farm, Wind Energy, 15, 183–196, 2012.
Hoeller, J., Fiévet, R., and Haerter, J. O.: Detecting cold pool family trees in convection resolving simulations, Journal of Advances in Modeling Earth Systems, 16, e2023MS003682, https://doi.org/10.1029/2023MS003682, 2024.
Iungo, G. V. and Porté-Agel, F.: Volumetric lidar scanning of wind turbine wakes under convective and neutral atmospheric stability regimes, J. Atmos. Ocean. Technol., 31, 2035–2048, https://doi.org/10.1175/JTECH-D-13-00252.1, 2014.
Kelly, M., Andersen, S. J., and Hannesdóttir, Á.: Statistical impact of wind-speed ramp events on turbines, via observations and coupled fluid-dynamic and aeroelastic simulations, Wind Energ. Sci., 6, 1227–1245, https://doi.org/10.5194/wes-6-1227-2021, 2021.
Kirsch, B., Ament, F., and Hohenegger, C.: Convective cold pools in long-term boundary layer mast observations, Monthly Weather Review, 149, 811–820, 2021.
Kirsch, B., Hohenegger, C., and Ament, F.: Morphology and growth of convective cold pools observed by a dense station network in Germany, Quarterly Journal of the Royal Meteorological Society, 150, 857–876, https://doi.org/10.1002/qj.4626, 2024.
Kolmogorov, A. N.: Dissipation of energy in locally isotropic turbulence., Dokl. Akad. Nauk SSSR, 32, 16–18, 1941.
Kropfli, R. A.: Single Doppler Radar Measurements of Turbulence Profiles in the Convective Boundary Layer, J. Atmos. Oceanic Technol., 3, 305–314, https://doi.org/10.1175/1520-0426(1986)003<0305:SDRMOT>2.0.CO;2, 1986.
Kruse, I. L., Haerter, J. O., and Meyer, B.: Cold pools over the Netherlands: a statistical study from tower and radar observations, Quarterly Journal of the Royal Meteorological Society, 148, 711–726, 2022.
Larsén, X. G., Ott, S., Badger, J., Hahmann, A. H., and Mann, J.: Recipes for correcting the impact of effective mesoscale resolution on the estimation of extreme winds, J. Appl. Meteorology Climatol., 51, 521–533, https://doi.org/10.1175/JAMC-D-11-090.1, 2012.
Lee, J. C. Y. and Fields, M. J.: An overview of wind-energy-production prediction bias, losses, and uncertainties, Wind Energ. Sci., 6, 311–365, https://doi.org/10.5194/wes-6-311-2021, 2021.
Lochmann, M., Kalesse-Los, H., Schäfer, M., Heinrich, I., and Leinweber, R.: Analyzing wind power ramp events and improving very short-term wind power predictions by including wind speed observations, Wind Energy, 26, 573–588, https://doi.org/10.1002/we.281, 2023.
Lombardo, F. T., Smith, D. A., Schroeder, J. L., and Mehta, K. C.: Thunderstorm characteristics of importance to wind engineering, J. Wind Eng. Ind. Aerod., 125, 121–132, https://doi.org/10.1016/j.jweia.2013.12.004, 2014.
Molina, M. O., Gutiérrez, C., and Sánchez, E.: Comparison of ERA5 surface wind speed climatologies over Europe with observations from the Hadisd dataset, Int. J. Climatol., 1, 1–15, https://doi.org/10.1002/joc.7103, 2021.
Rose, T., Crewell, S., Löhnert, U., and Simmer, C.: A network suitable microwave radiometer for operational monitoring of the cloudy atmosphere, Atmos. Res., 75, 183–200, https://doi.org/10.1016/j.atmosres.2004.12.005, 2005.
Sena, C. A. P., Negri, R. G., and Gava, M. L. L. M.: GOES ABI-derived hailstorm polygons and tracking dataset for Brazil, Data in Brief, 55, 110736, https://doi.org/10.1016/j.dib.2024.110736, 2024.
Steiner, A., Köhler, C., Metzinger, I., Braun, A., Zirkelbach, M., Ernst, D., Tran, P., and Ritter, B.: Critical weather situations for renewable energies – Part A: cyclone detection for wind power, Renew. Energy, 101, 41–50, https://doi.org/10.1016/j.renene.2016.08.013, 2017.
Stull, R. B.: An Introduction to Boundary Layer Meteorology. Atmospheric and Oceanographic Sciences Library, Vol. 13, Kluwer Academic, 670 pp., https://doi.org/10.1007/978-94-009-3027-8, 1988.
Uba, D. M., Negri, R. G., Enoré, D. P., Costa, I. C., and Jorge, A. A. S.: TATHU – Software para rastreio e análise do ciclo de vida de sistemas convectivos, São José dos Campos, INPE, 39 pp., IBI: 8JMKD3MGP3W34T/47AF772, http://urlib.net/ibi/8JMKD3MGP3W34T/47AF772 (last access: 9 October 2025), 2022.
Valldecabres, L., von Bremen, L., and Kühn, M.: Minute-scale detection and probabilistic prediction of offshore wind turbine power ramps using dual-Doppler radar, Wind Energy, 23, 2202–2224, https://doi.org/10.1002/we.2553, 2020.
Vincent, C. L., Pinson, P., and Giebela, G.: Wind fluctuations over the north sea, Int. J. Climatol., 31, 1584–1595, 2011.
Wakimoto, R. M.: The life cycle of thunderstorm gust fronts as viewed with Doppler radar and rawinsonde data, Monthly Weather Review, 110, 1060–1082, 1982.
Wapler, K.: Mesocyclonic and non-mesocyclonic convective storms in Germany: storm characteristics and life-cycle, Atmospheric Research, 248, 105186, https://doi.org/10.1016/j.atmosres.2020.105186, 2021.
Wildmann, N., Kigle, S., and Gerz, T.: Coplanar lidar measurement of a single wind energy converter wake in distinct atmospheric stability regimes at the Perdigão 2017 experiment, J. Phys.: Conf. Ser., 1037, 052006, https://doi.org/10.1088/1742-6596/1037/5/052006, 2018.
Wildmann, N., Päschke, E., Roiger, A., and Mallaun, C.: Towards improved turbulence estimation with Doppler wind lidar velocity-azimuth display (VAD) scans, Atmos. Meas. Tech., 13, 4141–4158, https://doi.org/10.5194/amt-13-4141-2020, 2020.
Wildmann, N., Hagen, M., and Gerz, T.: Enhanced resource assessment and atmospheric monitoring of the research wind farm WiValdi, Journal of Physics Conference Series, 2265, 022029, https://doi.org/10.1088/1742-6596/2265/2/022029, 2022.
Wildmann, N., Thayer, J. D., Detring, C., and Päschke, E.: Gust-detection from velocity azimuth display Doppler wind lidar profiling at the WiValdi research park, Journal of Physics: Conference Series, 2767, 092076, https://doi.org/10.1088/1742-6596/2767/9/092076, 2024.
Wilhelm, J., Wapler, K., Blahak, U., Potthast, R., and Kunz, M.: Statistical relevance of meteorological ambient conditions and cell attributes for nowcasting the life cycle of convective storms, Quarterly Journal of the Royal Meteorological Society, 149, 2252–2280, https://doi.org/10.1002/qj.4505, 2023.
Würth, I., Valldecabres, L., Simon, E., Moehrlen, C., Uzunoglu, B., Gilbert, C., Giebel, G., Schlipf, D., and Kaifel, A.: Minute-scale forecasting of wind power—results from the Collaborative Workshop of IEA Wind Task 32 and 36, Energies, 12, 712, https://doi.org/10.3390/en12040712, 2019.
Zhang, W., Markfort, C. D., and Porté-Agel, F.: Wind-turbine wakes in a convective boundary layer: a wind tunnel study, Boundary-Layer Meteorol., 146, 161–179, https://doi.org/10.1007/s10546-012-9751-4, 2013.
More information can be found on the official WiValdi wind park website (https://www.windenergy-researchfarm.com, last access: 9 October 2025).
- Abstract
- Introduction
- Data and methodology
- Temporal evolution of cold-pool characteristics
- Vertical structure of cold-pool characteristics
- Wind turbine rotor layer
- Summary and conclusions
- Code availability
- Data availability
- Author contributions
- Competing interests
- Disclaimer
- Acknowledgements
- Financial support
- Review statement
- References