the Creative Commons Attribution 4.0 License.
the Creative Commons Attribution 4.0 License.
 | 04 Nov 2025
Blade surface pressure and drag measurement of a blade section on a 4.3 MW turbine with trailing-edge flaps
Alejandro Gomez Gonzalez
Thanasis Barlas
Anders Smærup Olsen
Sigurd Brabæk Ildvedsen
Andreas Fischer
In this paper we present the measurements of local aerodynamic sectional characteristics on a full-scale rotor blade with a novel add-on instrumentation comprising a wake rake, a pressure belt, and a five-hole Pitot tube. The general objective of the research work is to provide information on the differences between airfoil performance in wind tunnel flow and on a full-scale rotor. Although pressure belt measurements have been performed in earlier studies, this is the first campaign to use a wake rake at the full-scale level. We present the development and testing of the wake rake in the wind tunnel and on a rotating test rig, which ultimately led to its installation on the 4.3 MW turbine. A more specific objective of the campaign was to characterize the aerodynamic performance of a trailing-edge active flap system installed on one of the blades. The short measurement campaign of 2 d comprised measurements of the flaps actuated at constant time intervals of 60 s between fully retracted and activated positions with a control set point of 75 % of full deflection. The lift and drag characteristics are compared with a similar flap actuation in a wind tunnel experiment. The relative changes in both lift and drag coefficients as a function of flap actuation correlate well with wind tunnel measurements, but the absolute drag levels measured on the rotor are higher than the wind tunnel data. During the measurement campaign, it was also demonstrated that it is possible to clearly measure the increased drag from adding a roughness tape at the leading edge of the airfoil. This illustrates the potential of the measurement system to capture the effect of variations in local aerodynamic performance at full scale, even for elements at the boundary layer scale, e.g., the impact of roughness or the positioning of add-ons such as vortex generators.
- Article
(5202 KB) - Full-text XML
- BibTeX
- EndNote


The lack of detailed measurements to characterize the aerodynamics and aeroelasticity of full-scale turbines is a barrier to further reliable turbine development and upscaling (Veers et al., 2023). In particular, inflow and blade surface pressure measurements on turbines operating in turbulent atmospheric inflow are crucial data for a deeper understanding of and insight into how the airfoil characteristics (lift, drag, and moment coefficients) measured in wind tunnels can be transferred and used for the design of full-scale wind turbine blades. This is due to the quite different operating conditions for a 2D airfoil section tested in the steady wind tunnel flow and the unsteady, turbulent 3D flow experienced on the wind turbine blade.
A common approach to the determination of aerodynamic coefficients for blade design and load calculations is to use a weighted average of measured or simulated aerodynamic characteristics for free-transition and tripped (forced-transition) wind tunnel airfoil data, where the weighting ratio is based on experience from previous blade designs and full-scale-rotor tests. The need for such empirical approaches can be found in the lack of knowledge of, e.g., the characteristics of airfoils operating at the high Reynolds numbers found in normal field operation, the roughness state of the surface of the blades (e.g., clean vs. dirty blades), and outer-flow-induced bypass transition at varying levels of free-flow turbulence. Together, these three mechanisms have an important influence on boundary layer transition characteristics, but other effects, like 3D flow effects in combination with local separation, are also important. Detailed measurements of the transition position based on readings of surface microphones mounted flush on a full-scale rotor have shown that the level of atmospheric turbulence moves the transition toward the leading edge (Madsen et al., 2019).
Hopefully, measured airfoil characteristics on blade sections of a full-scale wind turbine blade in real operating conditions can lead to less empiricism in the use of wind tunnel airfoil data in industrial blade design.
Blade surface pressure measurements on full-scale turbines have so far mainly been performed employing sensors and measurement equipment built into the blade and on specific test turbines (Madsen et al., 2010; Medina et al., 2011). This has hindered such measurements from being carried out on industrial-scale turbines to a greater extent and has limited access to the detailed aerodynamic data mentioned above. However, with the fast development of sensor technology, e.g., the considerable reduction in the size of the sensors, it is now possible to design compact and autonomous add-on measurement systems, which do not require any integration of measurement equipment during the manufacturing of the blade.
The need for autonomous add-on measurement systems has led to activities at different research institutes to develop such measurement systems. The pressure belt instrumentation developed at DTU was presented by Madsen et al. (2022), while the development and testing of an MEMS-based system were described by Barber et al. (2022). The measurement system of Fredebohm et al. (2023) comprises a system with pressure sensors embedded in thin glass fiber shells, which are glued to the rotor blades.
Another recent comprehensive full-scale experiment was conducted by TNO and LM Wind Power within the TIADE project (Boorsma et al., 2024; Fritz et al., 2024). Blade surface pressure measurements were planned at four spanwise locations on a 3.8 MW rotor. At the inboard section, with a radius of 15 m with access inside from the blade, a traditional pressure measurement installation was used. Further outboard with limited space inside the blade, a fiber optic pressure system was installed. However, it was found that blade surface strain complicated accurate surface pressure measurements.
The main objective of the present article is to present a further development and application of the system originally used in a measurement campaign carried out in 2021 (Madsen et al., 2022), including the measurement of the surface pressure of a blade section with one belt and the inflow with a five-hole Pitot offset radially from the belt by approximately 1 m.
However, measuring the blade surface pressure distribution does not provide full information for the derivation of the airfoil characteristics. In addition to the pressure drag derived from the pressure distribution, there is also viscous drag from the shear stresses in the boundary layer. The total drag (pressure drag + viscous drag) is commonly measured with a so-called wake rake measuring the momentum loss in the near wake behind the trailing edge of the blade section, and it is also the technique we use in the present experiment.
In this article, we present the further development of the measurement system used in the 2021 campaign (Madsen et al., 2022), comprising the design and testing of a blade-mounted wake rake. In addition, the pressure belt was redesigned from a 16- to a 32-tap pressure belt, while the inflow was measured with a five-hole Pitot tube, as in the previous campaign. With this instrumentation, the sectional airfoil characteristics can be characterized to a high degree of detail and thus also the aerodynamic performance of an active trailing-edge flap system installed on the turbine for this campaign.
In Sect. 2 the wake rake development work is discussed along with an overview of the other components of the measurement system. The measurement campaign carried out on the SG-4.3-120 DD turbine in July 2022 is briefly described in Sect. 3, followed by a presentation of the results in Sect. 4. A discussion and outlook are then provided in Sect. 5, and conclusions are drawn in Sect. 6.
2.1 The pressure belt
The DTU pressure belt and inflow measurement system developed in the last 5–6 years include the manufacturing of different prototypes that have been tested in various wind tunnel campaigns. The system was first used in full-scale testing campaigns on a 4.3 MW turbine in 2021 (Madsen et al., 2022), and in the present experiment, a modified pressure belt design with 32 taps is now used.
However, it can be mentioned that a completely new pressure belt design, manufactured in an extrusion process, was used in the downwind experiment on the GE 1.5 MW turbine operated in a downwind configuration in a test campaign in April 2024. The main objective of applying the system in this project was to provide experimental data characterizing the complex aerodynamics of the blade tower interaction of a downwind rotor (Bortolotti, 2024; Bortolotti et al., 2025).
2.2 The wake rake development
The development and testing of the wake rake comprised three major activities: (1) prototype design and testing parameter variations in the Poul la Cour wind tunnel (PLCT) at DTU, (2) mid-scale testing on a rotating test rig (RTR), and (3) adaptation of the wake rake for full-scale testing on the SWT-DD-120 4.3 MW turbine.
2.2.1 Prototype design and wind tunnel testing
Wind tunnel tests were conducted in the PLCT to estimate the main dimensions of the wake rake design. However, it should be noted that the design was also based on the already-developed wake rake installed as part of the standard measurement system in the PLCT at DTU.
The test section in the PLCT is 2 m in span and 3 m in width. For this campaign, a blade section with a 1 m chord and a 2 m span was used. The blade section was equipped with a trailing-edge morphing flap, as one of the crucial design parameters to determine in the PLCT tests is the width of the wake rake so it can capture the deficit with the flap in its maximum and minimum deflection positions. The instrumentation comprised standard pressure orifices in the midspan and two five-hole Pitot tubes at 0.5 and 1.5 m span positions measured from the floor of the tunnel.
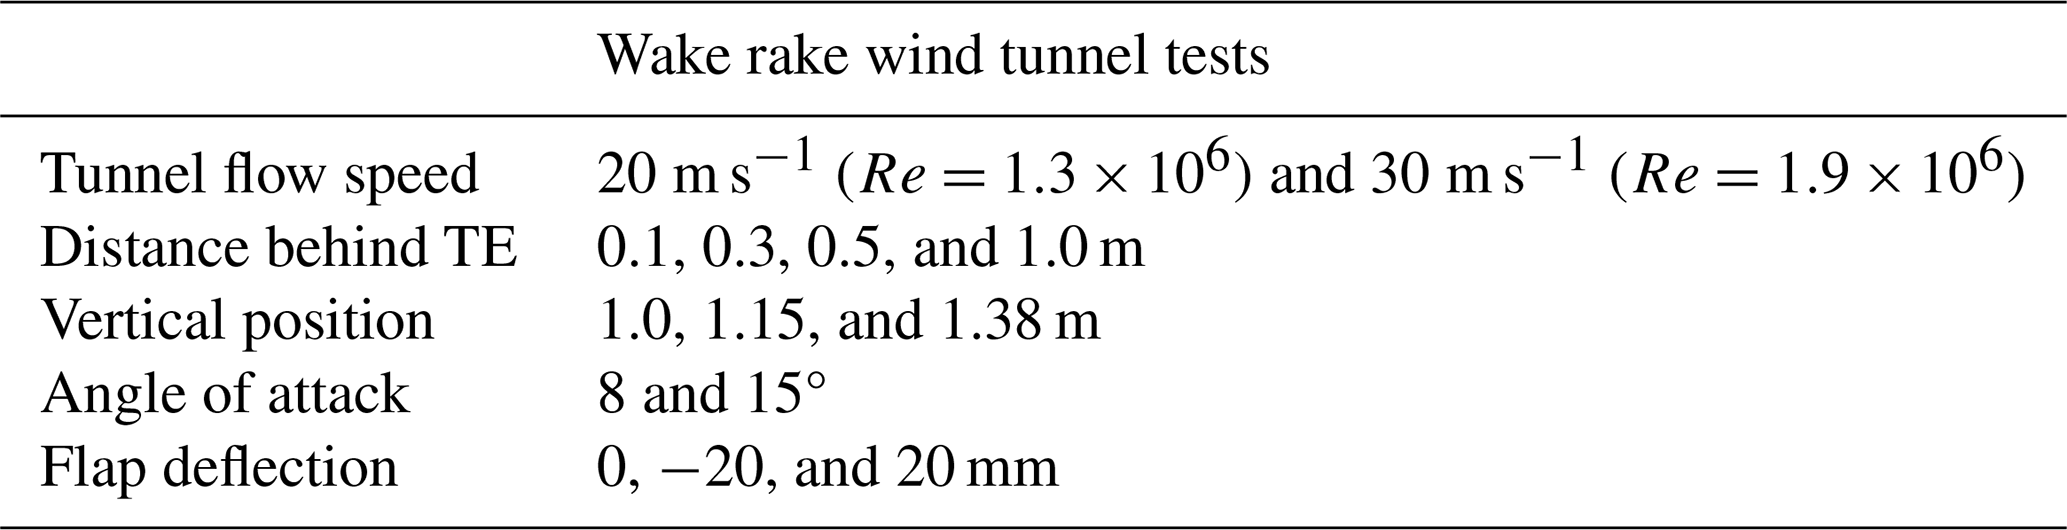
The parameters varied during the wind tunnel tests are listed in Table 1. The test parameters in the wind tunnel were chosen to match conditions similar to the wake rake test on the rotating test rig.
Table 1Overview of the parameters varied during the wind tunnel tests forming the basis of the final wake rake design. The three vertical positions were chosen to be (1) behind pressure orifices (1.0 m); (2) slightly above pressure orifices (1.15 m), and (3) at maximum height, closer to the connecting tubes for the five-hole Pitot tube (1.38 m).
The drag coefficient cd is found using the method of Jones (1936) and may be expressed as
with
where is the length of the integration path of the wake rake velocity deficit, p0 the static pressure, p the dynamic pressure, H0 the total head, ρ the density, and q0 the free stream dynamic pressure. The total and static pressures are measured by a differential pressure scanner, so the measurement gives H0−p0 and p−p0 directly. The free stream dynamic pressure, q0, is estimated from the two outer static and total probes, as the q0 based on the five-hole Pitot tube proved to be questionable.
The Jones formula is derived for uniform, steady, and 2D flow. The use of the same formula in the present case behind a blade section of a rotating full-scale blade in atmospheric flow thus deviates from the flow conditions for which the formula was derived. However, it is still assumed that the Jones formula is applicable in the rotating reference frame of the turbine, as the flow curvature at the wake rake location is very small compared to the blade section chord (chord/radial position of wake rake ). Therefore, the curvature effects can be neglected, and a 2D flow can be assumed at the wake rake location. The impact and uncertainty of applying the Jones formula in the turbulent flow field still need to be further investigated in future research, e.g., by extracting detailed pressure and flow details around the blade section from fully resolved CFD simulations of the rotor. In short, the sectional drag coefficient is extracted from a numerical simulation and compared with the drag coefficient for the section in 2D flow.
From the wind tunnel test results, the following conclusions and parameter settings were derived: (1) the cd measurement is only slightly affected by the downstream distance from the trailing edge (0.1 to 0.5 m); (2) the cd measurement is only slightly affected by rotating the rake with the profile, at least not for the value of angle of attack of 8° (it is also a matter of making the end of the tube conical); (3) cd is only slightly affected by the pressure orifices but is largely affected by the five-hole Pitot tube connection; and (4) the wake width is approximately 0.3 m at α=8° for a flap deflection of mm.
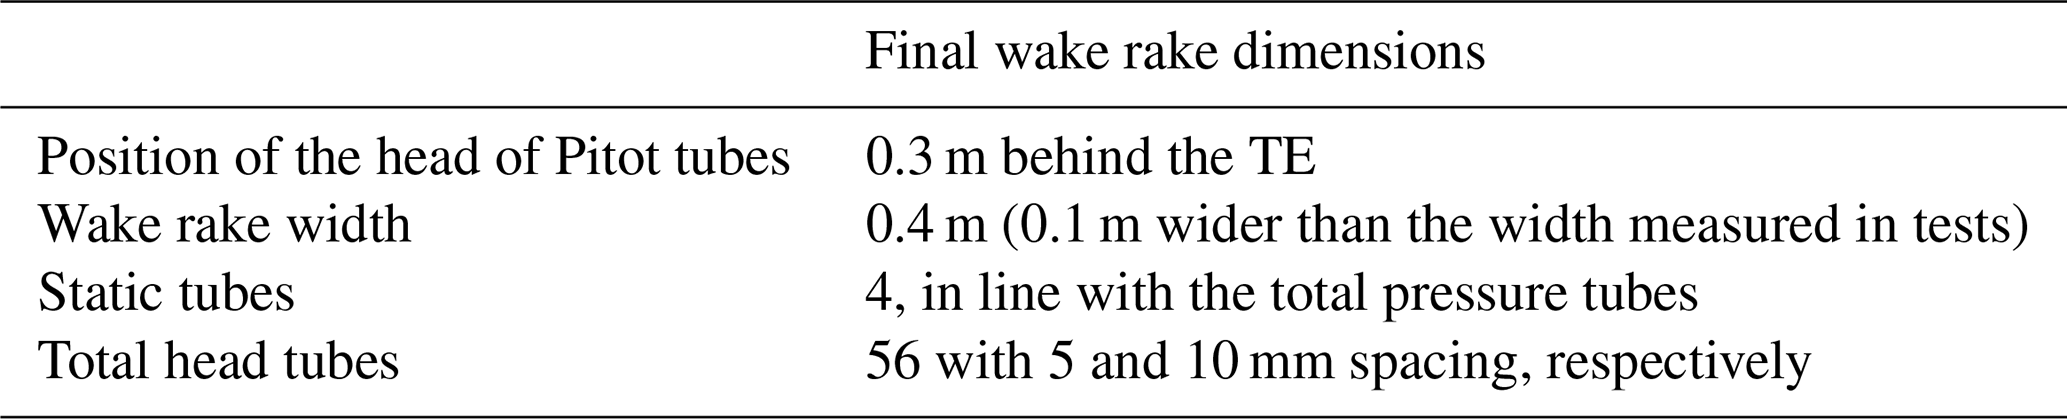
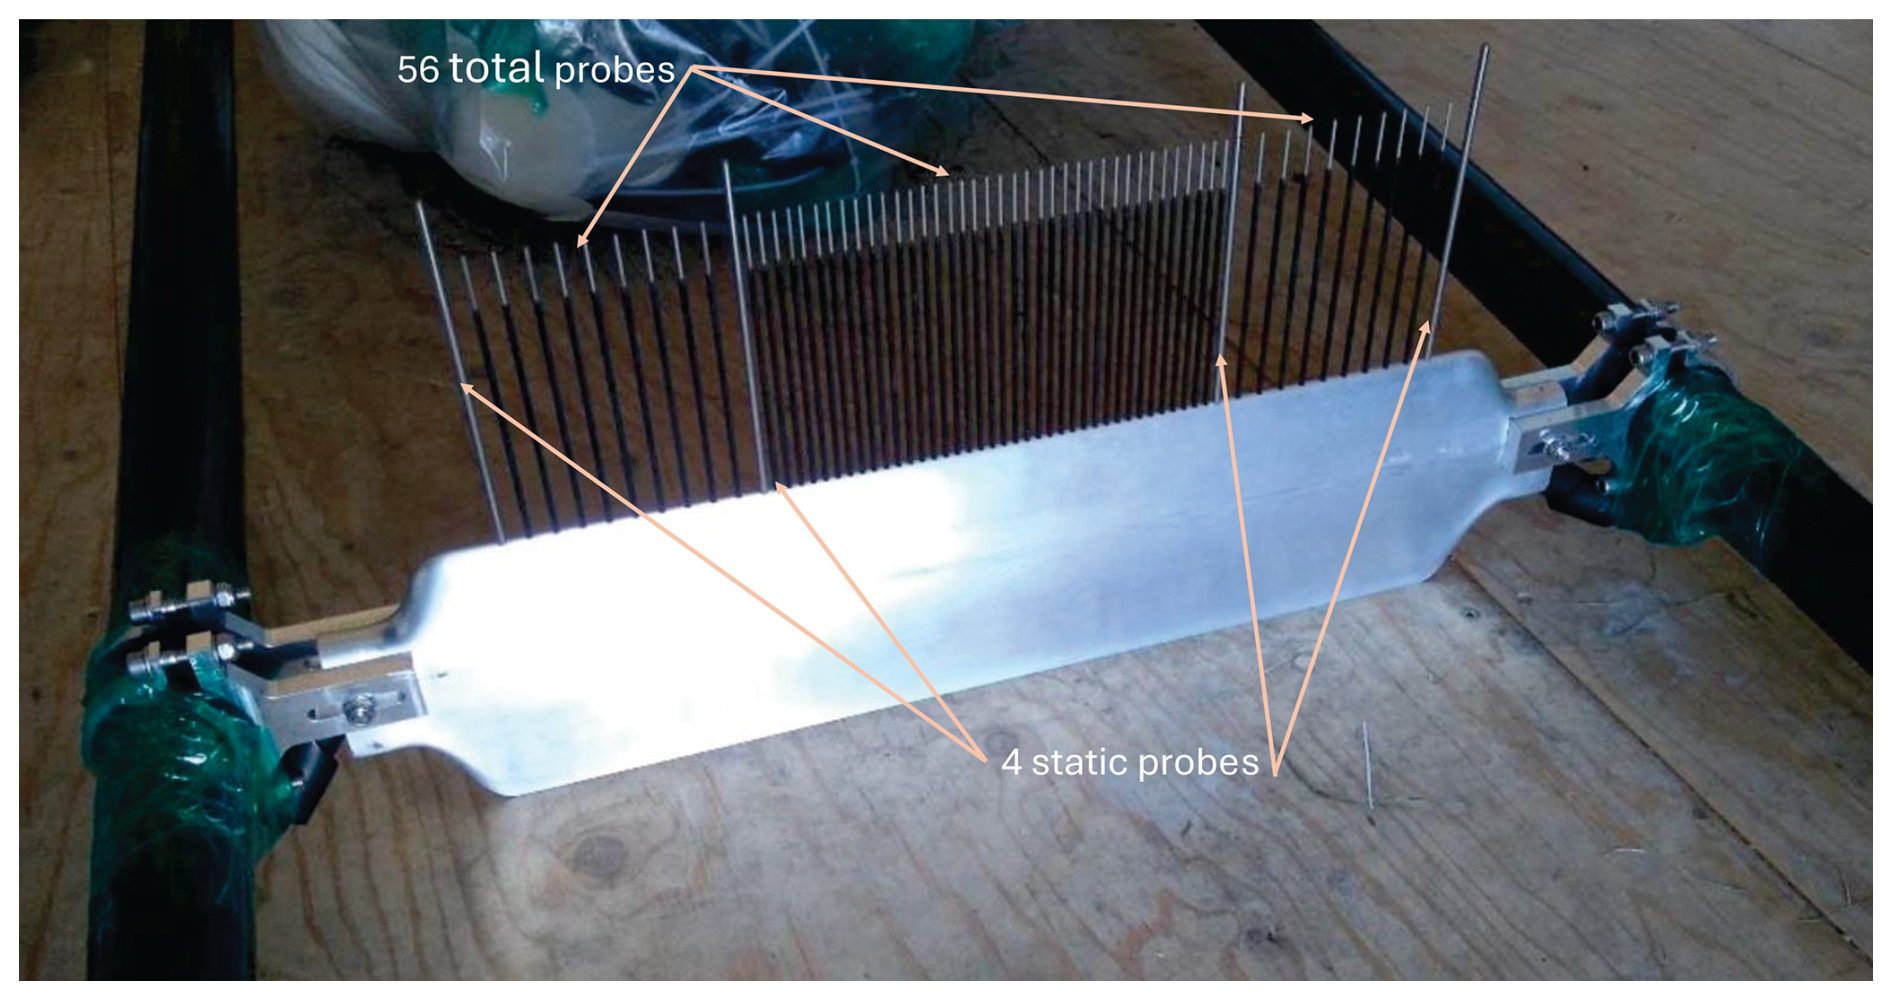
Based on the findings and conclusions of the wind tunnel tests, the final design parameters, as shown in Table 2, were chosen. A photo of the manufactured wake rake is shown in Fig. 1. Inside the wake rake, plastic tubes are connected to the pressure probes and led out at both ends of the rake to the pressure scanners outside.
Table 2Overview of the final wake rake design parameters. See also the photo of the wake rake in Fig. 1.
2.2.2 Mid-scale testing of the functionality and integration of the wake rake on the blade section on a rotating test rig
To gain experience with the functionality and operation of the wake rake in a rotating environment before applying it to the full-scale turbine, the wake rake was installed and tested on a rotating test rig (RTR) (Madsen et al., 2015; Ai et al., 2019; Barlas et al., 2022). The RTR is built on a 100 kW turbine platform, where the rotor is replaced by a 10 m pitchable long boom carrying a 2 m span blade section at the tip; see panel b in Fig. 2. In fact, a blade section for tests in the PLCT can be tested directly on the RTR.
The wake rake was mounted on the blade section with a frame of circular carbon tubes attached to the aluminum frame inside the blade section; see the photos in Fig. 2. The 2 m long rectangular blade section with end caps has an active trailing-edge flap system with serrations like in the full-scale experiment. However, the serrations were covered with tape as it is expected that the flow will not be uniform in the position of the wake rake due to the serrations and will thus make the drag measurement uncertain. The wake rake probes were connected to four 16-channel differential pressure scanners positioned inside the blade section and with the reference port connected to the static port of one of the five-hole Pitot tubes attached to the leading edge of the blade section.
The RTR tests confirmed that the wake deficit of the blade section could be satisfactorily covered within the wake rake width even in the turbulent inflow and with flap activation. The tests also confirmed that the carrying frame was stable. See the video of the test of the wake rake on the rotating test rig (Madsen et al., 2025).
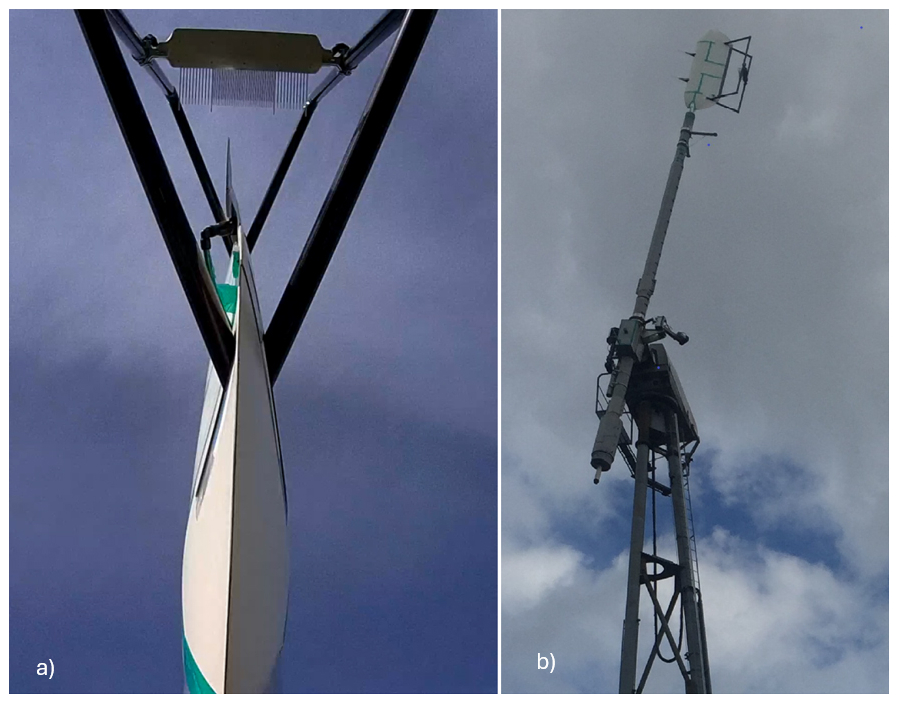
Figure 2(a) The wake rake attached to the 2 m span blade section with carbon fiber circular tubes fastened inside the blade section to the aluminum frame. (b) The blade section on the 10 m long rotating boom during the RTR tests.
2.2.3 Wake rake attachment on the full-scale blade
Based on the experience of mounting and operating the wake rake on the blade section for the RTR and considering the quite different attachment conditions on the full-scale blade, as there is no access to the interior of the blade, it was decided to design and manufacture a new frame for attaching the wake rake to the full-scale blade; see CAD designs in Fig. 3. CFD flow simulations were used to predict and adjust the wake rake position to optimally cover the width of the wake deficit, as shown schematically in Fig. 3b.
As preparatory work for the mounting of the wake rake, some interface pads were glued onto the blade 1 week before the actual mounting of the wake rake support structure. These interface pads were designed to carry shear and tension loads from the support structure without the need to drill holes in critical structural areas of the blade. A single hole was drilled in the blade at a location that was not relevant to the structural integrity of the blade, where a tension bolt was inserted to stiffen the entire wake rake structure to ensure stability during operation. Circular carbon rods were still used as the main elements of the frame, as seen in Fig. 3. The four 16-channel miniature differential pressure scanners connected to the wake rake tubes were mounted (taped) on the support structure at each end of the wake rake. The photos in Fig. 4 show the wake rake after installation.
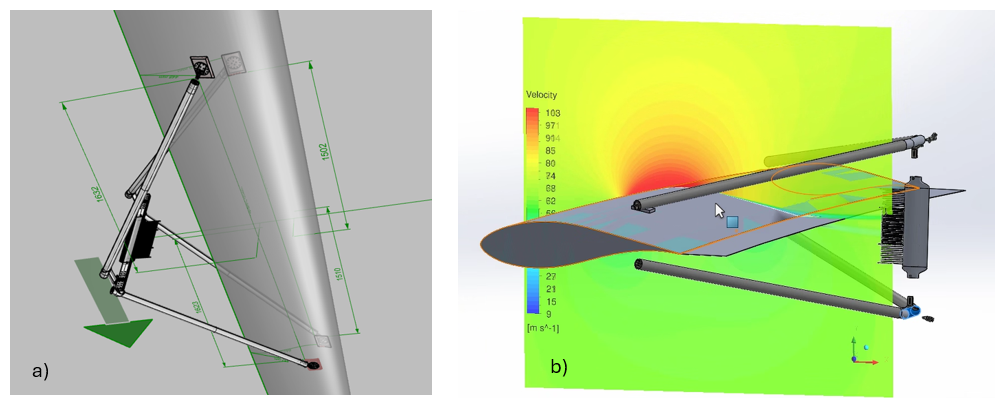
Figure 3(a) CAD design of the wake rake attachment on the full-scale blade. (b) CFD simulations for alignment of the wake rake with expected velocity deficit.
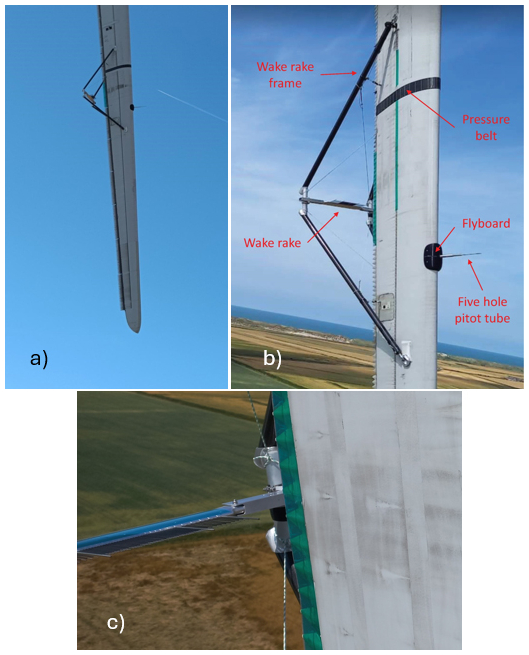
Figure 4(a) Overview of the full setup on the blade. (b) The instrumented blade section with the wake rake, the pressure belt, and the flyboard with the data acquisition system and carrying the five-hole Pitot tube. (c) Close-up view of serrations covered with a tape to avoid spanwise velocity deficit variations.
2.3 Setup of full-scale testing
2.3.1 Installation of equipment
The installation of the wake rake system on the turbine was carried out on the morning of 28 July 2022. The complete installation was performed in approximately 4–5 h from the basket of a truck-mounted lift. A weather window of relatively low wind speeds and no rain was chosen, with the primary focus of allowing good working conditions for the installation of the equipment, as well as avoiding rain during the duration of the tests due to the weather sensitivity of the Pitot and the wake rake probes.
The wake rake was structurally secured to the interface pads with screws, and the entire system was tensioned with an arrangement of tension ropes to ensure high stiffness during the operation of the turbine. The pressure belt and Pitot inflow sensor were subsequently mounted and connected to the data acquisition system. The wake rake was centered around a spanwise location approximately 50 m from the root of the blade, with the pressure belt and Pitot probe mounted 800 mm offset towards the inboard and outboard areas, respectively.
Finally, GoPro cameras were installed on interface locations close to the wake rake setup, which had been prepared in advance to have video overview of the full test setup while performing the test; see the video link in the “Video supplement” section at the end of the article. The impact of the installed instrumentation of the blade on the operation of the turbine is expected to be minimal.
2.3.2 Turbine and flap system
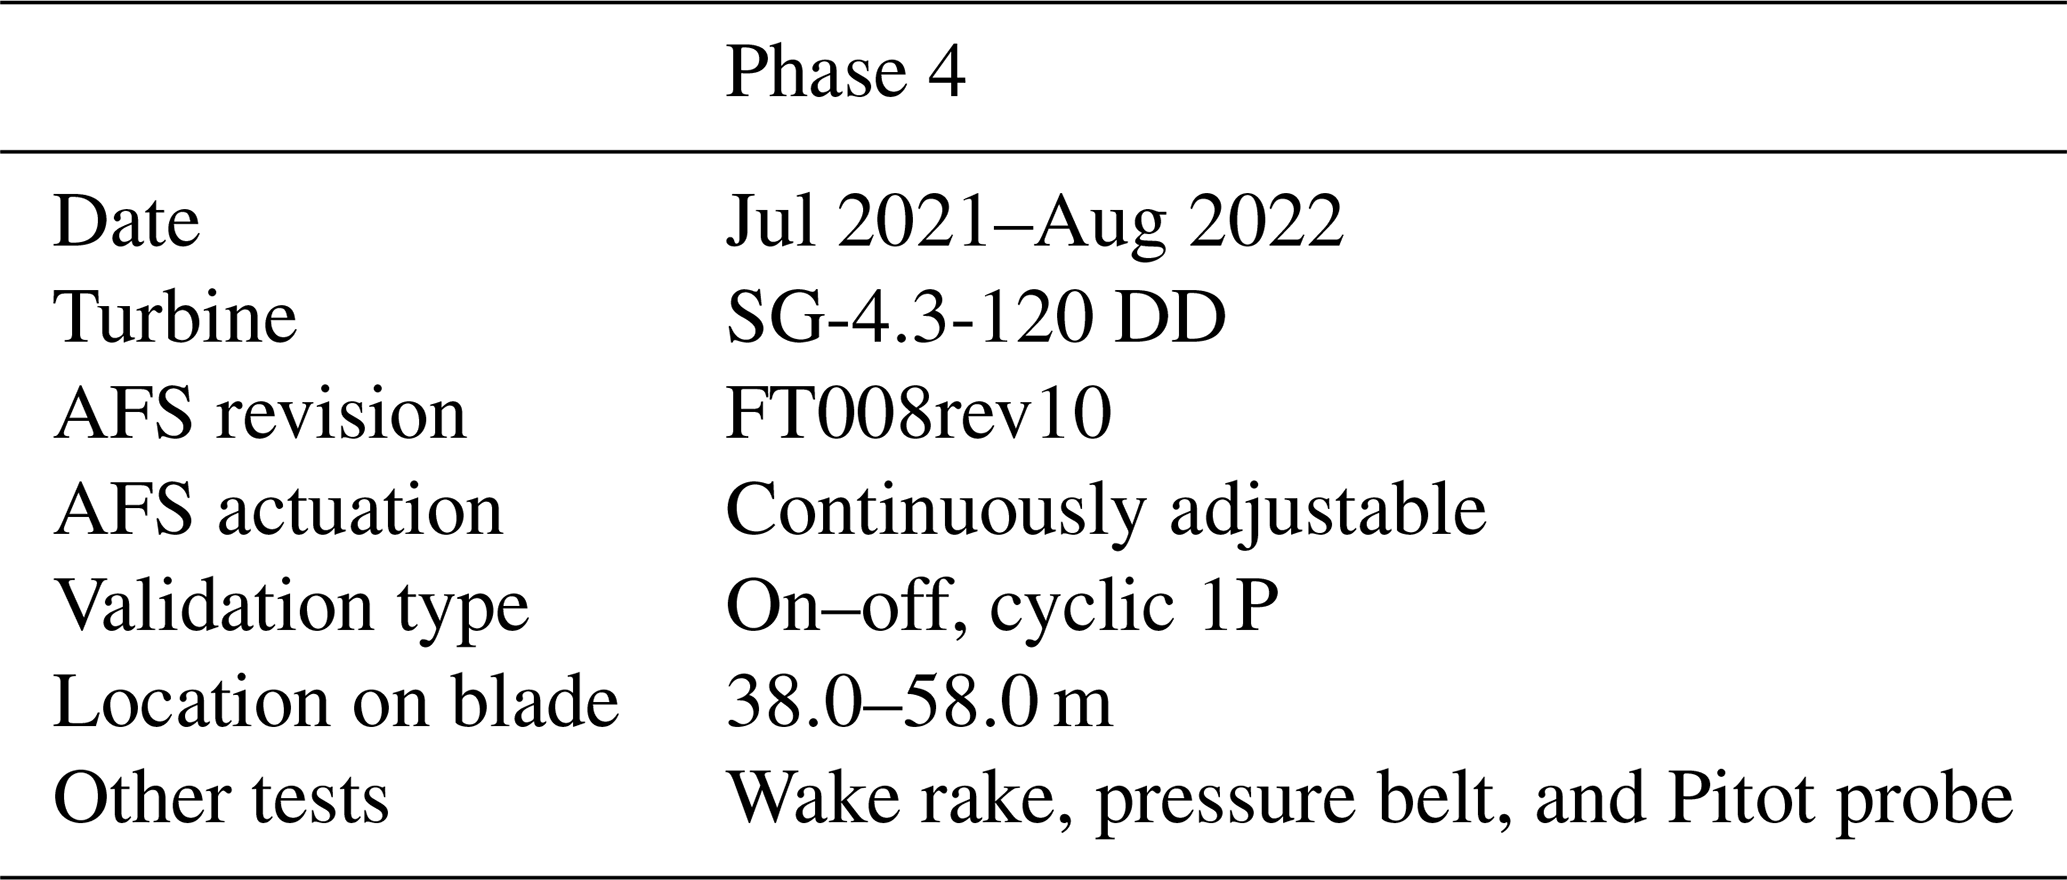
The SG-4.3-120 DD is a prototype wind turbine, fully instrumented for load and power performance validation campaigns, located in Høvsøre, Denmark (see site layout in Fig. 5). The specific wake rake measurements were carried out during phase 4 as part of the VIAs project (Gomez Gonzalez, 2019), for which one of the blades had previously been equipped with an active flap system (AFS). The main objective of the VIAs project was to redesign, manufacture, and validate an AFS for the rotor blades of wind turbines and to develop the methods and instrumentation necessary for experimental and numerical validation.
In what follows, a short description of the AFS is given, but the reader is referred to Gomez Gonzalez et al. (2022, 2023) for further details. The outer portion of the blade (span location 38–58 m) is retrofitted with the active flap (internal reference FT008rev10) with remote pneumatic actuation pressure. Note that the AFS includes trailing-edge serrations, which is important to highlight as discussed below. Furthermore, the blade has vortex generators (VGs) mounted on the suction side. However, these VGs were removed prior to the execution of the test in question, as discussed in Sect. 4, to avoid spanwise variations in the wake velocity deficit coming from the upwash and downwash structures trailed from the VG vanes. The pressure supply system is located in the hub, and air is supplied to the flap via hoses inside the blade that extend from the hub into the interior of the blade, reaching a distance from the root where physical access is no longer possible due to the internal dimensions of the blade. At this location, a smaller-diameter hose is continued on the outside of the blade flush with the trailing edge until it reaches the inlet of the active flap located 38 m from the root.
The pressure supply system is closed-loop regulated for given pressure set points (specified between 0 % and 100 % for the lower and upper limits of flap activation, respectively). The active flap can be activated in swap mode at predefined time intervals and set points or in a closed-loop manner based on the azimuthal position of the blades.
For the measurement with the wake rake, the trailing-edge serrations were covered with tape extending in the spanwise direction, rendering the trailing edge of the AFS effectively straight. This modification, which is visible in Fig. 4c as a green tape in the serration area, extends symmetrically in- and outboard of the wake rake position. The reason for this modification is the following: when performing wind tunnel measurements of airfoils with serrations, it is known that the integrated momentum deficit of the wake, i.e., the drag, has a periodic behavior with a spanwise wavelength equal to the spacing between the teeth of the serrations. This behavior is due to the local upwash and downwash induced by the vortical system created behind the serrations through their interaction with the boundary layer flow. When performing a wind tunnel measurement, one must therefore traverse the wake rake along the span of the airfoil to ensure that the drag variations are covered along multiple teeth. If no traverse is done, it is not possible to know if the wake rake position is in the “high” or the “low” area of the momentum deficit. Because wake traversing is not possible in the full-scale test, the serrations are covered with tape to avoid the spanwise drag variations. However, one consequence of this is that the drag coefficient measured in the full-scale test will be slightly larger than that measured in the wind tunnel due to the additional area coverage of the AFS. In the future, it may be useful to benchmark the results against wind tunnel tests where the same modification is performed on the serrations.
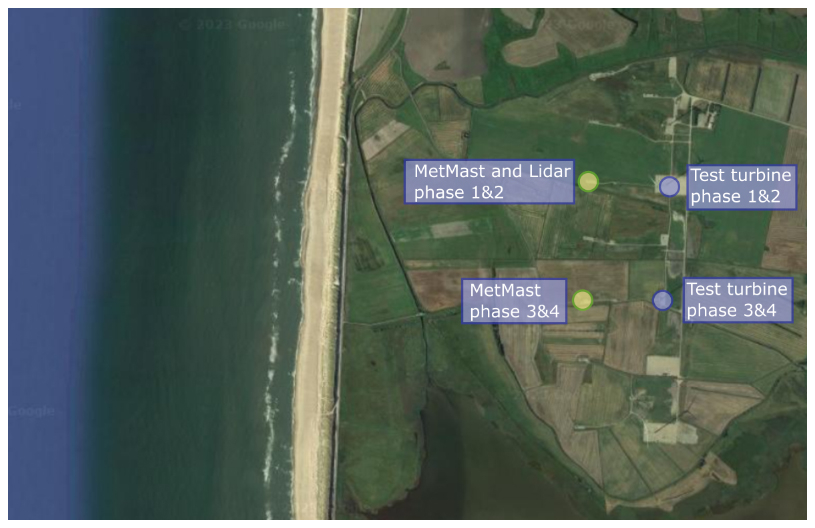
Figure 5Test site layout. Map data taken from © Google Maps 2025. Annotations inserted by the authors.
2.3.3 Turbine instrumentation
The turbine is equipped with various sensors, all logging continuously at 25 Hz. The main sensors of interest for this particular test are the pressure set point of the AFS, the rotor speed and power of the turbine, and the pitch and azimuth angle of the blade. Atmospheric conditions, such as wind speed at different heights, temperature, and atmospheric pressure, are collected using a meteorological mast (met mast) and a lidar located at the position marked with phase 1 and 2 in Fig. 5, since the met mast used specifically for phase 4 of the test was no longer in operation during the days when the wake rake test was conducted. During the whole campaign, the wind speed was also recorded with the turbine's own sonic nacelle anemometer.
2.3.4 Pressure belt and scanners
In the present experiment, an update of the pressure belt design with 32 channels was used compared to the 16 channels of the pressure belt used in the 2021 experiment (Madsen et al., 2022). However, the basic belt design is the same as in the 2021 experiment, with a printed plastic fixture in which the plastic tubes are pressed and fixed. Each pressure belt is connected to two miniature pressure scanners, with a size of mm, operated in the so-called calculated differential mode where one of the ports is used as reference. The full-scale range is −400 to 200 mbar with a resolution of 0.03 mbar and a drift over 1 year of maximum 1 mbar. For further details on the installation of pressure belts and pressure scanners, the reader is referred to Madsen et al. (2022).
2.3.5 Flyboard and the data acquisition system
As for the pressure belt, the flyboard with the data acquisition system, attached to the leading edge of the blade and carrying the five-hole Pitot tube, is also the same as in the 2021 experiment, and the reader is again referred to Madsen et al. (2022) for further details. The pressure scanners on the wake rake are connected to the data acquisition system on the flyboard in a similar fashion.
The scanning rate of the pressure belt, wake rake, and five-hole Pitot tube with one 3D accelerometer is 100 Hz, and the data are stored on the acquisition board and in parallel, sent to a laptop on the ground by a Wi-Fi system.
2.3.6 Data synchronization and processing
Both the wind turbine data (sampled at 25 Hz) and the aerodynamic measurement system data (sampled at 100 Hz) were post-processed and synchronized. The synchronization process has to be done with care as the different signals of the turbine and the flyboard/wake rake setup are collected with independent data acquisition systems. The first step of synchronization is based on the GPS timestamp of all measurements. The second step of synchronization is based on alignment of the acceleration signals of the blade-mounted data acquisition system with the hub-mounted measurement of the azimuthal position of the blade. For this second step, a wind turbine start-up sequence is used, where the acceleration level of the blade in the radial direction (i.e., the centrifugal acceleration) is overlaid with the azimuthal position, and the time correlation of these signals is optimized. Because the start-up sequence is a slow procedure, this type of synchronization is very well suited for wind turbine experiments, where the azimuthal variations in the measured variables are of interest.
The data of all signals collected by the blade-mounted data acquisition, including the pressure belt, the wake rake, the inflow Pitot probe, and the acceleration signals, were first processed by performing a down-sampling in the form of a block averaging of every four consecutive samples, effectively reducing the sample rate to 25 Hz (the same acquisition rate as for the wind turbine signals). Subsequently, a moving average with a window length of 10 samples (i.e., 0.4 s) was applied to all data sets. An example of pressure data collected by the belt and the wake rake before and after these data processing steps is shown in Fig. 6. For the sake of clarity, these plots show only every second pressure port of both the belt and the wake rake, for an exemplary time trace with a duration of 60 s. The characteristic sinusoidal variation in all signals is due to the rotation of the turbine with a 1P frequency in combination with shear in inflow and minor instantaneous yaw errors. The reduced frequency corresponding to the 1P variations is approximately k∼0.01.
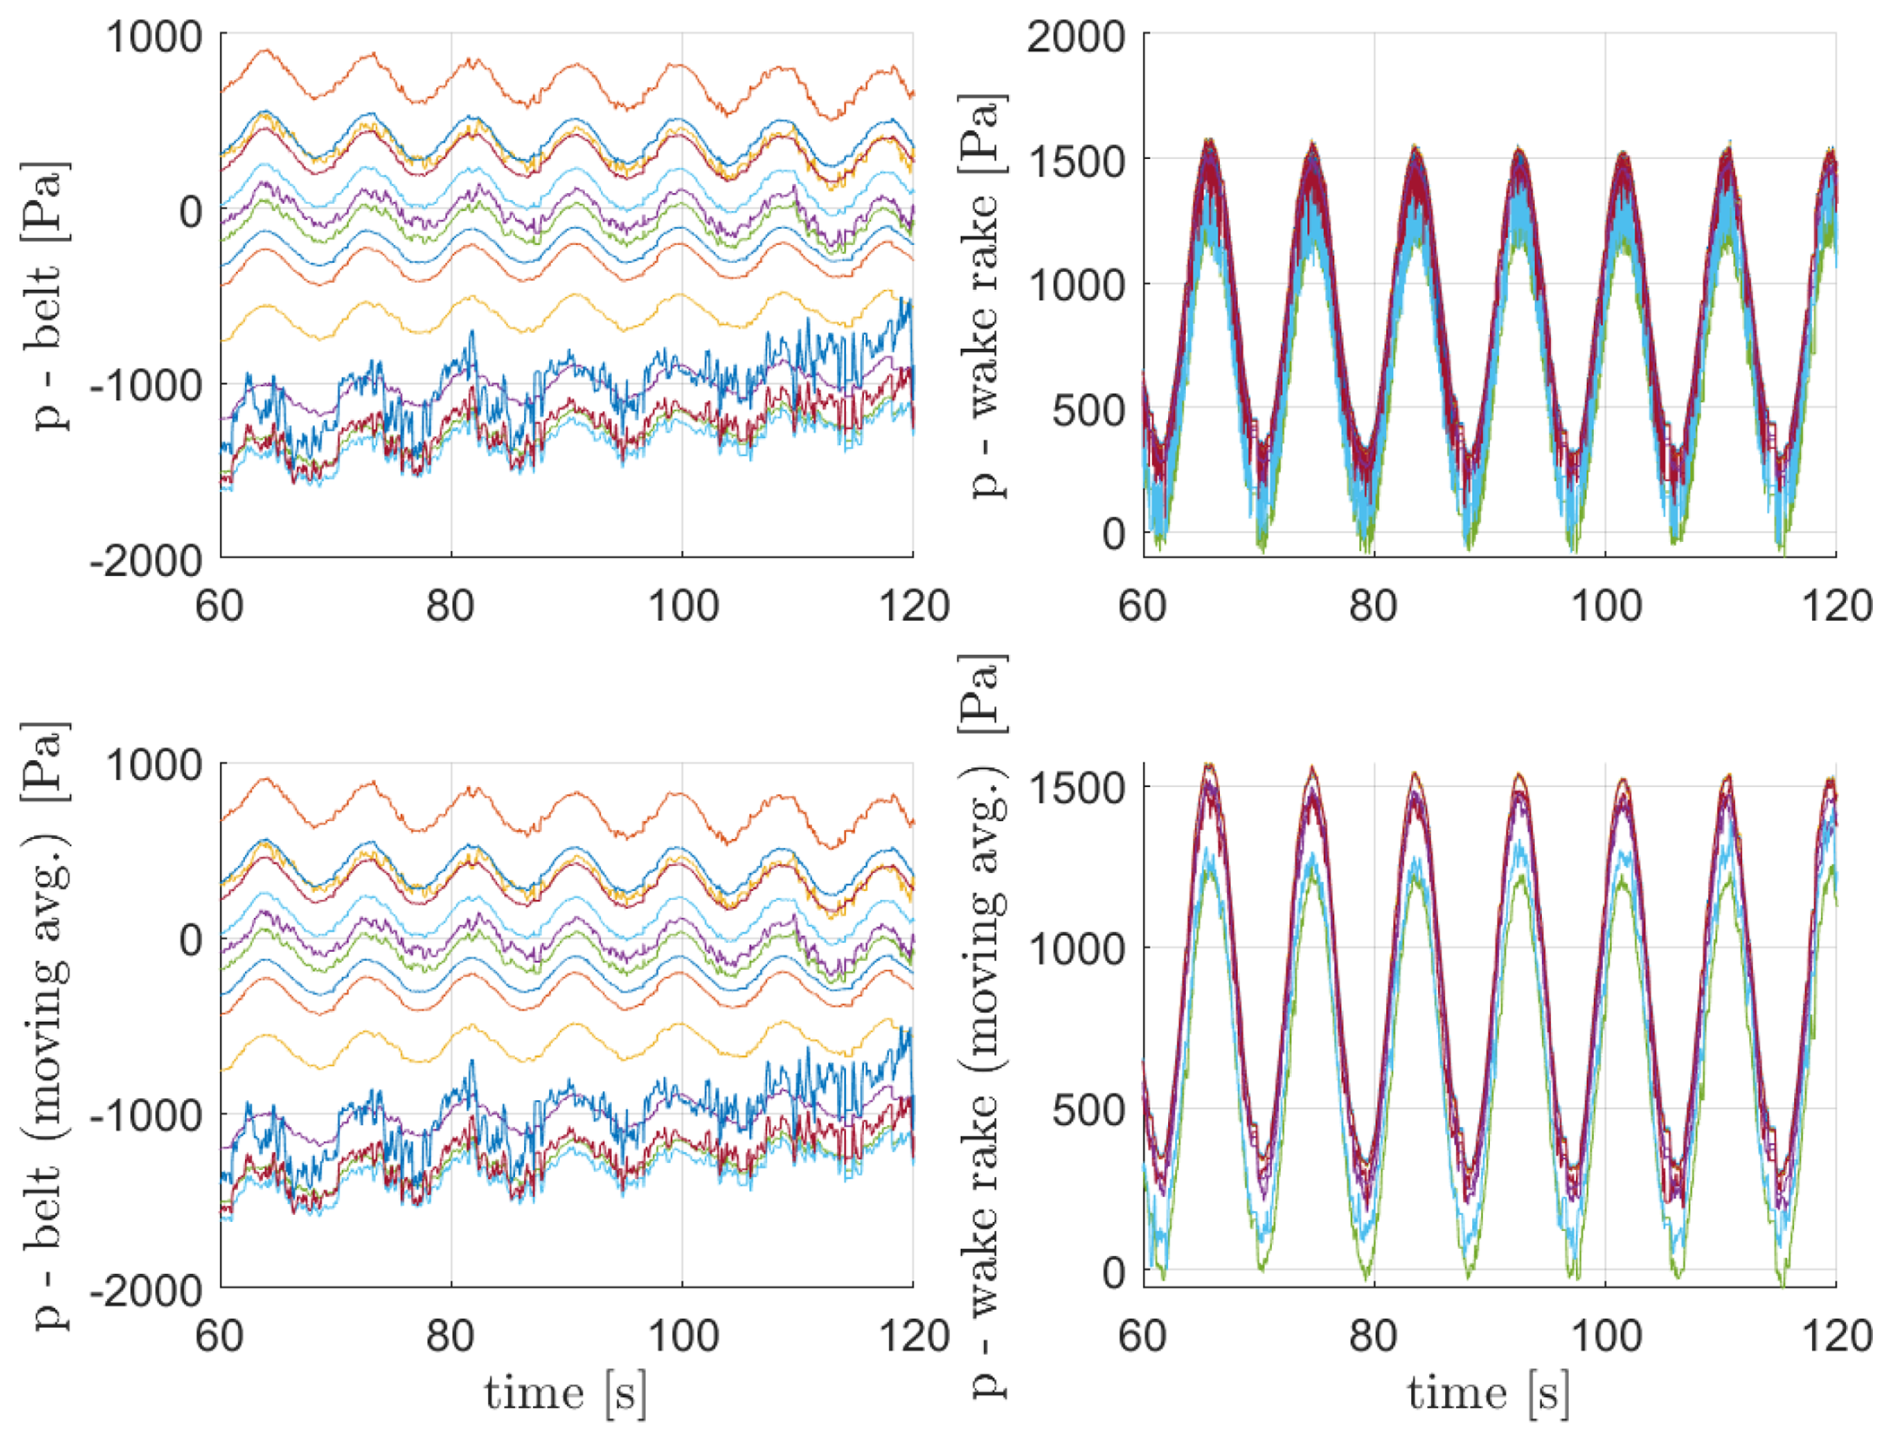
Figure 6Exemplary time traces of different pressure signals from the pressure belt and total pressure wake rake probes with and without block and moving average.
For the evaluation of the lift coefficient, the first step is to integrate the individual pressure measurements of the belt along the contour of the airfoil. Except for the viscous forces, this integral yields a total aerodynamic force on the airfoil section. The total force is initially projected into directions normal and parallel to the chord, using the information of the airfoil geometry. These two components are then transformed to obtain the components perpendicular and parallel to the flow using the angle of attack measurement of the Pitot probe, representing the lift and pressure drag of the airfoil, respectively. The pressure drag is not further processed because the total drag is obtained directly from the velocity deficit measured with the wake rake.
To obtain the lift coefficient, the lift force is normalized with the local chord in the position of the pressure belt and with the dynamic pressure Q. The dynamic pressure would normally be measured from the Pitot probe. However, the Pitot dynamic pressure measurement was faulty during the campaign, with values clearly underestimating expected levels by up to 40 %. Therefore, the dynamic pressure Q was obtained from the difference between the outermost total and static pressure probes of the wake rake, i.e., the probes that are least influenced by the presence of the airfoil and which are located in the “flat” region of the velocity deficit.
The angle of attack of the airfoil is measured with the Pitot probe using the correlation coefficients for the five-hole measurements obtained in a wind tunnel calibration. Furthermore, the measurement is corrected for the mounting angle of the probe (8° with respect to the chord line). Finally, the local impact of the airfoil upwash on the measurement location of the probe (which extends 480 mm into the flow) is estimated using CFD simulations of the airfoil with and without active flap actuation. Usually, for an airfoil without an active flap, a single linear correlation is found between the free wind inflow angle (i.e., the angle of attack) and the angle measured directly at the probe. This correlation is mostly linear within the linear range of the lift coefficient. However, for an airfoil with an active flap, this correlation varies depending on the actuation level of the flap due to its impact on the overall bound circulation level of the airfoil. The approach taken by the authors was to perform one CFD correlation for the maximum active flap activation position and one CFD correlation for the position where the flap was inactive. For all intermediate positions, linear interpolation was used, using the flap activation level as the interpolation factor. As discussed later, the uncertainty in the angle of attack measurements is one of the most important factors in the full analysis, as this value depends on the accuracy of the calibration and measurement, the potential geometry deviations during mounting, and the upwash correction for the operational turbine.
2.3.7 Uncertainty analysis
Although a comprehensive uncertainty quantification study is beyond the scope of this work, an attempt to list important sources of uncertainty is presented here.
Some components of the measurement and processing chain are estimated to have a minimal contribution to the results. These include the pressure scanner measurement accuracy (which is 0.1 % full scale for the 100 mbar measurement range). The Pitot tube and wake rake total/static pressure tubes have also been calibrated in the wind tunnel with insignificant mounting uncertainty, so the accuracy depends only on the pressure scanners. Based on internal investigations of the dynamic response for different tube lengths, it is estimated that the accuracy without any dynamic reconstruction is fine for frequencies up to 5–10 Hz. The statistical uncertainty is finally considered insignificant considering the number of data points.
The identified components with an estimated significant contribution to the accuracy of the results include the accuracy of the Pitot mounting angle and the upwash correction. The accuracy of the Pitot mounting angle is empirically estimated to be as high as ±2°. The impact of a potential offset of the rotor curve cl relative to the wind tunnel curve cl vs. AoA is attributed mainly to this uncertainty and not to a physical mechanism or a phenomenon of the rotor aerodynamics. For the current analysis, the curve cl was shifted by +2.5° to match the zero-lift angle of attack of the airfoil with the flap in its non-actuated position. Measuring the exact mounting angle of the Pitot probe with respect to the local chord of the rotor blade proved to be a complex undertaking, as there is no fixed reference for the measurement, and one has to rely fully on the assumed CAD compatibility of the flyboard and blade leading-edge shape.
Concerning the impact of uncertainty on the upwash correction, this is more complicated. The main impact of an inaccurate upwash correction will be a different slope of the rotor curve cl versus AoA compared to the wind tunnel data. However, for a blade section with flap actuation, this is even more complex, as the bound circulation can be changed due to both/either an angle of attack change and/or flap actuation. One of the best procedures to reduce this uncertainty is to carry out 2D CFD blade sectional computations and extract the inflow velocity vector at the same position as the Pitot tube for the different activation levels of the flap. This is the procedure used in the present post-processing as discussed above, but other methods using full 3D CFD rotor computations as the basis have been proposed in the past (e.g., Johansen and Sørensen, 2004; Shen et al., 2006; Madsen and Fischer, 2009). A comparison with these other approaches could lead to improved insight into the upwash correction and reduce the uncertainty in the AoA measurement.
Excluding installation and demounting time, the test campaign extended over a period of approximately 24 h from 17:30 on 28 July 2022 to 17:00 CET on 29 July 2022. These particular tests were part of the final phase 4 of the VIAs project testing, which was extended from July 2021 to August 2022 (see Table 3). During these 2 d, several individual tests were performed, mainly in which the operating conditions of the AFS were varied. The turbine operated mainly below rated conditions during the entire duration of the test, with wind speeds in the range of 3 to 10 m s−1 and rotor speed in the range of approximately 6 to 10 rpm, corresponding to chord-based Reynolds numbers in the range of 2.1–3.6×10⁶. One of the less practical factors of this campaign was that it is difficult to obtain measurements at high wind speeds with similar setups. The reason for this is the conflict with the required installation and demounting weather windows, which require rather low wind speeds for the safe operation of installation cranes. For future measurements, the goal is to design a more weather-resistant system such that the instrumentation can be left on the turbine for a longer period, removing restrictions on the installation weather windows.
The complete measurement period consists, as mentioned, of individual tests in which the active flap was actuated in different sequences. Furthermore, since this measurement technique with both the pressure belt and the wake rake was tested for the first time, some proof-of-concept tests were performed, such as applying zigzag tape to the leading edge of the airfoil to assess whether the wake rake system has enough fidelity to measure such local changes in the rotating and turbulent environment.
As a first exemplary result, some characteristic time traces of different calculated variables are shown in Fig. 7. In graph a of Fig. 7, an example of block averaging and moving window averaging is shown for a short measurement sequence of 60 s. Effectively, this averaging works as a very simple low-pass filter to avoid high-frequency peaks in the measured signals, making the analysis of the results clearer. The main frequency content of interest in the signals, which is around 1P, is far from the timescale of the averaging windows and therefore unaffected by it. It is important to keep the averaging window narrow to avoid introducing any artificial phase shifts of the signal. With the averaging parameters chosen by the authors, the averaging procedure of the wake rake and flyboard signals corresponds to a down-sampling from 100 to 25 Hz in an average-preserving manner.
Figure 7b shows an example of the angle of attack, as well as the lift and drag coefficients, for the airfoil section during a stepwise flap actuation test. For clarity, the flap actuation pressure is shown in each graph as a visualization aid. This particular example is chosen to display the ability of the system to capture the shift in aerodynamic properties caused by the actuation of the active flap. As seen in the figure, shortly after 10:36, a flap actuation cycle begins, swapping between on–off activation every 60 s. The angle of attack is only slightly affected by the flap actuation, whereas there is a clear impact on the lift and drag coefficients.
However, it should be noted that for this particular test case, the VGs were removed in the spanwise region of the pressure belt and wake rake, and the blade surface was cleaned. The fact that the VGs were removed might explain some of the strong increase in drag when the flap was activated, probably causing some local separation over the suction side of the flaps. The period of the activation cycles for this particular case is shown to ensure that several rotor revolutions are captured per activation cycle such that the 1P and active flap effects can be clearly identified.
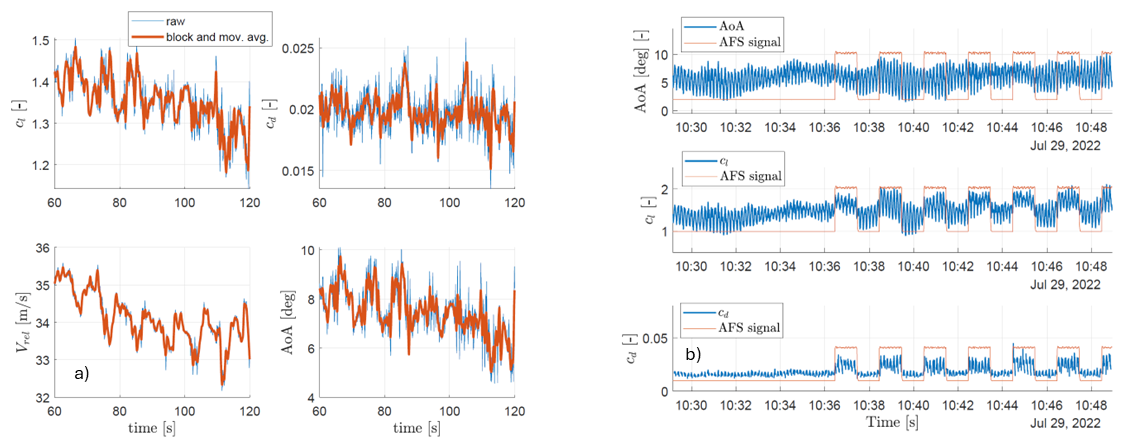
Figure 7(a) Exemplary time traces showing the impact of the block averaging and moving averaging. (b) An example of the processed signals for step actuation of the active flap, where the pressure signal is plotted in the background with an arbitrary scaling for the purpose of visualization. For this particular test case, the VGs were removed in the spanwise region of the pressure belt and wake rake measurements, and the blade surface was cleaned.
The plots of Fig. 7 are for qualitative illustration purposes only. For quantitative analysis, longer periods are required. For this purpose, the full measurement campaign is divided into individual tests, where the activation level (i.e., the pressure level) of the AFS and the actuation frequency are varied. Some of these individual tests have a duration of approximately 10 min, while others have a duration of several hours.
As a first example, a test in which the AFS was actuated at constant time intervals (60 s on, 60 s off) is shown in Fig. 8. The results are presented as airfoil polars that have been filtered for two individual pressure levels. The two levels of this figure are labeled AFS inactive and AFS active, corresponding to the flap being fully retracted and activated with a control set point of 75 %, respectively. At this control set point, the flap reaches an angular deflection of approximately 10°. From the lift polar, the impact of AFS activation is clearly visible. At a representative angle of 6.5°, a variation in the lift coefficient of Δcl=0.26 is measured. For the same angle, the wind tunnel data suggest . For clarification, note that the wind tunnel data plotted in Fig. 8 are based on Δ applied to a reference airfoil measured in the wind tunnel. However, because the airfoil geometry measured in the wind tunnel and the flap chord scaling do not match 1:1 (owing to the maximum chord limits of the wind tunnel), the AFS Δ due to actuation in the tunnel are scaled down to match the real flap length to chord ratio at the actual station at which the pressure belt was installed.
The remaining polar plots for the drag coefficient and the lift to drag ratio show very good agreement between the field measurements and the wind tunnel measurements when considering Δ due to AFS activation. The absolute levels of drag measured with the wake rake are observed to be above the drag measured in the wind tunnel. Whether this is correct or not is a matter for future investigation, e.g., to determine if the turbulent outer flow causes a higher drag level. However, the trends of both the drag and the lift ratio as a function of the angle of attack correlate well.
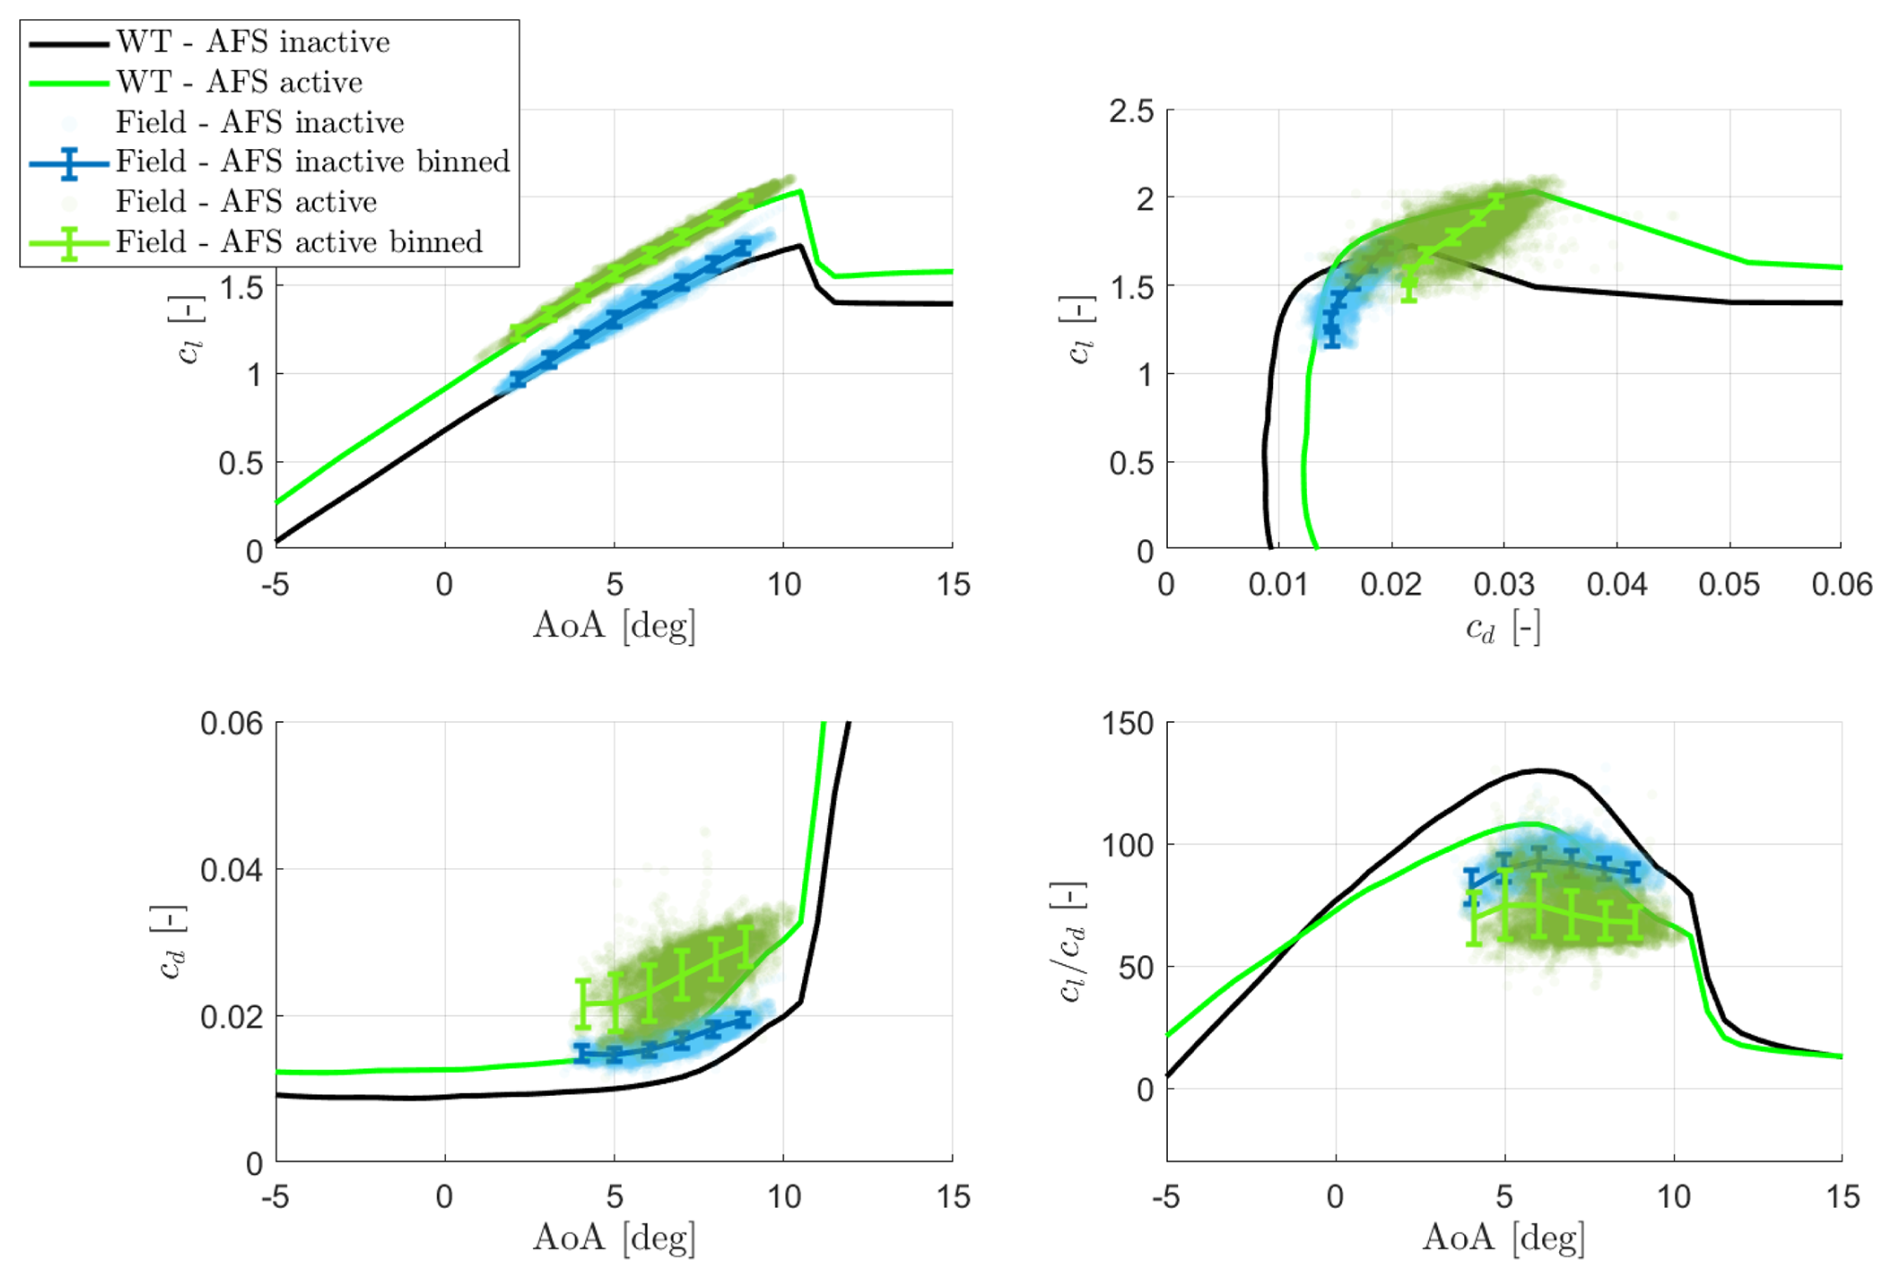
Figure 8Exemplary results of polars measured for the airfoil with and without active flap actuation.
As a further observation, it is seen that this version of the active flap leads to a visible increase in the drag coefficient base level. During the wind tunnel tests of this flap version, it was identified that the velocity deficit width behind the flap increases with the level of flap deflection. Although this result is not surprising, it highlights the need to improve the pressure recovery profile on the aft portion of the airfoil and its transition to the active flap. To better understand the source of the drag increase and to be able to correlate it with the velocity deficit measurements of the wake rake and the pressure belt, the signals of these two instruments were filtered for a narrow range of angle of attack in the interval 6±0.2°. Both the pressure distribution and the wake deficit measurements are shown in Fig. 9. Note in particular two characteristics of the wake rake velocity deficit with and without AFS actuation: a shift toward lower y values, i.e., a downward deflection of the airfoil wake due to the flap deflection, and an asymmetric widening of the velocity deficit showing a wider deficit on the suction side (toward positive y values) due to the local thickening of the boundary layer and small recirculation region directly behind the flap.
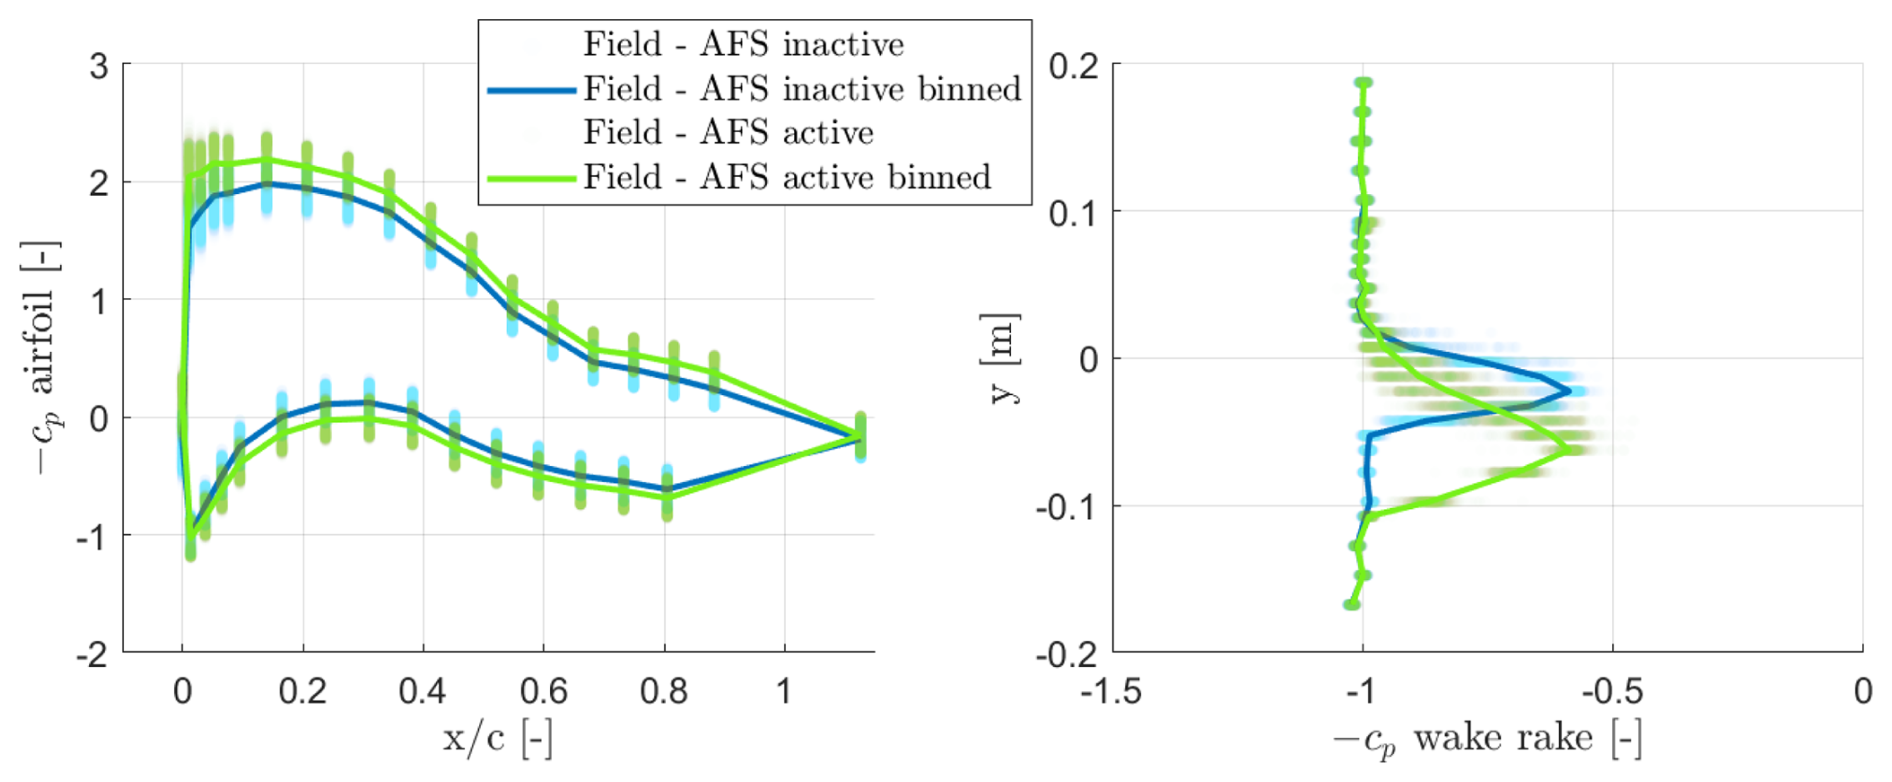
Figure 9Exemplary results of cp distributions and wake deficits for the airfoil with and without active flap actuation for the range of .
As a further demonstration example, an individual test is shown in which a 0.4 mm thick zigzag (ZZ) tape was applied in a location close to 2 % of the airfoil chord on the suction side. Similar to the previous example, the airfoil polars are shown separately for the case of the airfoil with and without ZZ tape. For this case, the main focus is on the impact on the drag increase. The airfoil polars with and without ZZ tape, as well as the cp plots for the pressure belt and the wake rake for , are shown in Figs. 10 and 11, respectively. Interestingly, the impact on the lift coefficient after the application of the ZZ tape is negligible, which is not the case for wind tunnel measurements, which usually show a small penalty in the mean lift level. Whether this is true or just an artifact of this particular measurement remains unanswered and is the subject of future investigations.
The impact on the drag coefficient is quite clear. The drag level is seen to be higher in its mean level but also starts to deviate towards higher cd values earlier compared to the clean airfoil. Compared to wake rake field measurements against wind tunnel measurements, the drag increase as a function of angle of attack is seen to occur in a more gradual manner in the field, in contrast to the sharper increase prior to entering stall, as observed in the wind tunnel. This difference could be attributed to the higher level of outer turbulence in the field that leads to a faster boundary layer development because of the outer flow bypass transition mechanisms. However, this is only a hypothesis.
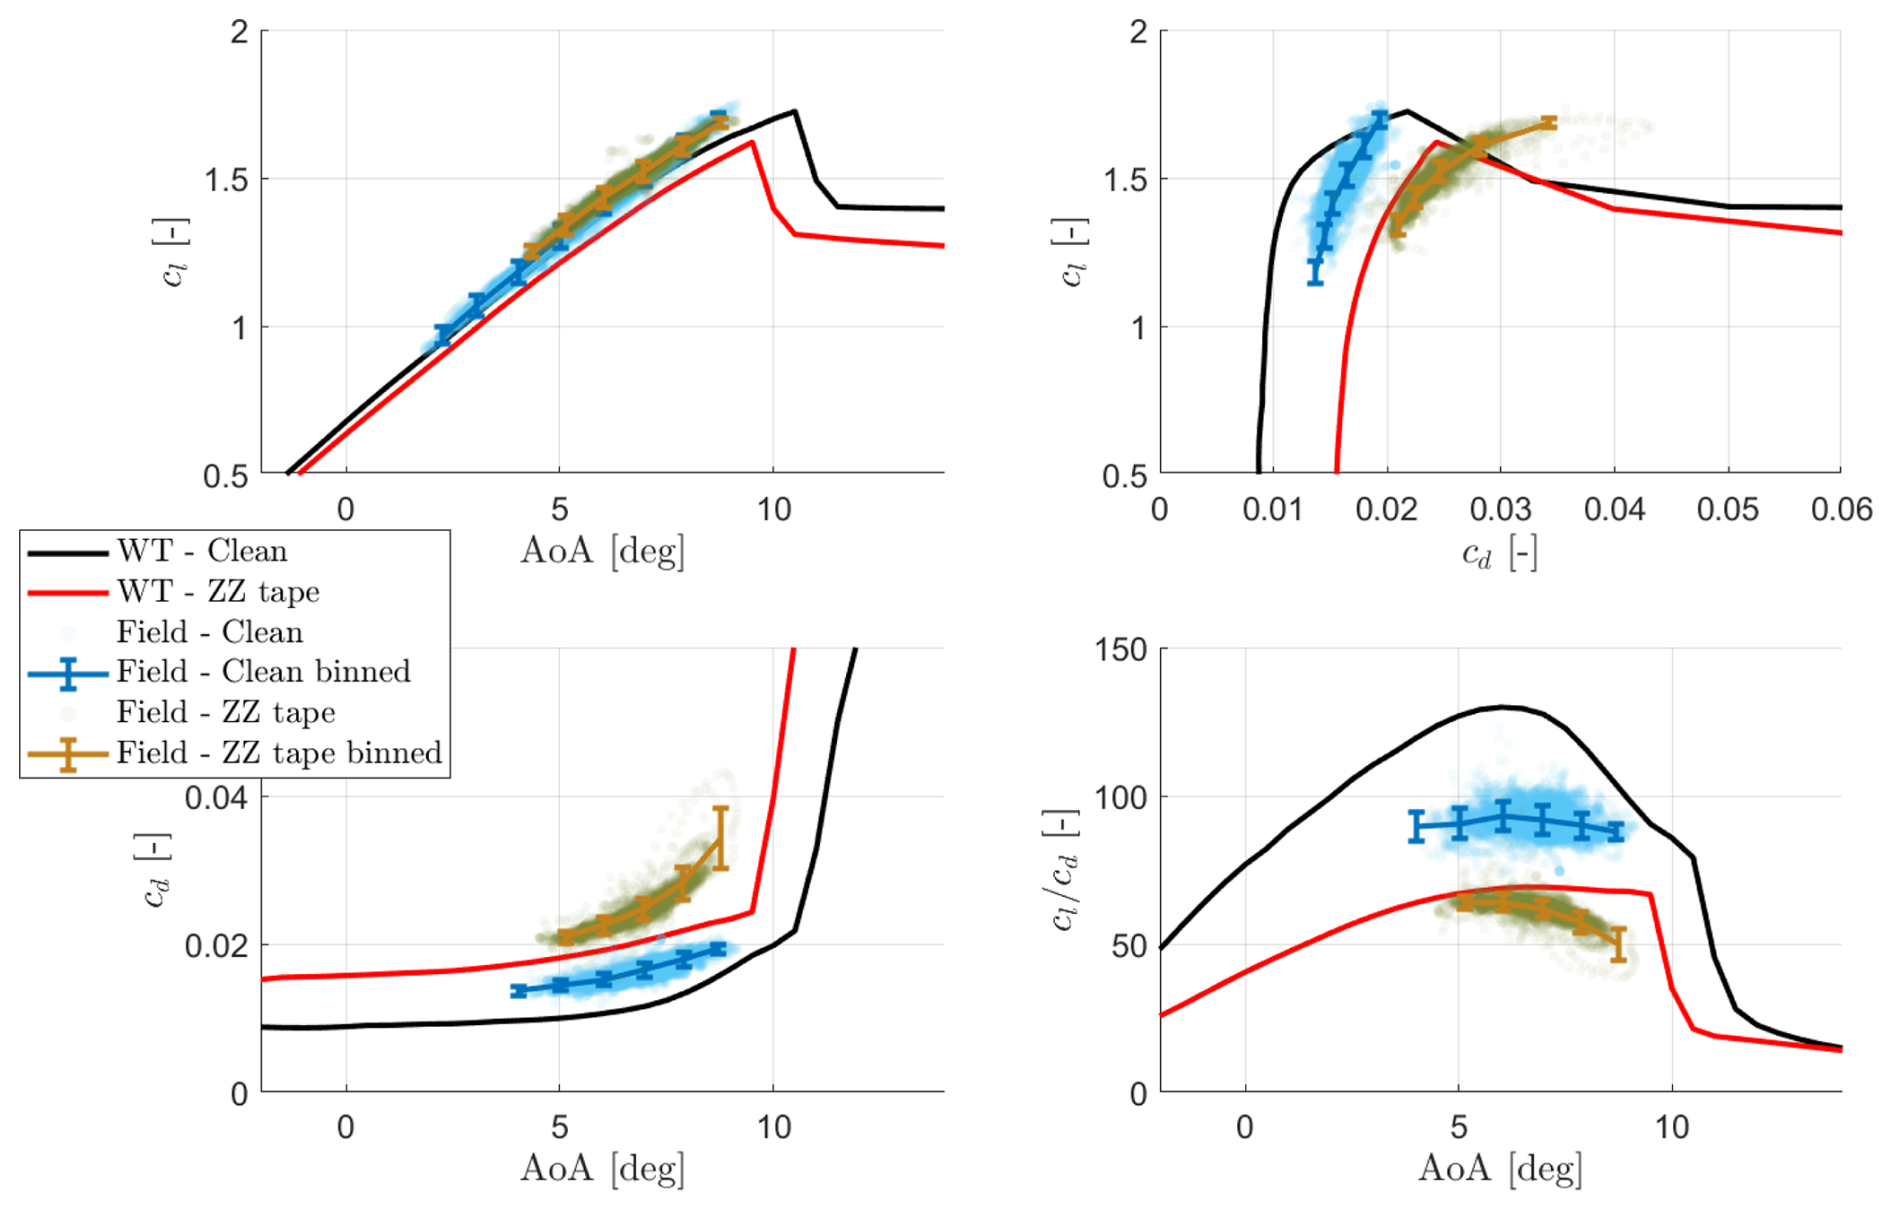
The comparison of the pressure belt and the wake rake pressure coefficients is shown in Fig. 11, where it is worth highlighting the differences in the velocity deficit profile. For the test with ZZ tape, the velocity deficit is wider toward the suction side because of the thickening of the boundary layer caused by the ZZ tape. Furthermore, the velocity deficit is deeper, a sign of the overall higher viscous losses of the flow.
If one compares the velocity deficit depth of the airfoil section with the AFS actuation in Fig. 9 to the ZZ tape deficit, it becomes clear that the increase in drag in the case of the ZZ tape is attributed to higher viscous losses (predominantly a deeper symmetric deficit), while the increase in drag for the case of the AFS in its activated position is predominantly due to increased pressure drag in the trailing-edge area (predominantly wider asymmetric velocity deficit).
Being able to draw this type of conclusion from field measurements highlights how promising these types of measurements are with regard to closing the gap in understanding between airfoils in the field vs. airfoils in the wind tunnel.
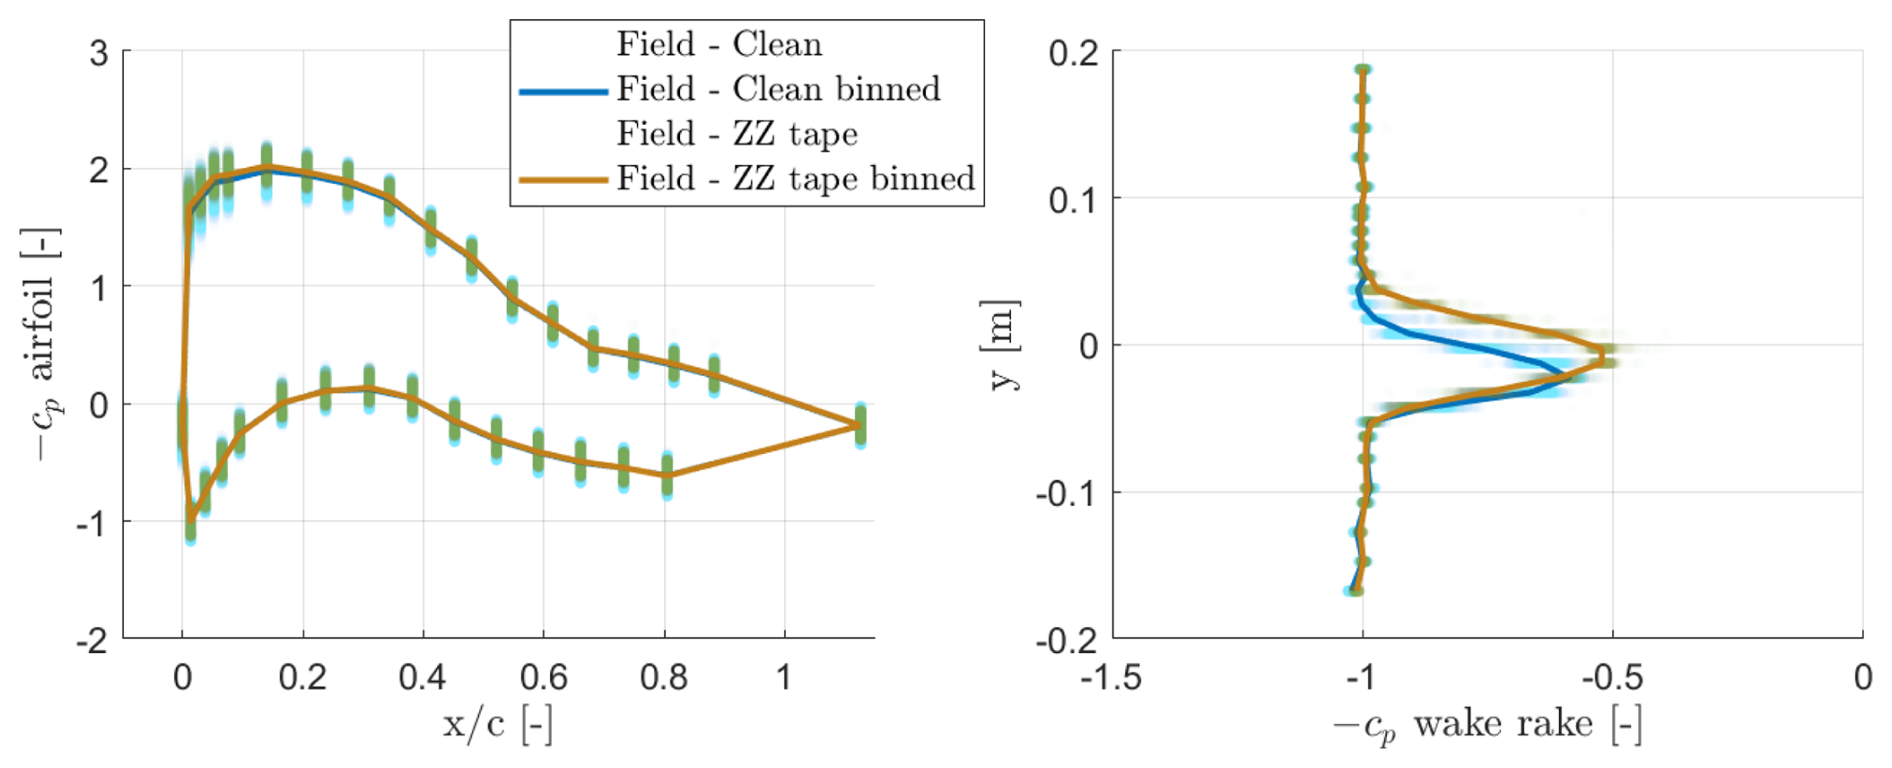
Figure 11Exemplary results of cp distributions and wake deficits for the airfoil with and without zigzag tape.
The present measurement campaign has been a kind of proof of concept for measuring the airfoil section drag under the natural operating conditions of a full-scale turbine. It is believed to be the first of its kind, where simultaneous measurement of airfoil pressure distribution, inflow angle and velocity, and wake velocity deficit allows for the characterization of cl, cd, and cp in a turbulent and rotating environment. Instrumentation and associated processing methods were developed to allow for detailed field characterization of an active flap system. The results of this measurement campaign provide valuable insight into the performance of the active flap system. However, the potential use cases of this novel measurement technique cover a wide range of aerodynamic applications, e.g., the study of airfoil characteristics at very high Reynolds numbers or the impact of atmospheric turbulence on natural transition and drag, to name just two examples.
It is seen that the system is able to measure small differences in the aerodynamic state of an airfoil section, e.g., drag differences from a clean leading edge vs. an artificially tripped boundary layer. With modern instrumentation and data acquisition systems with high accuracy in the analogue–digital interface, the main uncertainty in these types of measurements does not come from the instruments or the statistical uncertainty but rather from the overall corrections required, e.g., the upwash correction and the measurement of the free flow dynamic pressure. This is particularly true for rotor blades with active flow control devices such as active flaps, which influence the total circulation level such that the upwash at the probe location is not only a function of the angle of attack, but also a function of the actuation level of the device.
Some factors remain unanswered or have potential for future improvement, such as the correct approach to upwash correction for the Pitot probe (e.g., via full 3D rotor CFD), improved measurement of the physical alignment of the system with the local chord blade (e.g., via photogrammetry), considerations related to spanwise drag variations due to aerodynamic add-ons such as serrations, and a better understanding of the high absolute drag level. Furthermore, with the knowledge from this first campaign, several improvement areas for the hardware system itself were identified, including (1) higher weather robustness to allow for longer measurement campaigns, (2) an improved mounting alignment procedure and measurement of mounting angles, (3) an improved blade mounting strategy and procedure (a potentially more compact system), and (4) improved spanwise stiffness of the mounting frame.
In general, this campaign has shown that additional measurement of airfoil section drag, in combination with the measurement of pressure distribution, opens a range of promising new options for optimizing airfoil performance in its real operating environment. It could, e.g., optimize the size and position of vortex generators, either on new prototype blades or maybe on blades with some degradation of the surface.
The development and validation of a novel measurement system for full-scale drag measurements are presented. The system is developed in an effort to improve the understanding of rotor blade aerodynamics, with the aim of reducing the knowledge gap in airfoil sectional characteristics measured at wind tunnel and full-scale level. This measurement technique and its related instrumentation, using a combination of inflow measurements (Pitot tube), pressure distribution (pressure belt), and velocity deficit (wake rake), allow for the characterization of the aerodynamic state of the local sections to an unprecedented level of detail.
The performance of the full-scale measurement system is exemplified in a 2 d campaign on a modern 4.3 MW direct-drive wind turbine with a rotor blade equipped with an active flap system. The benefit of testing the system on such a blade is twofold: first, it demonstrates the ability of the system to measure changes in the aerodynamic characteristics of the airfoil when activating the flap in different modes, and, second, the data collected support the efforts of the full-scale aeroelastic characterization of the active flap system.
The capabilities of the system are shown with two exemplary tests within the same measurement campaign: the first, in which the active flap system is actuated at prescribed intervals, and the second, in which the airfoil section is measured with and without ZZ tape. The former is performed to demonstrate the ability of the system to measure changes in both lift and drag related to changes in circulation and to compare this with wind tunnel measurements. The latter test is performed to demonstrate the fidelity of the wake rake system in capturing local modifications of the boundary layer characteristics due to changes in viscous drag. In both cases, demonstrated in a rotating and turbulent environment, the system performed as expected.
However, from the measurements collected and the comparison with wind tunnel tests, it is seen that the absolute drag levels measured on the rotor are considerably higher. This possible difference in drag levels in the wind tunnel and on the rotor is exactly what we want to study with the new instrumentation. Further investigations of the present data set and new measurement campaigns will contribute to an understanding of what the true drag levels are. The deviations we see in the present data set could be related to the uncertainty in the dynamic pressure measurement and will be an area of improvement for future tests. Fundamental issues in extracting the drag from a highly unsteady velocity deficit are also a research area.
Ultimately, the continued development and optimization of blade-mounted aerodynamic measurement systems, such as the one presented herein, will help close the knowledge gaps regarding the aerodynamic characteristics of rotor blades in full-scale environments.
Due to confidentiality reasons, the data are only available to the project partners.
A short video clip of the full-scale testing can be found at https://www.linkedin.com/posts/helge-aagaard-madsen-ba006b93_demonstration-of-an-autonomous-measurement-activity-6970317822740570112–azA?utm_source=share&utm_medium=member_desktop&rcm= ACoAABPDpugB4LCfu2ALZyEjKEWnzV_xptui4xc (last access: 27 October 2025). A video showing the test of the wake rake on the rotating rig (RTR) can be found at https://doi.org/10.5281/zenodo.17062097 (Madsen et al., 2025).
All authors contributed to the work presented in this research paper. HAaM contributed to the planning of the test, data evaluation, and drafting the article; AGG contributed to the planning and execution of the test, the design of the turbine attachment concept, data analysis, and drafting of the paper; TB contributed to the planning of the test and writing a major part of the data processing software; ASO and AF contributed to the wake rake design, the test on the rotating test rig, and the data processing algorithms for the data collected by the wake rake and the flyboard; and SBI contributed to the design of the wake rake and the execution of the test.
The contact author has declared that none of the authors has any competing interests.
Publisher’s note: Copernicus Publications remains neutral with regard to jurisdictional claims made in the text, published maps, institutional affiliations, or any other geographical representation in this paper. While Copernicus Publications makes every effort to include appropriate place names, the final responsibility lies with the authors. Views expressed in the text are those of the authors and do not necessarily reflect the views of the publisher.
We acknowledge funding from EUDP-2019 (journal no. 64019-0061) of the VIAs project, making it possible to carry out the tests. Further data analysis has been partially funded by EUDP (journal no. 640241-521566) of the FAR project.
This research has been supported by the Energiteknologisk udviklings-og demonstrationsprogram (EUDP-2019, journal no. 64019-0061 (VIA's project) and EUDP journal no. 640241-521566 (FAR) project).
This paper was edited by Alessandro Bianchini and reviewed by three anonymous referees.
Ai, Q., Weaver, P. M., Barlas, A., Olsen, A. S., Aagaard Madsen, H., and Løgstrup Andersen, T.: Field testing of morphing flaps on a wind turbine blade using an outdoor rotating rig, Renewable Energy, 133, 53–65, https://doi.org/10.1016/j.renene.2018.09.092, 2019. a
Barber, S., Deparday, J., Marykovskiy, Y., Chatzi, E., Abdallah, I., Duthé, G., Magno, M., Polonelli, T., Fischer, R., and Müller, H.: Development of a wireless, non-intrusive, MEMS-based pressure and acoustic measurement system for large-scale operating wind turbine blades, Wind Energ. Sci., 7, 1383–1398, https://doi.org/10.5194/wes-7-1383-2022, 2022. a
Barlas, T., Pirrung, G. R., Ramos-García, N., González Horcas, S., Li, A., and Madsen, H. A.: Atmospheric rotating rig testing of a swept blade tip and comparison with multi-fidelity aeroelastic simulations, Wind Energ. Sci., 7, 1957–1973, https://doi.org/10.5194/wes-7-1957-2022, 2022. a
Boorsma, K., Giepman, R., and Herrig, A.: TIADE final report, Tech. Rep. TNO 2024 R12112, TNO, https://publications.tno.nl/publication/34643564/vPzmF6yO/TNO-2024-R12112.pdf (last access: 27 October 2025), 2024. a
Bortolotti, P.: Flipping the Script on Traditional Wind Turbine Technologies, https://www.nrel.gov/news/program/2024/flipping-the-script-on-traditional-wind-turbine-technologies.html (last access: 20 October 2025), 2024. a
Bortolotti, P., Fingersh, L. J., Hamilton, N., Huskey, A., Ivanov, C., Iverson, M., Keller, J., Lambert, S., Roadman, J., Slaughter, D., Thao, S., and Wells, C.: Upwind vs. downwind: loads and acoustics of a 1.5 MW wind turbine, Wind Energ. Sci., 10, 2025–2050, https://doi.org/10.5194/wes-10-2025-2025, 2025. a
Fredebohm, M., Theron, J. N., Höning, L., Weis, S., Stoevesandt, B., Wegner, A., Denecke, N., Rosemann, H., and Huhn, M. L.: Development of an aerodynamic measurement system for wind turbines, Journal of Physics: Conference Series, 2507, 012020, https://doi.org/10.1088/1742-6596/2507/1/012020, 2023. a
Fritz, E., Boorsma, K., Caboni, M., and Herrig, A.: Blade Surface Pressure Measurements in the Field and Their Usage for Aerodynamic Model Validation, Wind Energy, 27, 1483–1498, https://doi.org/10.1002/we.2952, 2024. a
Gomez Gonzalez, A.: The VIAs project, https://eudp.dk/projekter/validering-industriele-aktive-aerodynamiske-add-ons (last access: 27 October 2025), 2019. a
Gomez Gonzalez, A., Enevoldsen, P., Barlas, T., and Madsen, H. A.: Test of an active flap system on a 4.3 MW wind turbine, Journal of Physics: Conference Series, 2265, 032016, https://doi.org/10.1088/1742-6596/2265/3/032016, 2022. a
Gomez Gonzalez, A., Enevoldsen, P., Gamberini, A., Barlas, A., and Aa. Madsen, H.: Operational experience during a four year test program of active flaps on a wind turbine blade, in: X ECCOMAS Thematic Conference on Smart Structures and Materials (SMART 2023), edited by: Saravanos, D., Benjeddou, A., Chrysochoidis, N., and Theodosiou, T., pp. 850–865, 10th ECCOMAS Thematic Conference on Smart Structures and Materials, SMART 2023, conference date: 03-07-2023–05-07-2023, 2023. a
Johansen, J. and Sørensen, N. N.: Airfoil characteristics from 3D CFD rotor computations, Wind Energy, 7, 283–294, https://doi.org/10.1002/we.127, 2004. a
Jones, B. M.: The measurement of profile drag by the pitot-traverse method, Tech. Rep. 1688, Aeronautical Research Committee for the Year 1935–1936, 1936. a
Madsen, H. A. and Fischer, A.: Wind shear and turbulence characteristics from inflow measurements on the rotating blade of a wind turbine rotor, Ewec 2009 Scientific Proceedings, 1, 53–58, 2009. a
Madsen, H. A., Bak, C., Paulsen, U. S., Gaunaa, M., Sørensen, N. N., Fuglsang, P., Romblad, J., Olsen, N. A., Enevoldsen, P., Laursen, J., and Jensen, L.: The DAN-AERO MW experiments, 48th Aiaa Aerospace Sciences Meeting Including the New Horizons Forum and Aerospace Exposition, 2010-0645, https://doi.org/10.2514/6.2010-645, 2010. a
Madsen, H. A., Barlas, T., and Andersen, T. L.: A Morphing Trailing Edge Flap System for Wind, 7th ECCOMAS Thematic Conference on Smart Structures and Materials, pp. 1–10, 2015. a
Madsen, H. A., Özçakmak, O. S., Bak, C., Troldborg, N., and Sørensen, N. N.: Transition characteristics measured on a 2 MW 80 m diameter wind turbine rotor in comparison with transition data from wind tunnel measurements, Proceedings of the Aiaa Scitech 2019 Forum, https://doi.org/10.2514/6.2019-0801, 2019. a
Madsen, H. A., Barlas, T., Fischer, A., Olsen, A., and Gomez Gonzalez, A.: Inflow and pressure measurements on a full scale turbine with a pressure belt and a five hole pitot tube, Journal of Physics Conference Series, 2265, 022096, https://doi.org/10.1088/1742-6596/2265/2/022096, 2022. a, b, c, d, e, f, g
Madsen, H. A., Olsen, A. S., Barlas, A., Fischer, A., Ildvedsen, S. B., and Gonzalez, A. G.: Testing-wake-rake-on-rotating-rig, Zenodo, https://doi.org/10.5281/zenodo.17062097, 2025. a, b
Medina, P., Singh, M., Johansen, J., Jove, A. R., Machefaux, E., Fingersh, L. J., and Schreck, S.: Aerodynamic and Performance Measurements on a SWT-2.3-101 Wind Turbine, presented at WINDPOWER 2011, Anaheim, California, 22–25 May 2011, https://docs.nrel.gov/docs/fy12osti/51649.pdf (last access: 28 October 2025), 2011. a
Shen, W. Z., Hansen, M. O. L., and Sørensen, J. N.: Determination of Angle of Attack (AOA) for Rotating Blades, Wind Energy, 205–209, https://doi.org/10.1007/978-3-540-33866-6_37, 2006. a
Veers, P., Bottasso, C. L., Manuel, L., Naughton, J., Pao, L., Paquette, J., Robertson, A., Robinson, M., Ananthan, S., Barlas, T., Bianchini, A., Bredmose, H., Horcas, S. G., Keller, J., Madsen, H. A., Manwell, J., Moriarty, P., Nolet, S., and Rinker, J.: Grand challenges in the design, manufacture, and operation of future wind turbine systems, Wind Energ. Sci., 8, 1071–1131, https://doi.org/10.5194/wes-8-1071-2023, 2023. a