the Creative Commons Attribution 4.0 License.
the Creative Commons Attribution 4.0 License.
 | 05 Feb 2025
Semi-analytical methodology for fretting wear evaluation of unlubricated pitch bearing raceways under operative and non-operative periods
Mireia Olave
Iñigo Llavori
Ibai Ulacia
Jon Larrañaga
Aitor Zurutuza
Arkaitz Lopez
Current methodologies for the evaluation of fretting in pitch bearing raceways only consider damage induced by oscillating control movements. However, pitch bearings can remain static for long operative and non-operative periods, where load fluctuations cause fretting damage due to the small movements and deformations at the contact. In this work a semi-analytical methodology is presented and an analysis of the fretting phenomenon in pitch bearing raceways in the absence of lubricant under both productive and non-productive periods of static pitch control is accomplished. The analysis is performed following the energy-based wear model and the calculation of a total of 30 times series of 10 min of duration concerning winds speeds from 3 to 25 m s−1. As a result, critical locations based on the dissipated energy are identified for the different wind speeds and the contributions of operational and non-operational times, as well as the prediction of damage shapes on the raceway for both cases, are evaluated independently and compared.
- Article
(3350 KB) - Full-text XML
- BibTeX
- EndNote


The wind industry has grown remarkably over recent decades compared to the general industry due to the high demand for clean and renewable energy (Nematollahi et al., 2016; Rodríguez et al., 2019). This fact has been accompanied by new advances in design, materials, and manufacturing techniques that have ultimately resulted in wind turbines of larger dimensions and, consequently, larger components (Serrano et al., 2016). This fact and extreme operational conditions have led to complex scenarios where the methodologies for common components are not reliable. While new calculation procedures and design guidelines have been proposed for the analysis of the reliability of the pitch bearing raceway in terms of rolling contact fatigue and fretting damage, these techniques are supported by simple methods or high safety factors that generally result in conservative calculus and low design optimization (Harris et al., 2009; Stammler et al., 2024; Portugal et al., 2017; Houpert, 1999; Schwack et al., 2016; Heras et al., 2017; Olave et al., 2010; Lopez et al., 2019). This fact has promoted the usage of experiments to test the reliability of the wind turbine components under their different failure modes (Stammler and Geibel, 2024; Stammler et al., 2019; Menck et al., 2020; Schwack et al., 2021a). This technique has been applied to real-scale components, and therefore, it has provided effective and reliable results. However, it involves high costs due to the need for real-scale components, materials, and equipment, and these costs are even increasing due to continuous component growth. This raises the need for design methodologies and scaled testing approaches whose results are valid for real-scale applications (Olave et al., 2019).
Pitch bearings are typically large four-point contact ball (4PCB) bearings; they link the blades to the hub and allow pitch control to locate the blade in the optimal position to maximize lift of the airfoils and to reduce the structural loads when the wind is too high (Bossanyi, 2003). Due to the pitch control strategy, these bearings usually oscillate, and, eventually, the amplitude of the movement can be low enough (Harris et al., 2009) to result in rotational fretting at the bearing raceway (Schwack et al., 2016; Wandel et al., 2023; Stammler et al., 2019) as a consequence of the reciprocating rolling motion of the balls (Cai et al., 2020) and the evacuation of the lubricant out of the contact between the rolling element and the raceway. The fretting damage is also known as standstill marks (small amplitudes, ) or false brinelling (small amplitudes, ) (Presilla et al., 2023). This phenomenon has been extensively studied for different authors, whereby analytical (Cubillas et al., 2021b), numerical (Schwack et al., 2018; Lin et al., 2022) and experimental (Grebe et al., 2011, 2020; Schwack et al., 2021b) (Pittroff, 1961; Stammler, 2023) methods have been used to study the effects of these control movements on the fretting damage. As a result, it has been concluded that oscillatory movements of enough amplitude promote the relubrication of the raceway and aid in avoiding fretting damage. Therefore, the premeditated use of the control movements, called protection runs, has been experimentally studied to observe the movements' effects on the damage, with the aim of avoiding damage (Stammler et al., 2019).
Under some circumstances, such as pre-commissioning, low wind speeds, or safe operating stops, pitch control can remain static for long periods of time. Under such a scenario, pitch bearing must still accommodate tilting moments exerted by the wind and the blades' weight that are transmitted between the rings through the balls. As a consequence, balls experience variable loads, which may cause radial fretting (Zhu et al., 2006; Cubillas et al., 2021a), and additionally, this variable load causes small deformations at the ball and the rings' contact that result in small rolling movements (Olave et al., 2010) in the transversal direction of the raceway, squeezing out the lubricant, and, ultimately, they may cause rotational fretting.
Despite the efforts invested in the literature into the analysis of the pitch control moments on pitch bearing raceways, the effects of the variable loads when the pitch control remains static have not been studied. In our previous work, we developed and validated formulations for the analysis of radial fretting (Cubillas et al., 2021a), rotational fretting (Cubillas et al., 2021b), and the combination of both (Cubillas et al., 2021c) in small bearings.
The objective of this work is to propose a methodology to analyse the relative contributions of productive and non-productive periods of wind turbine operation to pitch bearing fretting damage, including identification of the most likely location of damage on each raceway. For this task, the 5 MW NREL reference wind turbine has been taken as a case study, and a total of 30 time series of different design load cases (DLCs) of normal production (DLC 1.2) and non-productive condition periods (DLC 6.4) from IEC 61400-3-1 have been evaluated through an energy-based wear model.
In this work, the damage evaluation has been addressed using energy-based wear models that have previously demonstrated adequate correlation to damage (Brinji et al., 2020; Schwack et al., 2018; Cubillas et al., 2021b). Although the present analysis does not consider the effect of the lubricant, pitch bearings are likely to be in boundary lubrication conditions when the pitch angle is not changing in non-operative periods and even in some low-wind-speed operations in which the model is valid. Therefore, the authors believe that the proposed method provides a reliable framework for the prediction of the most critical areas on the raceway where fretting damage can occur, as well as providing a basis for comparison between the severity of different wind speeds and operating conditions.
In previous work (Cubillas et al., 2021c), the authors developed and validated a complete methodology to predict fretting damage in static angular bearings subject to variable loads. In this work, this methodology is extended and adapted to the 4PCB bearing problem.
Figure 1 shows the flowchart of the complete methodology. The required inputs are the wind time series containing the value of the bearing reaction along the time Mx(t), My(t), and the geometry. The maximum value of the bearing reaction and the geometry are used to perform a series of experiments with finite-element model (FEM) simulations that determine a surface response with the values of every ball reaction and contact angle as function of the bearing reaction, ball ID (), row (), and contact ID (); see Fig. 2.
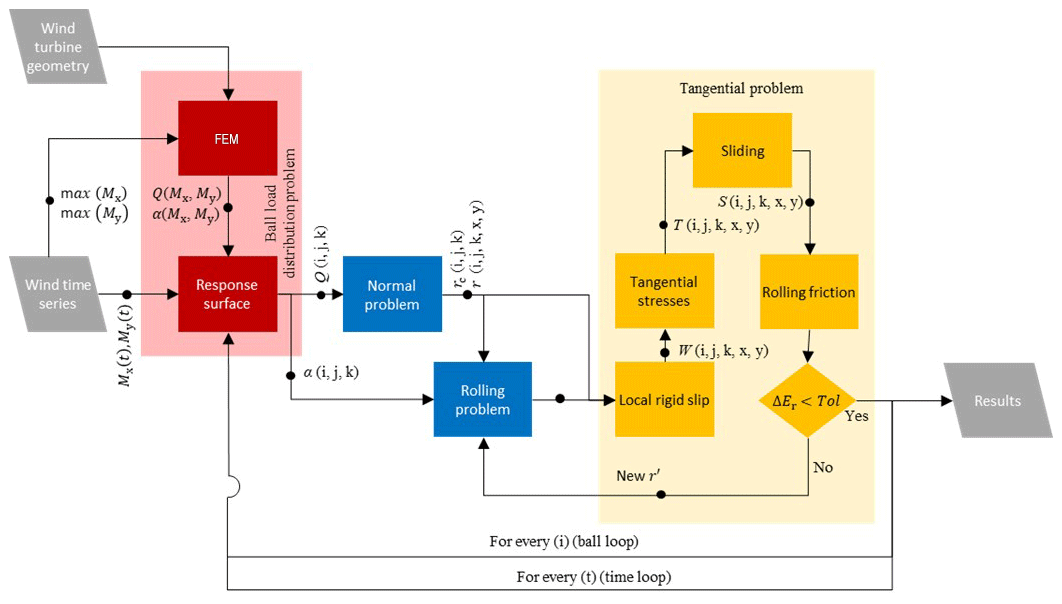
Figure 1Flowchart of the proposed semi-analytical formulation showing the necessary calculation process with the loops involved to calculate the fretting damage, where the suffix i defines the number ID of the ball, the suffix j defines the row ID, the suffix k defines the contact location, and the suffix t defines the time step. Q is the normal load over a contact, α is the contact angle, rc is the contact-deformed radius, r is the distance from a contact point to the rolling axis, r′ is the effective rolling radius, W is the local rigid slip, T is the tangential stresses, S is the local sliding, and Er is the rolling energy.
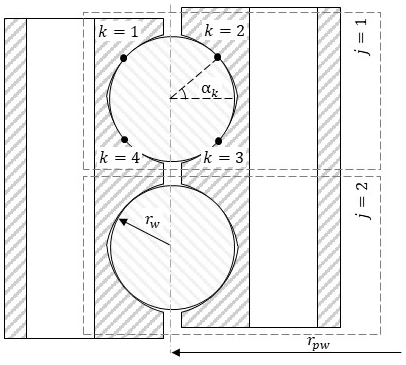
Figure 2Generic 4PCB bearing of pitch radius rpw; ball radius rw; and the definition of the contact through the suffix j, which defines the ID of the row, and the suffix k, which defines the ID of the contact location.
Once the response surface is created, it is possible to calculate the contact reaction, Q(t), and the contact angle, α(t), of every contact point of a ball in a specific time, and then the contact reaction provides enough information to calculate the contact deformations; the variation in the contact angle allows us to determine the ball motion. The kinematics of the ball are calculated following the authors' previous work (Cubillas et al., 2021c), with an iterative solver for rolling-friction minimization. This is implemented using the Nelder–Mead simplex algorithm, as described in Lagarias et al. (1998), with a tolerance applied to the function value of 10−4. Within this iterative solver, the local rigid slip, tangential stresses, and sliding are calculated. Finally, the fretting damage and the probability of damage initiation are calculated. Each of these steps is described in the following subsections.
2.1 Wind turbine: 5 MW NREL reference turbine
For the purpose of analysis, the 5 MW NREL case study has been selected (Jonkman et al., 2009). This model is a utility-scale multi-megawatt turbine, conventionally three-bladed and variable blade-pitch-to-feather-controlled. It has been used as a reference turbine by research teams throughout the world to standardize baseline offshore wind turbine specifications and to quantify the benefits of advanced land- and sea-based wind energy technologies (Zuheir et al., 2019; Cherubini et al., 2021; Halawa et al., 2018).
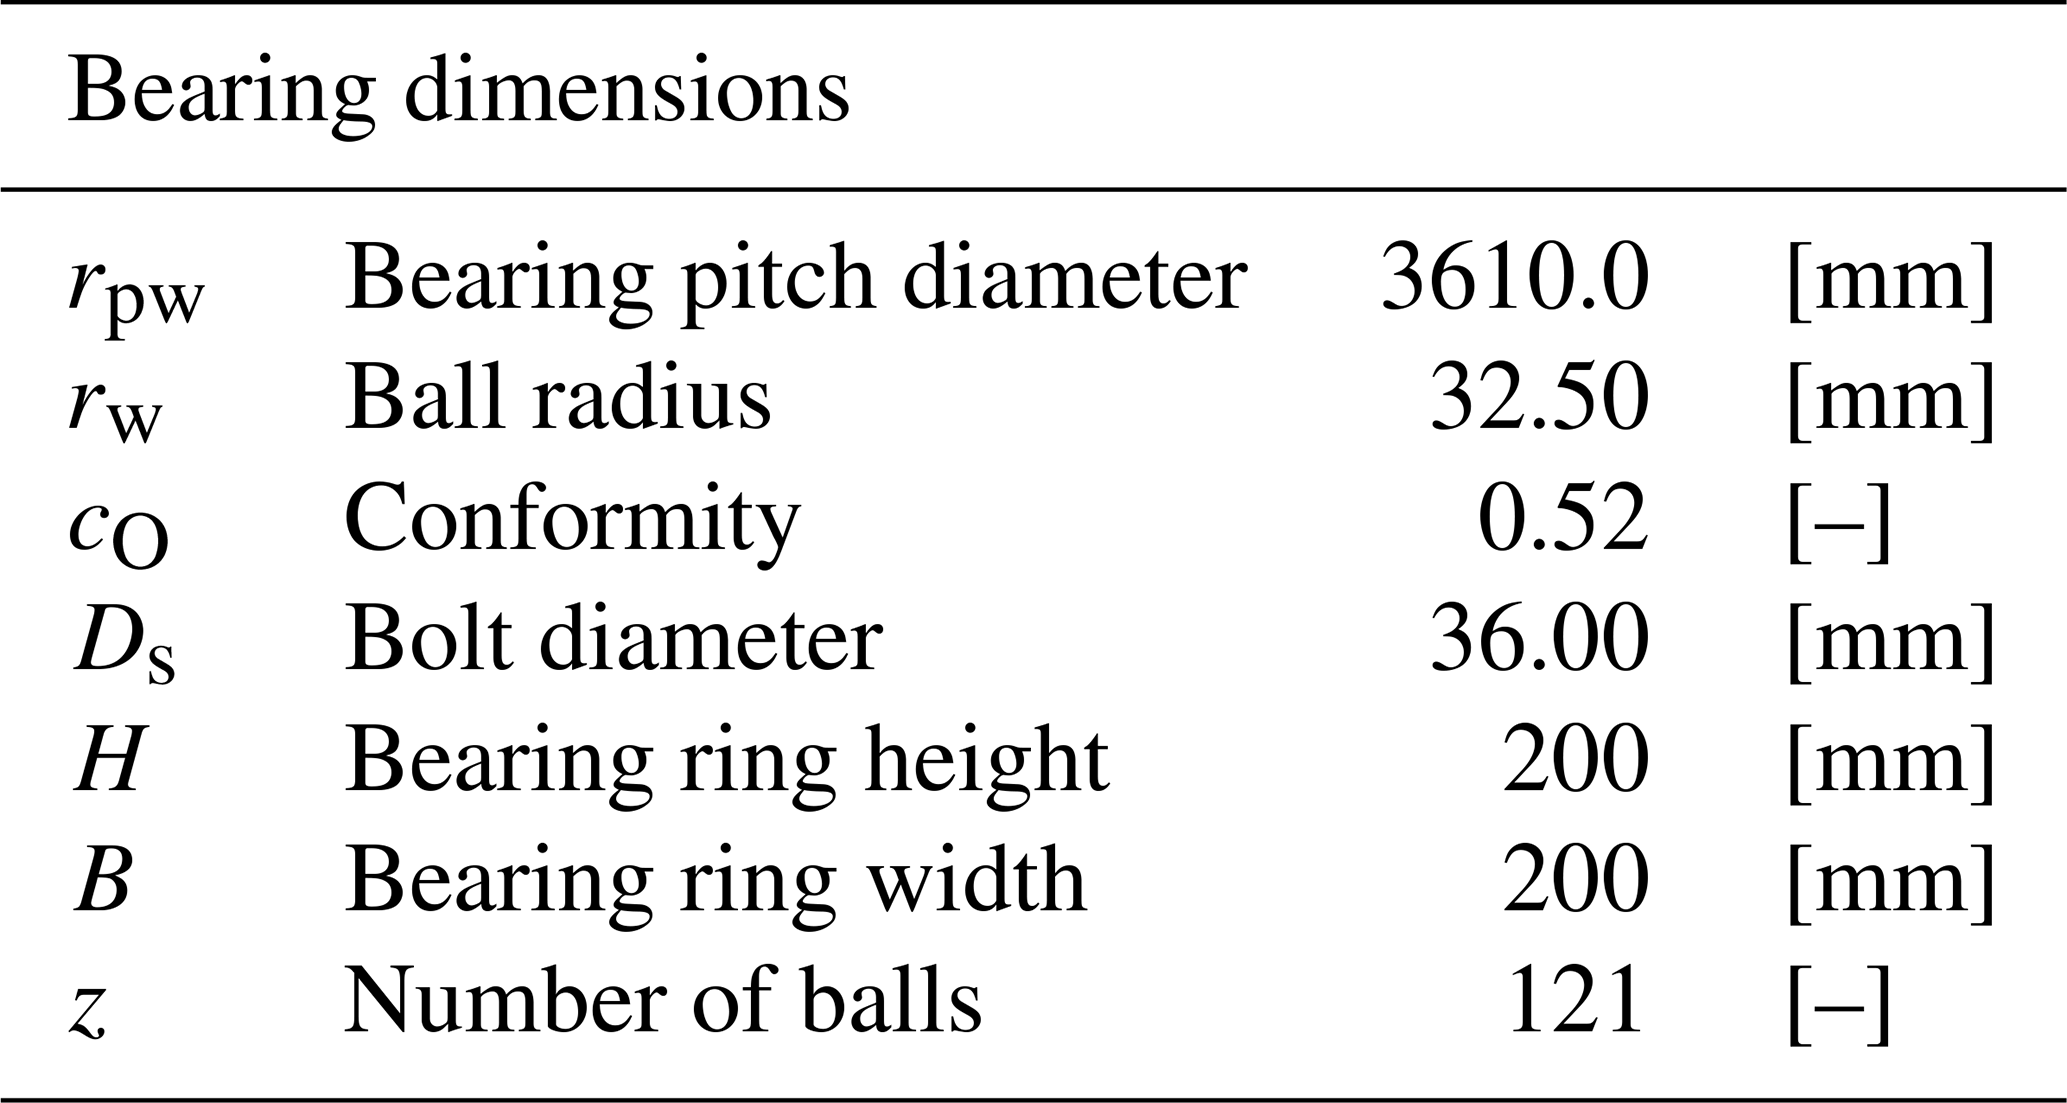
The bearing case study is a double-row 4PCB bearing attached to the hub and the blade through bolts. Table 1 summarizes the values of the main parameters of the bearing.
2.2 Pitch control and time series
Pitch control is usually collective pitch control (CPC) or individual pitch control (IPC) (Lopez et al., 2019). While CPC defines the position of the blades simultaneously, the IPC defines the position of each blade individually. Both controls result in oscillating movements, and besides this classification, the final routines of oscillations can be as specific as the turbine design, the world location, and the climate conditions. For this work, a reference control with five seeds of wind time series of the normal turbulence model (NTM) from winds of 3 to 25 m s−1 according to the design load cases (61400-3, 2009) DLC 1.2 (normal production) and DLC 6.4 (parked turbine with idling rotor) is available with an individual duration of 10 min at 20 Hz. Figure 3 shows the evolution of the power production with the wind speed and the value of the pitch bearing angle rate where the pitch control remains static for values under 7 m s−1.
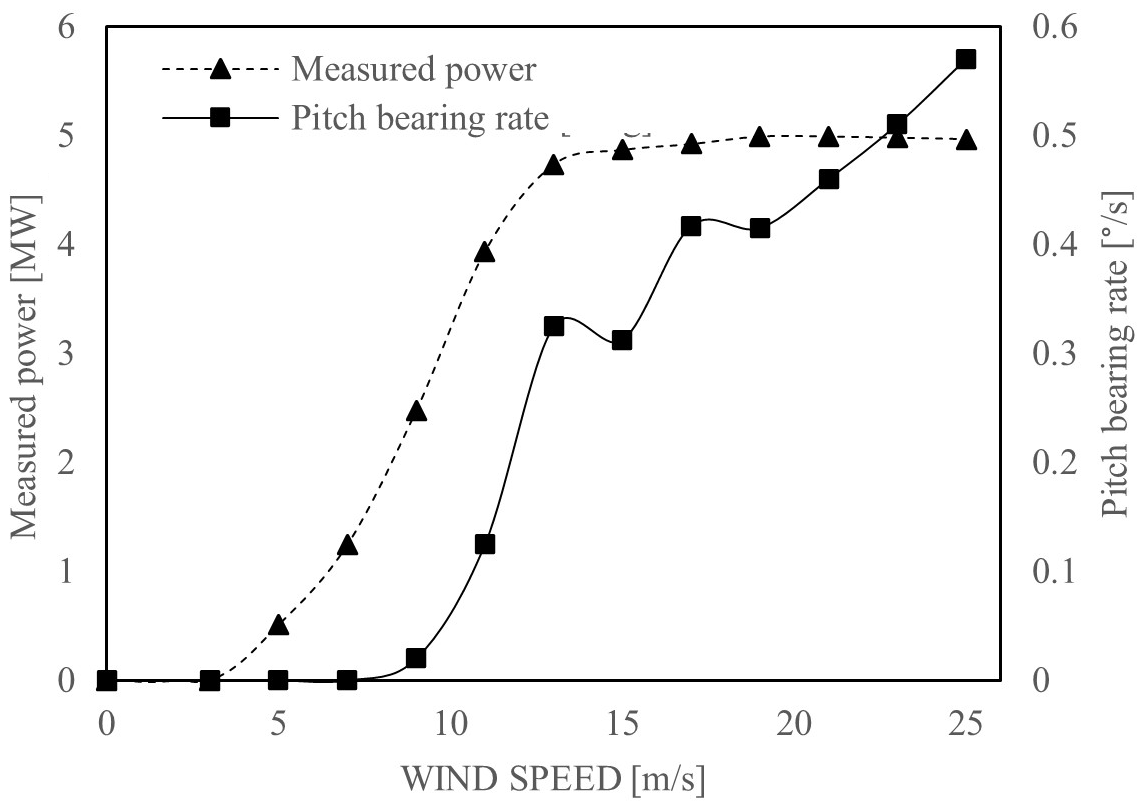
Figure 3Pitch control performance of the 5 MW NREL reference wind turbine as a function of the wind to a maximum 25 m s−1 speed and the measured power (Lopez et al., 2019).
Following the above observations, only series under 7 m s−1 are considered for DLC 1.2, series of 3, 5, and 7 m s−1, and all available series are considered for DLC 6.4, series of 3, 11, and 25 m s−1. The aeroelastic wind time series are decomposed into bearing reactions using the software Bladed (DNVGL-ST-0437, 2016).
2.3 Ball load distribution and contact angle problem
As described in Cubillas et al. (2021c), an FEM is necessary to calculate the contact reaction, Q, and the contact angle, α, of every contact of every ball under a specific bearing load scenario.
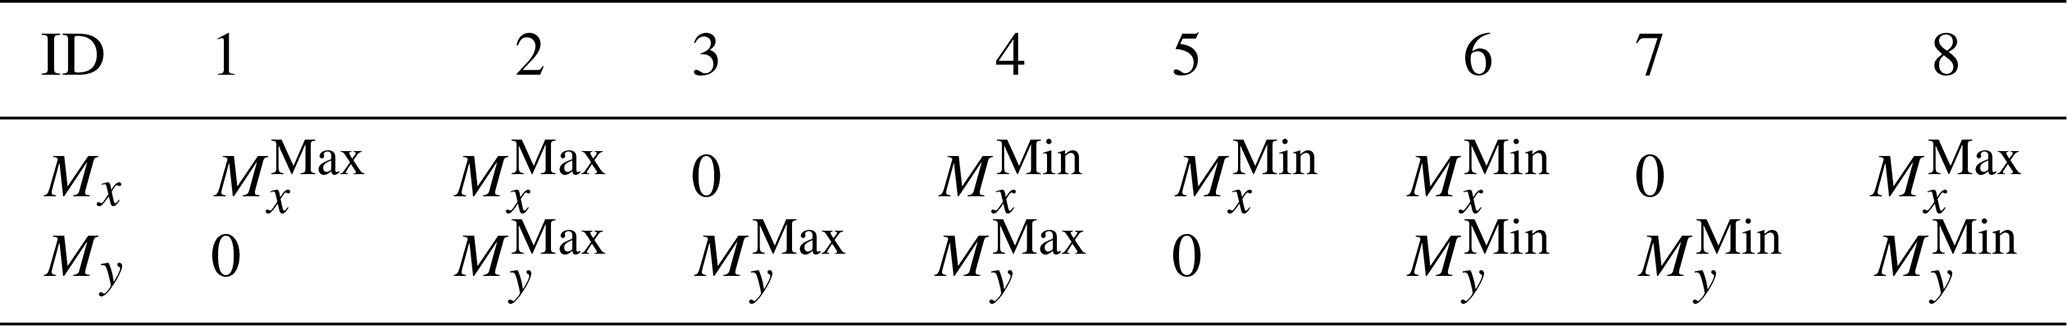
However, this method is time-consuming, and the calculation of every time increment of the time series is not practical. To manage this inconvenience, an experiment design is accomplished covering all possible load cases (see Table 2) that allows for the creation of a response surface. Radial forces and axial forces are neglected in this analysis as they have been demonstrated not to have a considerable effect on the bearing load distribution (Portugal et al., 2017). A total of 8 simulations are performed where the load is gradually applied in 10 load increments, resulting in a total of 80 load cases.
Table 2Design of experiments (DoE) for the development of a surface response of the contact reaction and contact angle.
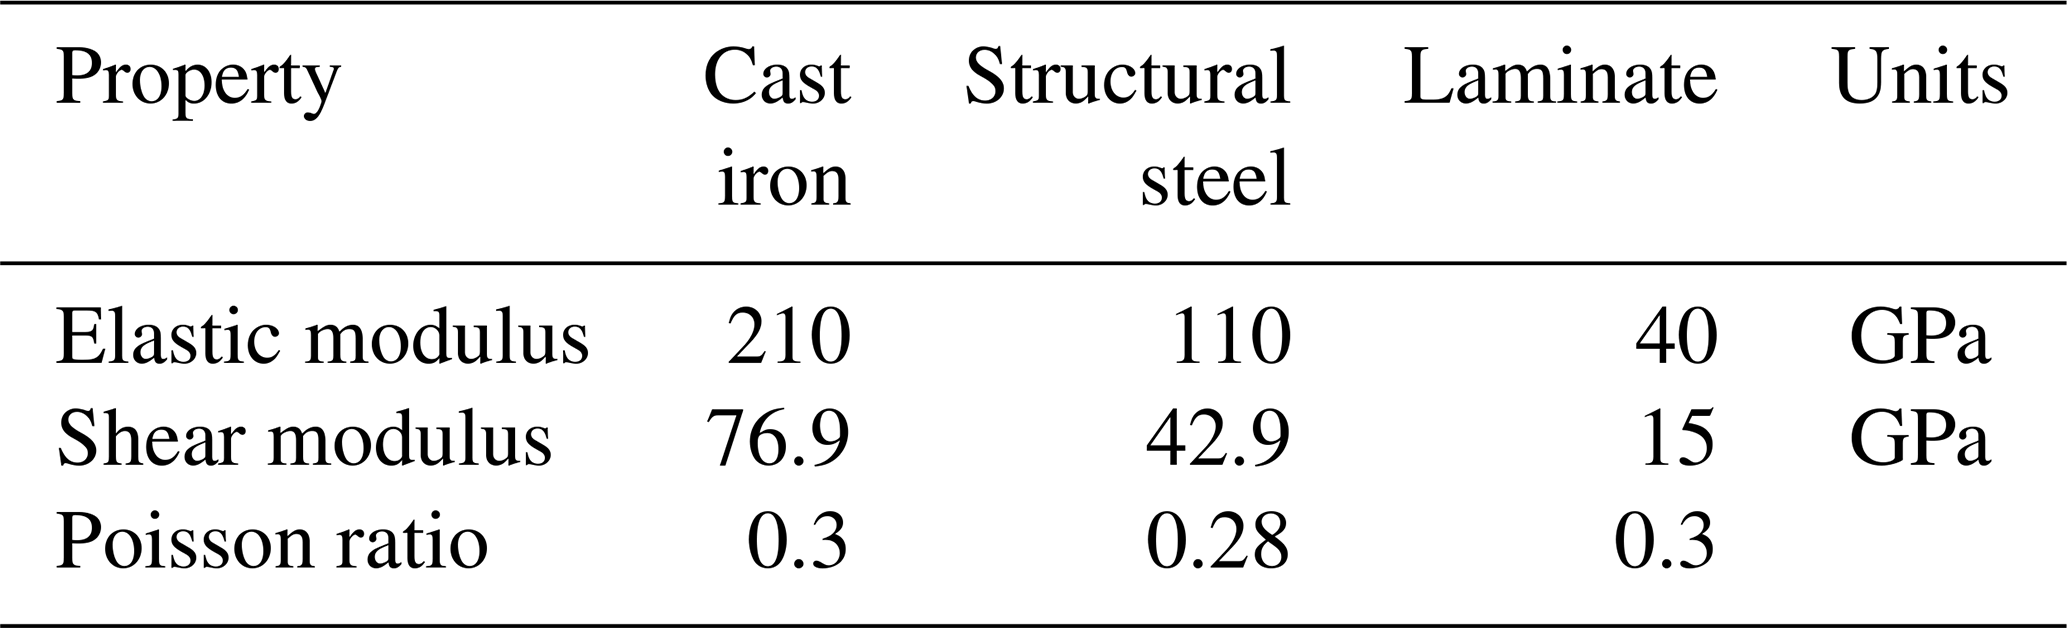
The FEM is built in Ansys considering not only the bearing geometry but also the geometry of the blade, bolts, and stiffeners. Nevertheless, symmetric behaviour is assumed, and only one blade and one-third of the hub is considered; see Fig. 4a. It is important to mention that the results in the areas around the circumference may be affected by this assumption by not considering the cross-effects at the root of the blade. The bearing and stiffeners are structural steel; the hub is cast iron; and, in the absence of a realistic blade design to carry out the calculation, a laminate circular tube with a constant section equal to the bearing ring has been incorporated to apply a geometric offset where the force can be applied. Table 3 summarizes the elastic properties of the materials mentioned.
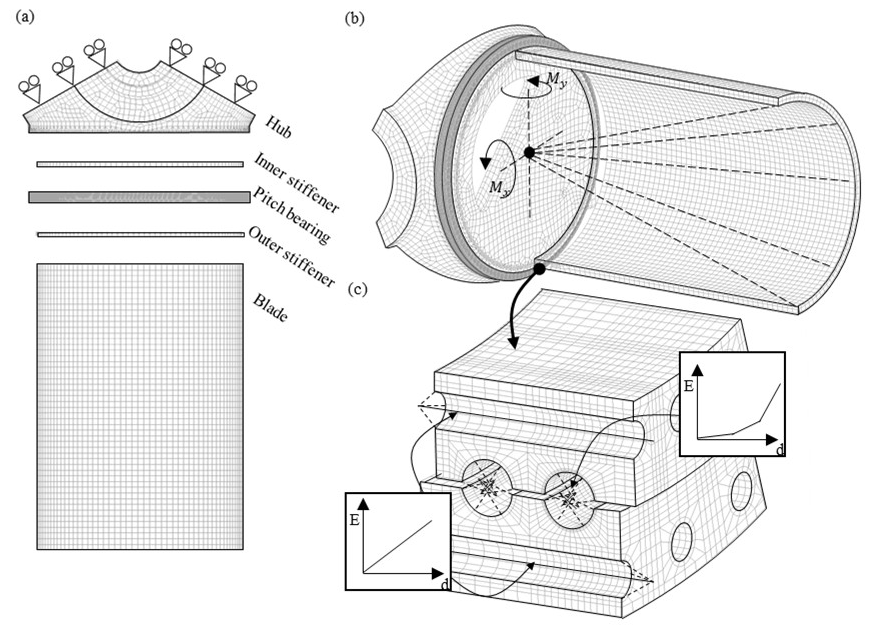
Figure 4FEM of the 5 MW NREL reference wind turbine formed by the hub, the pitch bearing, the blade, and the inner and outer stiffeners: (a) simplification of the original geometry considering symmetric behaviour of the hub; (b) application of the tilting moments through a remote point located at the bearing centre; and (c) detail of the bearing mesh and the simplifications of balls and bolts by a spring with non-linear and linear behaviour, respectively.
The entire mesh is composed of second-order elements, and a total of 1 562 761 elements are used in the entire model, with a maximum value of the element size of 10 mm in the bearing. Balls are replaced by two linear elements with variable stiffness connected to both bearing raceways (Daidié et al., 2008). To achieve this aim, rectangular partitions along the bearing raceway of dimensions (amax, bmax) are used. In these partitions, an ordered mesh of 2×8 elements is generated, and this is fixed to the end of the linear element at its opposite point, as seen in Fig. 4c. Analogously, bolts are replaced by linear elements considering the minimum section; see Fig. 4b.
Moment is applied through a remote point located at the bearing centre and linked to the blade with flexible behaviour. In this way, the decomposition of the moment is prevented, and a true moment is ensured. According to the previous assumption of symmetric behaviour of the hub, frictionless supports are applied to the cut surfaces to prevent normal deformations and allow deformations along the symmetry plane. Frictional contacts are used at the contacts between the bearing rings, stiffeners, and blade, with a 0.3 coefficient of friction with asymmetric behaviour and augmented Lagrange formulation. Bolt extremes are connected to the bearing rings, blade, and hubs with a multi-point constraint contact (MPC), and 608 kN of pre-tension is applied to the bolts based on a 10.9 grade.
2.4 Contact problem
The Brewe and Hamrock formulation (Brewe and Hamrock, 1977) can be used to define the contact area through the major and minor ellipse axis, a and b, respectively (see Fig. 5a):
where E is the elastic modulus of the material; v is Poisson's ratio; Sijk is the sum of the contact curvatures of the groove curvature at row j and raceway k; Qijk is the normal load at the ball i, row j, and contact k; and a* and b* are the dimensionless semiaxis quantity of the major and minor semiaxes, respectively. Appendix A describes the calculation of the above variables.
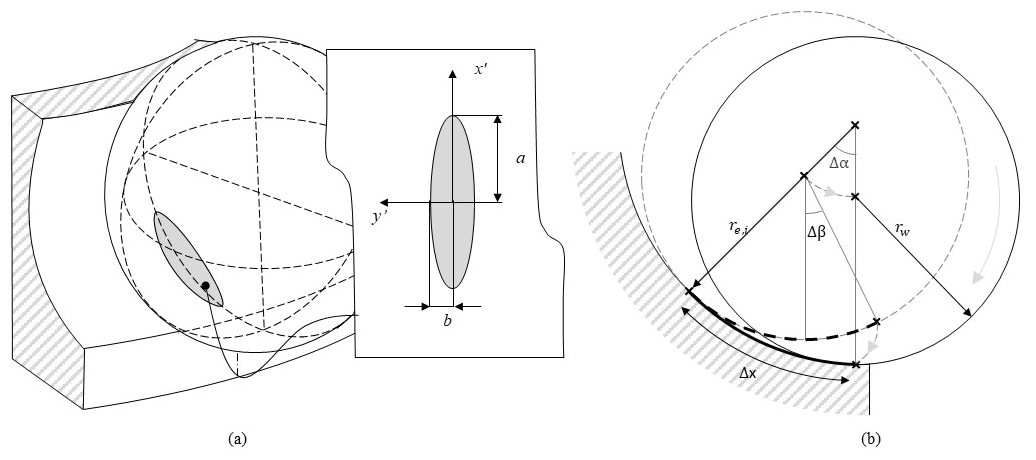
Figure 5Contact area and rolling motion of the ball. (a) Definition of the elliptical contact area through the major ellipse semiaxis a, and the minor semiaxis, b, and the local coordinates y′ aligned with the longitudinal direction of the raceway and x′ aligned with the transversal direction of the raceway; (b) depiction of the rolling motion of the ball in the raceway transversal direction.
Additionally, both bearing raceway and ball deform to finally coincide in a transversal curvature (Hertz, 1882), rc:
2.5 Transversal rolling problem
Following our previous work (Cubillas et al., 2021c), the distance of the ball travelled through the raceway, Δx (see Fig. 5a), can be calculated as
and the creepage, ε, is calculated as
where r′ is the effective radius (calculated in the iterative process of energy minimization) and r is the distance from any point to the rolling axis:
Here x′ and y′ are the local coordinates of the ball according to Fig. 5a, a(y) is the distance from a point to the ellipse bound in the x direction, and b(x) is the distance from a point to the ellipse bound in the y′ direction. They can be calculated as
respectively.
2.6 Tangential friction problem
Following Kalker (1981), the relative motion of two points, S (local slip), can be decomposed in the rigid displacements, W (local rigid slip), and the elastic displacements, U (local elastic slip):
Considering an initial condition of no slip, the local elastic slip is equal to the local rigid slip:
The following step is to determine the local rigid motion at the contact points:
where WNL is the local rigid slip caused by the variable normal load and WRo is the local rigid slip caused by the rolling effects.
According to our previous work (Cubillas et al., 2021c), the local rigid slip caused by the normal load is calculated as
On the other hand, the local rigid slip caused by the rolling motion considering the transient phenomena (Al-Bender and De Moerlooze, 2008) can be calculated as follows.
If and ,
If and ,
2.7 Tangential stresses, sliding, and rolling energy
Kalker's simplified theory (Kalker, 1982) is applied to determine the tangential stress T:
where L is the flexibility parameter calculated as
Here G is the shear modulus and C is the creepage coefficient. The creepage coefficient is tabulated as a function of Poisson's ratio and the contact area; however, for the numerical implementation of the method, a polynomial regression was taken from the tabulated values:
However, tangential stresses must be reconsidered at those points where slip occurs if .
where μ is the value of the coefficient of friction (CoF) and P is the contact pressure:
Then, reconsidering Eq. (11), the local slip is as follows:
Finally, the rolling energy, ER, is calculated from the local terms:
2.8 Fretting damage indicators
An energy-based model has been proposed and validated (Fouvry et al., 2003) for fretting applications, considering the dissipated friction energy where the wear volume, Vw, is proportional to the total accumulated friction energy (TFE), EF, and the wear coefficient, kw:
where EF is calculated from local terms as
The dissipated energy can be also expressed as a distribution through the density of the accumulated friction energy (DFE), ρF:
Then both the dissipated energy, EF, and its density, ρF, are instantaneous variables in local coordinate systems. To achieve the cumulative evolution of damage in the global coordinate system, these are translated into cumulative variables: the total accumulated friction energy, TFE, and maximum density of friction energy, MDFE. Thus, considering the change in position due to the variation in the contact angle,
In accordance with this work, multiple authors have found analogues result in multiple fretting wear applications and in particular for false brinelling prediction in roller bearings (Fallahnezhad et al., 2018, 2019; Brinji et al., 2021), angular bearings (Schwack et al., 2018), and thrust bearings (Cubillas et al., 2021c, 2022). However, the value of kw has shown dissimilar results as it is affected by multiple conditions such as frequency, sliding distance, or pressure (Brinji et al., 2021), but it will also be greatly affected by lubrication conditions. Considering this fact and keeping in mind the objective of identifying critical areas and adverse behaviour, the damage assessment is performed through energetic parameters only, TFE and MDFE.
In this section the results from the simulations are presented. First, the load and contact angle distributions are studied to determine the areas that are exposed the most to variable loads and variable contact angles. Then the distribution of the damage is analysed and compared to the load distribution to determine its effects on the final damage and the effects of the wind. Finally, the results of the probability of damage initiation are presented, and a cumulative model for variable winds analysis is proposed.
3.1 Load distribution and contact angles
Figure 6 shows the distribution of the mean and the amplitude load; the mean and the amplitude contact angle; and the damage indicators – the total accumulated friction energy, TFE, and the maximum density of friction energy, MDFE – after the simulation of the 15 wind series of 10 min of DLC 1.2 and DLC 6.4, respectively. For a clearer presentation of the results, contacts are classified according to the load diagonal, the row, and the ring (inner and outer); according to the high number of contact points and the similarity between adjacent locations, the results correspond to the mean value of two adjoining balls with the objective of facilitating the presentation of the data. Furthermore, considering the large difference between the damage values obtained in production and non-productive times, it has been decided to use different scales.
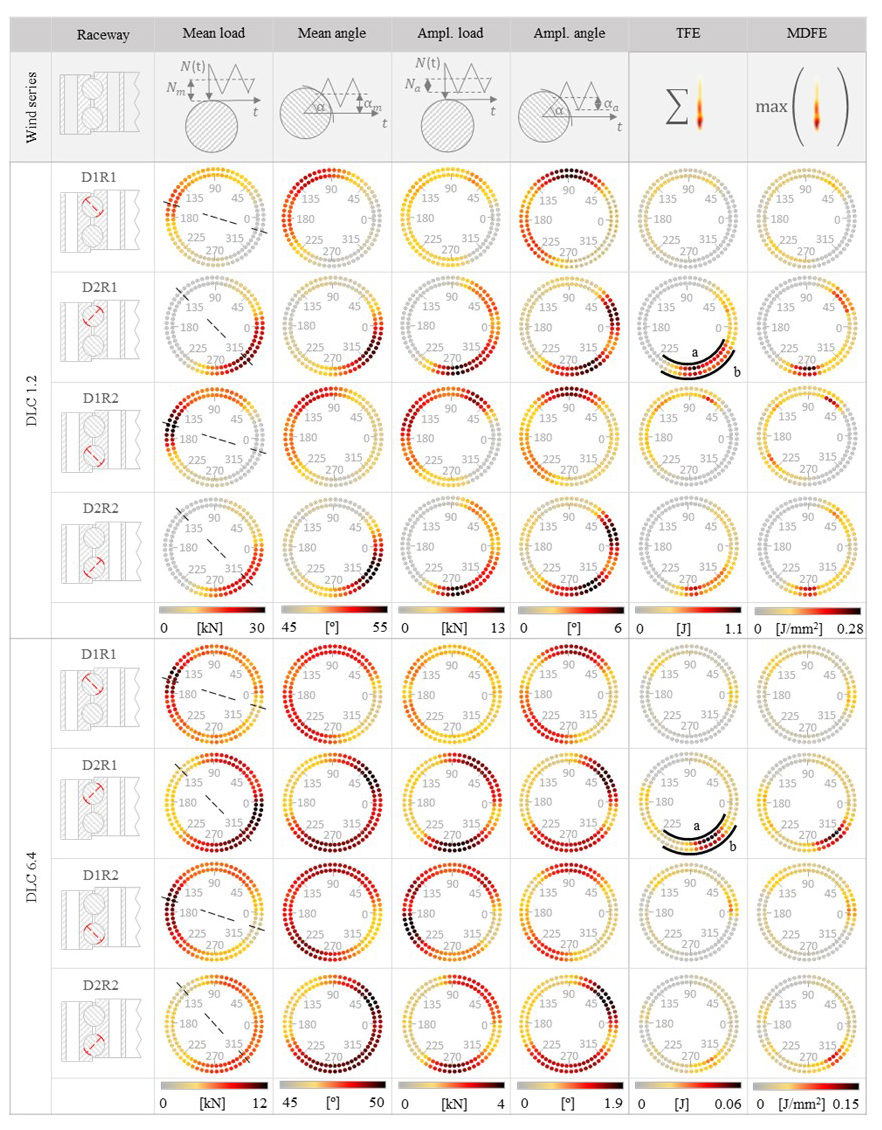
Figure 6Summary of the results of the analysis of the mean load, amplitude load, mean angle, amplitude angle, the total accumulated friction energy (TFE), and the maximum value of the maximum density of friction energy (MDFE), where results are classified according to the row location and the load diagonal and for the different design load cases, DLC 1.2 and DLC 6.4, moment might amplify the effects of the heterogeneous stiffness, resulting in different locations of the maximum values of the loads and the contact angles.
In this section, we first focus on the analysis of the loads and the contact angles. The results show the presence of variable loads and rolling motion (as consequence of the variable contact angle), and therefore the potential presence of radial and rotational fretting damage. Previous classification into load diagonals, rows, and rings allows us to easily observe the same value of the mean and amplitude load and mean and amplitude contact angle at the inner and the outer rings as the contact reactions are equal in magnitude with opposite directions.
Means and amplitude loads and contact angles show the expected symmetric behaviour with respect to a crossing axis from 150 to 330° (see dashed black lines in Fig. 6). Additionally, the values of the mean load and the mean angle on one side and the amplitude load and the amplitude angle on the other side, show some correlation. However, notable differences can be observed as the maximum values are not always located at the same angular position, and another interesting point is the dissimilar distribution between rows that can be observed through the maximum values at row 1 and row 2 being significantly different. These facts show the important effect of the heterogeneous stiffness of the structure and endorse the usage of the FEM to calculate the bearing reactions, as shown in Olave et al. (2010). The distribution of the mean load with the highest values located at D1 at 150° and D2 at 315° shows the effect of a permanent tilting moment of similar components Mx and My attributed to the mean load exerted by wind. The highest values of the mean load are 30 kN for DLC 1.2 and 12 kN for DLC 6.4 at D1R2 and D2R1. Similarly, higher values of the mean angle can be found in nearby locations at 120° in D1 and at 320° in D2, with similar maximum mean values of 58° at D2R1 and D1R2 for DLC 1.2 and 50° for DLC 6.4. On the other hand, the results of the analysis of DLC 6.4 show a more homogeneously distributed load over the bearing, where the lower value of the tilting is.
On the other hand, the higher values of the amplitude load are located at 60, 150, and 225° in D1 and 30 and 270° in D2, with a maximum value of 13 kN for DLC 1.2 and 4 kN for DLC 6.4. This distribution reveals the presence of a complex scenario with an alternative tilting moment of components Mx and My caused by the alternative load of the blade weight due to the turbine movement and the fluctuation in the wind. The regions of high variable load reveal critical regions for the occurrence of radial fretting. Similarly, the higher values of the amplitude of the contact angle can be found at 90 and 225° at D1 and 20 and 300° at D2, with a maximum value of 6° for DLC 1.2 and 1.9° for DLC 6.4 at D2R1. The amplitude of the contact angle indicates the presence of rolling motion of the balls, and consequently, these regions are critical for the development of rotational fretting.
3.2 Damage indicators
In Fig. 6, both damage indicators, the total accumulated friction energy, TFE, and maximum density of friction energy, MDFE, show similar distributions of the damage, with the TFE maximum at 60, 135, and 180° at D1 and at 30 and 275° at D2 and MDFE at 275° in D2R1 for DLC 1.2 and at 290° in D2R1 for DLC 6.4. These damage distributions retain certain similarities with the mean and amplitude load distributions and the mean and amplitude angle pointed out in the previous section. However, the correlation of the distribution of damage seems to have the best fit with the distribution of the amplitude load. Therefore, results might indicate that the main source of damage is the radial fretting caused by the variable load of the wind and the blade weight dynamics. This fact is aligned with previous work (Cubillas et al., 2021b), where the analysis of an angular bearing indicated that 70 % of the fretting damage caused for a variable load was produced by radial fretting. In addition, TFE and the value of MDFE show damage distributions where the inner ring is significantly more damaged in all diagonals and rows. The value of TFE in the inner ring (IR) is 1.8 to 4.6 times higher than in the outer ring (OR), and similarly, the value of MDFE of the IR is 1.2 to 3.6 times higher than that of the OR. As described in the previous section, the values of the contact reaction and the contact angle are equal in magnitude for the inner and the outer ring contacts; therefore, no differences can be made in terms of load or motion, and consequently, the different damage can only be attributed to the different contact curvatures of the bearing raceway where the inner contact is convex with respect to the longitudinal curvature (rb vs. rpw) and concave with respect to the transversal direction (rb vs. rp), while the outer ring contact is concave with respect to both transversal and longitudinal curvatures. Therefore, the increasing main diameter of the bearings would aid in balancing the damage at the inner ring.
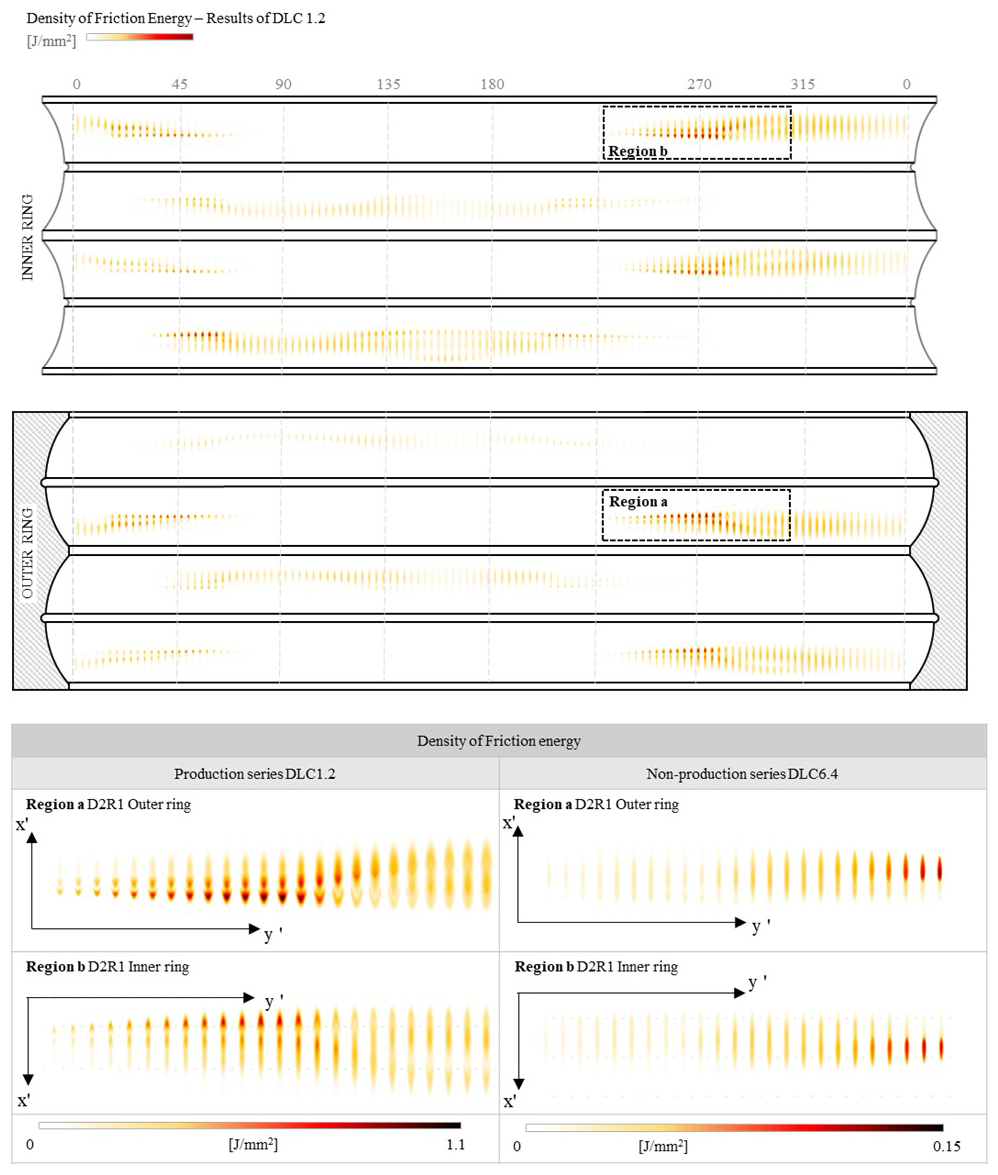
Figure 7 shows the density of the friction energy, ρF, along the different bearing raceways, i.e. the x axis, the longitudinal direction of the raceway, and the y axis, the transversal direction, according to the local coordinate system of Fig. 5. The plotted sectors correspond to the location of the maximum values at D2R1 from 225 to 320° denoted by the regions a and b for DLC 1.2 and for DLC 6.4 (see Fig. 6). In order to facilitate visualization and comparison between adjacent ball damage, the distance between marks was reduced. The results show notable differences in the damage shapes for every contact, and some look similar to previous experimental results (Cubillas et al., 2021b). All marks can be bounded in an elliptical area, which is notably more rounded at the OR and more flattened at the IR; this, as previously mentioned, is directly influenced by the contact curvatures of the rings. The forms of damage are significantly different for DCL 1.2 and DCL 6.4. In the case of DCL 1.2, there are two intensity zones within each footprint: a central, elliptical zone and a horseshoe-shaped zone at the rear of the tread. In contrast, the DCL 6.4 damage shows only one damage zone in the rear of the elliptically shaped tread. This fact may be related to the non-linear stiffness and how it affects the load ratio and contact angle. That is, for low loads, the contact is less stiff in relative terms as an increase in the load results in an increase in the contact angle. As the load increases, the stiffness of the contact is greater and the change in contact angle is smaller, and therefore the rolling is less. Under these conditions, the contribution from radial fretting damage, generated by the pulsating load, and from rotational fretting damage changes.
3.3 On the effect of the wind speed
Figure 8 shows the results of the contribution of different wind speeds – 3, 5, and 7 m s−1 for DLC 1.2 and 3, 11, and 25 m s−1 for DLC 6.4 – to the total accumulated friction energy, TFE. This is unlike the previous analysis, where the sum of the contribution of each wind speed was presented. Due to the similarities of the damage distribution for both indicators, TFE and MDFE, only the results of TFE are presented. According to previous sections, the results are also classified by the load diagonal, row, and ring.
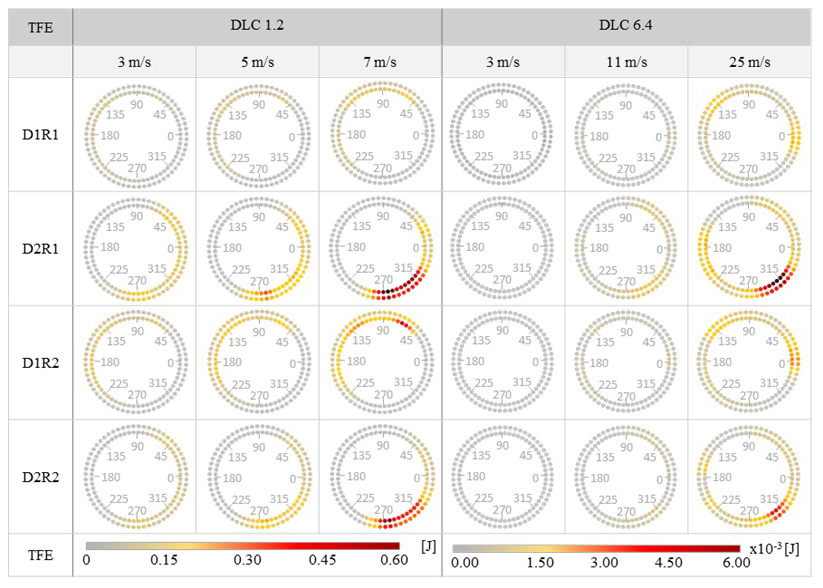
Figure 8Results of the total dissipated friction energy for different wind speeds of the design load cases DLC 1.2 and DLC 6.4 for 10 min duration, where results are organized by load diagonal and row.
As mentioned, the results show the contribution of different wind speeds: 3, 5, and 7 m s−1 for DLC 1.2 and 3, 11, and 25 m s−1 for DLC 6.4. As can be observed, a similar distribution of the dissipated energy where the location of the damage seems not to be affected by the wind speed and the maximum values can be found at 60, 135, and 190° at D1 and at 30 and 270° at D2. Therefore, it can be concluded that the position of the critical zones is not dependent on wind speed. If the wind speed does not alter the location of the damage, it seems that the contribution of the fluctuating wind load is low. Therefore, it can be inferred that the main source of damage is caused by the swinging of the blade weight when the rotor is in motion.
While the location of the damage is invariant, a notable and expected effect of the wind speed is observed on the value of TFE, with the results showing a growing tendency of the dissipated energy with increasing wind speed. Figure 9 shows the normalized value of the maximum TFE and MDFE for the different wind speeds. Despite the analogous growing tendency for both indicators with the growing wind speed, the tendency is significantly different: while TFE has exponential growth, MDFE shows a logarithmic tendency. The TFE indicator refers to a global term after integrating local damage; i.e. it is a parameter that takes into account the total damaged area. In contrast, MDFE is a local parameter, and it takes into account the intensity of damage at a given point. Therefore, the different trends of the two damage parameters indicate different effects. MDFE indicates that the damage intensity grows logarithmically with wind speed, while the TFE parameter shows that the damaged area grows exponentially.
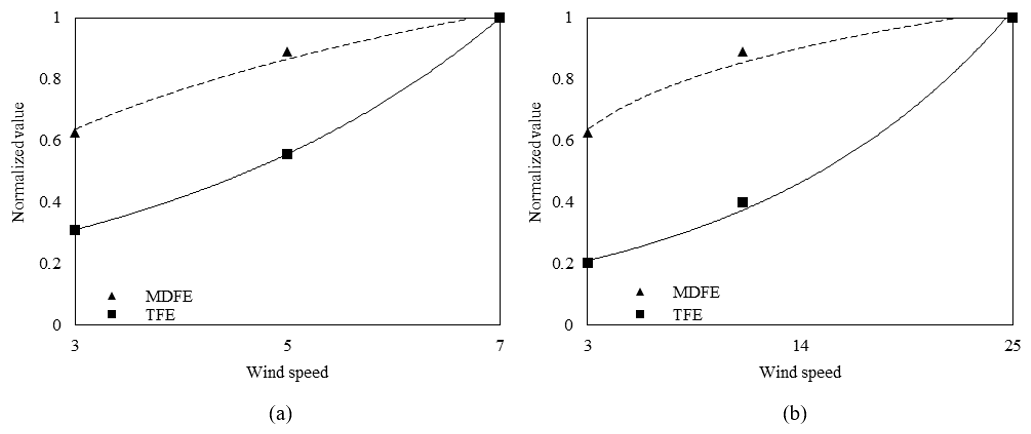
Figure 9Evolution of the normalized values of the maximum density of friction energy (MDFE) and the total dissipated friction energy (TFE) as a function of the wind speed and the logarithmic and exponential regressions, respectively. (a) DLC 1.2; (b) DLC 6.4.
This work started with the aims of analysing the performance of fretting damage in productive and non-productive periods of pitch bearings under realistic time series and determining the critical locations and conditions that favoured the development of the damage. As a result, the following conclusions have been made:
-
The energy-based wear model shows a critical region between 270 and 315° for the inner ring and at the first row, where the total accumulated friction energy (TFE) and the maximum density of friction energy (MDFE) are located in both operational and non-operational conditions.
-
An analysis of the loads and contact angle distribution shows a noticeably better correlation between the friction energy and the variable load than the variable angle, and consequently, this implies that radial fretting is the main source of damage.
-
The evaluation of the effects of the wind speed on the damage shows a similar distribution of damage where maximum values remain at the same level. Therefore, the critical locations do not vary with the intensity of the wind. However, important differences are found in the value of the accumulated energy indicators, showing exponential behaviour of TFE, and a logarithm trend of MDFE as a function of the wind speed. Therefore, the intensity of the damage is expected to be exponential with the wind speed.
-
For time series of the same duration, the damage intensity obtained in productive times associated with the DLC 1.2 series is much higher than in the DLC 6.4 series. Consequently, the productive times are much more critically affected by damage development.
-
The results obtained in this work shed light on the fretting damage mechanism in pitch bearings under different conditions of wind and operation. However, there is still a long way to go. Among these tasks, the most obvious would be to validate the proposed methodology on a real scale, with and without lubrication, to see the validation framework, as well as needing to implement additional formulations for modelling the effect of grease. Additionally, the formulation should be extended to the prediction of wear over time, making the methodology usable as a prediction tool for design.
where v is Poisson's ratio, Sρ is the sum of the contact curvatures, and δ* is the dimensionless contact deformation.
The sum of the contact curvatures is calculated as
where rpw is the main bearing radius, rp is the raceway radius, α is the contact angle, and the sign of both terms is taken as positive for the outer contact and negative for the inner contact.
The dimensionless contact deformation is calculated as
where ξ is the elliptical parameter of the first kind and F is the elliptical parameter of the second kind. These are calculated as
respectively, where ρ is the radius ratio, calculated as
and c is the conformity aspect ratio, ; the sign is considered positive for the outer contact and negative for the inner contact.
| Abbreviations | |
| IR | Inner ring |
| OR | Outer ring |
| FEM | Finite-element model |
| CoF | Coefficient of friction |
| TFE | Total accumulated friction energy |
| MDFE | Maximum density of friction energy |
| DLC | Design load case |
| DFE | Density of the friction energy |
| Symbols | |
| a | Contact ellipse major semiaxis |
| a0 | Distance from a point to the ellipse edge in |
| the x direction | |
| a* | Dimensionless major semiaxis |
| B | Bearing ring width |
| b | Contact ellipse minor semiaxis |
| b0 | Distance from a point to the ellipse edge in |
| the y direction | |
| b* | Dimensionless minor semiaxis |
| C | Creepage coefficient |
| c | Conformity aspect ratio |
| Ds | Bolt diameter |
| E | Elastic modulus of the material |
| EF | Dissipated friction energy |
| ER | Rolling energy |
| F | Elliptical parameter of the second kind |
| G | Shear modulus |
| H | Bearing ring height |
| kw | Coefficient of wear |
| L | Flexibility parameter |
| Mx | Moment component x at bearing |
| My | Moment component y at bearing |
| P | Contact pressure |
| Q | Reaction force at the ball contact |
| rw | Radius of the ball |
| rpw | Bearing pitch radius |
| re,i | Cross-sectional groove radius, e for the outer |
| and i for the inner ring | |
| Initial effective radius | |
| r′ | Effective radius |
| S | Local sliding |
| Sρ | Sum of the contact curvatures |
| T | Tangential stresses |
| t | Time |
| v | Poisson's ratio |
| Vw | Wear volume |
| W | Local rigid slip |
| WNL | Local rigid slip of the normal load |
| WRo | Local rigid slip of the rolling effects |
| x′, y′ | Local coordinate system directions |
| z | Number of balls |
| ε | Rolling creepage |
| Tl | Traction limits of the contact |
| U | Local elastic slip |
| α | Contact angle |
| ρF | Density of friction energy |
| δ* | Dimensionless contact deformation |
| ℋ | Elliptical parameter of the second kind |
| ξ | Elliptical parameter of the first kind |
| μ | Value of the CoF |
| ΦX | Probability function of the normal distribution |
| X | Density of the normal probability distribution |
Code and data are not available for confidential reasons.
DC and MO: conceptualization. DC: methodology. IL, IU, and JL: supervision. DC: writing – original draft preparation. AZ and AL: resources. MO, IL, IU, JL, AZ, and AL: writing – review and editing.
The contact author has declared that none of the authors has any competing interests.
Publisher's note: Copernicus Publications remains neutral with regard to jurisdictional claims made in the text, published maps, institutional affiliations, or any other geographical representation in this paper. While Copernicus Publications makes every effort to include appropriate place names, the final responsibility lies with the authors.
This paper was edited by Yi Guo and reviewed by two anonymous referees.
Al-Bender, F. and De Moerlooze, K.: A model of the transient behavior of tractive rolling contacts, Adv. Tribol., 94, 17–44, https://doi.org/10.1155/2008/214894, 2008.
Bossanyi, E. A.: Individual Blade Pitch Control for Load Reduction, Wind Energy, 6, 119–128, https://doi.org/10.1002/we.76, 2003.
Brewe, D. and Hamrock, B. J.: Simplified solution for elliptical-contact deformation between two elastic solids, J. Lubr. Technol., 99, 485–487, https://doi.org/10.1115/1.3453245, 1977.
Brinji, O., Fallahnezhad, K., and Meehan, P.: Analytical model for predicting false brinelling in bearings, Wear, 444–445, 203135, https://doi.org/10.1016/j.wear.2019.203135, 2020.
Brinji, O., Fallahnezhad, K., and Meehan, P.: False brinelling behaviour of high carbon bearing steel under varying conditions, Wear, 182–483, 203973, https://doi.org/10.1016/j.wear.2021.203973, 2021.
Cai, Z., Yang, Z., Gui, M., Zhu, Y., and Zhou, Z.: A review of fretting study on nuclear power equipment, Tribol. Int., 114, 106495, https://doi.org/10.1016/j.triboint.2019.106095, 2020.
Cherubini, S., De Cillis, G., Semeraro, O., and Leonardi, S.: Data Driven Modal Decomposition of the Wake behind an NREL-5 MW Wind Turbine, Int. J. Turbomach. Propuls. Power, 6, 44, https://doi.org/10.3390/ijtpp6040044, 2021.
Cubillas, D., Olave, M., Llavori, I., Ulacia, I., Larranaga, J., Zurutuza, A., and Lopez, A.: A novel formulation for radial fretting wear Application to false brinelling in thrust bearings, Wear, 488–489, 204078, https://doi.org/10.1016/j.wear.2021.204078, 2021a.
Cubillas, D., Olave, M., Llavori, I., Ulacia, I., Larranaga, J., Zurutuza, A., and Lopez, A.: An analytical formulation for rotational fretting: application to thrust bearings, Wear, 508–509, 204484, https://doi.org/10.1016/j.wear.2022.204484, 2021b.
Cubillas, D., Olave, M., Llavori, I., Ulacia, I., Larranaga, J., Zurutuza, A., and Lopez, A.: Semi-analytical methodology to predict fretting damage areas in angular contact ball bearing raceways under variable loading, Wear, 508–509, 204477, https://doi.org/10.1016/j.wear.2022.204477, 2021c.
Daidié, A., Chaib, Z., and Ghosn, A.: 3D Simplified Finite Elements Analysis of Load and Contact Angle in a Slewing Ball Bearing, J. Mech. Des., 130, 082601, https://doi.org/10.1115/1.2918915, 2008.
Fallahnezhad, K., Oskouei, R. H., and Taylor, M.: Development of a fretting corrosion model for metallic interfaces using adaptive finite element analysis, Finite Elem. Anal. Des., 148, 38–47, https://doi.org/10.1016/j.finel.2018.05.004, 2018.
Fallahnezhad, K., Liu, S., Brinji, O., Marker, M., and Meehan, P.: Monitoring and modelling of false brinelling for railway bearings, Wear, 424–425, 151–164, https://doi.org/10.1016/j.wear.2019.02.004, 2019.
Fouvry, S., Liskiewicz, T., Kapsa, P., Hannel, S., and Sauger, E.: An energy description of wear mechanisms and its applications to oscillating sliding contacts, Wear, 225, 287–298, https://doi.org/10.1016/S0043-1648(03)00117-0, 2003.
Grebe, M., Feinle, P., and Hunsicker, W.: Various Influence Factors on the Development of Standstill Marks (False-Brinelling Effect), Trib. Comp. Cen., 10, 35, https://doi.org/10.1002/9783527628513.ch35, 2011.
Grebe, M., Molter, J., Schwack, F., and Poll, G.: Damage mechanisms in pivoting rolling bearings and their differentiation and simulation, Bea. J., 3, 17–21, 2020.
Halawa, A. M., Sessarego, M., Shen, W. Z., and Yoshida, S.: Numerical Fluid-Structure Interaction Study on the NREL 5 MW HAWT, J. Phys.: Conf. Ser., 1037, 22026, https://doi.org/10.1088/1742-6596/1037/2/022026, 2018.
Harris, T., Rumbarger, J. H., and Butterfield, C. P.: Wind Turbine Design Guideline DG03: Yaw and Pitch Rolling Bearing Life, NREL/TP-5000-89161, Techical Report, NREL, https://doi.org/10.2172/2406870, 2009.
Heras, I., Aguirrebeitia, J., and Abasolo, M.: Friction torque in four contact point slewing bearings: Effect of manufacturing errors and ring stiffness, Mech. Mach. Theory, 112, 145–154, https://doi.org/10.1016/j.mechmachtheory.2017.02.009, 2017.
Hertz, H.: Über die Berührung fester elastische Körper und über die Härte (On the contact of rigid elastic solids and on hardness), Verhandlungen des Vereins zur Beförderung des Gewerbefleisses, Leipzig, 1882.
Houpert, L.: Bearing life calculation in oscillatory applications, J. Tribol., 42, 136–143, https://doi.org/10.1115/1.4052962, 1999.
Jonkman, J., Butterfield, S., Musial, W., and Scott, G.: Definition of a 5-MW Reference Wind Turbine for Offshore System Development, NREL/TP-500-38060, 21, NREL, 947–959, https://doi.org/10.2172/947422, 2009.
Kalker, J.: A Fast Algorithm for the Simplified Theory of Rolling Contact, Veh. Syst. Dyn., 11, 1–13, https://doi.org/10.1080/00423118208968684, 1981.
Kalker, J. J.: A Fast Algorithm for the Simplified Theory of Rolling Contact, Veh. Syst. Dyn., 11, 1–13, https://doi.org/10.1080/00423118208968684, 1982.
Lagarias, J. C., Reeds, J. A., Wright, M. H., and Wright, P. E.: Convergence properties of the Nelder-Mead simplex method in low dimensions, SIAM J. Optim., 9, 137–198, https://doi.org/10.1137/S1052623496303470, 1998.
Lin, C.-L., Fallahnezhad, K. B., and Meehan, P. A.: Mitigation of False Brinelling in a Roller Bearing: A Case Study of Four Types, Tribol. Lett., 70, 22, https://doi.org/10.1007/s11249-021-01557-0, 2022.
Lopez, A., Zurutuza, A., Olave, M., Portugal, I., and Muniz-Calvente, M.: Pitch bearing lifetime prediction considering the effect of pitch control strategy, J. Phys.: Mater., 1222, 1742–6596, https://doi.org/10.1088/1742-6596/1222/1/012017, 2019.
Menck, O., Stammler, M., and Schleich, F.: Fatigue lifetime calculation of wind turbine blade bearings considering blade-dependent load distribution, Wind Energ. Sci., 5, 1743–1754, https://doi.org/10.5194/wes-5-1743-2020, 2020.
Nematollahi, O., Rasti, M., Hoghooghi, H., and Sedaghat, A.: Energy demands and renewable energy resources in the Middle East, Renew. Sustain. Energ., 54, 1172—181, https://doi.org/10.1016/j.rser.2015.10.058, 2016.
Olave, M., Sagartazu, X., Damian, J., and Serna, A.: Design of Four Contact-Point Slewing Bearing with a New Load Distribution Procedure to Account for Structural Stiffness, J. Mech. Des., 132, 21006, https://doi.org/10.1115/1.4000834, 2010.
Pittroff, H.: Riffelbildung bei Wälzlagern infolge Stillstandserschütterungen, PhD thesis, Technische Hochschule München, Munich, 1961.
Portugal, I., Olave, M., Zurutuza, A., López, A., Muñiz-Calvente, M., and Fernández-Canteli, A.: Methodology to evaluate fatigue damage under multiaxial random loading, Eng. Fract. Mech., 185, 114–123, https://doi.org/10.1016/j.engfracmech.2017.04.012, 2017.
Presilla, R., Wndel, S., Stammler, M., Grebe, M., Pall, G., and Glavatshkih, S.: Oscillating rolling element bearings: A review of tribotesting and analysis, Trib. Int., 188, 108805, https://doi.org/10.1016/j.triboint.2023.108805, 2023.
Rodríguez, X. A., Regueiro, R. M., and Doldán, X. R.: Analysis of productivity in the Spanish wind industry, Renew. Sustain. Energ. Rev., 118, 109573, https://doi.org/10.1016/j.rser.2019.109573, 2019.
Schwack, F., Stammler, M., Poll, G., and Reuter, A.: Comparison of Life Calculations for Oscillating Bearings Considering Individual Pitch Control in Wind Turbines, J. Phys.: Conf. Ser., 753, 112013, https://doi.org/10.1088/1742-6596/753/11/112013, 2016.
Schwack, F., Prigge, F., and Poll, G.: Finite element simulation and experimental analysis of false brinelling and fretting corrosion, Tribol. Int., 126, 352–362, https://doi.org/10.1016/j.triboint.2018.05.013, 2018.
Schwack, F., Halmos, F., Stammler, M., Poll, G., and Glavatskih, S.: Wear in wind turbine pitch bearings – A comparative design study, Wind Energy, 25, 700–718, https://doi.org/10.1002/we.2693, 2021a.
Schwack, F., Schneider, V., Wandel, S., de la Presilla, R. J., Poll, G., and Glavatskih, S.: On the critical amplitude in oscillating rolling element bearings, Tribol. Int., 163, 107154, https://doi.org/10.1016/j.triboint.2021.107154, 2021b.
Serrano, J., Lacal, R., and Serrano, J.: Technological evolution of onshore wind turbines, a market-based analysis, Wind Energy, 19, 2171–2187, https://doi.org/10.1002/we.1974, 2016.
Stammler, M.: Wear test programs for roller-type pitch bearings of wind turbines, Wind Energ. Sci., 8, 1821–2023, https://doi.org/10.5194/wes-8-1821-2023, 2023.
Stammler, M. and Geibel, M.: Results of wear endurance runs of wind turbine pitch, J. Phys.: Conf. Ser., 2764, 420–452, https://doi.org/10.1088/1742-6596/2767/4/042001, 2024.
Stammler, M., Poll, G., and Reuter, A.: The influence of oscillation sequences on rolling bearing wear, Bear. World J., 188, 108805, https://doi.org/10.1016/j.triboint.2023.108805, 2019.
Stammler, M., Menck, O., and Keller, J.: Wind Turbine Design Guideline DG03: Yaw and Pitch Bearings. Technical Report, NREL/TP-5000-89161, NREL, https://doi.org/10.2172/2406870, 2024.
Wandel, S., Bartschat, A., Glodowski, J., and Bader, N.: Wear Development in Oscillating Rolling Element Bearings, Lubricants, 11, 3–24, https://doi.org/10.15488/14836, 2023.
Zhu, M. H., Yu, H. Y., and Zhou, Z. R.: Radial fretting behaviours of dental ceramics, Tribol. Int., 39, 1255–1261, https://doi.org/10.1016/j.triboint.2006.02.042, 2006.
Zuheir, S., Abdullah, O. I., and Al-Maliki, M.: Stress and vibration analyses of the wind turbine blade (A NrEL 5 MW), J. Mech. Eng. Res. Dev., 42, 14-19, https://doi.org/10.26480/jmerd.04.2019.14.19, 2019.