the Creative Commons Attribution 4.0 License.
the Creative Commons Attribution 4.0 License.
Numerical investigation of regenerative wind farms featuring enhanced vertical energy entrainment
Andrea Sciacchitano
Carlos Ferreira
Numerical simulations of wind farms consisting of innovative wind energy harvesting systems are conducted. The novel wind harvesting system is designed to generate strong lift (vertical force) with lifting devices. It is demonstrated that the trailing vortices generated by these lifting devices can substantially enhance wake recovery rates by altering the vertical entrainment process. Specifically, the wake recovery of the novel systems is based on vertical advection processes instead of turbulent mixing. Additionally, the novel wind energy harvesting systems are hypothesized to be feasible without requiring significant technological advancements, as they could be implemented as multi-rotor systems with lifting devices (MRSLs), where the lifting devices consist of large airfoil structures. Wind farms with these novel wind harvesting systems, namely MRSLs, are termed regenerative wind farms, inspired by the concept that the upstream MRSLs actively entrain energy for the downstream ones. With the concept of regenerative wind farming, much higher wind farm capacity factors are anticipated. Specifically, the simulation results indicate that wind farm efficiencies can be nearly doubled by replacing traditional wind turbines with MRSLs under the tested conditions, and this disruptive advancement can potentially lead to a profound reduction in the cost of future renewable energy.
- Article
(11582 KB) - Full-text XML
- BibTeX
- EndNote
In the wind energy industry, wind turbines are often arranged in clusters, leveraging closer spacings for economic and operational benefits (Meyers and Meneveau, 2012; Sørensen and Larsen, 2021). These clusters are known as wind farms. However, densely packed wind turbines result in annual energy production (AEP) losses due to the turbine–turbine wake interactions. The more tightly packed the turbines, the more pronounced the negative impact on AEP (Stevens et al., 2016). These losses are substantial, with reported AEP reductions ranging from 10 % to 25 % for large-scale offshore wind farms such as Horns Rev 1 and Nysted (Barthelmie et al., 2009, 2010). Moreover, predictions indicate that AEP losses due to wakes could reach more than 60 % for wind farms on a very large scale (infinite wind farm) with spacings similar to the typical ones (e.g., 7D in streamwise and 5D lateral directions, where D is the rotor diameter) (Dupont et al., 2018; Calaf et al., 2010). Note that the above-mentioned considerations are for conventional wind farms that consist of three-bladed horizontal-axis wind turbines (HAWTs), the prevailing concept in today's commercial wind farms (Manwell et al., 2010).
The AEP drop mentioned in the previous paragraph is attributed to the fact that the kinetic energy carried by the incoming wind is depleted by upstream turbines, and the energy replenishing rates cannot sustain the downstream turbines to extract as much energy as those in the first row of a wind farm (Porté-Agel et al., 2020). Note that the energy is mainly replenished by entraining from above the wind farms. This is due to the fact that wind farms are built close to the ground or sea surface, and they extend in both streamwise and lateral directions. However, without significant mean vertical flow in conventional wind farms, the primary source of vertical energy (momentum) entrainment is through the turbulent mixing process, relying on the Reynolds stress terms (Calaf et al., 2010; VerHulst and Meneveau, 2015). Typical rates of vertical energy entrainment are about 1 to 2 W m−2 for conventional wind farms with HAWTs (Dupont et al., 2018; VerHulst and Meneveau, 2015) (estimated based on an infinite-wind-farm scenario), which is significantly lower than 7 W m−2, a typical installation capacity (these estimations are based on a typical wind farm; i.e., the ranges of streamwise and lateral spacings are around 7D and 5D, freestream wind speed is estimated at 10 m s−1, and the power coefficient of the turbines is 0.54) (Barthelmie et al., 2009; Bosch et al., 2019). This indicates that the efficiencies of large wind farms with conventional designs are limited by the low vertical entrainment rates.
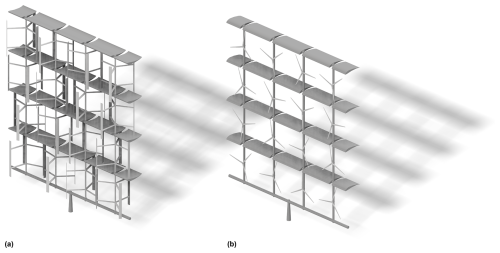
Figure 1Conceptualizing the proposed design of the innovative wind energy harvesting systems, namely multi-rotor systems with lifting devices (MRSLs). (a) MRSL consisting of vertical-axis wind turbines (VAWTs) with airfoils/wings that lift the wake upward. (b) MRSL consisting of horizontal-axis wind turbines (HAWTs) with airfoils/wings that lift the wake downward.
To overcome the aforementioned limitations of the current conventional wind farms, we adopt the strategy of introducing lifting devices onto the wind energy harvesting systems. These lifting devices can induce strong vertical flows, leading to a significant vertical advection process and thus enhancing vertical energy entrainment. To the authors' best knowledge, this concept was first studied by Bader et al. (2018), where they carried out numerical analysis of HAWTs coupled with lifting devices close to their rotors in various configurations. Their promising results showed that the power performance of the downstream turbines was substantially improved with the implementation of the lifting devices. However, they did not propose a way to install the lifting devices, as they were suspended without support in the computational domain.
Very recently, Broertjes et al. (2024) and Avila Correia Martins et al. (2025) have also studied the concept of introducing lifting devices onto wind harvesting devices both experimentally and numerically. These two studies were based on the idea proposed by Ferreira et al. (2024). Unlike Bader et al. (2018), an innovative design, the multi-rotor system with lifting devices (MRSLs), was proposed. The system comprises several sub-rotors, each in the form of vertical- or horizontal-axis wind turbines (VAWTs or HAWTs). The proposed design, illustrated in Fig. 1, highlights the designated positions to mount the lifting devices, where the airfoils/wings themselves serve as structural components. This MRSL design has been realized at a wind tunnel scale by Broertjes et al. (2024), featuring a system with 16 VAWTs and two wings. The results of Broertjes et al. (2024) and Avila Correia Martins et al. (2025) showed that, due to the strong vertical flow induced by the lifting devices, the wake recovery rate of MRSLs can reach more than 90 % at a distance of 5D downstream (based on available power, which is ∝u3), whereas a typical HAWT achieves less than 40 % at a similar distance (Li et al., 2024a), indicating a significant enhancement in wake recovery. Additionally, it should be noted that although the concept of MRSLs came out very recently, the implementation of this design may not require major technological breakthroughs, as the technology for multi-rotor systems already exists (Jamieson and Branney, 2012; Watson et al., 2019).
Building on the work of Broertjes et al. (2024) and Avila Correia Martins et al. (2025), this study further investigated the aerodynamics of wind farms consisting of MRSLs using a numerical method. These wind farms are termed regenerative wind farms by Ferreira et al. (2024). The name reflects the idea that upstream MRSLs actively entrain energy for the downstream ones. At this point, it is suggested that the proposed MRSLs and the concept of regenerative wind farms could be a groundbreaking concept for the wind energy industry. This concept has the potential to revolutionize wind energy by fundamentally altering the process of vertical energy entrainment. Unlike conventional wind farms, regenerative wind farms replenish flow energy vertically through the mean components of the flow rather than relying on Reynolds stress terms, which is likely to significantly elevate their wind farm efficiency. If successfully implemented, this approach promises not only significant economic advantages but also a reduction in the space required to generate the same power output compared to conventional wind farms. Achieving these goals could enhance the benefits of wind energy while minimizing its environmental and spatial impacts, marking a transformative advancement in renewable energy. To validate the groundbreaking potential of MRSLs in transforming the vertical entrainment process, this study conducts a comprehensive numerical analysis of regenerative wind farms, setting the stage for a significant leap forward in wind farm efficiency.
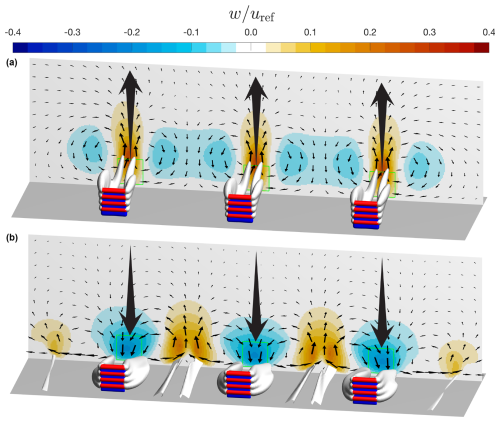
Figure 2Isosurfaces of the magnitude of streamwise vorticity (, silver) together with the contour plots of the vertical velocity fields w. The arrows on the contours depict the direction of the in-plane velocity, and note that the lengths of the arrows are scaled by the square root of the in-plane velocity's norms. MRSLs are represented with red and blue surfaces, where the blue surfaces are thrusting devices, and the red surfaces are the lifting devices. The plots are based on the solutions of the up-washing (a) and down-washing (b) cases in Table 3. The MRSLs depicted are the ones in the fourth row, and the contours are plotted at .
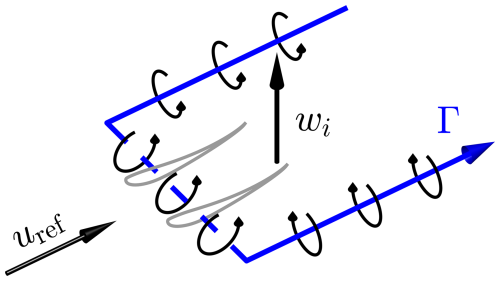
Figure 3A sketch of the simplified vortex/circulation system of a wing is presented. The vortex system is depicted as a horseshoe vortex, indicated by the blue line with angles, with the direction of the circulation Γ shown by an arrow. The solid lines in the horseshoe vortex represent the trailing vortices, while the dashed line represents the bound vortex. Note that, with the orientation of the wing in this figure, the vertical component of the induced flow wi right behind the wing is upward.
2.1 Working principles of MRSLs
As mentioned in the previous section, one of the key reasons that conventional wind farms suffer from slow wake recovery rates is the absence of vertical flow. Regenerative wind farms counter this shortcoming by introducing vertical advection through the placement of lifting devices onto MRSLs. How this concept works is depicted by the vertical velocity fields w inside regenerative wind farms presented in Fig. 2, where the active exchange of flow between the upper and lower layers can be observed. This concept is inspired by the flow field induced by a wing described by the classic lifting-line theory (Anderson, 2011). As depicted in Fig. 3, the vorticity/circulation system of a wing can be simplified as a horseshoe vortex. The horseshoe vortex consists of two trailing vortices and a bound vortex. Due to the induction field of this vortex system, particularly from its trailing vortices, the induced flow ui behind the wing has a non-zero vertical component (perpendicular to both the freestream and the spanwise directions), resulting in wi≠0. Additionally, both the strength and the direction of wi are affected by the wing's configuration. The strength of wi is governed by the lift per span of the wing, with a higher lift generating a stronger circulation Γ and thus a larger wi, as explained by the Kutta–Joukowski theorem and Helmholtz's theorem (Anderson, 2011). The direction of wi can be altered by flipping the wing, that is, swapping the locations of the pressure side and the suction side. Moreover, stacking multiple wings vertically can further amplify wi. Thus, in this work, MRSLs are equipped with several wings, referred to as the lifting devices, to increase the magnitude of wi. By arranging these lifting devices as shown in Fig. 1, the flows at different altitudes behind MRSLs are exchanged vertically due to the non-zero wi. It is this non-zero vertical flow induced by the lifting devices that fundamentally changes the mechanism of vertical energy entrainment within regenerative wind farms (Ferreira et al., 2024).
Based on the configurations of the lifting devices/wings of MRSLs, the lift exerted by MRSLs can be both upward and downward (note that the lift forces experienced by the flow and MRSL are in opposite directions). In this work, the configuration that exerts upward lift onto the flow is termed up-washing (UW), while the one that exerts downward lift is termed down-washing (DW). With the contours of vertical velocity w together with the isosurfaces of the streamwise vorticity magnitudes in Fig. 2, it can be seen that the flow at lower altitudes is channeled upward, while the flow at higher altitudes is brought downward for both UW and DW, enhancing the vertical exchange process. Note that the isosurfaces of ωx represent the trailing vortices. The working principle of the lifting devices here is akin to the vortex generators on the wings of modern aircraft and the blades of contemporary wind turbines but on the scale of wind farms, which is much larger (Ferreira et al., 2024).
2.2 Specifications of MRSLs
In this work, the shape of the frontal area of an MRSL is set as a square (as shown in Fig. 1) with a side length D of 300 m, where the height of the rotor center zrc is 186 m, corresponding to a clearance of 36 m. The lifting devices of MRSLs consist of four straight wings without any twist. These wings are placed at 100 %, 75 %, 50 %, and 25 % of the MRSL's height, as depicted in Figs. 1 and 4. Table 1 lists the key parameters of the MRSL used in this work. Note that the MRSL in Fig. 4 degenerates from Fig. 1, where the sub-rotors are represented with a single actuator disk (blue surface), and the lifting devices/wings are represented with four actuator lines (red surfaces). This simplification enables more efficient numerical modeling (Sorensen and Shen, 2002; Mikkelsen, 2004), and a detailed parameterization is provided in Sect. 3.4.
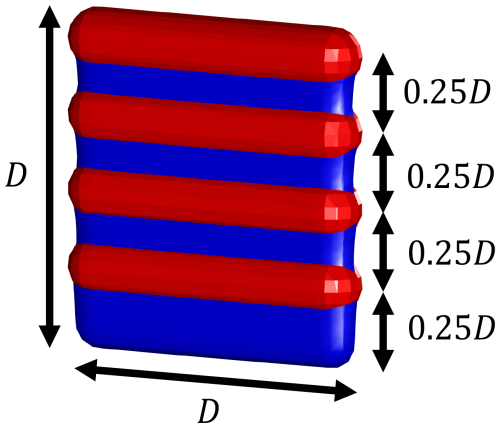
Figure 4Illustration of how an MRSL is modeled with an actuator disk (blue) and four actuator lines (red) in the simulation. Note that the sketch showed here is a degenerated form of the MRSL presented in Fig. 1, and this simplification is aimed at facilitating the computational efficiency.
Table 1Specifications of an MRSL modeled in the current work. D, c, and zrc are the MRSL's side length, chord length, and height of the rotor center, respectively. The designed CP (power coefficient) is estimated based on classic actuator disk theory (Manwell et al., 2010) with CT=0.7. The designed TR and PR are the designed thrust and power of an entire MRSL estimated based on CT=0.7 and CP=0.54 with uref=10 m s−1.
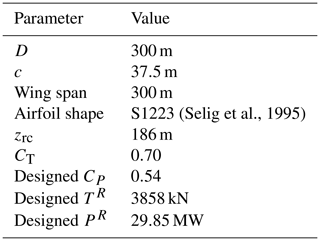
The thrust force exerted by an MRSL is calculated based on the sampled local velocity, where the thrust coefficient CT is set to 0.7. According to classic actuator disk theory (Manwell et al., 2010), CT=0.7 gives a power coefficient CP of 0.54 (see Sect. 3.4 for more explanations). Note that CP=0.54 is around the design values for modern large-scale wind turbines (Bak et al., 2013; Gaertner et al., 2020). The lifting devices of an MRSL consist of four straight wings with a constant profile, a constant twist angle, a constant chord length c, and a span of D. The chord length of the wings is set to , and the airfoil data used are the S1223 airfoil (Selig et al., 1995). The S1223 airfoil is chosen as it is one of the most representative profiles capable of achieving a high lift coefficient (Selig and Guglielmo, 1997). Additionally, the camber and thickness of the S1223 are relatively moderate, potentially making it more practical for real-world implementation. However, it is important to note that the specific airfoil profile is not critical to the implementation of the MRSL. The purpose of the MRSL's wings is to generate strong trailing vortices that enhance wake mixing and thus facilitate wake recovery. The airfoil coordinate and the lift–drag polar (calculated with the chord-based Reynolds number Rec being 2×10⁷ using XFOIL version 6.99 (Drela, 1989)) for the S1223 airfoil are plotted in Fig. 5.
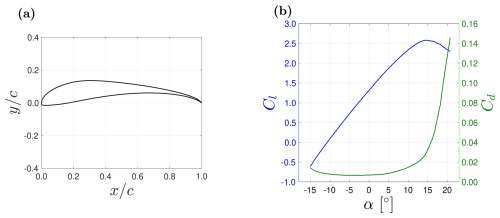
Figure 5(a) X−Y plot of the cross-section of airfoil S1223 (Selig et al., 1995). (b) The lift–drag polar of airfoil S1223 obtained with XFOIL version 6.99 (Drela, 1989) with .
3.1 Numerical setup and computational domain
Numerical simulations of this work are conducted with OpenFOAM v2106 (OpenCFD Ltd., 2021), an open-source finite-volume-based CFD (computation fluid dynamics) solver. The flow is treated as incompressible and Newtonian (ρ=1.225 kg m−3 and m2 s−1), and neither thermal effects nor Coriolis force is considered. The Reynolds-averaged Navier–Stokes (RANS) approach is employed. While higher-fidelity models such as large-eddy simulation (LES) are available for wind energy applications, RANS is selected for its lower computational demands (Thé and Yu, 2017), making it more suitable for rapid testing of new concepts and allowing for a broader parametric study. For the turbulence closure, the k–ω SST model (Menter, 1994) is chosen as it is the most widely used turbulence model in wind energy applications (Thé and Yu, 2017). A brief overview of the k–ω SST model is given in Appendix A, where the key governing equations are written. Additionally, a sensitivity test on the turbulence model is conducted in Appendix B, showing that the choice of turbulence model has a limited impact on the conclusions drawn from this work.
The spatial discretization schemes used are linear upwind (Gauss linearUpwind) for divergence and second-order central differencing (Gauss linear with limiter) for gradient and Laplacian. The pressure–velocity system is solved using the Semi-Implicit Method for Pressure Linked Equations (SIMPLE) algorithm.
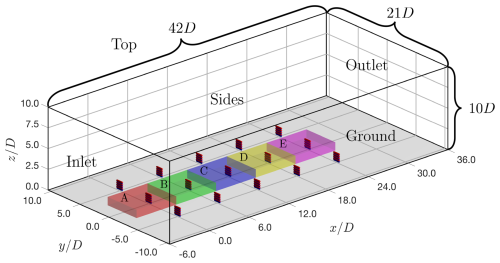
Figure 6Diagram depicting the computational domain and the layout of a regenerative wind farm. The inflow comes from the bottom left to the top right. The wind farm consists of 15 multi-rotor systems with lifting devices (MRSLs), having a layout of five rows and three columns. The deep-blue surfaces represent the rotor part of MRSLs (thrusting devices), while the deep-red surfaces indicate the lifting devices of MRSLs. The semi-transparent volumes annotated with letters are the control volumes used in Sect. 4.5.
3.2 Computational domain and boundary conditions
The computational domain for the simulations is illustrated in Fig. 6. A Cartesian coordinate system is employed, with positive x pointing downstream and positive z pointing upward. The mesh is generated using the blockMesh application, consisting of uniformly sized cubic cells with a grid size of in all three directions. The dimensions of the computational domain are in the x, y, and z (streamwise, lateral, vertical) directions, respectively, comprising approximately 137.8 M cells. Additionally, a grid independence test is carried out in Appendix C, confirming that a grid size of is adequate for this study.
Table 2Boundary conditions used for the simulation cases of regenerative wind farms immersed in ABL. atmBoundaryLayer and WallFunction are abbreviated as ABL and WF. For instance, ABLInletVelocity stands for atmBoundaryLayerInletVelocity.

A built-in library of OpenFOAM v2106, atmosphericModels (Richards and Hoxey, 1993; Hargreaves and Wright, 2007), is used to model the atmospheric boundary layer (ABL). The inlet profiles for the (mean) streamwise velocity u and turbulence kinetic energy k are given in Eqs. (1) and (2), respectively (see Fig. 12 for the generated freestream profile). z0 is the surface roughness length, which is set to 10−4 m, a typical value for an offshore environment (Manwell et al., 2010). uref is the reference velocity at the height of the rotor center zrc, which is set to 10 m s−1. C1 and C2 are the two coefficients that are set to 0.814 and 1.0 in order to make the turbulence intensity TI =8 % at z=zrc, where TI is defined as . This value corresponds to the turbulence intensity observed in typical offshore environments (Hansen et al., 2012). To make this work more comprehensive, a sensitivity study on inflow turbulence intensity is performed in Appendix D, and it is demonstrated that variation in inflow TI does not overthrow the conclusion drawn later in this paper. The boundary conditions used in this work are listed in Table 2. For more detailed specifications of the boundary conditions used, readers are referred to the OpenFOAM v2106 documentation (OpenCFD Ltd., 2021). Additionally, note that any constants and model coefficients that are not explicitly mentioned are set to their default values, e.g., κ=0.41 and Cμ=0.09.
3.3 Wind farm layout
All the simulations in this work share the same wind farm layout, which consists of five rows and three columns. The MRSLs in each column are fully aligned with the direction of the freestream. The mid-column of the wind farm is placed at the centerline of the computational domain, and the first row is located 6 D from the inlet. The lateral distance between any two columns is 5 D, and the streamwise distance between the rows is 6 D. The origin of the coordinate system is set at the first row of the mid-column, as indicated in Fig. 6.
3.4 Modeling multi-rotor systems with lifting devices
The multi-rotor systems with lifting devices (MRSLs) introduced previously are parameterized using a square actuator disk (called disk for historical reasons) together with four actuator lines, as mentioned in Sect. 2. With actuator techniques, the effects of MRSL geometry are replaced by body force fields (term fbody in Eq. A2). This allows avoiding the exceptionally high computational cost required to resolve the boundary layer around the complex geometry (Sorensen and Shen, 2002; Mikkelsen, 2004). These actuator methods are realized in OpenFOAM using a customized library building upon actuationDiskSource (a built-in library of OpenFOAM v2106) and turbinesFoam (Bachant et al., 2019), and we call it flyingActuationDiskSource (Li et al., 2024b).
It should be noted that while the actuator techniques enable efficient simulations, they under-represent certain aerodynamic effects of the MRSL. For instance, the supporting structures of the MRSL are not modeled, the rotational effects of the sub-rotors are not captured, and the inter-spacings between its sub-rotors are not accounted for. Nevertheless, this work focuses on demonstrating the proof of concept for the aerodynamic capabilities of MRSLs within a regenerative wind farm, and detailed investigations of these secondary aerodynamic effects are left for future work. That said, it is worth noting that Broertjes et al. (2024) have already conducted experiments with an isolated MRSL equipped with rotating sub-rotors and supporting frames, demonstrating that the effectiveness of the lifting devices/wings is not significantly affected by these secondary effects, suggesting omitting them has limited impacts.
All the sub-rotors of an MRSL (thrusting devices) are modeled as a single actuator disk, and the actuator disk has 25 by 25 actuator elements that are situated on the same streamwise plane. These actuator elements have the same inter-distance in both lateral and vertical directions. The rotors of each MRSL have non-uniform loading based on the velocities sampled at each actuator element. Tele and in Eq. (3) denote the thrust force exerted by the actuator element and the corresponding thrust coefficient, respectively. is the undisturbed inflow velocity seen by the actuator element. For all simulation cases in this work, the element-based area Aele is . The targeted for each element for all MRSLs is set to 0.70. However, because the undisturbed inflow velocity perceived by an actuator element () can vary when simulating wind farms and there is no universal method to define where to measure , estimating the value of Tele for an actuator element directly based on using Eq. (3) is challenging. To overcome this challenge, Tele of this work is estimated based on the locally sampled velocity and the corrected thrust coefficient , as expressed in Eq. (4). Note that is the velocity sampled exactly where the actuator element is situated. Unlike , the sampling position of does not have ambiguity. and are linked through the classic actuator disk (one-dimensional momentum) theory (Manwell et al., 2010), which states can be expressed as Eq. (5) based on the axial induction factor aele. After dividing/rearranging Eqs. (3) and (4) and applying the classic actuator disk theory (Eq. 5), the expression of is obtained with and aele, as written in Eq. (6). This method had been successfully implemented by Calaf et al. (2010). Through Eq. (5), it can be calculated that infers aele=0.23, which leads to .
After obtaining the value of Tele through Eq. (4), the force is projected onto the CFD grid with Eq. (7), where fele is the force vector exerted by the actuator element, and is the body force field on the CFD grid projected by fele at position x. ξele denotes the position vector of the actuator element. The projection is done by the Gaussian normalization kernel, and it is introduced to improve the robustness of the numerical modeling (Sorensen and Shen, 2002; Mikkelsen, 2004), where ε is called the smearing factor. For the actuator elements of the MRSL's rotors, is assigned, and its smearing factor, denoted as εR, is set to 1.0Δ, as it is commonly used for actuator disks (Mikkelsen, 2004; Wu and Porté-Agel, 2011). The thrust and power of the rotor (TR and PR) are calculated after projecting the body force fields using Eq. (8). Here, i and j represent the indices for positions and actuator elements, respectively. Note that Δ3 is the volume of a cell.
As mentioned in Sect. 2, the lifting devices of MRSLs are parameterized with four actuator lines, with each having 25 equally spaced actuator elements lining up in the lateral direction, and these actuator elements are in the same plane as those of the rotors. The forces to project are calculated based on the blade element approach, where fAL is calculated based on the velocity sampled and the airfoil polar, as written in Eq. (9). uAL is the sampled flow velocity for an actuator element of an actuator line. , , Cl, and Cd are the lift and drag forces and their corresponding coefficients. In this work, Cl and Cd are based on the polar data of the S1223 airfoil plotted in Fig. 5. ΔAL is the span length to which the actuator element corresponds. In this work, . , , and are the unit vectors in the spanwise, lift, and drag directions, respectively. Note that (depending on the lifting direction) and . In this work, uAL is obtained by averaging the 20 velocity samples sampled on a circular path with the actuator element at the center (line averaging). The sampling points are equidistant, and the normal direction of the enclosed surface is parallel to the spanwise direction. The radius of the circle is set to . Single-point sampling is avoided to achieve better robustness (Melani et al., 2021). Note that since and the wings are stationary, the lift forces of the wings do not do any work on the flow.
A Gaussian normalization kernel (see Eq. 7, where fele is replaced with fAL) is used again to project the forces of the lifting devices onto the CFD grid. For the smearing factor ε, instead of assigning a single value, the values of ε for the actuator lines (denoted as εW) are calculated based on the relative wing position as described in Eq. (10) ( corresponds to the middle of the wing). This approach was introduced by Jha et al. (2014). Compared with the experimental results of the load of a finite wing, it has been shown that using this distribution of εW outperformed the case using a single value for εW (Jha et al., 2014; Jha and Schmitz, 2018). For the current work, nmax is assigned as 3.0, and the distribution of εW along the wing used in this work is plotted in Fig. 7.
Using a similar method to obtain TR and PR (Eq. 8), the total lift LW (vertical force) and the total induced drag (streamwise force) of the four wings of an MRSL are obtained through Eq. (11). It should be noted that the directions of LW and are based on the global coordinate system, which is different from the directions of and , which are based on the local flow direction seen by the airfoil (uAL).
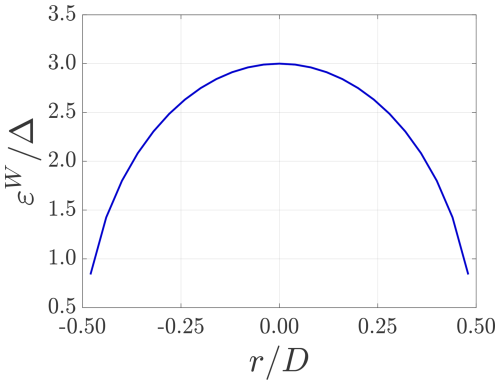
Figure 7The distribution of εW across the wings used in this work. is the grid size of the mesh used in the cases listed in Table 3.
To adjust the magnitudes of the lift force exerted by the lifting devices, the wings of MRSLs are pitched in the simulations by varying their pitch angles θp. Specifically, θp of each wing is adjusted so that the angle of attack α at the midpoint of the wing corresponds to a specified lift coefficient Cl. That is, Cl,mid, the lift coefficient at the midpoint of a wing, is tuned to a specified value. Since the inflow conditions for each of the MRSLs' wings differ, θp varies for each wing. The adjustment of θp is programmed and carried out automatically during the simulations. Note that each wing is pitched as a whole and has a constant twist angle along its entire span. For a demonstration, see Appendix E, where profiles of α along the wings are presented. In this work, for the MRSLs in the cases equipped with lifting devices, all their wings are pitched to make , except for the cases in Appendix F.
3.5 Test matrix
The main context of this study includes three simulations. The three cases are without lifting (WL), up-washing (UW), and down-washing (DW), as listed in Table 3. In the WL case, MRSLs are not equipped with lifting devices, serving as the reference case. In the UW case, the lifting devices on MRSLs exert upward vertical force onto the flow, and one of the immediate effects is that the wakes right behind the MRSLs are directed upward. Contrary, in the DW case, the lifting devices are designed to exert downward vertical force (the orientation of the wings is flipped compared to the UW category), sending the wakes right behind the MRSLs downward.
For the lifting devices of the MRSLs in the UW and DW cases, their wings are pitched during the simulations to make Cl,mid for each wing equal to 2.5 (Cl,mid is the lift coefficient at the mid-span of a wing; see the end of Sect. 3.4). Note that based on some rough estimations using the specifications provided in Table 1, allows an MRSL to generate a vertical force that is of a similar magnitude to the thrust force of its rotors.
4.1 Forces exerted by MRSLs
The thrust of the MRSL's rotors together with the lift (vertical force) and the induced drag (streamwise force) of the MRSL's lifting devices/wings are plotted in Fig. 8. The three cases listed in Table 3 are displayed. For the loading profiles of the MRSL's wings, see Appendix E.
, , and in Eq. (12) and Fig. 8 are the normalized thrust TR, lift LW, and induced drag of the MRSL (Eqs. 8 and 11), respectively. These forces are normalized against TR measured at the first row in the mid-column of the WL case in Table 3, denoted as , which is 3.87 MN. This value is very close to the designed value of 3.86 MN (based on letting CT=0.7 and a reference velocity of uref=10 m s−1), validating the actuator model described in Sect. 3.4.
Operator 〈⋅〉 in this work indicates row averaging. For example, in Fig. 8 denotes the row-averaged normalized rotor thrust. The results show that the value differences between the middle and side columns are at most 1 % for TR, LW, and for the three cases in Table 3.
As shown in the left and middle panels of Fig. 8, as designed, for the MRSLs in the two cases with lifting devices is similar to , while the WL case has zero lift. Additionally, for both UW and DW, it can be observed that their is much higher than that of WL from the second row onward, despite the fact that the lifting devices also introduce significant , as shown in the right panel of Fig. 8. Specifically, it is found that the thrust for the two cases with lifting devices decreases only slightly from the first to the second row, with remaining above 80 %, and the decreasing trend ceases from the third row onward. In contrast, for the case without lifting devices, drops significantly from the first to the second row, falling below 60 %, and continues to decrease row by row. By the third row, for the two cases with lifting devices is more than double compared to the WL case. Additionally, the fact that the forces for the MRSLs in the UW and DW cases remain relatively stable from the third to the fifth row suggests that these values would likely be sustainable if the regenerative wind farms had more rows. Furthermore, higher values of suggest that the streamwise velocity experienced by an MRSL at a given row is much higher when lifting devices are equipped. This is further confirmed by the plots and contours presented in later sections (Sect. 4.3).
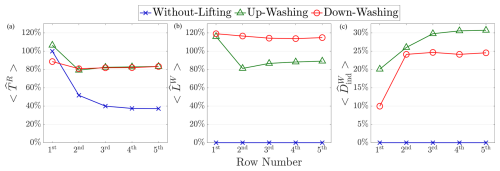
Figure 8The normalized row-averaged thrust of the MRSL's rotor (, a) together with the vertical (, b) and streamwise (, c) force components of the MRSL's lifting devices. The normalization is done by dividing the reference rotor thrust, which is based on the MRSL at the first row in the mid-column of the WL case. The legends correspond to the case names introduced in Table 3.
4.2 Power harvested by MRSLs
Figure 9 presents the normalized row-averaged power harvested by the rotors of MRSLs for the three cases listed in Table 3. These values are plotted alongside those predicted by the Frandsen wake model (Frandsen et al., 2006) (see Appendix G). As in the previous subsection, the rotor power PR is normalized based on the MRSL located at the first row in the mid-column of the WL case. The reference power, denoted as , is 30.1 MW. This value corresponds to a power density of 11.1 W m−2. This power density is calculated by dividing by the footprint area of an MRSL, which in this study is 6 D×5 D.
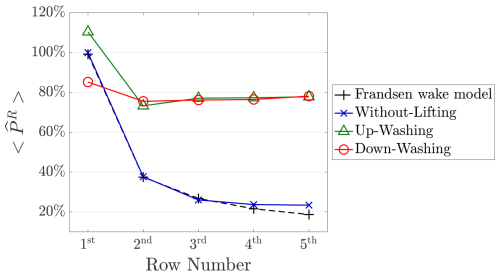
Figure 9The normalized row-averaged rotor power of the MRSL's rotor (). The normalization is done by dividing the values by the rotor power of the MRSL situated at the first row in the mid-column of the WL case. Calculation of the use of the Frandsen wake model is detailed in Appendix G.
Very good agreement was found between the CFD results for the without-lifting (WL) case and the predictions of the Frandsen wake model, which supports the validity of the numerical framework used in this work.
As expected, of the three cases is highly correlated with (as indicated by Eq. 8), with the cases having lifting devices also exhibiting higher . However, in terms of the magnitudes, the relative differences in between cases with and without lifting devices are greater than those in , since is proportional to the cube of the sampled velocity, while is proportional to the square of it (Eqs. 4 and 8).
Examining the values of for the first row of the three cases in Fig. 9, it is observed that for the UW case is higher than that of the WL case. In contrast, the DW case exhibits the opposite behavior. This can be attributed to the wings (lifting devices) of the MRSLs acting as diffuser-like devices. A straightforward explanation is that the bound circulations of the wings (Anderson, 2011) either accelerate or decelerate the flow velocity crossing the rotor (thrusting devices) of an MRSL, depending on the configuration of the lifting devices. Previous studies have reported similar phenomena with comparable configurations (Bader et al., 2018). Although this effect influences the power output of MRSLs, it is overshadowed by the effects of the enhanced wake recoveries due to the lifting devices. Therefore, it is not discussed or quantified in the rest of this work.
When comparing the power output row by row across the entire regenerative wind farm, it is found that the cases with lifting devices have significantly higher values for compared to the case without at and after the second row. Specifically, for the UW and DW cases at the second row is more than double that of the WL case. Remarkably, for the third to the fifth rows, for the two cases with lifting devices is more than triple compared to that without. Furthermore, despite the relatively small spacing (around 5.3 Dcir, considering the shape effects of the rotor; see Appendix G), for the cases with lifting devices remains at least 80 % of the reference power up to the fifth row. This significantly outperforms conventional wind turbines (i.e., HAWT), which typically maintain around 40 % to 60 % when the inflow is aligned with the wind farm layout and when the streamwise spacing is 5 Dcir or 7 Dcir, respectively (Barthelmie et al., 2010; Li et al., 2024a; Wu and Porté-Agel, 2015). These power output results underscore the profound potential of the concept of regenerative wind farms, supporting the current proposal.
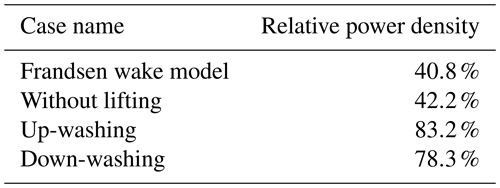
The overall performance of the regenerative wind farms is evaluated based on power density, which serves as a measure of the efficiency of the regenerative wind farms. Table 4 lists the relative power densities of the regenerative wind farms, with 100 % corresponding to 11.1 W m−2, which is the power density of the MRSL at the first row in the mid-column in the WL case.
Similarly, as has been seen in the plot of (Fig. 9), the result of the WL case has very good agreement with the prediction given by the Frandsen wake model in Table 4. By comparing the other values, it is evident that the two cases with lifting devices (cases UW and DW) have power densities that are nearly double the power density of the WL case, increasing from approximately 40 % to around 80 %. In other words, the power losses due to wake interactions among the regenerative wind farms are reduced from roughly 60 % to about 20 % by introducing lifting devices. These results demonstrate the capabilities of MRSLs and the tremendous potential of regenerative wind farms in achieving significantly higher wind farm efficiencies than conventional wind farms.
4.3 Flow field characterization
4.3.1 Three-dimensional flow structures
Figure 10 illustrates the three-dimensional flow structures of the simulated wind farms based on streamwise velocity. All three cases in Table 3 are depicted. The plots cover the mid-column of the regenerative wind farms, with the positions of the MRSLs represented by deep-blue surfaces for the rotors and deep-red surfaces for the lifting devices/wings. The low-speed wakes are depicted by light-blue isosurfaces, corresponding to . Additionally, several x planes color-coded by streamwise velocity u are displayed, and the directions of in-plane velocity are indicated by arrows.
In the plot for the WL case, it is evident that the MRSLs after the second row are generally immersed in the wakes of the upstream ones, resulting in significantly lower inflow velocities compared to the first row. Additionally, based on the arrows in the plot, it can be seen that vertical velocity is generally absent, making its wake recovery rates slow. Consequently, as shown in Fig. 9, the power outputs of the MRSLs after the second row are much lower compared to those in the first row for the WL case.
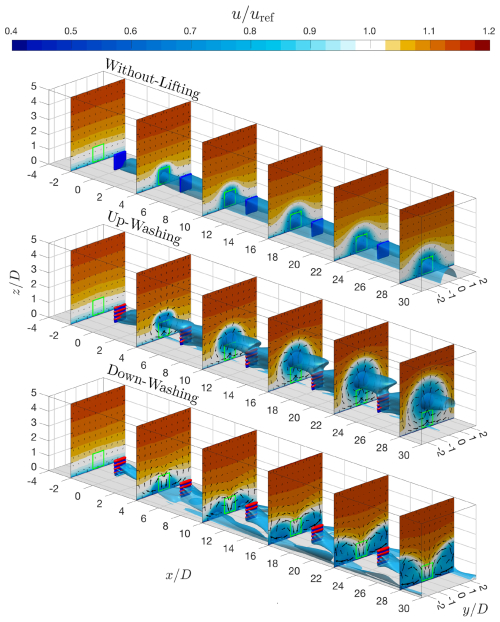
Figure 10Three-dimensional flow structures of the regenerative wind farms around their mid-columns. The without-lifting, up-washing, and down-washing cases are plotted at the top, middle, and bottom, respectively. MRSLs are represented by surfaces in deep blue and deep red, which indicate their rotors and wings. The isosurfaces in light blue depict the wakes of the MRSLs, corresponding to where . Additionally, sections with contours of streamwise velocity in the x planes are plotted, with arrows indicating the directions of the in-plane velocity. Note that the arrows' lengths are scaled by the square root of the in-plane velocity's norm. The frontal projections of the MRSLs are illustrated with light-green squares.
In the UW case, the wakes of the MRSLs are significantly steered upward, where the cores of the wakes (indicated by the light-blue surfaces) are mostly redirected away from the frontal areas of the MRSLs. This results in much higher PR for the downstream MRSLs compared to the WL case (see Fig. 9). Furthermore, it is observed that the wakes' positions are further elevated as the flow progresses deeper into the regenerative wind farm, indicating that the effects of UW accumulate progressively across rows. Additionally, arrows on the slices of the velocity contour reveal pairs of counter-rotating vortices (CRVs) formed by the trailing vortices released by the lifting devices (these CRVs can be seen clearer in Fig. 15 with the arrows). These CRVs lift the exhaust wakes upward and spread them laterally, simultaneously bringing down fresh, clean flows from above, thereby replenishing the lower layers, where MRSLs are situated, with higher-energy flows. These CRVs enhance the vertical energy entrainment process by promoting mixing in the vertical direction. See Sect. 4.4 and 4.5 for further discussions on CRVs and the vertical energy entrainment process.
In the DW case, the wakes of the upstream MRSLs are also steered away from the frontal areas of the downstream MRSLs, reducing the wake losses experienced by the downstream units. However, the presence of the ground makes the dynamics of the DW case quite different from those of the UW case. In the DW scenario, the wakes are initially directed downward. Then, they are quickly forced to spread sideways as the ground prevents further downward penetration. As the wakes accumulate on the sides as they go deeper into the regenerative wind farm, they eventually start to move upward. Like in the UW case, CRVs are also present in the DW case but rotate in the opposite direction. In this configuration, the CRVs bring fresh, clean flows down from above at the centerlines of the MRSLs while steering the exhausted wakes down and sidewards.
It is important to note that the purpose of the lifting devices is not limited to steering the wakes vertically. In fact, the primary goal of the lifting devices is to introduce a vertical advection process that enhances vertical mixing, as stronger vertical mixing leads to stronger vertical energy entrainment. A key aspect of Fig. 10 is that the blueish areas in the streamwise velocity contours (areas where u<uref) for the two cases with lifting devices are significantly larger than those without. This indicates that the mixing process of the cases with lifting devices is more pronounced, and therefore the effectiveness of lifting devices is demonstrated. However, although the significant potential of lifting devices is presented, their effectiveness in regenerative wind farms with different layouts and sizes remains uncertain, necessitating further investigation in future studies.
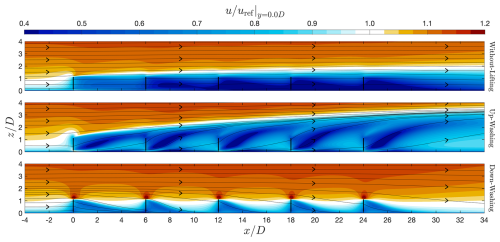
Figure 11Contours of streamwise velocity u of the regenerative wind farms with the without-lifting, up-washing, and down-washing cases in Table 3. The slices are cut at and uref=10 m s−1. The contours are superimposed with the streamlines based on the in-plane velocity (u and w). The thick black lines represent the positions of the MRSLs.
4.3.2 Streamlines
The contours of streamwise velocity u, superimposed with streamlines for the three cases in Table 3, are shown in Fig. 11. These contours are based on the data on the slices at , corresponding to the middle of the mid-column. In the WL case, no significant vertical flows are indicated by the streamlines, suggesting that the vertical advection process is generally absent. In contrast, for the cases with lifting devices (UW and DW), the streamlines show steep slopes right behind the MRSLs, indicating strong vertical advection and significant vertical mixing.
Additionally, it can be observed that the thickness of the wakes (the blueish area) in the WL case remains nearly constant after the second row (around 1.5 D). In the UW case, the wake thickness progressively increases as it moves deeper into the regenerative wind farm, growing from around 1.0 D to 3.5 D. On the other hand, in the DW case, the wake thickness decreases with each subsequent row of MRSLs, dropping from 1.0 D to 0.5 D. However, it should be noted that the surfaces in Fig. 11 are confined to . If the surfaces were shifted along the y direction, it would be evident that the wakes in both the UW and the DW cases penetrate higher than those of the WL case (the thickness of wakes for DW can reach around 2.1 D), as can be confirmed with the contours of u displayed in Fig. 10. This again demonstrates that lifting devices enhance vertical mixing within regenerative wind farms.
4.3.3 Lateral-averaged streamwise velocity profiles
This subsection explores the lateral-averaged velocity profiles in the regenerative wind farms. Two lateral-averaging ranges are considered, which are and , and their lateral-averaged velocities are denoted as 〈u〉±0.5 D and 〈u〉±2.5 D, respectively. Note that 〈u〉±0.5 D averages over the frontal area of MRSLs situated in the mid-column, while 〈u〉±2.5 D averages over the entire mid-column. Figure 12 presents the vertical profiles of 〈u〉±0.5 D (left) and 〈u〉±2.5 D (right) at , 16.0, and 22.0, which are located 4 D downstream from the second, third, and fourth rows of the regenerative wind farms. These positions are selected since they are completely within the regenerative wind farms, where the influences of the wind farm boundaries are relatively small. Additionally, the distance of 4 D is far enough from the upstream MRSLs, while the induction effects of the MRSLs in the next row are minimal.
In the plot of 〈u〉±0.5 D profiles (Fig. 12a), it is evident that both case UW and case DW exhibit significantly larger values for 〈u〉±0.5 D around the heights of the MRSLs compared to the WL case, and the differences are greater with larger . This has already been reflected in the values of power output reported in Fig. 9. Additionally, the shapes of the velocity profiles differ significantly between the two lifting configurations. In the DW case, the profiles closely resemble the freestream profiles, suggesting that the flow's mean kinetic energy (MKE) is replenished. Upon closer inspection between , the 〈u〉±0.5 D profiles for the DW case are slightly higher than the freestream profiles. This is related to the strong downward vertical velocities around , which entrain higher streamwise velocity from the upper layers to the lower ones. In contrast, for the UW case, the 〈u〉±0.5 D profiles decrease with z from z≃0.2 D to z≃1.5 D, which are atypical velocity profiles for standard atmospheric boundary layers. These shapes indicate that the wakes of the MRSLs are channeled upward in case UW and that the MKE entrainment is primarily from the sides of MRSLs at the lower layers.
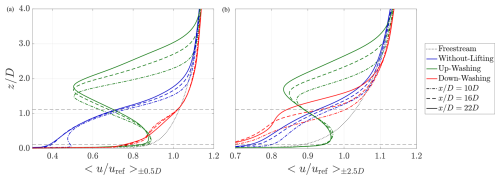
Figure 12Lateral-averaged streamwise velocity profiles. The velocity profiles are sampled at 4 D after the second, third, and fourth rows of the wind farm (, 16.0, and 22.0). The lateral averaging range for (a) is , which covers the frontal area of the MRSL of the mid-column. For (b), the lateral averaging range is , covering the entire mid-column. The freestream profiles are based on the results of the without-lifting case at . Without lifting, up-washing, and down-washing correspond to the case names in Table 3.
For the profiles of 〈u〉±2.5 D, case DW notably underperforms compared to case WL around the height of the MRSLs (). This is mainly because the MRSLs of case DW have extracted more power from the flow at these positions, and the induced drag from the lifting devices also negatively impacts 〈u〉±2.5 D. In contrast, case UW still significantly outperforms case WL around the height of the MRSLs, even though it also extracts more energy and introduces induced drag as case DW. This difference is because case UW ejects most of its exhausted wakes upward, while the wakes in case DW are mostly trapped at lower altitudes.
For both 〈u〉±0.5 D and 〈u〉±2.5 D in Fig. 12, it is evident that at higher altitudes (larger ), case UW has more pronounced effects on altering the velocity profiles compared to case DW. Moreover, for UW, it is found that the maximum deficits of both 〈u〉±0.5 D and 〈u〉±2.5 D appear to be higher for larger . This observation aligns with the circulation-based analysis carried out in the later section (Sect. 4.4), where it is found that the positions of CRVs () for case UW progressively rise as the flow moves deeper into the regenerative wind farm, while this is not the case for DW. Additionally, this observation further suggests that the UW configuration may have inherent advantages in enhancing vertical entrainment, as it can extend its effects to higher layers of the ABL compared to the DW configuration.
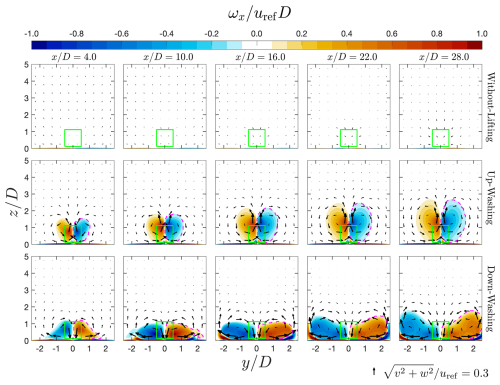
Figure 13Contours of streamwise vorticity ωx on x planes at different x positions. The x positions are indicated at the top of each column. These x positions are the same as those in Fig. 10, except is excluded. Cases WL, UW, and DW in Table 3 are plotted in the top, middle, and bottom rows, respectively. The frontal projections of the MRSLs are illustrated with light-green squares. The vortical structures enclosed by the dashed magenta lines are used to calculate the streamwise circulation-related quantities analyzed in Sect. 4.4. The arrows indicate the direction of the in-plane velocity. Their lengths are scaled by the square root of the in-plane velocity's norms, and their absolute scales are indicated at the bottom right of the figure.
4.3.4 Vorticity fields
The fields of streamwise vorticity ωx on the selected x planes (the same as those in Fig. 10 except that is dropped) for cases WL, UW, and DW are plotted in Fig. 13. In this figure, large-scale vortical structures appear in the wakes of both the UW and the DW cases, which we call counter-rotating vortices (CRVs). It is these CRVs that promote the vertical energy entrainment process for cases UW and DW, and it is evident that CRVs are absent in the wake of case WL. Additionally, the plots show that CRVs increase in size as they progress deeper into the regenerative wind farms for the cases with lifting devices. As described earlier, these CRVs originate from the trailing vortices released by the lifting devices of the MRSLs (see Fig. 2 for three-dimensional representations of CRVs with isosurfaces of ). Thus, as the downstream rows release their trailing vortices, the existing CRVs are strengthened, as can be assessed qualitatively in Fig. 13. Furthermore, visual inspection reveals that the centers of the CRVs rise as the flow passes through more rows of MRSLs in case UW, while in case DW, the centers of the CRVs are observed to be pushed primarily sideways. These observations highlight that the dynamics of CRVs depend on the lifting configurations of the MRSLs, which is further discussed in Sect. 4.4.
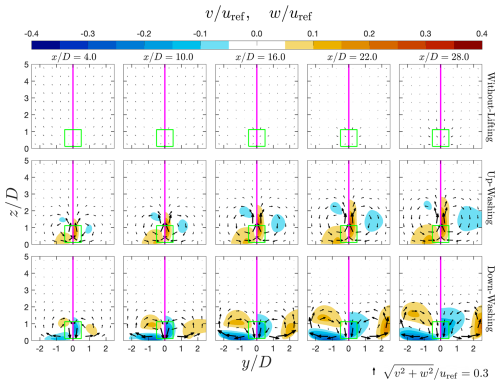
Figure 14Contour plots of lateral velocity v and vertical velocity w for the WL, UW, and DW cases in Table 3 on x planes at different x positions. The x positions are indicated at the top of each column. The two quantities are plotted side by side in each panel, where the left is v and the right is w. The arrows in the plots represent the in-plane velocities. The arrows indicate the direction of the in-plane velocity. Their lengths are scaled by the square root of the in-plane velocity's norms, and their absolute scales are indicated at the bottom right of the figure.
4.3.5 Lateral and vertical velocities
The contours of lateral and vertical velocities (v and w) at selected x planes (the same as those for ωx in Fig. 13) are presented in Fig. 14. In each panel, the left side displays the v fields, while the right side shows the w fields. Additionally, to supplement these results, contours of w for UW and DW at for the entire wind farm cross-section are provided in Fig. 2.
Contours of v and w are analyzed as they are directly linked to the advection processes that enhance energy entrainment. As shown in Fig. 13, the magnitudes of both v and w increase with for UW and DW, while they remain minimal for WL across all considered x planes. Notably, both v and w exceed 20 % of uref after the second row of the wind farm, demonstrating the strong influence of CRVs and significant advection processes.
Furthermore, the regions of high w values for both cases with lifting devices extend above the MRSLs' height, indicating enhanced vertical mixing, which leads to vertical energy entrainment. This effect is particularly pronounced in UW, where regions with greater than 5 % of uref reach up to .
4.4 Quantification of counter-rotating vortices
Utilizing circulation, this section assesses the counter-rotating vortices (CRVs) identified in Figs. 10 and 13 in a quantitative manner. Based on the fields of ωx, streamwise circulations Γx of all three cases in Table 3 are calculated to represent the strength of the CRVs, which are presented in Fig. 15. The values of Γx in Fig. 15 are obtained using Eq. (13). Stokes' theorem is applied in Eq. (13), with C being the contour bounding the surface S.
In this work, the strength of CRVs is defined by the magnitudes of Γx (denoted as ) calculated using the rightmost of Eq. (13). Moreover, the positions of the CRVs are defined based on the center of gravity (CoG) of the vortical structure (Saffman, 1995), which is calculated through Eq. (14), where and are defined as the z and y positions of CRVs, respectively. Note that when calculating the Γx-related quantities in the current work, only the regions within and are considered. Furthermore, only the ωx with the prevailing sign in that region is considered. Examples are illustrated in Fig. 13, where Γx as well as and are calculated based on the regions enclosed by the dashed magenta lines.
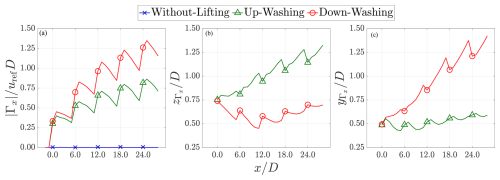
Figure 15Plots of (strength of CRVs, a), (heights/z positions of the cores of CRVs, b), and (lateral positions/y positions of the cores of CRVs, c). They are calculated based on Eqs. (13) and (14). The examples of the areas considered to calculate these quantities are enclosed by the dashed magenta lines in Fig. 13. See the text for more details. Note that the x ticks are made the same as the x positions of the MRSLs placed in different rows.
4.4.1 Strength of CRVs
As indicated by the values of on the left of Fig. 15, for both the UW and the DW cases, the strength of CRVs gradually decreases with larger x before reaching the MRSL of the next row (e.g., drops in the region of ), indicating that CRVs dissipate as they are convected downstream without further perturbation. However, the plot also reveals that the strength of the CRVs grows stronger as more rows of MRSLs are passed, surpassing the maximum values observed in previous rows. This indicates that the CRVs released by the MRSLs of different rows accumulate, reinforcing their strength row by row. Stronger CRVs result in stronger vertical flows, making the vertical advection process more significant. Furthermore, based on in Fig. 15, it appears that the strength of the CRVs has not yet reached its maximum or asymptotic value at the fifth row, suggesting that the strength of the CRVs may continue to accumulate if the regenerative wind farms have more rows of MRSLs.
4.4.2 Positions of CRVs
The positions of the CRVs' cores are quantified using and introduced earlier. They are plotted in the middle and right of Fig. 15. and indicate the vertical positions (heights) and the lateral positions of the CRVs' cores, respectively.
The self-propelling property of CRVs can be observed by checking the values of . Specifically, in case UW, the CRVs' cores rise progressively as they move deeper into the regenerative wind farm. Conversely, in case DW, the heights of the CRVs' cores gradually decrease starting from the first row. However, the positions of reach a minimum around the third row of the regenerative wind farm in case DW, after which they begin to rise. This is primarily due to the presence of the ground and the induced flow from the MRSLs in the side columns (see Fig. 2 for a contour illustrating all three columns).
Similarly to , the y positions (lateral positions) of CRVs, , also depend on the lifting configurations. In case UW, consistently remains around from the first row to the fifth row. Conversely, in case DW, shifts increasingly outward as the flow travels in the positive x direction. This outward shift of the CRVs is due to the boundary condition imposed by the ground, which can be deduced through the method of image vortices (Saffman, 1995). The presence of the ground also influences the locations of in case UW, causing them to tend toward between any two consecutive rows. However, since for case UW is located much higher than that in the DW case, the effects of the ground are much less significant.
An important aspect to mention is that when the positions of the CRVs' cores are higher (larger ), they may be more capable of mixing the exhausted wakes with the fresh freestream, which could be more beneficial for the vertical entrainment process. Therefore, even when the vertical forcing of UW and DW is very similar, case UW may offer inherent advantages in this regard.
4.5 Control volume analysis on energy budget
In this subsection, the energy transport process of the simulated regenerative wind farms is explored using the control volume approach. The calculations are based on Eq. (H4), derived and explained in Appendix H. Six terms are considered, namely mean kinetic energy (MKE) advection, MKE diffusion plus pressure work, TKE advection plus diffusion, power extraction (by the MRSL's rotor), TKE dissipation, and residuals. Five control volumes (CVs) are examined, labeled from A to E (see Fig. 6). Each CV encloses an MRSL in the mid-column, covering a range from its 4 D upstream to its 2 D downstream. This range is designed to assess the energy sources and sinks of the MRSL in a specific CV. The vertical and lateral ranges are and , encompassing the entire mid-column. The results of the control volume analysis for the three cases listed in Table 3 are presented in Fig. 16.
For case WL (left of Fig. 16), it can be observed that the energy within the CV is primarily supplied by the advection of MKE and the (modeled) turbulent shear stress (MKE diffusion plus pressure work), with both terms having similar magnitudes. Notably, neither of these energy sources alone could supply the power extracted by the MRSL rotors. At first glance, it may appear that the advection of MKE continues to supply energy to the CVs in case WL. However, this is because the wakes of the MRSLs accumulate row by row, continuously depleting the MKE transported in the streamwise direction (freestream MKE), while the contribution from vertical advection is almost negligible. This interpretation is supported by the flow fields shown in the top panels of Figs. 10 and 11.
For the UW and DW cases (middle and right of Fig. 16), unlike the WL case, the contribution of MKE advection is much greater than the work done by turbulent shear stress, with MKE advection alone being sufficient to support the energy extraction by the MRSLs after the second row. Furthermore, the energy supplied to CVs by MKE advection in these two cases is primarily due to the vertical advection process, driven by the strong vertical velocity component (see Fig. 11). This vertical energy entrainment process differs significantly from conventional wind farms, which mostly rely on Reynolds shear stress (turbulent shear stress) (Porté-Agel et al., 2020; Calaf et al., 2010; VerHulst and Meneveau, 2014). Due to the indirect nature of energy entrainment by Reynolds shear stress, its magnitudes are naturally less than those of energy entrainment by advection. The latter directly injects higher energy flows into the control volumes, while the former relies on a secondary process involving Reynolds shear stress and the strength of the shear layer.
By closely inspecting Fig. 16, it can be observed that the MKE advection term is higher for case UW compared to case DW. However, the MKE diffusion plus pressure work term (representing the work done by turbulent shear stress) contributes negatively in case UW after the second row. This phenomenon can be explained by the lateral-averaged velocity profiles shown in Fig. 12, where the shear profiles for case UW are inverted (〈u〉±2.5 D decreases with increasing z) in the range of , causing the shear to impact energy entrainment negatively. This highlights one of the key differences in aerodynamics between UW and DW.
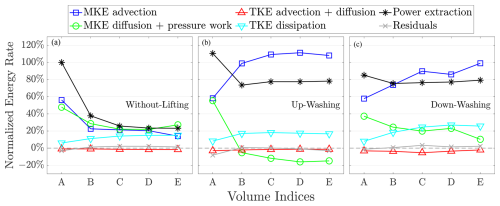
Figure 16Normalized energy transport rates of the terms in Eq. (H4) based on control volumes. The normalization is done by dividing the values by the rotor power of the MRSL situated at the first row in the mid-column of case WL, which is . Cases WL, UW, and DW are plotted in the left, middle, and right, respectively. The letters at the abscissa refer to the indices of the control volumes (see Fig. 6), where volume A is the most upstream one, and volume E is the most downstream one. Each volume encloses an MRSL of the mid-column, covering its 4 D upstream to its 2 D downstream.
This study conducted numerical investigations of regenerative wind farms. Regenerative wind farming is a newly proposed wind farm concept that consists of innovative wind harvesting systems, which are multi-rotor systems with lifting devices (MRSLs; see Fig. 1). In these regenerative wind farms, wake recoveries of MRSLs were engineered to be much faster compared to conventional horizontal-axis wind turbines (HAWTs), significantly reducing the power losses due to wake interactions. These enhanced wake recoveries were achieved by altering the vertical entrainment processes. Instead of turbulent mixing, the entrainment processes were facilitated by the vertical flows induced by trailing vortices generated by the lifting devices of MRSLs (see Fig. 2). To gain a comprehensive understanding of how the MRSLs' lifting devices affect the entrainment processes, cases with different configurations for lifting devices were tested. Additionally, detailed parametric and sensitivity studies on varying lifting magnitudes, inflow turbulence intensities, turbulence models, and grid sizes are performed in the appendixes.
Our results showed that, as the magnitudes of the vertical force were similar to the thrust of MRSLs, the power outputs of MRSLs with the lifting devices could be more than tripled compared to those without after the third row of the regenerative wind farms (see Fig. 9), diminishing the wake losses from around 75 % to 25 %. This significant increase in power output highlights the great potential of the regenerative wind farm. Specifically, to deliver the same amount of power, regenerative wind farms would require only half the land area compared to conventional wind farms with HAWTs because they have much higher wind farm efficiencies (see Table 4). This land use reduction could lower the overall cost of wind energy, making renewable energy more affordable.
Further examinations of how regenerative wind farms could achieve significantly higher power output were conducted by analyzing the flow fields using both qualitative and quantitative methods. Two-dimensional contour plots and three-dimensional isosurfaces illustrated that the low-velocity wakes of MRSLs were guided vertically upward, while high-velocity fresh flows were directed downward, replenishing the available power for MRSLs located further downstream. Circulation-based analysis revealed that the strength of counter-rotating vortices (CRVs), which are the trailing vortices generated by the MRSLs' lifting devices, accumulated progressively as the flow moved deeper into the regenerative wind farms. These CRVs are responsible for inducing the vertical advection process, with stronger CRVs leading to stronger vertical entrainment processes. Energy budget analysis based on control volumes indicated that wind farms with MRSLs equipped with lifting devices underwent a much stronger energy recovery than those with multi-rotor systems lacking such devices. Moreover, the analysis confirmed that the primary contributor to wake recovery in cases with lifting devices was the vertical advection process, contrasting with conventional wind farms, where wake recovery predominantly relies on turbulent shear (Calaf et al., 2010; VerHulst and Meneveau, 2015). These analyses thoroughly investigated the underlying physics of how regenerative wind farms can achieve significantly higher power outputs.
The results and analysis from this study suggest that the concept of regenerative wind farms could potentially lead to wind farms with much higher farm efficiencies than their conventional counterparts. A series of future research efforts is recommended to fully understand the physics and potential of regenerative wind farms and MRSLs, aiding in their realization. Several key aspects related to aerodynamics are outlined below. First, conducting simulations using higher-fidelity models, such as large-eddy simulations, in a time-resolved manner would enable better resolving the aerodynamics within the regenerative wind farms. Moreover, modeling MRSLs with greater detail is desirable, as the effects of their detailed geometry and the rotational of the sub-rotors are omitted in the current work. Additionally, investigating whether the stability properties of atmospheric boundary layers influence the dynamics of CRVs would be of significant interest. Furthermore, exploring how the inflow directions, the layouts of regenerative wind farms, and the sizes of the regenerative wind farms impact the farm efficiency is also critical. In addition, investigating the effectiveness of placing large-wing structures (i.e., MRSLs without rotors) between the turbines of existing wind farms is also of interest. This approach explores the possibility of transforming existing wind farms into regenerative wind farms. Moreover, experimental studies on regenerative wind farms and developing MRSL prototypes should be considered a top priority, as the ultimate goal is to transform this innovative concept into a real-world application. Certainly, there are numerous other practical challenges beyond aerodynamics, such as the structural integrity of MRSLs, the control strategies and mechanisms of MRSLs (such as yaw control), and the economic feasibility of regenerative wind farms, among others. These aspects are also critical, and addressing them adequately will be necessary to bring the concept of regenerative wind farms to a commercial stage.
The key governing equations of the RANS k–ω SST model are written in Eqs. (A1) to (A3), which are the equations for continuity, transport of momentum, and transport of modeled turbulence kinetic energy (denoted as TKE or k). In these equations, ui, p, k, ω, ρ, ν, fbody,i, Sij, τij, and νT denote the ith component of velocity, static pressure, turbulence kinetic energy, turbulence specific dissipation, fluid density, kinematic (molecular) viscosity, the body forces applied on the flow, the shear strain tensor, the Reynolds stress tensor, and eddy viscosity. Note that all quantities just mentioned are time averaged. The definition of Sij and the modeling of τij are written in Eq. (A4). For brevity, certain equations related to the k–ω SST model, such as the transport equation of ω and the calculation of νT, have been omitted. Readers are referred to the OpenFOAM v2106 documentation (OpenCFD Ltd., 2021) for further details. Moreover, in this work, all model coefficients of the k–ω SST model are set to the default values provided by OpenFOAM v2106 (OpenCFD Ltd., 2021), e.g., .
For the steady RANS simulations, all the fluctuating properties are modeled through the turbulence model, and they are modeled differently depending on the model chosen. Thus, model-related uncertainties arise, which may affect the conclusions obtained by analyzing CFD results. To ensure that the conclusions obtained in this work are robust and independent of the chosen turbulence model, a few simulations are conducted with several mostly used turbulence models. In addition to the already-used k–ω SST model (Menter, 1994), configurations of cases WL, UW, and DW in Table 3 are tested with the realizable k–ε model (Shih et al., 1995) and RNG k–ε model (Yakhot et al., 1992). These are three of the most popular turbulence models for wind-energy-related applications, and note that there is currently no unified standard for the optimum RANS turbulence model (Thé and Yu, 2017; Eidi et al., 2021).
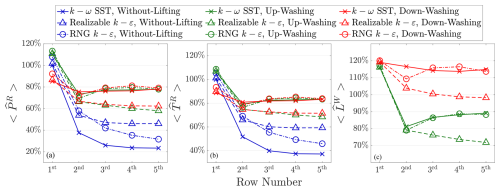
Figure B1Simulations cases with different RANS turbulence models. The configurations used are those of the cases listed in Table 3. , , and are the normalized row-averaged power, thrust, and vertical force, respectively. The normalization factors are and of the cases using the k–ω SST model, where their values are the same as those used in Figs. 8 and 9.
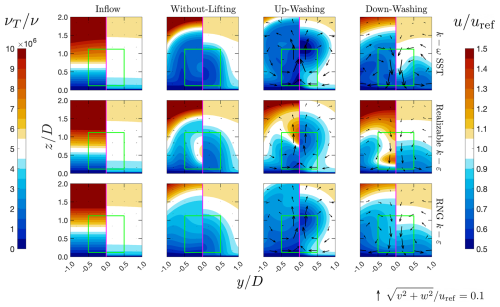
Figure B2Contour plots of (modeled) eddy viscosity νT and streamwise velocity u for the cases with different RANS turbulence models. The two quantities are plotted side by side in each panel, where the left is νT and the right is u. The top, middle, and bottom rows are the solution given by the simulations using the k–ω SST, realizable k–ε, and RNG k–ε models, respectively. The leftmost column presents the inflow conditions at of configuration WL for reference. The rest of the columns plot the quantities at , with the cases from left to right being WL, UW, and DW. The arrows in the plots represent the in-plane velocities. The lengths of the arrows are scaled by their norms, and their absolute scales are indicated at the bottom right of the figure.
The results of MRSLs' outputted power, thrust, and lift for cases with different turbulence models are presented in Fig. B1. Except for changing the turbulence model, all other parameters remain the same as cases WL, UW, and DW listed in Table 3 (inlet conditions of ε are set to atmBoundaryLayerInletEpsilon). It can be seen that similar results are yielded by the RNG k–ε model when compared to the k–ω SST model. As for the results with the realizable k–ε model, the results significantly deviate from the other two, and it shows that the effectiveness of the wings of the MRSL is less astonishing. This deviation is likely due to the more diffusive behavior of the realizable k–ε model in the current application.
As shown in Fig. B2, the νT values modeled by the realizable k–ε model are higher than those of the other two turbulence models across all three configurations. Higher νT leads to faster vortex dissipation and increased (modeled) turbulent shear stress (term MKE diffusion in Eq. H4). Faster vortex dissipation reduces the effects of upwash and downwash (see the arrows in Fig. B2), thereby slowing the wake recovery rates for configurations UW and DW. Conversely, higher (modeled) turbulent shear stress (MKE diffusion) accelerates wake recovery for configuration WL, as this is its primary mechanism for wake recovery (see Fig. 16).
Although the power predicted by different turbulence models shows considerable variation, it is evident that significant improvements are achieved by introducing lifting devices when comparing the power outputs of the cases with and without lifting devices across all three turbulence models. Thus, with the results, it can be concluded that even though the selection of the RANS turbulence model may influence the results in the sense of their absolute values, it does not significantly impact the main conclusion of this work, which is that the installation of the lifting devices (wings) can dramatically improve the power performance of the downstream wind harvesting systems (MRSLs) in regenerative wind farms.
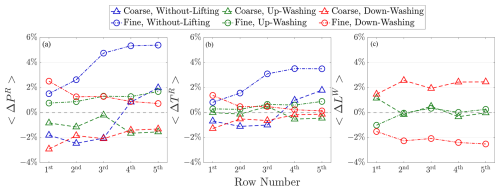
A grid independence test is carried out to ensure that the discretization error of the CFD simulations does not affect the conclusions drawn. The three cases in Table 3, WL, UW, and DW, are tested with three grid sizes Δ. The three tested grid sizes are , , and , and they are labeled as Coarse, Medium, and Fine, and each of them results in a mesh that has 73.9 M, 137.8 M, and 249.5 M cells, respectively. Note that the cases in Table 3 use mesh Medium. Also note that, except for adjustment of the grid sizes, all other parameters are kept the same as the cases in Table 3, including the spacings of the actuator elements for wings and the absolute values of the smearing factors (εR and εW).
The results of the grid independence test are presented in Fig. C1, where 〈ΔPR〉, 〈ΔTR〉, and 〈ΔLW〉 are the relative deviations of 〈PR〉, 〈TR〉, and from their reference cases, respectively. The reference cases are the cases that used a medium mesh. The definition of 〈ΔPR〉 is given in Eq. (C1), and 〈ΔTR〉 and 〈ΔLW〉 are derived in the same way. It can be seen that 〈ΔTR〉 and 〈ΔLW〉 of the cases with coarse and fine meshes both fall in the ranges of ±2 % for the first row and ±4 % for all rows. This suggests that the impacts of grid sizes considered are minimal on the conclusions drawn, as the deviations due to different Δ are at least an order smaller than the differences in TR between the cases with and without lifting devices (∼50 % to 100 %). For the values of 〈ΔPR〉 of the WL cases, although they can be up to 6 % for the third, fourth, and fifth rows, their absolute values of the reference 〈PR〉 are relatively small compared to the upstream rows. Due to their relatively small values compared to those of the upstream rows, their relative deviations are more susceptible to the variations arising from the upstream rows. With these results, it can be concluded that the medium mesh () is sufficient for the application used in this work.
Previous studies have shown that inflow turbulence intensity (TI) significantly influences wind turbine wake aerodynamics, particularly by disrupting large-scale coherent structures in the wake and reducing their coherence (Li et al., 2024a). In this work, the concept of regenerative wind farms relies heavily on the swirling motions induced by the trailing vortices released from MRSLs, which are also considered coherent structures. Therefore, a parametric study on inflow TI is particularly important and worth conducting. In this appendix, additional simulations are performed with inflow TI values of 5 % and 14 %. Except for the changes in inflow turbulence intensity, all other parameters are kept identical to cases WL, UW, and DW listed in Table 3. To achieve TI levels of 5 % and 14 %, the model coefficient C1 mentioned in Sect. 3.2 is set to 0.065 and 8.214, respectively.
The results for the power, thrust, and lift output of MRSLs under different inflow TIs are presented in Fig. D1, while the flow fields are analyzed in Fig. D2. As expected, Fig. D1 shows that the effectiveness of the lifting devices diminishes as TI increases. Higher TI causes the trailing vortices in UW and DW to dissipate more rapidly, while it enhances the wake recovery rates in WL by increasing the diffusion of MKE (modeled turbulent mixing). This trend is confirmed by examining the flow fields in Fig. D2, which demonstrate that the upwash and downwash effects in UW and DW become less pronounced with higher TI.
Although the improvement in power outputs is less dramatic under higher TI, this appendix shows that the benefits of the lifting devices remain significant even at TI =14 %, which is around or beyond the upper limit of typical offshore conditions (Hansen et al., 2012). Specifically, MRSLs in UW and DW still achieve over 50 % higher power output compared to WL after the third row when subjected to an inflow TI of 14 %.
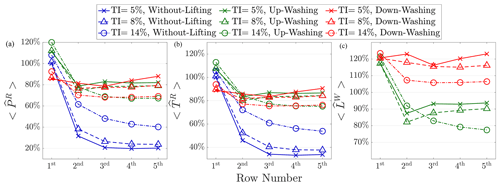
Figure D1Simulation cases that are subjected to different inflow turbulence intensities. The configurations used are those of the cases listed in Table 3. , , and are the normalized row-averaged power, thrust, and vertical force, respectively. The normalization factors are and of the cases subjected to TI =8 %, where their values are the same as those in Figs. 8 and 9.
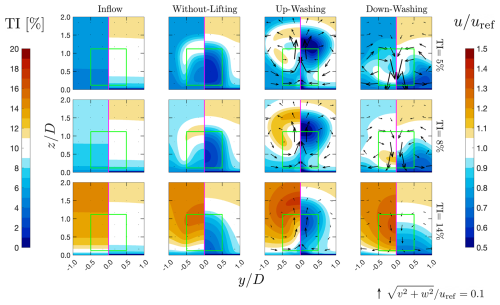
Figure D2Contour plots of turbulent intensity (TI) and streamwise velocity u for the cases subjected to different inflow TIs. The two quantities are plotted side by side in each panel, where the left is TI and the right is u. Note that TI is defined as , where k is the turbulent kinetic energy modeled by the k–ω SST model. The top, middle, and bottom rows are the solution given by the simulations subjected to inflow TI being 5 %, 8 %, and 14 %, respectively. The leftmost column presents the inflow conditions at of configuration WL for reference. The rest of the columns plot the quantities at , where cases WL, UW, and DW are indicated from left to right. The arrows in the plots represent the in-plane velocities. The lengths of the arrows are scaled by their norms, and their absolute scales are indicated at the bottom right of the figure.
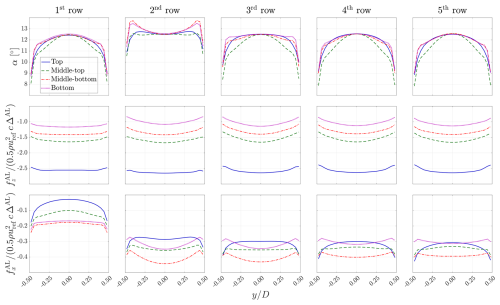
The angle of attack and load distributions of the MRSLs' wings for cases UW and DW in Table 3 are presented in Figs. E1 and E2, respectively. Note that the presented angle of attack α, streamwise forcing , and vertical forcing are sampled from the mid-column of the wind farms. Definitions of α, , and are in Eqs. (E1) and (E2), where fAL is the force exerted by an actuator element of the wings. Focusing on the force exerted by the first row of the MRSL, tip losses can be identified with the profiles. Additionally, with the profiles, it can be seen that induced drags are mainly concentrated around the tips. These results comply with classical aerodynamic theories (Anderson, 2011), suggesting that the wings' loading predicted by the actuator lines used in this work is reasonable. Some peculiar shapes appear for the loading from the second row onward. This is due to the wakes and vertical flows introduced by upstream MRSLs that complicate the inflow of these wings. Furthermore, in these two figures, it can be seen that α in the middle of the wings is 12.5°, and this α corresponds to Cl=2.5 according to the airfoil polar data of the S1223 airfoil (Fig. 5), confirming holds for these two cases.
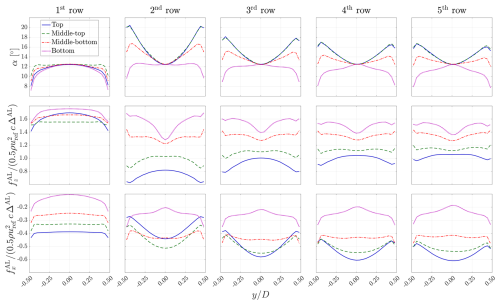
Figure E1The profiles of the angle of attack α (top row), vertical forcing (middle row), and streamwise forcing (bottom) for the wings of the MRSLs situated in the mid-column for case UW.
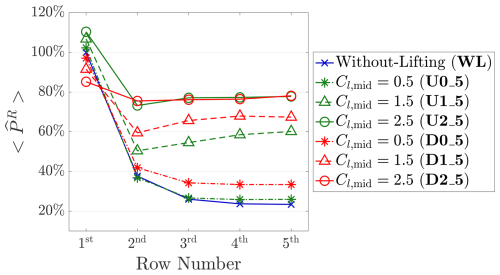
To further understand how the magnitudes of MRSLs' lift affect the performance of regenerative wind farms, several auxiliary cases are performed. The cases tested are listed in Table F1. Three different vertical forcing (lifting) magnitudes are tested for each direction of the lift. The lift magnitudes are adjusted by changing Cl,mid (the lift coefficient at the mid-span of the wing) by pitching the wings (see the end of Sect. 3.4). Both directions of lift are tested with Cl,mid being 0.5, 1.5, and 2.5. Note that the cases marked with an asterisk are those listed in Table 3, where WL, U2_5, and D2_5 correspond to WL, UW, and DW, respectively.
Similarly to Fig. 8, Fig. F1 presents the normalized row-averaged thrust, lift, and induced drag (, , and ) of the MRSLs for the seven cases listed in Table F1. As designed, increases with higher Cl,mid values. Additionally, regardless of the lift direction, after the second row is higher for all the cases with lifting devices compared to the case without. Moreover, from the second row onward, higher Cl,mid corresponds to higher for both directions of the lift, despite the fact that larger Cl,mid also results in larger , as shown in the right panel of Fig. F1.
Table F1The test matrix of the auxiliary cases. These cases have different values of Cl,mid, which affects the magnitudes of the MRSLs' vertical force (lift). The values of Cl,mid represent Cl at the mid-span of the MRSLs' wings of a case (see Sect. 3.4). Note that the cases marked with an asterisk are the same as those listed in Table 3, where WL, U2_5, and D2_5 correspond to the WL, UW, and DW cases, respectively.
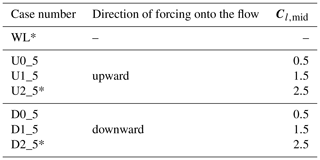
Figure F2 summarizes the power performance of the regenerative wind farms for the cases listed in Table F1. It can be seen that the normalized row-averaged power output of the MRSLs () progressively increases with higher values of Cl,mid, indicating that the performance of the regenerative wind farms is positively correlated with the lift magnitudes of the MRSLs within the tested range.
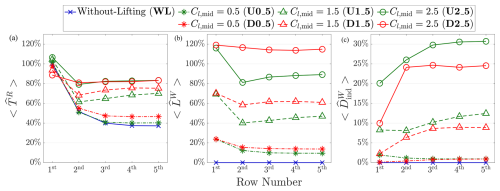
Figure F1The normalized row-averaged thrust of the MRSL's rotor (, a) together with the vertical (, b) and streamwise (, c) force components of the MRSL's lifting devices. The normalization is done by dividing the reference rotor thrust, which is based on the MRSL at the first row in the mid-column of the WL case. The legends correspond to the case number introduced in Table F1.
The analytical wake model used in Sect. 4.2 is the well-known Frandsen model, which is proposed by Frandsen et al. (2006) (region I is used as the wakes of different columns do not merge). It is derived from momentum analysis over a control volume covering one or multiple wind turbines aligned in the streamwise direction. The inputs of the Frandsen model include the wind turbine diameter DF, the thrust coefficient CT, and the streamwise spacings between the turbines (when there is more than one row of turbines), and the outputs are the wake velocity uF and wake diameter Dw, which vary along the streamwise direction. The equations for the Frandsen model are briefly written in Eqs. (G1) and (G2), where αF is the wake expansion factor that is decided empirically. In the current work, αF=0.0629 is used, based on the CFD results using large-eddy simulations reported by Andersen et al. (2014).
Note that the Frandsen model was developed mainly for horizontal-axis wind turbines, and thus it is not immediately suitable for the current work, as the MRSL has a square frontal area instead of a circular frontal area. Therefore, a correction is needed. In this work, is used, making (D is the side length of MRSL). That is, for a circular disk with DF being the diameter, its swept area will be equal to the one for a square MRSL used in this work.
Since the current work is only interested in the velocity at x positions where there are MRSLs, for simplicity, only the velocity at these positions is calculated. uF,nth is used to denote the inflow velocity seen by the nth row of the MRSL predicted by the Frandsen model, and xnth is the streamwise position of the nth row. Dw,nth denotes the wake diameter at x=xnth. For clarity, uF of the first and second rows is explicitly written in Eq. (G3). uF after the third row is calculated through a recursive method using Eq. (G4). After obtaining the values of uF for all the rows, the relation of Eq. (G5) is utilized to obtain (the power output of the MRSL's rotors predicted by the Frandsen model) based on the one-dimensional momentum theory (Manwell et al., 2010). Note that the values for CT and CP are 0.7 and 0.54, as mentioned in Sect. 2, and the corresponding power of the first row is 29.9 MW.
In addition to evaluating the performance of MRSLs based on their power outputs, analysis of this work is also conducted using the terms of the energy transport equations based on the control volume approach. This analysis aims to distinguish the primary source terms for wake recoveries. In this appendix, the control volume approach used to analyze the budget of flow energy is detailed.
We start with the two transport equations for mean kinetic energy (MKE; also denoted as K) and turbulence kinetic energy (TKE; also denoted as k) provided in Eqs. (H1) and (H2), where the physical meaning of each term is labeled. The definition of MKE is given in Eq. (H3). The transport equations for MKE (Eq. H1) and TKE (Eq. H2) are derived by multiplying ρui and ρ by Eqs. (A2) and (A3), respectively. Some rearrangements are then performed using the chain rule and the continuity equation (Eq. A1).
The transport equation for the total energy (resolved plus modeled) in differential form can be obtained by adding the two energy equations (Eqs. H1 and H2). This equation is integrated over a control volume (CV) to examine the energy balance, resulting in Eq. (H4). The divergence theorem is applied, with CS denoting the control surface bounding the CV. It is worth noting that the term MKE diffusion plus pressure work essentially represents the work done by surface forces on the control volumes. Due to the high Reynolds number in this study (e.g., and ), the primary contributor of MKE diffusion plus pressure work is the turbulent shear stress, which is modeled through the Reynolds shear stress τij (see Eq. A4). That is, the effects of MKE diffusion in this work can be understood as the effects of the modeled turbulent mixing. Additionally, the signs for each term on the left-hand side of the equation are rearranged so that positive values correspond to energy gains for a CV and vice versa for the terms on the right-hand side. The viscous dissipation term is omitted because ν≪νT due to the high Reynolds number. Furthermore, a residual term ℛ is introduced to account for discrepancies, including the viscous dissipation term, losses due to the parasitic drag of the wings, errors from discretization, interpolation errors, and other factors.
The settings, including the custom library flyingActuationDiskSource, of the simulation cases performed in this research are openly available in 4TU.ResearchData (Li et al., 2024b) with the DOI being https://doi.org/10.4121/6f7e50af-6355-4910-9918-28f9208fa37a. All data used in this work are reproducible through executing these cases.
YL: setup and conduction of simulations, formal analysis, and writing. WY: supervision and technical review. AS: supervision and technical review. CF: conceptualization, supervision, and technical review.
The contact author has declared that none of the authors has any competing interests.
Publisher's note: Copernicus Publications remains neutral with regard to jurisdictional claims made in the text, published maps, institutional affiliations, or any other geographical representation in this paper. While Copernicus Publications makes every effort to include appropriate place names, the final responsibility lies with the authors.
YuanTso Li thanks the Delft High Performance Computing Centre (DHPC) (2024) for providing computational resources.
This paper was edited by Mingming Zhang and reviewed by three anonymous referees.
Andersen, S. J., Sørensen, J. N., Ivanell, S., and Mikkelsen, R. F.: Comparison of engineering wake models with CFD simulations, J. Phys. Conf. Ser., 524, 012161, https://doi.org/10.1088/1742-6596/524/1/012161, 2014. a
Anderson, J.: EBOOK: Fundamentals of Aerodynamics (SI units), McGraw hill, ISBN 978-1-259-01028-6, 2011. a, b, c, d
Avila Correia Martins, F., van Zuijlen, A., and Simão Ferreira, C.: Proof of concept for multirotor systems with vortex-generating modes for regenerative wind energy: a study based on numerical simulations and experimental data, Wind Energ. Sci., 10, 41–58, https://doi.org/10.5194/wes-10-41-2025, 2025. a, b, c
Bachant, P., Goude, A., daa-mec, and Wosnik, M.: turbinesFoam/turbinesFoam: v0.1.1, Zenodo [code], https://doi.org/10.5281/zenodo.3542301, 2019. a
Bader, S. H., Inguva, V., and Perot, J.: Improving the efficiency of wind farms via wake manipulation, Wind Energy, 21, 1239–1253, 2018. a, b, c
Bak, C., Zahle, F., Bitsche, R., Kim, T., Yde, A., Henriksen, L. C., Natarajan, A., and Hansen, M.: Description of the DTU 10 MW reference wind turbine, Tech. rep., DTU Wind Energy, Roskilde, Denmark, 2013. a
Barthelmie, R. J., Hansen, K., Frandsen, S. T., Rathmann, O., Schepers, J., Schlez, W., Phillips, J., Rados, K., Zervos, A., Politis, E., and Chaviaropoulos, P. K.: Modelling and measuring flow and wind turbine wakes in large wind farms offshore, Wind Energy, 12, 431–444, 2009. a, b
Barthelmie, R. J., Pryor, S. C., Frandsen, S. T., Hansen, K. S., Schepers, J., Rados, K., Schlez, W., Neubert, A., Jensen, L., and Neckelmann, S.: Quantifying the impact of wind turbine wakes on power output at offshore wind farms, J. Atmos. Ocean. Tech., 27, 1302–1317, 2010. a, b
Bosch, J., Staffell, I., and Hawkes, A. D.: Global levelised cost of electricity from offshore wind, Energy, 189, 116357, https://doi.org/10.1016/j.energy.2019.116357, 2019. a
Broertjes, T., Bensason, D., Sciacchitano, A., and Ferreira, C.: Lift-induced wake re-energization for a vawt-based multi-rotor system, J. Phys. Conf. Ser., 2767, 072012, https://doi.org/10.1088/1742-6596/2767/7/072012, 2024. a, b, c, d, e
Calaf, M., Meneveau, C., and Meyers, J.: Large eddy simulation study of fully developed wind-turbine array boundary layers, Phys. Fluids, 22, 2010. a, b, c, d, e
Delft High Performance Computing Centre (DHPC): DelftBlue Supercomputer (Phase 2), https://www.tudelft.nl/dhpc/ark:/44463/DelftBluePhase2 (last access: 5 February 2025), 2024. a
Drela, M.: XFOIL: An Analysis and Design System for Low Reynolds Number Airfoils, in: Low Reynolds Number Aerodynamics, pp. 1–12, Springer Berlin Heidelberg, Berlin, Heidelberg, ISBN 978-3-642-84010-4, https://doi.org/10.1007/978-3-642-84010-4_1, 1989. a, b
Dupont, E., Koppelaar, R., and Jeanmart, H.: Global available wind energy with physical and energy return on investment constraints, Appl. Energ., 209, 322–338, 2018. a, b
Eidi, A., Ghiassi, R., Yang, X., and Abkar, M.: Model-form uncertainty quantification in RANS simulations of wakes and power losses in wind farms, Renewable Energy, 179, 2212–2223, 2021. a
Ferreira, C., Bensason, D., Broertjes, T. J., Sciacchitano, A., Martins, F. A., and Ajay, A. G.: Enhancing Wind Farm Efficiency Through Active Control of the Atmospheric Boundary Layer’s Vertical Entrainment of Momentum, J. Phys. Conf. Ser., 2767, 092107, https://doi.org/10.1088/1742-6596/2767/9/092107, 2024. a, b, c, d
Frandsen, S., Barthelmie, R., Pryor, S., Rathmann, O., Larsen, S., Højstrup, J., and Thøgersen, M.: Analytical modelling of wind speed deficit in large offshore wind farms, Wind Energy, 9, 39–53, 2006. a, b
Gaertner, E., Rinker, J., Sethuraman, L., Zahle, F., Anderson, B., Barter, G., Abbas, N., Meng, F., Bortolotti, P., Skrzypinski, W., Scott, G., Feil, R., Bredmose, H., Dykes, K., Shields, M., Allen, C., and Viselli, A.: Definition of the IEA 15-megawatt offshore reference wind turbine, Tech. rep., National Renewable Energy Laboratory (NREL), Golden, CO, USA, https://doi.org/10.2172/1603478, 2020. a
Hansen, K. S., Barthelmie, R. J., Jensen, L. E., and Sommer, A.: The impact of turbulence intensity and atmospheric stability on power deficits due to wind turbine wakes at Horns Rev wind farm, Wind Energy, 15, 183–196, 2012. a, b
Hargreaves, D. and Wright, N. G.: On the use of the k–ε model in commercial CFD software to model the neutral atmospheric boundary layer, J. Wind Eng. Ind. Aerod., 95, 355–369, 2007. a
Jamieson, P. and Branney, M.: Multi-rotors; a solution to 20 MW and beyond?, Energy Proced., 24, 52–59, 2012. a
Jha, P. K. and Schmitz, S.: Actuator curve embedding–an advanced actuator line model, J. Fluid Mech., 834, R2, https://doi.org/10.1017/jfm.2017.793, 2018. a
Jha, P. K., Churchfield, M. J., Moriarty, P. J., and Schmitz, S.: Guidelines for volume force distributions within actuator line modeling of wind turbines on large-eddy simulation-type grids, J. Solar Energ. Eng., 136, 031003, https://doi.org/10.1115/1.4026252, 2014. a, b
Li, Y., Yu, W., and Sarlak, H.: Wake structures and performance of wind turbine rotor with harmonic surging motions under laminar and turbulent inflows, Wind Energy, 27, 1499–1525, https://doi.org/10.1002/we.2949, 2024a. a, b, c
Li, Y., Yu, W., Sciacchitano, A., and Ferreira, C.: Underling source code and case settings for “Numerical Investigation of Regenerative Wind Farms Featuring Enhanced Vertical Energy Entrainment”, 4TU.ResearchData [code and data set], https://doi.org/10.4121/6f7e50af-6355-4910-9918-28f9208fa37a, 2024b. a, b
Manwell, J. F., McGowan, J. G., and Rogers, A. L.: Wind energy explained: theory, design and application, John Wiley & Sons, ISBN 978-1-119-99436-7, 2010. a, b, c, d, e, f
Melani, P. F., Balduzzi, F., Ferrara, G., and Bianchini, A.: Tailoring the actuator line theory to the simulation of Vertical-Axis Wind Turbines, Energ. Convers. Manage., 243, 114422, https://doi.org/10.1016/j.enconman.2021.114422, 2021. a
Menter, F. R.: Two-equation eddy-viscosity turbulence models for engineering applications, AIAA journal, 32, 1598–1605, 1994. a, b
Meyers, J. and Meneveau, C.: Optimal turbine spacing in fully developed wind farm boundary layers, Wind Energy, 15, 305–317, 2012. a
Mikkelsen, R. F.: Actuator disc methods applied to wind turbines, 2004. a, b, c, d
OpenCFD Ltd.: OpenFOAM: User Guide v2106, https://develop.openfoam.com/Development/openfoam/-/tree/OpenFOAM-v2106 (last access: 1 October 2024), 2021. a, b, c, d
Porté-Agel, F., Bastankhah, M., and Shamsoddin, S.: Wind-turbine and wind-farm flows: a review, Bound.-Lay. Meteorol., 174, 1–59, 2020. a, b
Richards, P. and Hoxey, R.: Appropriate boundary conditions for computational wind engineering models using the k–ε turbulence model, J. Wind Eng. Ind. Aerod., 46, 145–153, 1993. a
Saffman, P. G.: Vortex dynamics, Cambridge University Press, ISBN 978-0-521-47739-0, 1995. a, b
Selig, M. S. and Guglielmo, J. J.: High-lift low Reynolds number airfoil design, J. Aircraft, 34, 72–79, 1997. a
Selig, M. S., Guglielmo, J. J., Broeren, A. P., and Giguere, P.: Summary of Low-Speed Airfoil Data: Volume 1, SoarTech publications, ISBN 978-0-964-67471-4, 1995. a, b, c
Shih, T.-H., Liou, W. W., Shabbir, A., Yang, Z., and Zhu, J.: A new k-epsilon eddy viscosity model for high reynolds number turbulent flows, Comput. Fluids, 24, 227–238, 1995. a
Sørensen, J. N. and Larsen, G. C.: A minimalistic prediction model to determine energy production and costs of offshore wind farms, Energies, 14, 448, https://doi.org/10.3390/en14020448, 2021. a
Sorensen, J. N. and Shen, W. Z.: Numerical modeling of wind turbine wakes, J. Fluids Eng., 124, 393–399, 2002. a, b, c
Stevens, R. J., Gayme, D. F., and Meneveau, C.: Effects of turbine spacing on the power output of extended wind-farms, Wind Energy, 19, 359–370, 2016. a
Thé, J. and Yu, H.: A critical review on the simulations of wind turbine aerodynamics focusing on hybrid RANS-LES methods, Energy, 138, 257–289, 2017. a, b, c
VerHulst, C. and Meneveau, C.: Large eddy simulation study of the kinetic energy entrainment by energetic turbulent flow structures in large wind farms, Phys. Fluids, 26, 025113, https://doi.org/10.1063/1.4865755, 2014. a
VerHulst, C. and Meneveau, C.: Altering kinetic energy entrainment in large eddy simulations of large wind farms using unconventional wind turbine actuator forcing, Energies, 8, 370–386, 2015. a, b, c
Watson, S., Moro, A., Reis, V., Baniotopoulos, C., Barth, S., Bartoli, G., Bauer, F., Boelman, E., Bosse, D., Cherubini, A., Croce, A., Fagiano, L., Fontana,M., Gambier, A., Gkoumas, K., Golightly, C., Iribas Latour, M., Jamieson, P., Kaldellis, J., Macdonald, A., Murphy, J., Muskulus, M., Petrini, F., Pigolotti, L., Rasmussen, F., Schild, P., Schmehl, R., Stavridou, N., Tandev, J., Taylor, N., Telsnig, T., and Wiser, R.: Future emerging technologies in the wind power sector: A European perspective, Renew. Sust. Energ. Rev., 113, 109270, https://doi.org/10.1016/j.rser.2019.109270, 2019. a
Wu, Y.-T. and Porté-Agel, F.: Large-eddy simulation of wind-turbine wakes: evaluation of turbine parametrisations, Bound.-Lay. Meteorol., 138, 345–366, 2011. a
Wu, Y.-T. and Porté-Agel, F.: Modeling turbine wakes and power losses within a wind farm using LES: An application to the Horns Rev offshore wind farm, Renew. Energy, 75, 945–955, 2015. a
Yakhot, V., Orszag, S. A., Thangam, S., Gatski, T., and Speziale, C.: Development of turbulence models for shear flows by a double expansion technique, Phys. Fluids A, 4, 1510–1520, 1992. a
- Abstract
- Introduction
- Working principles and specifications of multi-rotor systems with lifting devices
- Methodology
- Results and discussions
- Conclusions and outlooks
- Appendix A: A brief overview of the RANS k–ω SST model
- Appendix B: Sensitivity test of turbulence models
- Appendix C: Grid independence test
- Appendix D: Sensitivity test of inflow turbulence intensity
- Appendix E: Forcing distribution of MRSLs' wings
- Appendix F: Testing MRSLs with different lift magnitudes
- Appendix G: Frandsen wake model
- Appendix H: Control volume analysis of flow energies
- Code and data availability
- Author contributions
- Competing interests
- Disclaimer
- Acknowledgements
- Review statement
- References


