the Creative Commons Attribution 4.0 License.
the Creative Commons Attribution 4.0 License.
 | 24 Apr 2026
New method to characterize aerodynamic flow state around wind turbine blades
Dimitri Voisin
Didier Velayoudon
Mattéo Capaldo
John-Richard Ordonnez-Valera
Rachel Jorand
Mohammed Fajar
This paper presents a novel methodology for characterizing the aerodynamic flow state around wind turbine blades, with the aim of optimizing blade aerodynamics to maximize energy production and extend turbine service life. The study leverages advanced eTellTale (eTT) sensors, deployed on two Vestas V27 wind turbines at the SWIFT facilities (Sandia National Laboratory, Texas), to analyse the relationship between the flow condition on blade suction sides and output power. Results demonstrate that attached flow states increase energy production by 15 % compared to the average energy production, while detached flows result in a 30 % reduction compared to average energy production. The eTT sensor data, correlated with high-frequency meteorological measurements, enables the differentiation of power output curves in attached versus detached aerodynamic regimes. The findings indicate that 15 % of potential power is lost during 33 % of operational time under low and medium wind conditions due to flow detachment. The methodology is further validated through wind tunnel experiments linking eTT signals to lift coefficient and angle of attack, establishing a strong correlation between sensor data and power output. The approach provides actionable insights for future real-time turbine control, with implications for increasing efficiency and meeting global wind energy targets.
- Article
(6250 KB) - Full-text XML
- BibTeX
- EndNote


The recent GWEC report (GWEC, 2025) describes that 2024 saw another record-breaking year for wind energy, with 117 GW of new capacity installed globally. Rather than simply marking a slight increase from the previous year, this report highlights an industry expanding to new territories, the rise of promising wind energy hubs and technological advancements that are meeting the growing demand for reliable clean electricity in an increasingly unpredictable world. Given the right conditions, the wind industry can accelerate its growth, aiming for the 320 GW required to achieve the targets set at COP28.
One approach to boosting the energy output from wind turbines is to increase the size of their rotors – a trend that has gained momentum in recent years, although it brings its own set of challenges (GWEC, 2025). Alternatively, enhancing the efficiency of wind turbines themselves offers another path forward. While it is always true that the Betz limit sets an upper bound on the amount of wind energy that can be converted into electrical power, current wind turbine technologies still fall short of this theoretical maximum. Improving efficiency within these constraints remains an important frontier for innovation in the wind industry.
Additionally, the power coefficient related to the rotor design often does not match the values observed once the wind turbine is in operation (Kumar and Rotea, 2022). Existing models still fall short of accurately reflecting real-world conditions, particularly because turbulence remains a highly complex phenomenon that is difficult to understand and model.
The power produced by the rotor in below-rated wind speed is directly related to the wind power available. The power coefficient is a key factor in this relationship and should be optimized to achieve the highest possible output. In variable speed and variable pitch wind turbines, the power production efficiency depends on two factors: tip speed ratio (TSR) and pitch angle. There is an ideal TSR and an ideal pitch angle that will yield the maximum production efficiency.
In actual practice, when the wind is below the rated speed, operators maintain a constant ideal blade pitch while adjusting the rotor speed to keep the optimal TSR, even when the wind changes. These ideal settings may vary from those suggested by the manufacturer due to local aerodynamic effects and other influences unique to each site. Over time, the best settings can also change because of blade wear, different weather conditions and other factors. To address these challenges, there are existing methods that can be found in the literature like the extremum seeking control (Creaby et al., 2009) and, more recently, the log-power proportional-integral extremum seeking (Kumar and Rotea, 2022). The aim of this study is to experiment with a new approach to optimize the aerodynamics of wind turbine blades so as to maximize production revenues and extend service lifetime. The analysis of the wind turbine power curve was conducted as a function of the flow condition on the suction side of a wind turbine blade.
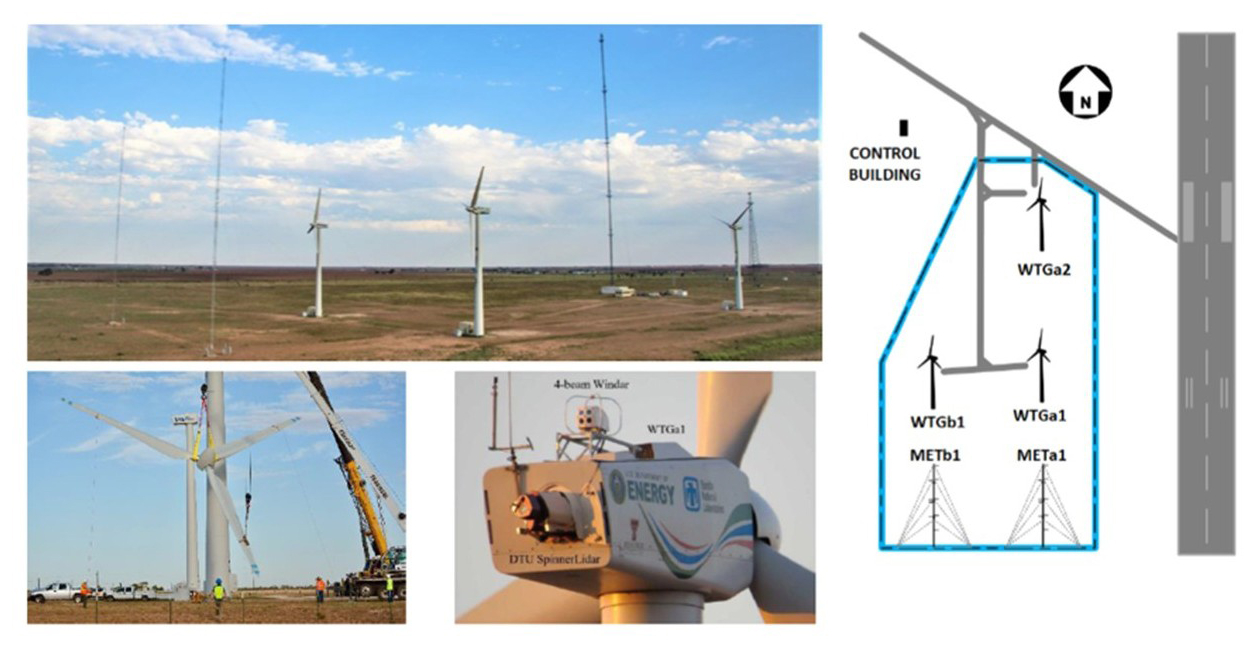
A test campaign was conducted in 2024 at the SWIFT facilities (Sandia National Laboratory-Texas USA) to test the eTellTale's sensor capabilities in real conditions on two wind turbines to analyse the power curve.
1.1 State of the art
Blade response to turbulence shows distinct trends under three scale ranges (Gao et al., 2020). The blade structure responds strongly to the turbulent inflow in the lower and intermediate ranges, while it is primarily dominated by the rotation effect and other high-frequency characteristics of the turbine in higher frequencies.
The small timescales from small turbulent structures generated in a wind turbine wake, for instance (Chamorro et al., 2012), have a strong impact on blade loads (Bartholomay et al., 2018). Anemometers measured at the wind turbine nacelle are not sufficient to characterize the state of the flow on the aerodynamic surfaces (attached/detached, laminar/transitional or turbulent aerodynamic boundary layer), which is critical to optimize production performances.
Another issue is the effect of aerodynamic imbalance due to individual blade pitch angle misalignment, which has a significant impact on the remaining useful life of wind turbines, which is well known (Saathoff et al., 2021). Blade misalignment measurements were carried out using a laser-optical method, showing that 38 % of 195 wind turbines were misaligned. The solution to extend the life of wind turbines is correcting the pitch misalignments.
Aerodynamic imbalance not only diminishes energy production efficiency but also exacerbates structural vibrations, induces rotor speed variations and elevates loads across multiple turbine components, thereby reducing the overall operational lifespan of the turbine (Hyers et al., 2006; Elosegui et al., 2018; Astolfi, 2019). Furthermore, Kusnick et al. (2015) established that even a minor pitch misalignment in a single blade can lead to a significant increase in main shaft loading.
Sensors are a response to mitigate those problematics and become essential for experimental testing, validating design choices and simulation models (Veers et al., 2023). Advanced measurement campaigns have been conducted, but high-quality data is still lacking. There is a need to develop new autonomous measurement systems for large-scale turbines. Advanced real-time measurement systems are required to better capture unsteadiness and the non-linearity of fluid flow around the blades, and monitor aerodynamic loads and structural responses for better performance of wind turbines.
1.2 Panel of existing sensors for the blade
1.2.1 Internal sensors
Strain sensors measure the local strains and can be used to measure the blade root bending moment.
Fibre optic sensors for wind turbine blades are a proven technology for structural health monitoring (SHM) and load measurement, especially because they integrate well with composite blades (fibreglass or carbon fibre). They use optical fibres (often embedded during manufacturing or bonded to the surface) to sense strain, temperature, vibration and sometimes acoustic events.
Inertial sensors for a wind turbine blade are used to measure motion, orientation and vibration to improve control, monitoring and fault detection. They typically fall under inertial measurement units (IMUs), which combine accelerometers, gyroscopes and sometimes magnetometers. These are mounted at the root blade for structural monitoring, or at mid-span or near tip to detect aerodynamic loads and dynamic behaviour.
1.2.2 Inflow sensors
Inflow sensors measure local aerodynamic conditions on a blade section, allowing local loads. Common local sensors include pitot tubes, which achieve good accuracy (Ezzeddine et al., 2019), and require regular maintenance and calibration (prone to vibration, contamination and weather effects); and surface pressure sensors (expensive, fragile and clog prone). Remote inflow sensors (e.g. lidar) and nacelle-mounted sensors (e.g. spinner anemometers) are alternatives.
Blades as the sensors of the flow for measuring blade loads (Coquelet et al., 2024) is also a solution. This estimation of the incoming wind conditions based on the blade bending moments can be used as an estimator to activate the control strategy on the turbine.
Digital tuft flow visualization with a high-definition camera has been tested to understand the resulting three-dimensional and transient aerodynamic effects on a 10 m diameter two-blade 25 kW wind turbine (Swytink-Binnema et al., 2016). Digital tuft flow visualization allows one to know the fraction of tufts (number of stall acrylic yarn tufts vs number of tufts on the outer suction side of the blade) exhibiting detached flow (stall). The independently measured instantaneous turbine output power production correlates highly with the stall fraction. Digital tuft allows one to follow dynamic stall and stall hysteresis on the azimuthal variation potentially caused by vertical wind shear. Hence, the trailing of the tufts is very useful from an aerodynamic point of view, but industrial implementation is complicated.
The eTellTale (eTT) sensor to detect flow separation based on strain gauge technologies has shown ability in wind tunnels to detect flow separation (Soulier et al., 2022). However, the sensor is mechanically fragile, which causes measurements to drift over time, meaning that it cannot provide absolute measurements. Furthermore, it drifts with temperature.
In this study, we use a set of aerodynamic eTT sensors providing mean and standard deviation raw data to characterize the state of the flow, whether it is attached or detached.
The goal of the study is also to test an algorithm to obtain an estimation of angle of attack (AoA) and loads on wind turbine blades. The algorithm integrates applied mathematical techniques to transform sensor raw data in terms of aerodynamical physical properties. These applied mathematical methods need to be trained in a wind tunnel.
2.1 eTT sensor description
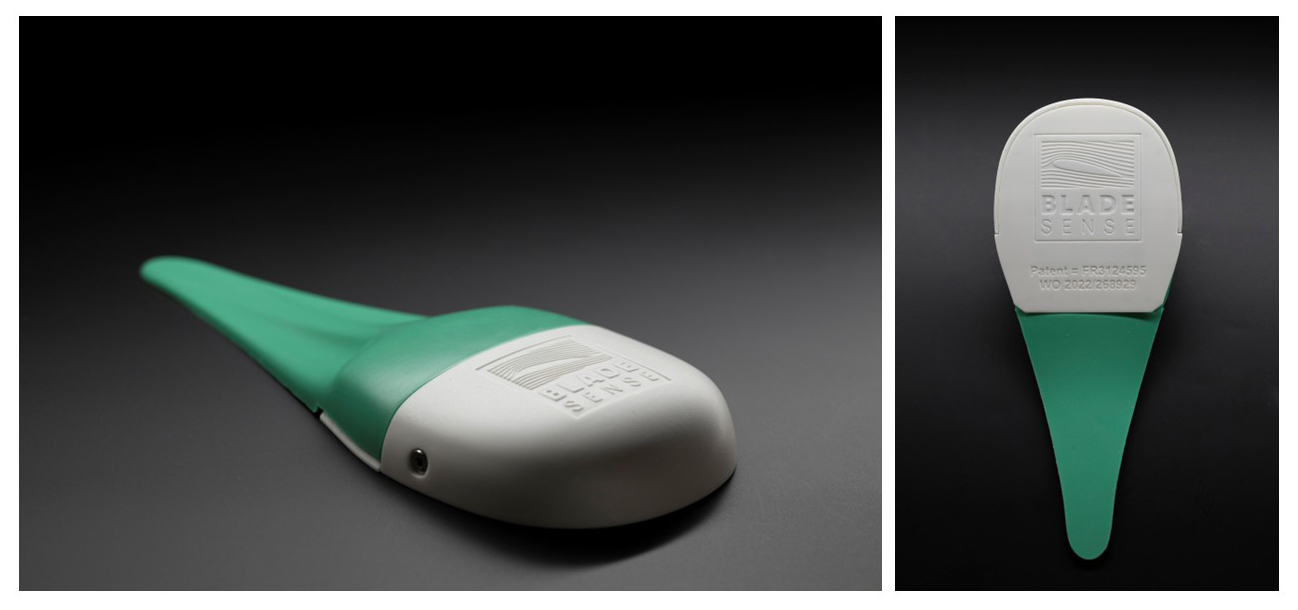
eTellTale's sensor is a wireless aerodynamic stall sensor based on hall effect (Fig. 1), each composed of a silicone strip. It is glued on the blade's suction side to qualify the inflow behaviour on the blade (detached or attached) in real time at 200 Hz, with a filtering standard deviation of magnetic field Bz (10−3 Tesla).
The signal was then recorded with the same acquisition frequency as for the pressure measurements in the wind tunnel.
2.2 eTT calibration in wind tunnel at full scale
The experiments were conducted in the 5 m × 6 m high-speed wind tunnel at CSTB Nantes (see Fig. 2 and Neunaber et al., 2022, for further details). Its turbulent intensity level is less than 3 %. The airfoil profile has been scanned on a real wind turbine blade (Senvion 2 MW) at 80 % from the blade root.
The overall aerodynamic forces on the airfoil profile were measured with two rows of pressure taps.
The experimentation allows the research to set thresholds for the standard deviation for eTT to detect detached and attached flow behaviour.
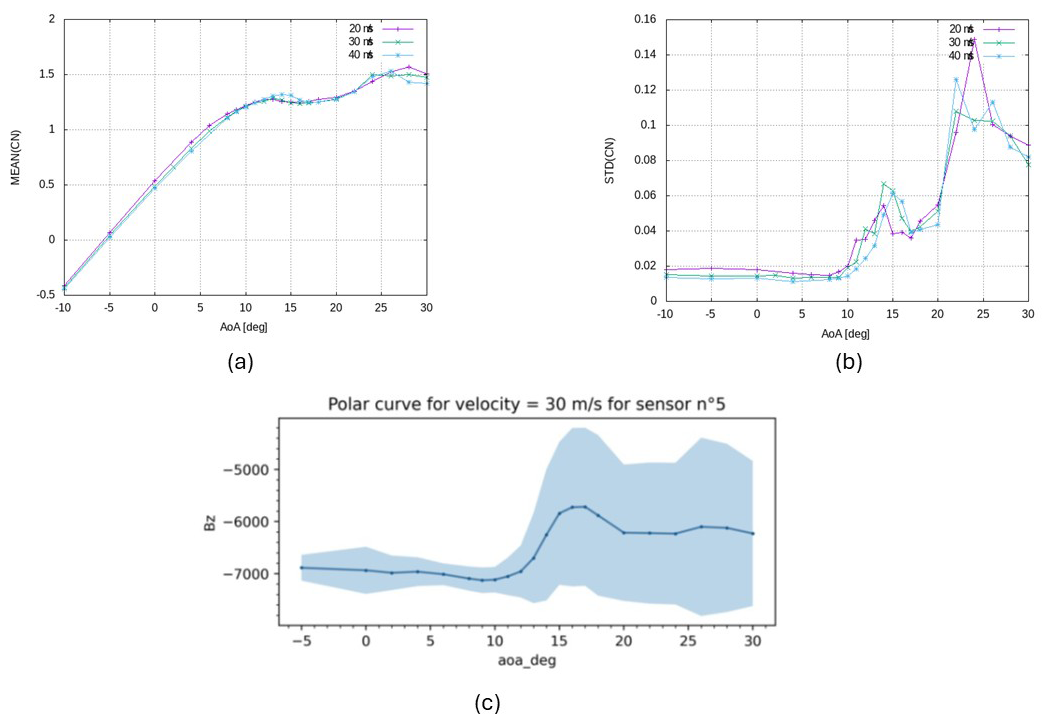
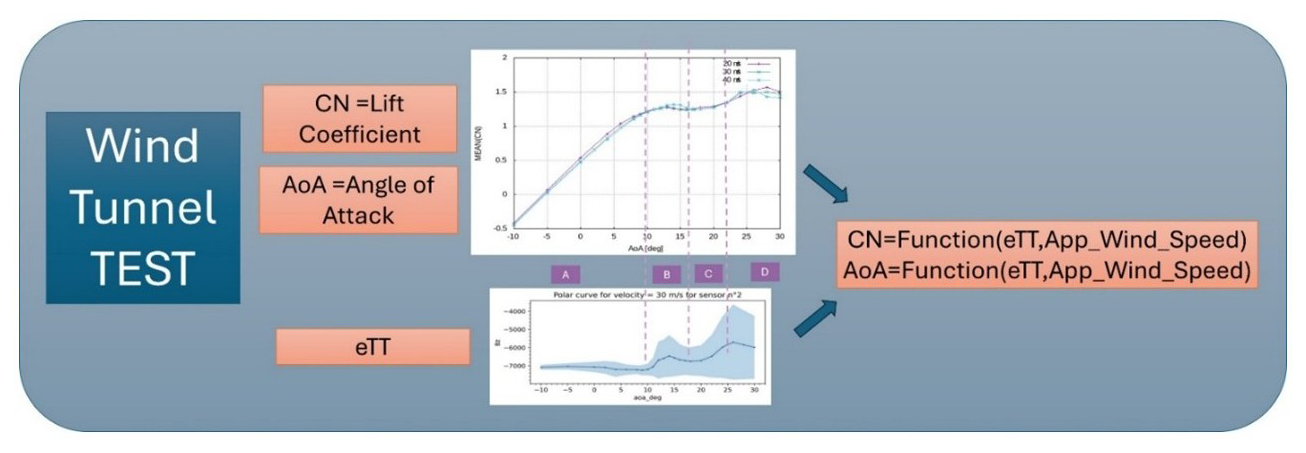
Finally, wind tunnel experimentation is conducted using a machine learning method to link eTT values to AoA and lift force. The training was carried out on four eTT sensors at 15 % chord.
-
The reduced model is conducted for −5° < AoA < 22° and a wind speed of 20 to 40 m s−1.
-
The large model is conducted for −5° < AoA < 30° and a wind speed of 20 to 40 m s−1.
Outside this range of AoA and wind speed, a linearization is applied.
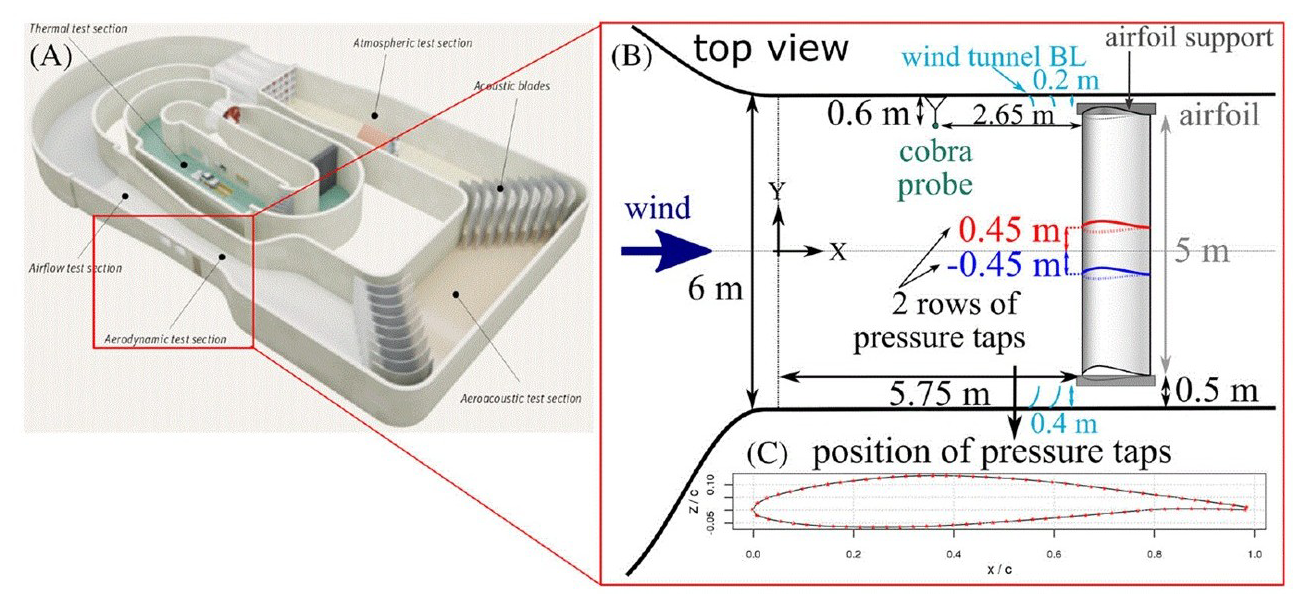
Figure 2Wind tunnel set up (Neunaber et al., 2022).
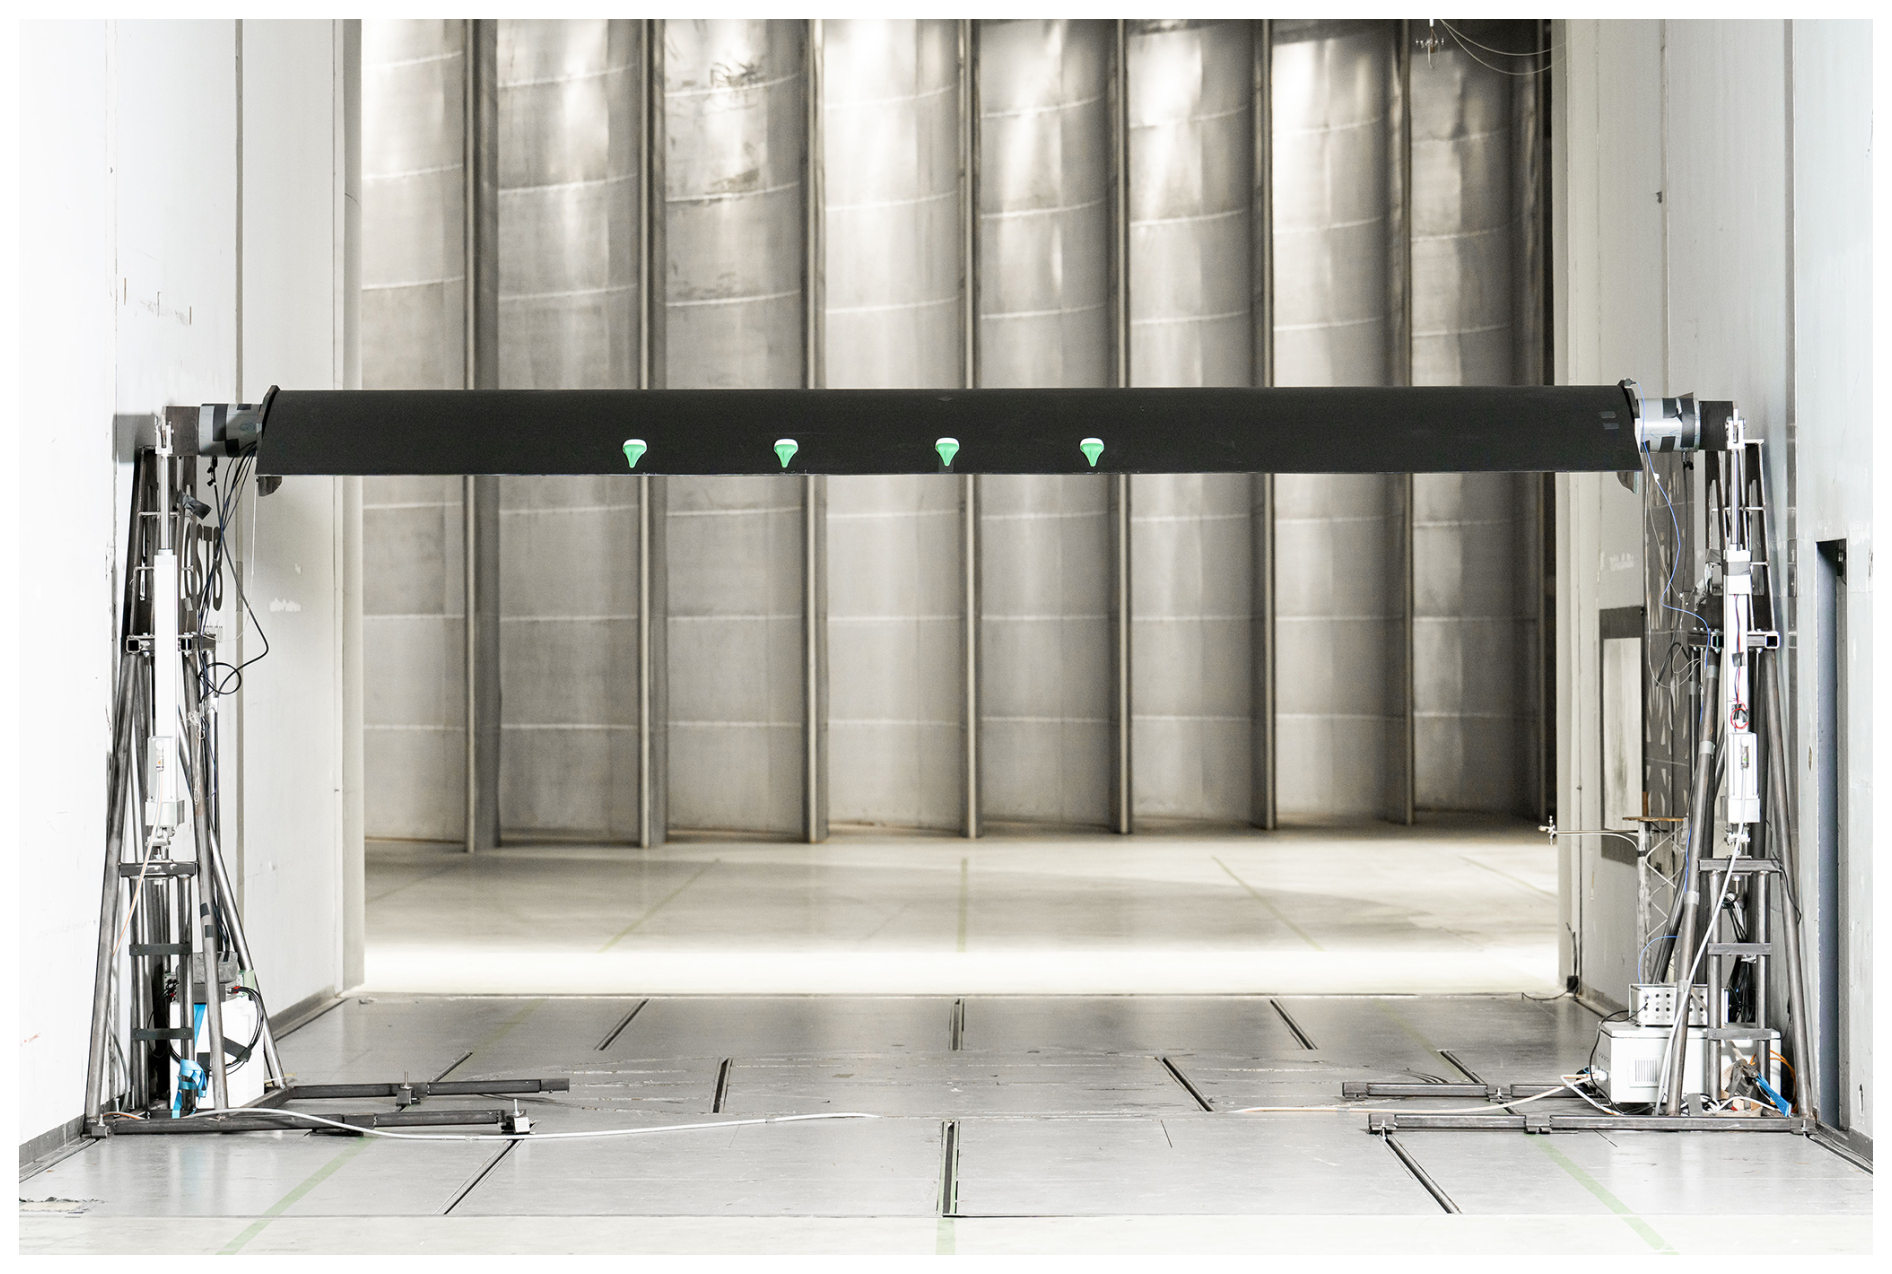
Figure 4a, b show mean and standard deviation (STD) lift versus AoA, while Fig. 4c shows the eTT signal with its standard deviation in the filled area.
The variations in the magnetic field are directly related to the movements of the eTT silicon tell and therefore to its sensitivity to disturbances in the flow.
The statistical processing of each component of the magnetic flux density vector yields the standard deviation obtained for each experiment. A filter according to the z component (normal to the wall) is used to obtain the polar curves in Fig. 4c.
A learning process is then used to link lift and AoA to the magnetic flux density vector on the z axis and to wind speed in Fig. 5.
2.3 Description of the field tests
The experimentation has been conducted at the SWIFT infrastructure of the Sandia National Laboratory (SNL, Texas) facilities on two wind turbine generators (Vestas V27), called A1 and A2.
To correct the power curve, meteorological parameters (Cup31 BP27m Temp27m RH27m) have been measured from a meteorological tower METa1.
2.3.1 Power correction according to weather conditions
The output generated power (GenPwr) has been corrected with the weight of the air. The corrected generated power (GenPwr_Cor) is necessary to enable a comparison with the theoretical power curve of Vestas and to make possible a comparison in the time.
with
-
BP27m: barometric pressure at 27 m tower height (Pascal),
-
RH27m: relative humidity at 27 m tower height (%),
-
Temp27m: air temperature at 27 m tower height (°C),
-
Rs: dry air constant 287.06 J kg−1 K−1.
with
-
GenPwr: generator power measured by variable frequency drive (full power converter) (KW),
-
ρ: air density (kg m−3).
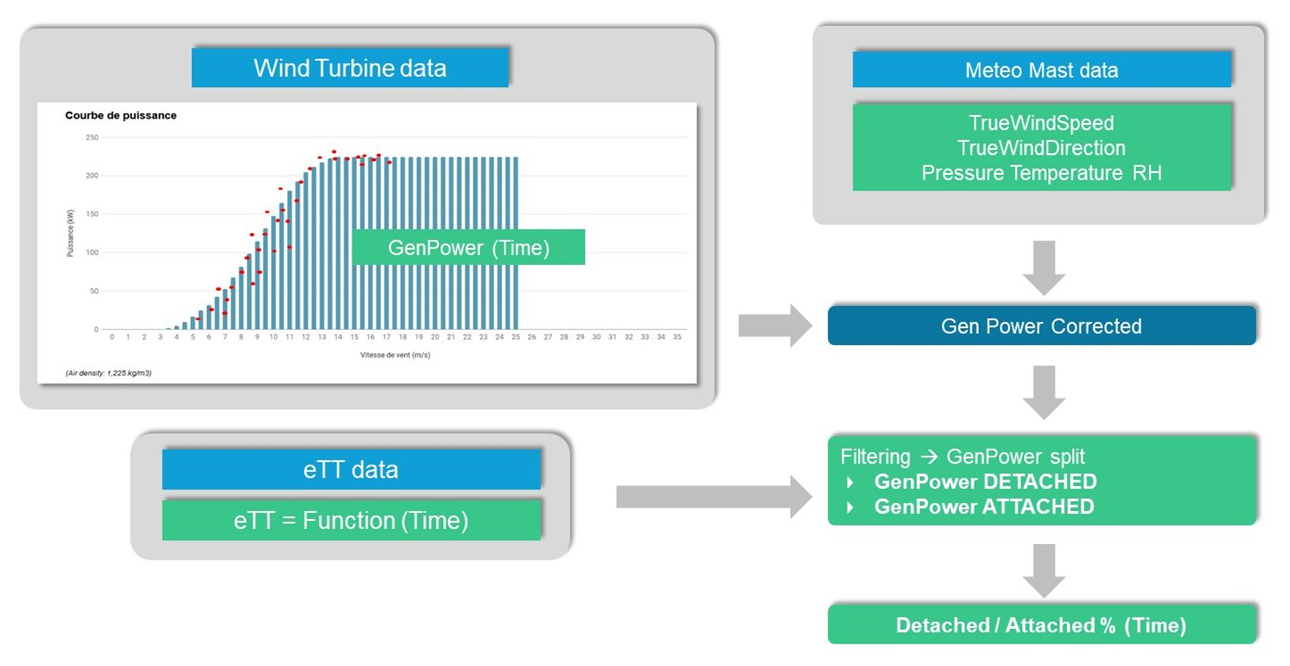
2.3.2 Power curve corrected and split method
The SWIFT facilities gives the opportunity to have access to high-frequency meteo mast data (time-averaging on 0.1 s for true wind speed, true wind direction, pressure, temperature and relative humidity). The correction of generated power is possible to obtain a GenPower_cor corrected on each wind turbine. The correction is necessary to compare with the V27 theoretical power curve provided by Vestas.
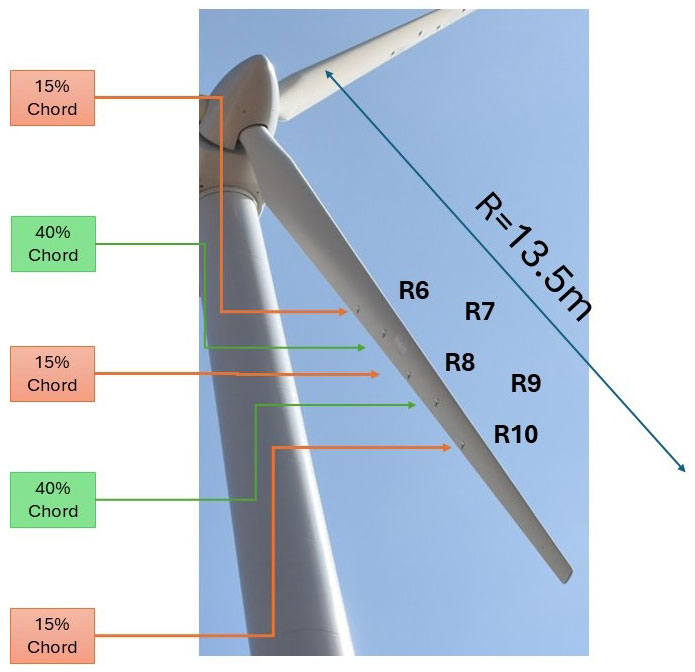
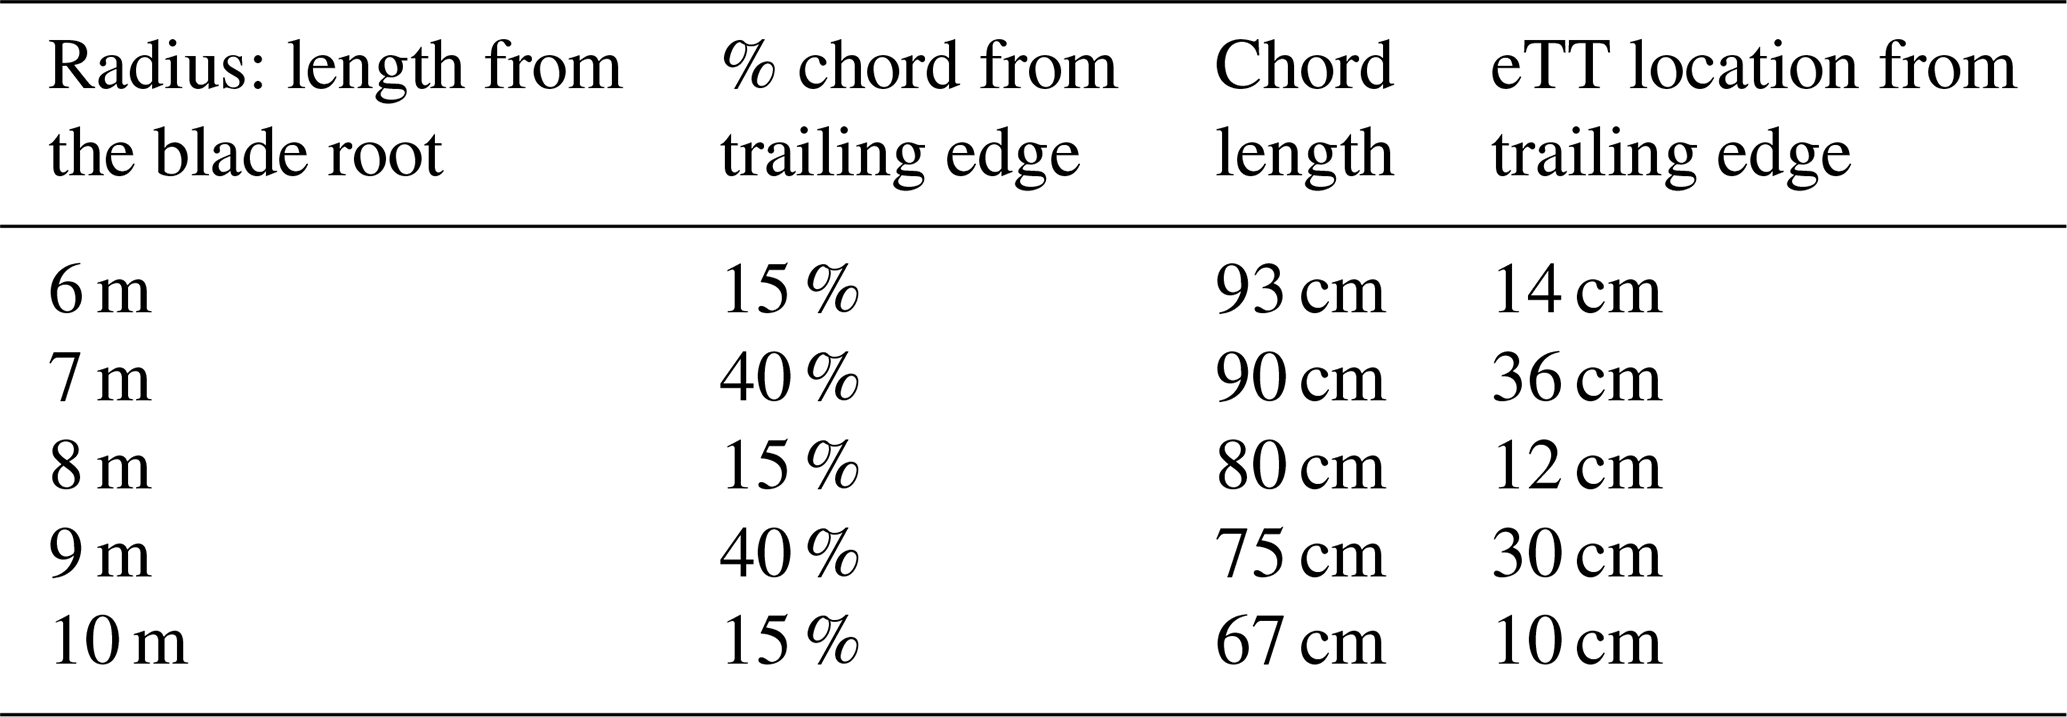
At the same time, the eTT sensors provide raw data on five positions on the blade's suction side (Fig. 7 and Table 1) in such a way that it is possible to differentiate the corrected GenPower curve in detached and attached behaviours.
Power loss criteria is defined to get the difference between detached and attached in terms of time % and identifies the potential increase in production (Fig. 8).
3.1 Pitch distribution for A1 and A2
During August, September and October 2024, and January 2025, about 20 d of experimentation on wind turbines A1 and A2 have been conducted. In summary, this was 1545 h on A1 and 610 h on A2.
Different offsets of pitch angle have been tested for wind turbines A1 and A2 (Fig. 9):
-
A1 pitch offset of −3, −2, −1, 0, +1, +2, +3, +4, +5°
-
A2 pitch offset of 0 and +1°.
A pitch angle of 1° is the reference value for these two wind turbines, corresponding to the 0° reference value to reach the optimum TSR in the standard control algorithm of the wind turbine.
3.2 Power curve measure analysis for A1 and A2
The power curve is plotted in Figs. 10, 11, 12 and 13 for the A1 and A2 wind turbines at +1° of pitch angle (reference value for optimum TSR). The power curve is plotted in Fig. 14 for A1 at −3°, A1 at +1° and A2 at +1°.
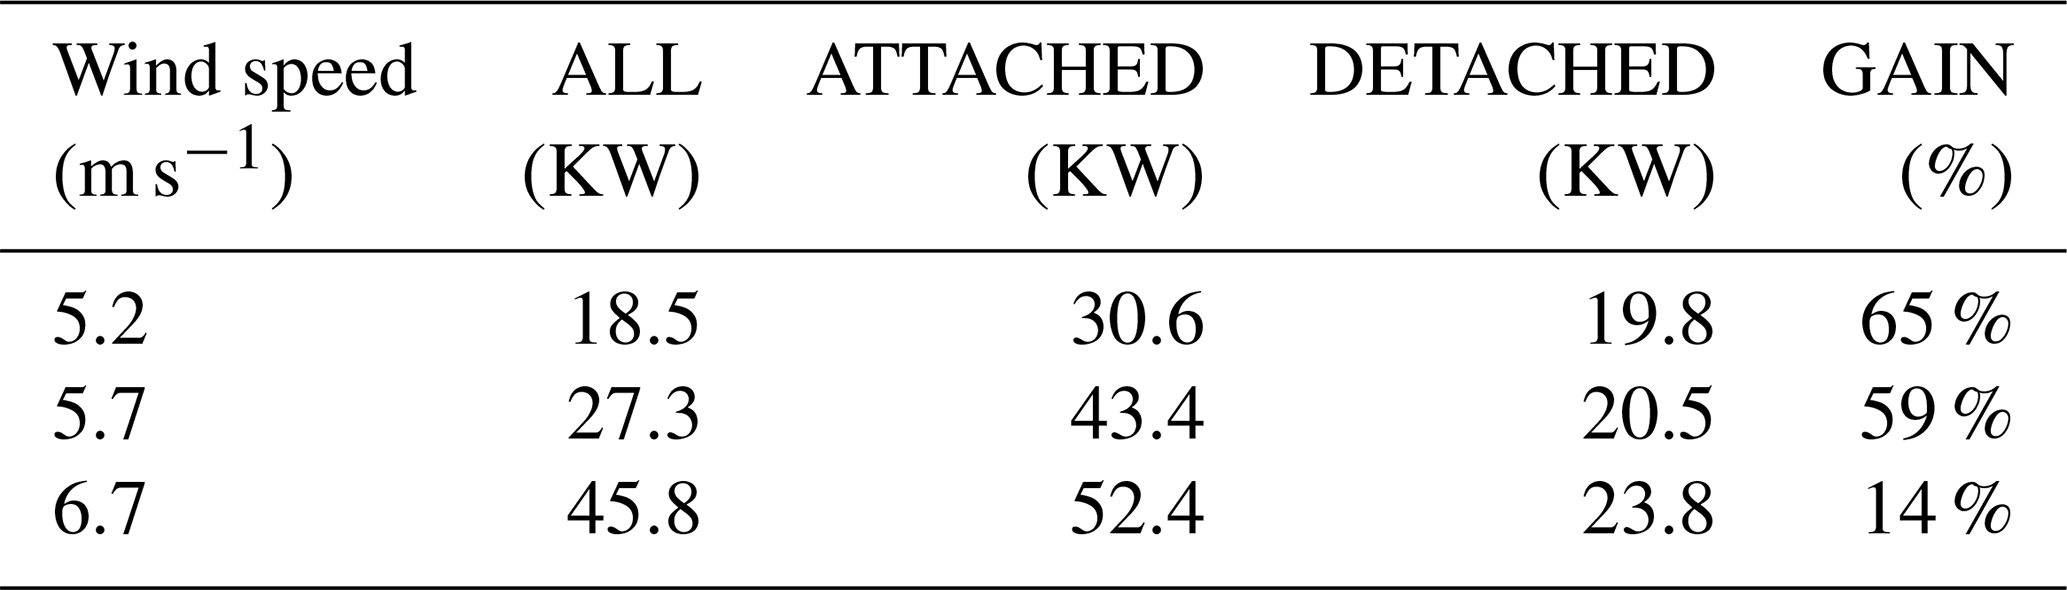
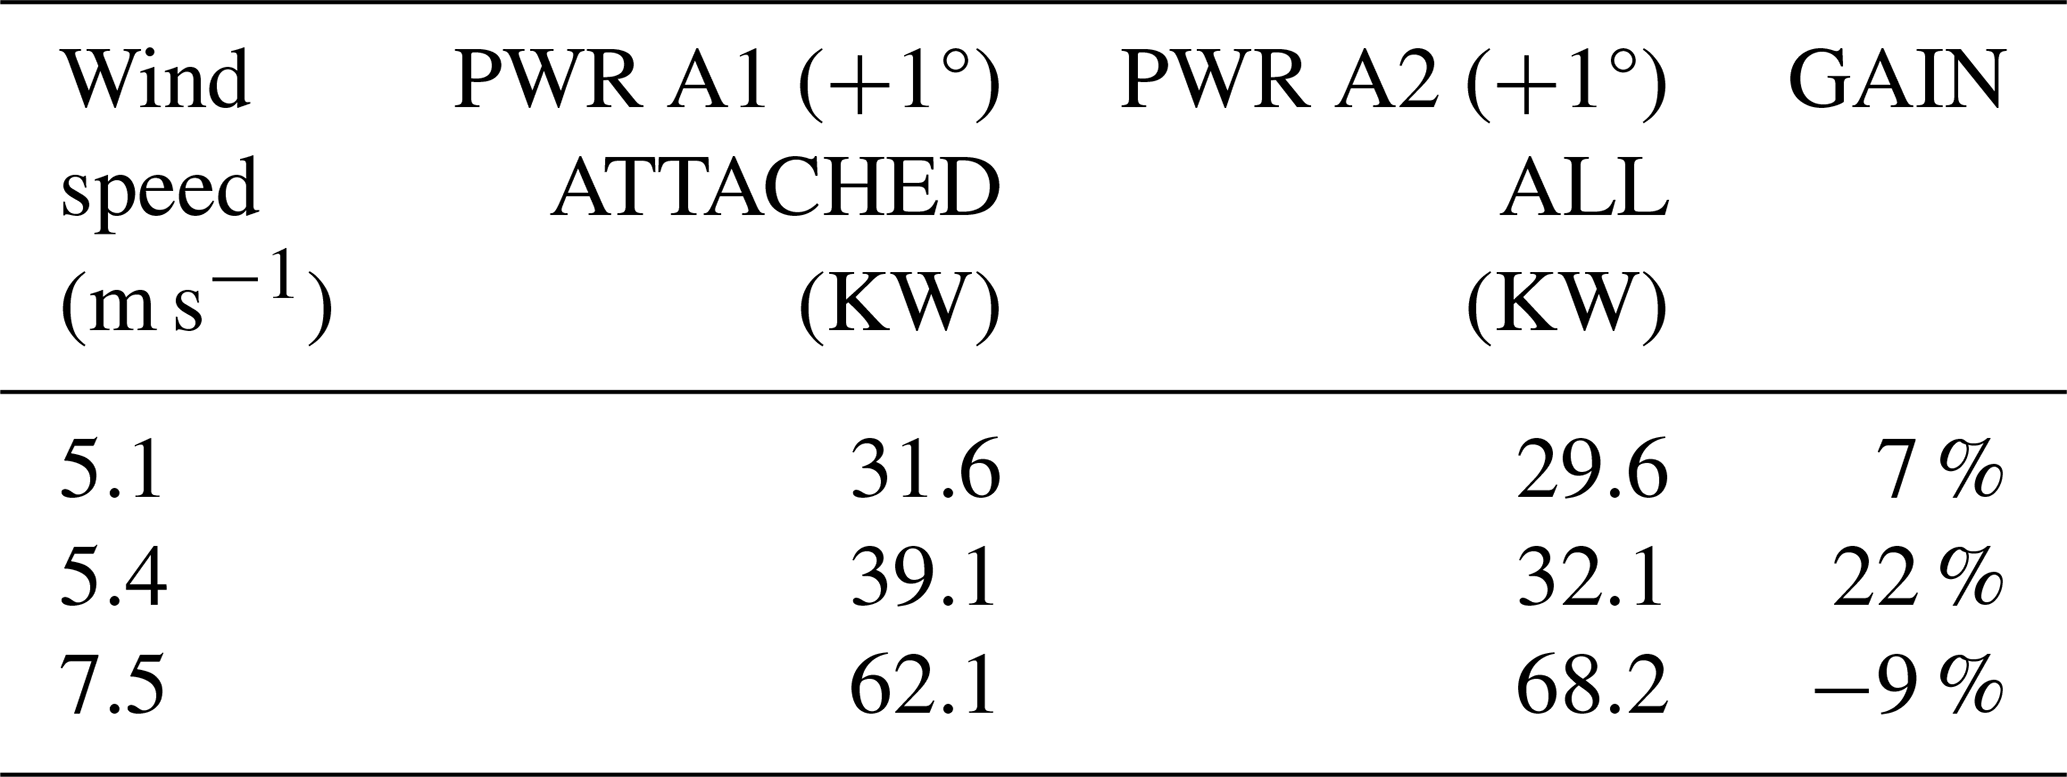
For A1 in the range 4.5–7.5 m s−1, it is observed that when the flow is attached at eTT R9, the power is much higher than for the measured power curve (Fig. 10 and Table 2). There is then a great potential (around 59 %) increase power for A1 at +1° of pitch if the flow is attached at R9. From wind speed v=7.5 m s−1, the measured power curve converges with the attached values, and there is no potential increase. This corresponds to a chaotic behaviour of R9 that we call “hard stall”.
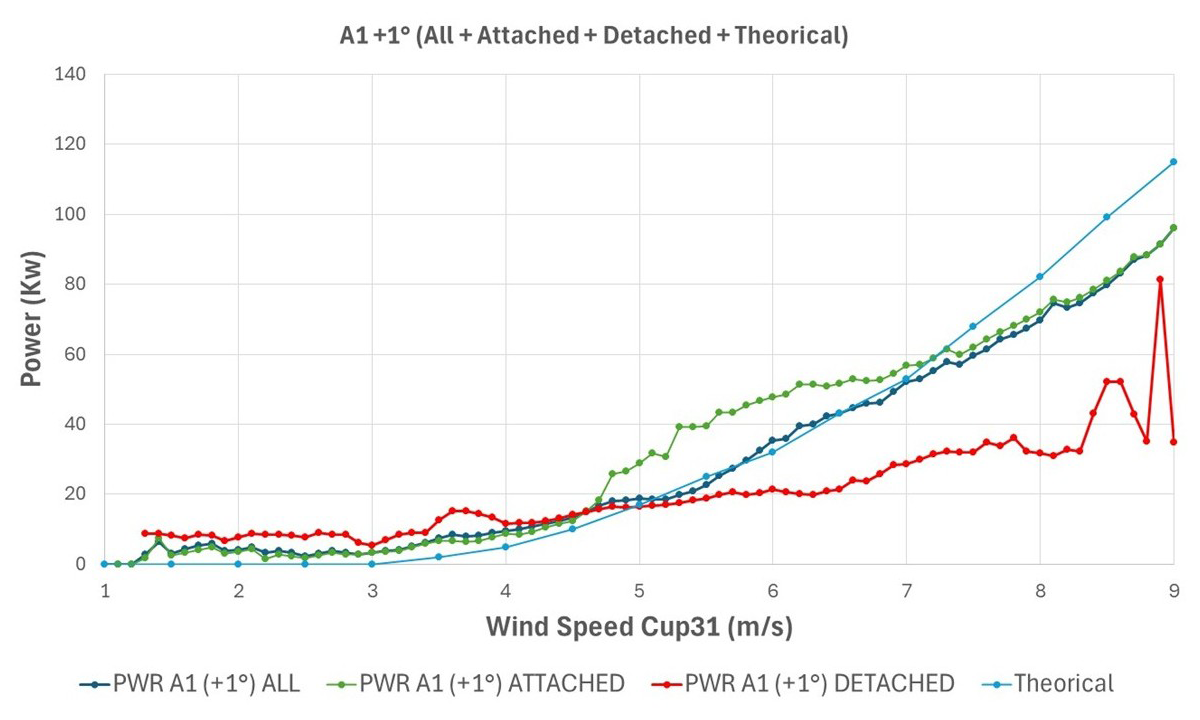
Table 2A1 (pitch +1°) power curve filtering according to the attached/detached criteria.
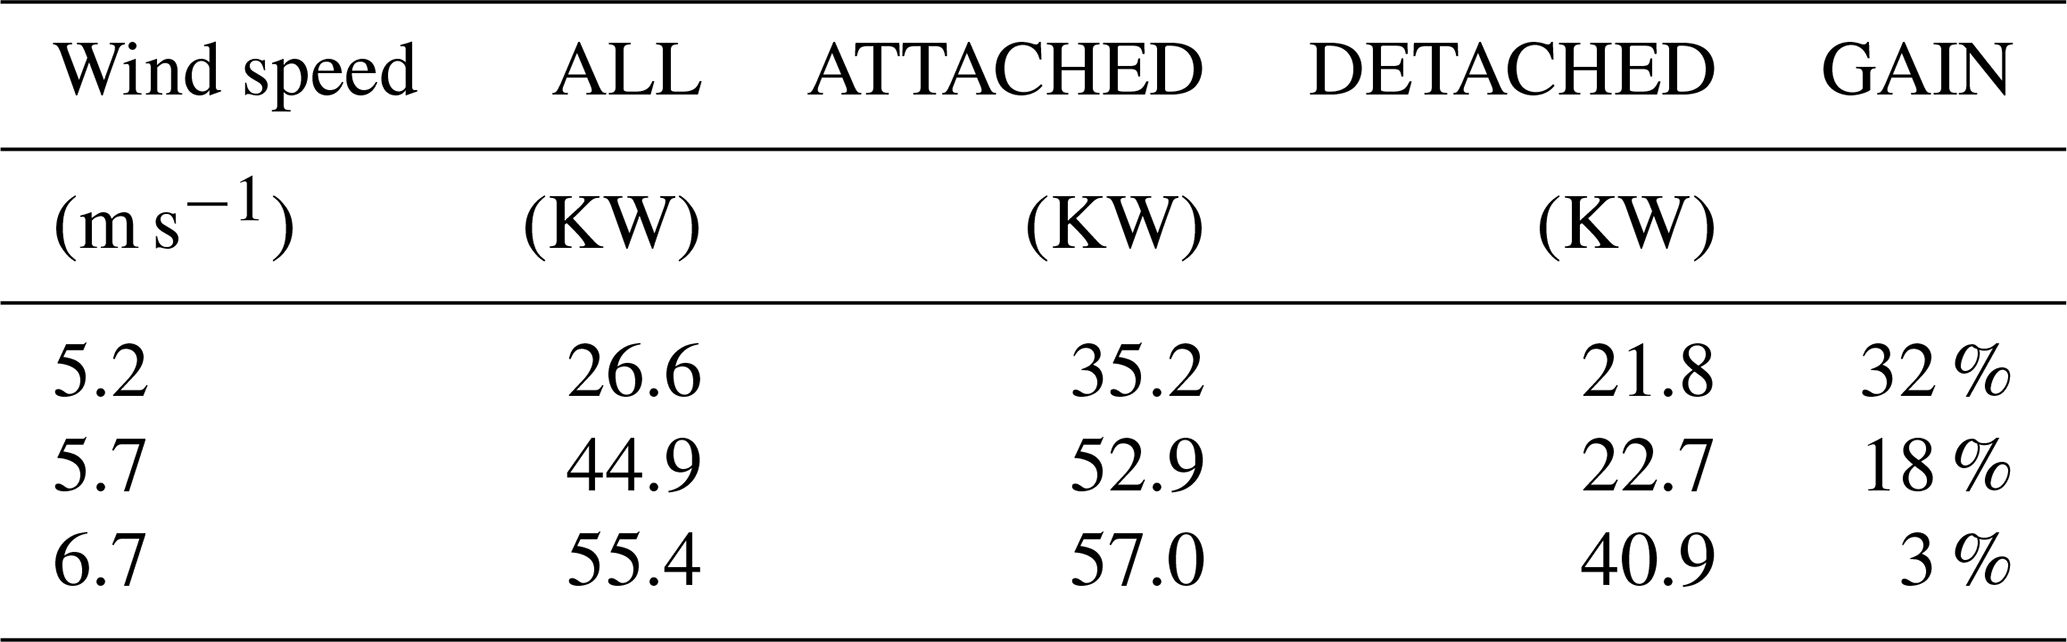
The same applies for A2 where there is also great potential for increasing power (Fig. 11 and Table 3) up to wind speed v=7.5 m s−1. From wind speed v=7.5 m s−1, the measured power curve converges with the attached values, and there is no potential increase, unlike A1. The same chaotic behaviour of R9 (“hard stall”) is observed.
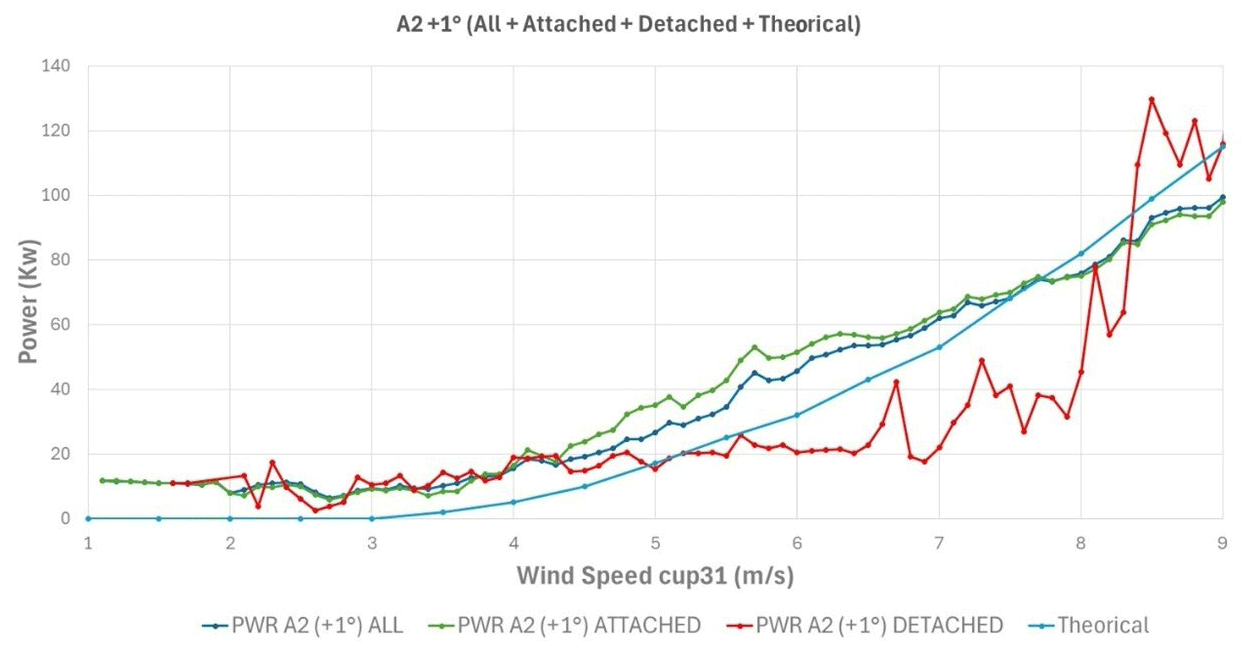
Table 3A2 (pitch +1°) power curve filtering according to the attached/detached criteria.
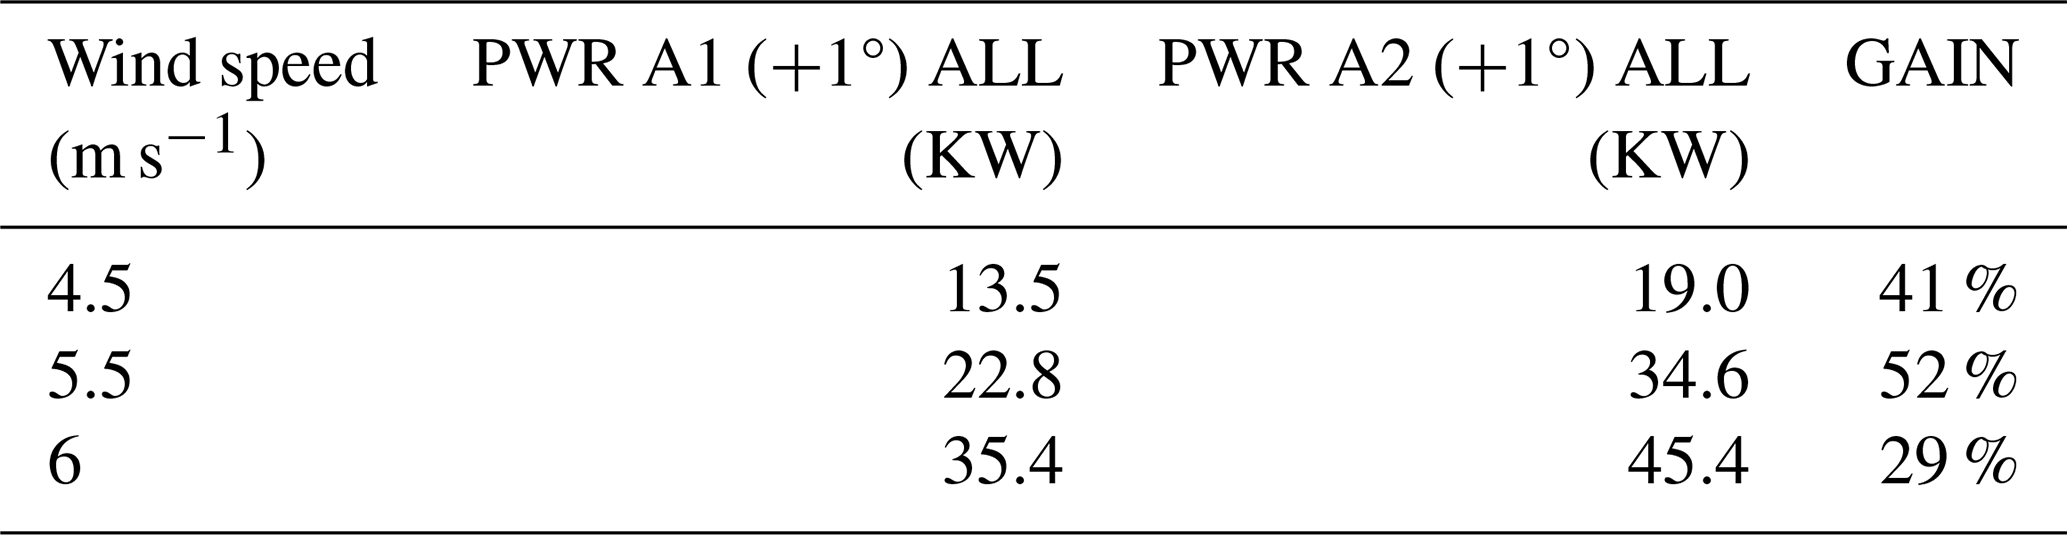
Nevertheless, the potential increase is much higher for A1 than for A2. A2 seems to have better performance than A1. This is confirmed by comparing the A1 and A2 power curves, where A2 produces more than A1 (Fig. 12 and Table 4) for wind speed greater than 4.5 m s−1.
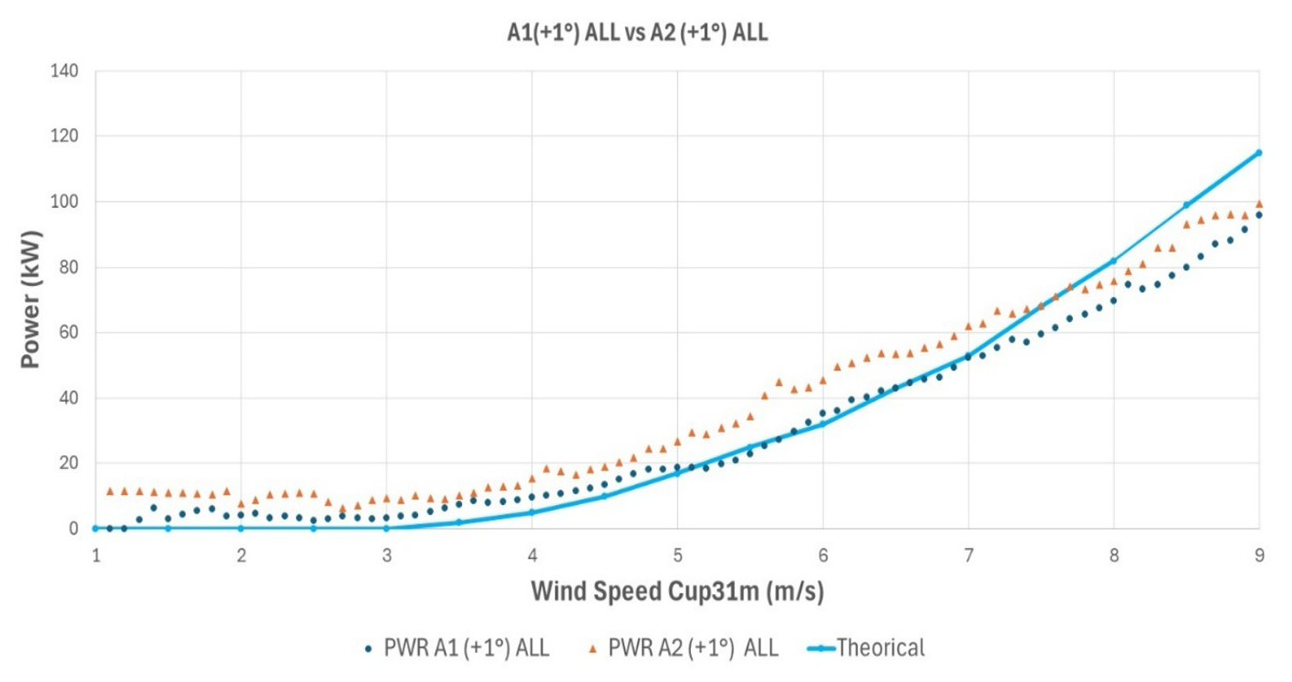
Figure 12A1 (pitch +1°) and A2 (pitch +1°) power curve filtering according to the attached/detached criteria.
Table 4A1 (pitch +1°) and A2 (pitch +1°) power curve filtering according to the attached/detached criteria.
And when A1 is optimized with R9 attached on A1, it produces as much as A2 (Fig. 13 and Table 5). This confirms that A1 production is not as optimized as A2.
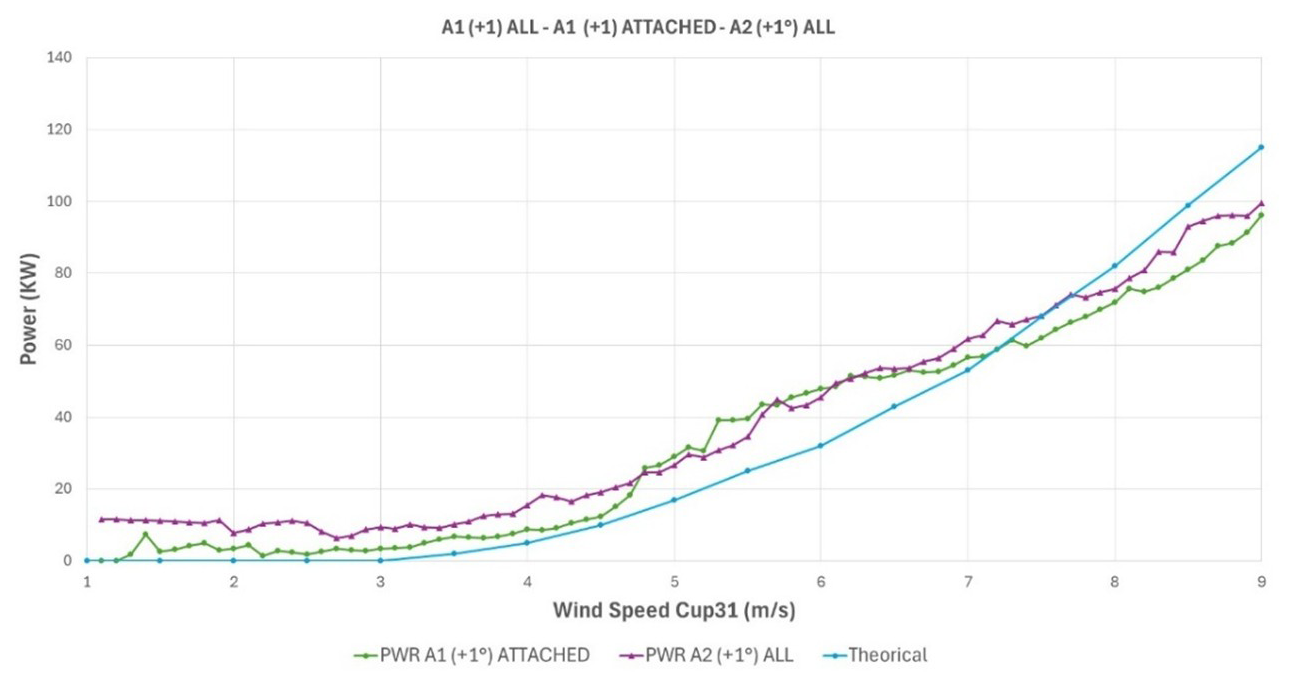
Figure 13A1 (pitch +1°) and A2 (pitch +1°) power curve filtering according to the attached/detached criteria.
Table 5A1 (pitch +1°) and A2 (pitch +1°) power curve filtering according to the attached/detached criteria.
This confirms that a pitch control strategy searching for attached R9 just before hard stall behaviour will produce the maximum power as seen in the range 4.7–7.5 m s−1. The wind speed of 7.5 m s−1 seems to be the value of the Vestas V27 wind turbine. After 7.5 m s−1, R9 is established in hard stall and there is no more power to gain for this set point where the pitch is fixed to 1°.
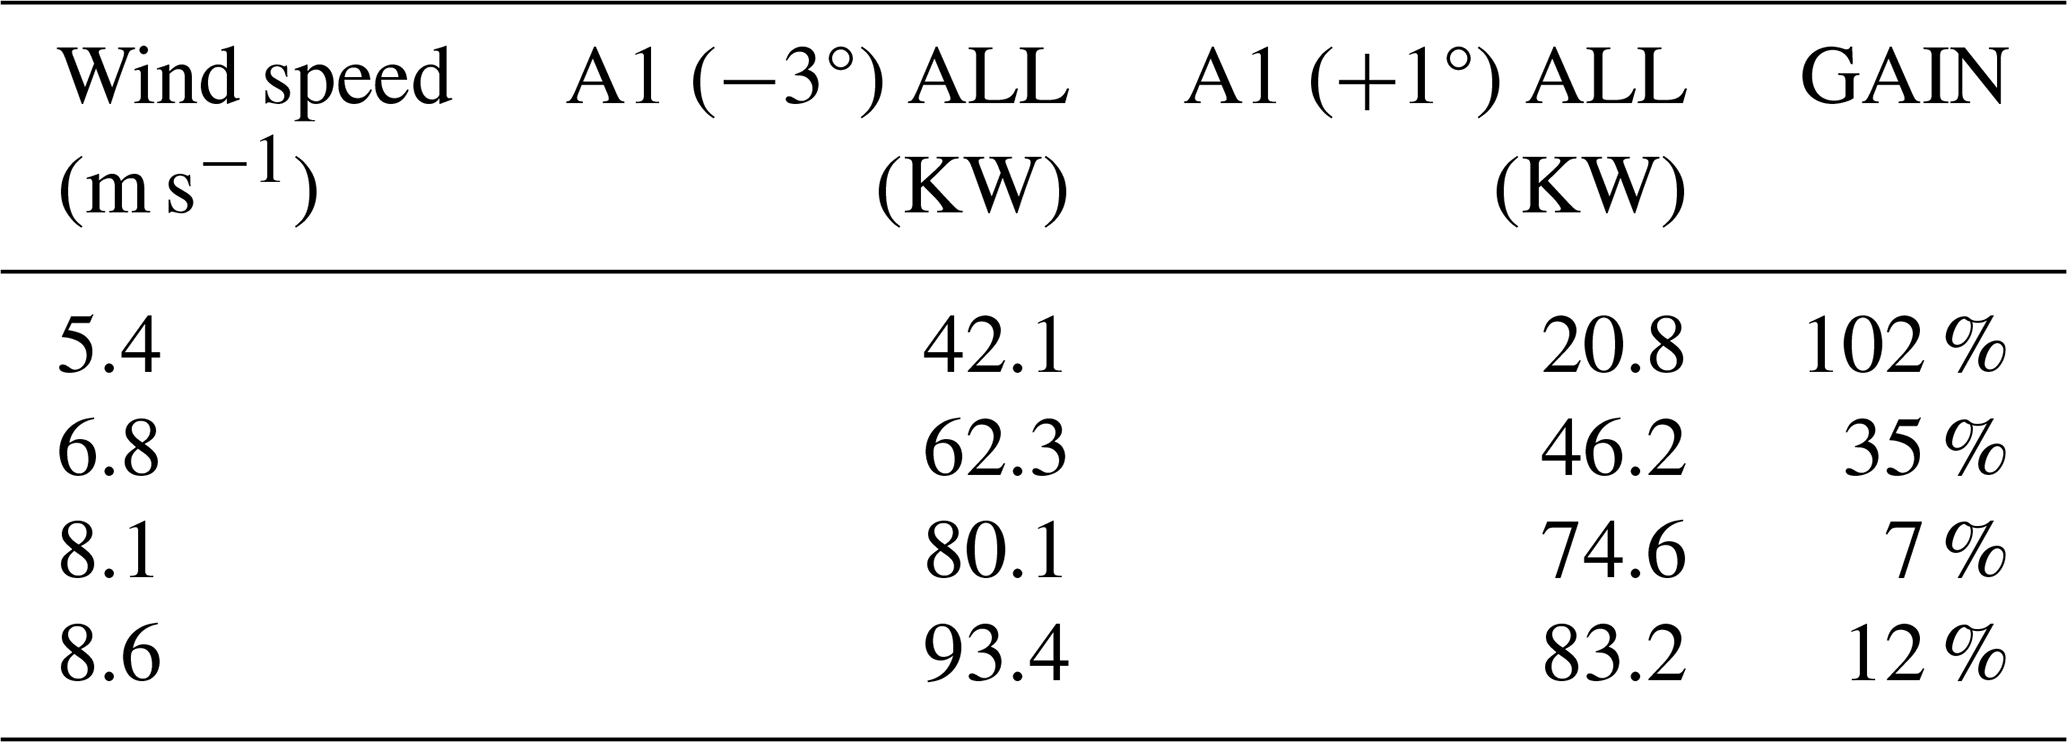
As soon as the turbine performances are set for a fixed pitch angle (+1°), we have tested different pitch angles for A1 from −3 to +5° to find a potential increase in production. For a pitch value for A1 set at −3°, results show the highest production performance, better than A1 set at +1°. A pitch angle of −3° proves to provide a better Cp than 1° of pitch angle. A1 pitched at −3° produces also more than A2 at +1° (Fig. 14 and Table 6).
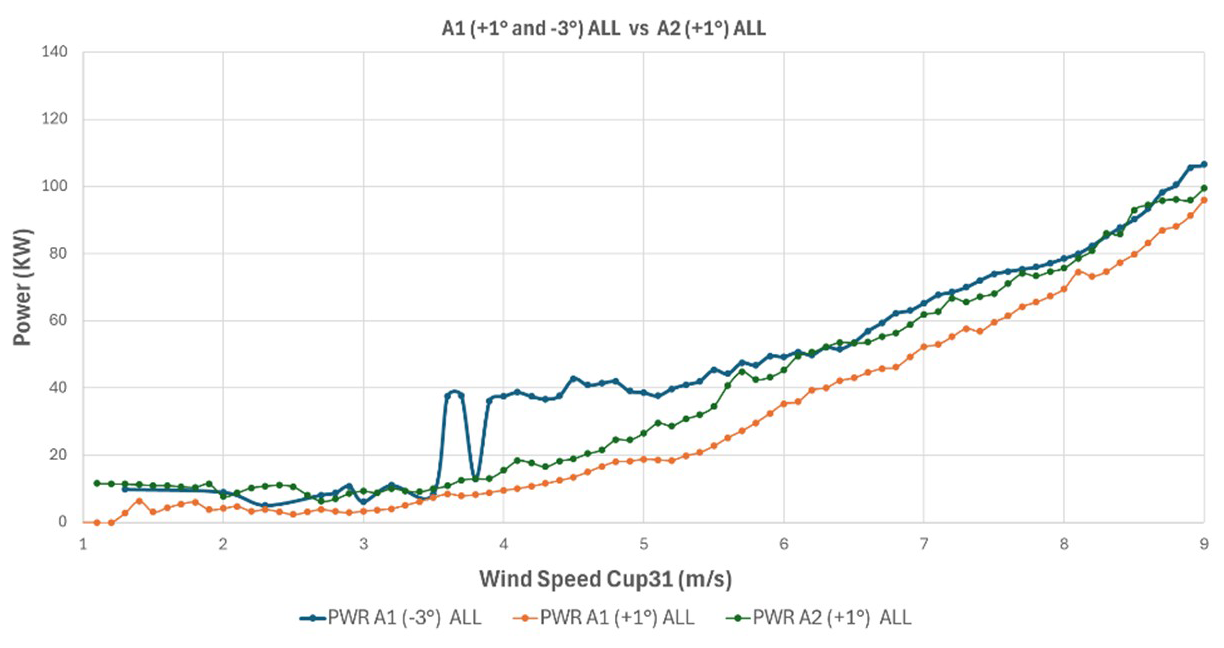
Figure 14A1 (pitch +1 and −3°) and A2 (pitch +1°) power curve filtering according to the attached/detached criteria.
Table 6A1 (pitch +1 and −3°) and A2 (pitch +1°) power curve filtering according to the attached/detached criteria.
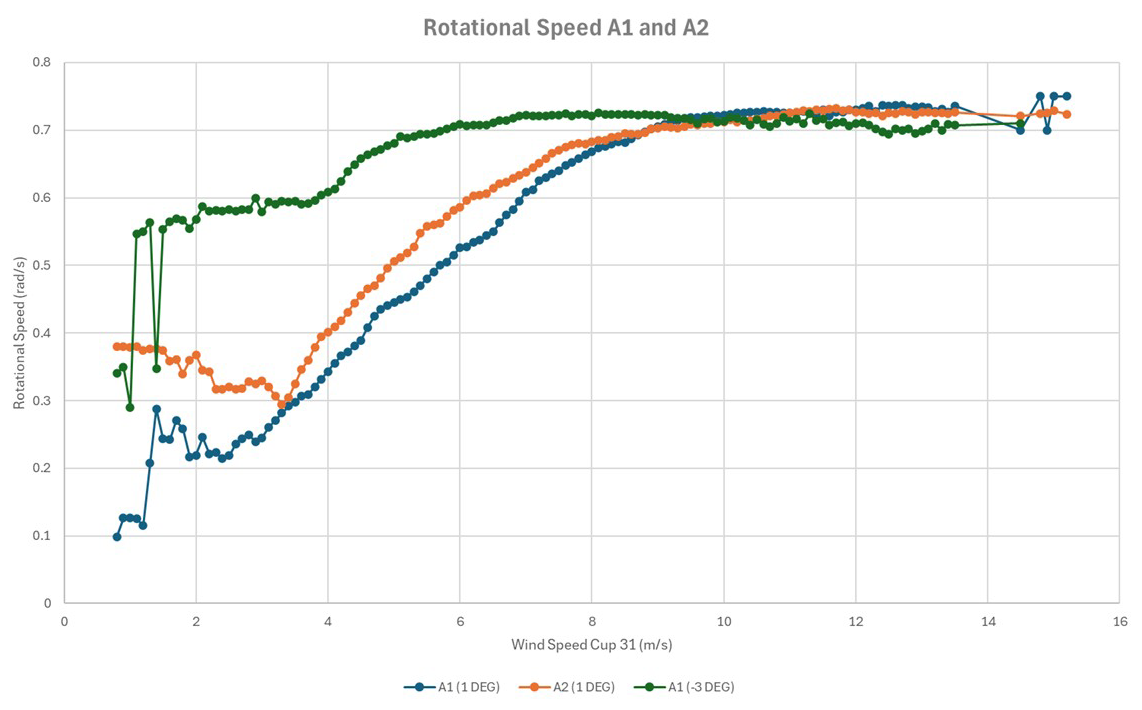
Looking at the rotational speed (Fig. 15), we can see that A2 at 1° is faster than A1 at 1°. And A1 at −3° is much faster than A1 and A2, and it reaches constant rotational speed (rated speed) sooner at 6 m s−1 than A1 and A2 at 1°, reaching rated speed at 10 m s−1. This confirms the better performance of A1 pitched at −3° than the manufacturer's set point of 1° of pitch. The rated rotational speed is 0.7 r s−1, which corresponds to the 43 rpm.
3.3 Literature review of the Vestas V27 power curve and power coefficient (Cp) curves
To optimize the energy extracted from the wind, the rotor should ideally be operated at a TSR of 8, with a pitch angle of −4° (Varpe, 2008). Operation at this TSR and pitch will result in the highest Cp ().
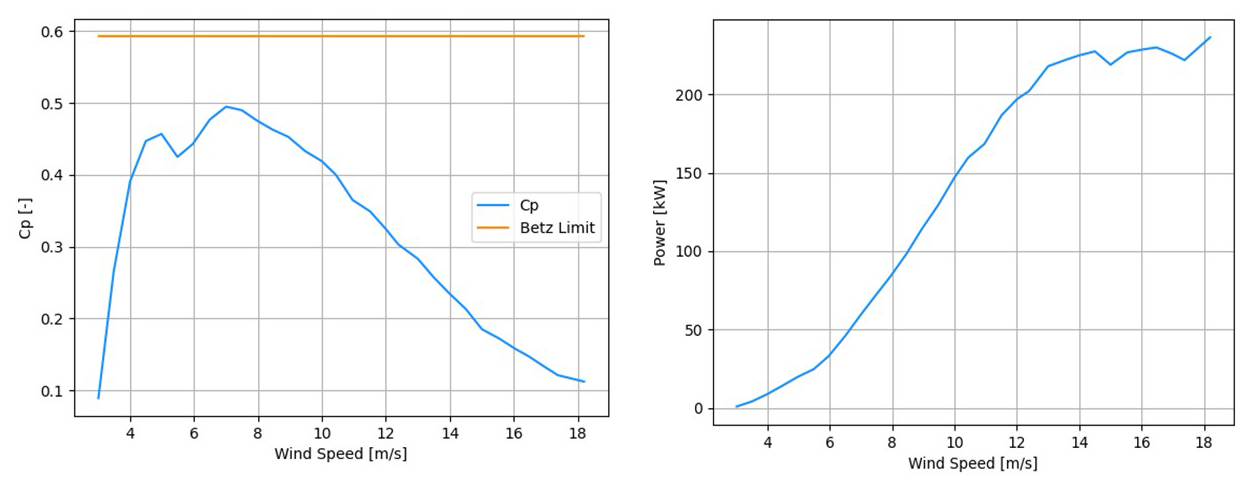
Figure 16Vestas V27 characteristics (extracted from the NREL wind turbine model power curve archive).
According to the Vestas V27 characteristics extracted from the NREL wind turbine models power curves archive (Fig. 16), the maximum Cp () is obtained for a wind speed of v=7.5 m s−1, while the rated power (maximum power) is obtained for a wind speed of v=11 m s−1.
Therefore, the Vestas V27 control algorithm will vary the rotating speed with a constant pitch value of 0° to keep the optimum lambda up to wind speed v=11 m s−1, while the is attained for v=7.5 m s−1. These results confirm the experimental result that there is no more power to grab after v=7.5 m s−1 for a pitch value of 0° (1° for SNL experimentation).
The Vestas V27 should keep constant rotational speed from v=14 m s−1, which is the rated set point. Experimental values show a constant rotating speed for A1 and A2 from 11 m s−1 (Fig. 15).
Moreover, we see that the is reached for v=7.5 m s−1. Cp is not maximum before and after this value. The rated power does not correspond to the maximum power from which rotational speed is kept constant.
Therefore, as soon as is attained for v=7.5 m s−1, there is potential increase in Cp before and after v=7.5 m s−1. And according to Varpe (2008), to improve the Vestas V27 control algorithm, the optimum pitch angle for the TSR = 8 is theta = −4°. These results are confirmed by the experimentation results, where we found the major potential increase (before 11 m s−1) with a pitch angle of −3° and a reference at 1° corresponding to the −4° with reference at 0°.
3.4 Discussion on eTT R6 and R9 for A1 and A2
Figure 17 is a representation of the power curve with a colour mapping of the eTT standard deviation (STD Bz) to detect detached and attached behaviour of the flow (GenPwr_cor function to wind speed (Cup31m) with a yaw misalignment filter of −20 to 20° and blade pitch filter of 0.9 to 1.1°).
We can note that
-
A1R9 predominantly is detached between 4 and 6.5 m s−1, while A2R9 is attached in all the wind speed ranges,
-
A2R6 is detached from 5 m s−1, while A1R6 is detached from 7 m s−1.
Therefore, it confirms that A1 is not optimized although R9 is predominantly stalling. A control strategy looking for R9 attached should provide better production performance as we can see for A2.
A2 at +1° and A1 at −3° seem to have their full potential of production when R6 is stalled while R9 is attached.
Therefore, the control strategy should consider R6 stall and R9 attached behaviour, and avoid R9 chaotic behaviour (hard stall) to maximize production.
Therefore, a strategy setting a minimum and a maximum standard deviation for eTT at 15 % chord (R6) and eTT at 45 % chord (R9) will provide the right measures to detect the optimum angle to maximize production and minimize peak loads by avoiding hard stall.
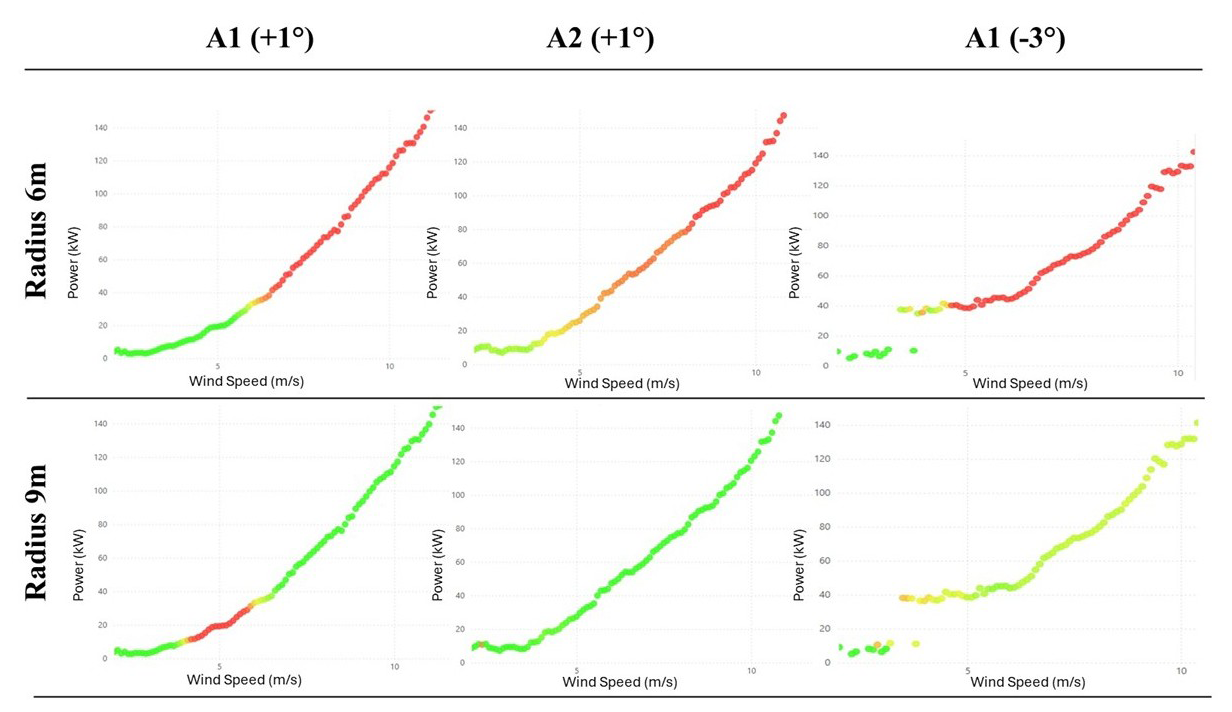
Figure 17Power curve function of wind speed with std Bz filter to detect flow behaviour (yaw misalignment filter −20 to 20°, pitch filter 0.9 to 1.1°).
3.5 Remark on the pitch regulation for A1 and A2
We note (Fig. 15) that rotor speed for A2 is more important than for A1 in the range 4 to 8 m s−1, and the power curves are different between the two wind turbines: A2 produces more than A1.
Theoretically, both wind turbines are similar in blade geometry and in control parameters.
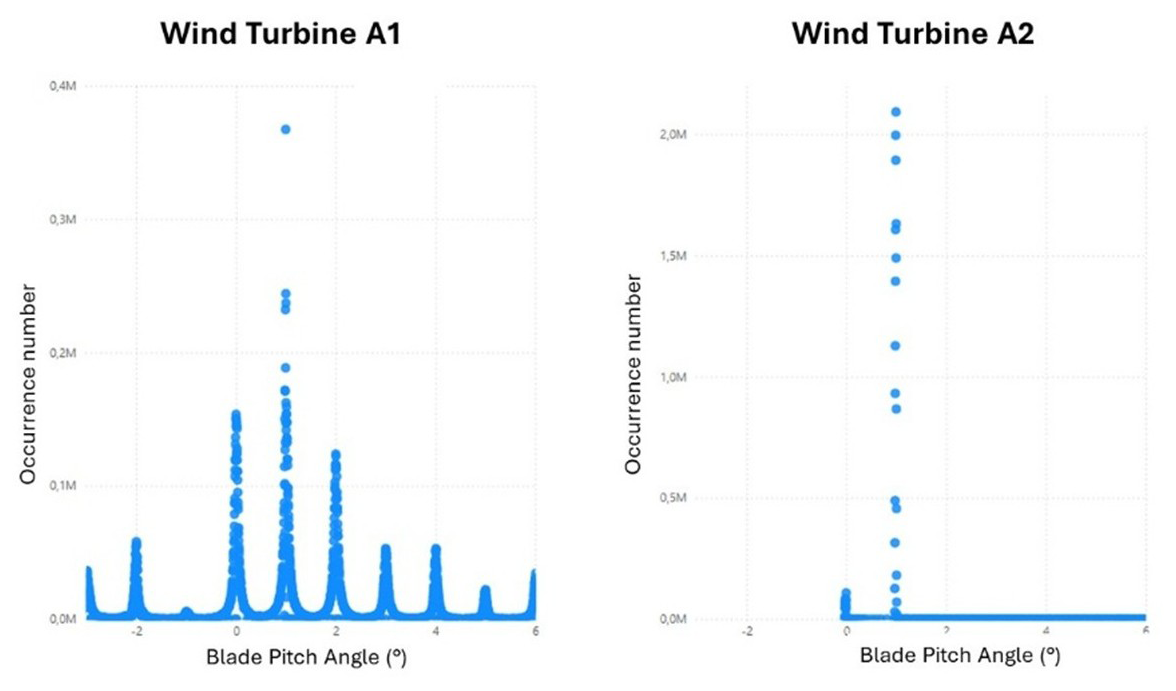
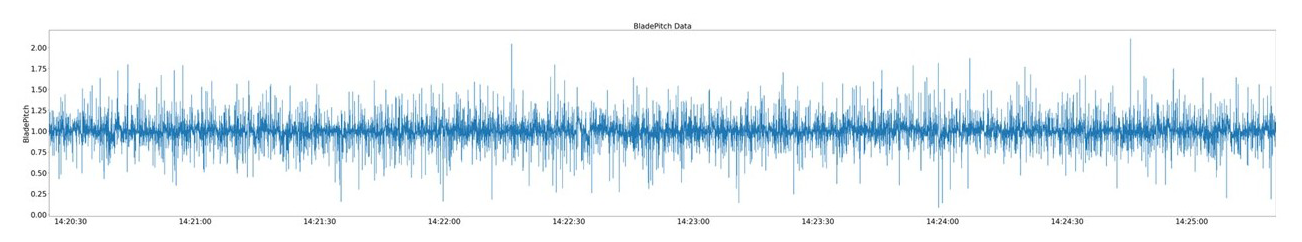
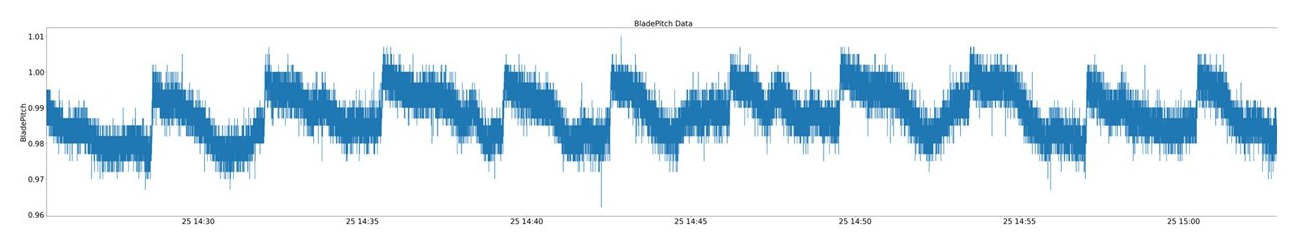
If we look at the regulation of the pitch angle (Figs. 18 and 19), we can see that the amplitude of regulation between A1 and A2 is very different. For A1, the angle goes from 0.5 to 1.5°, while A2 goes from 0.97 to 1.03°. This is also confirmed by the distribution of pitch angles during the test.
We can say that the control between A1 and A2 is not similar, which could explain the differences of performance between both wind turbines.
3.6 Pitch offset trim recommendations
By measuring an AoA on blades at radius 6 m for a range of wind speed, it is possible to propose a pitch offset recommendation function of wind speed to get the same AoA on the three blades (Table 7). The goal is to reduce aerodynamic unbalance at all wind speed ranges.
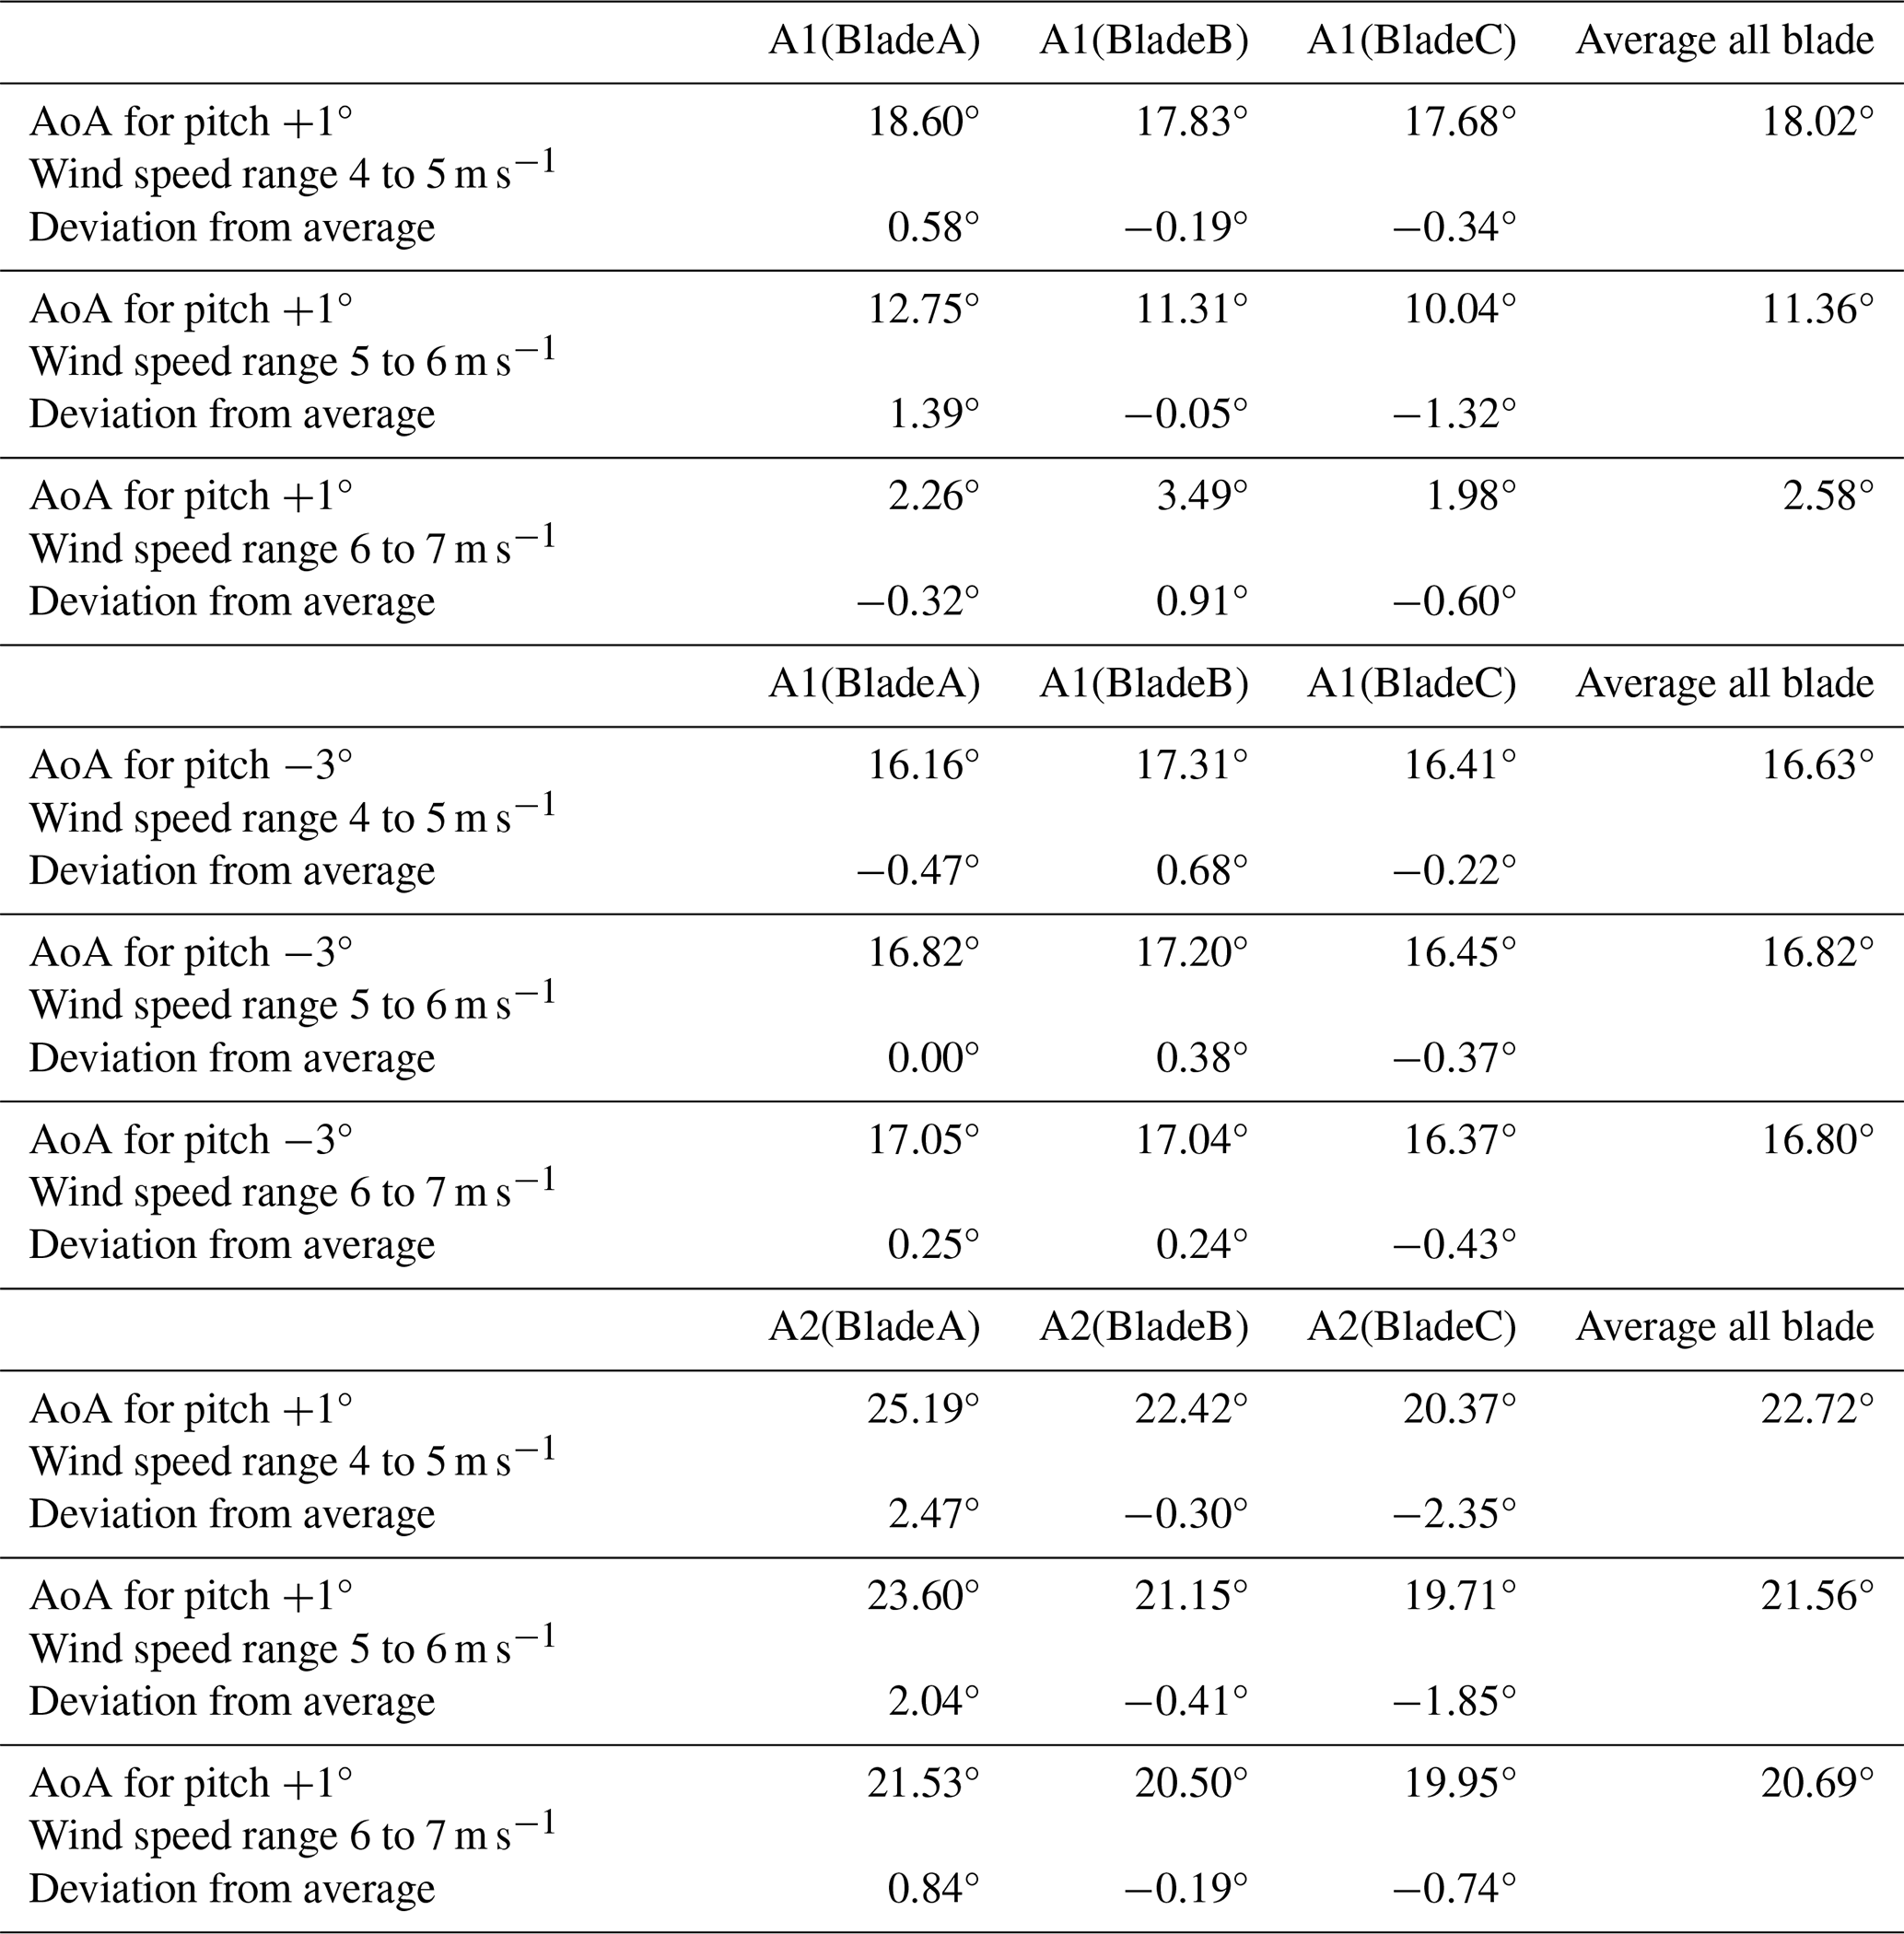
The recommendations is the average of all blades at R6 for a specific wind speed range.
The added value of this method is to provide recommendations in the function of the wind speed.
The first thing to note is that the offsets of A1 and A2 are different at a radius of 6 m.
The average offset for A2 decreases with the wind speed range from 22.72 to 20.69°. We do not observe the same decrease for A1.
3.7 CN function of pitch angle
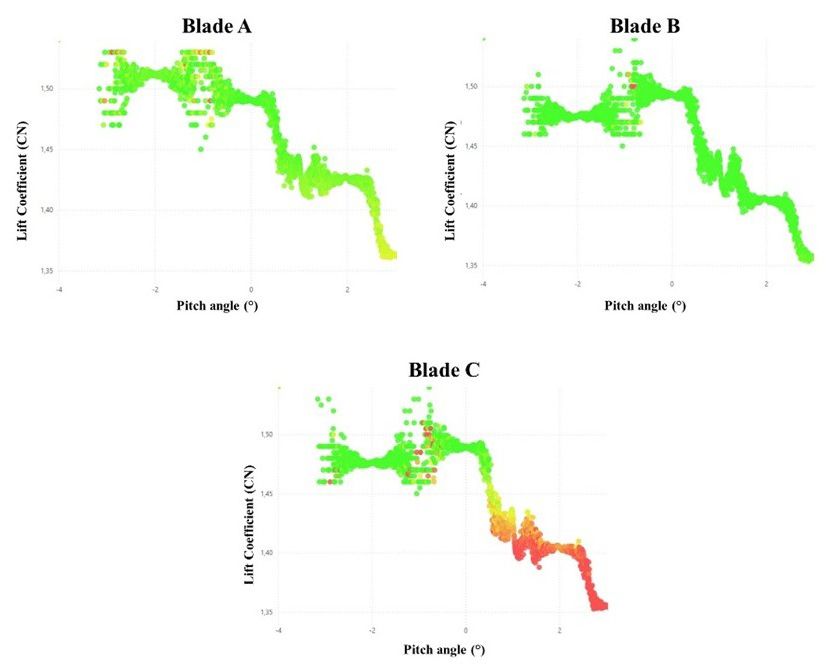
The normal (to the chord) lift coefficient CN is estimated with eTT raw data, rotor speed and wind speed by applied mathematical model and trained with data from the wind tunnel. Figure 20 represents a CN function of the pitch angle for each blade. Colours represent the standard deviation of eTT raw data (green = attached; red = detached).
The CN increases from pitch +3° to pitch −2°. This confirms that CN is a decreasing function of pitch angle offset.
The aerodynamic eTT sensors placed on each blade of two wind turbines (Vestas V27 – 225 kW) showed that when the flow is attached, the production is 15 % higher than average, and conversely when the flow is detached, production falls by 30 %. Hence, the state of the flow measured on the blades has a high correlation with the output power and loads.
The approach was made possible by applied mathematical tools linking the eTT signals on a two-dimensional model full-scale blade in the CSTB high-speed wind tunnel to lift coefficient and angle of attack (AoA). The research quantifies the effect of aerodynamic behaviour on the wind turbine electric power production. The power loss criteria is considered to prove that eTT raw data are highly correlated with the output power of the wind turbine.
The SWIFT facilities give the opportunity to have access to high-frequency meteo mast data (true wind speed, true wind direction, pressure, temperature and relative humidity). The correction of generated power is possible to obtain a GenPower corrected on each wind turbine. At the same time, the eTT sensors provide raw data on five positions on the blade's suction side in such a way that it is possible to differentiate the corrected GenPower curve in detached and attached behaviours.
With this method, we show that 33 % of the time, 15 % power (kW) was lost during the test in low and medium winds.
A solution to recover this power loss is to implement new control strategies for wind turbine blades.
A pitch control strategy searching for attached R9 just before hard stall behaviour will produce the maximum power as seen in the range 4.7–7.5 m s−1 for A1, 4.7–6.5 m s−1 and for A2, and confirmed by the convergence of A1 to A2 performance in this range.
-
For instance, for A1 at 5.2 m s−1, it is observed that when the flow is attached on eTT R9, the power is 65 % higher than for the measured power curve. There is huge potential (around 59 %) for increased power for A1 at +1° of pitch if the flow is attached at R9.
-
The power of the A1 and A2 wind turbines have been compared, concluding that A2 produces more than A1 for the whole range of wind speeds. When A1 has R9 attached, the power curve reaches A2 production.
-
A2 is producing more than A1 but even for A2 the potential for increased power is huge (e.g. 18 % at 5.7 m s−1 to 32 % at 5.2 m s−1).
-
The test at −3° of pitch for A1 confirms that it is possible to obtain more with the same wind turbine when the AoA increases to the optimal angle.
To get the maximum electric power production, the proposed control strategy would focus on tracking the optimum angle of attack (AoA) instead of varying the rotational speed with a constant pitch angle.
Moreover, with the same pitch control algorithm, aerodynamic imbalance can be addressed by measuring the AoA on the blade at a different radius for a range of wind speed and providing a pitch offset recommendation function of the wind speed to get the same AoA on the three blades.
In this paper, we present the testing of a method to qualify the power curve in terms of detached and attached moments. The results demonstrate the ability of the eTT sensor to detect the under-production of a wind turbine and the machine learning algorithm to detect blade misalignment. The results also demonstrate the potential gain from real-time flow monitoring to get a maximum of attached flow on the blade.
In summary with this method, we can address:
-
Blade pitch misalignment identification for given wind speed with AoA analysis,
-
Optimization to reach maximum power by static pitch angle to catch the optimum AoA.
Moreover, we showed the potential optimization to reach maximum power with dynamic pitch control considering the eTT standard deviation for 15 % and 45 % chord. Testing such new control algorithm will be the subject of a future project.
The code is not publicly available because of confidentiality reasons. The paper contains a detailed description of the methodology, which should make it possible for the reader to reproduce it.
The data are not publicly available because of confidentiality reasons. All data are covered by an NDA between the industrial partner and Blade Sense.
DVO and DVE conceptualized the research question. DVO and DVE performed the analysis with assistance from MC, JROV, RJ and MF. DVO, DVE and MC also wrote the first version of the paper, which was subsequently reviewed and edited by all co-authors.
Didier Velayoudon and Dimitri Voisin are board members of Blade Sense SAS. Dimitri Voisin is the inventor of the patent related to the technology described in this article.
Publisher's note: Copernicus Publications remains neutral with regard to jurisdictional claims made in the text, published maps, institutional affiliations, or any other geographical representation in this paper. The authors bear the ultimate responsibility for providing appropriate place names. Views expressed in the text are those of the authors and do not necessarily reflect the views of the publisher.
The authors would like to thank the technical staff at CSTB who carried out experiments in the high-wind tunnel and the technical team of Sandia National Laboratory for allowing the experimental campaign at the SWIFT facilities.
This research has been supported by the TotalEnergies On Batch#4 programme and the TotalEnergies R&D department.
This paper was edited by Emmanuel Branlard and reviewed by two anonymous referees.
Astolfi, D.: A study of the impact of pitch misalignment on wind turbine performance, Machines, 7, 8, https://doi.org/10.3390/machines7010008, 2019.
Bartholomay, S., Michos, G., Perez-Becker, S., Pechlivanoglou, G., Nayeri, C., Nikolaouk, G., and Paschereit, C. O.: Towards Active Flow Control on a Research Scale Wind Turbine Using PID controlled Trailing Edge Flaps, Wind Energy Symposium, American Institute of Aeronautics and Astronautics, Inc., https://doi.org/10.2514/6.2018-1245, 2018.
Chamorro, L. P., Guala, M., Arndt, R. E. A., and Sotiropoulos, F.: On the evolution of turbulent scales in the wake of a wind turbine model, J. Turbul., 13, 1–13, https://doi.org/10.1080/14685248.2012.697169, 2012.
Coquelet, M., Lejeune, M., Bricteux, L., van Vondelen, A. A. W., van Wingerden, J.-W., and Chatelain, P.: On the robustness of a blade-load-based wind speed estimator to dynamic pitch control strategies, Wind Energ. Sci., 9, 1923–1940, https://doi.org/10.5194/wes-9-1923-2024, 2024.
Creaby, J., Li, Y., and Seem, J. E.: Maximizing Wind Turbine Energy Capture Using Multivariable Extremum Seeking Control, Wind Eng., 33, 361–387, https://doi.org/10.1260/030952409789685753, 2009.
Elosegui, U., Egana, I., Ulazia, A., and Ibarra-Berastegi, G.: Pitch angle misalignment correction based on benchmarking and laser scanner measurement in wind farms, Energies, 11, 3357, https://doi.org/10.3390/en11123357, 2018.
Ezzeddine, W., Schutz, J., and Rezg, N.: Pitot sensor air flow measurement accuracy: Causal modelling and failure risk analysis, Flow, Measurement and Instrumentation, 65, 7–15, https://doi.org/10.1016/j.flowmeasinst.2018.10.021, 2019.
Gao, L., Yang, S., Abraham, A., and Hong, J.: Effects of inflow turbulence on structural response of wind turbine blades, J. Wind Eng. Ind. Aerod., 199, 104137, https://doi.org/10.1016/j.jweia.2020.104137, 2020.
GWEC (Global Wind Energy Council): Global Wind Report 2025, Global Wind Energy Council, Brussels, https://26973329.fs1.hubspotusercontent-eu1.net/hubfs/26973329/2. Reports/Global Wind Report/GWEC Global Wind Report 2025.pdf (last access: 5 January 2026), 2025.
Hyers, R., McGowan, J., Sullivan, K., Manwell, J., and Syrett, B.: Condition monitoring and prognosis of utility scale wind turbines, Energ. Mater., 1, 187–203, https://doi.org/10.1179/174892406X163397, 2006.
Kumar, D. and Rotea, M. A.: Wind Turbine Power Maximization Using Log-Power Proportional-Integral Extremum Seeking, Energies, 15, 1004, https://doi.org/10.3390/en15031004, 2022.
Kusnick, J., Adams, D. E., and Griffith, D. T.: Wind turbine rotor imbalance detection using nacelle and blade measurements, Wind Energ., 18, 267–276, https://doi.org/10.1002/we.1696, 2015.
Neunaber, I., Danbon, F., Soulier, A., Voisin, D., Guilmineau, E., Delpech, P., Courtine, S., Taymans, C., and Braud, C.: Wind tunnel study on natural instability of the normal force on a full-scale wind turbine blade section at Reynolds number 4.7⋅106, Wind Energ., 25, 1332–1342, https://doi.org/10.1002/we.2732, 2022.
Saathoff, M., Rosemeier, M., Kleinselbeck, T., and Rathmann, B.: Effect of individual blade pitch angle misalignment on the remaining useful life of wind turbines, Wind Energ. Sci., 6, 1079–1087, https://doi.org/10.5194/wes-6-1079-2021, 2021.
Soulier, A., Braud, C., Voisin, D., and Danbon, F.: High-Reynolds-number investigations on the ability of the full-scale e-TellTale sensor to detect flow separation on a wind turbine blade section, Wind Energ. Sci., 7, 1043–1052, https://doi.org/10.5194/wes-7-1043-2022, 2022.
Swytink-Binnema, N. and Johnson, D. A.: Digital tuft analysis of stall on operational wind turbines: Digital tuft analysis of stall on operational wind turbines, Wind Energy, 19, 703–715, https://doi.org/10.1002/we.1860, 2016.
Varpe, S. A.: Control system on a wind turbine, Norwegian University of Science and Technology Department of Energy and Process Engineering, http://hdl.handle.net/11250/235060 (last access: 5 January 2026), 2008.
Veers, P., Bottasso, C. L., Manuel, L., Naughton, J., Pao, L., Paquette, J., Robertson, A., Robinson, M., Ananthan, S., Barlas, T., Bianchini, A., Bredmose, H., Horcas, S. G., Keller, J., Madsen, H. A., Manwell, J., Moriarty, P., Nolet, S., and Rinker, J.: Grand challenges in the design, manufacture, and operation of future wind turbine systems, Wind Energ. Sci., 8, 1071–1131, https://doi.org/10.5194/wes-8-1071-2023, 2023.