the Creative Commons Attribution 4.0 License.
the Creative Commons Attribution 4.0 License.
 | 04 May 2026
Impact of floater flexibility on tower eigenfrequencies of a spar-type floating offshore wind turbine: measurement-based assessment and model calibration
Romain Ribault
Jerome De-Lauzon
Adrien Hirvoas
Designing floating wind turbine systems requires integrated load assessments (ILA) using fully coupled hydro-servo-aero-elastic models. In most cases, floater hydrodynamics are represented using potential-flow models for mooring system design and motion estimation, while the floater itself is typically assumed to behave as a rigid body. However, this assumption can significantly affect tower eigenfrequency calculations, especially for large floaters. In this study, we investigate these effects using in situ sensor data from the Zefyros 2.3 MW spar wind turbine. We present a methodology to accurately determine the tower's eigenfrequencies. A rigid-floater model without added mass leads to an average error of 65 % for the first tower mode relative to measurements. Including hydrostatic added mass reduces the error to 40 %. Further incorporating floater flexibility decreases the error to 4.3 %, and accounting for blade flexibility lowers it to just 2.8 %. These discrepancies highlight the importance of refining the hydro-servo-aero-elastic model to align with eigenfrequencies derived from finite-element hydro-structural analyses. We present potential model adjustments, assess their impacts, and demonstrate the updated validation process.
- Article
(3192 KB) - Full-text XML
- BibTeX
- EndNote


Offshore wind energy has experienced rapid growth over the past decade, with capacity tripling between 2012 and 2022. During this period, an average of 55 GW of new wind capacity was added annually, reaching as much as 75 GW in 2022 alone (IRENA, 2023). According to the 1.5° scenario of IRENA (2023), wind energy is expected to become one of the largest sources of electricity worldwide, with an estimated 10 300 GW of installed capacity by 2050.
Despite this expansion, the sector continues to face the challenge of a relatively high levelized cost of energy (LCOE) compared to other power generation sources. However, collaborative research, supportive government policies, and advances in large-scale asset production have significantly reduced the LCOE of floating offshore wind turbines (FOWTs), making them increasingly cost-competitive (WindEurope, 2020).
One strategy for cost reduction is to increase the power output of individual turbines. This approach, however, also requires a proportional increase in the overall structural size. As floating foundations scale up, they must be designed to remain stable and flexible under more demanding conditions.
The design of support structures for FOWTs is particularly challenging due to the complex physical phenomena involved and the harsh marine environments in which they operate (European Commission, 2019). Consequently, the continuous trend toward larger and more powerful turbines raises new concerns for the engineering and design community.
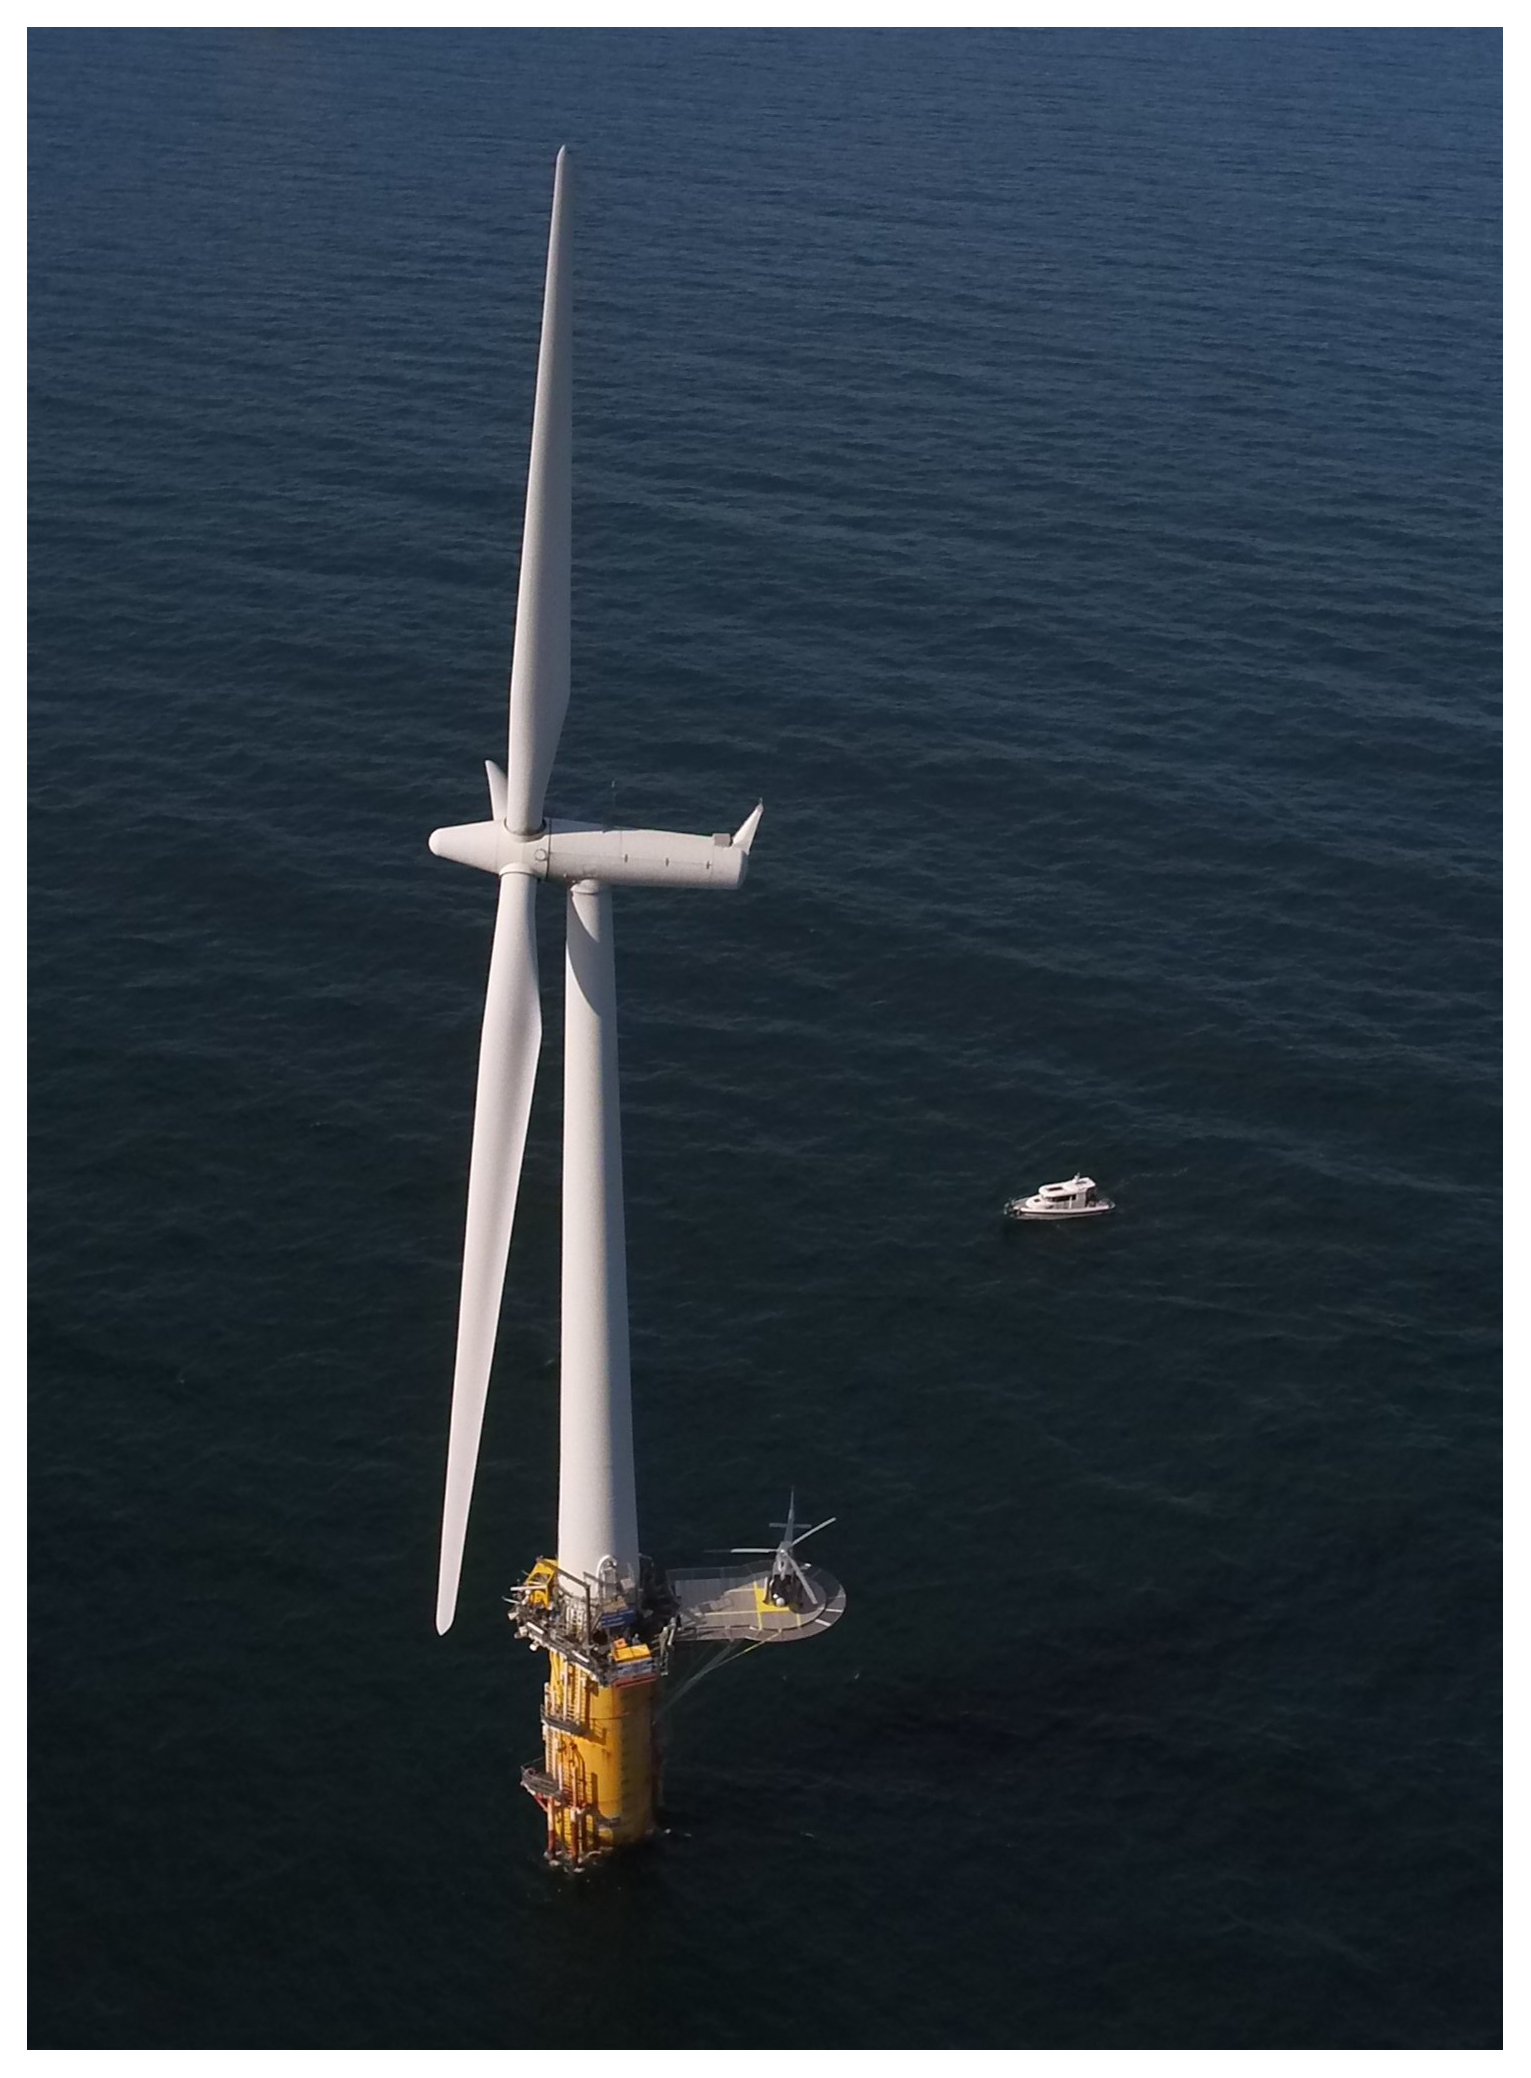
Currently, only a few FOWTs are operational. Zefyros (shown in Fig. 1) is one them. This wind turbine is located 11 km far from the coast of Norway and owned by Unitech. It is the first multi-megawatt floating turbine in the world (Skaare et al., 2014). The first numerical model of Zefyros was presented in the work of Skaare et al. (2007). In this work, the structure was modeled using a coupled simulation based on two different software tools, SIMO/RIFLEX and HyWindSim, developed by Marintek and the Risø National Laboratory, respectively. Both simulators solve their own dynamic equilibrium equations in the time domain. A scaled set of test cases was carried out by the Ocean Basin Laboratory at Marintek with the objective of comparing the results of integrated coupled simulation tool outputs with experimental data. Good agreement was shown between simulation and measurement data.
Many studies employing aero-hydro-servo-elastic simulations of FOWTs (e.g., Curfs, 2015; Cheng et al., 2015; Zhang et al., 2020) account for tower and blade flexibility. However, when the focus is on mooring design or platform motion, floater hydrodynamics are often modeled using potential-flow theory. While these models capture hydrodynamic loading with reasonable accuracy, they generally assume the floater to be rigid. This assumption not only precludes the estimation of internal loads within the floater but also influences the calculation of tower eigenfrequencies, which in turn may affect predictions of the tower's dynamic response.
The importance of considering floater flexibility in global dynamic responses has been emphasized in recent studies. For example, Haoran et al. (2023) investigated a 15 MW semi-submersible wind turbine, highlighting the influence of structural flexibility on its dynamic behavior. Similarly, Borg et al. (2016) proposed an approach to incorporate large-volume substructure flexibility using an iterative coupling between the radiation-diffraction solver WAMIT and the aeroelastic code HAWC2 for a spar-type platform. Their study compared the global responses of rigid and flexible models, showing that accounting for flexibility yields more accurate sectional load predictions.
As shown in the literature, the effect of floater flexibility has been addressed for different types of floating support structures and wind turbine sizes. According to DNV-RP-0286 (DNV-GL, 2019), the assumption of rigid-body behavior may be acceptable in certain cases, provided it can be demonstrated that floater flexibility does not significantly influence the turbine's response. Similarly, NR572 (Bureau Veritas, 2015) states that hydro-elasticity should be considered when relevant. However, despite these references, there is currently no clear or unified guidance on best practices for assessing the validity and applicability of the rigid-body simplification during the design phase of floating substructures.
This article details a methodology to accurately calculate tower eigenfrequencies at the design stage and integrate floater flexibility effects into the aero-hydro-servo-elastic simulations. We demonstrate the impacts of a floater rigid-body assumption on tower eigenfrequency calculation, using in situ sensor data from the Zefyros 2.3 MW spar wind turbine. In Sect. 2.1, we briefly introduce the Zefyros wind turbine, describe the measurement campaign, and estimate the tower eigenfrequencies, among other dynamic parameters, using the S-Morpho measurement system. In Sect. 2.2, we describe the numerical models. Section 2.2.1 provides some theoretical background on the hydro-structural model used for modal analysis and reference calculation of the tower eigenfrequencies. Then, in Sect. 2.2.2, we describe the initial aero-hydro-servo-elastic simulation model implemented in OpenFAST. In Sect. 2.2.3, the potential simulation model adjustments are presented, discussing their limitations and impacts. For the tower's eigenfrequency calculation from time-domain simulation results, we used an operational modal analysis (OMA), described in Sect. 2.2.4. In Sect. 2.3 we describe the load cases we used to run the aero-hydro-servo-elastic models in order to assess tower eigenfrequency in the time-domain simulation and identify a potential modification of the global dynamic tower response. Section 3 is dedicated to the discussion and the presentation of the results.
2.1 Measurements performed on 2.3 MW Zefyros wind turbines
Unitech Zefyros is a floating spar offshore wind turbine originally installed as Hywind Demo by Equinor (Statoil) at approximately 11 km off the west coast of Karmøy (Norway). The floater is based on a cylinder shape submerged vertically and connected to a steel tower. Having a spar-type substructure, the structure is stabilized due to the long distance between the center of gravity and center of buoyancy. This system supports a Siemens 2.3 MW wind turbine with a rotor diameter of 82.4 m.
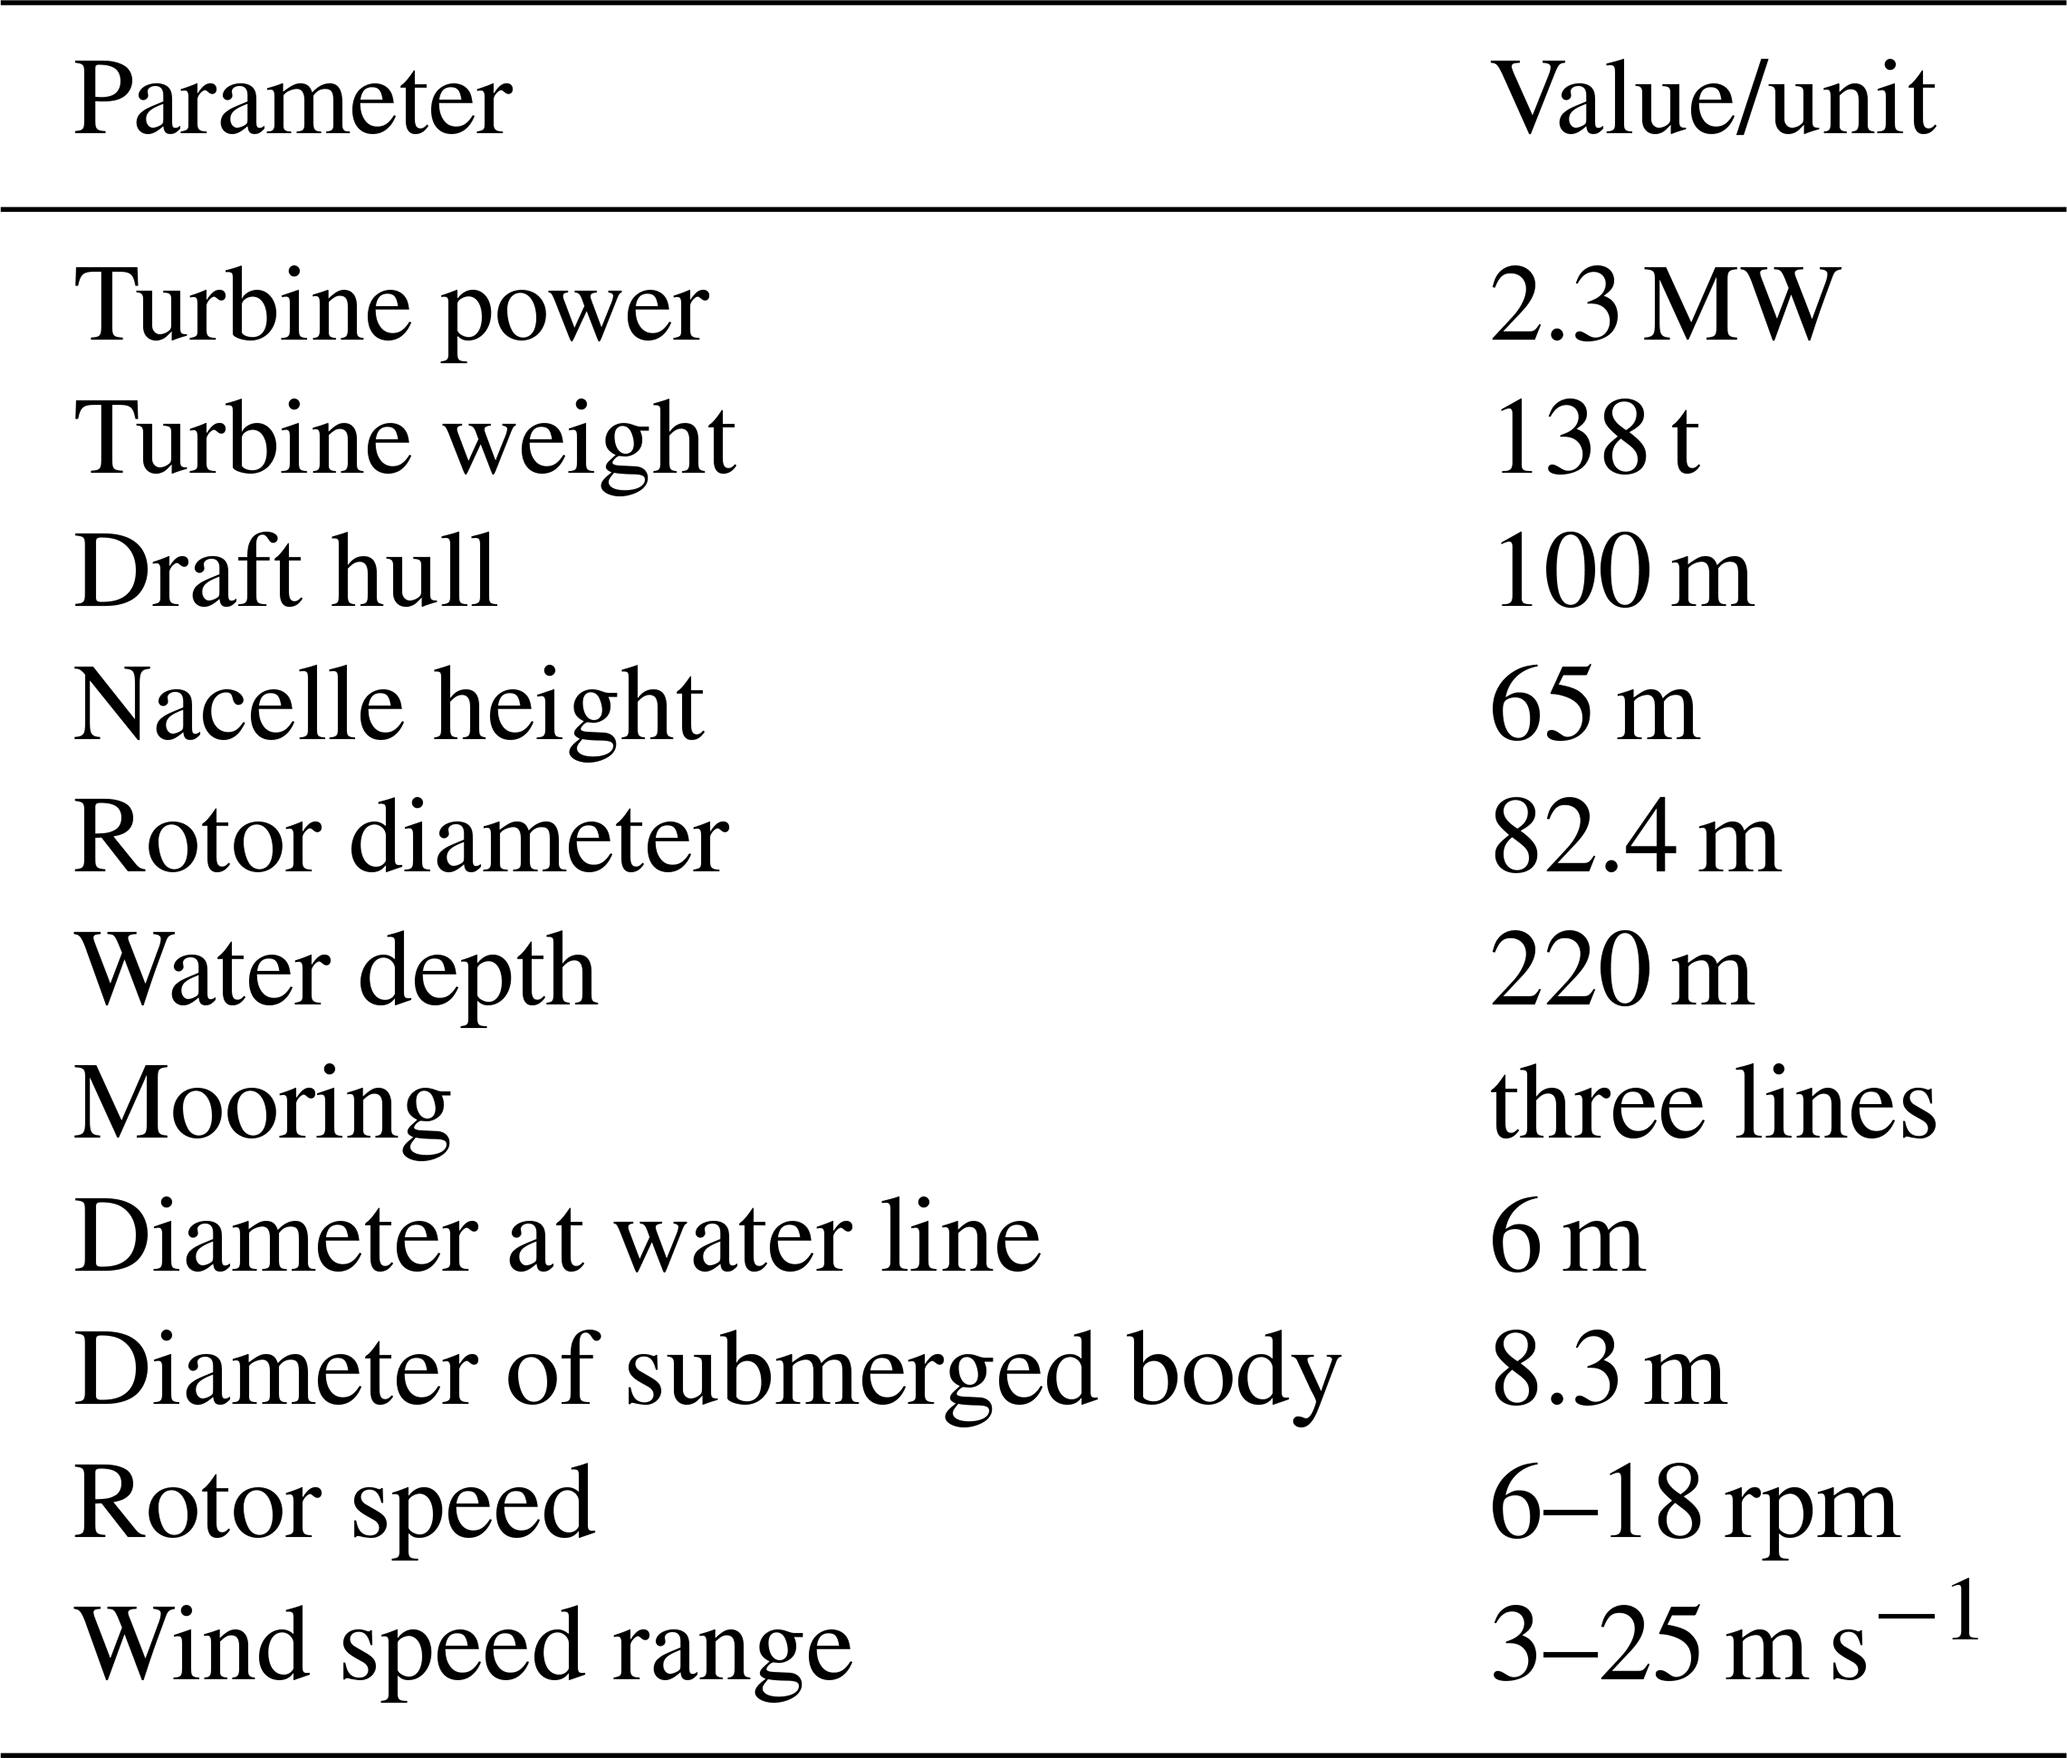
The system is fixed to the seabed by three mooring lines consisting of hybrid wires and clump weights. The length of each line is approximately 800 m. The hull is ballasted with gravel and water. The main particulars of Zefyros are given in Table 1. For a detailed description of the structure, refer to the work of Godø (2013).
Dynamic and static measurement data were collected continuously over 2 years within the framework of the DIONYSOS project using the S-Morpho system. The sensor outputs include three-axis accelerations, a magnetic field, and temperature at a sampling frequency of 40 Hz. Six sensors were installed along the Zefyros tower in May 2022, approximately 30° northwest.
Their positions were 17, 33, 41, 49, 57, and 63 m above sea level. The local sensor reference frame was aligned with the tower's reference frame: the x axis corresponds to fore–aft movement, the y axis to side-to-side movement, and the z axis to vertical movement.
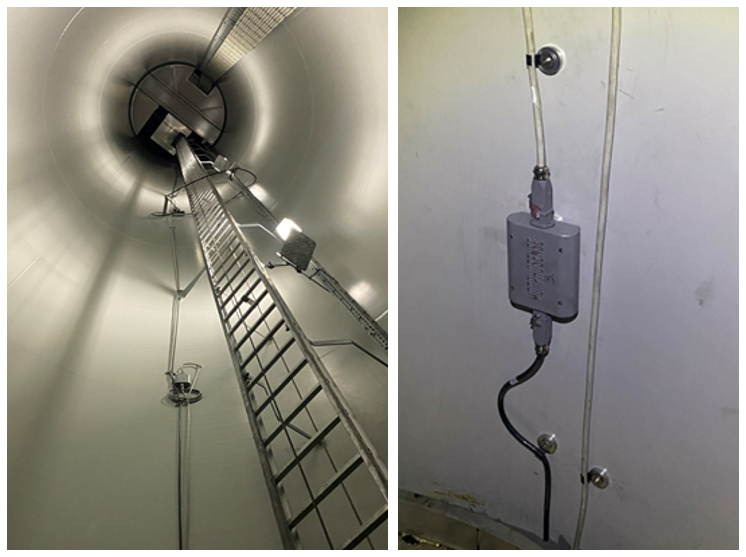
Figure 2 shows the first two sensors installed on the tower. As the tower is made of steel, all sensors were fixed by two powerful magnets per unit. A general view of the positioning is provided in Fig. 3. For further details about the sensor system, refer to Thomas Redoute (S-MORPHO system user manual, unpublished internal project document).
Modal identification of Zefyros tower from measurements
The simulation of the dynamic behavior of a wind turbine is highly dependent on the accuracy of its numerical model. To ensure the model correctly reproduces the dynamic response of the asset, calibration must be performed using reliable experimental data. In this work, the selected experimental data for calibration were the global modal parameters.
The Zefyros wind turbine is equipped with a yaw system, which allows the nacelle to rotate and remain oriented toward the wind direction. This feature adds complexity to the modal analysis, as the structural modal deformations depend on the nacelle orientation (Oliveira et al., 2018). To address the challenge of combining the moving reference frame of the nacelle with the fixed reference frame of the tower, a coordinate transformation was applied. The transformation used the nacelle orientation angle, obtained from the SCADA data provided by Unitech Energy Group:
where the variables x and y contain the raw acceleration data, the variables x′ and y′ are the new transformed accelerations and correspond to the 10 min averaged yaw angle θ, and R(θ) is the three axes' matrix rotation.
This coordinate transformation enables the projection of the measured acceleration signals into the fore–aft and side-to-side directions of the wind turbine – i.e., the directions parallel and perpendicular to the rotor plane, respectively. The transformation was applied to the entire dataset collected during December 2022, allowing comparison with SCADA data acquired for the same period.
After performing the transformation, reference modal parameters were estimated from a 20 min interval when the wind turbine operated under rated conditions. The environmental parameters corresponding to this operating condition are summarized in Table 3.
Subsequently, the transformed acceleration data were continuously processed for the entire month using operational modal analysis (OMA) techniques for wind turbine structures when external excitation could not be measured (van Vondelen et al., 2022). In order to estimate and track the modal frequencies and mode shapes over time, the covariance-driven stochastic subspace identification (COV-SSI) method was employed (Masjedian and Keshmiri, 2009; Ghalishooyan et Shooshtari, 2015) using six reference channels and a time lag of 10 s. The analysis provided parametric estimations within 20 min moving windows. To ensure the correct modal shape tracking over time, the modal assurance criterion (MAC) was used to assess the correlation between the continuously estimated and reference mode shapes (Pastor et al., 2012). When the MAC value exceeded 0.9, the corresponding mode shape was retained as a valid tracked mode.
Figure 4 illustrates the temporal evolution of the second fore–aft and side-to-side tower modes during December 2022, shown by the pink and red lines, respectively. The black line represents the rotor rotational speed in rpm, derived from SCADA data. This figure highlights the influence of rotor rotation on the tower's modal frequencies. The emerged frequencies of the structure are shown in Table 4.
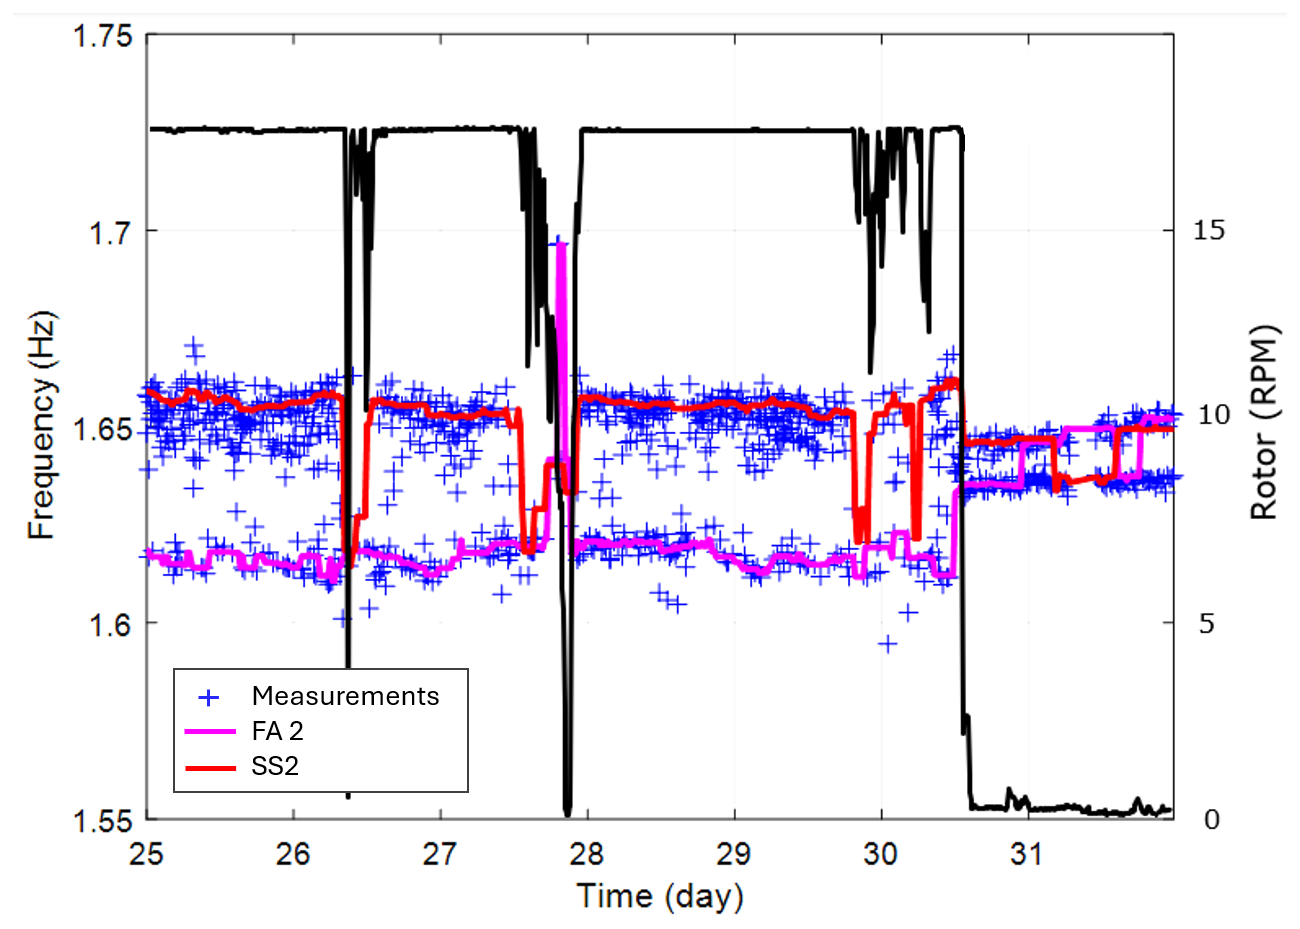
Figure 4Plot of the second tower natural frequency tracking correlated with the rotor rotation during December 2022.
2.2 Numerical models
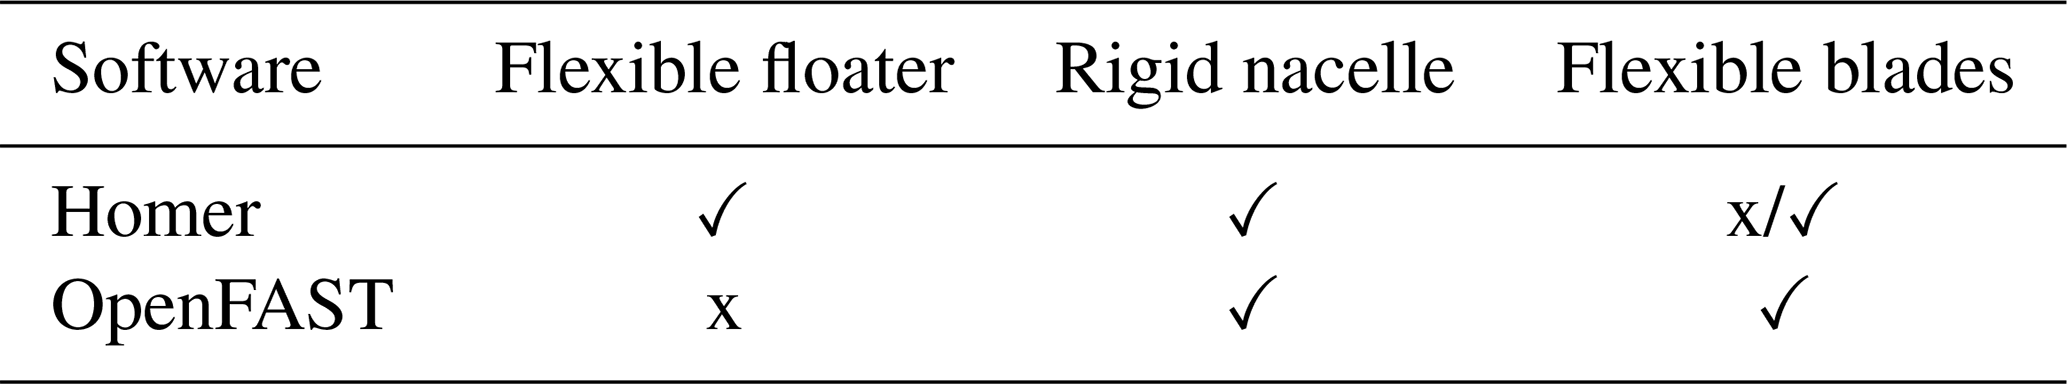
In the following subsections, the calculation methodology for each software tool is briefly described. It should be noted that Homer was employed as the offshore modal analysis tool, solving the classic equation of motion (Eq. 3). For coupled dynamic time-domain simulations of the wind turbine, an OpenFAST model was developed and tested. A summary of the two numerical model characteristics is given in Table 2. A more detailed description is given in the following sections.
Table 2Main model characteristics as a function of the numerical software.
2.2.1 Hydro-structure model used to perform tower's eigenfrequency reference calculation
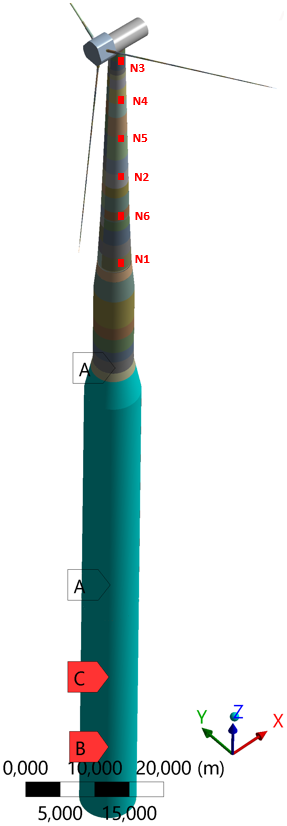
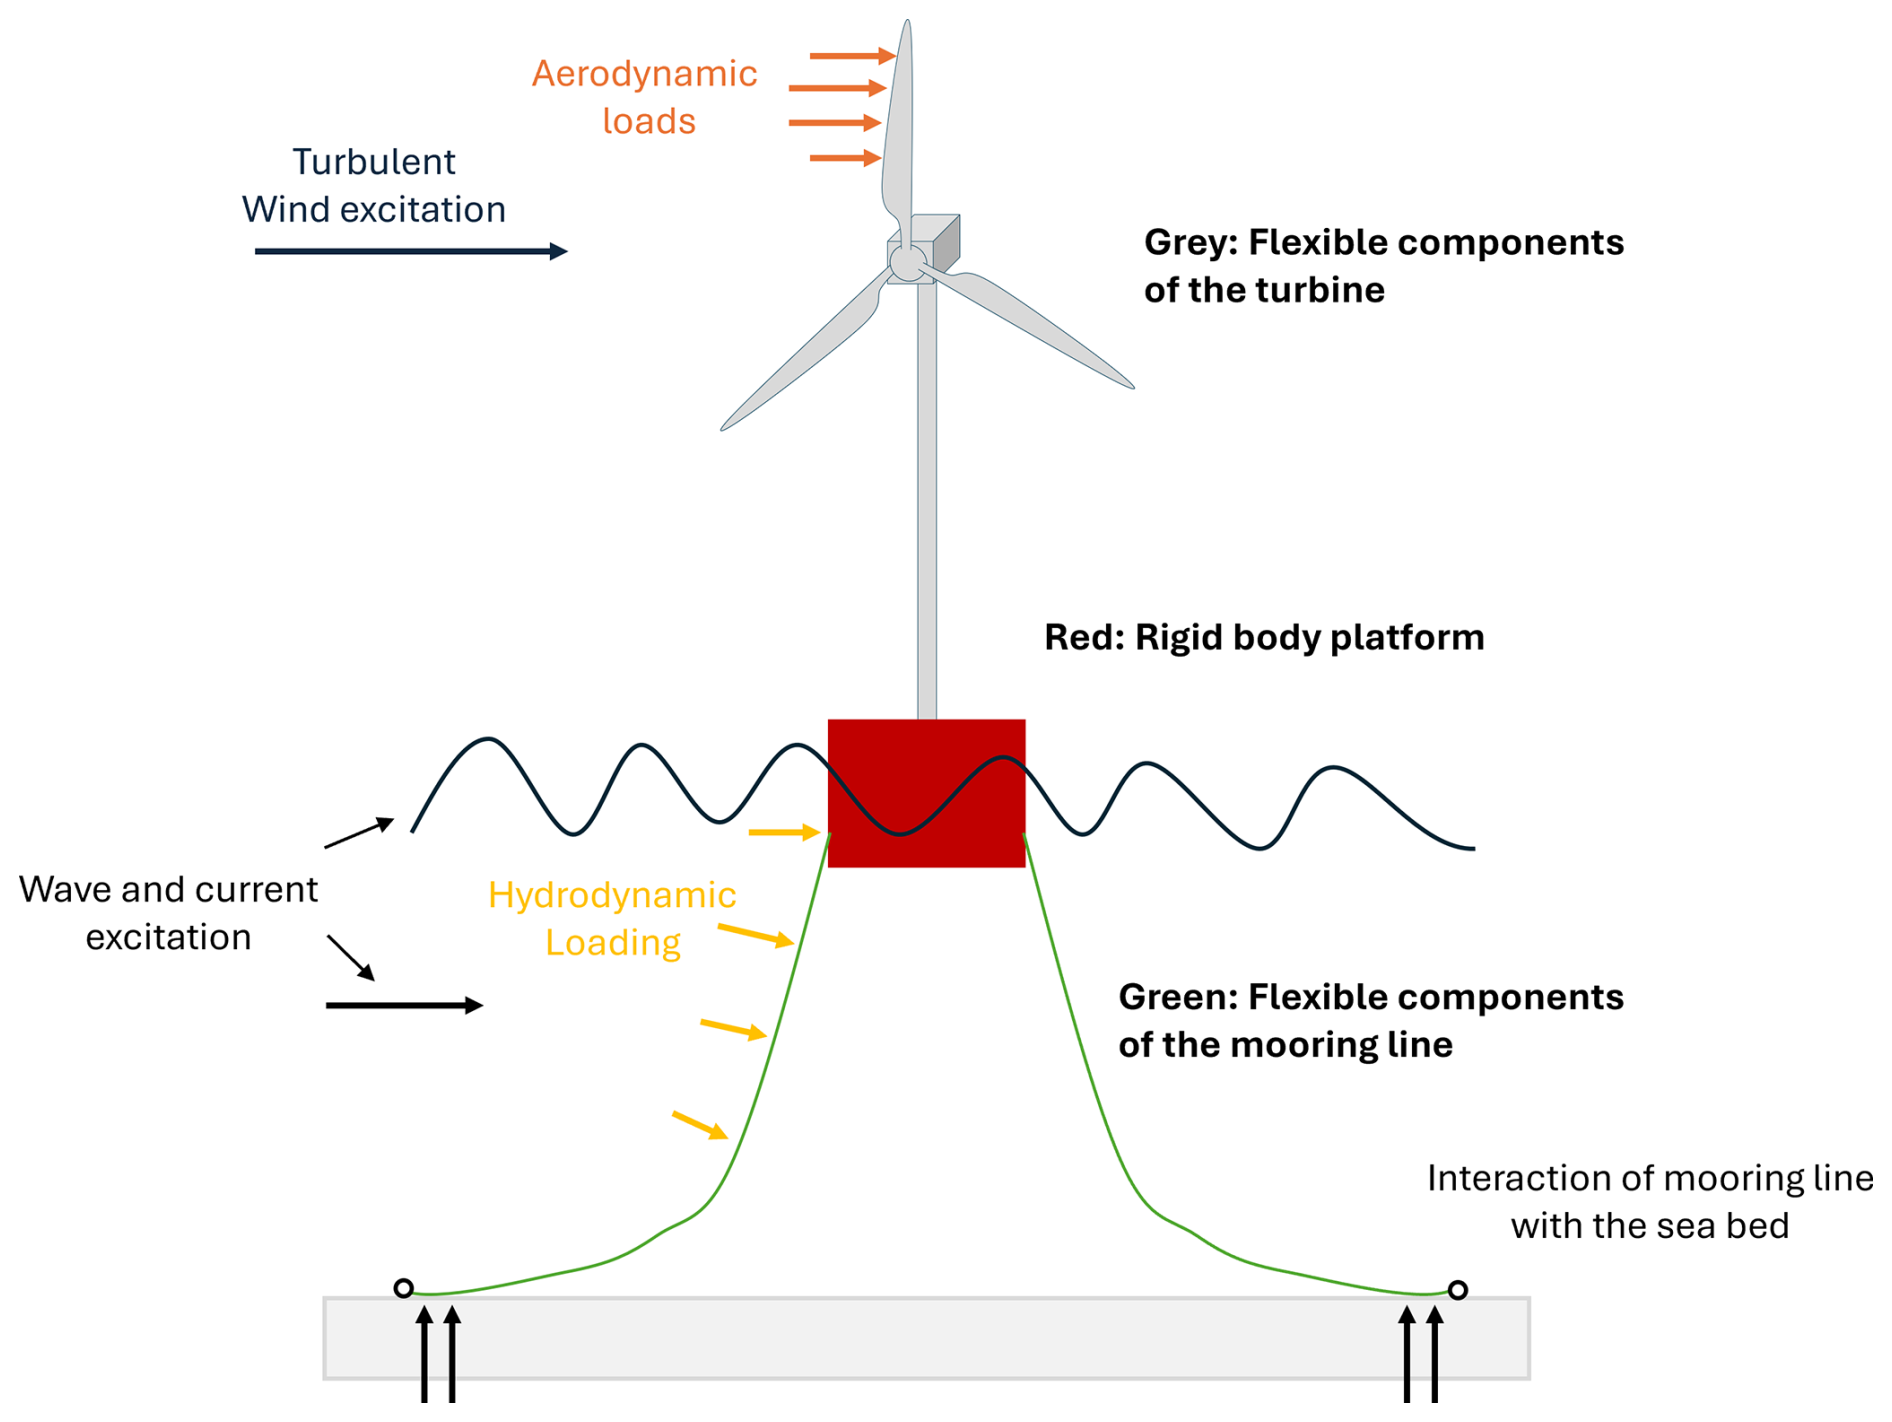
To calculate the reference eigenfrequencies of the tower, the analysis was carried out in Homer, a hydro-structure software tool with a modal analysis capability developed by Bureau Veritas (Malenica et al., 2013). The model implemented in Homer describes the full mechanical FOWT system and is derived from an ANSYS model (Fig. 3). The floater and tower are built with shell elements. Rotor nacelle assembly is modeled as a mass element, connected to the tower rigidly. Blades are also modeled, either as flexible beam elements or by just considering their inertia.
The hydro-elastic analysis performed in Homer relies on the decomposition of the structural response of the floating wind turbine on its N first dry vibration modes. Instead of solving a 6-by-6 linear problem, the dimension of all matrices (mass, added mass, stiffness) is increased to 6+N.
The first step in the coupled analysis is therefore a dry modal analysis of the structure. After the flexible modes have been chosen, the hydrostatic stiffness is computed for the N vibration modes, as well as for the six rigid-body motions (surge, sway, heave, roll, pitch, and yaw). The hydrodynamic radiation boundary value problem is then solved by Hydrostar for the 6+N modes, and the added-mass matrix is then assembled. Finally, the wet eigenmodes and frequencies are computed. The method is rather well known and has been the subject of many scientific publications (Malenica et al., 2008). The pre-stressing at hydrostatic equilibrium is not considered in this analysis; its influence is assumed to be small.
Bureau Veritas Hydrostar software is used to solve the radiation boundary value problems for the rigid-body motions and the vibration modes. For each vibration mode, the additional body boundary condition becomes
where φRj is the radiated velocity potential for mode j, and hj is the shape of mode j, interpolated from the finite-element model to the hydrodynamic mesh. Once all radiation boundary value problems (six rigid motions and N elastic modes) have been solved, the radiation pressures are computed at the center of the finite elements and integrated to compute the added masses. The motion equation can then be written as (after removing the excitation forces and radiation damping)
where [K] is the structural stiffness, [C] the hydrostatic stiffness, [M] the structural mass, [A(ω)] the added mass, and {ξ} the vector of modal amplitudes.
For each frequency ω, the inverse of the total mass (including added mass) is computed and multiplied by the total stiffness. The resulting matrix is finally diagonalized for each frequency to find the wet eigenfrequencies and eigenvectors. For each eigenmode computed by the diagonalization, the vibration frequency is obtained when the eigenfrequency matches the frequency used for the added mass.
2.2.2 Initial aero-hydro-servo-elastic simulation model
OpenFAST (FAST stands for fatigue, aerodynamics, structures, and turbulence) is an open-source engineering code distributed by the National Wind Technology Center (NWTC) (Jonkman and Buhl, 2005). This code is a nonlinear time-domain simulator that employs a combined modal and multibody structural-dynamic formulation. In our research, the numerical representation of the Zefyros system has been implemented within OpenFAST. This model assumes a rigid platform but accounts for the tower's flexibility; see Fig. 5. The structural, hydrodynamic, and aerodynamic properties of the FOWT were configured based on publicly available documents and generic wind turbine data interpolation. The key properties defined include inertial characteristics of the nacelle, lift, and drag profiles of the airfoil, along with mass and structural-elastic properties at various blade locations; inertial and structural-elastic characteristics of the drive train; mass and structural-elastic properties at specific tower locations, from the waterline to the tower's top; and inertial properties of the rigid spar.
To prevent drifting, the Zefyros platform is anchored to the seabed using three separate catenary mooring lines attached to anchors at the seafloor. For the numerical representation of mooring line dynamics, we used MoorDyn, a dynamic lumped-mass model within OpenFAST (Hall, 2015). This numerical modeling methodology leverages this model's capability to represent multi-segmented mooring lines, comprising diverse elements such as chains, unsheathed spiral ropes, and additional clump weights, as outlined in Adrien Hirvoas (Model construction of Zefyros floating offshore wind turbine, unpublished internal project document). The latest version of MoorDyn enables modeling two-leg bridles, significantly improving the yaw natural period from previous versions (Hall, 2020).
Incorporating hydrodynamics into the numerical simulation requires accurately defining incident wave characteristics and hydrodynamic loading representations (Molin, 2023). Within this OpenFast framework, HydroDyn is a module that has been designed to calculate these hydrodynamic loads in the time domain (Jonkman et al., 2014). To obtain the hydrodynamic loads acting on the rigid-body platform, a pre-computation step using radiation-diffraction software with a second-order loading module is necessary to solve different hydrodynamic theories. Finally, in our full-scale study, we calibrated the mooring radius and the platform's displaced volume to match the system's natural periods with low relative errors, as evaluated using in situ data.
Additionally, we adapted the ROSCO NREL controller, as described in Abbas et al. (2022), to the simulation model and conducted different dynamic load cases, comparing them with field measurements. The results show that the floating platform movements closely match the measured data, indicating good agreement, as shown in Adrien Hirvoas (Model construction of Zefyros floating offshore wind turbine, unpublished internal project document).
2.2.3 Possible aero-hydro-servo-elastic model modification and impacts
When modification of the aero-hydro-servo-elastic model is required to align the simulated tower eigenfrequencies with the measured or calculated values, several approaches can be applied. A first option is to model the floater as a flexible body, using a beam-element discretization and distributing the hydrodynamic loading over each element. This provides access to the internal loads of the floater at the chosen discretization scale. Two types of hydrodynamic models can be employed:
-
distributed potential-flow hydrodynamic model.
-
distributed Morison elements.
Thomsen et al. (2021) and Xu et al. (2019) applied a full-Morison approach for the hydrodynamic model and beam elements for the mechanical model of the floater. Such an approach can lead to a satisfactory FOWT global model with flexible-floater models. However, the Morison hydrodynamics model has its own limitations (Leroy et al., 2021), and coefficients are not available for all floater shapes, which makes the approach inapplicable to some floater designs (Guignier et al., 2016).
To overcome these constraints, several initiatives have investigated equivalent approaches that combine potential-flow theory with flexible floater modeling. These methods leverage the multi-body or additional generalized mode capabilities of radiation-diffraction software (e.g., WAMIT, HydroStar, Diodore) in combination with beam-element aero-hydro-servo-elastic solvers (e.g., OrcaFlex, Deeplines, SIMA). The following aspects are applicable in such frameworks:
-
The radiation-diffraction software calculates several hydrodynamic databases (HDBs) on a floater discretization equivalent to the mechanical model discretization.
-
The floater is mechanically modeled as an assembly of beam elements in aero-hydro-servo-elastic software, and for each beam element, the corresponding HDB is connected.
This type of approach was applied to Ideol's floater, using Ansys Aqwa as the radiation-diffraction software and Orcaflex as the aero-hydro-servo-elastic software (Guignier et al., 2016). In their work, a multibody approach was implemented in Aqwa, where the floater was discretized into several compartments. HDBs were then computed, including the hydrodynamic interactions between compartments. However, to prevent divergence of the calculations when using bodies that share faces, the compartments had to be manually separated within the Aqwa code.
In contrast, other studies adopted different hydrodynamic modeling strategies for platforms such as a spar-type platform supporting the DTU 10 MW turbine by Ran et al. (2023) and three-column semi-submersible floaters by Luan et al. (2017) and Haoran et al. (2023). They all used Wamit as radiation-diffraction software and in-house code to integrate panel pressure per floater substructure to compute the added mass, damping, and excitation forces with a discretization adapted to the mechanical model of the floater.
In the above-cited approaches, hydrodynamic interactions between substructures are taken into account, but the hydrostatic/hydrodynamic loads are not in turn influenced by floater flexibility. Luan et al. (2017) acknowledged that the influence of the inertia loads and hydro loads induced by the flexible modes of the hull will be investigated in the future. To account for the deformable modes of a floater contribution into hydrodynamic loads, within a small deformation assumption, Borg et al. (2016) proposed an iterative procedure between an aero-hydro-servo-elastic model (HAWC2) and WAMIT. An additional generalized mode calculation option may also be used (De Lauzon, 2024) and is available in the Homer software. Ran et al. (2023) performed an experimental validation of such a hydro-structural coupled model, demonstrating that internal floater loading estimations were more accurate with a distributed potential-flow hydrodynamic model rather than with a Morison hydrodynamic model.
When the above approaches cannot be implemented, other options are available:
-
Prolongate the tower mechanical model with a virtual element inside the floater, and calibrate the mechanical properties to match the tower eigenfrequencies.
-
Modify the global stiffness modal parameter in OpenFast (such an option is available inside the ElastoDyn file).
In our case, the chosen option was to modify the global tower stiffness. The OpenFAST model employed did not include the SubDyn module, which would have enabled the representation of the tower's prolongation below the floater–tower interface. Given the significant mismatch in eigenfrequencies, adding a small structural element at the tower base was not considered a viable option. It is worth noting, however, that recent updates to the HydroDyn and SubDyn modules now include capabilities for modeling flexible floaters.
2.2.4 Verification tool of simulated tower frequencies and shapes
To verify the tower eigenfrequencies from the aero-hydro-servo-elastic setup against those obtained from the hydro-structure calculation model, a modal analysis is required. This comprehensive model is primarily used for time-domain simulations, where most of the physics are nonlinear. Consequently, a specific linearization of the state-space representation is necessary to perform eigenanalysis. Most software tools include built-in modules for this purpose. Here, two options were available:
-
the use of the linearization functionality included in the OpenFAST open-source code
-
running OMA techniques on the OpenFAST output acceleration data.
Even though the OpenFAST functionality has been widely used and verified for FOWTs, as demonstrated in Johnson et al. (2019), in this study the validation of the natural frequencies and shapes was estimated via OMAs already used when estimating the modal parameters of measured data, described in the section “Modal identification of Zefyros tower from measurements”.
2.3 Load cases for evaluation of dynamic tower response in time-domain calculations
The first stage of the proposed methodology consisted of determining the sensitivity of the tower modes to the floater rigidity. In the second stage, the aero-servo-hydro-elastic model was adapted to account for the floater's flexibility. To achieve this, two main load cases were analyzed in order to investigate the global structural response under both low-wind and rated conditions.
-
Low-wind condition. Wind speed was below 12 m s−1, and significant wave height was below 2 m.
-
Rated condition. Wind speed was around 13 m s−1, and significant wave height was approximately 3.5 m.
The full set of input parameters for these two load cases is presented in Table 3. The irregular wave elevation time series were modeled using a JONSWAP spectrum, while the time-varying wind loads were generated with TurbSim, a full-field turbulent wind simulator (Jonkman, 2016).
Table 3Load case characteristics of 1 h average values. Low-wind condition of 2 December 2022 at 15:00 local time (LT) and rated condition of 6 December 2022 at 22:00 LT.
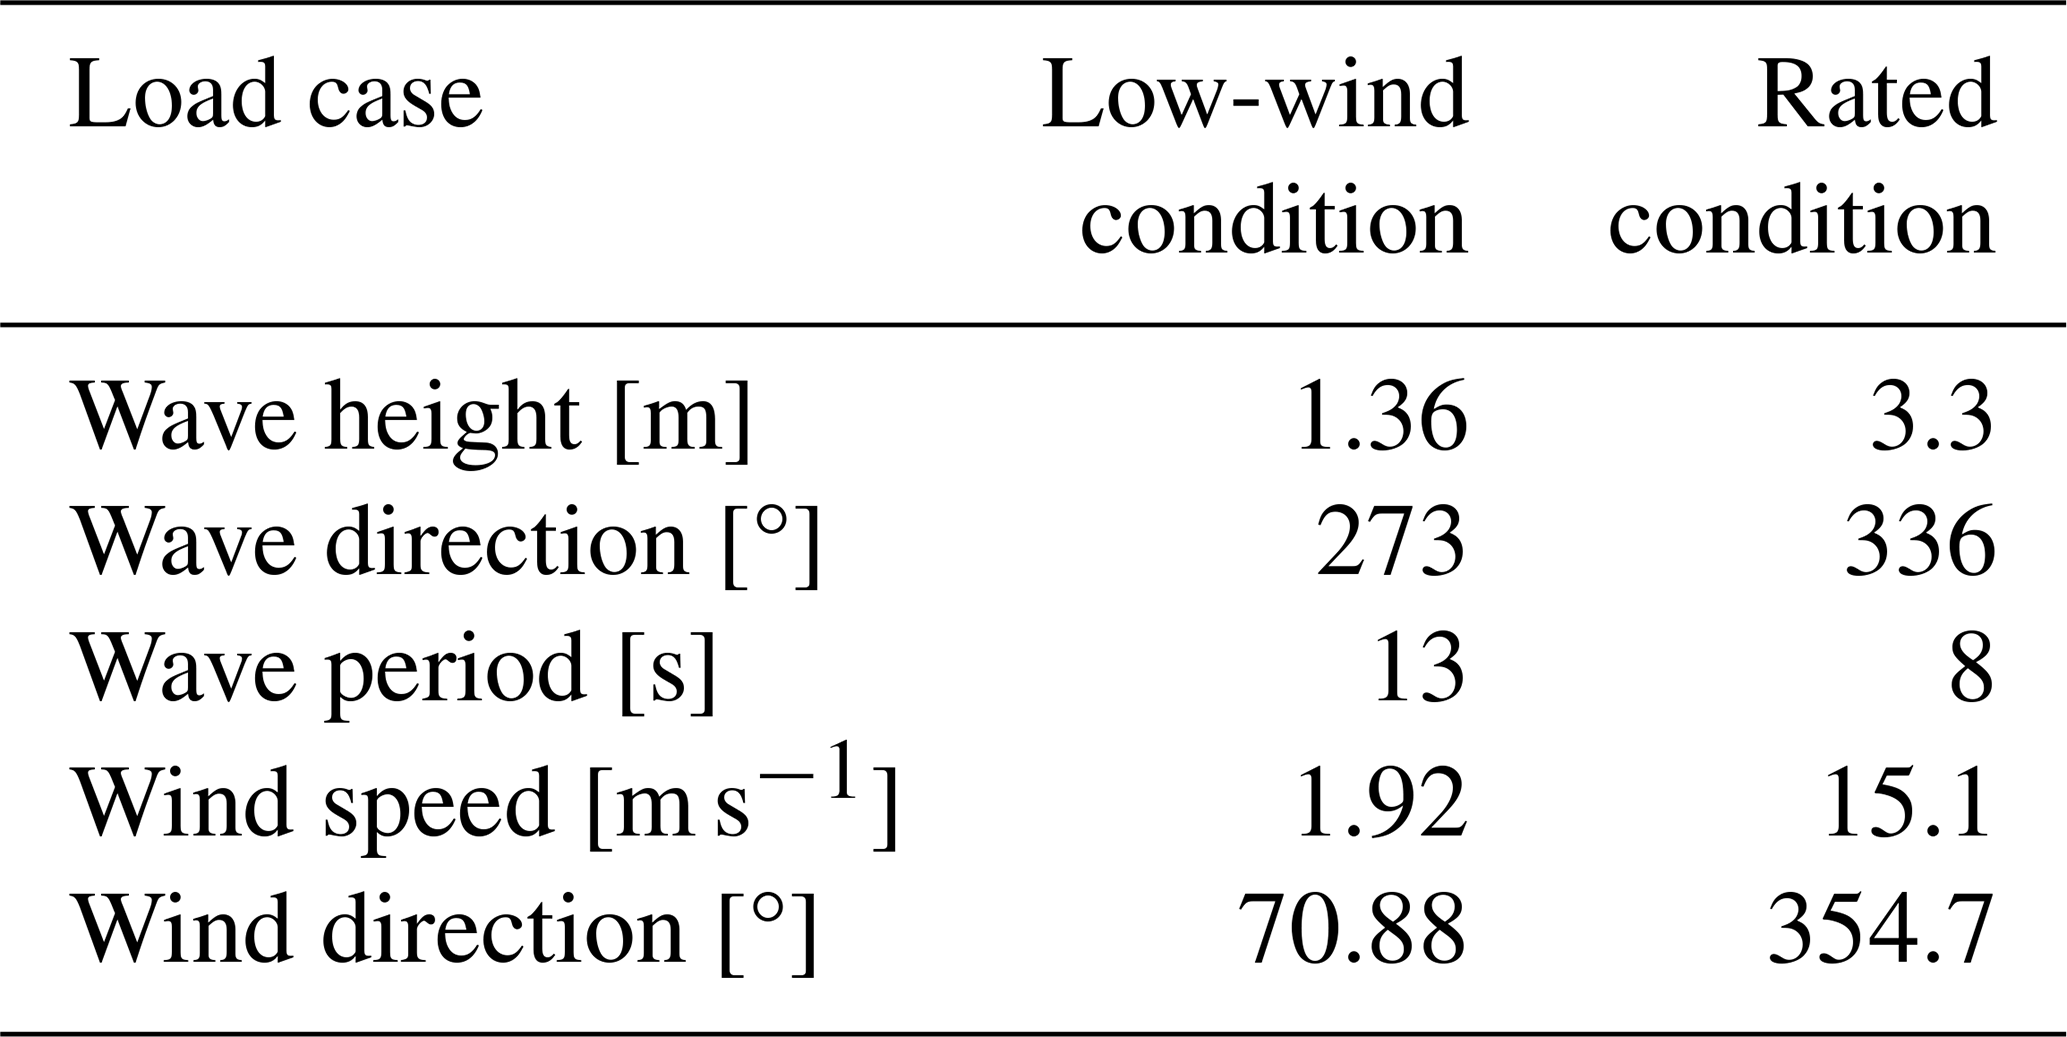
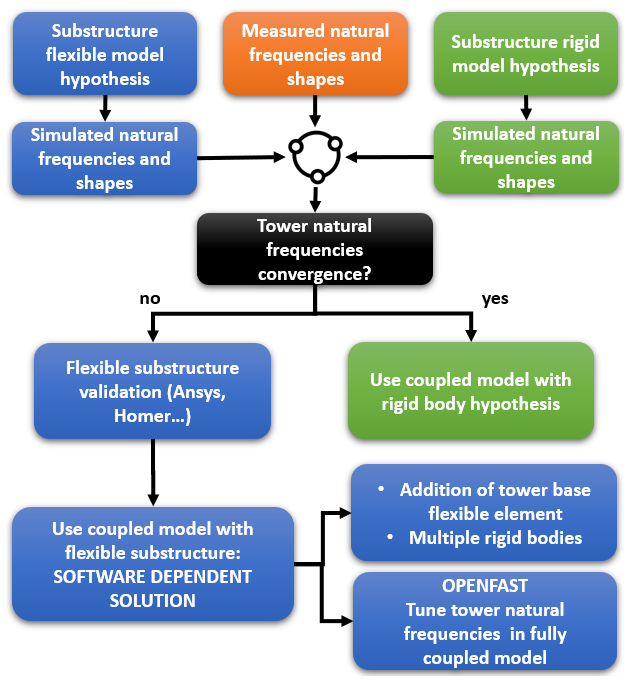
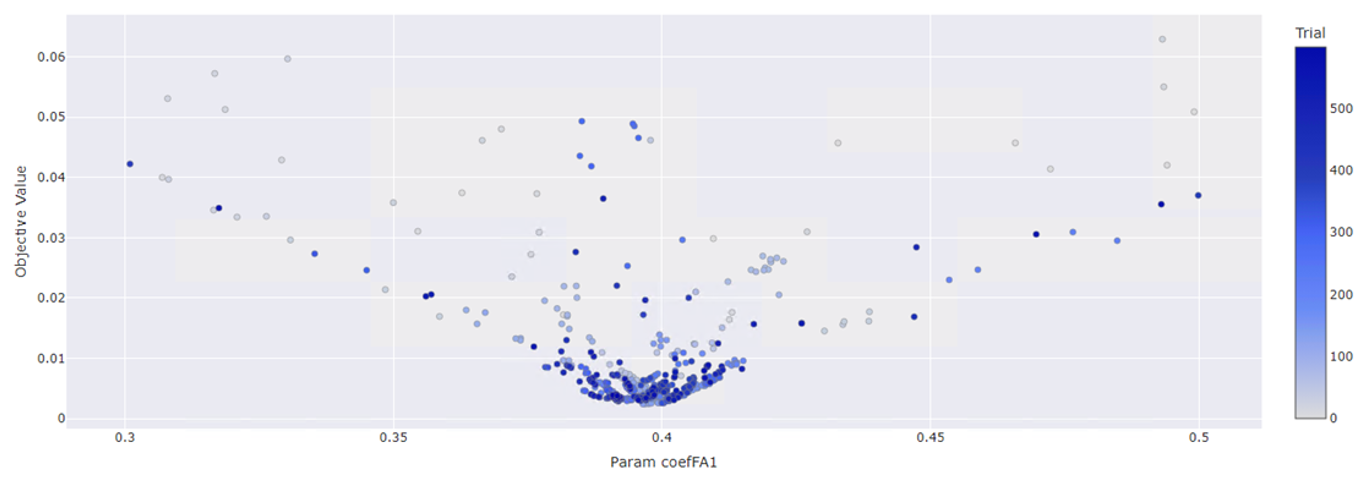
Figure 7CoefFA1 parametric values across all optimization trials. Color scale indicates trial index.
2.4 Parametric optimization
Once the load cases and the parameters to be optimized were defined, a parametric study was carried out to optimize the global stiffness modal parameter in OpenFAST, available inside the ElastoDyn module. This was achieved through the open-access Python package SimuOptuna (Ribault, 2024). The package is based on the Optuna hyperparameter optimization framework (Akiba et al., 2019), specifically adapted for wind turbine simulation tools. The configuration of the optimization routine was as follows:
-
sampler: tree-structured parzen sampler (TPS)
-
number of trials: 600
-
loss function: mean squared error between measured and simulated natural frequencies (the natural frequency identification methodology is described in Sect. 2.1.1).
Since the tower factors vary between 0 and 1, these limits were used to constrain the objective function. Figure 7 illustrates the parametric space and sampling iterative evolution of the first fore–aft tower factor. The color bar indicates the sequential iterations, showing how the objective function value decreases over time. The adjustment factor for the first side-to-side mode was estimated using the same procedure. The optimized values obtained for the first tower modes were 0.397 (fore–aft) and 0.421 (side to side). For more details on the parameter optimization process, refer to Ribault (2024).
This section is divided into two parts. Following the schema of Fig. 6, this section shows the modal sensitivity analysis performed in Homer. In the second part, a spectral analysis of the measured acceleration and the simulation signals is presented.
A 1 h simulation time was run for each load case in OpenFAST. To avoid the undesired model transient response, the first 300 s were eliminated, keeping the equivalent 1 h simulation when the structure is in its stability position.
3.1 Sensitivity analysis
During this analysis, the effect on the tower modes of the following phenomena and component modeling was evaluated:
-
the floater rigidity
-
the hydrodynamic added mass
-
the flexibility of the blades.
This first sensitivity analysis was carried out in Homer based on the finite-element model shown in Fig. 3. In the reference case, the rotor-nacelle assembly (including the blades) and the floater were assumed to be rigid. To approximate the rigid-floater condition within the Homer model, the material's Young's modulus was artificially increased from the steel value of 2.1 × 10¹¹ to 1 × 10²⁰ Pa. This unrealistically high modulus was used solely to demonstrate that increasing the floater stiffness in the physically consistent Homer model causes the system's modal behavior to converge toward the rigid-floater configuration. The adopted value is therefore valid only for the purposes of the present study.
The upper graph in Fig. 8 presents the natural frequencies of the system. The first six modes correspond to the 6 degrees of freedom (DoFs) of a floating system. Very good agreement was observed between the measured and simulated values, confirming the accuracy of the global mass and stiffness representation. The yaw response exhibited the largest deviation, with a maximum error of 7 %, while the average error across all 6 DoFs was approximately 3 %. As anticipated, treating the spar-type floater as a rigid body exerted a negligible influence on the first six low frequencies (first–sixth).
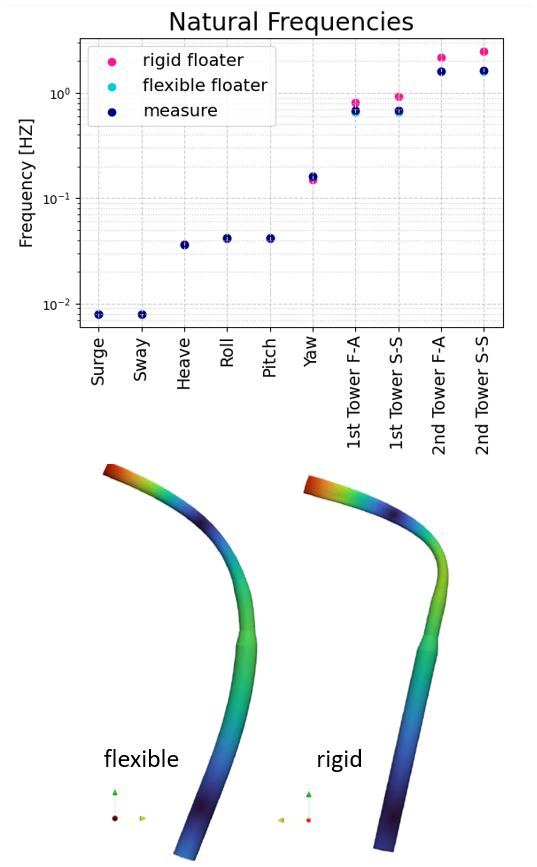
Figure 8Plot of the measured and simulated natural frequencies of the system (upper figure). Graphical representation of the first fore–aft coupled floater–tower mode (lower image).
In contrast, the floater stiffness strongly affected the tower modes, as seen in the higher-order modes in Fig. 8. When the floater was considered rigid, significantly larger discrepancies emerged, with errors reaching up to 48 % and 65 % for the second side-to-side and first fore–aft tower mode, respectively. Conversely, modeling the floater as flexible led to a reduction in the four tower natural frequencies, resulting in much closer agreement with the measured values. A graphic representation of the first fore–aft coupled floater–tower mode shape is shown in the bottom image of Fig. 8.
Table 4Summary of the estimated tower natural frequencies from the sensitivity analysis.
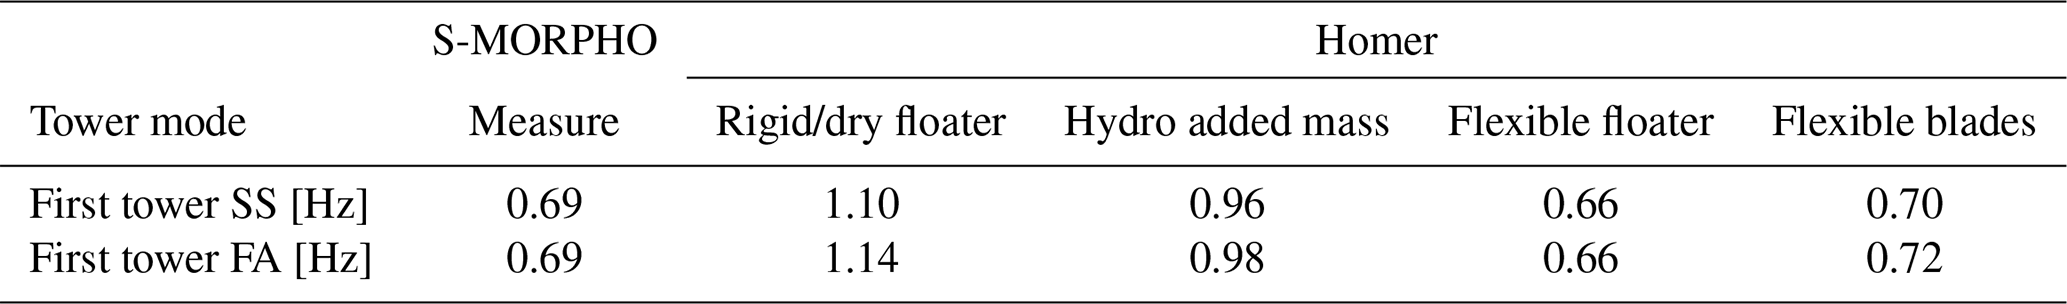
In the second analysis, the influence of the hydrodynamic added mass was evaluated. When this additional mass was included, a reduction in the natural frequencies was observed, and the average error for the first mode decreased to 40 % (see column 4 in Table 4). Subsequently, when floater flexibility was considered in addition to the hydrodynamic added mass, the tower frequencies showed a more pronounced decrease. This adjustment further reduced the average error by 4.3 % (column 5 in Table 4).
In the final step, blade flexibility was incorporated, while the hub and nacelle were modeled as rigid. A rigid connection was imposed between the blade roots and the hub, and the distributed blade structural properties were taken from the SIMA model developed by Homb (2013).
Unlike the floater flexibility, the blade flexibility exhibited an opposite effect on the tower modes, leading to a 7 % increase in the frequencies compared to the previous results. Nevertheless, this modification improved the overall accuracy, reducing the average error from 4.3 % to 2.8 % (last column in Table 4).
3.2 Spectral analysis
It was confirmed that modeling the floater as a rigid body significantly affects the tower natural frequencies of the Zefyros FOWT. Consequently, floater flexibility must be accounted for in the time-domain simulation tool. To achieve this, the tower adjustment factors were modified within the OpenFAST simulator, specifically in the ElastoDyn file. These coefficients multiply the global tower stiffness for the first and second tower modes in both the fore–aft and side-to-side directions. For this study, only the coefficients corresponding to the first tower mode were adjusted.
The coefficient values were determined through a parametric optimization routine described in Sect. 2.4. The resulting adjustment factors were 0.397 for the fore–aft direction and 0.421 for the side-to-side direction.
To validate the time-domain simulation outputs, four OpenFAST simulations were conducted: two for the low-wind condition (using the original and the adjusted model) and two for the rated wind condition. Figure 9 presents the acceleration spectrum comparison for the measured data (dark blue line), the rigid-floater model (dashed line), and the tuned model (dashed light blue line) under both operating conditions. The spectra were computed using Welch's power spectral density method in Python.
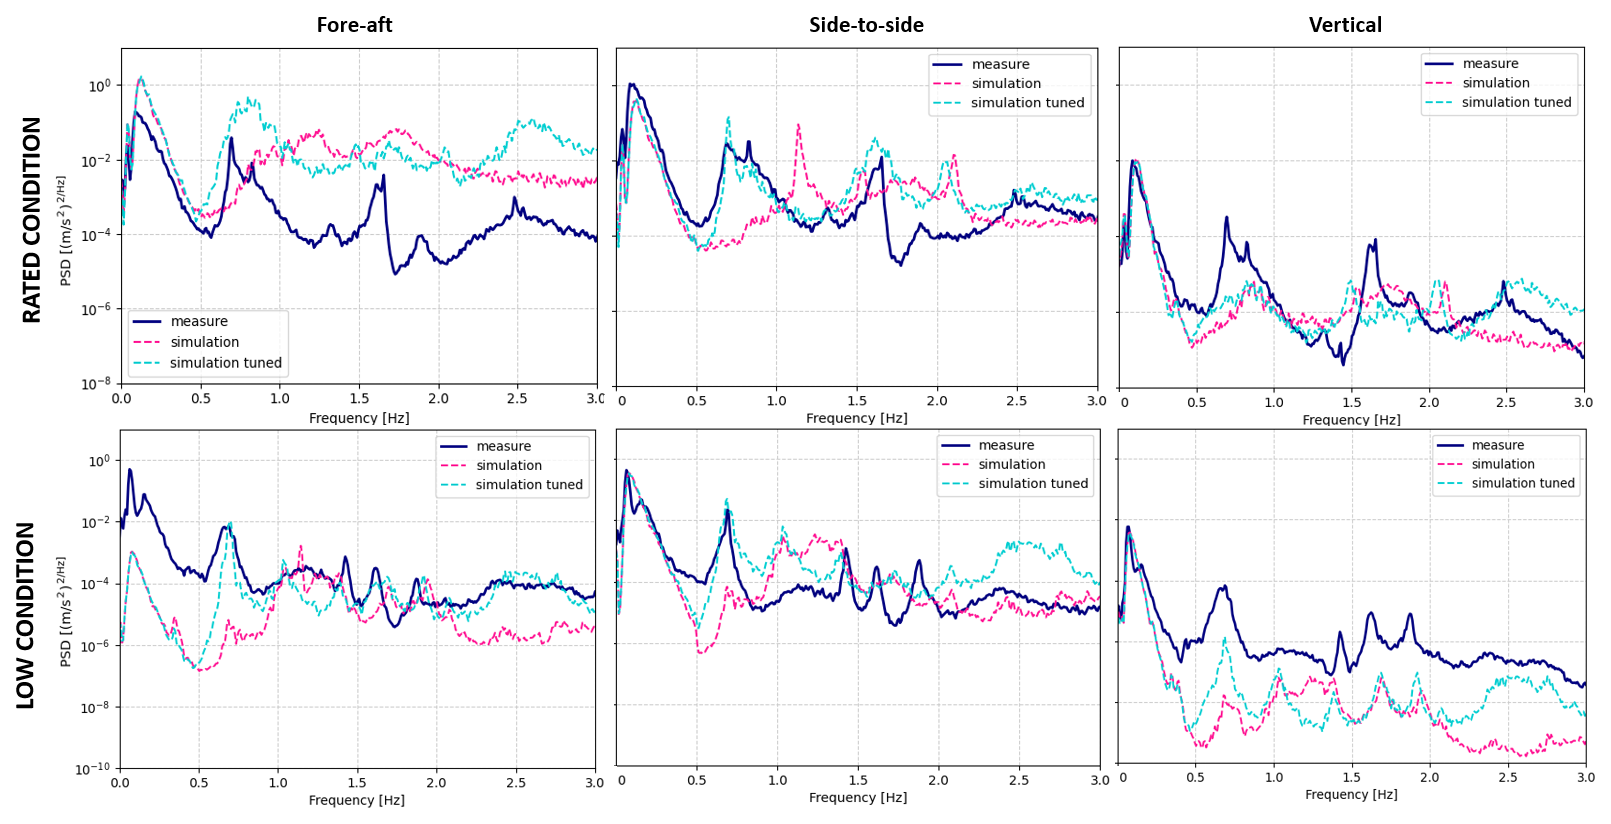
Figure 9Spectrum of the measured and simulated acceleration of sensor node 4 as a function of the fore–aft, side-to-side, and vertical directions. The dark blue line represents the measurement, the pink line is the response of the original model, and the light blue line is the response of the tuned model.
The simulated dynamic response in the side-to-side direction (middle graph of Fig. 9) has shown good agreement within the 0.05–3 Hz frequency range. Notably, the tuned numerical model shifted the original frequency peak from 1.1 to 0.70 Hz in both the fore–aft and the side-to-side spectra, corresponding to the first tower frequency. This was further validated using the operational modal analysis (OMA) algorithm applied to the acceleration output data, as described in the section “Modal identification of Zefyros tower from measurements”, and the resulting modal shape is illustrated in Fig. 10, showing excellent agreement with the first tower mode.
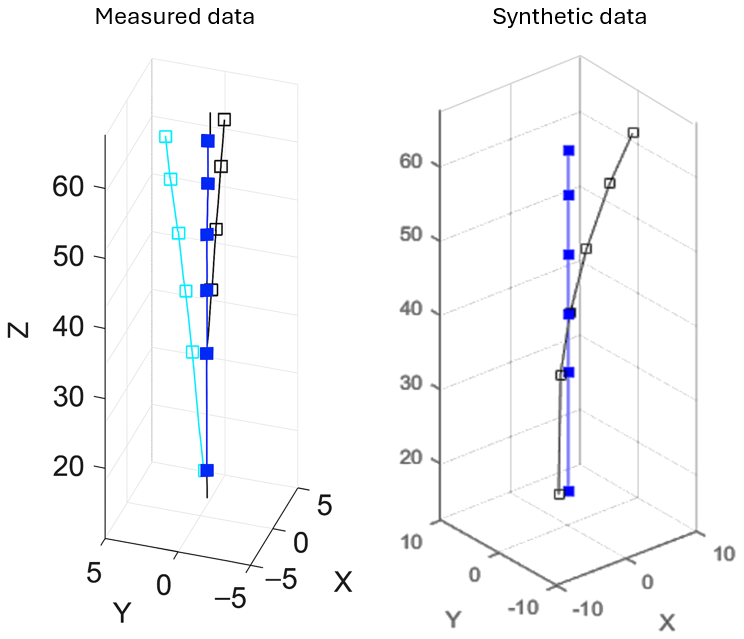
Figure 10Both figures show the first tower mode. The left figure shows the measured response in the FA and SS directions, while the right figure shows only the FA direction estimated from OpenFAST acceleration output.
Considering the peak verification, the tuned model accurately captures the first tower mode at 0.69 Hz and the harmonics due to the rotor rotation, namely the 3P and 6P at 0.83 and 1.66 Hz, respectively. The model was less accurate in the low-frequency range (0 to 0.05 Hz), likely because second-order hydrodynamic forces were not included in this analysis.
In the fore–aft direction (left images in Fig. 9), the simulation response exhibited either higher or lower amplitudes than the measured data across the analyzed frequency range. This discrepancy may arise from multiple sources, including uncertainties in sensor position and orientation, and the sensor localization within the numerical model relative to the tower discretization.
As a result of the tuning process, although the dynamic response of the model became closer to the measured data, the global tower stiffness was modified, impacting the overall system behavior. Moreover, the obtained values were considerably low, indicating a substantial reduction in tower rigidity. According to the OpenFAST forum, these tower stiffness tuners are recommended only for small adjustments, with values not smaller than 0.9. Changes in system stiffness generally manifest most clearly in the low-frequency region of the response spectrum. To illustrate this, Fig. 11 presents the middle panel of Fig. 9 using a logarithmic frequency axis. Comparing the original (pink) and tuned (blue) simulation responses reveals noticeable differences below 0.01 Hz, corresponding primarily to surge and sway motions.
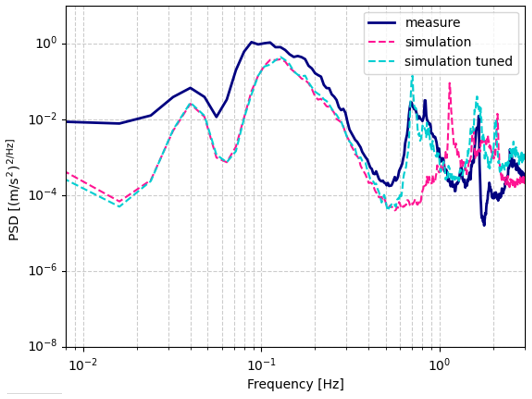
Figure 11Power spectral density of the side-to-side dynamic response of sensor number 4. Rated condition.
To further examine the influence of the stiffness reduction on higher-frequency content (above 0.6 Hz), tower displacements and moments were analyzed. The upper panel of Fig. 12 shows the fore–aft and side–side tower-top displacements, where the amplitudes increase as expected due to the reduced stiffness.
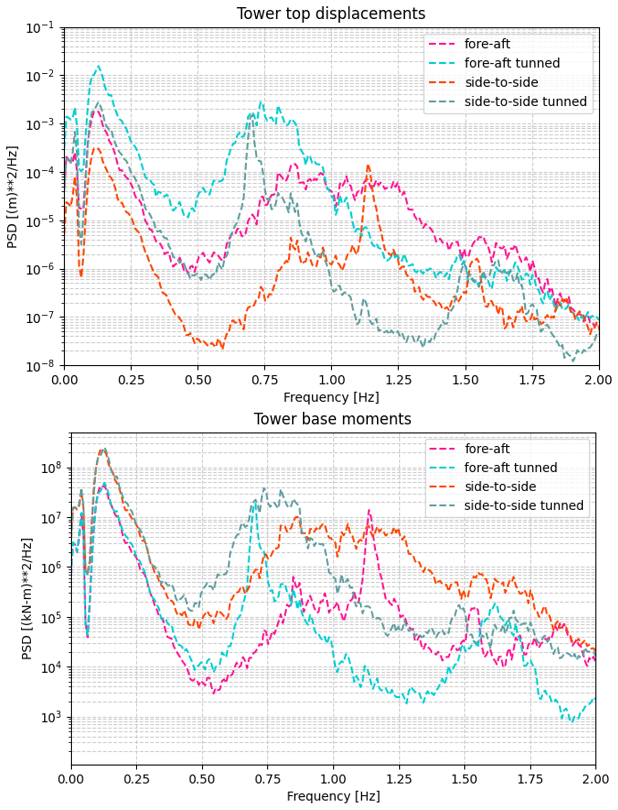
Figure 12Power spectral density of the tower-top displacements (upper image) and the tower-base moment (lower image).
In contrast, the lower panel of Fig. 12 indicates that the tower-base bending moments within the wave-excitation frequency range (0–0.5 Hz) were mildly affected by the global stiffness reduction.
This study investigates the effects of the rigid-floater assumption, the hydrodynamic added mass, and the blade flexibility on the global dynamic response of the 2.3 MW spar-type floating wind turbine Zefyros. In conventional wind turbine structural analyses, it is common to model the floater as a rigid body. However, as wind turbines increase in size to capture more energy, this rigid-floater assumption becomes progressively less valid.
It was demonstrated that floater flexibility has a substantial impact on the tower modes, with errors reaching up to 65 % when compared to measured modal data.
Hydro-servo-aero-elastic simulation tools can incorporate floater flexibility using a Morison hydrodynamic model. When employing potential-flow hydrodynamic models, modern simulation tools are increasingly integrating functionalities to couple distributed hydrodynamic databases with mechanical beam-element representations of the floater.
When it is not possible to implement a flexible floater in the Hydro-servo-aero-elastic model due to software restrictions, it is generally feasible to modify the tower/floater boundary condition and calibrate the tower's eigenfrequencies by adding a massless beam with a well-chosen length and stiffness between the tower and floater. In OpenFAST, one possible solution is adjusting the global tower stiffness factors to properly fit the spectral response to the measured one. We do not recommend using this solution as it modifies the tower's mechanical model itself. However, we implemented it in our case due to limitations of the older OpenFAST version. We observed that this adjustment successfully aligned the tower eigenfrequencies in the time-domain simulations. It had a minimal impact on the low-frequency content of the dynamic response (0–0.01 Hz) but led to increased tower-top displacements, reflecting the effectively reduced tower rigidity. In contrast, the modification had only a minor effect on the tower-base bending moments.
Data can be made available upon request, in alignment with the contractual description of the DIONYSOS project https://www.france-energies-marines.org/en/projects/dionysos/ (last access: January 2026).
CA: methodology, software, validation, formal analysis, investigations, writing – original draft, writing – review and editing, visualization. RR: methodology, software, investigations, writing – original draft, writing – review and editing, project administration. JDL: methodology, software, writing – original draft. AH: methodology, software, writing – original draft.
The contact author has declared that none of the authors has any competing interests.
Publisher's note: Copernicus Publications remains neutral with regard to jurisdictional claims made in the text, published maps, institutional affiliations, or any other geographical representation in this paper. The authors bear the ultimate responsibility for providing appropriate place names. Views expressed in the text are those of the authors and do not necessarily reflect the views of the publisher.
This paper was edited by Erin Bachynski-Polić and reviewed by three anonymous referees.
Abbas, N. J., Zalkind, D. S., Pao, L., and Wright, A.: A reference open-source controller for fixed and floating offshore wind turbines, Wind Energ. Sci., 7, 53–73, https://doi.org/10.5194/wes-7-53-2022, 2022. a
Akiba, T., Sano, S., Yanase, T., Ohta, T., and Koyama, M.: Optuna: A Next-Generation Hyperparameter Optimization Framework, GitHub [code], https://github.com/optuna/optuna (last acces: December 2025), 2019. a
Borg, M., Hansen A., and Bredmose, H.: Floating substructure flexibility of large-volume 10MW offshore wind turbine platforms in dynamic calculations, J. Phys., 753, https://doi.org/10.1088/1742-6596/753/8/082024, 2016. a, b
Bureau Veritas: Classification and certification of floating offshore wind turbines (NI 572 DT R01 E), https://questfwe.com/wp-content/uploads/2018/06/Veristar.-Classification-of-offshore-floating-turbines.pdf (last access: 17 April 2026), 2015. a
Cheng, Z., Wang, K., Gao, Z., and Moan, T.: Comparative study of spar type floating horizontal and vertical axis wind turbines subjected to constant winds, Proceedings of EWEA Offshore, https://www.researchgate.net/publication/281459433_Comparative_study_of_spar_type_floating_horizontal_and_vertical_axis_wind_turbines_subjected_to_constant_winds (last access: 17 April 2026), 2015. a
Curfs, C. P. M.: Dynamic behaviour of floating wind turbines – A comparison of open water and level ice conditions, MS, Delft University of Technology, https://repository.tudelft.nl/record/uuid:f339482a-8e0d-4827-85af-c8cf05b4260f (last access: Decemeber 2026), 2015. a
De Lauzon, J.: Coupled eigen-frequency analysis of floating wind turbines, Webinar DIONYSOS project, https://www.youtube.com/watch?v=Z0Q6nCxkRqE&list=PLk6pEgFE9zTmIer0hLQFmNlKEcq4rSHVI&index=3 (last access: 17 April 2026), 2024. a
Det Norske Veritas (DNV-GL): DNV-RP-0286 Coupled analysis of floating wind turbines, https://www.dnv.com/energy/standards-guidelines/dnv-rp-0286-coupled-analysis-of-floating-wind-turbines/ (last access: December 2025), 2019. a
European Commission: Summary of the Commission assessment of the draft National Energy and Climate Plan 2021–2030, https://energy.ec.europa.eu/system/files/2019-06/necp_factsheet_fr_final_0.pdf (last access: December 2025), 2019. a
Ghalishooyan, M. and Shooshtari, A.: Operational modal analysis techniques and their theoretical and practical aspects: A comprehensive review and introduction, IOMAC, Guijon – Spain, 12–14 May 2015, https://www.researchgate.net/publication/281786721_Operational_modal_analysis_techniques_and_their_theoretical_and_practical_aspects_A_comprehensive_review_and_introduction#fullTextFileContent (last access: 17 April 2026), 2015. a
Godø, S. N.: Dynamic Response of Floating Wind Turbines, MS, 136, Norwegian University of Science and Technology, https://ntnuopen.ntnu.no/ntnu-xmlui/bitstream/handle/11250/2400722/9091_COVER.pdf (last access: 17 April 2026), 2013. a
Guignier, L., Courbois A., Mariani, R., and Choisnet, T.: Multibody Modelling of Floating Offshore Wind Turbine Foundation for Global Loads Analysis, International Ocean and Polar Engineering Conference, https://www.bw-ideol.com/sites/default/files/inline-files/16tpc-0701.pdf (last access: 17 April 2026), 2016. a, b
Hall, M.: MoorDyn user's guide, University of Maine: Orono, ME, USA, http://www.matt-hall.ca/files/MoorDyn Users Guide 2015-12-15.pdf (last access: 17 April 2026), 2015. a
Hall, M.: Moordyn v2: New capabilities in mooring system components and load cases, International Conference on Offshore Mechanics and Arctic Engineering, https://doi.org/10.1115/OMAE2020-19341, 2020. a
Haoran L., Gao, Z., Bachynski-Polić, E., Zhao Y., and Fiskvik, S.: Effect of floater flexibility on global dynamic responses of a 15-MW semi-submersible floating wind turbine, Ocean Eng., 286, https://doi.org/10.1016/j.oceaneng.2023.115584, 2023. a, b
Homb, H. R.: Fatigue Analysis of Mooring Lines on the Floating Wind Turbine Hywind Demo, MS, Norwegian University of Science and Technology, https://nva.sikt.no/registration/0198e7943457-cf8578c4-4439-490b-80b5-3eb6db10c5f5 (last acces: 17 April 2026), 2013. a
IRENA: World Energy Transitions Outlook 2023: 1.5 °C Pathway, https://www.irena.org/Publications/2023/Jun/World-Energy-Transitions-Outlook-2023 (last access: March 2026), 2023. a, b
Johnson, N., Jonkman, J., Wright, A., Hayman, G., and Robertson, A.: Verification of floating offshore wind linearization functionality in OpenFAST, J. Phys., 1356, https://doi.org/10.1088/1742-6596/1356/1/012022, 2019. a
Jonkman, J.: TurbSim User's Guide v2.00.00, https://openfast.readthedocs.io/en/dev/_downloads/cb14d3e2d3533d76e405d730fea19846/TurbSim_v2.00.pdf (last access: March 2026), 2016. a
Jonkman, J. and Buhl, M.: FAST user's guide, https://docs.nrel.gov/docs/fy06osti/38230.pdf (last access: March 2026), 2005. a
Jonkman, J. M., Robertson, A. N., and Hayman, G. J.: HydroDyn user's guide and theory manual, NREL, Vol. 610, https://www.nlr.gov/docs/libraries/wind-docs/hydrodyn_manual-pdf.pdf?sfvrsn=9783c0da_1 (last acces: 17 April 2026), 2014. a
Luan, C., Hao, Z., and Moan, T.: Development and verification of a time-domain approach for determining forces and moments in structural components of floaters with an application to floating wind turbines, Mar. Struct., 51, 87–109, https://doi.org/10.1016/j.marstruc.2016.10.002, 2017. a, b
Leroy, V., Bachynski-Polić, E., Babarit, A., Ferrant, P., and Gilloteaux, J.-C.: A weak-scatterer potential flow theory-based model for the hydroelastic analysis of offshore wind turbine substructures, Ocean Eng., 238, https://doi.org/10.1016/j.oceaneng.2021.109702, 2021. a
Malenica, Š., Tuitman, J., Bigot, F., and Sireta, F. X.: Some aspects of 3D linear hydroelastic models of springing, https://www.academia.edu/download/93194796/3671.1.ICHD08-BIGOT.pdf (last acces: 17 April 2026), 2008. a
Malenica, Š., Derbanne, Q., Sireta, F., Bigot, F., Tiphine, E., De Hauteclocque, G., and Chen, X.: HOMER–Integrated hydro-structure interactions tool for naval and offshore applications, https://marine-offshore.bureauveritas.com/sites/g/files/zypfnx136/files/pdf/Homer, Integrated hydro-structure.pdf (last acces: 17 April 2026), 2013. a
Masjedian, M. H. and Keshmiri, M.: A review on operational modal analysis researches: Classification of methods and applications, https://www.researchgate.net/publication/288594713_A_review_on_operational_modal_analysis_researches_Classification_of_methods_and_applications (last acces: 17 April 2026), 2009. a
Molin, B.: Offshore structure hydrodynamics, Cambridge University Press, https://books.google.com/books?hl=en&lr=&id=rO6hEAAAQBAJ&oi=fnd&pg=PP1&dq=Offshore+structure+hydrodynamics&ots=UXofpJ0qyD&sig=uu7zRtgO8JvI92IgGTw9xU2ZyV0 (last access: March 2026), 2023. a
Oliveira, G., Magalhães, F., Cunha, A., and Caetano, E.: Continuous dynamic monitoring of an onshore wind turbine, Eng. Struct., 164, 22–39, https://doi.org/10.1016/j.engstruct.2018.02.030, 2018. a
Pastor, M., Binda, M., and Harčarik, T.: Modal Assurance Criterion, 48, 543–548, https://doi.org/10.1016/j.proeng.2012.09.551, 2012. a
Ran, X., Leroy, V., and Bachynski-Polić, E.: Hydroelastic response of a flexible spar floating wind turbine: Numerical modelling and validation, Ocean Eng., 286, 115635, https://doi.org/10.1016/j.oceaneng.2023.115635, 2023. a, b
Ribault, R.: Simulation Optimisation Parameters Package (Version 1.0), GitLab [code], https://gitlab.france-energies-marines.org/Romain/simuoptuna (last acces: 17 April 2026), 2024. a, b
Skaare, B., Hanson, T., Nielsen, F., Yttervik, R., Hansen, A., Thomsen, K., and Larsen, T.: Integrated dynamic analysis of floating offshore wind turbines, 3, 1929–1939, https://www.academia.edu/download/86922162/00b7d528b46c256d79000000.pdf (last acces: 17 April 2026), 2007. a
Skaare, B., Nielsen, F., Hanson, T., Yttervik, R., Havmøller, O., and Rekdal, A.: Analysis of measurements and simulations from the Hywind Demo floating wind turbine, Wind Energy, 18, 1105–1122, https://doi.org/10.1002/we.1750, 2014. a
Thomsen, J., Bergua, R., Jonkman, J., Robertson, A., Mendoza, N., Brown, C., Galinos, C., and Stiesdal, H.: Modeling the TetraSpar Floating Offshore Wind Turbine Foundation as a Flexible Structure in OrcaFlex and OpenFAST, Energies, 14, 7866, https://doi.org/10.3390/en14237866, 2012. a
UNITECH: Dynamic cables for offshore wind farms, https://www.techtransfer.no/en/renewable-energy/unitech/ (last access: December 2025), 2022. a
van Vondelen, A. A. W., Navalkar, S. T., Iliopoulos, A., van der Hoek, D. C., and van Wingerden, J.-W.: Damping identification of offshore wind turbines using operational modal analysis: a review, Wind Energ. Sci., 7, 161–184, https://doi.org/10.5194/wes-7-161-2022, 2022. a
WindEurope: floating-offshore-wind-factsheet, https://windeurope.org/data/products/floating-offshore-wind-factsheet/ (last acces: 17 April 2026), 2020. a
Xu, K., Zhang, M., Shao, Y., Gao, Z., and Moan, T.: Effect of wave nonlinearity on fatigue damage and extreme responses of a semi-submersible floating wind turbine, Appl. Ocean Res., 91, https://doi.org/10.1016/j.apor.2019.101879, 2019. a
Zhang, L., Shi, W., Karimirad, M., Michailides, C., Jiang, Z.: Second-order hydrodynamic effects on the response of three semisubmersible floating offshore wind turbines, Ocean Eng., 207, https://doi.org/10.1016/j.oceaneng.2020.107371, 2020. a