
the Creative Commons Attribution 4.0 License.
the Creative Commons Attribution 4.0 License.
 | 20 May 2026
Experimental investigation of the effects of floating wind turbine motion on a downstream turbine performance and loads
Alessandro Fontanella
Stefano Cioni
Francesco Papi
Sara Muggiasca
Alessandro Bianchini
Marco Belloli
This study investigates how the motion of a floating wind turbine affects the aerodynamic performance and dynamic loading of a downstream turbine operating in its wake. Wind tunnel experiments were conducted using a two-turbine setup, where the upstream turbine was subjected to controlled platform motions (both sinusoidal and wave driven), while the downstream turbine remained fixed and was tested in multiple relative positions. Results show that large-amplitude, low-frequency sinusoidal motions of the upstream turbine, especially in crosswind and yaw directions, can increase the power output of the downstream turbine under low-turbulence conditions and at short turbine spacing (3–5 rotor diameters). The largest relative gain reached 26 % over the fixed case, although the absolute increase remained moderate because the highly persistent wake, driven by low turbulence and strong thrust of the upstream turbine, resulted in very low baseline power of the downstream turbine. The gains obtained under idealized sinusoidal motions were replicated in cases with realistic wave-driven motions when wind and waves were aligned but not when wind–wave misalignment introduced crosswind movements of the upstream wind turbine. In parallel, motion of the upstream turbine increased the dynamic loading on the waked turbine. Load increments varied with turbine spacing and alignment, and were more pronounced in sinusoidal motion cases than with wave-induced motions, which also produced increased dynamic loading but with smaller amplitudes. The loads resulting from wave-induced motions exhibited a broad spectral distribution, consistent with the wide frequency content of the wave excitation. Overall, these findings underscore the fact that platform-induced wake dynamics are not a secondary effect but a key driver of wake recovery, downstream turbine performance, and dynamic loading, and must be considered in the design and operation of floating wind farms.
- Article
(7236 KB) - Full-text XML
- BibTeX
- EndNote


The deployment of floating offshore wind farms is a key strategy to harness wind energy in deep-water regions where bottom-fixed turbines are not feasible. While the floating wind technology enables access to abundant yet untapped wind resources, it also introduces additional complexities, especially regarding system dynamics due to the large motions of platforms and their influence on the wind turbine aerodynamic response. In particular, the aerodynamic interactions between wind turbines through wakes, which is already a critical factor in bottom-fixed wind farms, become even more complex in floating wind farms, as the aforementioned large platform motions lead to more unsteady and irregular wake flows. These wake effects alter power generation, fatigue loading, and control requirements at the turbine and plant levels. Despite their importance, they remain poorly understood (Meyers et al., 2022). One reason for the limited understanding of aerodynamic interactions in floating wind farms is the lack of wake and performance data from operational plants. In fact, to date, only a few floating wind farms have been constructed, each comprising a small number of turbines (Chitteth Ramachandran et al., 2022).
The motion of a floating wind turbine under environmental forcing is characterized by two distinct frequency ranges. Motions at different frequencies are known to produce different aerodynamic responses (Schulz et al., 2024, 2025), thus the frequency content of the motion is an important factor, as it can significantly influence wake development. Ocean waves typically excite the platform at frequencies between 0.05 and 0.2 Hz; the tower-top motion amplitude resulting from this forcing depends on both platform characteristics and sea state. At lower frequencies, the platform eigenmodes are excited by wind turbulence and wave forcing, which may induce a response through nonlinear effects. These lower-frequency motions can lead to response amplitudes substantially larger than those in the wave-frequency range; the amplitude of this response is again influenced by platform characteristics, wind, and sea state. Considering both frequency ranges, the realistic range for rotor-reduced frequencies (the ratio of the product of frequency and rotor diameter to wind speed) spans from slightly less than 1 to 10 (Schulz et al., 2025).
Most available studies focus on the wake behavior of individual floating turbines and do not address how turbines interact through wakes in a full wind farm. A recent study by Angelou et al. (2023) examined the far wake of a 6 MW floating wind turbine in the Hywind Scotland offshore wind farm, the world's first floating wind farm, using LiDAR measurements. The findings indicate that, under mild wave excitation causing small-amplitude platform motions, the wakes of floating turbines have time-averaged characteristics similar to those of bottom-fixed turbines. Under these conditions, atmospheric turbulence was identified as the dominant mechanism for wake recovery, with platform motion having a negligible effect. However, the investigation focused on conditions in which the turbine operated outside the wake of upstream units, and therefore did not address the impact of upstream wakes on turbine performance within the array.
The impact of platform motions on the wake behavior of floating wind turbines has been extensively investigated through wind tunnel experiments, which offer controlled and repeatable conditions ideal for isolating aerodynamic phenomena. Most of these studies have used model-scale wind turbines in a low-turbulence inflow, subjecting them to sinusoidal motions, typically prescribed in 1 degree of freedom at a time. The investigated motions generally had relatively large amplitudes and low frequencies, with reduced frequencies of up to 1.5. This range is representative of both the eigenmode responses of floating wind turbines and the lower end of the wave-frequency spectrum. The amplitudes were selected to create tower-top motions ranging from 2 % to 10 % of the rotor diameter.
The experiment of Bayati et al. (2017a) analyzed the effect of surge motion on the near wake of a 1:75-scale model of the DTU 10 MW wind turbine (Bak et al., 2013), demonstrating that platform motion introduces wind speed fluctuations in the wake. Building on this, Fontanella et al. (2022b) explored additional surge motion conditions and showed how motion affects the formation and evolution of tip vortices near the rotor. In a later study, Fontanella et al. (2022a) investigated the near wake of a 1:100-scale model of the IEA 15 MW reference turbine (Gaertner et al., 2020) under platform motions in along-wind and crosswind directions; the results indicated that all motion types induced velocity fluctuations in the wake, although mean velocity in the near wake was slightly reduced compared to the fixed-turbine case. Messmer et al. (2024a) further examined wake behavior under harmonic surge and sway motions in laminar inflow conditions. The study found that sway motion enhances lateral meandering, while surge motion induces wake pulsation; both contribute to improved mixing and recovery of the far wake. In a follow-up study, Messmer et al. (2024b) assessed the effect of surge motion under inflow turbulence intensities up to 3 %, showing that increased turbulence significantly diminishes the influence of platform motion on the far-wake recovery.
A notable exception to the wind tunnel studies that focused on individual turbines is presented in the work of Bossuyt et al. (2023), which investigated a 1:400-scale floating wind farm with 12 turbines in a wind–water tunnel under a sheared inflow with 10 % turbulence intensity and wave excitation. Despite the challenges of simultaneously scaling aerodynamics and hydrodynamics, the study revealed clear differences in wake recovery linked to periodic rotor motions: wave-induced yaw and pitch led to synchronized vertical wake oscillations that enhanced recovery but also increased turbulence levels, potentially affecting the unsteady loading on downstream turbines.
Taken together, these experiments consistently demonstrate that large rotor motions influence wake development, generating flow structures with the same periodicity as the platform motion. These dynamic features, primarily seen as pulsations in velocity and increased lateral meandering, are absent in wakes of bottom-fixed turbines. Under nearly laminar conditions, these wake dynamics can enhance recovery, but their effect becomes negligible as inflow turbulence increases. At low but realistic turbulence intensities, platform motions still generate coherent periodic structures, but they do not lead to substantial improvements in wake recovery.
The limited availability of experimental data has led to diverse modeling approaches for floating wind farms, often yielding scattered results. Carmo et al. (2024) used FAST.Farm, which neglects dynamic wake effects due to platform motion, modeling only the wake vertical deflection due to average rotor inclination. This simplification was deemed acceptable under typical turbulence conditions, where wake pulsing effects are expected to be minimal. In contrast, Ramos-García et al. (2022) used a vortex-multibody solver to show that platform motions in an upstream turbine enhance wake breakdown, increasing power and thrust in downstream turbines, while this effect diminishes with higher inflow turbulence. Simulations with prescribed surge and pitch motions confirmed that platform dynamics significantly affect wake behavior and the loading of downstream turbines, especially deeper in the array where resonant interactions may occur.
A number of numerical studies using computational fluid dynamics (CFD) has investigated wake behavior in floating wind turbines, often focusing on isolated machines (Micallef and Rezaeiha, 2021). Moving toward farm-scale interactions, Arabgolarcheh et al. (2023) used unsteady Reynolds-averaged Navier–Stokes (URANS) simulations to examine the effect of prescribed surge motion on two aligned floating wind turbines. Although the mean thrust and power output of the upstream rotor were nearly unchanged between the fixed and surging scenarios, the motion-generated periodic wake structures increased the dynamic loading on the downstream turbine. Li et al. (2025) used large-eddy simulations (LESs) to investigate wake interactions between two surging NREL 5 MW wind turbines (Jonkman et al., 2009), considering a motion amplitude of 3 % of the rotor diameter and a frequency of 0.1 Hz (reduced frequency of 1.1), representative of typical wave conditions. They found that, under laminar inflow, the power of the downstream turbine increased significantly. However, under inflow with a turbulence intensity of 5.3 %, this gain became negligible. Additional insight into the physical mechanisms governing this behavior has recently been provided by Pagamonci et al. (2025), who conducted LES-based CFD simulations on the same wind tunnel-scale turbine used in the present study. Their results show that, under turbulent inflow, the coherent flow structures induced by platform motion dissipate more rapidly than in laminar conditions, thereby reducing the associated gains in wake recovery.
Although CFD studies provide valuable insights into wake dynamics and turbine interactions, their results often vary due to differences in turbulence modeling, inflow conditions, and domain size. This variability limits their reliability in predicting wake effects in realistic floating farm configurations. This motivates the need for controlled experimental data, which can serve both to understand key physical mechanisms and to validate or calibrate numerical tools.
Through wind tunnel experiments, this study investigates how wakes generated by floating wind turbines affect the dynamic loading and power output of a downstream turbine operating in their wake. Building on previous numerical and experimental studies that suggested such effects are possible, the present work aims to quantify and characterize them under controlled experimental conditions. Specifically, it seeks to address the following questions:
-
To what extent, and under which conditions, do the unsteady flow disturbances induced by platform motion propagate downstream and influence the load response of a waked turbine?
-
How much, and under which conditions, can a turbine operating in the wake of a moving upstream rotor extract more power than one operating behind a bottom-fixed turbine?
The experiment and its results are presented in the following sections. Section 2 describes the methodology of the study, including the experimental setup, the operating conditions of the wind turbines, and the platform motions. Section 3 presents and analyzes the experimental results. In Sect. 4, these results are discussed, with the aim of evaluating their relevance and applicability to the design and operation of floating wind farms. This discussion also considers the limitations and simplifications inherent to the experimental setup. Finally, Sect. 5 summarizes the main findings of the study and outlines the conclusions.
The experimental campaign was conducted in the atmospheric boundary layer test section of the Politecnico di Milano wind tunnel, which is 13.84 m wide by 3.84 m high by 35 m long and used two wind turbines (WTs) that are 1:75-scale models of the DTU 10 MW reference wind turbine (Bak et al., 2013). In the experiment, the flow speed was scaled by a factor of 1:3 compared to a full-scale environment. The time scaling in the experiment was determined by the geometric and velocity scales, resulting in a time scale ratio of 1:25. Consequently, the wind farm response in the experiment occurred 25 times faster than at full scale.
In the experiment, only the upstream turbine (WT1) was subjected to platform motions representative of a floating wind turbine, while the downstream turbine (WT2) was fixed at the tower base. This approach avoids introducing additional variables that could make it more difficult to identify the specific influence of the upstream turbine dynamics on the downstream turbine response. Similar methodologies have been employed in previous wind tunnel studies on wake interactions, particularly in active wake control research, where only the most upstream turbine is dynamically actuated, and downstream turbines are operated with fixed settings (Van Der Hoek et al., 2024a, b). Once the effects of upstream rotor motion are well understood, the analysis can be extended to more realistic scenarios that also include the motion of the downstream turbine.
The experiment with two turbines followed the one of Fontanella et al. (2025b), which was performed in the same wind tunnel using the same wind turbine and robotic platform, and measured the wake of the upstream wind turbine at the locations where WT2 was placed in the current experiment. Hence, the inflow caused by the wake of WT1 on WT2 is precisely known because it has been already characterized.
2.1 Experimental setup
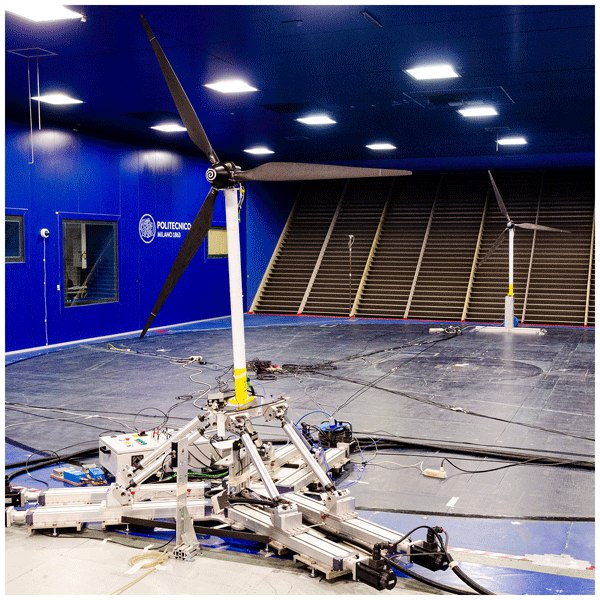
The experimental setup is shown in Fig. 1. The upstream wind turbine was mounted on a 6 degrees-of-freedom robotic platform that mimics the rigid-body motions of floating foundations. The downstream wind turbine was mounted on a rigid support structure connecting the tower base to the wind tunnel floor.
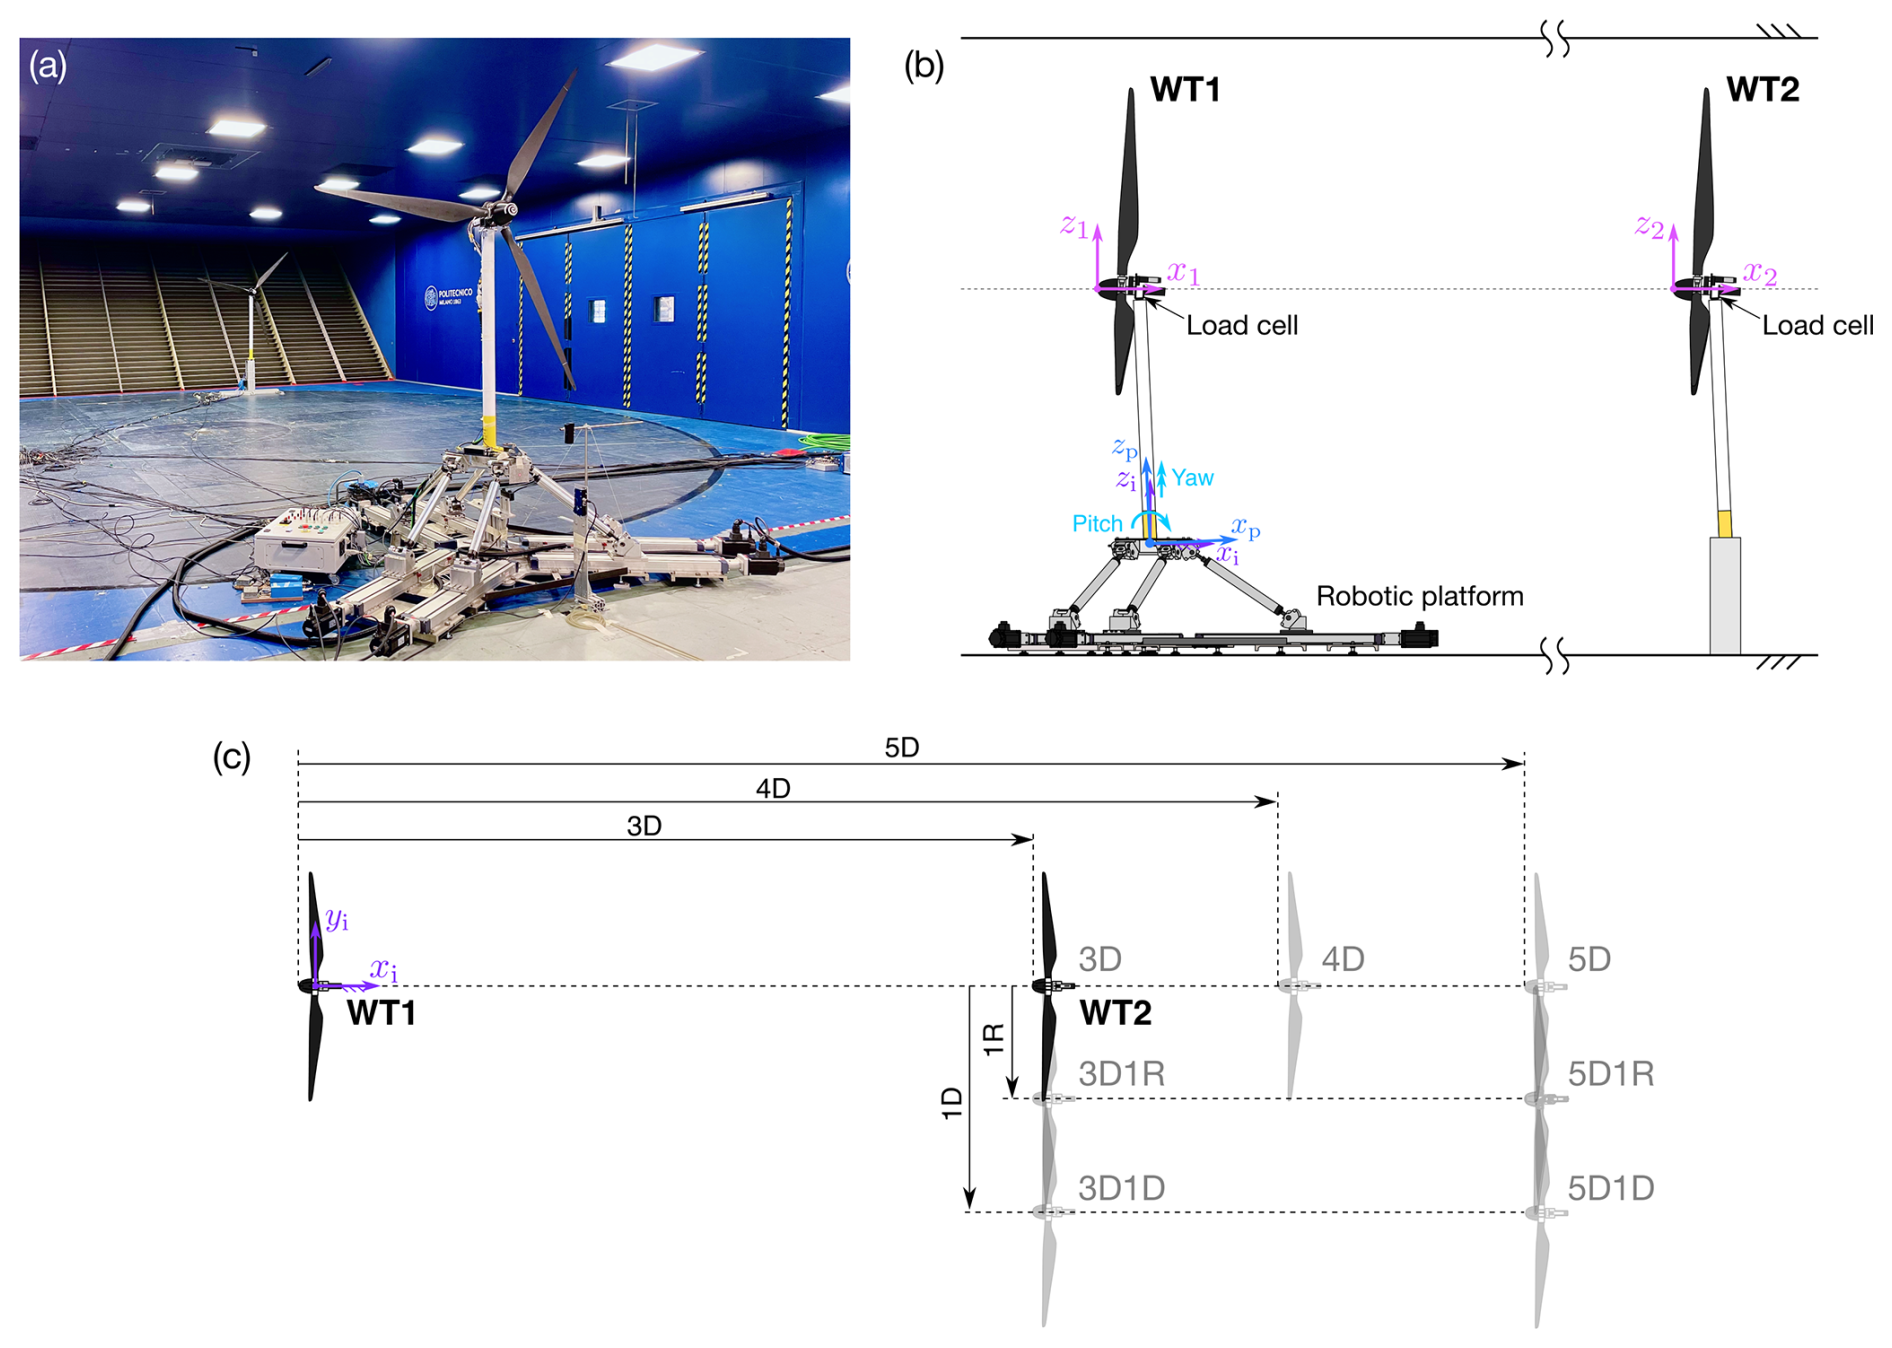
Figure 1Experimental setup. (a) The two wind turbines in the wind tunnel, positioned at a distance of 5 rotor diameters (D), with a lateral offset of 1 radius (R). (b) Schematic representation of the experimental setup with the coordinate systems. (c) Wind farm configurations that were tested.
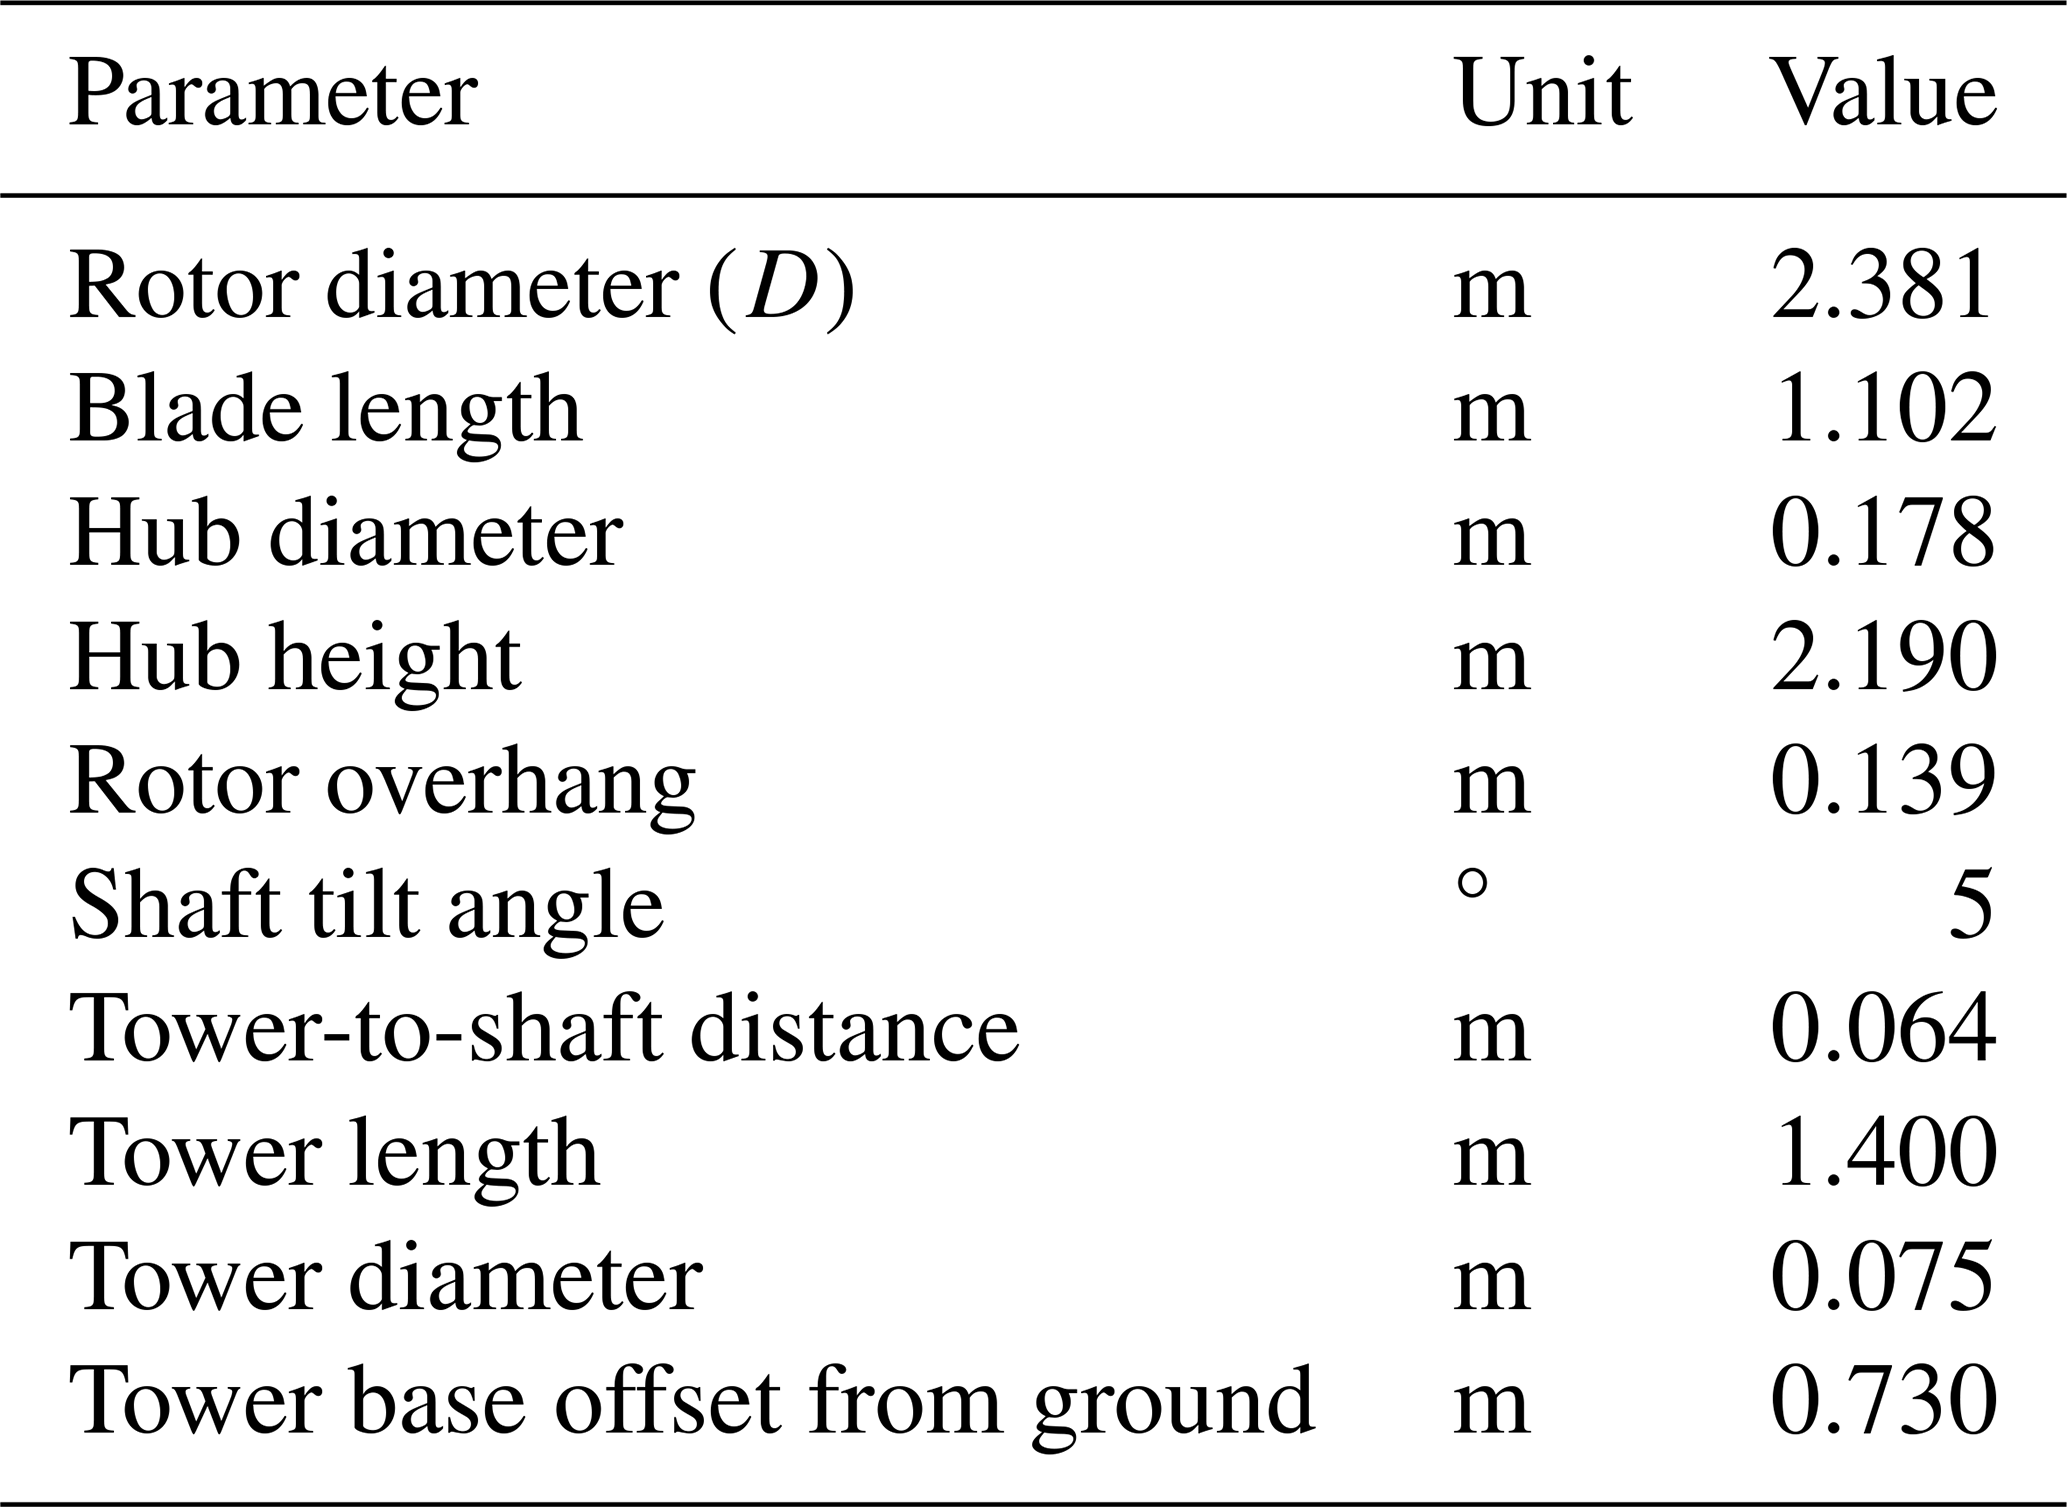
The two wind turbines are identical, and their main geometric parameters are listed in Table 1. Each rotor has a diameter (D) of 2.38 m and was designed at a 1:75 scale with the primary objective of replicating the blade normal load distribution of the DTU 10 MW reference turbine. Matching this distribution ensures that the model reproduces the thrust characteristics of the reference turbine with high accuracy and also leads to a reasonable match in power performance. Due to the reduced wind speed in the wind tunnel, the model operates at chord-based Reynolds numbers between 5 × 10⁴ and 1.5 × 10⁵, well below the 106–107 range of the full-scale turbine. To achieve the target loads under these conditions, the rotor blades were specifically designed for low Reynolds-number operation. The SD7032 airfoil was selected for its favorable aerodynamic characteristics at such conditions: minimal lift sensitivity to Reynolds number for angles of attack below 10°, a linear lift curve, and no nonlinearities in drag (Fontanella et al., 2021). Based on this airfoil choice, the chord and twist distributions were adapted from those of the DTU 10 MW reference turbine (Bayati et al., 2017b). The aerodynamic performance of the resulting rotor is compared with that of the reference turbine in Appendix A.
The wind tunnel test section has a rectangular cross-section. The rotor tips are located 5.7 m from the side walls (corresponding to 2.4D), while the rotor tip is approximately 1 m (0.4D) above the ground and 0.5 m (0.2D) below the wind tunnel ceiling. As a result, the rotor operates in close proximity to the ceiling, which introduces a physical boundary that limits vertical flow development and is not present for full-scale wind turbines operating in the atmospheric boundary layer.
Previous studies conducted in the same wind tunnel using the same turbine geometry (Bergua et al., 2023) showed that the overall aerodynamic performance of the rotor (in terms of thrust and power) is not significantly affected by the proximity of the ceiling. However, the limited vertical clearance may influence wake development. In particular, the presence of the ceiling can restrict the vertical entrainment of high-momentum flow into the wake, a mechanism that plays a dominant role in wake recovery in wind farms (Cal et al., 2010). As a result, wake recovery in the present experiment may rely more strongly on lateral mixing than would be expected under open-field conditions. In addition, the ceiling may constrain vertical wake deflection induced by platform motion. The proximity of this boundary can partially limit the amplitude of upward or downward wake displacement and may introduce asymmetries between upward and downward deflections compared to an unconfined flow case.
The shaft of the wind turbines had a tilt of 5°, matching the full-scale version of the DTU 10 MW. During wind tunnel tests, the towers of the two wind turbines were tilted at a negative angle of 5° to ensure the rotors were orthogonal to the wind tunnel floor and to the incoming flow. This simplification was intended to limit the analysis to axial thrust and torque in scenarios without prescribed platform motion and with the turbine operating in undisturbed flow.
During the experiment, the position of WT2 relative to WT1 was varied to investigate how downstream distance and crosswind offset influence the response of the downstream turbine, as illustrated in Fig. 1. WT2 was placed at downstream distances of 3D, 4D, and 5D along the same line as WT1. The maximum spacing was limited by the dimensions of the wind tunnel test section, which did not permit placing the downstream turbine beyond 5D. While these spacings are shorter than those typically used in commercial wind farms, generally ranging from 6 to 10 rotor diameters (Stevens et al., 2017), they are particularly relevant for experimental investigation, as the dynamic wake behaviors induced by platform motion remain well defined at these distances (Fontanella et al., 2025b; Firpo et al., 2024) and can significantly affect the performance and loading of downstream turbines. Studying these effects at short spacing helps to isolate the impact of wake–motion interactions, providing insight into its fundamental mechanisms before turbulence and wake recovery dominate at larger spacings. Based on our measurements across 3–5D, we assume that, at greater distances, motion-induced effects on power and loading of a downstream turbine will progressively diminish as coherent velocity structures generated by the upstream rotor dissipate due to turbulence development and wake mixing with the free stream. However, under very low inflow turbulence, which can keep the wake more stable and delay the decay of coherent flow structures, such effects may still remain measurable.
For the 3D and 5D configurations, WT2 was also shifted laterally in the negative y direction by either 1R or 1D, where R is the rotor radius. When offset by 1R, approximately half of the WT2 rotor is immersed in the wake of WT1; with a 1D offset, most of the rotor operates in free-stream flow, with only a small portion affected by the wake.
2.1.1 Wind turbine measurements
The WT1 platform position was measured using Wenglor PNBC107 laser transducers, with signals recorded at a sampling frequency of 2 kHz. The rotor forces of both wind turbines were measured using six-component ATI Mini45 force transducers (SI-580-20 calibration) mounted at the top of each tower, with data acquired at the same 2 kHz sampling rate.
For WT1, the recorded loads also include inertial and gravitational contributions of the rotor–nacelle assembly induced by platform motion. These contributions were removed following the method described by Fontanella et al. (2022a). A two-test subtraction procedure was adopted: for each motion case, two tests with identical prescribed platform motion were performed: (i) a no-wind, rotor-locked test and (ii) a wind-on, rotor-spinning test. The six-component tower-top signals from both tests were windowed to include the same integer number of motion periods and subsequently subtracted (wind-on minus no-wind). This procedure removes inertial and gravitational loads associated with the rigid-body motion of the wind turbine, under the assumption that the structure behaves rigidly and that the structural response is identical in both tests. The accuracy of the subtraction procedure was quantified through dedicated no-wind repeat tests and repeated wind-on measurements. The resulting uncertainty estimates are reported in Appendix B.
After this post-processing, the resulting force signals are expressed in the respective hub reference frames: for WT1 and for WT2. The final signals contain approximately 100 full cycles of platform motion, ensuring robust statistical convergence of the quasi-periodic aerodynamic response due to platform motion.
The recorded loads of both WT1 and WT2 also include centrifugal contributions associated with rotor rotation. These loads arise primarily from rotor mass imbalance and manifest at the blade-passing frequency – 4 Hz for WT1 and between 2.2 and 3.8 Hz for WT2, depending on the farm configuration (see Table 2) – as well as at its higher harmonics. Since centrifugal loads arise only when the rotor is spinning, they are not eliminated by the subtraction procedure applied to WT1.
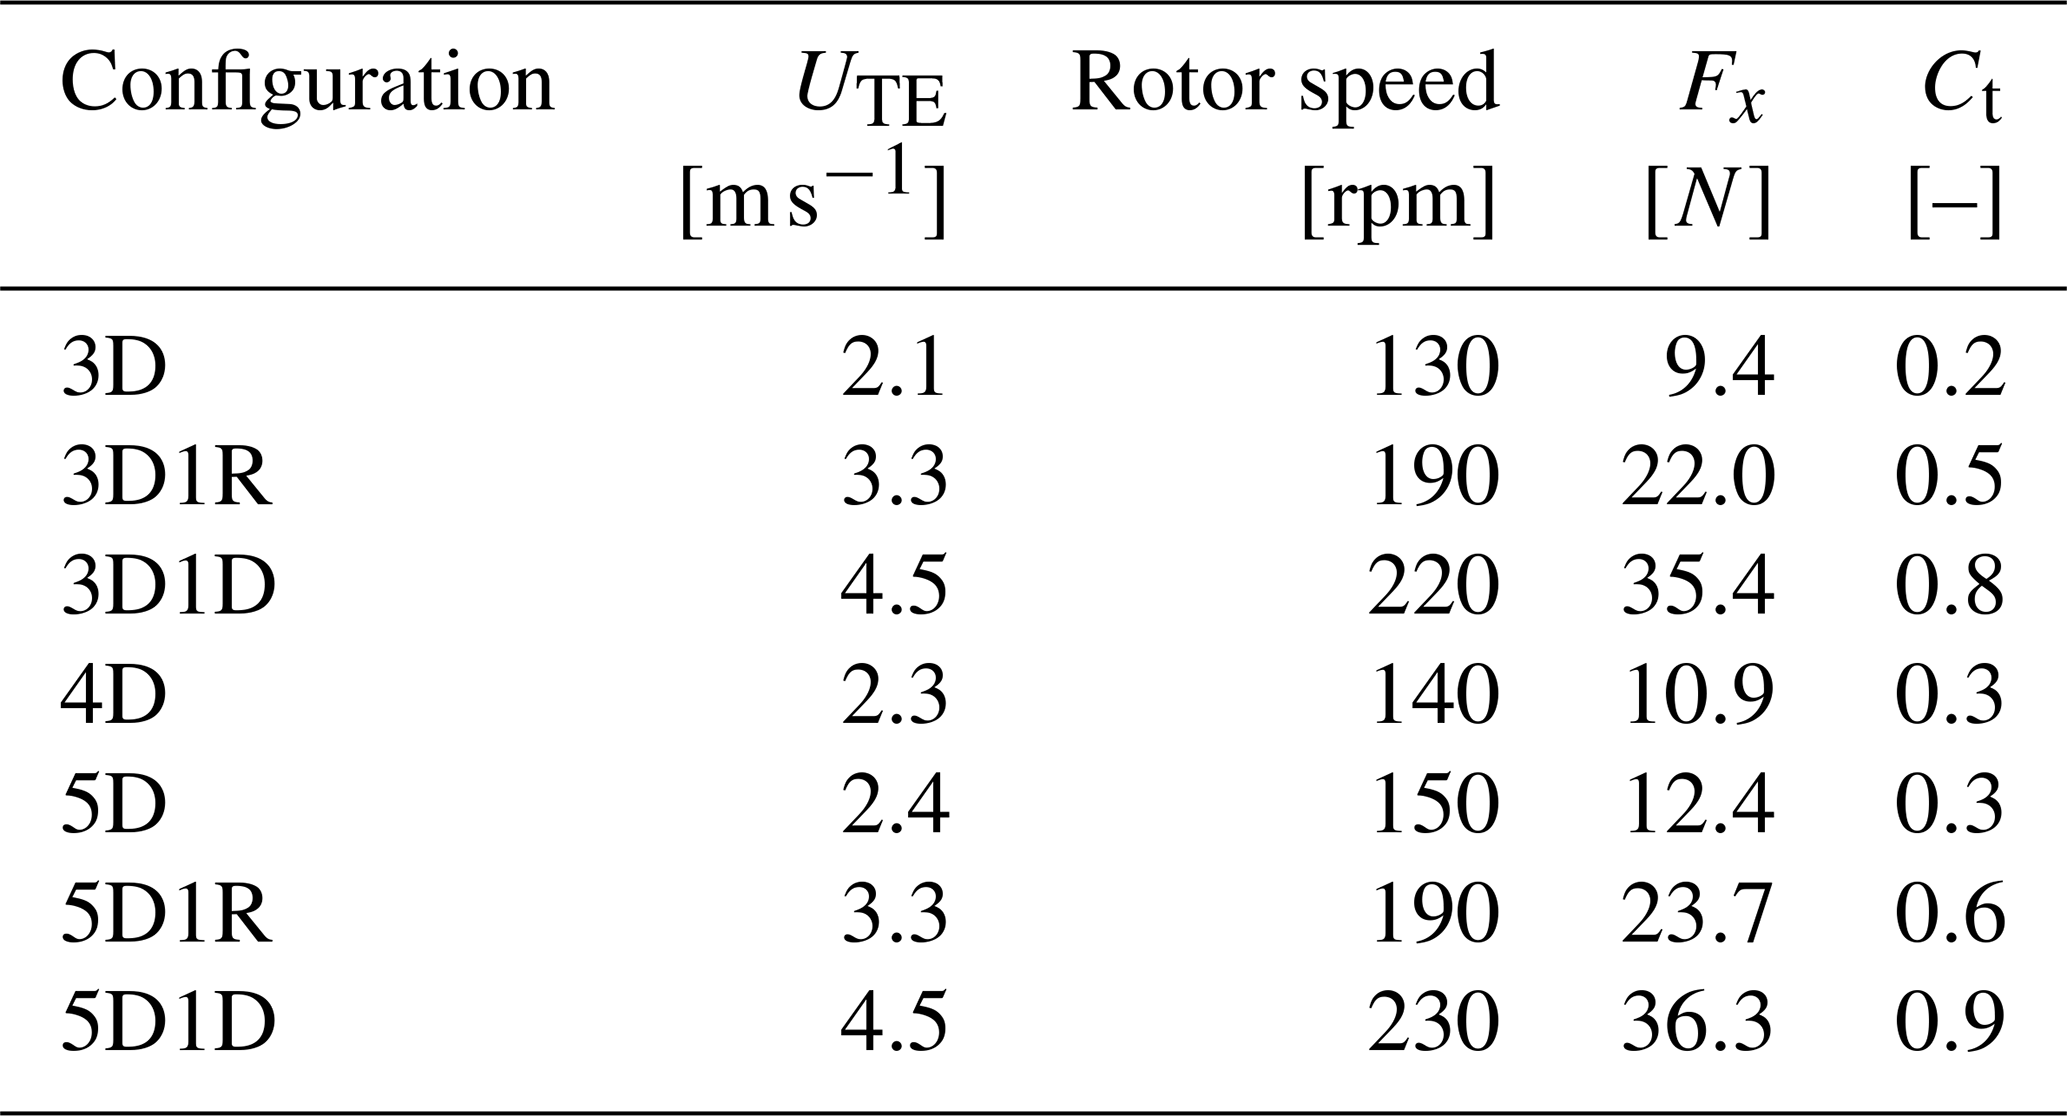
Table 2Thrust-equivalent wind speed (UTE), rotor speed, thrust (Fx), and thrust coefficient (Ct) of the downstream wind turbine in the different wind farm configurations tested in the experiment.
2.1.2 Wake velocity measurements
Wake velocities reported in this paper were obtained using hot-wire anemometry. Measurements of the streamwise velocity in the turbine wake were performed in a prior experimental campaign using a single hot-wire anemometer capable of measuring both mean and fluctuating components of one-dimensional flow (Fontanella et al., 2025b). The probe was mounted on an automated traversing system, enabling measurements in the crosswind (yi–zi) plane.
Velocity measurements were carried out at xi=3D, 4D, and 5D downstream of the rotor, along the hub-centered horizontal (yi axis) and vertical (zi axis) traverses. At each downstream location, the horizontal traverse comprised 35 evenly spaced measurement points, while the vertical traverse included 27 points. The spacing between consecutive measurement positions was 0.1 m (0.04D). For each measurement point, the acquisition time corresponded to 12 platform motion cycles or, in the fixed tower-base cases, to 12 rotor revolution periods of WT1. A preliminary sensitivity study conducted at the beginning of the experimental campaign showed that 12 cycles were sufficient to ensure convergence of the mean velocity, turbulence intensity, and – for the cases with platform motion – of the spectral amplitude at the platform motion frequency.
The hot-wire signals were acquired at a sampling frequency of 10 kHz and subsequently digitally low-pass filtered with a cut-off frequency of 100 Hz to remove high-frequency electrical noise.
To reconstruct phase-averaged spatial velocity fields, the velocity time series acquired at each probe location were recorded simultaneously with the platform motion signal. The signals were then phase aligned by synchronizing them to a common reference point of the motion cycle and conditionally averaged over the 12 cycles. The resulting phase-resolved velocity signals from the different spatial positions were subsequently combined to obtain the reconstructed velocity fields.
2.2 Wind characteristics and turbine operating conditions
2.2.1 Wind tunnel inflow conditions
All the main tests were carried out for a constant free-stream wind speed (U) of 4.0 m s−1, which corresponds to a chord-based Reynolds number of approximately 1 × 10⁵ at blade mid-span. The free-stream wind speed was measured by a pitot tube positioned 3.13D ahead of the wind turbine on the hub axis. An additional measurement at 2.4 m s−1 was also performed to verify the performance of WT2 and is discussed later in the paper. The free-stream flow was approximately uniform across the wind tunnel test section, as demonstrated in a previous study (Fontanella et al., 2025b): the mean velocity over the WT1 rotor area varied by 5 % compared to the hub mean velocity, and the average turbulence intensity across the rotor disk was 1.5 %. Large-eddy simulations of Pagamonci et al. (2025) showed that this relatively low free-stream turbulence contributes significantly to dissipating the coherent flow structures generated by platform motion, limiting the gains in wake recovery compared to the laminar-inflow case, where such gains are higher.
Another pitot system was placed laterally to WT1 at xi=0.8D, yi=2.1D, and zi=1.3D to measure the wind speed influenced by blockage effects induced by the WT1 rotor, recording a wind speed of 4.2 m s−1. The increase in wind speed due to wind tunnel blockage is sufficiently small, and multi-fidelity simulations by Bergua et al. (2023) on the wind turbine used in this study showed that blockage does not significantly alter its aerodynamic behavior. The effect can be accurately introduced in simulations by applying a corrected inflow velocity that reflects the value measured by the lateral pitot system.
Additional measurements performed at the WT2 rotor plane, at hub height, and at a lateral position yi=1.5D showed a mean velocity of 4.3 m s−1. This corresponds to a cumulative flow acceleration attributable to wind tunnel blockage effects of approximately 7 %–8 % relative to the upstream reference velocity U.
During testing, the air density (ρ) was 1.187 kgm−3.
2.2.2 Operating conditions of the upstream turbine
WT1 had a fixed rotor speed of 240 rpm and a collective blade pitch set to the optimal value of 0°. The turbine operated near its rated condition, which corresponds to the peak of the thrust curve under the standard pitch-to-feather control strategy, and therefore produced the strongest wake deficit. In these conditions, the thrust coefficient (calculated by Eq. 6) was Ct=0.9. Because rotor speed was held fixed at 240 rpm, the tip-speed ratio (TSR) varied with the apparent wind created by platform motion. Under the tested conditions, the TSR oscillation amplitude was 5 % of its value observed in the bottom-fixed scenario. This small modulation causes a slight dynamic shift of the operating point, without causing the rotor to enter a substantially different aerodynamic regime (the angle of attack varies by ± 1° at 70 % of the rotor radius, as shown by Fontanella et al., 2021).
2.2.3 Free-inflow characterization and operating conditions of the downstream turbine
The uniformity of the inflow generated by the wind tunnel across the region occupied by the wind farm was verified by measuring the loads on WT2 positioned at 5D downstream under free-stream conditions with WT1 removed from the test chamber, while the robotic platform remained installed on the wind tunnel floor. This configuration, in which the robotic platform remained installed, preserves flow conditions consistent with those of the subsequent wake-interaction experiments involving both turbines. This verification also ensured that WT2, when placed in the most downwind position, was not influenced by boundary effects near the end of the test section. Measurements were conducted at two wind speeds: 4.0 and 2.4 m s−1. The latter corresponds to the average wind speed over the rotor plane in the 5D full-wake condition, as estimated from the wake measurements reported by Fontanella et al. (2025b). At 2.4 m s−1, the rotor speed was set to 150 rpm, corresponding to a TSR close to the optimal value of 7.5. The resulting deviation from the ideal TSR (about 4 %) is due to the practical resolution with which the rotor speed can be prescribed and has a negligible effect on the operating conditions.
The energy available to WT2 when operating under waked conditions is reduced due to wake losses, which depend on its position relative to the upstream turbine. Outside free-stream conditions, WT2 operates in a non-uniform inflow caused by partial or total immersion in the wake of WT1, depending on the specific farm configuration. In these cases, the operating conditions of WT2 were defined in terms of the thrust-equivalent wind speed (UTE). For each configuration with fixed WT1, UTE was obtained by inverting a calibrated thrust–wind-speed–rotor-speed relation derived from a blade-element momentum (BEM) model of the rotor under uniform free-stream conditions (see Appendix C). The thrust-equivalent wind speed is introduced as an operational parameter to define a consistent operating condition for the WT2 rotor across configurations characterized by different wake interactions. Specifically, UTE denotes the uniform inflow speed that, in the calibrated free-stream thrust map, corresponds to the measured mean thrust at the prescribed rotor speed. It is not intended to reconstruct the actual heterogeneous waked inflow experienced by the rotor.
The blade pitch of WT2 was fixed at 0°, as for WT1, and was not adjusted based on UTE in order to avoid added complexity and to better isolate the effects of the wake on aerodynamic loading. The optimal TSR of the rotor (equal to 7.5), derived from the aerodynamic design, was used as the target operating condition. WT2 rotor speed was adjusted to achieve this optimal TSR based on the mean UTE at each position, except in the 3D1D and 5D1D configurations. In these two cases, the UTE for WT2 is higher than both the free-stream wind speed and the wind speed measured by the lateral pitot system, which accounts for the blockage induced by the presence of WT1 within the test section. The additional increase in velocity observed at the WT2 rotor plane is attributed to wind tunnel confinement effects associated with the presence of the second rotor, which contributes to the overall test-section blockage. This interpretation is supported by additional measurements performed at the WT2 rotor plane (at hub height and at a lateral free-stream position), which showed a mean velocity of 4.3 m s−1. In the 3D1D and 5D1D cases, the rotor speed was set to maintain the same thrust force as in the free-stream condition. As a result, the TSR was lower than the design value of 7.5 because of the blockage-induced speed-up at the rotor, but this choice ensured comparable thrust loading of WT2 across the farm configurations.
For the cases with dynamic WT1 motion, the rotor speed of WT2 was not updated instantaneously with the fluctuating inflow but kept constant at the value corresponding to the mean UTE, so that WT2 experienced small deviations from the nominal TSR during the motion cycle. The resulting rotor speed values, fixed for each configuration, are specified in Table 2. For completeness and to support reproducibility, the table also reports the corresponding average thrust force and thrust coefficient of WT2, with Ct being computed according to Eq. (6) using the measured thrust and the reference free-stream velocity (constant during the tests at 4.0 m s−1).
2.3 Platform motion scenarios
The experiment included both sinusoidal platform motions, applied either in a single degree of freedom or as combined surge–sway motions and realistic platform motions representative of a 10 MW floating wind turbine subjected to irregular wave excitation.
Platform motions were defined using the inertial reference frame and the platform reference frame that are depicted in Fig. 1b. The platform reference frame is fixed to the robotic platform and moves with the turbine; it has the origin Op in correspondence of the tower base, on the tower centerline. zp points along the tower axis, xp points in the downwind direction when the platform is fixed, and yp forms a right-hand coordinate system with xp and zp. The origin of the inertial reference frame Oi is at a vertical distance of 0.73 m from the ground. When the wind turbine is in the fixed position, Op is coincident with Oi.
2.3.1 Sinusoidal motion
The system was studied under sinusoidal motion of different frequencies and amplitudes. For translational motions, the displacement was defined as
where am is the displacement amplitude and fm the motion frequency. Surge motion corresponds to a translation of the platform reference point Op along the xi axis. Surge–sway motion corresponds to a translation at an angle γ relative to the xi axis (and hence to the wind). The displacement components are dx(t)=d(t)cos γ along the surge direction and dy(t)=d(t)sin γ in the crosswind (sway) direction. Angles γ = 15, 30, 45, and 90° were tested.
For pitch and yaw motions, the platform rotation was defined as
where aθ is the angular amplitude. Pitch motion corresponds to a rotation around the yi axis with the rotor hub located at a distance rhub from the platform rotation point Op. When θ is small, the resulting hub displacement along the wind direction is . Yaw motion corresponds to a rotation around the zi axis (see Fig. 1b).
Surge and pitch motions cause along-wind movement of the nacelle and result in an apparent wind speed over the rotor given by
where in the case of surge motion, in the case of surge–sway motion, and in the case of pitch motion. Accordingly, the amplitude of the apparent wind oscillation is Δu=2πfmam in the case of surge motion, Δu=2πfmamcos γ in the case of surge–sway motion, and Δu=2πfmrhubaθ in the case of pitch motion.
During yaw motion, because the yaw amplitude is small, the apparent velocity remains predominantly aligned with the xi axis. However, a velocity gradient develops across the rotor span: the apparent wind speed perturbation is largest at the blade tips and vanishes at the hub. The local apparent velocity at position py along the yp axis (measured from the hub, with sign) is
The oscillation amplitude of the apparent velocity therefore scales linearly with the spanwise position: Δu(py)=2πfmaθpy.
In research concerning the unsteady aerodynamics of floating wind turbines (Fontanella et al., 2021; Messmer et al., 2024a; Schulz et al., 2024), frequencies are typically expressed in a non-dimensional form using the rotor-reduced frequency (fr), which is equivalent to a Strouhal number and is defined as
The sinusoidal motion conditions were characterized in terms of reduced frequency and amplitude. The selected amplitudes and frequencies were based on those used in the previous wind tunnel experiment of Fontanella et al. (2025b) that characterized the wake behavior. The selected conditions were known to cause significant dynamic variations in the wake and were consequently expected to produce a substantial aerodynamic excitation of the downstream turbine. The frequencies correspond to reduced frequency values representative of full-scale floating wind turbine dynamics. Specifically, at a wind speed of 12 m s−1, fr=0.3 and fr=0.6 correspond to full-scale frequencies of 0.02 and 0.04 Hz, respectively, which are typical of rigid-body modes in 10 MW floating turbines. In contrast, fr=1.2 corresponds to a full-scale frequency of 0.08 Hz (with a period of 12.5 s), representative of platform motions at wave frequency.
The amplitudes of surge and pitch motions caused an apparent wind speed variation, expressed as a ratio of apparent wind to undisturbed wind speed () of approximately 5 % at all reduced frequency values considered in the experiment. In surge–sway motion, the displacement amplitude d was the same as in pure surge, but the variation in apparent wind speed decreased as the angle between the motion direction and the wind (γ) increased. For yaw motion, an amplitude of 2° was selected to investigate wake development under large dynamic yaw rotations, representative of those that may occur in real operating conditions under severe sea states. When combined with reduced frequencies of 0.3, 0.6, and 1.2, this yaw motion amplitude resulted in apparent wind speed variations at the rotor edge of approximately 3 %, 7 %, and 13 %, respectively.
2.3.2 Irregular waves
Following the analysis of cases with sinusoidal motions, the experiment was extended to include motions similar to those induced by irregular waves acting on a 10 MW floating wind turbine from different directions, in order to assess whether the observations from the simplified cases remained valid under more realistic conditions.
Table 3Frequencies of the rigid-body motion modes of the SOFTWIND floating wind turbine, with reduced frequencies evaluated at a mean wind speed of 12 m s−1.

In these tests, unlike the sinusoidal cases, the wind turbine motion was not prescribed from simple parametric inputs but was obtained from aero-hydro-servo-elastic simulations of a realistic floating wind turbine. Specifically, we modeled the SOFTWIND system, which consists of the DTU 10 MW wind turbine mounted on a spar-buoy platform (Arnal, 2020; Behrens de Luna et al., 2024; Papi et al., 2024), using the OpenFAST simulation tool (Jonkman et al., 2023). Table 3 reports the frequencies of the rigid-body motion modes of the SOFTWIND floating wind turbine. At these frequencies, the platform motion exhibits significant amplification of the excitation from wind and wave forcing.
The OpenFAST simulations were run for representative wind and wave conditions, and the resulting platform motion time series were used as inputs to the wind tunnel experiments. The waves in the simulation had a full-scale significant height of 5 m and a peak period of 12 s corresponding to a model-scale significant height of 0.067 m and a peak period of 0.48 s. The same waves were applied at heading angles of 0 and 30° relative to the wind direction. The simulations were carried out with a uniform wind field, with a full-scale wind speed of 12 m s−1, turbulence intensity of 1.5 %, and fixed rotor speed and blade pitch, matching the conditions of the experiment. The time series of platform motions in six directions were downscaled and employed to prescribe the motion of WT1 utilizing the robotic platform.
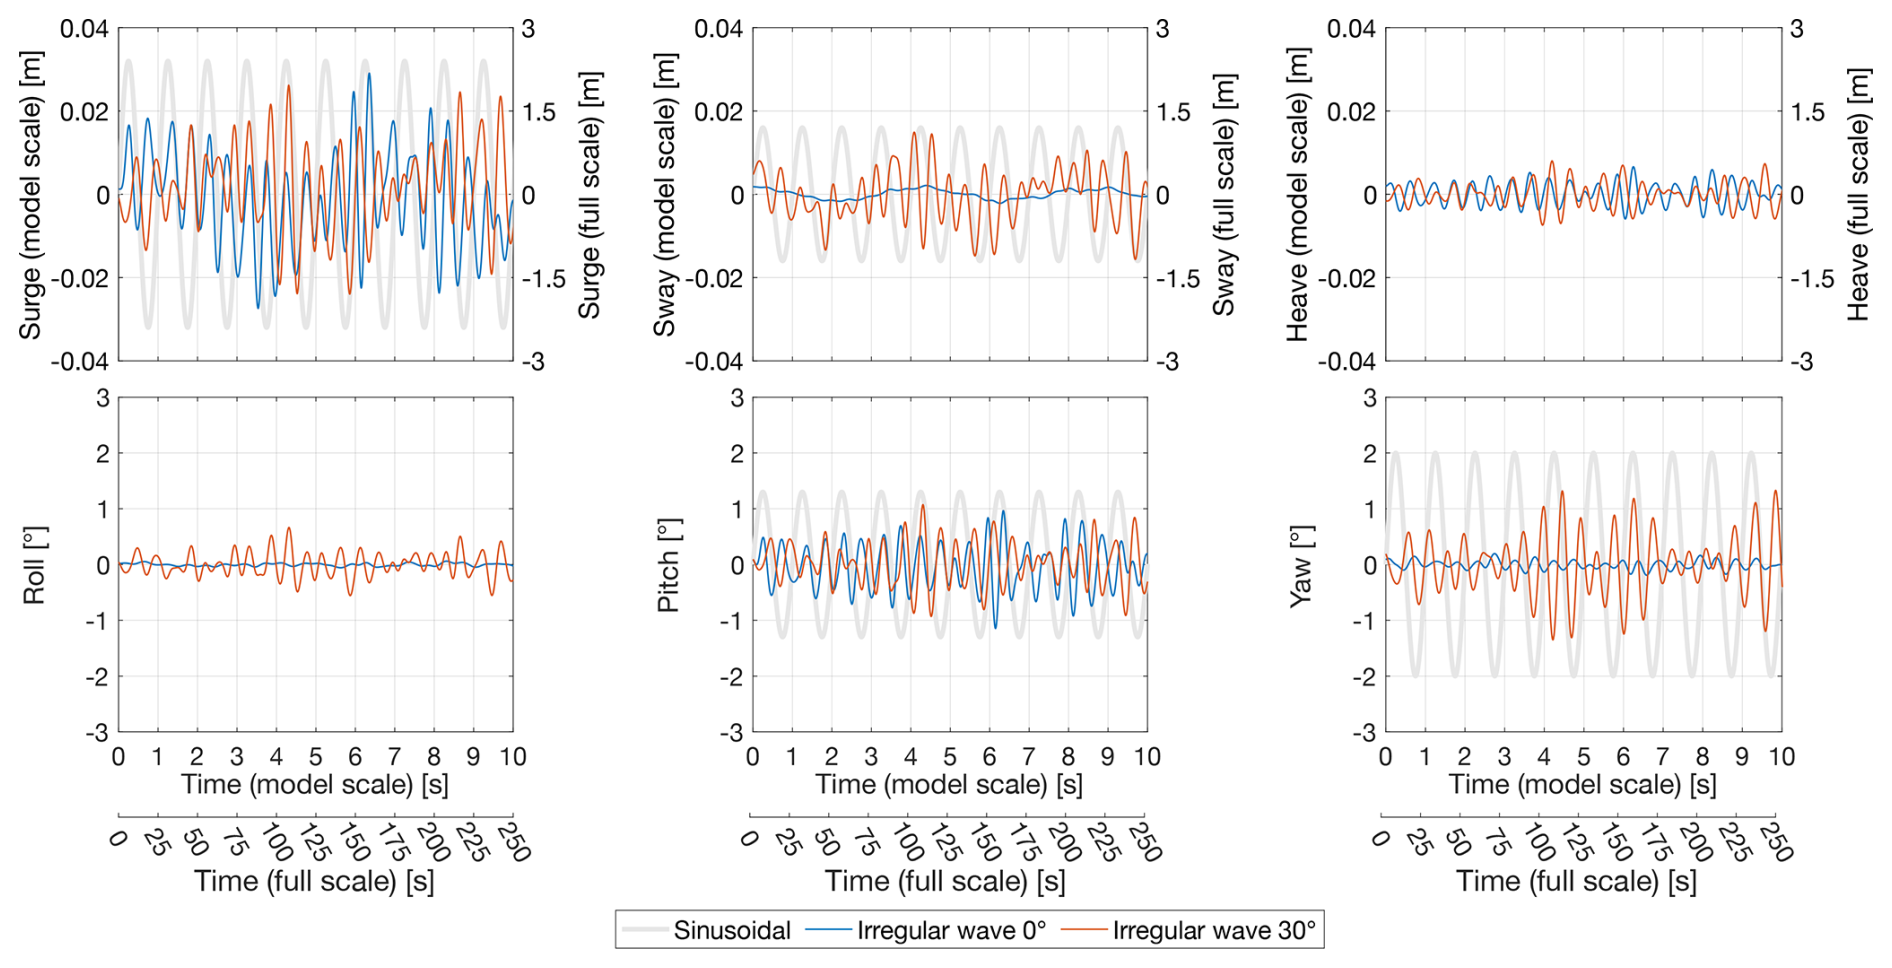
Figure 2The time series of wave-induced motions examined in the experiment are compared with sinusoidal motions of fr=0.6. The wave-induced motions correspond to the SOFTWIND 10 MW floating wind turbine subjected to irregular waves, with a significant height of 5 m and a peak period of 12 s (full scale).
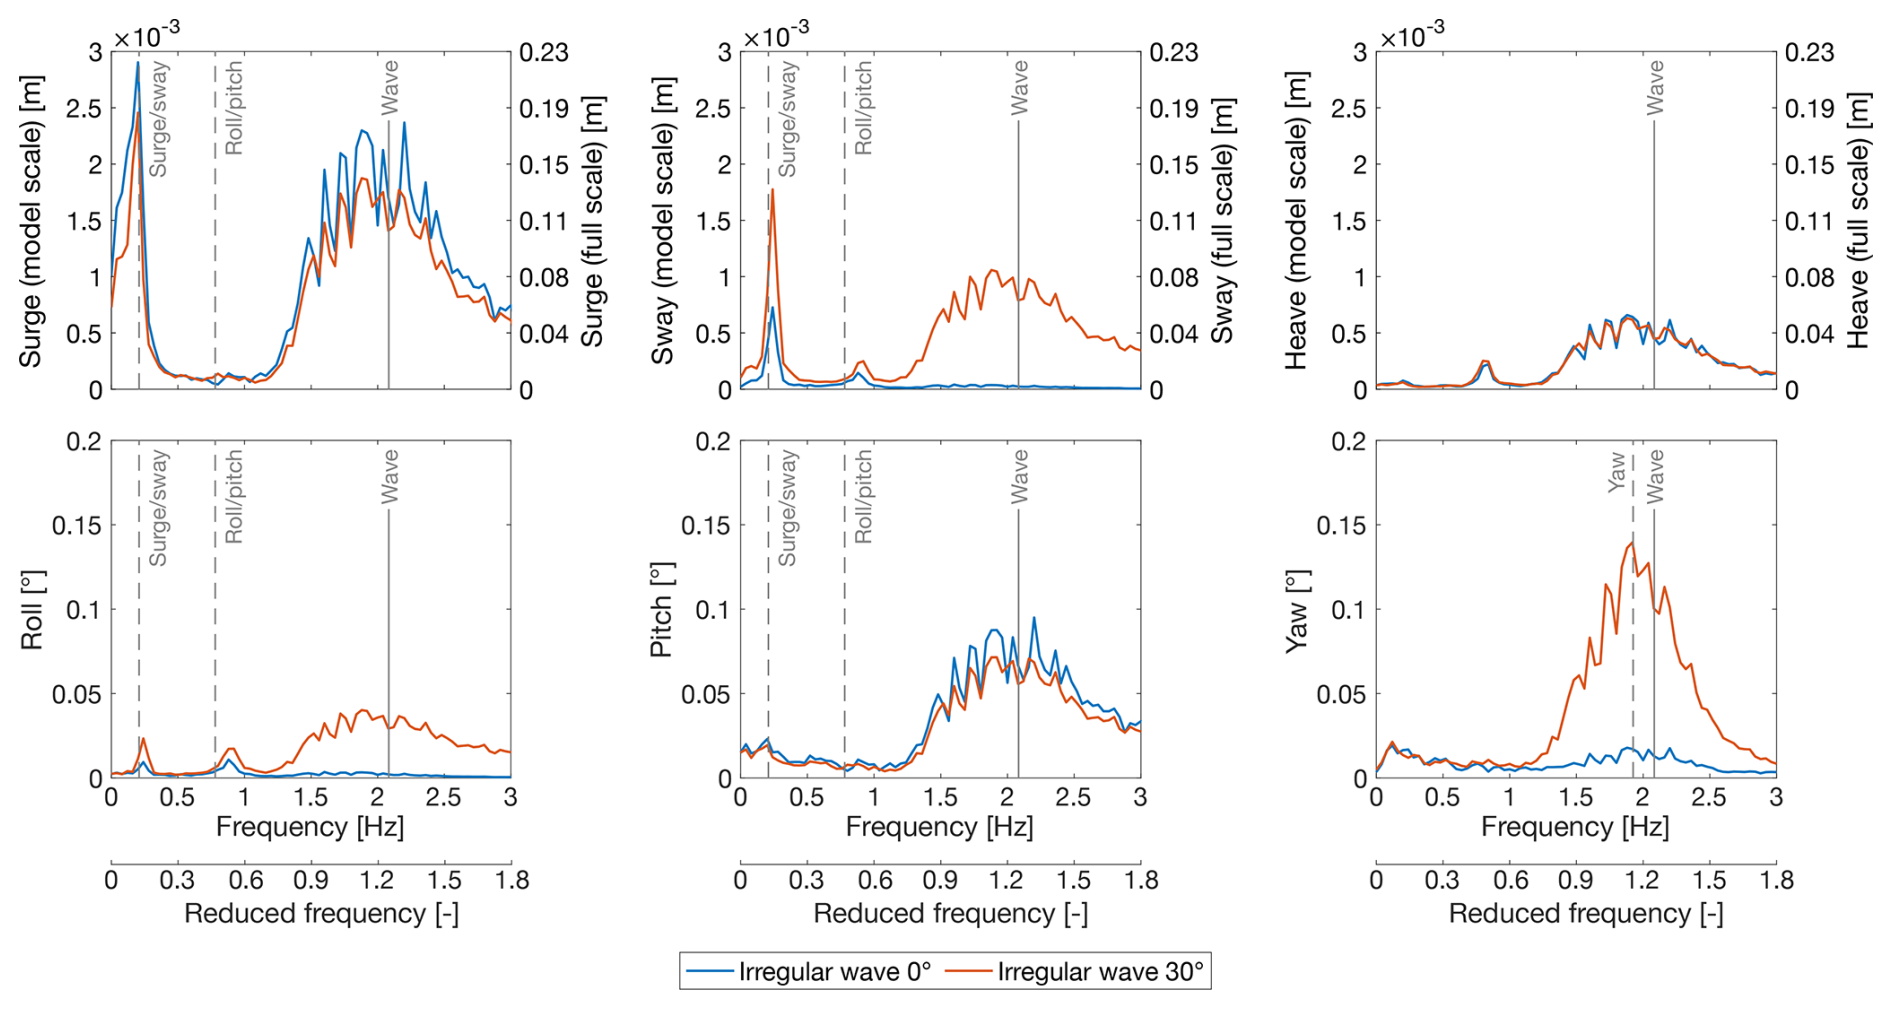
Figure 3Spectra of wave-induced motions of the SOFTWIND 10 MW floating wind turbine subjected to irregular waves, with a significant height of 5 m and a peak period of 12 s (full scale).
The time series of platform motions induced by irregular waves are shown in Fig. 2 and the corresponding spectra in Fig. 3. When waves are aligned with the wind direction (0°), the platform response is dominated by surge and pitch, with minimal motion in the other degrees of freedom. In contrast, waves at 30° also excite significant sway, roll, and yaw movements. Figure 2 shows that the frequency and amplitude of the platform motions of the SOFTWIND driven by the selected wave conditions are similar to those in the sinusoidal motion cases. Specifically, sinusoidal surge–sway and yaw motions represent movements in the sway and yaw directions caused by waves with a 30° heading.
The experimental campaign produced an extensive dataset, which is openly available (Fontanella et al., 2025a). This paper focuses on a subset of cases selected for their relevance to floating wind farm dynamics and for the insights they offer into the effects of platform motion and array configuration on wake interactions.
The analysis of the results uses the aerodynamic thrust force (Fx) and the torque (Mx) as key indicators of rotor performance. Thrust plays a critical role in the coupled dynamics of floating wind turbines, linking aerodynamic forces to platform motion and contributing significantly to tower and blade loading. Torque, on the other hand, governs power generation and influences drivetrain dynamics. In the experiment, the wind turbines operated at a fixed rotor speed, so the aerodynamic power was directly calculated as the product of aerodynamic torque and rotor speed.
To enable comparison with other studies, rotor loads are also reported in terms of non-dimensional coefficients. The thrust coefficient is defined as
and the torque coefficient as
where U is the reference wind speed measured with the pitot tube placed upstream of the rotor along the hub axis. During the tests, this velocity remained constant at 4.0 m s−1. In this study, the same free-stream velocity U is used for the normalization of both the WT1 and WT2 loads. This convention is often adopted in wake and wind farm studies (e.g., by Van Der Hoek et al., 2024b), as it facilitates direct comparison of upstream and downstream turbine performance under identical reference conditions.
No blockage correction was applied to the results reported in this paper. Classical correction methods (Inghels, 2013) are based on simplified one-dimensional flow assumptions and are valid only for isolated rotors in uniform inflow. While they could be applied to WT1 operating in free stream, they cannot be consistently extended to WT2 when it is partially or fully immersed in the wake of WT1. To ensure consistency across turbines and configurations, the results are therefore presented without correction.
3.1 Time-average loads
This section presents an analysis of the average loads on the two wind turbines. Specifically, thrust and torque were evaluated in the fixed tower-base configuration to assess the aerodynamic response of each turbine and the overall wind farm behavior across different layouts (Sect. 3.1.1). The time-average power output was examined under prescribed motions of the upstream turbine to quantify the impact of platform motion on wake recovery (Sect. 3.1.2).
3.1.1 Fixed tower base
The loads of WT1 in the fixed tower-base condition were measured in 40 repeated test runs. These repetitions were carried out throughout the experimental campaign, particularly after any changes in the test setup and following system initialization, for example, at the beginning of each testing day, to ensure consistency of the measurements. The average thrust force was 36.17 N and the average torque was 2.87 Nm. The loads were consistent during the experimental campaign, with maximum deviations from their mean values of ± 0.33 N for thrust (± 0.9 %) and ± 0.10 Nm for torque (± 3.5 %). Under these conditions, WT1 produced an average power of 72 W, corresponding to a full-scale value of 10.93 MW.
To verify the aerodynamic equivalence of WT2 with respect to WT1, WT2 was mounted on the robotic platform in the WT1 position, and its performance was compared under identical operating conditions. The measured thrust force (35.9 N, −0.7 % relative to WT1) and torque (3.03 Nm, +5.6 % relative to WT1) for WT2 were in close agreement with the values obtained for WT1. The thrust fell within the variability range measured for WT1, while the torque showed a slightly larger deviation but remained within an acceptable margin. Overall, these results confirm that the WT2 rotor exhibits equivalent aerodynamic performance.
The average WT2 loads are shown in Fig. 4. When WT2 operated in free-stream conditions at the 5D position (with WT1 removed) and a wind speed of 4.0 m s−1, its loads were consistent with those measured when the turbine was mounted on the robotic platform. At a wind speed of 2.4 m s−1, which is representative of the average velocity in full-wake conditions, the thrust force of WT2 matched the scaled thrust of the DTU 10 MW turbine used as the reference in rotor design. These results confirm that the wind tunnel provided a uniform inflow across the wind farm region and that the aerodynamic response and induction of the downstream turbine were not significantly influenced by proximity to the end of the test section. This comparison is not intended to reproduce waked inflow conditions but simply to verify that, in the absence of a wake, WT2 operates consistently at a downstream spacing of 5D, as it does at the other tested spacings.
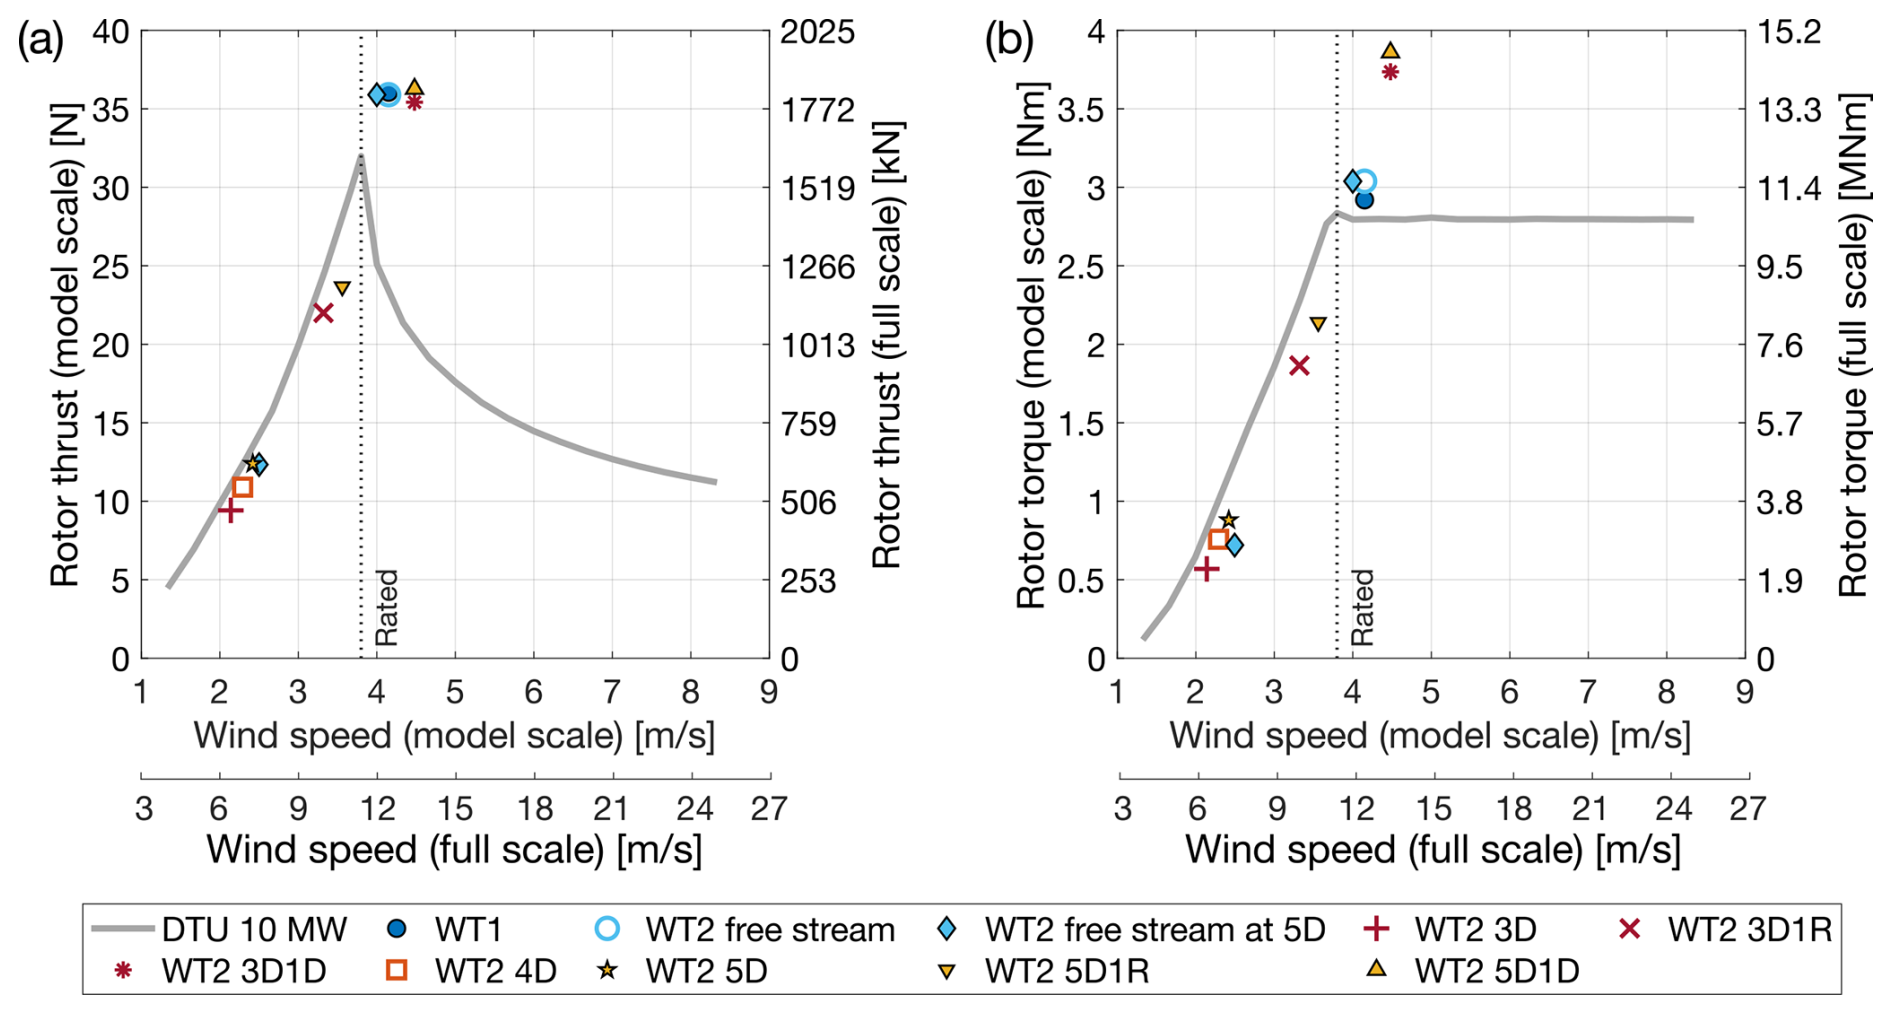
Figure 4Rotor thrust (a) and rotor torque (b) of the two wind turbines in the scenario without platform motion and for different positions of WT2 with respect to WT1. The loads of WT1 and of WT2 in the free-stream condition are plotted against the wind speed measured by the pitot system, while the loads of WT2 in all other configurations are plotted against the estimated thrust-equivalent wind speed.
The WT2 loads in farm scenarios with fixed WT1 were recorded across all farm configurations, with 2 to 9 repeated tests. In the configurations with aligned turbines and those with a lateral offset of 1R, the UTE for WT2 is below the rated wind speed and the loads follow adequately the values of the DTU 10 MW at model scale. In configurations with a lateral offset of 1D, the thrust-equivalent wind speed UTE for WT2 exceeds the rated wind speed, resulting in a TSR lower than the optimal value for the rotor. While the thrust remains equal to that of the turbine in free-stream conditions, as intended when defining the operating parameters, the torque is higher.
3.1.2 Effect of platform motion on the time-average power of the downstream turbine
Large rotor motions induced by platform dynamics introduce dynamic variations in aerodynamic loads, which in turn alter the wake dynamics. This disturbance may enhance the natural mixing between the wake and the surrounding free-stream, leading to earlier wake recovery compared to a case where the turbine is fixed at the tower base. Earlier mixing implies that the flow regains free-stream characteristics closer to the rotor, thereby increasing the available energy for a downstream turbine. Wake velocity measurements obtained from hot-wire anemometry at the WT2 positions by Fontanella et al. (2025b) showed only minor increases in mean wind speed relative to the fixed case. Larger improvements were observed in crosswind and yaw motion cases, with more significant gains at 5D than at shorter distances.
To assess the influence of upstream rotor motion on wake energy recovery, we measured the power output of WT2 at several downstream positions in the wake of WT1. Because the rotor speed was prescribed and constant in each farm configuration, the aerodynamic power of both turbines was obtained directly from the measured torque and the known rotational speed. In all tests, WT1 maintained a time-average power output of 72 W (10.93 MW at full scale). Figure 5 shows the ratio of WT2 power to WT1 power for various farm configurations and WT1 motion conditions, including the fixed tower-base case. The complete set of time-averaged power measurements for every farm configuration, including all amplitudes and frequencies tested for sinusoidal motions, is provided in Appendix D. For sinusoidal platform motions, the values reported in Fig. 5 correspond for each farm configuration to the maximum WT2 power observed across all tested combinations of frequency and amplitude for that motion type.
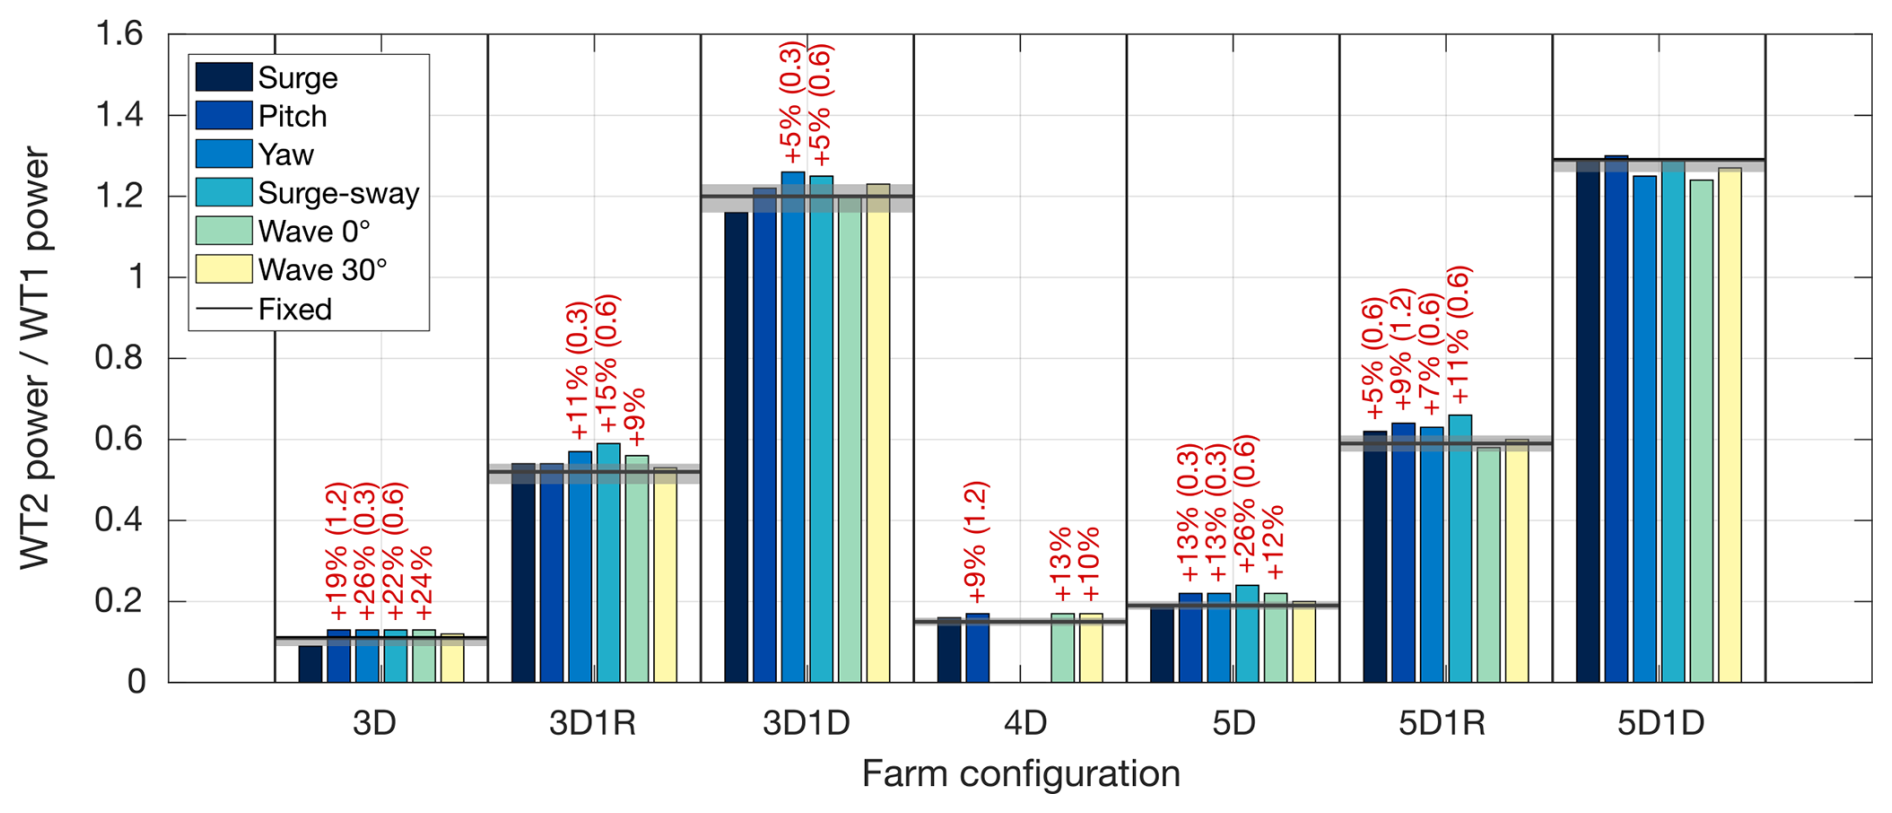
Figure 5Time-averaged power output of WT2, normalized by that of WT1, for various WT1 motion scenarios. For sinusoidal platform motions, the values shown correspond for each farm configuration to the maximum WT2 power observed among all tested combinations of frequency and amplitude for that motion type. The shaded bands indicate the variability (minimum/maximum) of WT2 power in fixed-turbine conditions. Percentages above the bars denote the relative improvement with respect to the fixed case when this exceeds the variability, while the values in parentheses indicate the reduced frequency of the sinusoidal motion at which the maximum gain occurred.
When WT2 is fully aligned with WT1, it operates within the core of the wake and therefore produces the lowest power. In the fixed configuration, WT2 power increases only gradually with downstream distance, rising from 11 % of WT1 power at 3D to 15 % at 4D and 18 % at 5D, reflecting slow wake recovery.
These wake losses are larger than those typically reported in full-scale studies, where the power of a downstream turbine at 5D often reaches 40 %–50 % of the upstream turbine power (Shen and Mikkelsen, 2011). In the present experiments, the stronger deficit can be attributed to the combination of a high thrust coefficient of WT1 (average Ct=0.9), which generates a pronounced momentum deficit and a very low free-stream turbulence intensity (1.5 %), which limits turbulent mixing and reduces wake recovery. The value of Ct is consistent with the operating conditions adopted in previous wind tunnel investigations of floating wind turbine aerodynamics, where model rotors were typically operated near rated conditions and produced similarly high thrust coefficients (Fontanella et al., 2021, 2022a, 2025b). In addition, the proximity of the wind tunnel ceiling (with the rotor tip located approximately 0.2D below it) likely limits the vertical entrainment of high-momentum flow into the wake. Since vertical entrainment is a key mechanism governing wake recovery in field-scale wind farms, this confinement may further delay wake recovery and contribute to the persistence of a stronger wake deficit than would occur under open-field conditions.
It is important to note that the free-inflow characterization of WT2 at 5D (Sect. 3.1.1) was performed with the robotic platform mounted on the wind tunnel floor, i.e., under the same geometric configuration adopted for the wake-interaction experiments. Under these conditions, WT1 and WT2 exhibited comparable power performance, indicating that the presence of the robotic platform does not introduce any significant alteration of the inflow under free-stream conditions. Furthermore, as shown in Appendix E, the comparison between vertical and horizontal wake profiles at 3D indicates that the robotic platform does not introduce a significant distortion of the wake within the rotor-swept region. The reduced power levels of WT2 when operating in the wake of WT1 are therefore attributable to the combined effects discussed above, rather than to modifications of the inflow induced by the experimental setup, and in particular by the robotic platform.
As a result of the combined effects of the high thrust loading of the upstream turbine, the low free-stream turbulence intensity, and the vertical confinement imposed by the wind tunnel boundaries, the wake remains coherent and persistent over the investigated downstream distances, exerting a strong influence on the downstream turbine. Consequently, any additional recovery promoted by upstream turbine motion may have a more pronounced effect on downstream turbine performance in the present experimental setup than would be expected under open-field conditions. In an atmospheric boundary layer inflow, reduced confinement together with higher background turbulence would enhance vertical entrainment and likely accelerate natural wake recovery, thereby reducing the relative importance of motion-induced wake recovery.
As expected, the power generated by WT2 increases with lateral offset from the wake centerline. At an offset of 1R, WT2 produces approximately 55 % of WT1 power, as the rotor is only partially immersed in the wake. When the offset reaches 1D, WT2 generates more power than WT1, consistent with the local overspeed observed in the rotor-averaged wind-speed estimates. Local flow acceleration around turbines positioned near the edge of a wake has previously been reported in experimental wind farm studies (Bossuyt et al., 2018). However, in the present experiments, the magnitude of this speed-up may also be influenced by wind tunnel confinement. The global blockage of the test section enhances lateral flow acceleration around the wake (Bergua et al., 2023), potentially amplifying the velocity increase experienced by a partially waked turbine. Therefore, while the qualitative behavior of the speed-up is consistent with observations in the literature, its quantitative magnitude may not directly translate to unconfined flow conditions.
When WT1 undergoes platform motion, WT2 power increases under certain motion types relative to the fixed case. The most significant power gains were observed with sinusoidal yaw and surge–sway motions at reduced frequencies of 0.3 and 0.6. Wake velocity measurements reported by Fontanella et al. (2025b) indicate that these motion types have the strongest impact on wake recovery. Motions driven by stochastic wave excitation at 0° incidence led to power gains comparable to those observed under sinusoidal pitch motion. For instance, in the 3D configuration, sinusoidal pitch motion resulted in a 19 % increase in WT2 power, while wave-induced motion at 0°, which excited platform pitch, produced a similar gain of 24 %. In contrast, wave excitation at 30° incidence, which introduced significant crosswind and yaw motions, did not lead to increased power output for WT2. This differs from the sinusoidal motion cases, where crosswind and yaw motions were generally associated with noticeable power gains.
While relative power gains are most pronounced when WT2 is fully aligned with WT1, they remain small in absolute terms due to the inherently low baseline power in this configuration. The highest relative power increases over the fixed-turbine case (+26 %) were observed in two scenarios: the 3D aligned configuration with WT1 undergoing yaw motion (2° amplitude, reduced frequency of 0.3) and the 5D aligned configuration with WT1 undergoing sway motion of 0.032 m amplitude (2.4 m at full scale), at a γ = 45° angle with respect to the wind and reduced frequency of 0.6. In the 3D yaw case, WT2 power increased from 11 % to 13 % of WT1 power, corresponding to a rise from 7.7 W (1.17 MW at full scale) to 9.7 W (1.47 MW). In the 5D surge–sway case, WT2 power increased from 19 % to 24 % of WT1 power, rising from 13.8 W (2.1 MW at full scale) to 17.4 W (2.64 MW).
While relative gains are most pronounced in aligned configurations, the absolute power increases are more substantial in partially misaligned layouts. For instance, in the 3D1R configuration, when WT1 underwent surge–sway motion at a reduced frequency of 0.6 with an amplitude of 0.032 m (equivalent to 2.4 m at full scale) and at a γ = 45° angle to the wind, the power output of WT2 increased from 52 % to 59 % of WT1 power. In absolute terms, this corresponds to a rise from 37.1 W (5.63 MW at full scale) to 42.5 W (6.45 MW at full scale). Conversely, when WT2 was laterally offset by a full rotor diameter (1D), the influence of WT1 motion on downstream power became negligible.
It should be noted that the present ranking of motion types in promoting wake recovery relative to the fixed case is derived under confined flow conditions. The limited vertical clearance between the rotor and the ceiling may constrain vertical wake deflection and potentially reduce the wake recovery induced by platform pitch motion. As a result, the comparatively stronger impact observed for yaw and crosswind motions in this study may be partly attributable to the flow confinement of the experimental setup.
3.2 Dynamic loads induced by upstream turbine surge and pitch motions
In addition to promoting wake mixing, the disturbances introduced by rotor motions can propagate downstream through the wake and induce dynamic loading on other turbines in the wind farm.
3.2.1 Time-domain response of the downstream turbine
Figure 6 shows the aerodynamic thrust and torque measured on WT1 and WT2 when WT1 undergoes surge and pitch motions at a reduced frequency of 0.6 and with of 5 %; in these tests, the two turbines are aligned and spaced 3D apart. Surge and pitch motions are considered because they both involve nacelle translation in the wind direction, directly altering the apparent wind speed at the rotor, and are therefore expected to produce similar effects on the aerodynamic loads. In the figure, the load time series were binned and phase averaged according to WT1 platform motion to show variations at the platform motion frequency. The results are reported both in dimensional form (force and torque) and as non-dimensional coefficients. The thrust and torque coefficients were computed using Eqs. (6) and (7), with the free-stream velocity U measured by the pitot tube located upstream of WT1 on the hub axis (constant during the tests at 4.0 m s−1).
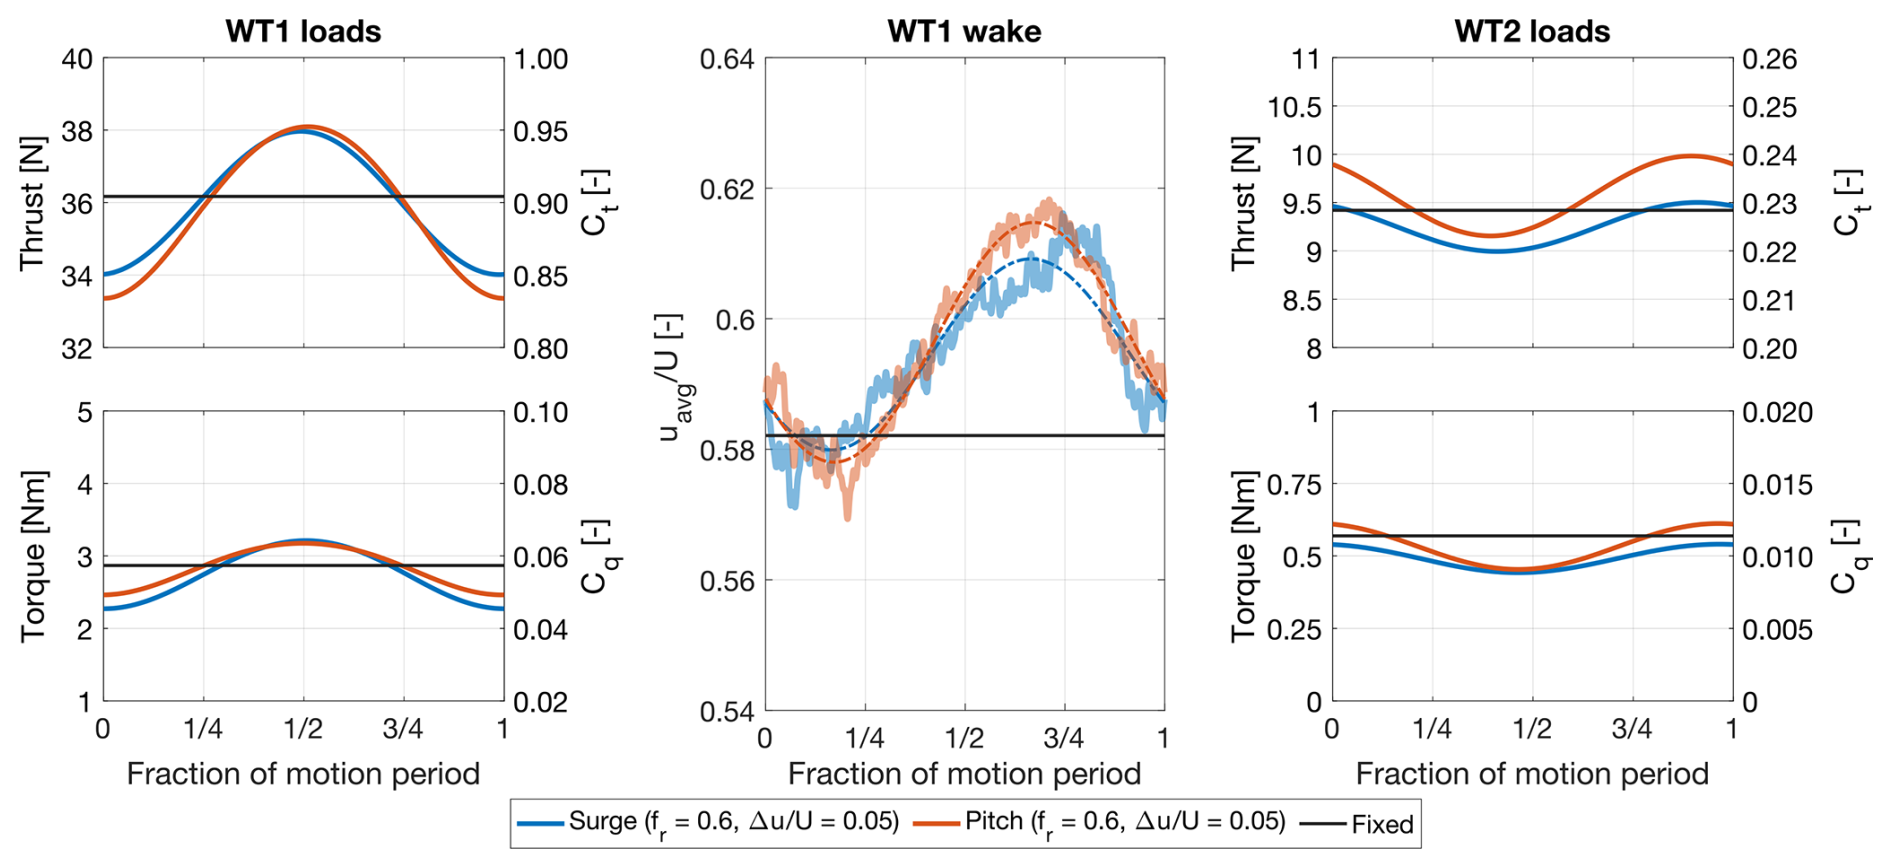
Figure 6Rotor thrust and torque of WT1 and WT2, together with the spatially averaged wake velocity (uavg) of WT1 along a horizontal line at hub height. WT2 is positioned 3D downstream of WT1, and the wake is evaluated at the same distance. Three cases are compared: WT1 undergoing surge motion (fr=0.6, = 5 %), WT1 undergoing pitch motion (fr=0.6, = 5 %), and WT1 fixed.
In both cases, the thrust and torque of WT1 exhibits a clear sinusoidal variation at the same frequency as the platform motion. The peak loads occur at half the motion period, when the nacelle reaches its maximum upstream velocity. This behavior, well documented in previous experimental and numerical studies (Bergua et al., 2023), confirms that the load oscillations are primarily driven by variations in apparent wind due to platform motion. The rotor loads follow these variations proportionally, indicating a quasi-steady response.
The pulsating loads on WT1 generate a periodically varying momentum deficit and shed vorticity in the wake; additionally, the rotor itself moves in space during the platform motion cycle. Together, these effects create flow structures that evolve with the same periodicity as the rotor motion and remain coherent with it as they are advected downstream. For surge and for small-amplitude pitch motion, these structures manifest as a pulsing of the wake velocity, with periodic acceleration and deceleration of the flow during the motion cycle (Fontanella et al., 2025b; Messmer et al., 2024a). This pulsing behavior is illustrated in Fig. 6, which shows the velocity in the wake of WT1 at 3D downstream, spatially averaged along a horizontal line at hub height within the extent of the WT2 rotor ( < y < ). Wake velocity data are obtained from hot-wire measurements reported in Fontanella et al. (2025b). Since velocity fluctuations are not uniform across the wake (see spectra of Fig. 9), this metric provides only a qualitative measure of the inflow over the WT2 rotor. Nevertheless, both surge and pitch motions produce periodic increases and decreases of the spatially averaged velocity, with comparable amplitude (≈ 1.5 % of U) and a phase shift of approximately −150° relative to WT1 platform motion (with the negative sign indicating that the WT2 wake is delayed relative to WT1).
The unsteady wake of WT1 therefore creates a periodically varying inflow for WT2. In response, WT2 exhibits periodic thrust and torque fluctuations at the same frequency as the motion of the upstream turbine. The amplitude of these oscillations is much smaller than for WT1: in the surge case, 0.25 N versus 1.98 N in thrust and 0.05 Nm versus 0.47 Nm in torque. The peaks in the WT2 loads occur with a delay of about 0.4 motion periods relative to the WT1 loads (i.e., a phase shift of ≈ −140°; the negative sign indicates that the WT2 response is delayed relative to WT1). This corresponds to a phase shift of approximately −230° relative to the WT1 motion.
The reduced amplitude of the WT2 load oscillations reflects the fact that the velocity fluctuations in the wake are of lower amplitude and less uniformly distributed across the rotor compared to the apparent wind variations acting on WT1, which are generated by its own motion. At the reduced frequency of 0.6, the induction response of the scale-model rotor to such inflow variations is expected to be quasi-steady (Bergua et al., 2023; Schulz et al., 2024), as also evidenced by the WT1 loads when its own motion modulates the inflow. A similar quasi-steady behavior can therefore be assumed for WT2, meaning that induction dynamics do not introduce additional phase shifts or attenuate the load oscillation amplitude. The observed time lag is therefore primarily associated with the advection of coherent flow structures shed by WT1. The corresponding advection velocity varies downstream as the wake recovers and the local mean velocity changes, and it is further influenced by the induction region upstream of the WT2 rotor.
3.2.2 Spectral analysis of downstream turbine loads at different spacings
Figure 7 presents the fast Fourier transform (FFT) of the thrust force of WT2 when aligned with WT1 and positioned at various downstream distances. In these tests, WT1 undergoes surge or pitch motions at reduced frequencies of 0.3, 0.6, and 1.2, with of 5 %. The FFT is used to quantify load variations at the motion frequency and to identify whether additional harmonics appear at other frequencies.
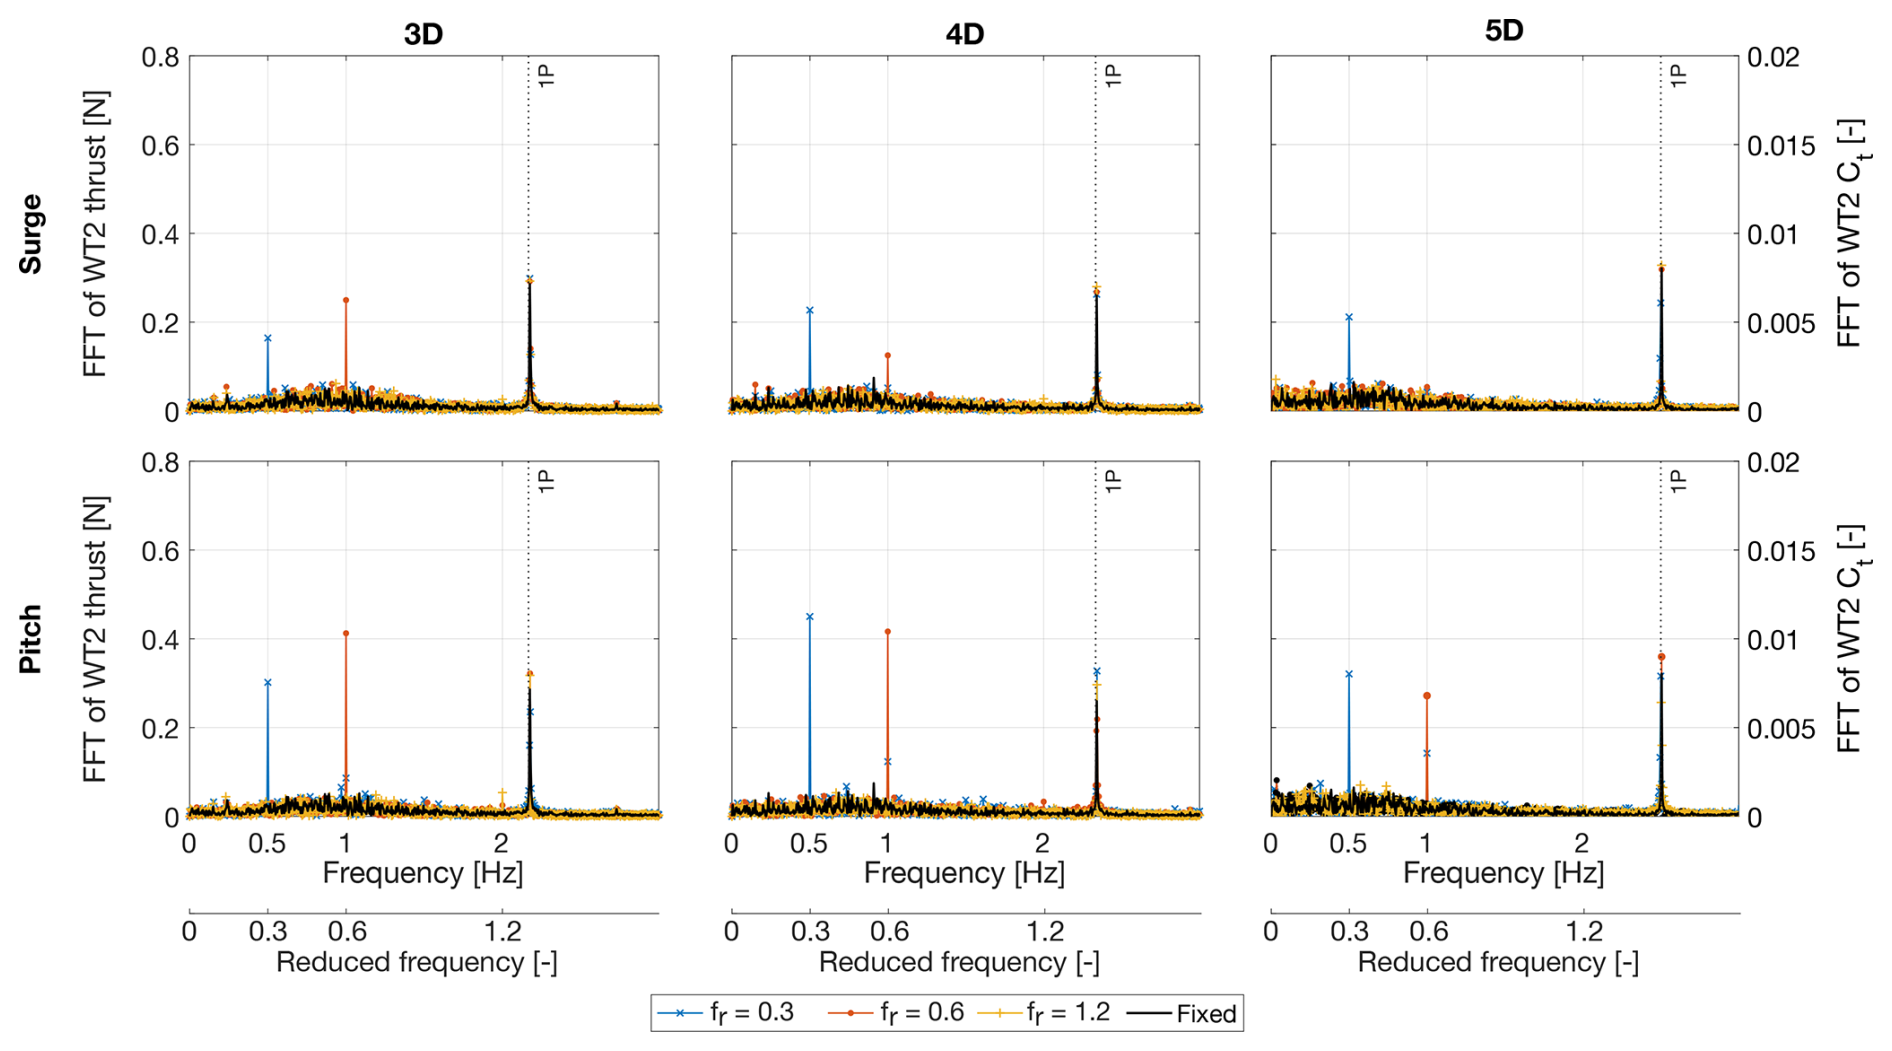
Figure 7Fast Fourier transform (FFT) of the thrust force on the downstream wind turbine (WT2) operating in the wake of the upstream turbine subjected to sinusoidal surge and pitch motions with apparent wind-to-undisturbed wind speed ratios of 5 %. The turbines are aligned, and the downstream turbine is placed at multiple distances downstream of the upstream rotor. The spectra include a peak at the frequency corresponding to the once-per-revolution (1P) frequency of WT2.
The load spectra of WT2 consistently show a sharp peak at the frequency of WT1 platform motion, corresponding to the periodic load oscillations observed in Fig. 6. Across all tested configurations, this peak is clearly visible at the platform motion frequency, while the rest of the spectrum remains largely unchanged relative to the fixed case. In addition, all spectra exhibit a distinct peak at the 1P frequency of WT2, associated with imbalance loads generated by the spinning rotor. The frequency of this peak varies with the rotor speed, which differs across farm configurations (see Table 2), whereas its amplitude remains essentially unchanged whether WT1 is fixed or subjected to motion.
Figures 6 and 7 show that surge and pitch motions producing equal variations in apparent wind speed lead to dynamic loads of comparable amplitude on the downstream wind turbine. In general, load variations are slightly higher for pitch motion than for surge motion, likely due to the additional vertical wake meandering induced by pitch. WT2 exhibits a clear dynamic response at the frequency of WT1 motion when the reduced frequency is 0.3 or 0.6, confirming that the upstream rotor motion is the primary driver of its load oscillations. This response is not observed at fr=1.2, indicating that higher-frequency motions of the upstream platform do not significantly influence the downstream turbine. This observation is consistent with the findings of Fontanella et al. (2025b), who reported that wake velocity oscillations induced by platform motion decrease in strength as the reduced frequency increases from 0.6 to 1.2. At a reduced frequency of 1.2, the periodic velocity structures in the wake of WT1 at the WT2 location have reduced amplitude and rapidly become comparable to the background turbulence of a fixed-turbine wake.
At a reduced frequency of 0.6, the spectral peak in WT2 thrust is visible at distances of 3D and 4D from WT1 but disappears at 5D. This again agrees with previous wake measurements of Fontanella et al. (2025b), which showed that at larger distances, turbulence in the flow masks the periodic structures introduced by platform motion. The observed reduction in motion-induced effects with increasing spacing is consistent with a gradual loss of wake coherence due to turbulence and shear-layer instabilities. As the wake advects downstream, motion-imposed velocity patterns are progressively replaced by smaller-scale turbulence, diminishing their influence on the downstream rotor.
3.2.3 Second-harmonic load response induced by pitch motion
Interestingly, when WT1 is subjected to pitch motion at a reduced frequency of 0.3, a secondary spectral peak appears at twice the excitation frequency. The amplitude of this second harmonic increases with the spacing between the turbines. This peak is absent under surge motion at the same reduced frequency, despite producing similar variations in apparent wind speed and is of much lower magnitude in the other pitch cases with higher frequency and smaller rotation amplitude. This difference is attributed to the nature of pitch motion, which periodically tilts the rotor upward and downward, causing vertical deflection of the wake. As a result, the wake undergoes oscillatory vertical motion. The second harmonic in the WT2 load spectrum likely originates from this vertical displacement: each upward or downward shift of the wake produces a drop in thrust on WT2, creating a load fluctuation at twice the pitch motion frequency.
The effect is most evident at a reduced frequency of 0.3 because this case produces the largest rotor tilt amplitude (2.5°) and, consequently, the greatest vertical wake deflection. This interpretation is supported by Fig. 8, which shows phase-averaged velocity fields in the wake of the upstream turbine at 3D, measured with hot-wire probes as reported in Fontanella et al. (2025b) for two pitch motions: reduced frequency of 0.3 with 2.5° amplitude and reduced frequency of 0.6 with 1.3° amplitude.
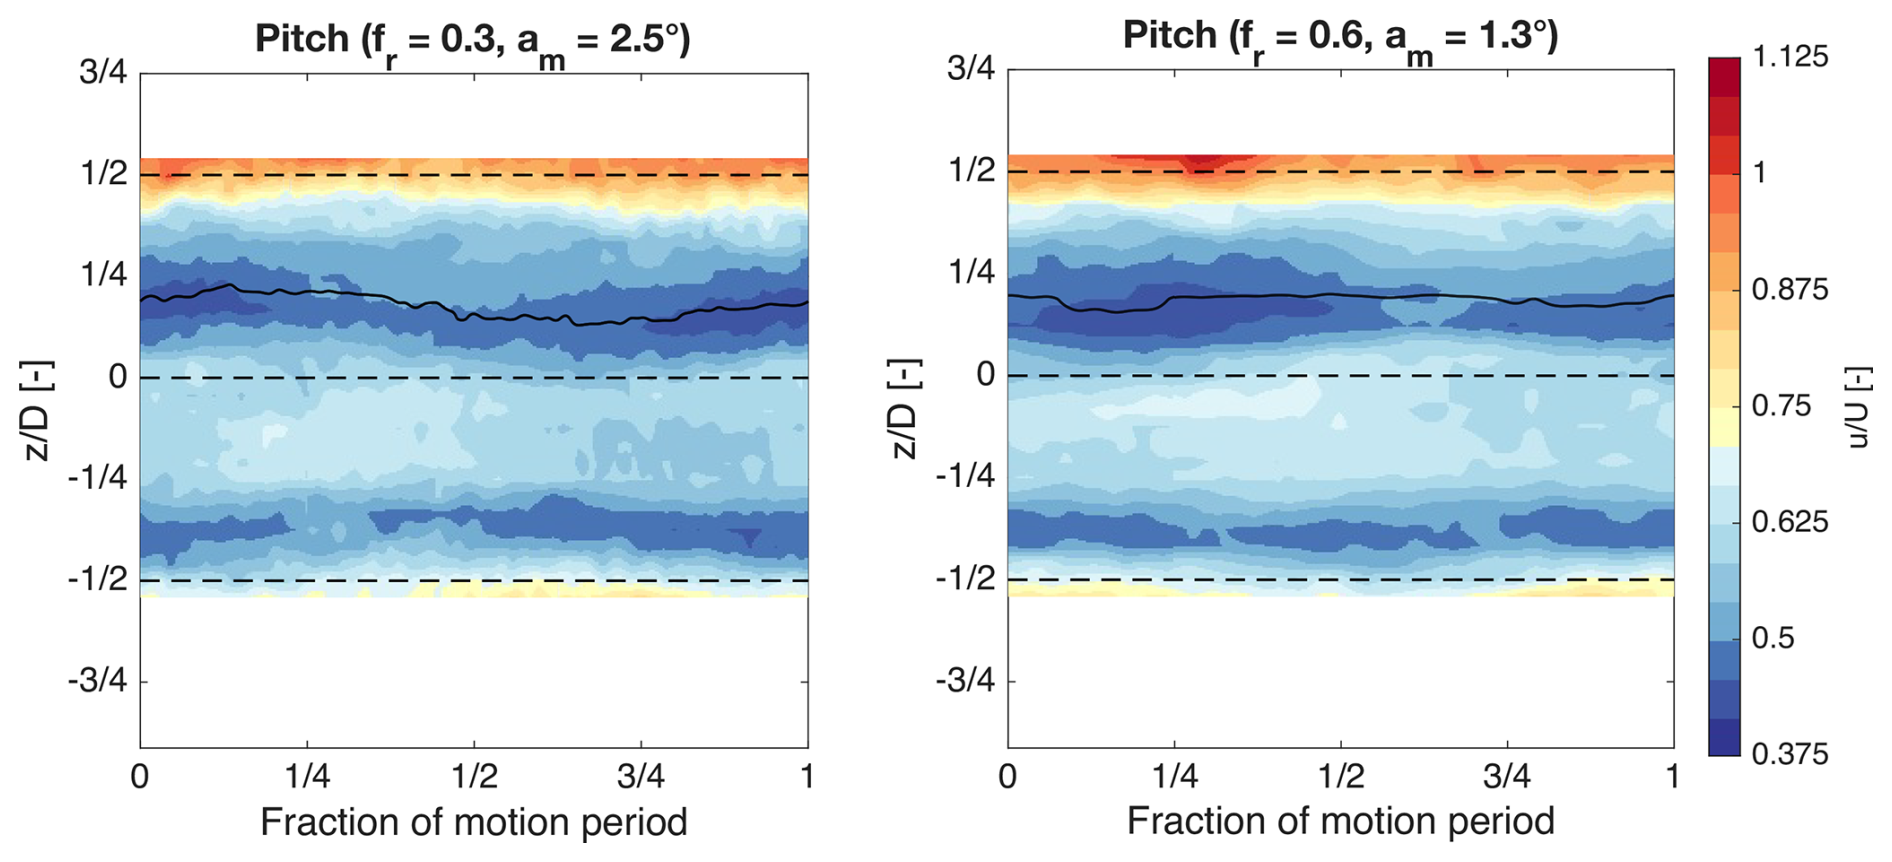
Figure 8Phase-averaged velocity along the vertical line passing through the rotor axis of the upstream turbine wake at a downstream distance of 3 rotor diameters for cases with pitch motion. The two motions have the same apparent wind : undisturbed wind speed ratio of 5 %, but this differs in frequency and amplitude. The velocity fields are obtained by interpolating hot-wire measurements acquired at discrete spatial locations. The solid black line tracks the vertical position of the upper minimum of the wake over one motion cycle.
In both cases, the wake exhibits periodic acceleration and deceleration, but in the 2.5° case the upper portion of the wake also undergoes a clear periodic vertical displacement. This displacement is quantified by tracking, over one motion cycle, the vertical position of the upper wake minimum: the resulting peak-to-peak excursion is 0.24D for the 2.5° case and 0.11D for the 1.3° case. The larger displacement observed for the higher pitch amplitude is consistent, with the stronger second harmonic identified in the load spectrum of the downstream turbine.
3.2.4 Effect of turbine relative positioning
The influence of lateral offset between the two turbines on the dynamic loading induced by the wake of a moving upstream turbine on a downstream rotor is examined for a pitch motion with an amplitude of 1.3° and a reduced frequency of 0.6. This case was selected because the motion produces pronounced velocity oscillations in the wake of the upstream turbine (see Fig. 8) and induces clear dynamic loads on the rotor of the downstream turbine in aligned configurations.
Figure 9 presents the power spectral density (PSD) of the wake velocity at hub height, measured with hot-wire probes by Fontanella et al. (2025b) at different downstream locations. The figure also shows the amplitude of thrust and torque oscillations at the platform motion frequency experienced by the downstream turbine. In the figure, the thrust and torque amplitudes for the “fixed” case represent the load oscillations experienced by WT2 when WT1 has a fixed tower base. These values are extracted from the load spectra evaluated at a reduced frequency of 0.6 by computing the FFT of the load signals and taking the magnitude of the spectral component at that frequency. The observed oscillations in this configuration result from turbulence generated by the upstream turbine and the natural meandering of its wake.
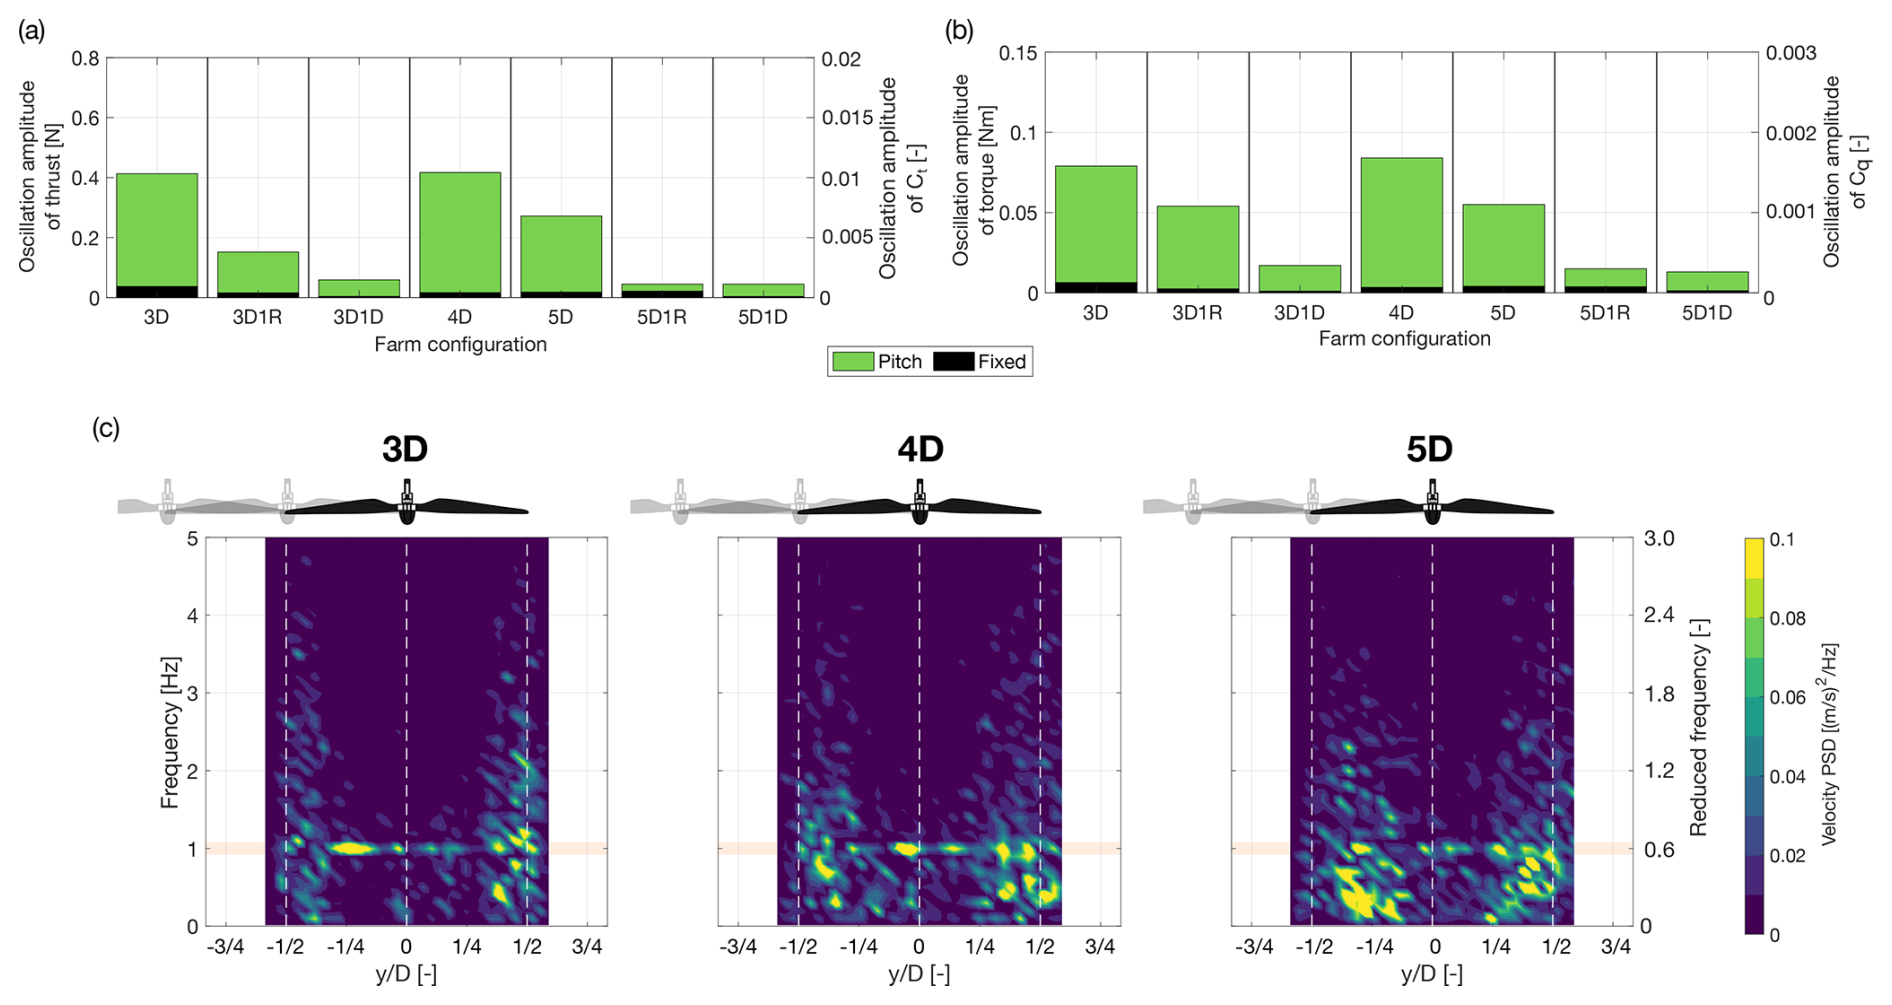
Figure 9Effect of velocity oscillations induced by platform pitch motion with 1.3° amplitude and a reduced frequency of 0.6 on the loads of a downstream wind turbine operating in the wake at varying downstream distances and crosswind positions. (a) Amplitude of thrust oscillations on the downstream turbine. (b) Amplitude of torque oscillations on the downstream turbine. (c) Power spectral density (PSD) of the velocity in the wake of the upstream turbine at different downstream locations.
In all farm configurations, WT2 experiences greater load amplitudes when WT1 is subject to platform motion than when it is fixed. The dynamic loads on WT2 reach their maximum when it is aligned with WT1. In this configuration, WT2 operates fully within the wake of WT1, and velocity fluctuations at the platform motion frequency affect the entire rotor-swept area. In the velocity PSD, the spectral peak corresponding to the motion frequency is less prominent at 5D than at closer distances, as it is masked by turbulence that increases downstream of the rotor. As a result, the motion-induced loads on WT2 are also reduced at 5D, consistent with observations from Fig. 7. In the 4D configuration, the load amplitude is maximum. This trend is consistent for both thrust and torque. The motion of WT1 induces zero-to-peak variations in WT2 thrust of 0.4 N (equivalent to 20.3 kN at full scale) representing approximately 3 % of the average thrust developed by the turbine. The torque variation reaches 0.084 Nm (319.3 kNm at full scale), corresponding to about 12 % of the turbine average torque.
As WT2 is laterally offset from WT1, the amplitude of its dynamic load oscillations decreases. This reduction occurs because a larger portion of the WT2 rotor operates outside the wake. As the lateral offset increases, only part of the rotor is exposed to the unsteady wake flow and its coherent structures, while the remaining portion operates in relatively steady free-stream conditions. The steadier inflow on part of the rotor mitigates the effects of the wake-induced fluctuations, leading to a net reduction in dynamic loading. When the offset reaches 1 rotor diameter, motion-induced loads on WT2 become negligible. This conclusion, however, is specific to the streamwise spacing investigated in this study (3–5D). At larger spacings, wake spreading would increase the fraction of the rotor exposed to unsteady flow, potentially modifying this trend.
3.3 Effect of motion-induced lateral wake meandering
While surge and pitch motions primarily induce oscillations in thrust that lead to a pulsating wake, motions in the crosswind (sway) and yaw directions predominantly excite the lateral meandering of the wake (Messmer et al., 2024a, 2025; Fontanella et al., 2025b). Here, the term “meandering” refers to the coherent lateral displacement of the wake forced by the platform motion, which differs from the natural large-scale meandering that typically develops in the far wake of a bottom-fixed turbine. This side-to-side displacement of the wake introduces a different type of unsteadiness in the flow compared to the pulsing associated with surge and pitch. A rotor operating in such a wake is therefore subjected to dynamic loads that differ from those generated by along-wind motion of the upstream turbine examined in Sect. 3.2.
Section 3.3.1 investigates the effects of yaw motion of the upstream turbine, while Sect. 3.3.2 analyzes the crosswind motion associated with the surge–sway movement of the upstream turbine.
3.3.1 Yaw motion
Figure 10 shows the amplitude of thrust and torque oscillations on WT2 (Fig. 10a and b) together with the phase-averaged wake velocity field at 3D downstream (Fig. 10c), generated by sinusoidal yaw motion of WT1 with a reduced frequency of 0.6 and an amplitude of 2°. The wake measurements were obtained from Fontanella et al. (2025b), and the loads are reported for WT2 positioned at different locations relative to WT1 (loads were not measured in the 4D configuration).
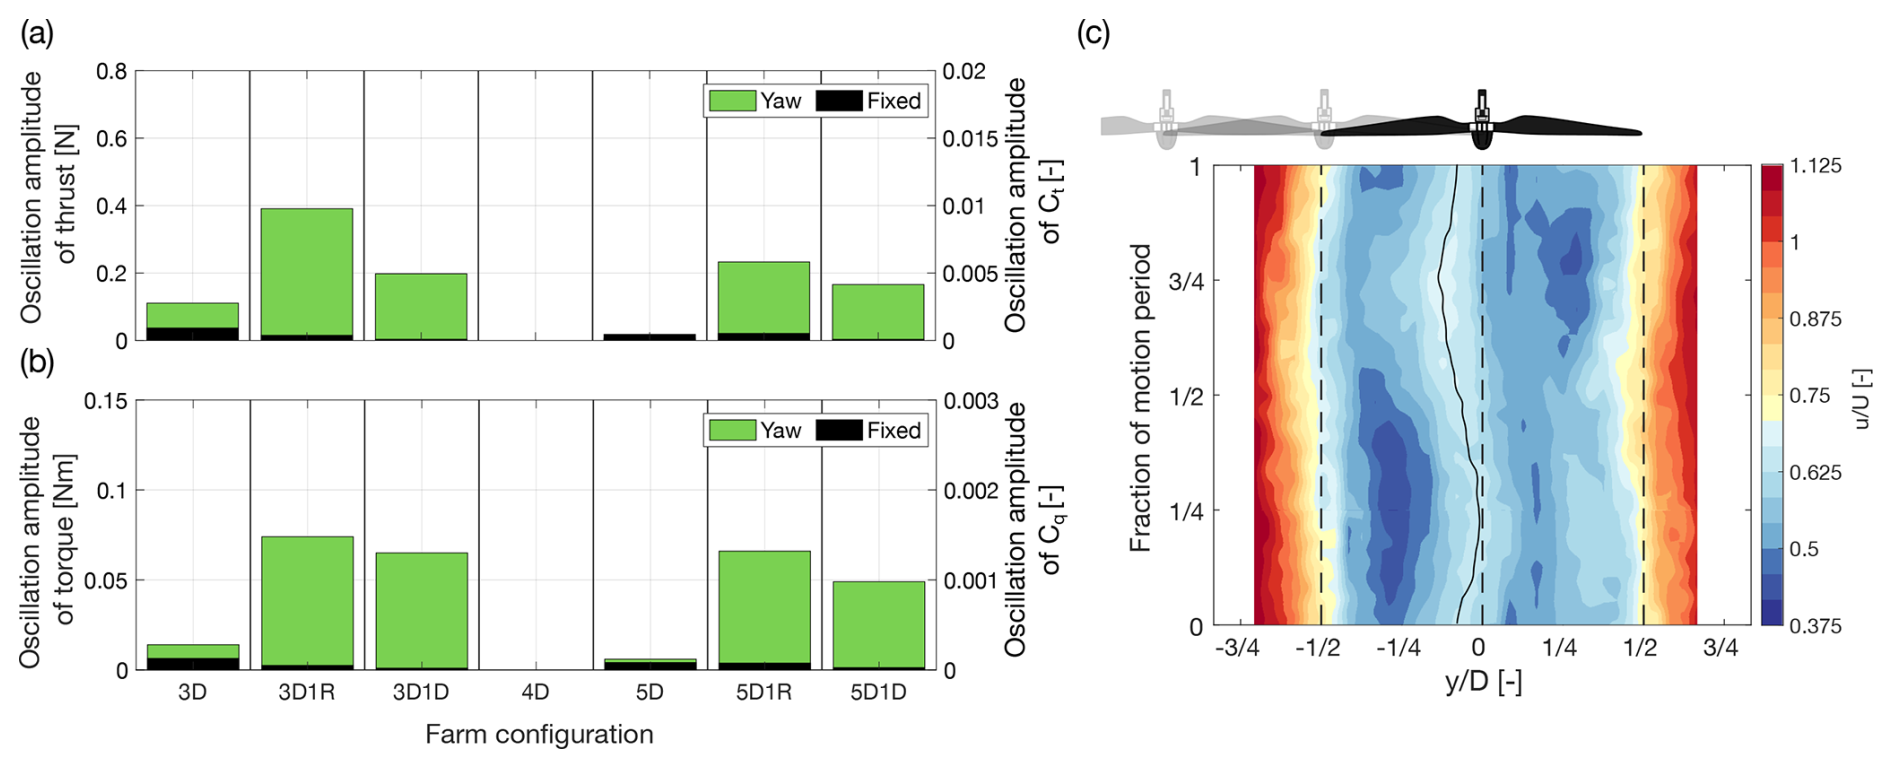
Figure 10Effect of wake meandering induced by platform yaw motion with 2° amplitude and a reduced frequency of 0.6 on the loads of a downstream wind turbine operating in the wake at varying downstream distances and crosswind positions. (a) Amplitude of thrust oscillations on the downstream turbine. (b) Amplitude of torque oscillations on the downstream turbine. (c) Phase-averaged velocity in the wake of the upstream turbine caused by yaw motion at a downstream distance of 3 rotor diameters, reconstructed by interpolating hot-wire measurements acquired at discrete spatial locations; the solid black line tracks the vertical position of the upper minimum of the wake over one motion cycle.
Phase-averaged velocity time series at hub height show a coherent lateral displacement of the wake. This is particularly evident at the wake center, which deviates from the xi axis and returns to it over the course of one motion period. By tracking the instantaneous position of the wake center over one platform motion cycle, a lateral peak-to-peak displacement of approximately 0.3D is obtained. This behavior is linked to the periodic change in the WT1 rotor orientation relative to the wind due to platform yaw motion, which deflects the wake laterally. As a result of this lateral displacement of the WT1 wake, the axial velocity field in the fixed frame of reference becomes asymmetric about the xi axis at each instant in time. With respect to the xi axis, one side of the flow field exhibits a velocity reduction (slowdown), while the opposite side shows a relative velocity increase (speed-up).
When WT2 is aligned with WT1 along the xi axis (in the 3D and 5D configurations), the periodic lateral meandering of the wake causes opposite sides of the WT2 rotor to experience axial velocity fluctuations of opposite sign: one side undergoes a velocity increase while the other experiences a velocity decrease. These local fluctuations largely cancel in the rotor-averaged thrust and torque, so their net oscillations remain small and comparable to those caused by inflow turbulence in the fixed-WT1 case. In this aligned configuration, the unsteady WT1 wake mainly generates asymmetric inflow conditions across the WT2 rotor, leading primarily to lateral force and moment fluctuations (not examined here), while the rotor-averaged thrust and torque remain only weakly affected.
When WT2 is laterally offset with respect to the xi axis (by 1R or 1D), this symmetry is broken: part of the rotor is exposed to the oscillatory velocity field associated with the wake meandering, while the remainder operates in relatively undisturbed inflow. The reduced cancellation of velocity fluctuations leads to stronger thrust and torque oscillations. In the 1R case, approximately half of the rotor is immersed in the fluctuating velocity field of the wake, producing substantial dynamic loads, whereas in the 1D case only the outer portion is affected, resulting in a smaller load response than in the 1R configuration.
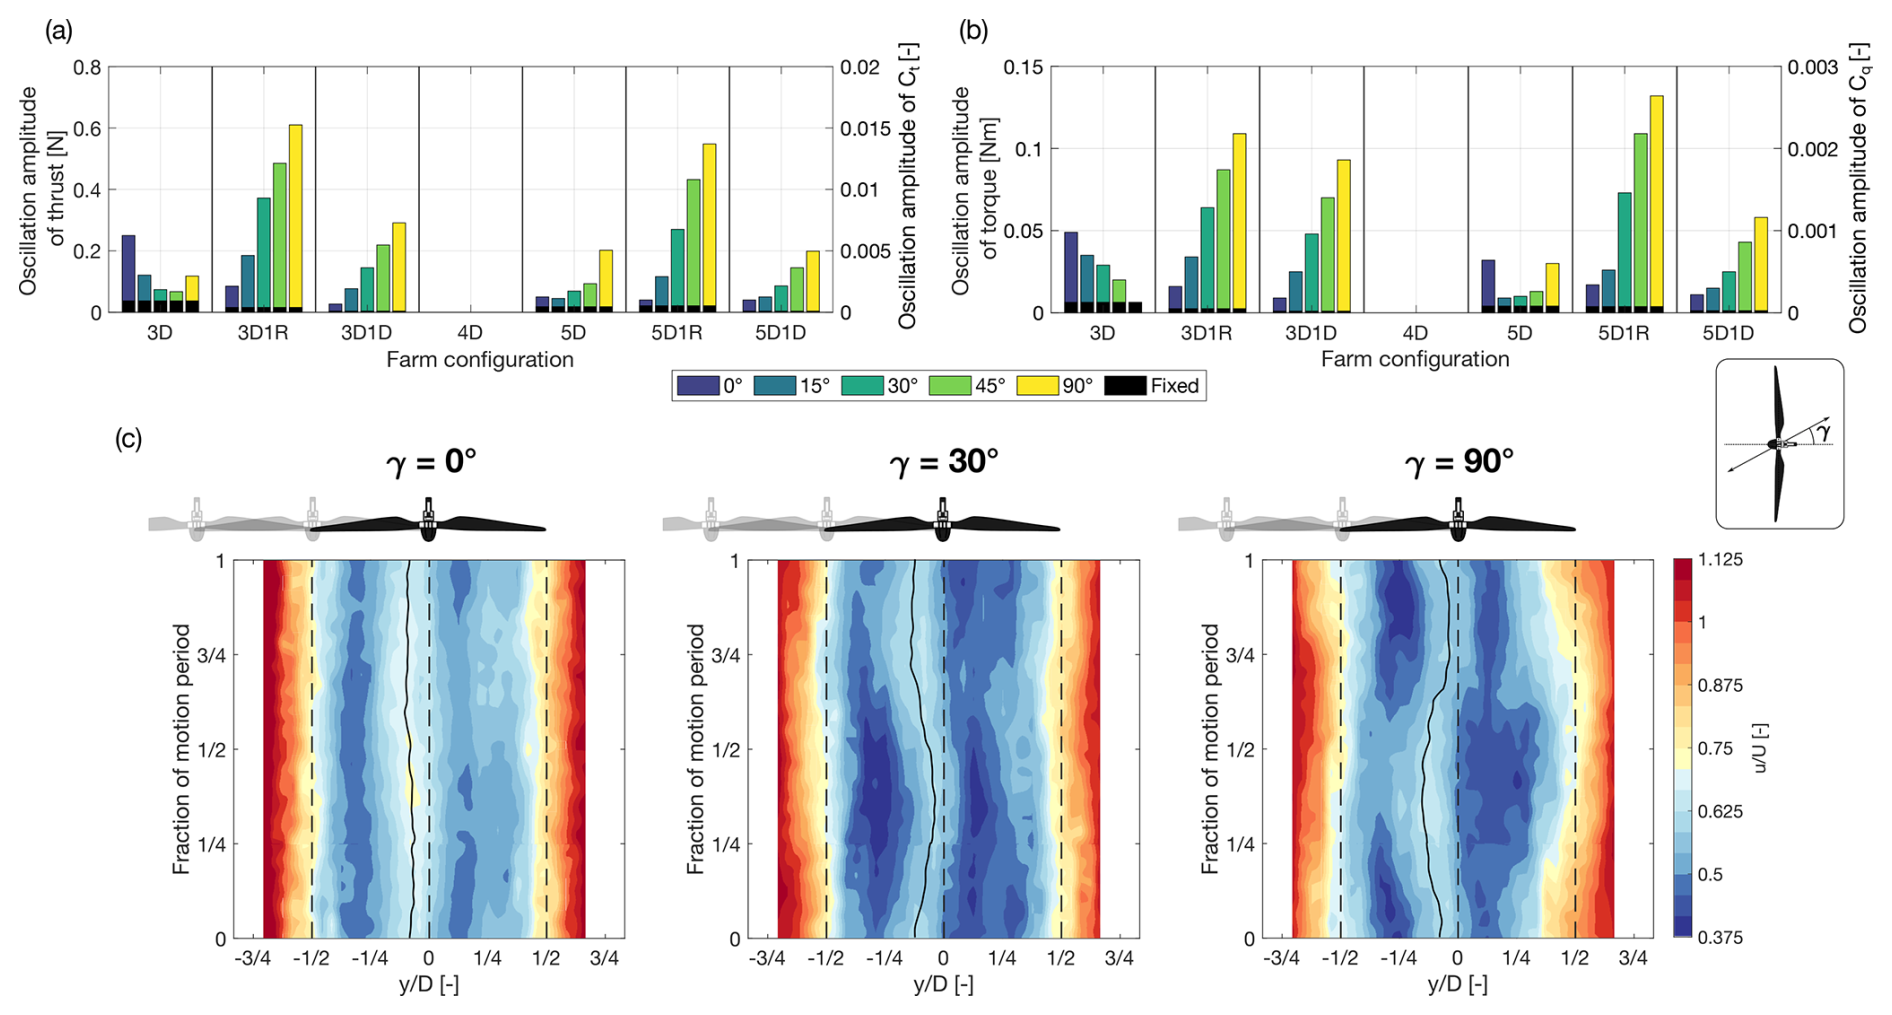
Figure 11Effect of wake meandering induced by platform translational motion with a displacement amplitude (am) of 0.032,m (model scale), a reduced frequency of 0.6, and various angles relative to the wind direction on the loads of a downstream wind turbine operating in the wake at different downstream distances and crosswind positions. (a) Amplitude of thrust oscillations on the downstream turbine. (b) Amplitude of torque oscillations on the downstream turbine. (c) Phase-averaged velocity in the wake of the upstream turbine at a downstream distance of 3 rotor diameters for a translational motion at different angles γ relative to the wind direction, reconstructed by interpolating hot-wire measurements acquired at discrete spatial locations; the solid black line tracks the vertical position of the upper minimum of the wake over one motion cycle.
In the 3D1R configuration, WT2 experiences zero-to-peak thrust variations of 0.4 N (equivalent to 20.3 kN at full scale) and torque variations of 0.074 Nm (281.2 kNm at full scale). These values are comparable to the load fluctuations observed in the 3D aligned configuration when WT1 undergoes pitch motion with an amplitude of 1.3° and a reduced frequency of 0.6. This indicates that a downstream turbine can experience similar dynamic loading either when fully immersed in a pulsating wake induced by pitch motion or when partially exposed to a laterally meandering wake caused by yaw motion.
3.3.2 Crosswind motion
Figure 11 shows the amplitude of thrust and torque oscillations on WT2 (Fig. 11a and b) together with the phase-averaged wake velocity field at 3D downstream (Fig. 11c), generated by sinusoidal surge–sway motion of WT1 defined in Sect. 2.3.1. The motions are characterized by a reduced frequency fr=0.6, a displacement amplitude am = 0.032 m (model scale), and different angles γ relative to the wind direction. The wake measurements were obtained from hot-wire data reported by Fontanella et al. (2025b), and the loads are shown for WT2 positioned at different locations relative to WT1 (loads were not measured for the 4D configuration).
When γ = 0°, the motion corresponds to pure surge, producing a pulsing behavior of the wake characterized by velocity oscillations concentrated near the wake center. By tracking the instantaneous position of the wake center over one motion cycle, a limited lateral peak-to-peak displacement of approximately 0.07D is obtained. As the motion angle increases, the wake exhibits more pronounced lateral meandering, similar to what is observed in yaw motion. The corresponding peak-to-peak displacement of the wake increases to about 0.25D for γ = 30° and reaches 0.28D for γ = 90°. For comparison, the lateral displacement of the nacelle is much smaller. In the γ = 30° case, the lateral motion amplitude is ≈ 0.014D, while for γ = 90° it is ≈ 0.026D. The resulting wake center displacement is therefore about 18 times larger than the rotor lateral motion in the γ = 30° case and about 11 times larger in the γ = 90° case. This clearly indicates that the perturbation introduced by rotor motion is significantly amplified as it develops through the wake, in agreement with the wind tunnel experiments of Messmer et al. (2025), who reported a pronounced lateral wake meandering induced by sway motion.
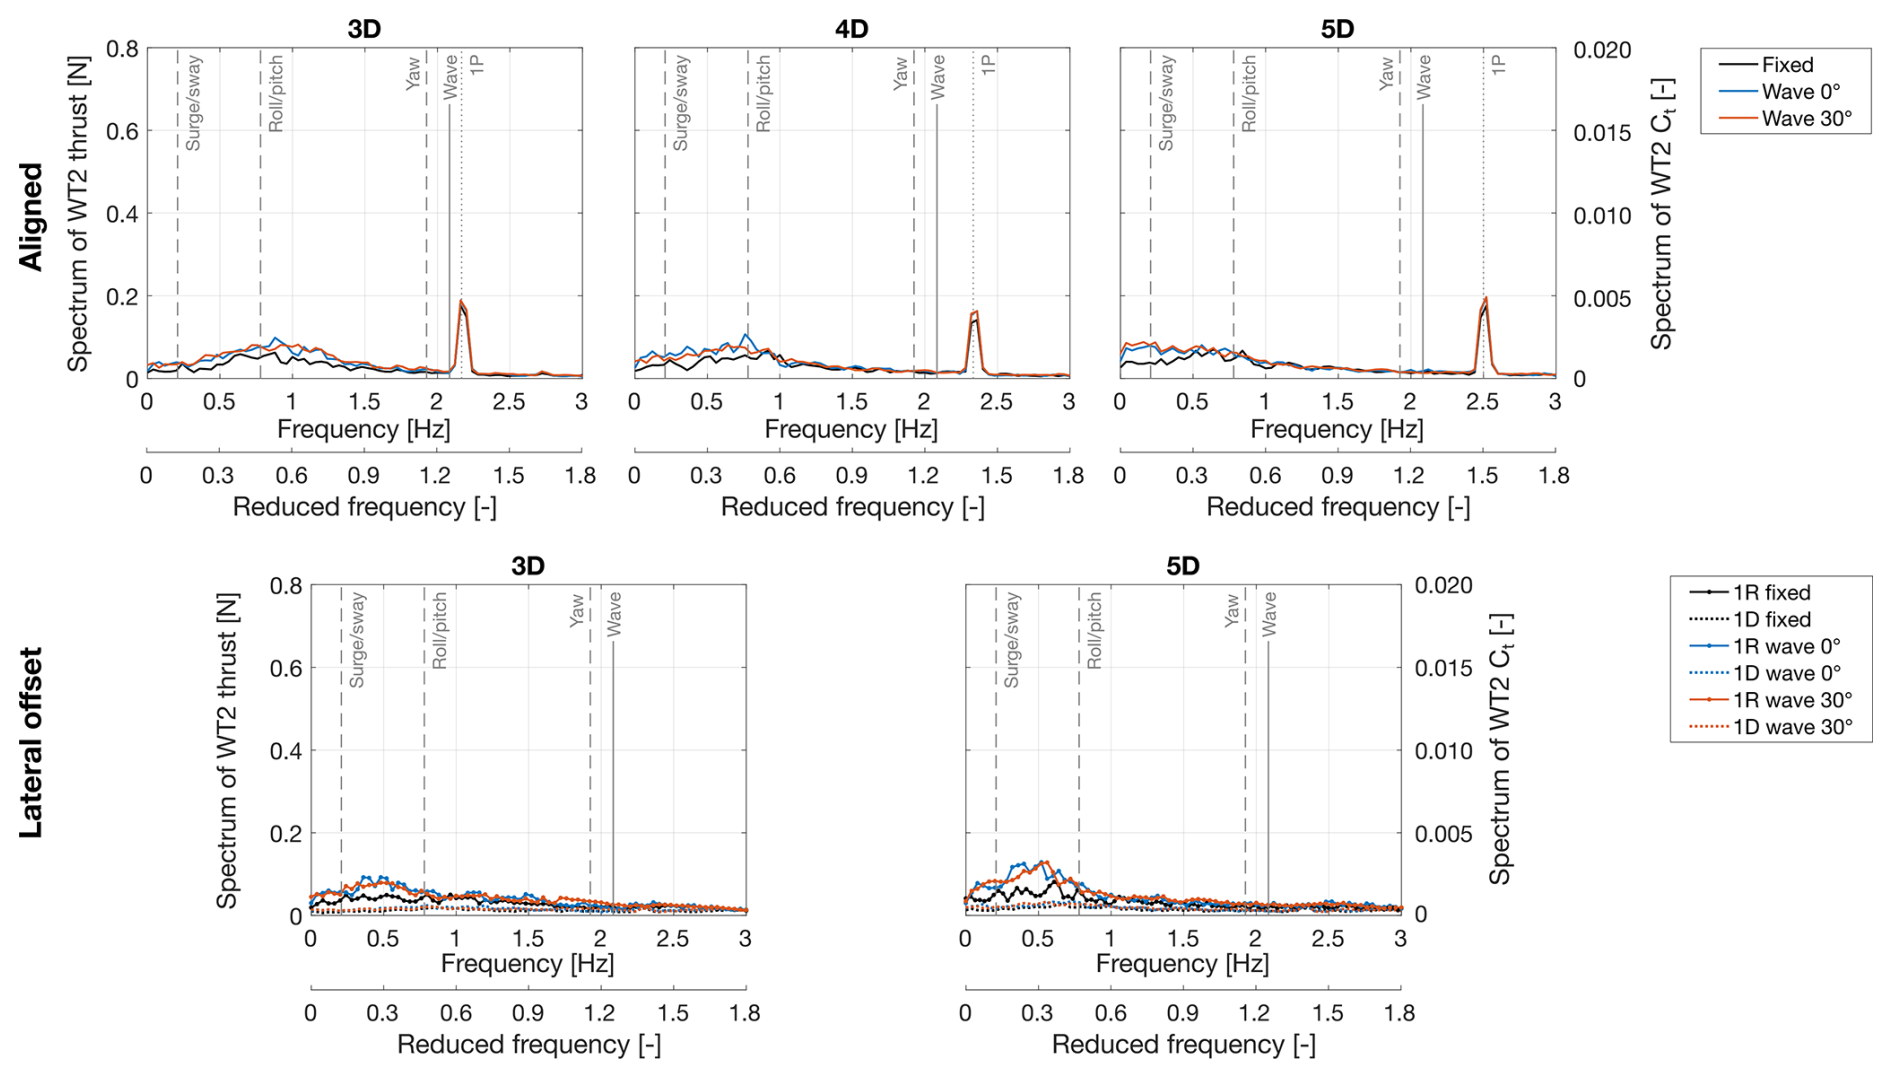
Figure 12Spectrum of the thrust force on a downstream wind turbine operating at various positions in the wake of an upstream turbine subjected to wave-induced motions. The motions correspond to those of the SOFTWIND 10 MW floating wind turbine under irregular waves, with a significant wave height of 5 m and a peak period of 12 s (full scale). The vertical dashed lines mark the natural frequencies of the upstream wind turbine rigid-body modes, the solid vertical line indicates the frequency associated with the peak wave period, and the dotted vertical line corresponds to the rotor rotation frequency of WT2 (1P).
In the farm configuration with aligned turbines at a distance of 3D, the amplitude of the WT2 load oscillations at the platform motion frequency decreases as the motion angle γ increases. This trend reflects a shift from wake pulsation to lateral meandering. As explained in the yaw motion case, meandering-induced velocity fluctuations tend to cancel out across the rotor when the turbines are aligned, reducing dynamic thrust and torque variations. At 5D spacing, this behavior is less pronounced: the dynamic loads on WT2 remain nearly constant for motion angles of up to 45° but show a noticeable increase at γ = 90°. This rise in loading is likely due to pure sway motion which induces strong velocity oscillations in the wake that do not fully cancel out across the rotor.
In farm configurations where WT2 is laterally offset, the trend of loads reverses compared to aligned configurations. Here, the amplitude of dynamic loads increases with the motion angle, as only a portion of WT2 rotor is exposed to the periodic lateral wake meandering. As in the yaw motion case, the dynamic loads are higher in the 1R configurations than in the 1D configurations, reflecting the greater extent of rotor-wake interaction. In the 3D1R configuration, when WT1 undergoes motion at a 30° angle to the wind direction, WT2 experiences zero-to-peak thrust variations of 0.37 N (18.7 kN at full scale) and torque variations of 0.064 Nm (243.2 kNm at full scale). These values are similar to load fluctuations seen in the 3D aligned configuration with pitch motion and in the 3D1R configuration with yaw motion. The load amplitudes during crosswind motions reach their maximum when WT1 moves orthogonally to the wind direction (γ = 90°), with thrust variations of 0.61 N (30.9 kN at full scale) and torque variations of 0.109 Nm (418.1 kNm at full scale).
3.4 Dynamic loads with irregular waves
Sinusoidal platform motions of the upstream wind turbine along different directions produce distinct dynamic loads on a downstream turbine operating in its wake. When WT1 undergoes wave-induced motion, it experiences simultaneous movements in all 6 degrees of freedom across a broad frequency range. The tests with wave-driven motions aim to assess whether the observations made under sinusoidal motion still hold in these more complex and realistic scenarios.
Figure 12 analyzes the effect of wave-driven motion on the thrust force spectrum of WT2, considering different wind farm configurations and wave headings of 0 and 30° relative to the wind direction.
In the cases with WT1 fixed, the thrust spectrum of WT2 is lowest when it is laterally offset by 1D from WT1. The downstream turbine operates mostly outside the wake, experiencing minimal influence from turbulence in the wake of the upstream turbine. In the aligned configuration and with a lateral offset of 1R, the thrust spectrum is noticeably higher as wake interactions are stronger.
When WT1 was subjected to wave-induced motion, the thrust spectrum of WT2 increased at reduced frequencies below 0.6 in both the aligned and 1R configurations. This indicates that upstream platform motions occurring near the surge/sway and roll/pitch natural frequencies contribute to dynamic loading of the downstream turbine in these layouts. The increase was similar for both wave headings (0 and 30°), suggesting limited directional sensitivity under the tested conditions.
Across all farm configurations, no increase in load amplitude was observed at frequencies near the spectral peak of the irregular waves (corresponding to a reduced frequency of approximately 1.25), despite the significant amplitude of platform motions occurring at this frequency (see Fig. 3). This result aligns with previous sinusoidal motion tests, which demonstrated that motions at reduced frequencies of around 1.2 do not lead to appreciable load oscillations on the downstream turbine.
To facilitate comparison with sinusoidal cases, the amplitude of the WT2 thrust spectrum in the irregular wave case was evaluated at a reduced frequency of 0.6 for the 3D configuration. With upstream motion driven by 0° waves, which excite primarily surge and pitch motions, the thrust spectral amplitude increased from 0.05 N (2.5 kN at full scale) in the fixed-WT1 case to 0.08 N (4.1 kN at full scale) under wave-induced motion. However, this remains substantially lower than the dynamic loads induced by prescribed sinusoidal motion: WT2 experienced zero-to-peak thrust fluctuations of 0.25 N (12.7 kN at full scale) with sinusoidal surge at fr=0.6 and 0.4 N (20.3 kN at full scale) with sinusoidal pitch at the same frequency. These comparisons highlight the more moderate impact of wave-driven motion on the dynamic loading of a downstream turbine compared to sinusoidal movements.
In cases with a lateral offset of 1R, the increase in WT2 thrust spectrum relative to the fixed case was more pronounced than in the aligned cases, particularly at reduced frequencies below 0.5. At frequencies above 0.6, the spectrum remained nearly unchanged. In configurations with a 1D lateral offset, the influence of wave-induced motion on WT2 thrust oscillations was minimal, confirming that the rotor was largely outside the region affected by the wake.
The analysis of aerodynamic loads from the two wind turbines was carried out from two complementary perspectives: the effect on average performance, particularly the power extracted by the downstream turbine, and the influence on dynamic oscillations of thrust and torque experienced by the downstream rotor.
4.1 Effects of platform motion on downstream turbine power
In the low-turbulence short-spacing conditions considered in the experiment (3–5 rotor diameters), large low-frequency motions of the upstream rotor were found to modestly enhance the power extracted by the downstream turbine. These enhancements were particularly pronounced when the upstream turbine underwent sinusoidal motions in yaw or crosswind directions. In two cases with aligned turbines, WT2 power increased by 26 % over the fixed-turbine baseline, but this corresponded to only a 2–3.5 W (0.3–0.5 MW at full scale) absolute gain. Similarly, in partially offset layouts, surge–sway motions yielded increases of up to 5.4 W (0.82 MW at full scale). These modest absolute gains are attributed to the highly persistent wake produced by the combination of low-turbulence inflow, limited vertical entrainment of kinetic energy due to flow confinement, and the high thrust loading of the upstream turbine, all of which resulted in very low baseline power for WT2 in the fixed case.
The power gains observed under idealized sinusoidal motion were only partially reproduced in tests involving realistic wave-driven platform motions of a 10 MW spar floating wind turbine. In particular, waves aligned with the wind direction (0° heading), which strongly excited pitch motion, resulted in power gains of the downstream turbine comparable to those observed under sinusoidal pitch motion. In contrast, wave excitation at 30° incidence, which introduces combined crosswind and yaw motions, did not consistently lead to power increases in the downstream turbine. This contrasts with the sinusoidal motion tests, where motions in the yaw and crosswind directions were generally associated with improvements in wake recovery and power output. These results suggest that the irregularity, phase coupling, and lower coherence of realistic platform motions may limit the effectiveness of wake recovery mechanisms driven by rotor motion, which appear more pronounced under idealized single degree-of-freedom sinusoidal excitations.
4.2 Influence of flow confinement on wake recovery
It should be noted that, in the wind tunnel environment, both the inflow velocity around the wind turbines and the wake losses are influenced by flow confinement. Blockage effects arising from the presence of the rotors in the confined test section accelerate the flow outside the wake, which is particularly relevant for configurations in which the downstream turbine is partially exposed to the free stream. In addition, the proximity of the ceiling may restrict vertical entrainment of high-momentum flow into the wake, thereby contributing to a more persistent wake deficit than would be expected under open-field conditions. Despite these confinement effects, the relative differences in WT2 power between the fixed and moving WT1 cases are primarily attributable to motion-induced wake dynamics, since all configurations were tested under the same experimental setup.
However, confinement may influence not only the absolute magnitude of wake losses but also the way wake recovery responds to different platform motion types. Because the flow in the wind tunnel is vertically constrained by the ceiling, vertical wake deflection and the associated enhancement of mixing may be limited. This constraint is particularly relevant for pitch-induced wake oscillations, which may promote recovery through vertical wake displacement and enhanced entrainment of kinetic energy. In contrast, under open-field conditions, vertical confinement is effectively present only due to the ground, while the flow above the rotor is unbounded. Therefore, vertical wake deflection and entrainment mechanisms may develop differently at full scale compared to the wind tunnel environment.
Consequently, the quantitative ranking of the different motion types in terms of their effectiveness in enhancing energy recovery may be influenced by the specific confinement characteristics of the present experimental setup. This aspect should therefore be considered when extrapolating the results to full-scale conditions. Additional benchmarking against scale-model experiments performed under different levels of flow confinement, as well as against numerical simulations conducted in progressively less constrained computational domains, would help to isolate and quantify the impact of confinement on the observed trends.
4.3 Dynamic loading induced by wake motion
Regarding dynamic loading, sinusoidal motion tests clearly showed that the frequencies of upstream turbine motion were directly reflected in the aerodynamic loads on the downstream rotor, with a well-defined periodic response. The magnitude of these dynamic loads depended on turbine distance, lateral offset, and the type of motion of the upstream wind turbine. For instance, load fluctuations reached up to 12 % of the mean torque and 3 % of the mean thrust when WT2 operated fully within the wake of WT1, which was undergoing motion aligned with wind (surge or pitch), resulting in wake pulsation. Comparable load oscillation amplitudes were also observed when WT2 was only partially immersed in a laterally meandering wake, generated by crosswind or yaw motions of WT1.
Both wake pulsing and wake meandering can induce substantial cyclic loading on a turbine operating within the wake, pulsing predominantly in fully aligned turbine configurations and meandering when there is a lateral offset between the turbines. In real operating conditions, the first scenario is likely to occur when waves are aligned with the wind, exciting surge and pitch motions, and when wind is aligned to wind farm rows placing downwind turbines directly in the full wake of upstream machines. The second scenario may arise under significant wind–wave misalignment and when the wind approaches the wind farm at an angle, resulting in partial wake exposure for downstream turbines and increased wake meandering due to lateral or yaw-induced motion.
Irregular wave-induced motions reproduced these dynamics with broader spectral content but lower amplitudes of load oscillations on the downstream turbine. Key behaviors, such as increased load oscillations at low frequencies, persisted, although the absolute loading levels were smaller than those observed in the sinusoidal motion tests.
Compared to atmospheric boundary layer inflow, the low-turbulence conditions of the present experiment produce a highly coherent wake with steep velocity gradients at its boundaries. In this inflow environment, the wake response to platform motion – particularly forced meandering – induces significant variations in the inflow experienced by a downstream turbine. As the wake moves laterally across the downstream rotor, the strong velocity gradients give rise to pronounced temporal fluctuations in the velocity encountered by the blades, thereby amplifying the associated dynamic loads. In contrast, under higher-turbulence atmospheric conditions, stronger turbulent mixing and natural wake meandering would smooth the wake structure and accelerate recovery of the velocity deficit. This would moderate the periodic inflow fluctuations experienced by a downstream rotor and, consequently, reduce the sensitivity of its dynamic loads to platform-induced wake oscillations.
Conversely, flow confinement – particularly due to the proximity of the ceiling – may restrict the amplitude of wake deflection, especially in the vertical direction. This limitation can attenuate motion-induced loading mechanisms on the downstream turbine that depend on vertical wake displacement, such as the periodic vertical meandering generated by platform pitch motion.
4.4 Implications for floating wind farms and study limitations
Overall, the results on wind farm power and dynamic loading indicate a tradeoff: platform motions can promote modest downstream energy gains by enhancing wake recovery, but they also introduce additional cyclic loading on downstream turbines. Whether this tradeoff persists under higher-turbulence atmospheric inflow, at larger turbine spacing, or when active blade pitch and generator torque control are considered remains an open question. In realistic atmospheric boundary layer conditions, turbulence is expected to become the dominant driver of wake behavior, governing mixing, recovery, and natural meandering (Wu and Porté-Agel, 2012; Hodgson et al., 2023).
It is also important to note that in this study only the upstream turbine was subjected to motion, while the downstream one remained fixed. This configuration was adopted to isolate the effect of wake-induced unsteady loading on the downstream turbine and to enable a clearer identification of the underlying physical mechanisms. The use of a fixed downstream turbine therefore represents a tightly controlled and physically meaningful idealization, which is more readily reproducible in numerical simulations, thereby supporting the validation and further development of numerical modeling tools for floating wind farms.
In reality, both turbines in a floating array will experience platform motion induced by waves and wind. If the downstream turbine also undergoes motion, its aerodynamic loading will be affected not only by the wake fluctuations generated by the upstream turbine but also by its own platform kinematics. The phasing between the velocity oscillations in the wake and the motion of the downstream rotor may play a critical role: depending on whether the downstream turbine moves in phase or out of phase with the wake fluctuations, the aerodynamic loads can be amplified or mitigated. Moreover, the motions of neighboring turbines are not independent, since wave forcing is spatially correlated as waves propagate across the farm. Such correlated motions could further influence wake–motion interactions. While these coupled effects are beyond the scope of the present work, they highlight the need to account for wave propagation and correlated turbine responses in future studies.
Finally, further research is needed to assess the validity of the conclusions of this work when the downstream turbine is located at larger distances from the upstream one and when static rotor inclination alters the effective rotor-swept area exposed to the flow or deflects the wake vertically, as these effects were not captured in the present experimental setup.
Through wind tunnel experiments, this study investigated how the motion of a floating wind turbine affects the performance and dynamic loading of a downstream turbine operating in its wake. The upstream turbine was subjected to controlled platform motions, including both sinusoidal excitations and motions induced by irregular waves, while the downstream turbine remained fixed and was tested at different relative positions.
Under the low-turbulence inflow and short turbine spacings investigated (3–5 rotor diameters), large-amplitude low-frequency motions of the upstream turbine – particularly in the yaw and crosswind directions – produced moderate increases in the power output of the downstream turbine. It should be noted, however, that the proximity of the wind tunnel ceiling may constrain vertical wake deflection induced by pitch motion, thereby limiting its ability to enhance mixing and promote wake recovery. Consequently, although yaw and crosswind motions produced the largest power gains for the downstream turbine in the present experimental setup, further investigations under flow conditions representative of full-scale turbines – where the flow above the rotor is unbounded – are required before generalizing the relative effectiveness of different platform motion directions to open-field conditions.
In the most favorable cases, the downstream turbine gained up to 26 % relative to the fixed-turbine baseline, although the corresponding absolute increase remained limited due to the very low baseline power associated with the persistent wake of the upstream turbine. These gains were most evident in sinusoidal tests and were only partially reproduced under realistic wave-induced motion scenarios.
At the same time, platform motion of the upstream turbine introduced periodic flow disturbances that propagated downstream and increased dynamic loading on the waked turbine. The magnitude and frequency content of these dynamic loads depended on the type of motion, relative turbine positioning, and turbine-to-turbine distance. Oscillation amplitudes of the downstream turbine loads at the frequency of the upstream turbine motion reached up to 12 % of the mean torque and 3 % of the mean thrust in certain farm configurations. Both wake pulsing induced by along-wind motions and lateral wake meandering driven by crosswind and yaw motions contributed comparably to the cyclic loading of the downstream turbine. Key patterns in the aerodynamic loads of the downstream wind turbine identified under sinusoidal motion were also evident in tests involving realistic motions induced by irregular waves. However, the resulting load amplitudes were lower, reflecting the broader spectral content of the wave-driven platform response and its influence on the upstream turbine wake.
Overall, platform-induced wake dynamics can modestly enhance the energy capture of a waked turbine but also introduce increased cyclic loads. Sinusoidal motion tests are effective for isolating the key mechanisms governing wake response and turbine–wake interactions, whereas tests with motions induced by irregular waves provide a more realistic assessment of turbine performance and loading.
Further studies are needed to assess whether the trends observed in this work persist under higher-turbulence inflows and when multiple turbines are in motion. However, the findings of this study clearly underline the importance of considering wake–motion coupling in the design and analysis of future floating wind farms.
The aerodynamic performance of the scale model rotor was evaluated in a steady and uniform wind field with a turbulence intensity of 1.5 %, matching the free-stream inflow conditions of the rest of this study. Measurements were performed at a constant blade pitch angle of 0°, while the tip-speed ratio was varied by adjusting the rotor speed at a fixed free-stream wind speed of 4 m s−1.
Figure A1 reports the measured thrust coefficient (Ct) and power coefficient (Cp) as functions of tip-speed ratio both with and without blockage correction. The blockage correction was performed using Glauert's wind tunnel interference model presented by Inghels (2013). The correction defines an increment to the free-stream wind speed. The increased wind speed is then used for the computation of the performance coefficients. The wind speed correction depends on the ratio between the rotor-swept area and the wind tunnel cross-section, as well as on the turbine thrust coefficient.
After correction, the model rotor Ct closely matches the DTU 10 MW reference turbine near the design tip-speed ratio of 7.5. The Cp curve has a comparable shape to that of the reference turbine, but its maximum value is lower (0.38 vs. 0.48). This reduction is attributed to the lower efficiency of airfoils at low Reynolds numbers, which is only partially mitigated by the use of a low Reynolds airfoil in the scale model blades.
In the main body of the paper, performance results are reported without blockage correction, since available correction methods are not applicable to downstream turbines operating in wakes.
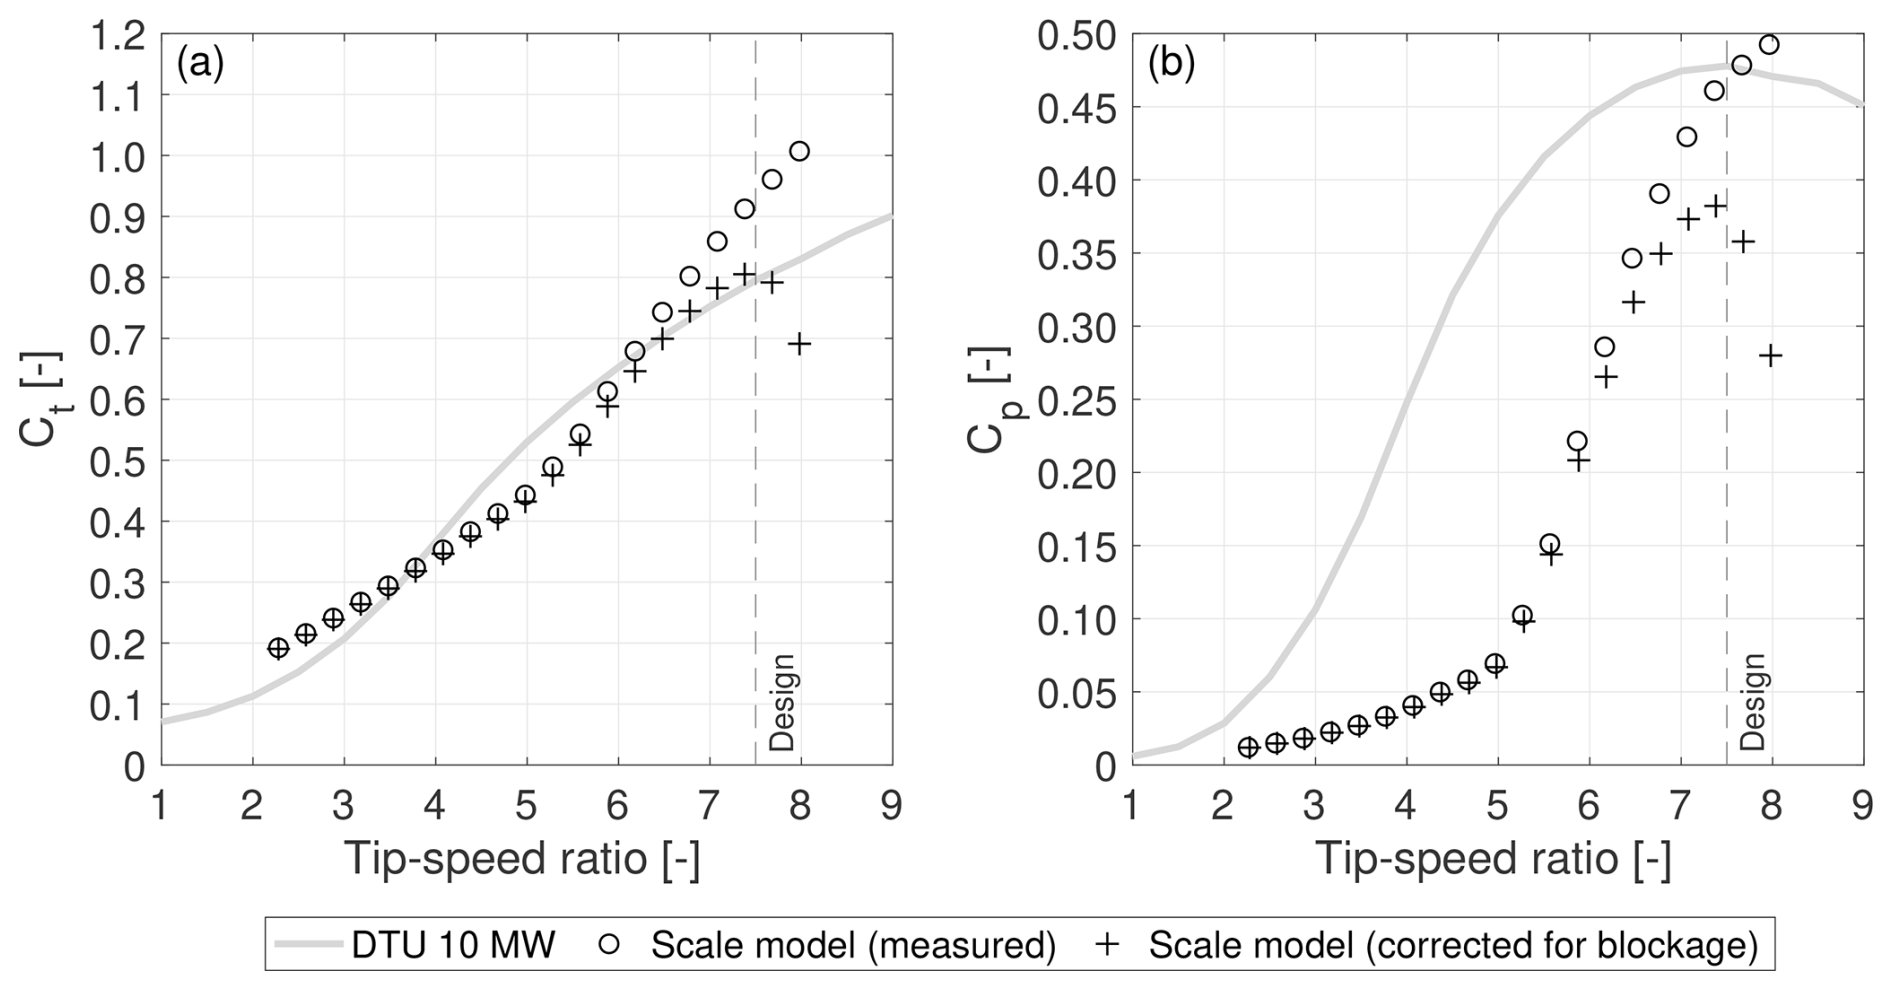
Figure A1Thrust (Ct) and power (Cp) coefficients of the rotor at different tip-speed ratios. The dashed vertical line indicates the design tip-speed ratio of 7.5.
The accuracy of the aerodynamic load estimation of WT1 obtained with the two-test subtraction procedure described in Sect. 2.1.1 was assessed through two complementary analyses.
First, two identical no-wind, rotor-locked tests were performed for representative surge and pitch motion cases. The resulting load time histories were processed and subtracted from each other following the same procedure adopted for the wind-on minus no-wind tests. Since both no-wind measurements contain only inertial and gravitational contributions associated with the prescribed rigid-body motion, their difference provides an estimate of the residual error introduced by the subtraction procedure, primarily due to possible non-identical structural response and measurement noise. For the surge case (fr=0.6, am = 0.032 m), the residual load amplitude at the motion frequency was 0.037 N in thrust and 0.001 Nm in torque. Compared to the aerodynamic load oscillation amplitudes obtained under the same motion condition (1.95 N in thrust and 0.46 Nm in torque), this corresponds to relative uncertainties of approximately 2 % and 0.2 %, respectively. For the pitch case (fm=0.6, am = 1.3°), the residual load amplitudes were 0.379 N in thrust and 0.016 Nm in torque. Relative to the corresponding aerodynamic load oscillation amplitudes (2.35 N in thrust and approximately 0.35 Nm in torque), this yields relative uncertainties of about 16 % and 5 %, respectively.
Second, seven repeated wind-on tests were performed for each of the two motion conditions (corresponding to WT2 operating in the different wind farm configurations listed in Table 2, while WT1 underwent the same prescribed motion in each case). This analysis assesses the repeatability of the wind-on response. Across the repeated tests, the oscillation amplitudes of aerodynamic thrust and torque at the motion frequency exhibited a standard deviation of 1 %–3 % relative to their mean value, indicating a high level of repeatability.
The thrust-equivalent wind speed (UTE) was estimated from measured rotor thrust using a calibrated thrust-rotor–speed-wind speed relation. Thrust was preferred over power as the feedback variable because it is less sensitive to Reynolds number effects at the model scale.
The estimator relies on a pre-computed thrust map Fx(ω,U) obtained from a blade-element momentum (BEM) model of the rotor, previously validated against wind tunnel measurements (Bergua et al., 2023), where it showed excellent agreement with the measured thrust and power characteristics. The model was simulated under steady and uniform inflow for a range of wind speeds U and rotor speeds ω, providing the corresponding steady thrust force Fx.
During the experiments, the rotor speed and thrust signals were averaged over the acquisition window to obtain the mean rotor speed ωm and mean thrust force F x,m. The pair was then used to invert the pre-computed thrust map and estimate the corresponding thrust-equivalent wind speed:
where denotes the inversion of the thrust map. This process is illustrated in Fig. C1.
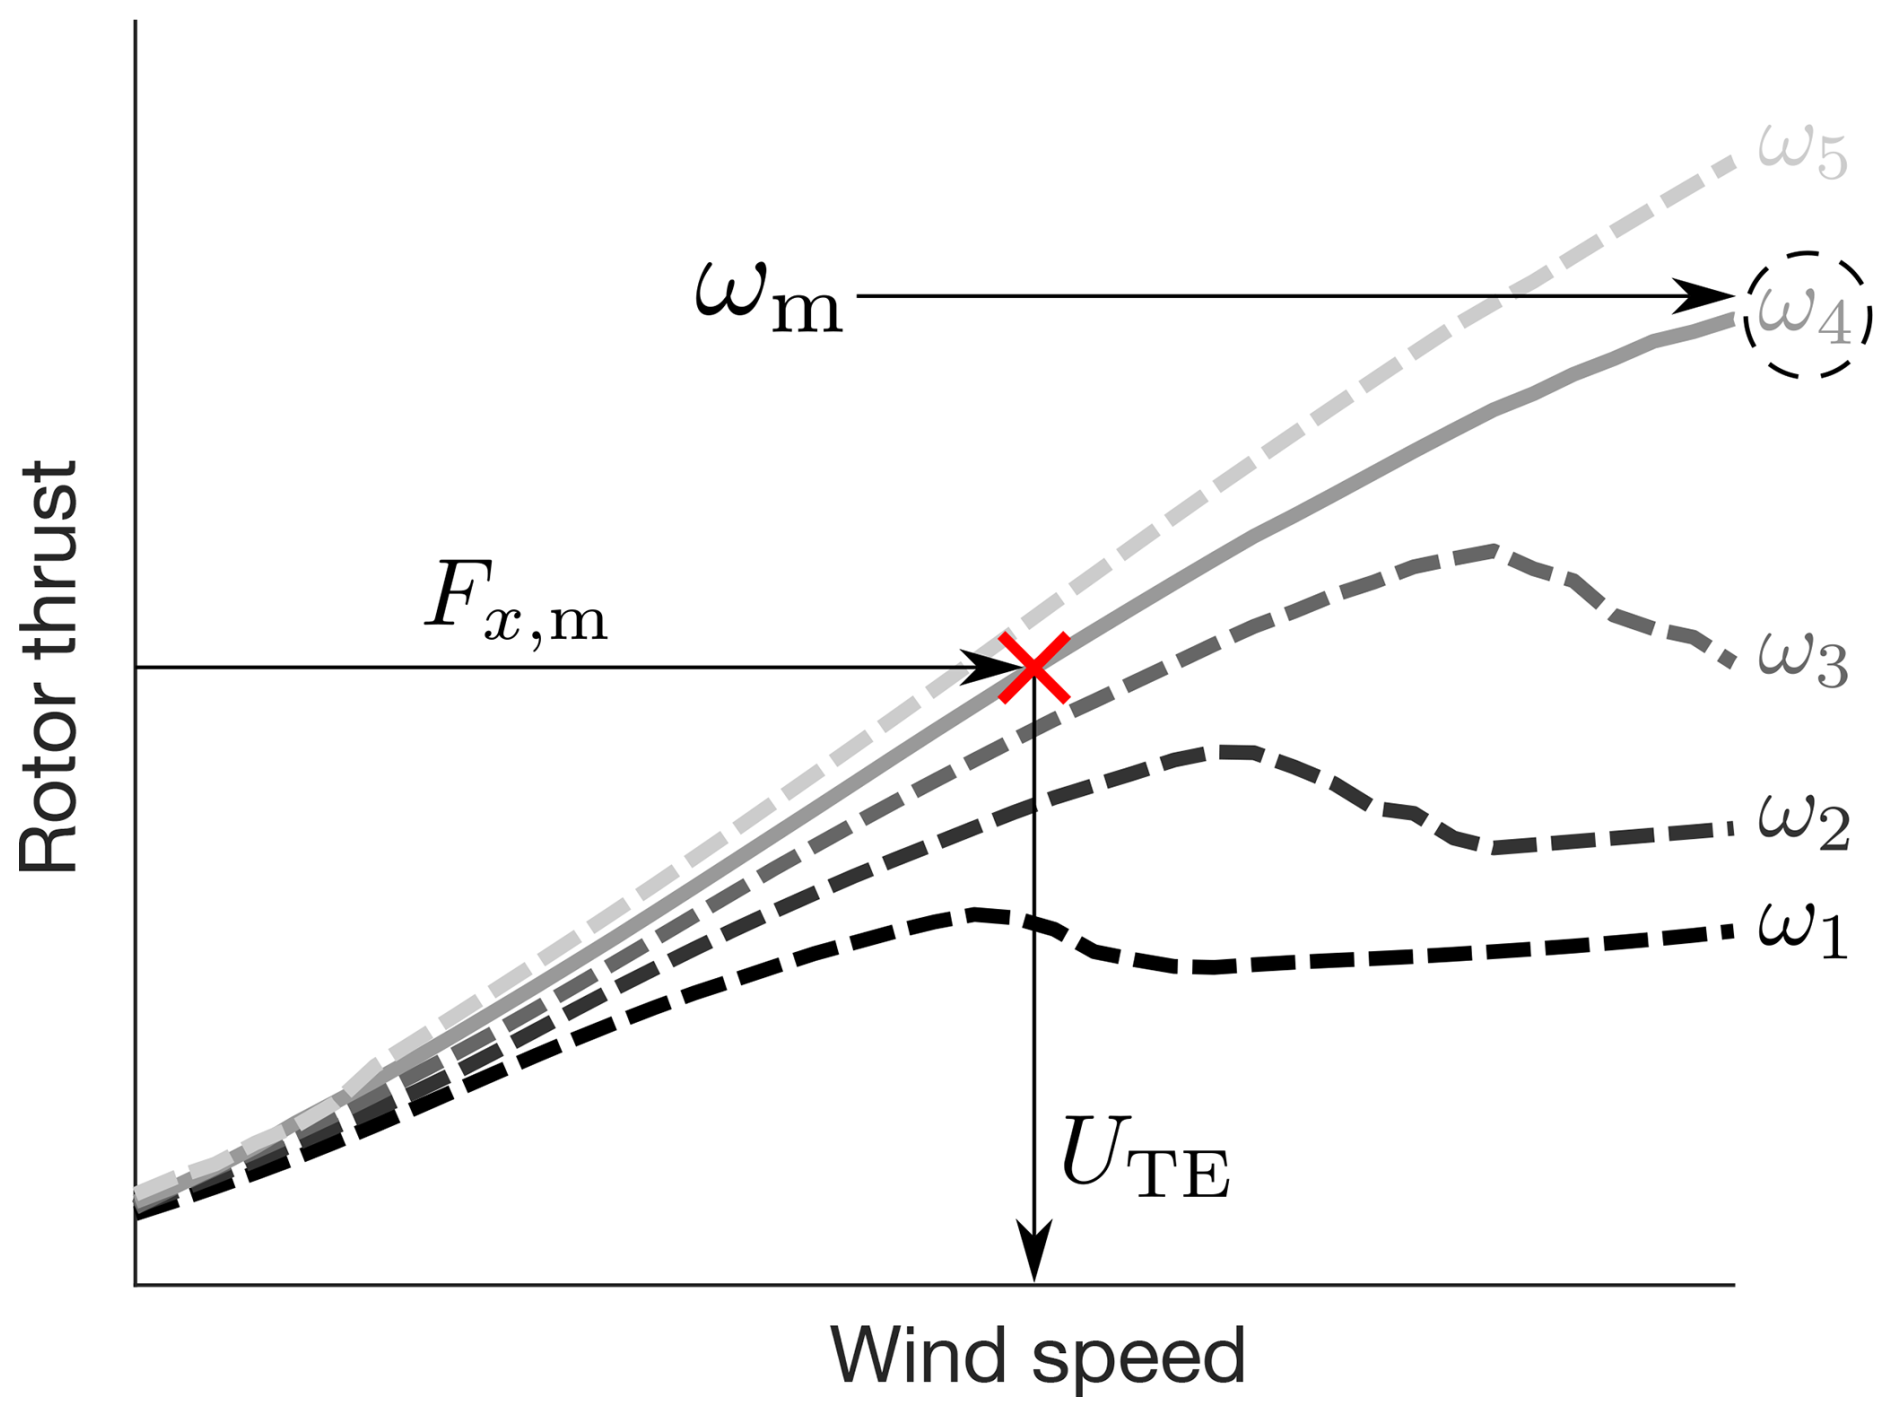
Figure C1Estimation of thrust-equivalent wind speed (UTE) by inverting the BEM-based thrust map Fx(ω,U). The measured mean thrust Fx,m and rotor speed ωm define a unique operating point (red marker) from which UTE is obtained.
This appendix provides the complete set of time-averaged power measurements for all wind farm configurations and motion scenarios investigated in this study. Because the rotor speed was prescribed and constant in each farm configuration, the aerodynamic power of both turbines was obtained directly from the measured torque and the known rotational speed. In all tests, WT1 operated at a fixed rotor speed of 240 rpm and maintained a time-averaged power output of 72 W (10.93 MW at full scale). The power of WT2 depended on the farm configuration and on its position relative to WT1.
Table D1 reports the time-averaged WT2 power for the fixed tower-base condition across all configurations, together with the fixed rotor speeds at which WT2 was operated. For each configuration, the table also lists the minimum and maximum WT2 power recorded over the repeated tests. The power ratio is defined as the ratio between the WT2 and WT1 power.
WT1 sinusoidal motions were tested using different combinations of amplitudes and frequencies for each wind farm configuration. Table D2 reports the corresponding time-averaged WT2 power in the case of surge motion, Table D3 for pitch motion, Table D4 for yaw motion, and Table D5 for combined surge–sway motion. In Tables D2–D6, the power ratios that exceed the maximum ratio observed in the fixed tower-base case (Table D1) are highlighted in bold.
Table D1Time-averaged power output of WT2 for the fixed tower-base condition across the different farm configurations. WT2 was operated at fixed rotor speeds. Values in brackets indicate the minimum and maximum WT2 power recorded over the tests, along with the corresponding minimum and maximum power ratios when normalized by the average power of WT1.
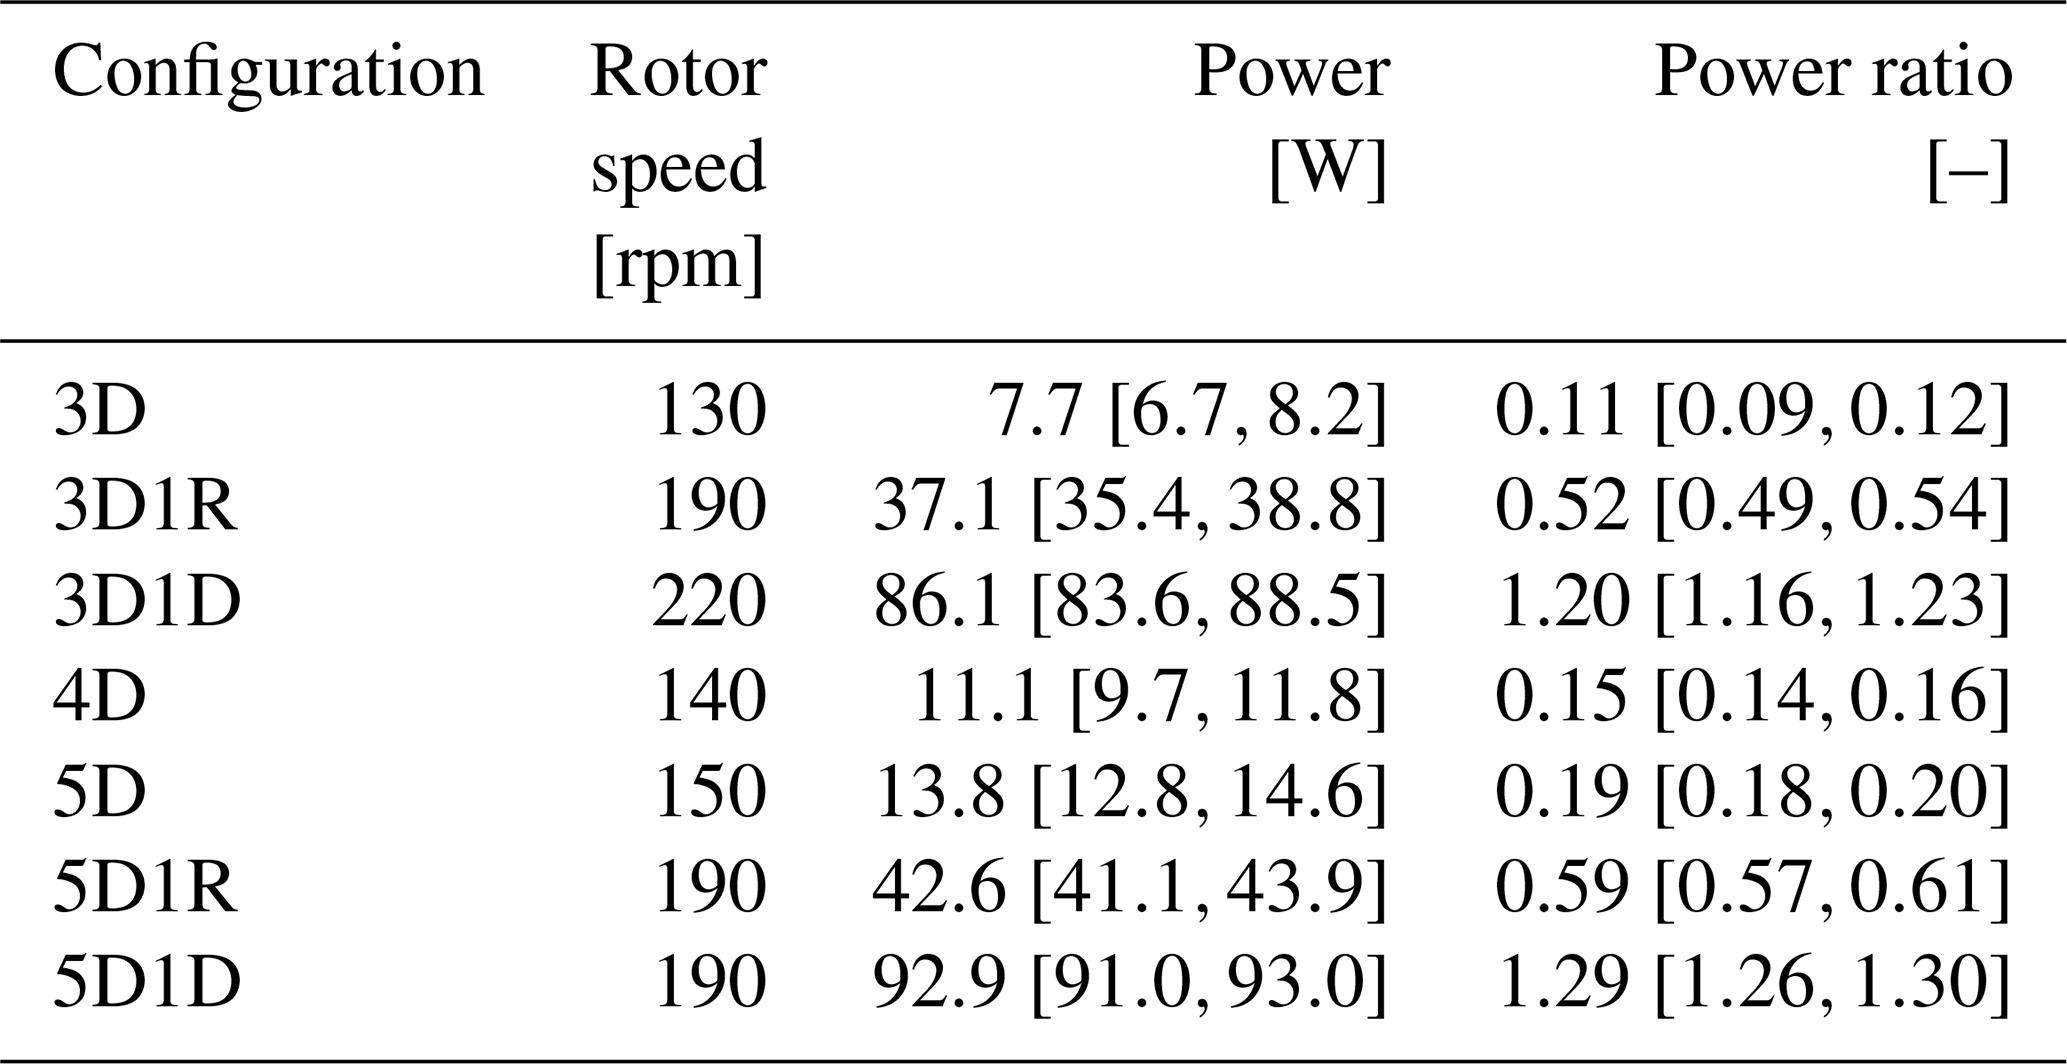
Table D2Time-averaged power output of WT2 for the different farm configurations under surge motion of WT1. WT2 was operated at a fixed rotor speed, set according to each farm configuration. Values highlighted in bold correspond to power ratios that exceed the maximum ratio observed in the fixed tower-base case (Table D1).
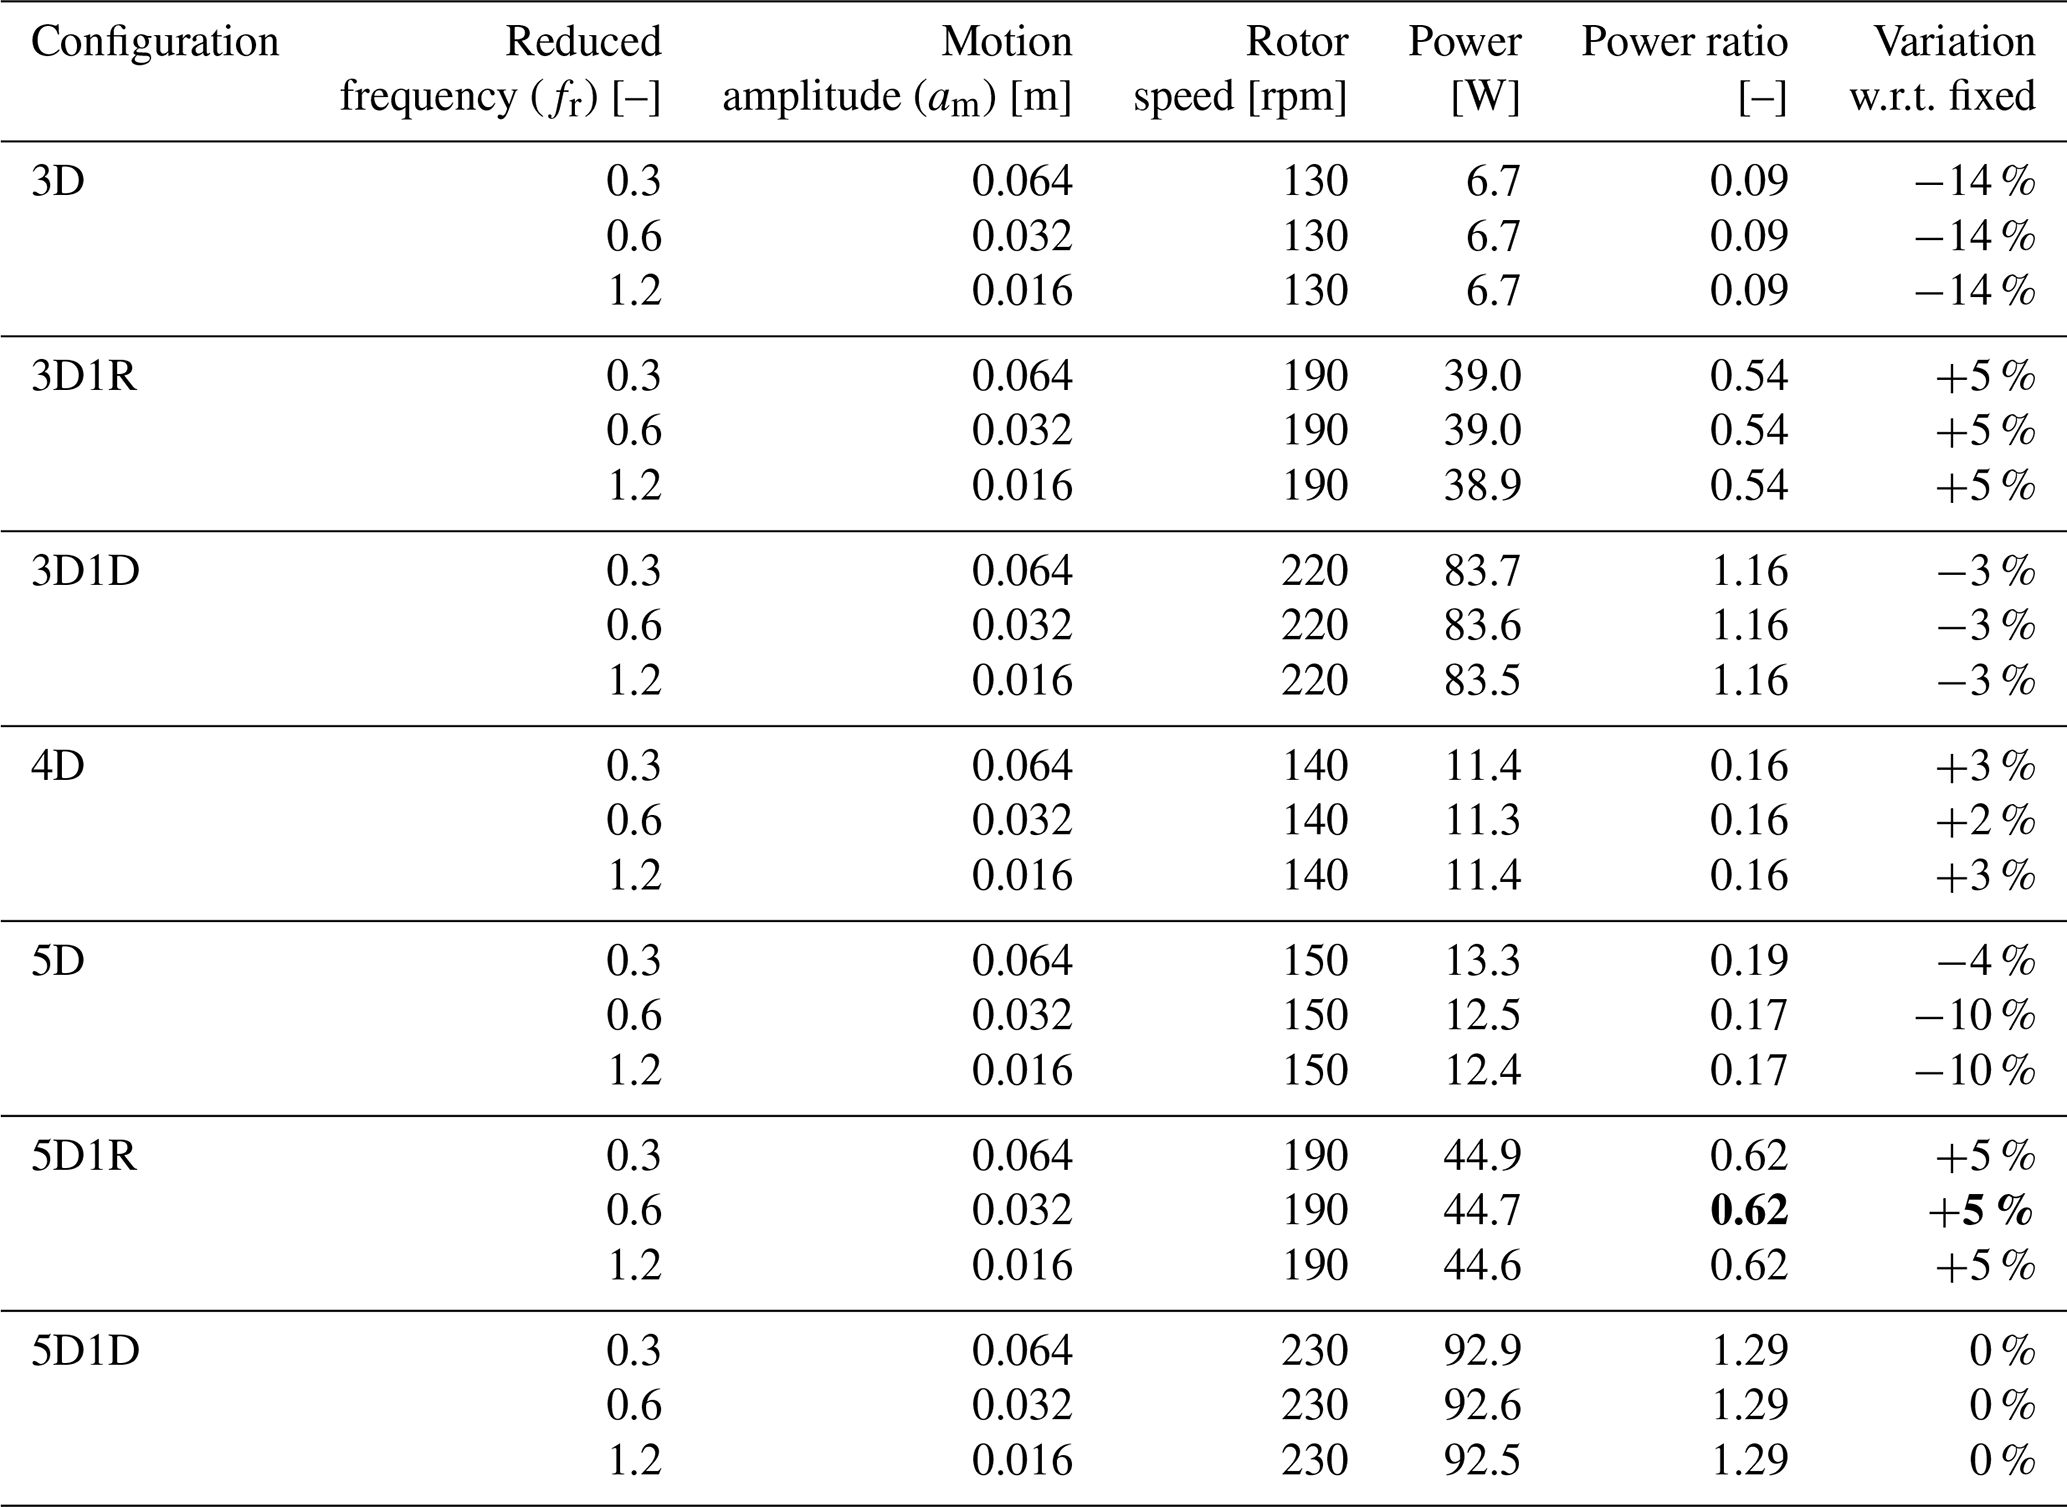
Table D6 reports the time-averaged power of WT2 for the different farm configurations when WT1 was subjected to wave-driven platform motions generated for various wave directions. In these tables, the power ratios that exceed the maximum ratio observed in the fixed tower-base case (Table D1) are highlighted.
Table D3Time-averaged power output of WT2 for the different farm configurations under pitch motion of WT1. WT2 was operated at a fixed rotor speed, set according to each farm configuration. Values highlighted in bold correspond to power ratios that exceed the maximum ratio observed in the fixed tower-base case (Table D1).
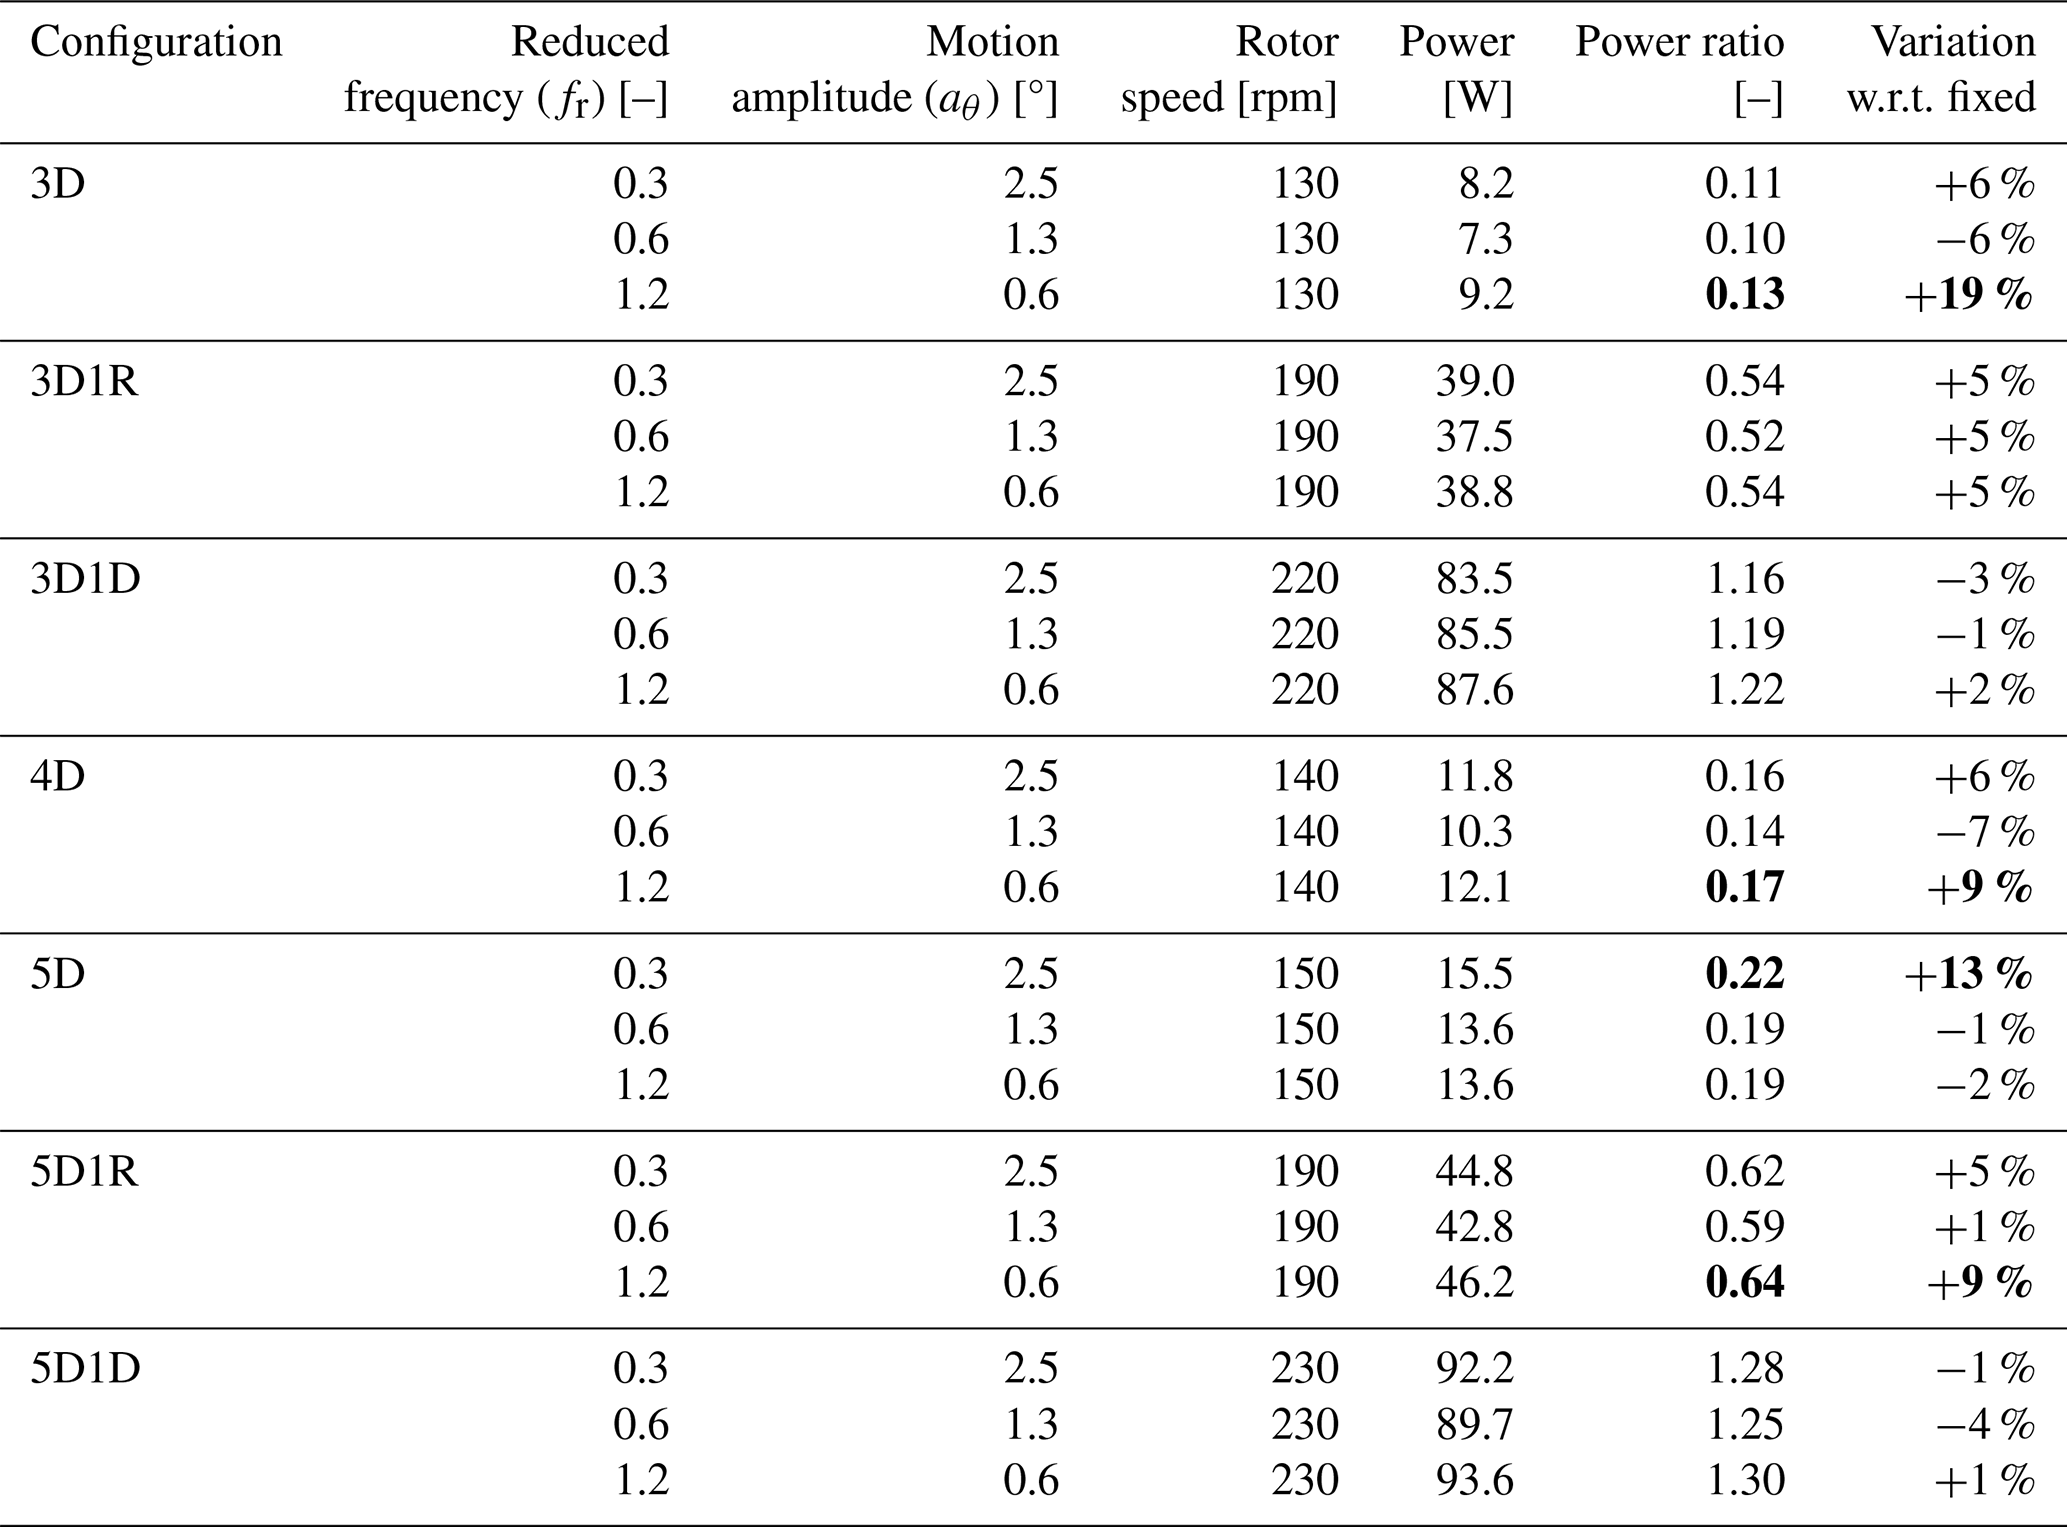
Table D4Time-averaged power output of WT2 for the different farm configurations under yaw motion of WT1. WT2 was operated at a fixed rotor speed, set according to each farm configuration. Values highlighted in bold correspond to power ratios that exceed the maximum ratio observed in the fixed tower-base case (Table D1).
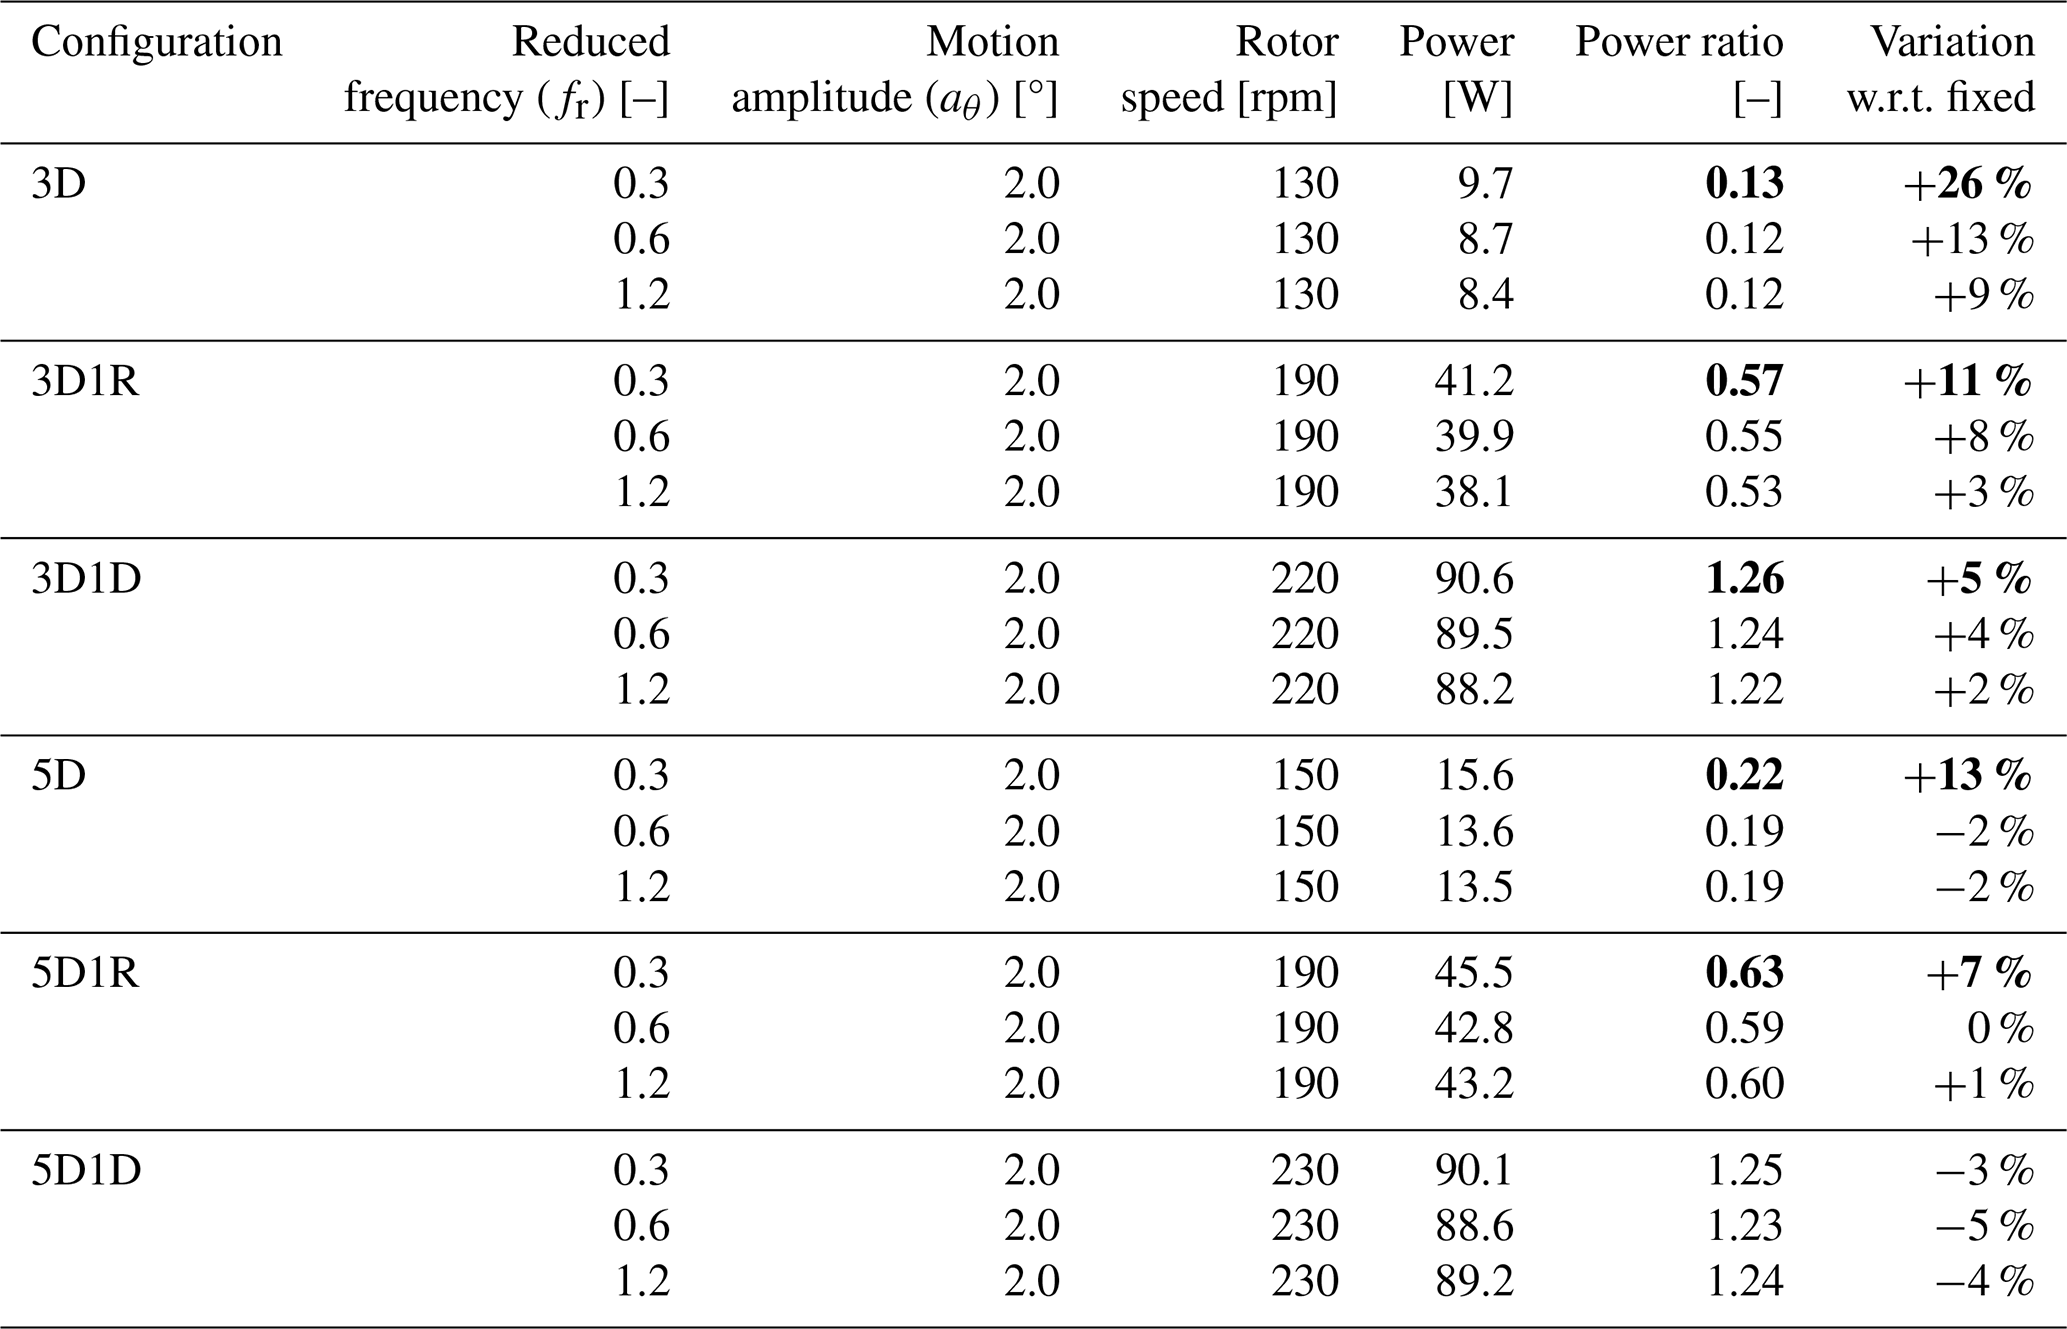
Table D5Time-averaged power output of WT2 for the different farm configurations under surge–sway motion of WT1 (all motions with an amplitude of 0.032 m). WT2 was operated at a fixed rotor speed, set according to each farm configuration. Values highlighted in bold correspond to power ratios that exceed the maximum ratio observed in the fixed tower-base case (Table D1).
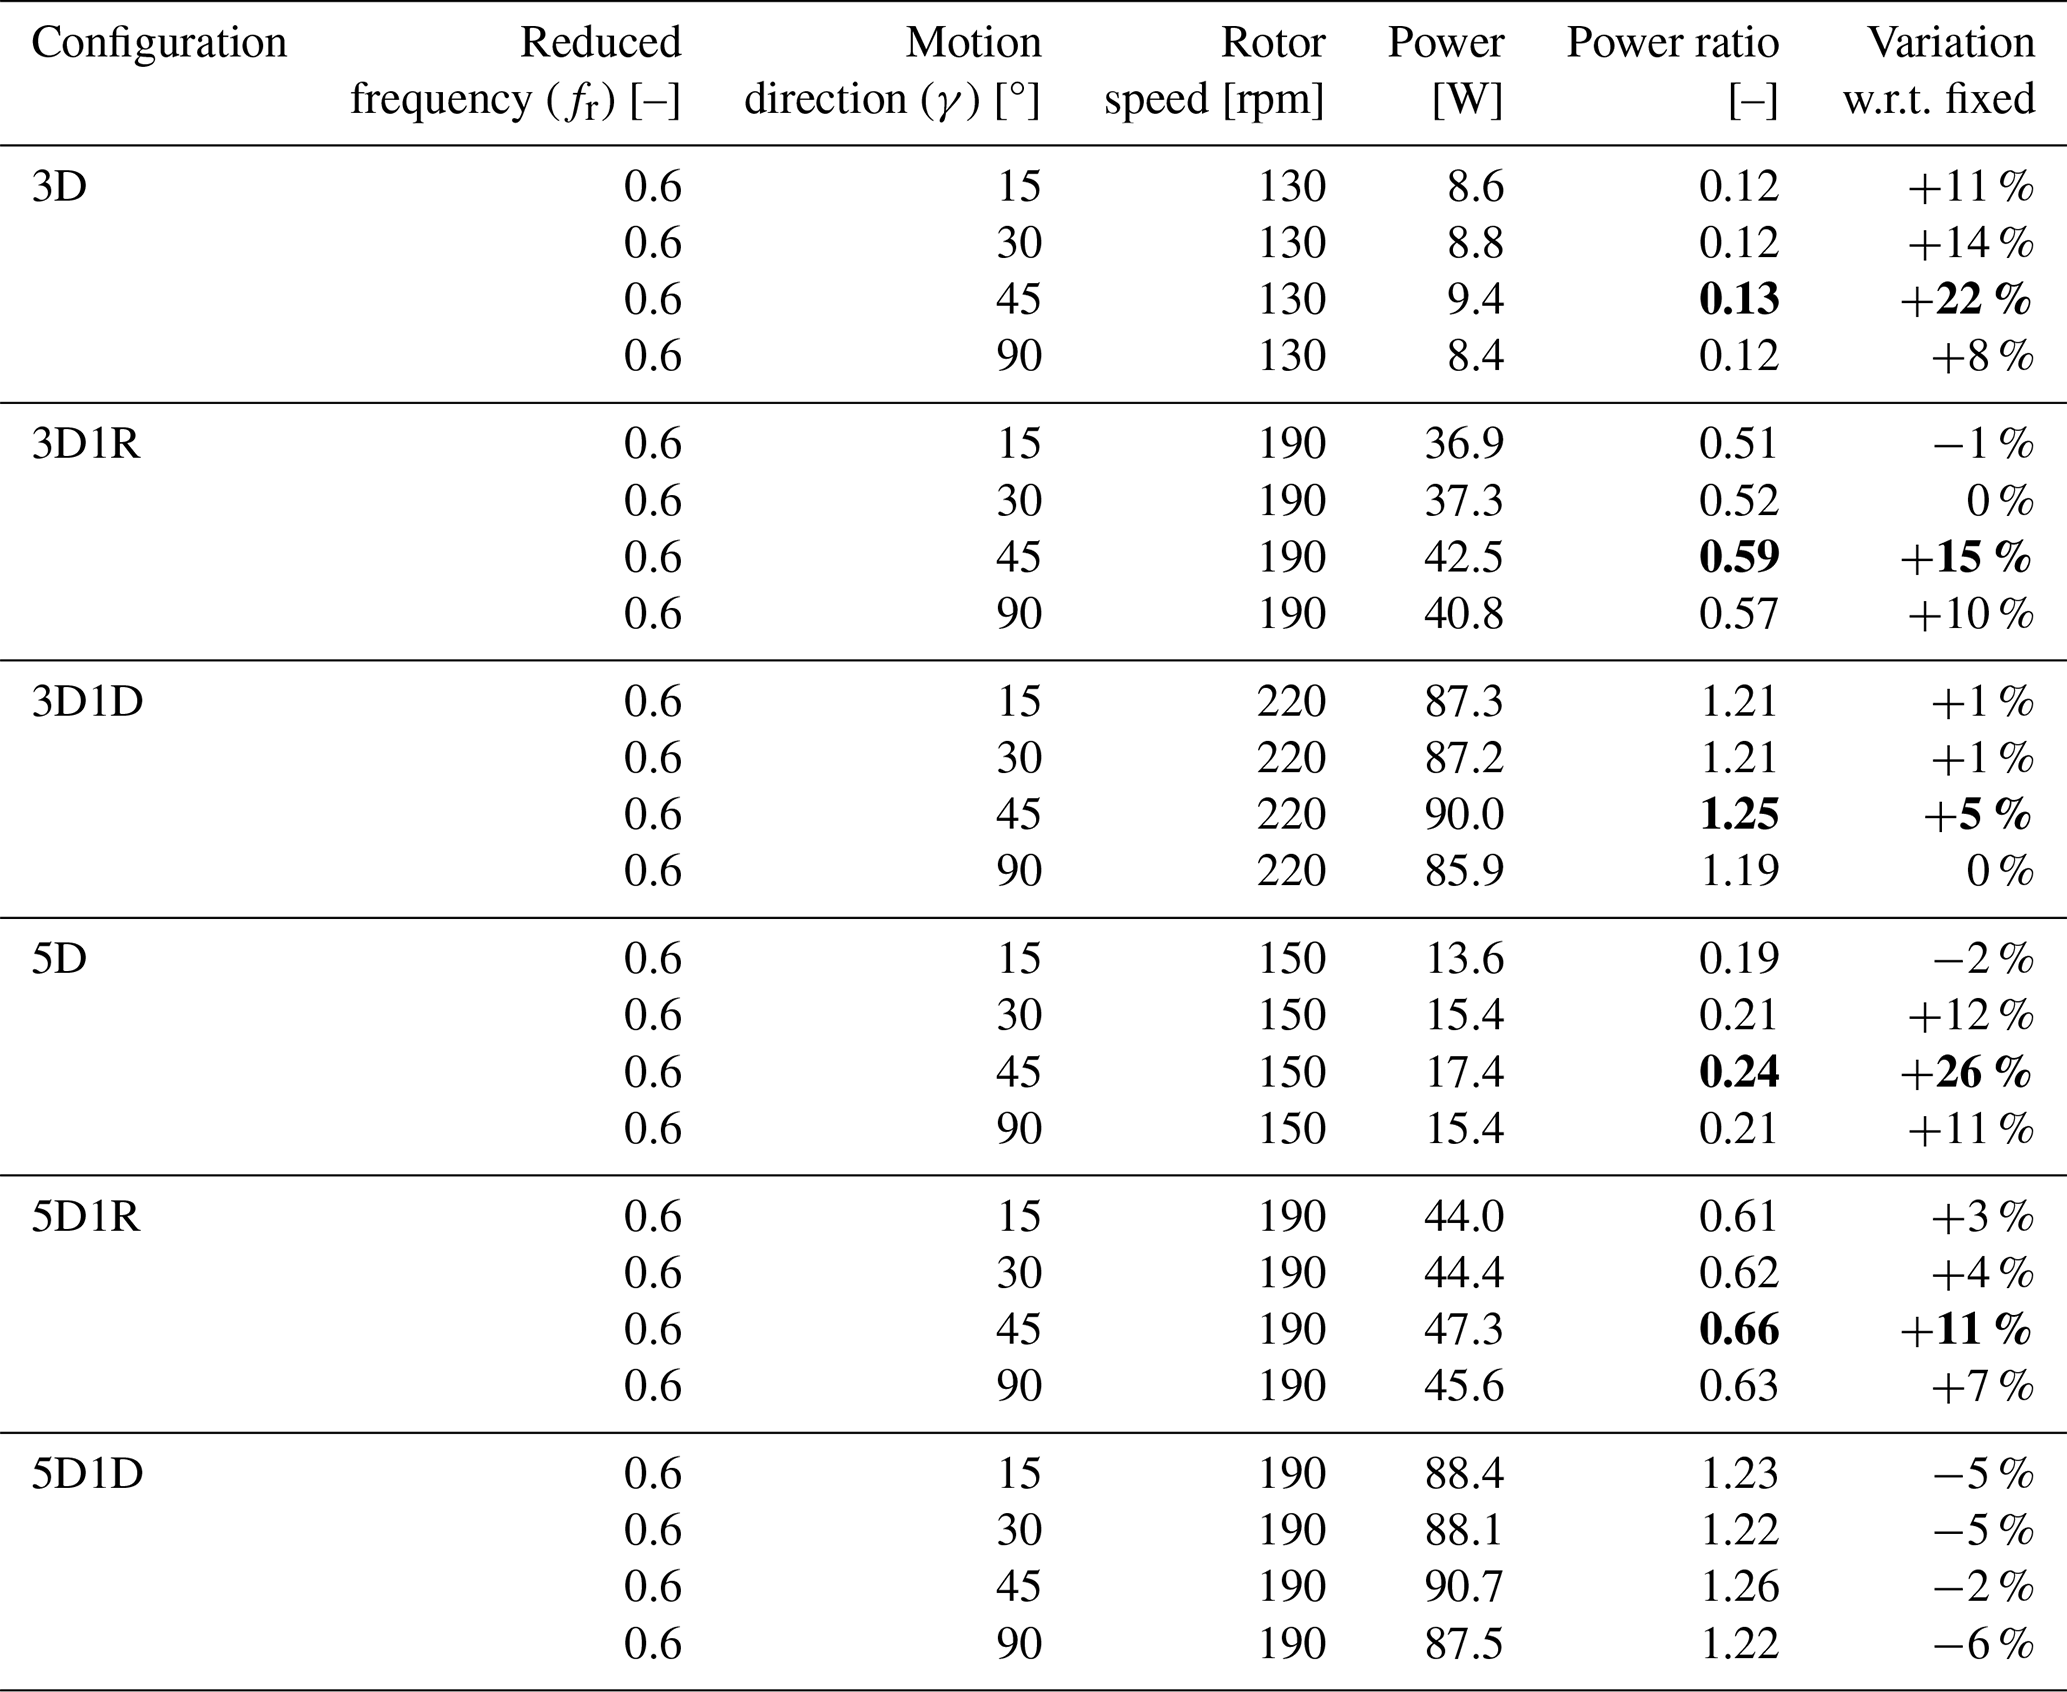
Table D6Time-averaged power output of WT2 for the different farm configurations under wave-driven motions of WT1 caused by waves from different directions. WT2 was operated at a fixed rotor speed, set according to each farm configuration. Values highlighted in bold correspond to power ratios that exceed the maximum ratio observed in the fixed tower-base case (Table D1).
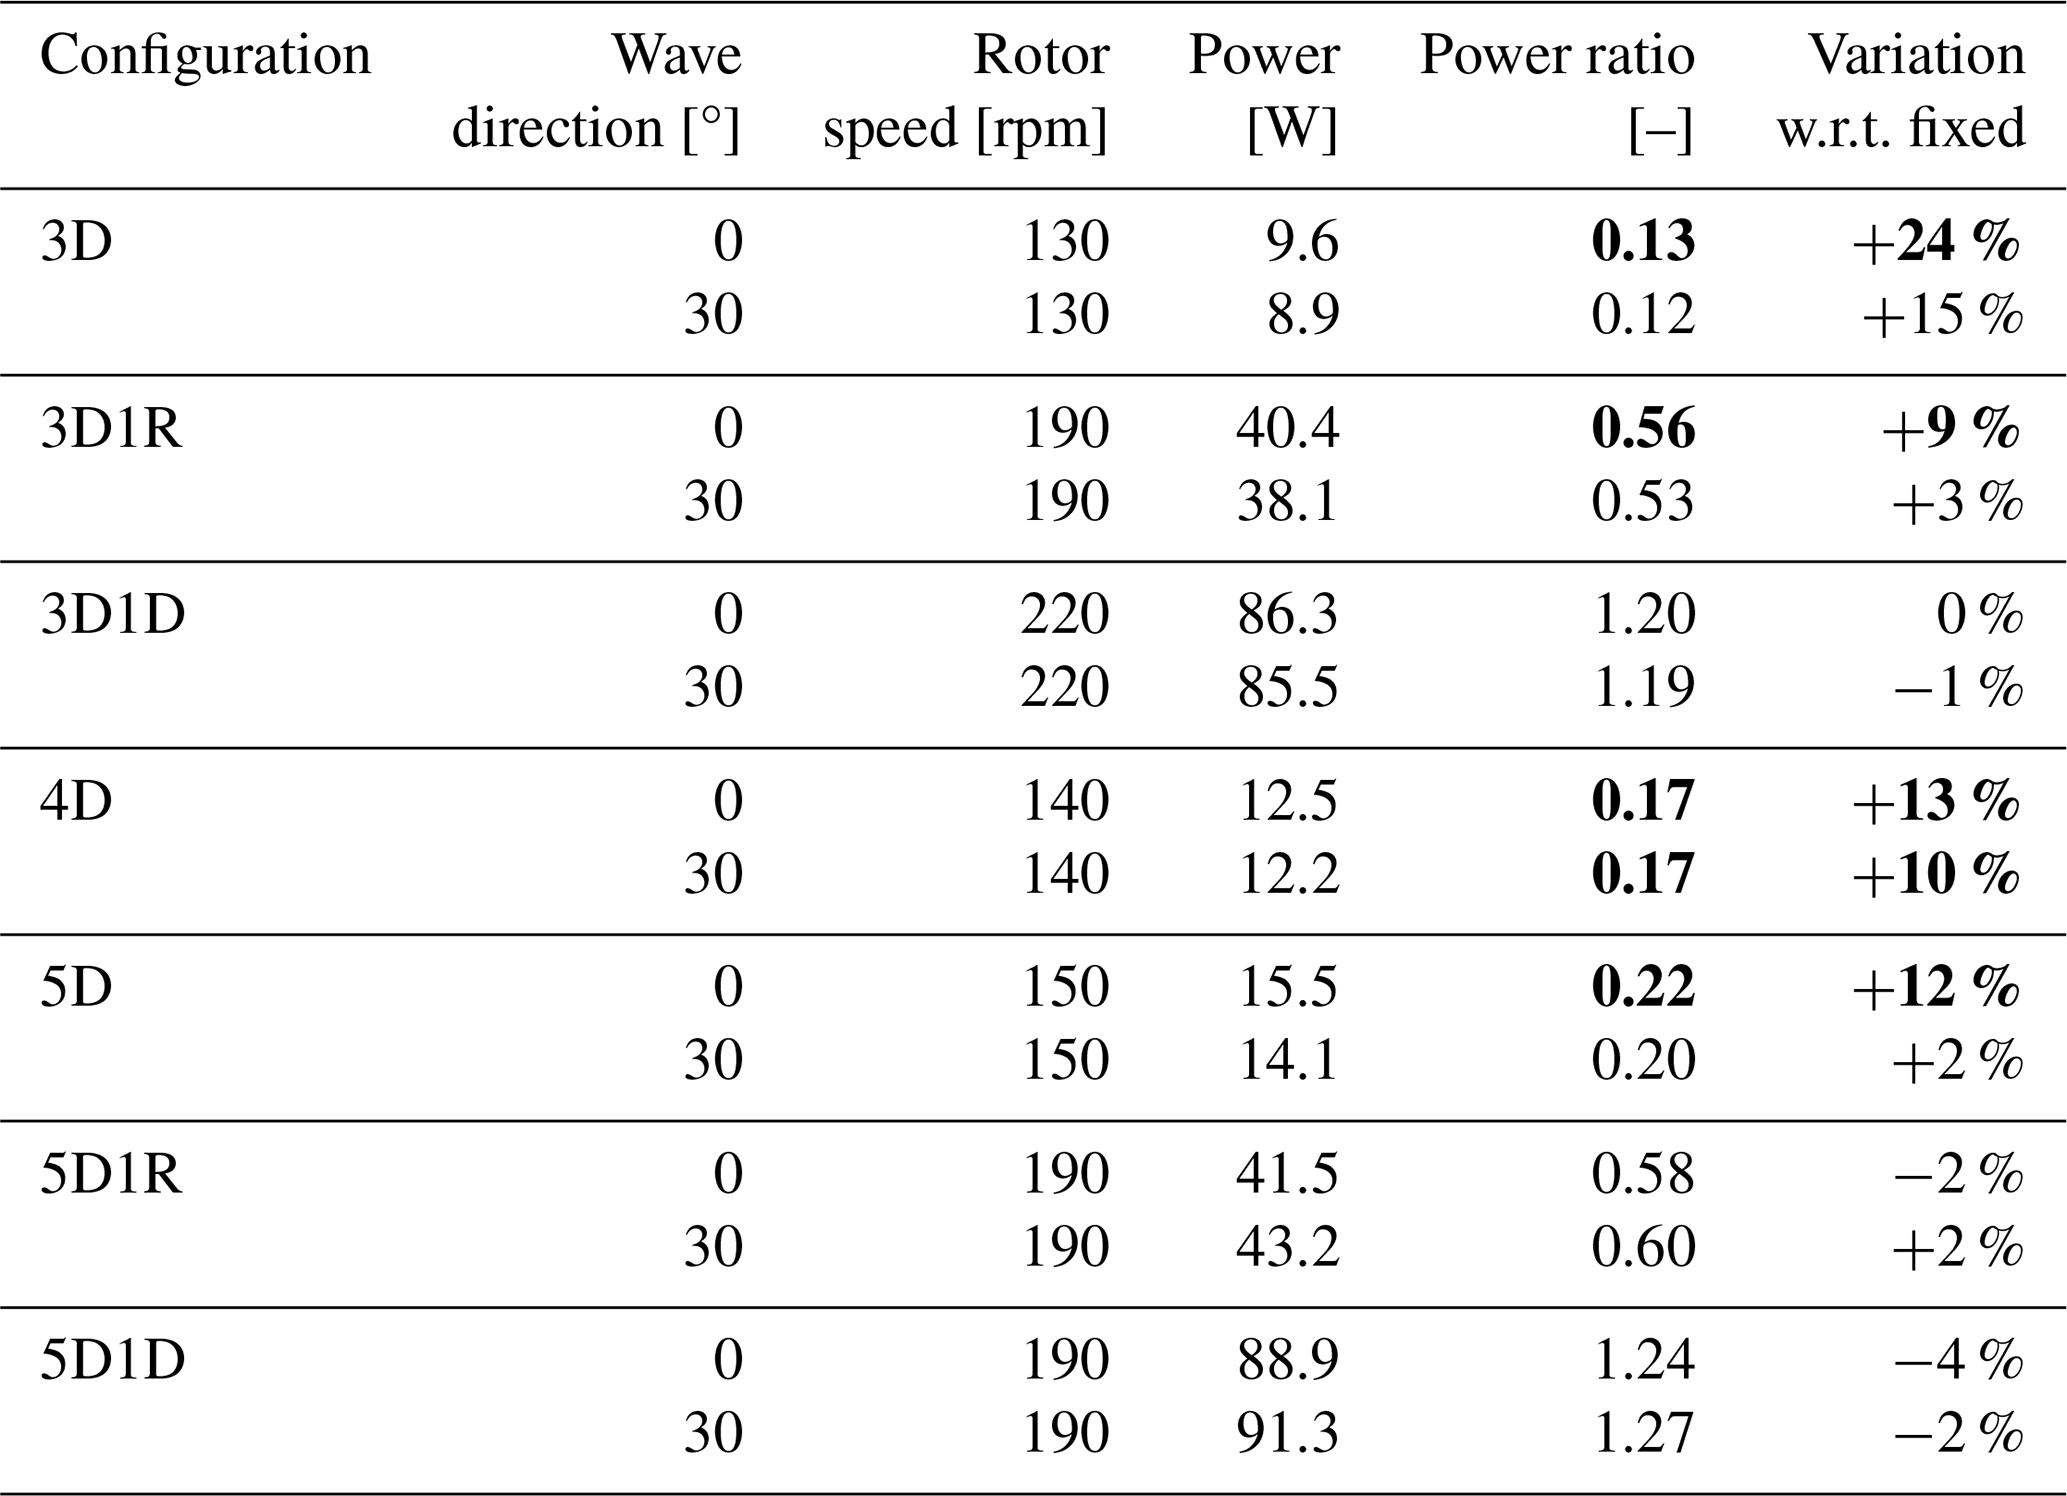
To assess whether the presence of the robotic platform introduces a significant distortion of the WT1 wake flow, the vertical profiles of mean streamwise velocity and turbulence intensity at a downstream distance of xi=3D from WT1 were compared with the corresponding horizontal profiles measured at the same downstream location.
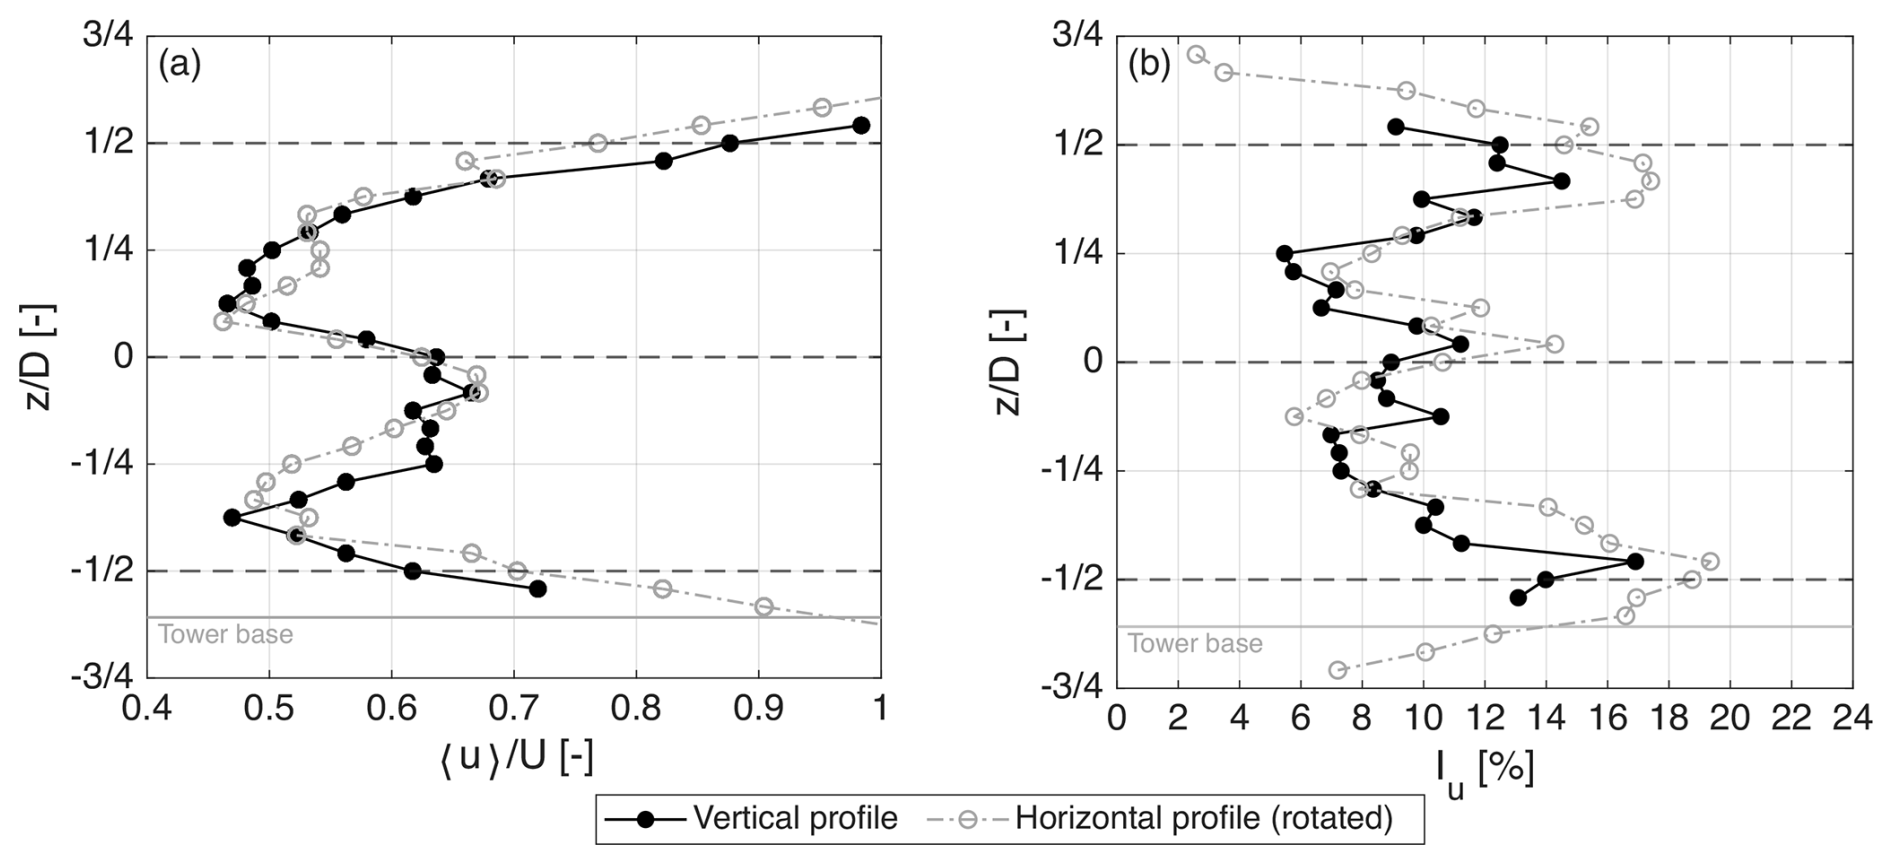
Figure E1Comparison between vertical and horizontal wake profiles at a downstream distance of xi=3D from WT1. (a) Mean streamwise velocity normalized by the free-stream value . (b) Turbulence intensity . Vertical profiles are measured along a line passing through the rotor axis, while horizontal profiles are measured at hub height and rotated by 90° to enable a direct comparison with the vertical distributions. The dashed horizontal lines indicate the rotor-swept region and the rotor axis. The “tower base” line marks the vertical position corresponding to the location where the tower is connected to the robotic platform.
Figure E1 presents the mean velocity normalized by the free-stream velocity () and the turbulence intensity () measured along a vertical line passing through the rotor axis. These profiles are compared with those obtained along the horizontal direction at hub height. For clarity, the horizontal profiles are rotated by 90° to allow direct overlap with the vertical ones.
Within the rotor-swept region (−0.5 < < 0.5), the vertical and horizontal profiles show very good agreement in both the magnitude and spatial distribution of the velocity deficit and turbulence intensity. The shape of the wake and the peak deficit levels are comparable in the two directions, and no systematic vertical asymmetry or additional velocity gradient attributable to the robotic platform is observed. The turbulence intensity profiles likewise exhibit consistent levels and similar variations across the wake core and shear-layer regions. Small discrepancies appear outside the rotor-swept area and near the lower boundary of the measurement domain, where the proximity of the tower base and the robotic platform may locally influence the flow. However, within the region relevant to the downstream turbine rotor, these differences remain limited and do not modify the overall wake structure.
These results indicate that the robotic platform does not introduce a significant distortion of the wake at a downstream distance of 3D. At larger downstream distances, any localized perturbations would be expected to further diminish as the wake evolves and mixing processes promote spatial homogenization.
Measurements of the upstream wind turbine wake under various platform motions are available at https://doi.org/10.5281/zenodo.13994980 (Fontanella et al., 2024). Load measurements for two wind turbines in various farm setups and motion conditions, including those not covered here, are available at https://doi.org/10.5281/zenodo.15582187 (Fontanella et al., 2025c).
All authors prepared and conducted the experiment, and analyzed the measurement data. AF wrote the first draft of the article, and all authors contributed to its review and editing. MB and AB procured the funding. MB, SM, and AB supervised the work.
At least one of the (co-)authors is a member of the editorial board of Wind Energy Science. The peer-review process was guided by an independent editor, and the authors also have no other competing interests to declare.
Publisher's note: Copernicus Publications remains neutral with regard to jurisdictional claims made in the text, published maps, institutional affiliations, or any other geographical representation in this paper. The authors bear the ultimate responsibility for providing appropriate place names. Views expressed in the text are those of the authors and do not necessarily reflect the views of the publisher.
This research has been supported by the European Commission, NextGenerationEU (grant no. M4C2 I1.1, Progetto PRIN 2022 “NETTUNO”, Prot. 2022PFLPHS, CUP D53D23003930006).
This paper was edited by Raúl Bayoán Cal and reviewed by three anonymous referees.
Angelou, N., Mann, J., and Dubreuil-Boisclair, C.: Revealing inflow and wake conditions of a 6 MW floating turbine, Wind Energ. Sci., 8, 1511–1531, https://doi.org/10.5194/wes-8-1511-2023, 2023. a
Arabgolarcheh, A., Micallef, D., and Benini, E.: The impact of platform motion phase differences on the power and load performance of tandem floating offshore wind turbines, Energy, 284, 129271, https://doi.org/10.1016/j.energy.2023.129271, 2023. a
Arnal, V.: Experimental modelling of a floating wind turbine using a “software-in-the-loop” approach, Theses, École centrale de Nantes, https://theses.hal.science/tel-03237441 (last access: 1 January 2025), 2020. a
Bak, C., Zahle, F., Bitsche, R., Kim, T., Yde, A., Henriksen, L. C., Hansen, M. H., Blasques, J. P. A. A., Gaunaa, M., and Natarajan, A.: The DTU 10-MW Reference Wind Turbine, danish Wind Power Research 2013, Conference date: 27–28 May 2013, https://orbit.dtu.dk/en/publications/the-dtu-10-mw-reference-wind-turbine/ (last access: 18 May 2026), 2013. a, b
Bayati, I., Belloli, M., Bernini, L., and Zasso, A.: Wind Tunnel Wake Measurements of Floating Offshore Wind Turbines, Energy Procedia, 137, 214–222, https://doi.org/10.1016/j.egypro.2017.10.375, 2017a. a
Bayati, I., Belloli, M., Bernini, L., and Zasso, A.: Aerodynamic design methodology for wind tunnel tests of wind turbine rotors, J. Wind Eng. Ind. Aerod., 167, 217–227, https://doi.org/10.1016/j.jweia.2017.05.004, 2017b. a
Behrens de Luna, R., Perez-Becker, S., Saverin, J., Marten, D., Papi, F., Ducasse, M.-L., Bonnefoy, F., Bianchini, A., and Paschereit, C.-O.: Quantifying the impact of modeling fidelity on different substructure concepts for floating offshore wind turbines – Part 1: Validation of the hydrodynamic module QBlade-Ocean, Wind Energ. Sci., 9, 623–649, https://doi.org/10.5194/wes-9-623-2024, 2024. a
Bergua, R., Robertson, A., Jonkman, J., Branlard, E., Fontanella, A., Belloli, M., Schito, P., Zasso, A., Persico, G., Sanvito, A., Amet, E., Brun, C., Campaña-Alonso, G., Martín-San-Román, R., Cai, R., Cai, J., Qian, Q., Maoshi, W., Beardsell, A., Pirrung, G., Ramos-García, N., Shi, W., Fu, J., Corniglion, R., Lovera, A., Galván, J., Nygaard, T. A., dos Santos, C. R., Gilbert, P., Joulin, P.-A., Blondel, F., Frickel, E., Chen, P., Hu, Z., Boisard, R., Yilmazlar, K., Croce, A., Harnois, V., Zhang, L., Li, Y., Aristondo, A., Mendikoa Alonso, I., Mancini, S., Boorsma, K., Savenije, F., Marten, D., Soto-Valle, R., Schulz, C. W., Netzband, S., Bianchini, A., Papi, F., Cioni, S., Trubat, P., Alarcon, D., Molins, C., Cormier, M., Brüker, K., Lutz, T., Xiao, Q., Deng, Z., Haudin, F., and Goveas, A.: OC6 project Phase III: validation of the aerodynamic loading on a wind turbine rotor undergoing large motion caused by a floating support structure, Wind Energ. Sci., 8, 465–485, https://doi.org/10.5194/wes-8-465-2023, 2023. a, b, c, d, e, f
Bossuyt, J., Meneveau, C., and Meyers, J.: Effect of layout on asymptotic boundary layer regime in deep wind farms, Phys. Rev. Fluids, 3, 124603, https://doi.org/10.1103/PhysRevFluids.3.124603, 2018. a
Bossuyt, J., Ferčák, O., Sadek, Z., Meneveau, C., Gayme, D. F., and Cal, R. B.: Floating wind farm experiments through scaling for wake characterization, power extraction, and turbine dynamics, Phys. Rev. Fluids, 8, 120501, https://doi.org/10.1103/PhysRevFluids.8.120501, 2023. a
Cal, R. B., Lebrón, J., Castillo, L., Kang, H. S., and Meneveau, C.: Experimental study of the horizontally averaged flow structure in a model wind-turbine array boundary layer, J. Renew. Sustain. Ener., 2, 013106, https://doi.org/10.1063/1.3289735, 2010. a
Carmo, L., Jonkman, J., and Thedin, R.: Investigating the interactions between wakes and floating wind turbines using FAST.Farm, Wind Energ. Sci., 9, 1827–1847, https://doi.org/10.5194/wes-9-1827-2024, 2024. a
Chitteth Ramachandran, R., Desmond, C., Judge, F., Serraris, J.-J., and Murphy, J.: Floating wind turbines: marine operations challenges and opportunities, Wind Energ. Sci., 7, 903–924, https://doi.org/10.5194/wes-7-903-2022, 2022. a
Firpo, A., Sanvito, A. G., Persico, G., Dossena, V., Schito, P., and Zasso, A.: Multi-fidelity actuator-line modelling of FOWT wakes, J. Phys. Conf. Ser., 2767, 052050, https://doi.org/10.1088/1742-6596/2767/5/052050, 2024. a
Fontanella, A., Bayati, I., Mikkelsen, R., Belloli, M., and Zasso, A.: UNAFLOW: a holistic wind tunnel experiment about the aerodynamic response of floating wind turbines under imposed surge motion, Wind Energ. Sci., 6, 1169–1190, https://doi.org/10.5194/wes-6-1169-2021, 2021. a, b, c, d
Fontanella, A., Facchinetti, A., Di Carlo, S., and Belloli, M.: Wind tunnel investigation of the aerodynamic response of two 15 MW floating wind turbines, Wind Energ. Sci., 7, 1711–1729, https://doi.org/10.5194/wes-7-1711-2022, 2022a. a, b, c
Fontanella, A., Zasso, A., and Belloli, M.: Wind tunnel investigation of the wake-flow response for a floating turbine subjected to surge motion, J. Phys. Conf. Ser., 2265, 042023, https://doi.org/10.1088/1742-6596/2265/4/042023, 2022b. a
Fontanella, A., Fusetti, A., Menconi, F., Cioni, S., Papi, F., Muggiasca, S., Persico, G., Dossena, V., Bianchini, A., and Belloli, M.: NETTUNO Experiment 1 – Wake Development in Floating Wind Turbines, Zenodo [data set], https://doi.org/10.5281/zenodo.13994980, 2024. a
Fontanella, A., Cioni, S., Papi, F., Muggiasca, S., Bianchini, A., and Belloli, M.: NETTUNO Experiment 2 – Effects of floating wind turbine motion on a downstream turbine performance and loads, Zenodo [data set], https://doi.org/10.5281/zenodo.15582187, 2025a. a
Fontanella, A., Fusetti, A., Cioni, S., Papi, F., Muggiasca, S., Persico, G., Dossena, V., Bianchini, A., and Belloli, M.: Wake development in floating wind turbines: new insights and an open dataset from wind tunnel experiments, Wind Energ. Sci., 10, 1369–1387, https://doi.org/10.5194/wes-10-1369-2025, 2025b. a, b, c, d, e, f, g, h, i, j, k, l, m, n, o, p, q, r
Fontanella, A., Cioni, S., Papi, F., Muggiasca, S., Bianchini, A., and Belloli, M.: NETTUNO Experiment 2 – Effects of floating wind turbine motion on a downstream turbine performance and loads, Zenodo [data set], https://doi.org/10.5281/zenodo.15582187, 2025c. a
Gaertner, E., Rinker, J., Sethuraman, L., Zahle, F., Anderson, B., Barter, G., Abbas, N., Meng, F., Bortolotti, P., Skrzypinski, W., Scott, G., Feil, R., Bredmose, H., Dykes, K., Sheilds, M., Allen, C., and Viselli, A.: Definition of the IEA 15-Megawatt Offshore Reference Wind Turbine, Tech. rep., International Energy Agency, https://www.nrel.gov/docs/fy20osti/75698.pdf (last access: 1 January 2025), 2020. a
Hodgson, E. L., Madsen, M. H. A., and Andersen, S. J.: Effects of turbulent inflow time scales on wind turbine wake behavior and recovery, Phys. Fluids, 35, 095125, https://doi.org/10.1063/5.0162311, 2023. a
Inghels, P.: Wind-tunnel blockage corrections for wind-turbine measurements, Tech. rep., Royal Institute of Technology KTH Mechanics, https://urn.kb.se/resolve?urn=urn:nbn:se:kth:diva-138602 (last access: 1 September 2025), 2013. a, b
Jonkman, B., Mudafort, R. M., Platt, A., Branlard, E., Sprague, M., Jonkman, J., Ross, H., Hall, M., Vijayakumar, G., Buhl, M., Bortolotti, P., Ananthan, S., Schmidt, M., Rood, J., Damiani, R., Mendoza, N., Shaler, K., Housner, S., Bendl, K., Carmo, L., Quon, E., Phillips, M. R., Kusuno, N., and Salcedo, A. G.: OpenFAST/openfast: v3.4.1, Zenodo [code], https://doi.org/10.5281/zenodo.7632926, 2023. a
Jonkman, J., Butterfield, S., Musial, W., and Scott, G.: Definition of a 5-MW Reference Wind Turbine for Offshore System Development, Tech. rep., National Renewable Energy Laboratory (NREL), Golden, CO., https://doi.org/10.2172/947422, 2009. a
Li, Y., Yu, W., and Sarlak, H.: Wake interaction of dual surging FOWT rotors in tandem, Renew. Energ., 239, 122062, https://doi.org/10.1016/j.renene.2024.122062, 2025. a
Messmer, T., Hölling, M., and Peinke, J.: Enhanced recovery caused by nonlinear dynamics in the wake of a floating offshore wind turbine, J. Fluid Mech., 984, A66, https://doi.org/10.1017/jfm.2024.175, 2024a. a, b, c, d
Messmer, T., Peinke, J., and Hölling, M.: Wind tunnel investigation on the recovery and dynamics of the wake of a floating offshore wind turbine subjected to low inflow turbulence, J. Phys. Conf. Ser., 2767, 092083, https://doi.org/10.1088/1742-6596/2767/9/092083, 2024b. a
Messmer, T., Peinke, J., Croce, A., and Hölling, M.: The role of motion-excited coherent structures in improved wake recovery of a floating wind turbine, J. Fluid Mech., 1018, A23, https://doi.org/10.1017/jfm.2025.10509, 2025. a, b
Meyers, J., Bottasso, C., Dykes, K., Fleming, P., Gebraad, P., Giebel, G., Göçmen, T., and van Wingerden, J.-W.: Wind farm flow control: prospects and challenges, Wind Energ. Sci., 7, 2271–2306, https://doi.org/10.5194/wes-7-2271-2022, 2022. a
Micallef, D. and Rezaeiha, A.: Floating offshore wind turbine aerodynamics: Trends and future challenges, Renew. Sust. Energ. Rev., 152, 111696, https://doi.org/10.1016/j.rser.2021.111696, 2021. a
Pagamonci, L., Papi, F., Cojocaru, G., Belloli, M., and Bianchini, A.: How does turbulence affect wake development in floating wind turbines? Some insights from comparative large-eddy simulations and wind tunnel experiments, Wind Energ. Sci., 10, 1707–1736, https://doi.org/10.5194/wes-10-1707-2025, 2025. a, b
Papi, F., Troise, G., Behrens de Luna, R., Saverin, J., Perez-Becker, S., Marten, D., Ducasse, M.-L., and Bianchini, A.: Quantifying the impact of modeling fidelity on different substructure concepts – Part 2: Code-to-code comparison in realistic environmental conditions, Wind Energ. Sci., 9, 981–1004, https://doi.org/10.5194/wes-9-981-2024, 2024. a
Ramos-García, N., González Horcas, S., Pegalajar-Jurado, A., Kontos, S., and Bredmose, H.: Investigation of the floating IEA wind 15-MW RWT using vortex methods Part II: Wake impact on downstream turbines under turbulent inflow, Wind Energy, 25, 1434–1463, https://doi.org/10.1002/we.2738, 2022. a
Schulz, C. W., Netzband, S., Özinan, U., Cheng, P. W., and Abdel-Maksoud, M.: Wind turbine rotors in surge motion: new insights into unsteady aerodynamics of floating offshore wind turbines (FOWTs) from experiments and simulations, Wind Energ. Sci., 9, 665–695, https://doi.org/10.5194/wes-9-665-2024, 2024. a, b, c
Schulz, C. W., Begua, R., Branlard, E., Netzband, S., Jonkman, J., and Roberston, A.: Unsteady Aerodynamics of Large-Scale Floating Offshore Wind Turbines in Surge Motion, SSRN, https://doi.org/10.2139/ssrn.5375682, 2025. a, b
Shen, W. Z. and Mikkelsen, R. F.: Study on wind turbine arrangement for offshore wind farms, in: ICOWEOE-2011, vol. Paper 05, international Conference on Offshore Wind Energy and Ocean Energy, ICOWEOE, Conference date: 31 October–2 November 2011, https://orbit.dtu.dk/en/publications/study-on-wind-turbine-arrangement-for-offshore-wind-farms/ (last access: 18 May 2026), 2011. a
Stevens, R. J. A. M., Hobbs, B. F., Ramos, A., and Meneveau, C.: Combining economic and fluid dynamic models to determine the optimal spacing in very large wind farms, Wind Energy, 20, 465–477, https://doi.org/10.1002/we.2016, 2017. a
Van Der Hoek, D., Ferreira, C. S., and Van Wingerden, J.-W.: Experimental comparison of induction control methods for wind farm power maximization on a scaled two-turbine setup, J. Phys. Conf. Ser., 2767, 092064, https://doi.org/10.1088/1742-6596/2767/9/092064, 2024a. a
Van Der Hoek, D., Den Abbeele, B. V., Ferreira, C. S., and van Wingerden, J.-W.: Maximizing wind farm power output with the helix approach: Experimental validation and wake analysis using tomographic particle image velocimetry, Wind Energy, 27, 463–482, https://doi.org/10.1002/we.2896, 2024b. a, b
Wu, Y.-T. and Porté-Agel, F.: Atmospheric Turbulence Effects on Wind-Turbine Wakes: An LES Study, Energies, 5, 5340–5362, https://doi.org/10.3390/en5125340, 2012. a
- Abstract
- Introduction
- Methodology
- Results
- Discussion
- Conclusions
- Appendix A: Aerodynamic performance of the scale model rotor
- Appendix B: Accuracy of inertial and gravitational load removal in the aerodynamic loads estimation
- Appendix C: Thrust-equivalent wind speed estimator for operating-point definition
- Appendix D: Power of the downstream turbine for all motion cases and farm configurations
- Appendix E: Assessment of potential wake distortion induced by the robotic platform
- Data availability
- Author contributions
- Competing interests
- Disclaimer
- Financial support
- Review statement
- References
- Abstract
- Introduction
- Methodology
- Results
- Discussion
- Conclusions
- Appendix A: Aerodynamic performance of the scale model rotor
- Appendix B: Accuracy of inertial and gravitational load removal in the aerodynamic loads estimation
- Appendix C: Thrust-equivalent wind speed estimator for operating-point definition
- Appendix D: Power of the downstream turbine for all motion cases and farm configurations
- Appendix E: Assessment of potential wake distortion induced by the robotic platform
- Data availability
- Author contributions
- Competing interests
- Disclaimer
- Financial support
- Review statement
- References