the Creative Commons Attribution 4.0 License.
the Creative Commons Attribution 4.0 License.
 | 04 Jun 2026
Remote diagnostics for power converter faults in wind turbines based on converter control system data
Timo Lichtenstein
Martin Hippenstiel
Katharina Fischer
Power converters are among the most frequently failing subsystems of onshore and offshore wind turbines. In order to minimize the resulting downtime and production losses, the time to repair should be as low as possible. In practice, however, it is not uncommon for several turbine visits to be necessary, as information about the failure mode and the spare parts required can often only be determined on site. This paper presents a data-driven, interpretable workflow for the remote diagnosis of power-converter-related turbine shutdowns using converter control system data from an offshore wind farm. The study uses converter fault events and three data sources: high-resolution fast logs (4.5 kHz, −350 to +200 ms around a fault-induced trigger), 1 min operating data, and fault flags derived from event log data. From an initial 864 engineered features we remove low-variance and highly correlated features, apply a subsampled decision-tree inclusion-rate filter to retain 34 features, and estimate diagnostic impact via subsampled logistic regression. Results show that fast-log features and converter fault flags contain the most predictive information for classifying standstill severity after a fault-induced shutdown, while low-resolution operating data contribute little. Using four of the derived features yields the best cross-validated performance in a decision tree, with an accuracy of 0.89 and an F1 score of 0.86. The proposed approach is practical for industry use and offers the potential to provide explainable decision support for improving the first-time fix rate.
- Article
(1409 KB) - Full-text XML
- BibTeX
- EndNote


Power converters are among the subsystems of wind turbines that are most susceptible to failure and, thus, cause considerable costs and yield losses (Lin et al., 2016; ORE Catapult, 2023; Tartt et al., 2022; Walgern et al., 2026). Fraunhofer IWES analyzed failure data from over 10 000 wind turbines worldwide to identify factors affecting converter reliability (Anderson et al., 2025). Despite some improvements (Anderson et al., 2025), failure rates remain high at 0.21 converter system failures per MW converter capacity per year (Fischer et al., 2025). In addition, the economic impact of failures grows with turbine size and offshore expansion, the latter of which limits accessibility. Early fault detection and differentiated remote diagnostics are, therefore, increasingly important to keep any downtime and its associated yield loss as low as possible.
While nowadays all wind turbines are equipped with condition monitoring systems (CMSs) for mechanical drive-train components, effective CMSs for power converters are not yet available. First prototypes and concepts presented during recent years cover temperature monitoring of the power semiconductors (Rannestad et al., 2020), the detection of humidity-related degradation of IGBT modules (Kostka and Mertens, 2022), the impedance monitoring of DC-link capacitors (Zhou et al., 2019; Froehling and Fischer, 2025), and corrosion monitoring in control electronics (Sehr et al., 2025). However, none of these approaches has reached market readiness so far. Among methods not requiring additional hardware, there are, on the one hand, approaches based on SCADA data, which have shown insufficient performance in early fault detection (Peinke et al., 2024). On the other hand, high-resolution information from the converter system is generally recorded by the converter control but has so far remained largely unused. This is mainly due to the fact that, for a long time, access to data from the converter control system has been limited to manual downloading of disturbance logs (also called trigger files) generated during converter fault events.
Since 2017, first initiatives have been launched to create a user interface and make high-resolution data from the converter control available in the cloud in order to facilitate condition monitoring and predictive maintenance (Schönfelder, 2017; ABB, 2017). Its implementation, however, has remained limited to a low number of turbines. With Schwenzfeier et al. (2022), a first scientific contribution to the use of multidimensional data from converter control systems of wind turbines for the purpose of anomaly detection was published. The authors proposed a self-supervised learning approach using LSTM autoencoders to identify outliers in the data.
As part of the ReCoWind2 project led by Fraunhofer IWES, in which three research institutes and six industry partners have joined forces to bring forward the reliability and monitoring of power converters in wind turbines, we have investigated the utilization of data from the converter control for the purpose of remote diagnostics. In this context, the present work aims at giving purely data-derived decision support through a remote diagnosis about the type of power converter fault-related downtime. It is the initial step toward developing a decision support tool, allowing us to enhance the first-time fix rate1 (also: first-visit fix rate) by providing technicians with more accurate information about an occurred fault or failure before a repair visit at the turbine. To the authors' best knowledge, it is the first study exploring the utilization of converter control data for this purpose. In contrast to our previous analyses focusing on converter failures (e.g., Anderson et al., 2025; Pelka and Fischer, 2023; Fischer et al., 2019), the present work is dedicated to the analysis of converter faults, i.e., events that led to a turbine stop but not necessarily involved a damage with the need for spare parts. Our diagnosis is derived by the fusion of multiple data sources with information about the operating history of the power converter around a converter fault. A similar data fusion from multiple sources has already proven useful in the past, e.g., for wind turbine gearboxes (Hameed et al., 2009). Apart from the combination of data sources, focus is placed on ensuring that the results remain interpretable. Our work also addresses the issue of researchers often calling for more data. In that regard, our results demonstrate a methodology for working with a small dataset of approximately 100 instances – specifically, fault events with derived features – emphasizing the need for data scientists to effectively deal with the sometimes limited data available in the industry (Gück et al., 2024).
The rest of this article is organized as follows: in Sect. 2, we summarize the data basis underlying this work and explain the preprocessing steps carried out to be able to use it in our analysis. Then, the methodology is explained in Sect. 3, detailing our feature reduction steps and the derivation of feature importance. In Sect. 4, we present and discuss the results before we draw our conclusions in Sect. 5.
Our investigations are based on historical data from the converter control systems of wind turbines of an offshore wind farm in the North Sea.
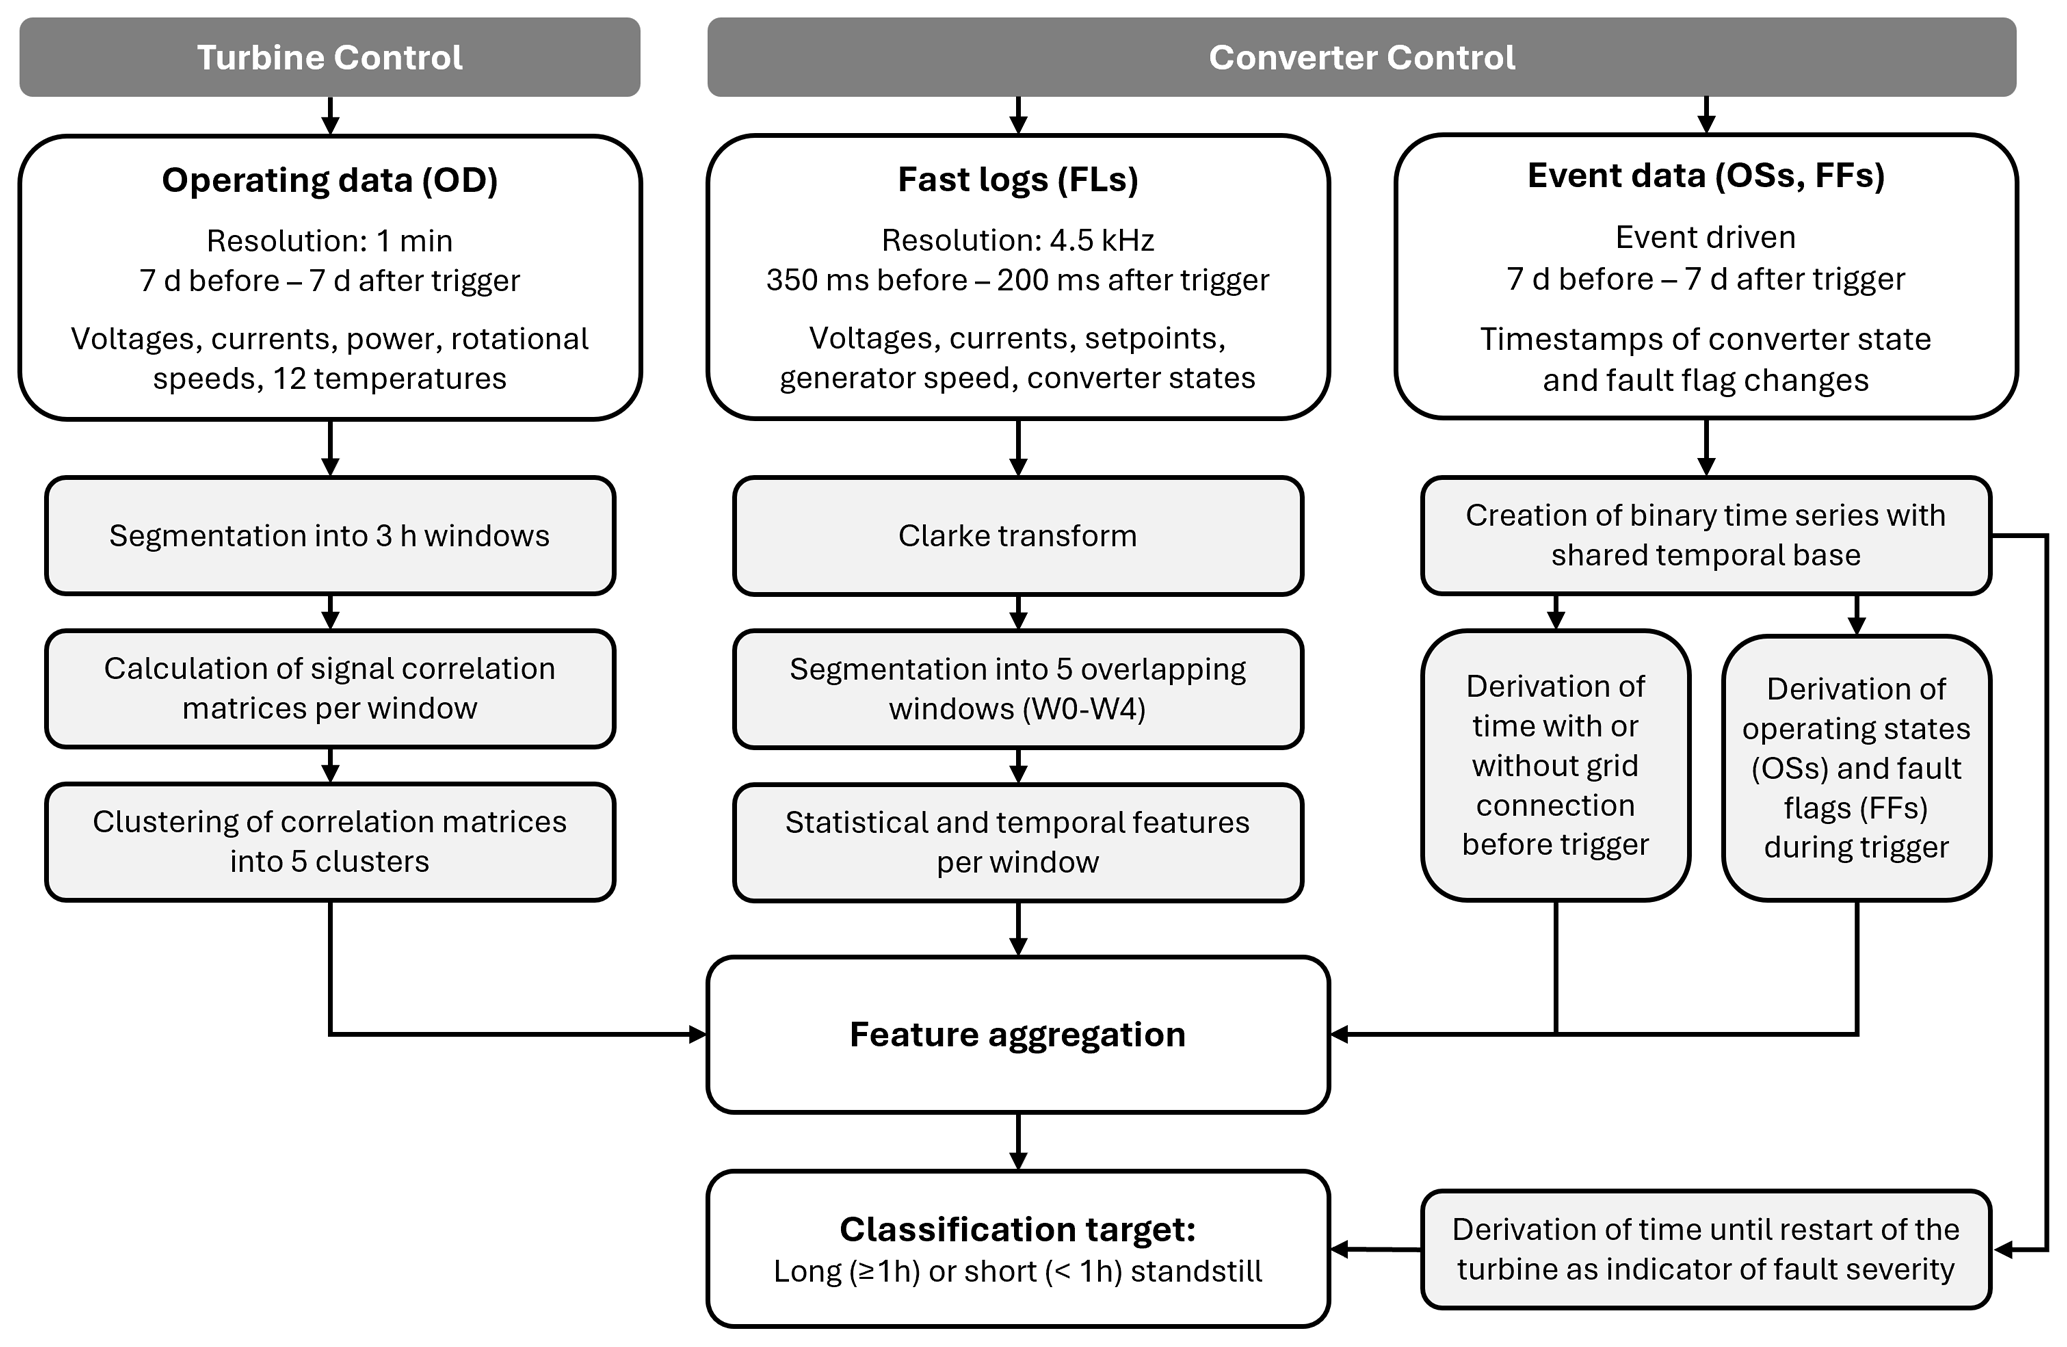
Figure 1Flow diagram illustrating where the different data streams originate in the wind turbine (turbine control vs. converter control) and how the operating data (OD) and fault logs (FLs), as well as the operating states (OSs) and fault flags (FFs) from event data are processed in our workflow.
Data were recorded around trigger events – specifically, converter faults of the turbines – spanning roughly 2 years of operation of the entire wind farm; see also Fig. 1 for a flow diagram of the data used. Fast logs (FLs) were captured when faults triggered the power converter to shut down. These logs contain operating data, in particular voltages, currents, corresponding setpoints, the generator speed, and the converter's operating states at a 4.5 kHz sampling rate (0.222 ms resolution), from 350 ms before to 200 ms after the trigger. Furthermore, operating data (OD) and event data from the converter controller were provided covering a window of 7 d before to 7 d after the events. The operating data include currents and voltages inside the converter, turbine active and reactive power generation, generator speed, and 12 temperature signals with 1 min resolution. The event data consist of records, i.e., a list with timestamps of converter-internal and turbine-wide changes of operating states (OSs) as well as predefined fault flags (FFs) from the converter control system.
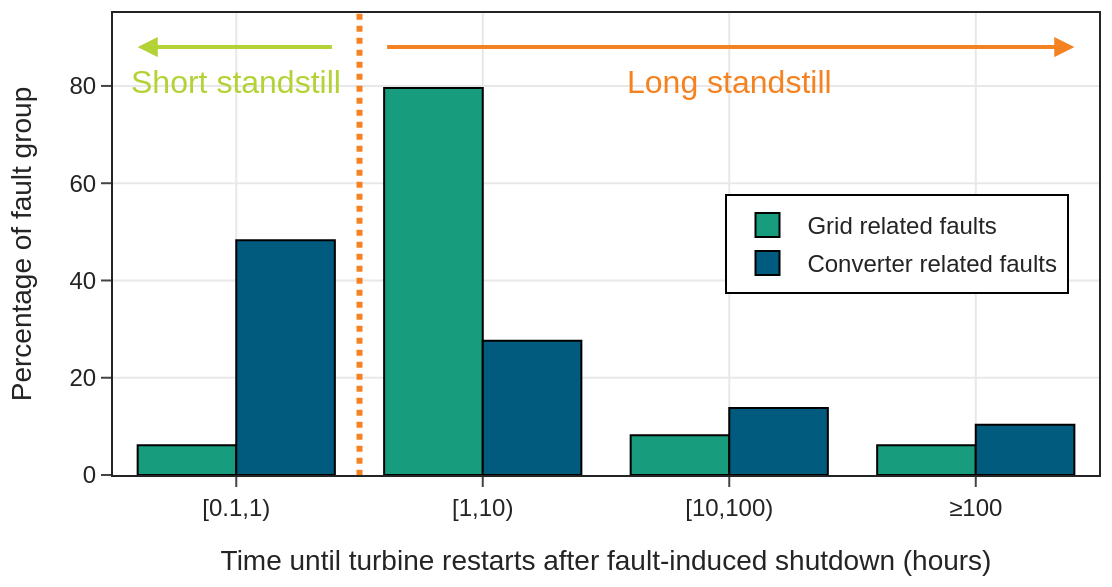
Figure 2Histogram of the relative distribution of the restart time after a trigger event as an indicator for the severity of a fault, differentiated between grid- and converter-related faults.
The event records are converted to binary time series with a shared temporal base to extract active fault flags (FFs) at the trigger event. As these event records contain information about the converter being connected to the grid, i.e., the so-called parallel state, we derive additional features if the converter is grid connected during the trigger, how long it was connected until the fault trigger, and how long it was disconnected before the last grid connection. Lacking detailed fault or maintenance information, we use the time until the turbine restarted as an indicator of fault severity. Their distribution is shown in the logarithmically binned histogram of Fig. 2, distinguishing between grid-related and converter-related faults. The first fault category is due to the grid conditions being outside permissible tolerance. In this work, only data for converter-related faults (blue bars) are included, as we do not have any influence on the duration of grid outages and the associated forced shutdowns of the turbines. We use the time until restart (standstill) as a target value for the models of this work, differentiating between long (≥ 1 h) and short (< 1 h) standstill.
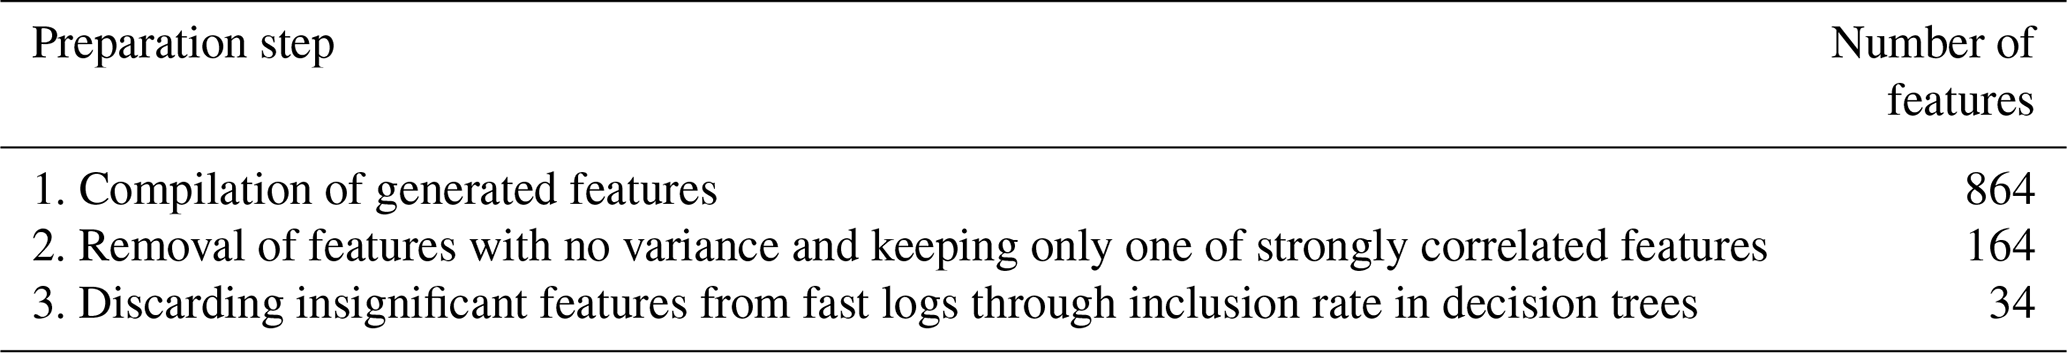
Table 1Overview of the feature reduction steps and the number of features left after each preparation step.
From the operating data, we derive operating condition information before the trigger event. Previous investigations showed an increase in the failure occurrence per unit of time of the converter core components with increasing active power output of the turbine before the failure (Fischer et al., 2019). In the present work, we identified correlation matrices to describe the overall behavior of the turbine before the fault, giving a more detailed characterization of the turbine operation before a fault. From these correlation matrices, we derive clusters of similar collective behavior in windows of 3 h, similar to Bette et al. (2023). We partitioned all data into 6 clusters (0 to 5) of operating behavior, ordered by ascending mean active power output, i.e., cluster 0 having the lowest, cluster 5 the highest.
To utilize the fast-log data time series effectively, we applied the Clarke transformation to convert the three-phase signals into a two-axis stationary reference frame. This transformation yields a rotating space vector from which we derive its magnitude, the electrical angle, and its derivative – the rotational speed. Under steady-state conditions, these quantities become steady values, whereas in case of a disturbance they exhibit characteristic deviation patterns. On these preprocessed signals, we use statistical and temporal feature extraction techniques that compute characteristic values for each time series, including, e.g., standard deviation, Shannon entropy, and signal total range, as well as interquartile range (IQR) and the mean slope by fitting a line to the observed data. To account for the variability and for the fact that the fault trigger event is located approximately at two-thirds of the recorded FL time periods, the complete time span is segmented into five overlapping 183 ms windows (named W0 to W4), with features extracted independently for each window.
A key task when working with a large number of features – as in our dataset – is identifying the most important ones and their relevance to specific events. Before reduction, our dataset contains 864 features, around 800 from the fast logs alone. By removing features with no variance and keeping only one of a set of highly correlated features, we are able to reduce the dataset to 164 features. For further reduction, we pull 400 subsamples containing randomly selected 80 % of the remaining features from the fast logs. On each of these subsets, we train an entropy-based decision tree model. We inspect each of these decision trees and the features that the optimization algorithm chooses to implement and count their overall inclusion rate, i.e., how often they are used in the 400 models. We then only keep features that are implemented in more than 2 % of the models; see also Table 2. Reducing the number of features from the fast logs, we are able to reduce the total dataset to 34 features. See an overview of the feature reduction steps in Table 1.
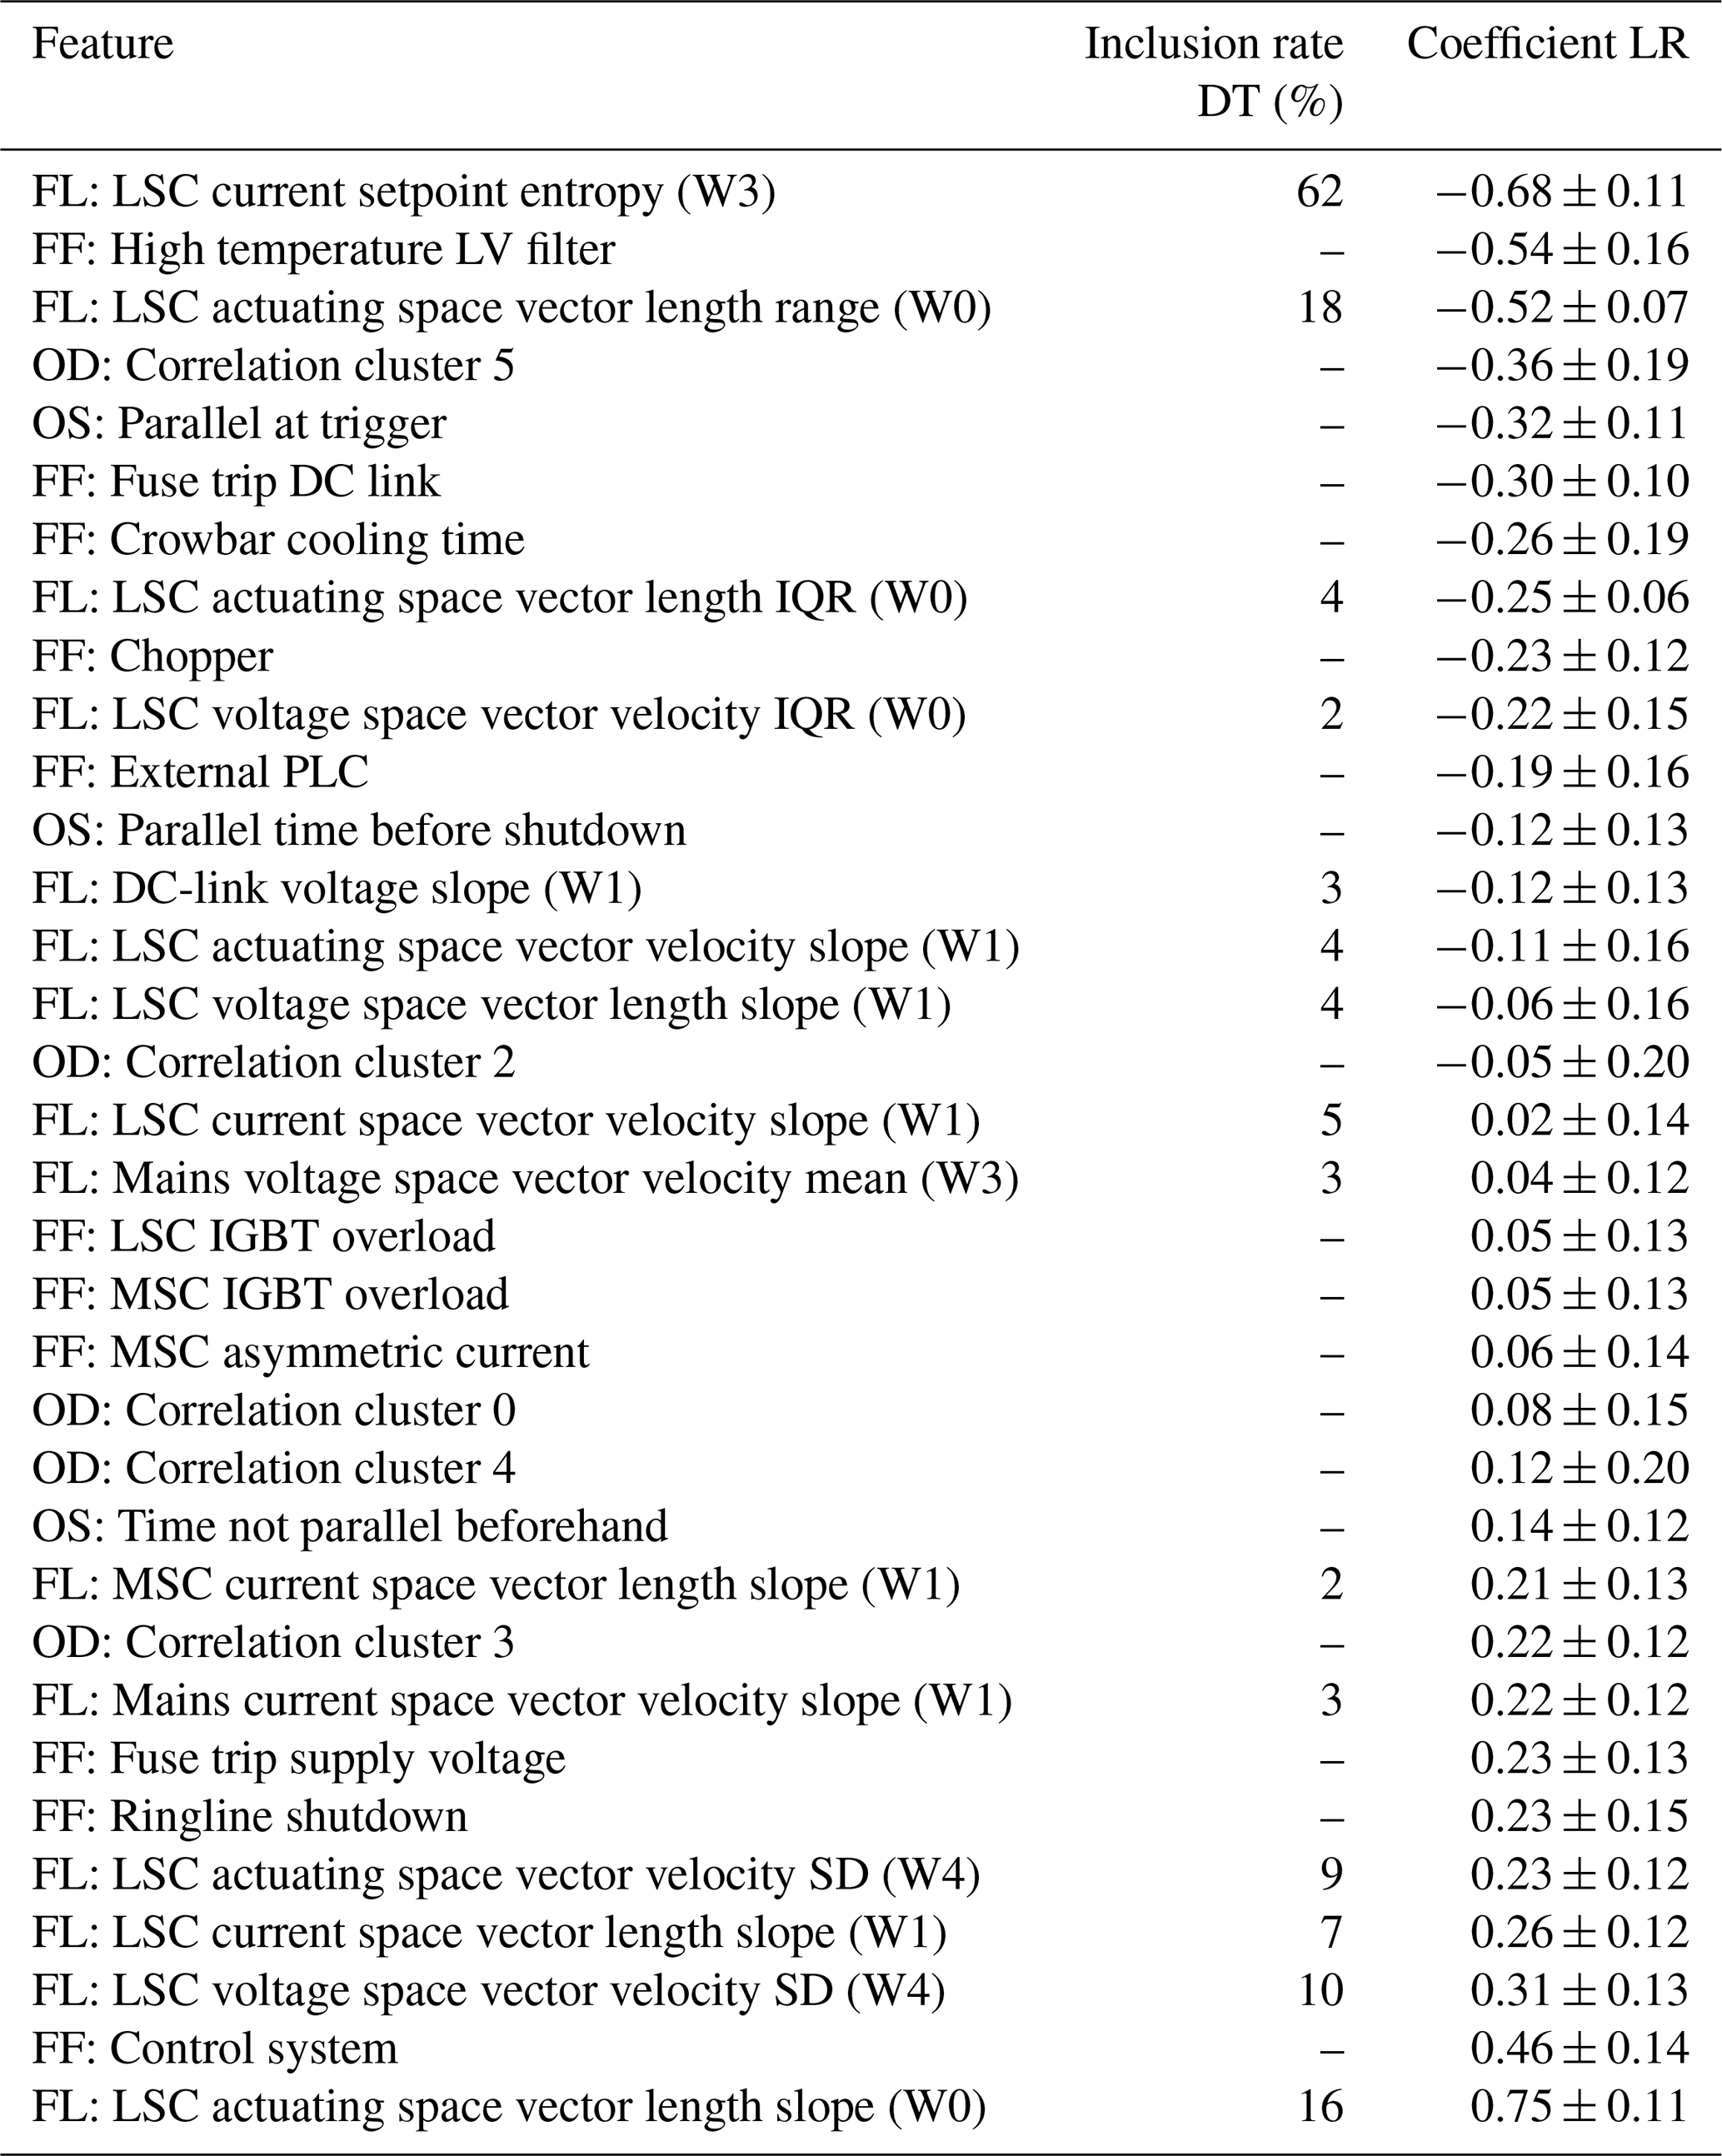
Table 2Overview of the 34 included features in the logistic regression analysis showing both the inclusion rate from the decision tree (DT) feature reduction as well as the regression coefficient of the logistic regression (LR) with corresponding standard deviation.
To assess the impact of the remaining features, we choose to directly apply the features for a training on a logistic regression model. Before training, all features are min-max scaled, thus ranging from 0 to 1. With this approach, the regression coefficients of the features allow giving a direct estimate on the tendency toward short or long standstill. To account for variability, we again use the subsampling technique with 400 80 % subsamples on the remaining dataset containing 34 features.
We choose the usage of decision trees and logistic regression for feature reduction and impact estimation as it allows for interpretability and full control of each analysis step. In the decision trees, a decision node directly shows how and why the dataset is split, and the regression coefficient has a direct influence on the overall outcome of the regression model. In contrast, more sophisticated methods like Shapley value approaches (Chen et al., 2023) might be used with larger datasets, higher feature number, and in more complex machine learning models.
The model coefficients resulting from the average of all regression models are displayed as bars in Fig. 3. These mean values of the fit coefficients give an estimate of how strongly each feature relates to faults causing long standstills. The error bars correspond to the standard deviation of each coefficient directly reflecting the variations of the model coefficients of all 400 subsamples.
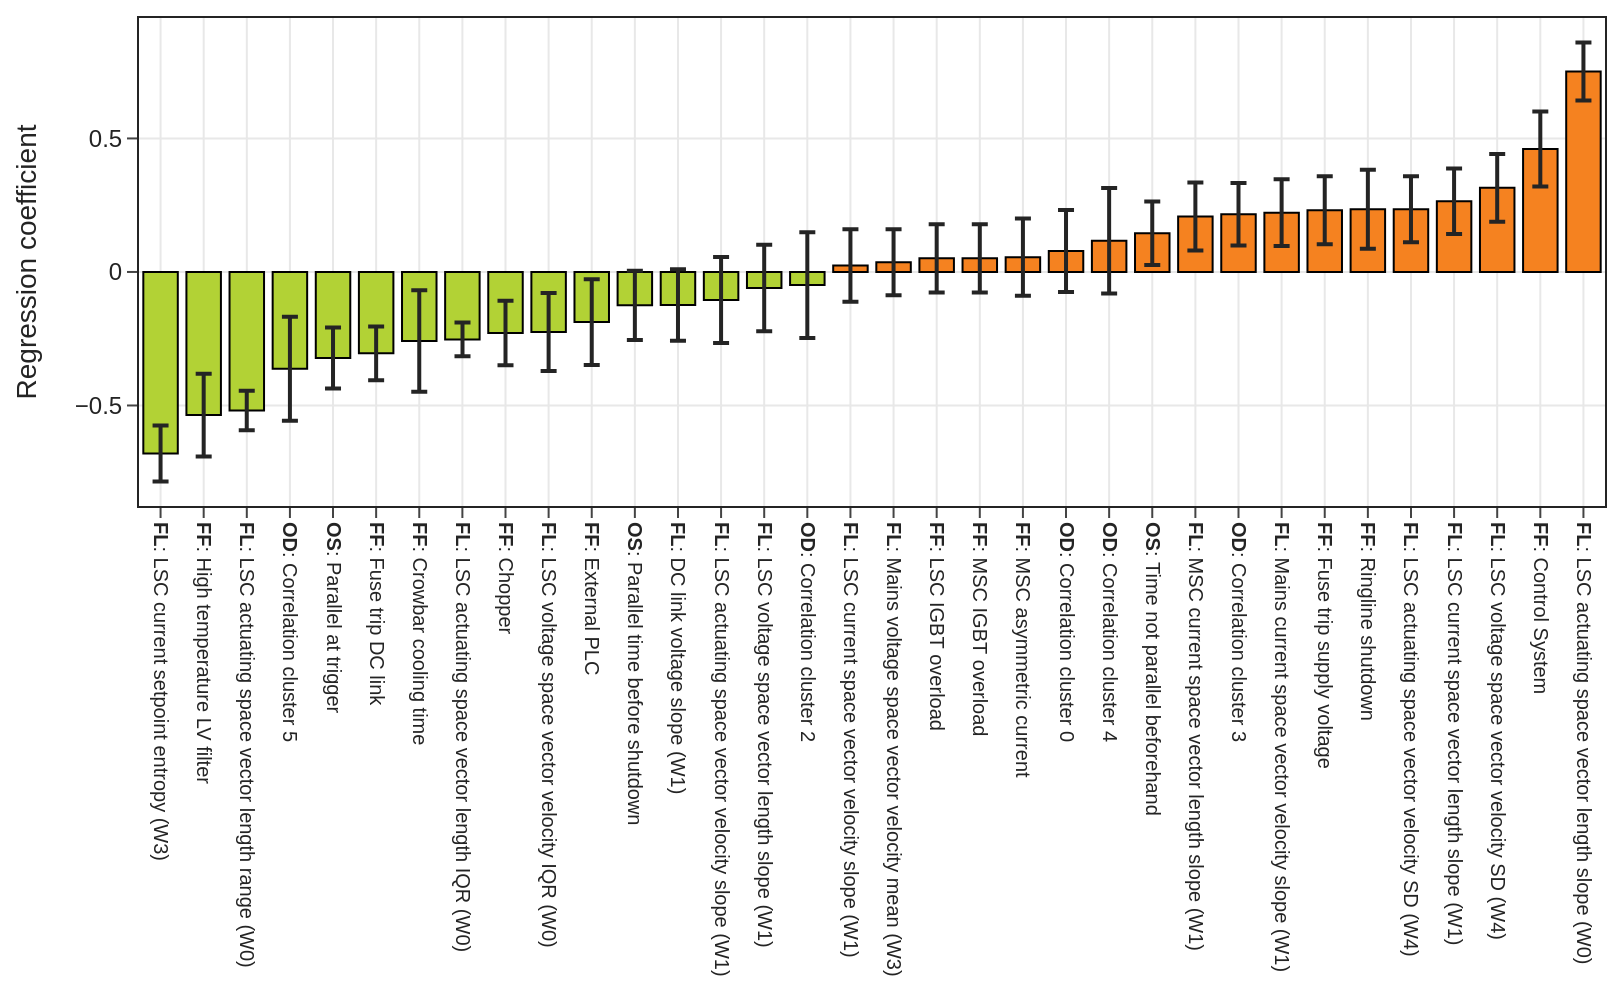
Figure 3Resulting regression coefficients from logistic regression with corresponding standard deviation depicted as error bars: negative values displayed in green bars tend toward short standstill after shutdown, whereas positive values in orange bars tend toward long standstill.
For positive coefficients, a higher absolute feature value increases the normalized probability of a severe fault leading to a longer standstill. For binary values like a fault flags (FFs), the probability is directly proportional to the bar length. For positive coefficients, a low feature value or a binary feature of 0 indicates a lower probability of a long standstill. The opposite applies for negative coefficients. In Fig. 3, the highest coefficients are the slope of the actuating space vector length at the line side in window 0 (W0), a fault flag from the converter, and the standard deviation of the voltage space vector, indicating a long standstill. The lowest coefficients are seen for the Shannon entropy in one setpoint of the line side converter current in window 3 (W3), a fault flag for high temperature at the low voltage filter, and the range of the space vector length at the line side of the converter, indicating a short standstill. For more information, see the coefficients of Fig. 3, also listed in Table 2.
Some features in the center of Fig. 3 with low overall prefactors have high relative uncertainties. If the features resulted from the selection of the decision tree analysis, also low inclusion rates can be seen for these features. Therefore, we deduce that the inclusion rate threshold could be chosen higher, e.g., at least to > 5 %. Nevertheless, this plot gives an exemplary overview of the influence of each feature to the type of shutdown. Additionally, these results allow identifying insignificant features when using them for diagnosis. Using all features of Fig. 3 for a model leads to strong overfitting and bad generalizability. When testing the prediction performance via subsampling and splitting the dataset 400 times randomly in 80 % for training and 20 % for cross validation, we obtain mean F1 scores of around 0.6 for both logistic regression and decision tree predictions during cross validation.
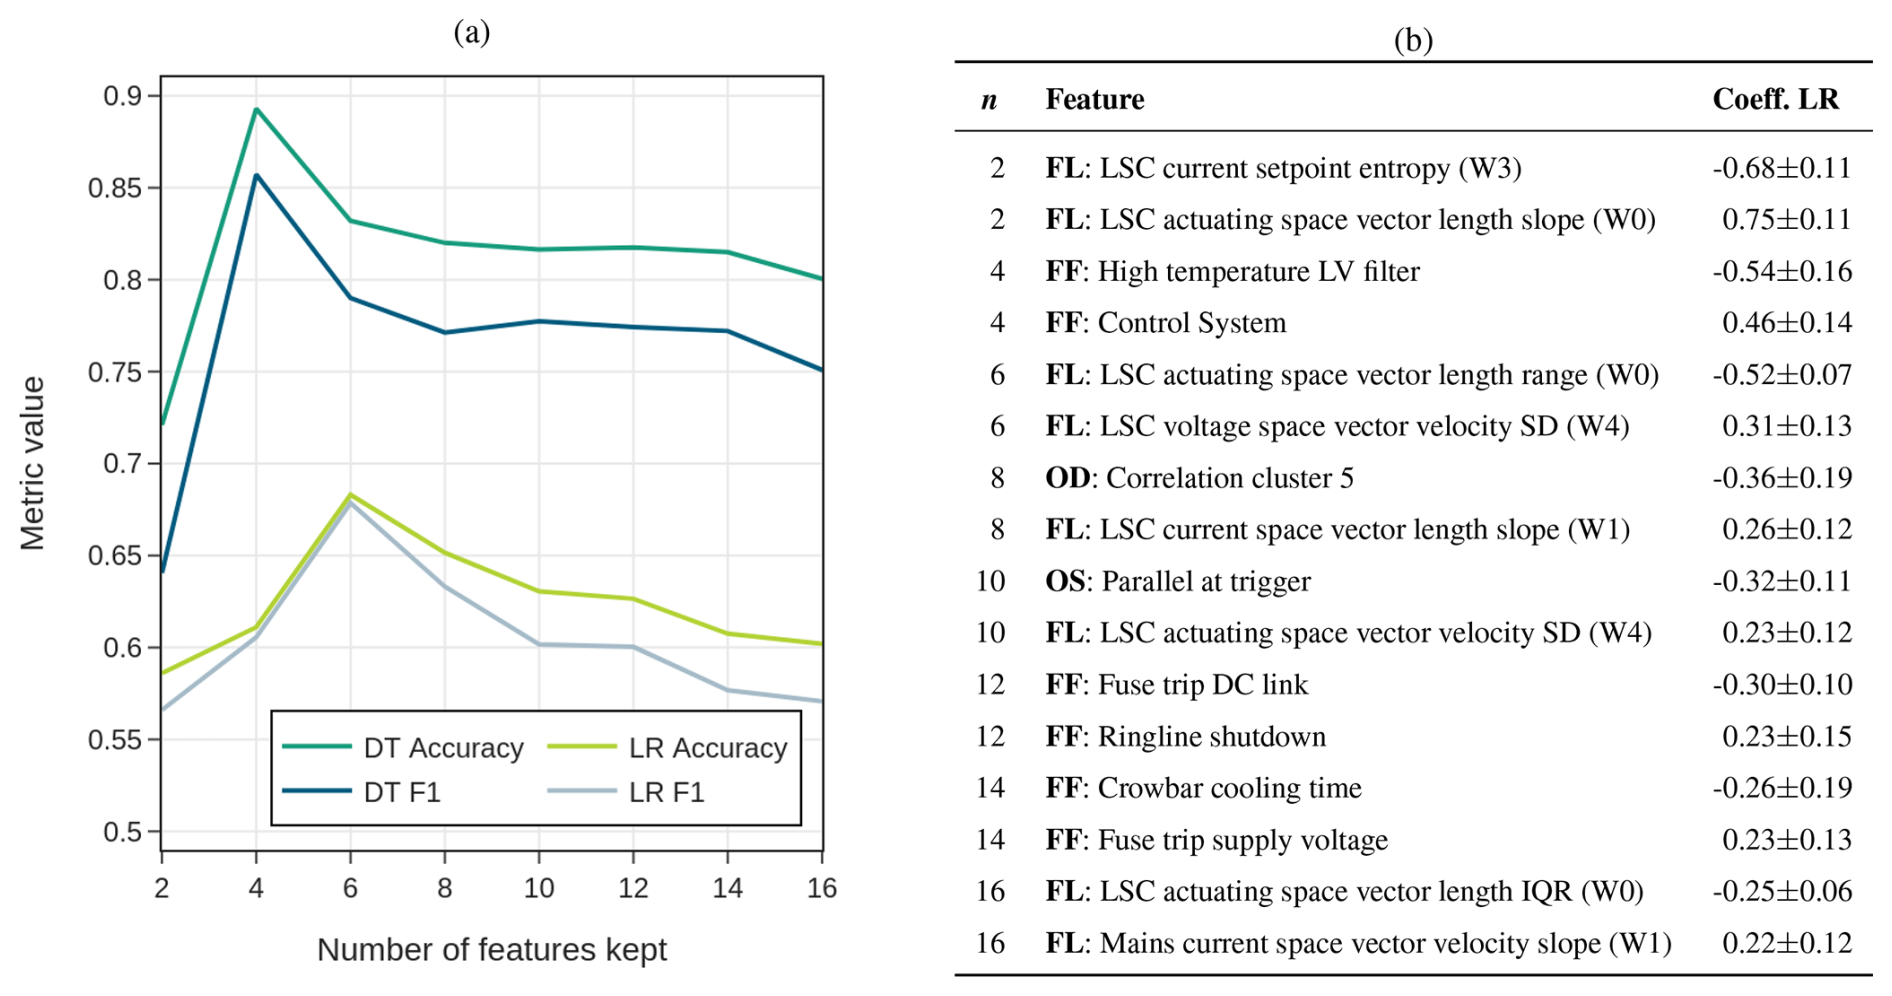
Figure 4(a) Resulting accuracy (ACC) and F1 score (F1) for a systematic analysis, keeping only a certain number of features in decision tree (DT) or logistic regression (LR) models; (b) retained features in analysis for the numbers of features kept (n) with corresponding regression coefficient of Fig. 3. Note that all preceding features are also retained for a certain number n of features kept.
Therefore, we systematically reduce the feature set by retaining only a specified number of extreme coefficients: selecting two features corresponds to preserving the largest and smallest coefficient, four features correspond to the two largest and two smallest coefficients, and so forth. The results of this analysis are displayed in Fig. 4a and the retained features for each step in Fig. 4b. The best model is achieved by retaining only four features in total, yielding an F1 score of 0.86 and an accuracy of 0.89 in the decision tree model. For a higher number of implemented features, those metrics decrease steadily by roughly 0.1 toward 16 features. Hence, coefficients with higher relative uncertainty or those coefficients with relatively small absolute values are consequently disadvantageous for the model and must therefore be omitted, also for decision support in remote diagnostics. It is observed that among the 16 most relevant features, only one OD and one OS feature are present; see also Fig. 4b. Therefore, this example shows that the information in the fault flags and the high-resolution information from the fast logs provide the necessary information, while the low-resolution features of the operating data contribute little or no predictive value. Please note that the limited size of our dataset with around 100 fault events limits the conclusions about its generalizability.
We have shown an approach to derive, combine, and reduce features from three data sources for a power converter in a wind turbine: operating data with a resolution of 1 min, event data, and high-resolution (4.5 kHz) fast logs recorded around a fault trigger. We have used this information for a remote diagnosis of the standstill time, i.e., the time until restart of the turbine, after a fault-induced shutdown.
With the shown algorithm, technical operation can automatically derive relevant additional insights from their available in-house datasets and use them for decision support, providing valuable information for a maintenance task. In the shown example, fast logs and fault flags of the converter control system are more relevant for determining the fault severity than operating or status data. The approach opens the possibility of identifying patterns related to certain faults from a plethora of features on a purely data-driven basis. It can generally be applied for any turbine system where trigger data from the converter control are available. In an ideal case, more detailed information about the converter faults and – even more importantly – about converter failures would be available from maintenance reports or post-mortem analyses. Furthermore, due to the dataset's size, we focused on simple models. Dataset augmentation by synthetic data generation, allowing for dataset size variations and a comparison with alternative machine learning methods (e.g., random forests or support vector machines) will be taken into consideration in future work.
Considering the successful prediction of converter-fault-related standstill times achieved with the presented approach, the inclusion of such data could make it possible to remotely diagnose converter failure modes and spare-part needs in the future. This bears the potential for increasing the first-time fix rate in converter maintenance and in this way reducing downtime, particularly in offshore wind farms.
The code underlying this study is not publicly accessible owing to intellectual property and confidentiality constraints. A description of the methodology is provided in the article. The raw data supporting the findings of this study are not publicly available due to legal, contractual, and confidentiality restrictions.
Conceptualization: K.F., T.L., and M.H. Data curation: M.H. and T.L. Formal analysis: T.L.. Funding acquisition: K.F. Methodology: T.L. Project administration: M.H. Supervision: K.F. Visualization: T.L. Writing (original draft preparation): T.L., K.F., and M.H.. Writing (review and editing): K.F., M.H., and T.L.
The contact author has declared that none of the authors has any competing interests.
Publisher's note: Copernicus Publications remains neutral with regard to jurisdictional claims made in the text, published maps, institutional affiliations, or any other geographical representation in this paper. The authors bear the ultimate responsibility for providing appropriate place names. Views expressed in the text are those of the authors and do not necessarily reflect the views of the publisher.
The provision of comprehensive field data by RWE Offshore Wind is gratefully acknowledged.
The present work was carried out within the project ReCoWind2. This research is funded by the German Federal Ministry for Economic Affairs and Climate Action (BMWK), grant no. 03EI4066A. The BMWK was renamed to the Federal Ministry for Economic Affairs and Energy (BMWE) in May 2025.
This paper was edited by Yi Guo and reviewed by two anonymous referees.
ABB: New ABB Ability Remote Services Help Boost Wind Parks' Performance | News Center, ABB Media Relations, https://new.abb.com/news/detail/2640/new-abb-ability-remote-services-help-boost-wind-parks-performance (last access: 27 May 2026), 2017. a
Anderson, F., Pelka, K., Walgern, J., Lichtenstein, T., and Fischer, K.: Trends and Influencing Factors in Power-Converter Reliability of Wind Turbines: A Deepened Analysis, IEEE T. Power Electr., 40, 7286–7297, https://doi.org/10.1109/TPEL.2025.3530163, 2025. a, b, c
Bette, H. M., Jungblut, E., and Guhr, T.: Nonstationarity in Correlation Matrices for Wind Turbine SCADA-data, Wind Energy, 26, 826–849, https://doi.org/10.1002/we.2843, 2023. a
Chen, H., Covert, I. C., Lundberg, S. M., and Lee, S.-I.: Algorithms to Estimate Shapley Value Feature Attributions, Nature Machine Intelligence, 5, 590–601, https://doi.org/10.1038/s42256-023-00657-x, 2023. a
Fischer, K., Pelka, K., Bartschat, A., Tegtmeier, B., Coronado, D., Broer, C., and Wenske, J.: Reliability of Power Converters in Wind Turbines: Exploratory Analysis of Failure and Operating Data From a Worldwide Turbine Fleet, IEEE T. Power Electr., 34, 6332–6344, https://doi.org/10.1109/TPEL.2018.2875005, 2019. a, b
Fischer, K., Anderson, F., and Walgern, J.: Medium-Voltage versus Low-Voltage Converter Reliability in Wind Turbines: A Field-Data Based Study, in: PCIM Conference 2025; International Exhibition and Conference for Power Electronics, Intelligent Motion, Renewable Energy and Energy Management, VDE VERLAG GMBH, Nuremberg, Germany, https://doi.org/10.30420/566541095, 2025. a
Froehling, S. and Fischer, K.: Condition Monitoring Approach for DC Link Capacitors in MW-Scale Power Converters, in: PCIM Conference 2025; International Exhibition and Conference for Power Electronics, Intelligent Motion, Renewable Energy and Energy Management, 2149–2155, https://doi.org/10.30420/566541284, 2025. a
Gück, C., Roelofs, C. M. A., and Faulstich, S.: CARE to Compare: A Real-World Benchmark Dataset for Early Fault Detection in Wind Turbine Data, Data, 9, 138, https://doi.org/10.3390/data9120138, 2024. a
Hameed, Z., Hong, Y., Cho, Y., Ahn, S., and Song, C.: Condition Monitoring and Fault Detection of Wind Turbines and Related Algorithms: A Review, Renew. Sust. Energ. Rev., 13, 1–39, https://doi.org/10.1016/j.rser.2007.05.008, 2009. a
Kostka, B. and Mertens, A.: Practical Implementation of a Concept for In-Situ Detection of Humidity-Related Degradation of IGBT Modules, in: 2022 24th European Conference on Power Electronics and Applications (EPE'22 ECCE Europe), 1–9, https://ieeexplore.ieee.org/document/9907302 (last access: 27 May 2026), 2022. a
Lin, Y., Tu, L., Liu, H., and Li, W.: Fault Analysis of Wind Turbines in China, Renew. Sust. Energ. Rev., 55, 482–490, https://doi.org/10.1016/j.rser.2015.10.149, 2016. a
ORE Catapult: System Performance, Availability and Reliability Trend Analysis (SPARTA) Portfolio Review 2021/22, Tech. rep., https://ore.catapult.org.uk/resource-hub/analysisreports/sparta-portfolio-review-2021-22 (last access: 27 May 2026), 2023. a
Peinke, J., Wächter, M., Heißelmann, H., Guhr, T., Lichtenstein, T., Reinkensmeier, J., Häckell, M. W., Böer, T., Asswad, J., Bastine, D., Bendlin, D., Bette, H., Eguchi, A., Fankhänel, M., Freund, J., Gansel, K., Haghani, A., Kühn, M., Marx Goméz, J., Pelka, K., von Maltzahn, V., Schwarzkopf, M.-A., Seifert, J. K., Solsbach, A., Walgern, J., Wiedemann, C., and Zurborg, S.: Wind farm virtual Site Assistant for O&M decision support – advanced methods for big data analysis (WiSAbigdata), Tech. rep., Technische Informationsbibliothek, Hannover, https://doi.org/0.34657/20633, 2024. a
Pelka, K. and Fischer, K.: Field-Data-Based Reliability Analysis of Power Converters in Wind Turbines: Assessing the Effect of Explanatory Variables, Wind Energy, 26, 310–324, https://doi.org/10.1002/we.2800, 2023. a
Rannestad, B., Fischer, K., Nielsen, P., Gadgaard, K., and Munk-Nielsen, S.: Virtual Temperature Detection of Semiconductors in a Megawatt Field Converter, IEEE T. Ind. Electron., 67, 1305–1315, https://doi.org/10.1109/TIE.2019.2901662, 2020. a
Schönfelder, O.: Die Datenflut Nutzen: Cloudification von Frequenzumrichtern, presentation at CPS.HUB NRW (Competence Center for Cyber Physical Systems), 2017. a
Schwenzfeier, N., Heikamp, M., Meyer, O., Hönnscheidt, A., Steffes, M., and Gruhn, V.: Outlier Detection in Wind Turbine Frequency Converters Using Long-Term Sensor Data, in: Proceedings of the AAAI Conference on Artificial Intelligence, vol. 36, 12601–12607, https://doi.org/10.1609/aaai.v36i11.21533, 2022. a
Sehr, F., Wagner, S., Schulz, A., and Vorwerk, A.: Condition Monitoring for Detection of Humidity-Induced Failures in Control Electronics of Power Converters, Microelectron. Reliab., 172, 115832, https://doi.org/10.1016/j.microrel.2025.115832, 2025. a
Tartt, K., Kazemi-Amiri, A., Nejad, A. R., McDonald, A., and Carroll, J.: Development of a Vulnerability Map of Wind Turbine Power Converters, J. Phy. Conf. Ser., 2265, 032052, https://doi.org/10.1088/1742-6596/2265/3/032052, 2022. a
Walgern, J., Stratmann, N., Horn, M., Then, N. W. Y., Menzel, M., Anderson, F., Kolios, A., and Fischer, K.: Reliability and O&M key performance indicators of onshore and offshore wind turbines based on field-data analysis, Wind Energ. Sci., 11, 1553–1568, https://doi.org/10.5194/wes-11-1553-2026, 2026. a
Zhou, W., Wang, M., Wu, Q., Lu, X., Xiao, K., and Chen, C.: Online Monitoring Method for a DC-Link Capacitor in an AC/DC/AC Converter, in: 2019 IEEE Energy Conversion Congress and Exposition (ECCE), 2953–2956, IEEE, Baltimore, MD, USA, https://doi.org/10.1109/ECCE.2019.8912171, 2019. a
The first-time fix rate (FTFR) is defined as the percentage of maintenance interventions where the technicians are able to resolve the issue during the initial site visit, without the need for follow-up interventions.