
the Creative Commons Attribution 4.0 License.
the Creative Commons Attribution 4.0 License.
 | 14 Sep 2026
Investigating grease behavior in tilted double-row tapered roller bearing installed in wind turbine by developing a full-scale multi-phase CFD model
Muhammad Ishaq Khan
Lorenzo Maccioni

Franco Concli
Lubrication plays a critical role in the effective performance of tapered roller bearings (TRBs) used as main bearings in wind turbines. Several experimental and CFD-based studies have investigated lubrication behavior in single-row TRBs. However, grease-lubricated double-row TRBs have not yet been studied extensively, particularly in large-size bearings. Therefore, this paper aims to investigate in detail the grease behavior in a tilted double-row TRB installed in a direct-drive wind turbine by developing a novel, three-dimensional, full-scale, multiphase CFD model. This model was implemented in the open-source environment OpenFOAM®, using a transient, incompressible, and multiphase solver based on the volume of fluid (VoF) model, where air and grease were treated as the two immiscible phases. Grease was modeled as a homogeneous non-Newtonian fluid using the Herschel–Bulkley formulation, with its rheological parameters determined by performing a best-fit analysis of experimentally obtained data. The simulated operating conditions included three grease filling ratios – 45 %, 35 %, and 21 % of the total volume of bearing lubricating chamber – at a rated rotational speed of 17.5 rpm, with a bearing tilt of 5° towards the main-frame side (MFS) relative to the vertical axis. The model captures grease distribution and inter-row fluxes across the bearing, identifying potential zones of lubricant starvation, and demonstrates how tilt affects grease flow between the two rows under varying fill conditions. Additionally, the model evaluates seal pressure, providing insights into the risk of grease leakage. The numerical predictions of grease distribution were validated experimentally using a smaller-scale TRB test rig, providing confidence in the model's ability to capture the dominant lubrication mechanisms in TRBs. The outcomes of this study have practical implications for optimizing relubrication strategies and improving maintenance planning for large wind turbine bearings.
- Article
(28275 KB) - Full-text XML
- BibTeX
- EndNote


The wind turbine main bearing is a critical component that transfers radial loads, axial forces, and bending moments from the rotor to the nacelle structure. It operates under complex dynamic loading and harsh environmental conditions, including low rotational speeds, high torque, and very low temperatures. The reliability of the main bearing is essential to the overall availability and performance of wind turbines, as its failure can result in extended downtime and costly repairs (Keller et al., 2016). According to Hart et al. (2019), main bearing failure rates can reach up to 30 %, highlighting the importance of robust bearing design and lubrication strategies.
Tapered roller bearings (TRBs) are widely used in heavy-load applications – including wind turbines and automotive transmissions – due to their ability to support combined loads (radial, axial, and bending), the absence of slip under ideal kinematic conditions, and high radial strength provided by line contact between rollers and raceways (Tong and Hong, 2014; Liu, 1976). In large wind turbines, double-row TRBs are employed as main bearings because they offer high load-carrying capacity and require less axial space than alternative configurations (Hart et al., 2020).
Effective lubrication is a key factor in maximizing the service life and reliability of bearings (Khonsari and Booser, 2017). Proper lubricant distribution within the bearing assembly minimizes friction and wear between contacting surfaces, while also promoting heat dissipation from heavily loaded regions (Mang and Dresel, 2007). These effects contribute to a reduction in load-dependent power losses (PLB), thereby improving overall system efficiency. In wind turbine main bearings, lubrication plays an even more critical role due to complex operating conditions. Therefore, effective lubrication is essential to prevent metal-to-metal contact and reduce the risk of premature main bearing failure (Hart et al., 2020). However, while lubrication improves bearing performance, it also introduces load independent power losses , which result from viscous (drag) and inertial (churning) effects due to the lubricant's interaction with rollers, raceways, and cage (Niemann and Winter, 2002). Therefore, lubrication strategies must balance wear protection and thermal control with energy efficiency considerations.
Experimental and numerical investigations have been extensively conducted to explore lubrication phenomena in rolling element bearings (Maccioni and Concli, 2020; Sadeghi et al., 2024). Wu et al. (2016) conducted an experimental study to investigate oil flow behavior and thermal characteristics in a jet-lubricated 7210 ball bearing with a bore diameter of 50 mm. A transparent test rig combined with high-speed imaging was employed to visualize oil supply patterns, flow fields, and temperature distributions. The results revealed that oil flow behavior is strongly influenced by the injection angle, nozzle position, and bearing rotational speed. Thermal analysis further indicated that insufficient lubrication can lead to elevated bearing temperatures, thereby increasing the risk of wear and failure. Wen and Oshima (2014) and Santhosh et al. (2017) performed numerical simulations, validated by experimental observations, to investigate the influence of cage design – specifically iron and plastic cages – on lubricant splash patterns in ball bearings. Transparent housings were utilized to facilitate macroscopic visualization of oil flow behavior under various operating conditions.
Russell et al. (2021) developed a novel test rig to investigate the frictional characteristics between the ball and cage in a deep groove ball bearing for four different cage types: a snap-on polymeric cage, a low-profile polymeric cage, a stamped steel cage, and a machined brass cage. The measured friction torque provided insights into the oil–air mixture dynamics within the cage pockets. The results also indicated that the coefficient of friction increased with rotational speed and decreased with applied load. Aamer et al. (2022) developed a test rig incorporating a transparent cage in a ball bearing to investigate the effect of cage position relative to the ball. It was observed that as the cage moved closer to the ball, greater air entrainment occurred within the cage, and striated fluid layers formed over the ball surface. These phenomena were further supported by CFD analysis using a multiphase lubrication model.
Arya et al. (2023) investigated oil starvation in a horizontally mounted angular contact ball bearing. A counter-rotating angular contact test rig equipped with transparent cages was developed to visualize oil distribution using high-speed imaging. The results showed that oil starvation within the bearing cage is influenced by several factors, including raceway motion, ball submersion level, lubricant properties, and cage pocket geometry. These experimental observations were further validated through CFD analysis using a two-phase lubrication model.
Manjunath et al. (2024) employed electrical impedance spectroscopy (EIS) to estimate lubricant film thickness in a TRB (SKF 81208TN). The results revealed a transition from boundary lubrication to mixed lubrication, and subsequently to elastohydrodynamic lubrication (EHL), as the rotational speed increased. To investigate lubrication dynamics in TRB (32312-A), Maccioni et al. (2022) utilized particle image velocimetry (PIV) by developing a custom test rig incorporating a sapphire outer ring to enhance optical accessibility. The PIV technique enabled the visualization of lubricant velocity patterns in the region between the cage and the outer ring – an area critical for understanding the pumping effect. The study also reported that bubble formation within the lubricant increased with rising rotational speed, indicating the presence of aeration phenomena. To further explore this behavior, a new solver was developed and implemented in OpenFOAM® to account for aeration effects, and the CFD results showed good agreement with the experimental findings. In another study, Maccioni et al. (2023a) conducted both experimental and numerical investigations to analyze lubricant fluxes in a fully flooded oil lubricated TRB (32312-A). PIV was employed to capture experimental velocity fields, while the numerical simulations were carried out using OpenFOAM®. The results revealed significant squeezing effects caused by high-pressure gradients near the edges of the rollers. Additionally, the tangential velocity of the lubricant was observed to be higher than that of the cage, highlighting the complex flow interactions within the bearing assembly.
has been investigated through both experimental and numerical approaches. Concli et al. (2020) and Feldermann et al. (2017) employed a multiphase CFD solver to simulate a single sector of an oil-lubricated cylindrical roller bearing to estimate . Marchesse et al. (2019) and Gao et al. (2022b) estimated the drag coefficient of rollers in cylindrical roller bearing using simplified, single-phase CFD models. Similarly, Hu et al. (2014) applied CFD techniques to evaluate drag losses in oil jet-lubricated ball bearings. In the context of TRBs, Maccioni et al. (2023b) conducted a combined numerical and experimental study on a TRB (32208), providing a detailed breakdown of the contributions of individual bearing components to the overall .
Hoeprich (2005) conducted an experimental investigation on grease behavior in TRBs using nine different grease formulations (different combinations of thickeners and oil viscosities) at rotational speeds of 1800 and 3600 rpm. Grease film thickness was measured using an infrared (IR) technique, and bearing temperatures were recorded to assess thermal performance. The results indicated that higher-viscosity greases contributed to more thermally stable operating conditions, as evidenced by reduced temperature rise. In another experimental study, Gao et al. (2022a) examined the thermal characteristics of a railway double-row TRB under varying rotational speeds. It was found that the temperature difference between the inner and outer rings diminished as the rotational speed increased, suggesting improved thermal equilibrium. Complementing these experimental studies, Li et al. (2022) and Zhu et al. (2022) employed CFD simulations to analyze the thermal and lubrication behavior of double-row TRBs during lubrication loss scenarios and investigated the influence of rib structures on oil flow dynamics.
Based on the study performed by Ishaq Khan et al. (2025), it was found that most experimental and numerical studies have been limited to oil-lubricated single-row TRB. Furthermore, the TRBs that were studied had an outside diameter (OD) less than 300 mm. No comprehensive study has been reported for grease-lubricated double-row TRB at such a large scale. It is also worth mentioning that the simulation models developed in the above studies employed a symmetry-based approach – simulating only a single sector and extrapolating the results to represent the entire bearing – except for the work by Concli et al. (2020). The use of geometric symmetry is often a valid simplification in CFD modeling of rolling element bearings, particularly when the bearing is perfectly aligned with the gravitational acceleration, the load is uniformly distributed, and there is no external tilt or misalignment. Under such conditions, each sector of the bearing experiences nearly identical lubrication behavior, and simulating a single sector with periodic boundary conditions provides an accurate and computationally efficient representation of the entire bearing. However, the use of symmetry is not always valid – particularly in wind turbine main bearings, where the bearing is typically tilted to promote uniform load distribution, leading to sector-dependent variations in lubrication dynamics (Loriemi et al., 2021).
The present research was conducted in collaboration with a wind turbine manufacturer to investigate lubrication behavior in a full-scale, grease-lubricated, double-row TRB installed as the main bearing in a direct-drive wind turbine. The bearing under study features a structural tilt of 5° towards the main-frame side (MFS) relative to the vertical axis, a configuration specifically implemented to improve load distribution. A comprehensive CFD model was developed using the open-source platform OpenFOAM® to simulate the multiphase grease–air interactions within the bearing under realistic operating conditions. All boundary conditions and operational parameters – including rotational speed, tilt, and grease fill levels – were defined based on specifications and guidance provided by the industrial partner, ensuring that the simulation closely reflects actual field conditions.
In the light of this, the primary objectives of this study are as follows:
-
to develop a novel, full scale, multiphase, 3D CFD model in OpenFOAM® environment for tilted double-row TRB;
-
to predict grease distribution across the bearing geometry during rotation, including zones that may experience lubricant starvation over time;
-
to assess the effectiveness of different initial grease fill rates under realistic gravitational and tilt conditions – information that can directly support maintenance planning and design of relubrication strategies;
-
to evaluate seal pressure under various conditions to assess the risk of grease leakage, which is a key concern in operational reliability.
The remainder of this paper is organized as follows. Section 2 outlines the methodology adopted for the development of the CFD model. This includes the creation of the computational mesh, definition of boundary patches and conditions, selection of an appropriate multiphase solver, the implementation of realistic operating parameters, and the experimental validation of the model. Section 3 presents the simulation results and discussion, focusing on grease distribution across the bearing under various fill ratios, lubricant fluxes, and seal pressure evaluation. Finally, Sect. 4 concludes the study by summarizing the key findings and highlighting their implications for bearing design and maintenance in wind turbine applications.
2.1 Geometry of double-row TRB
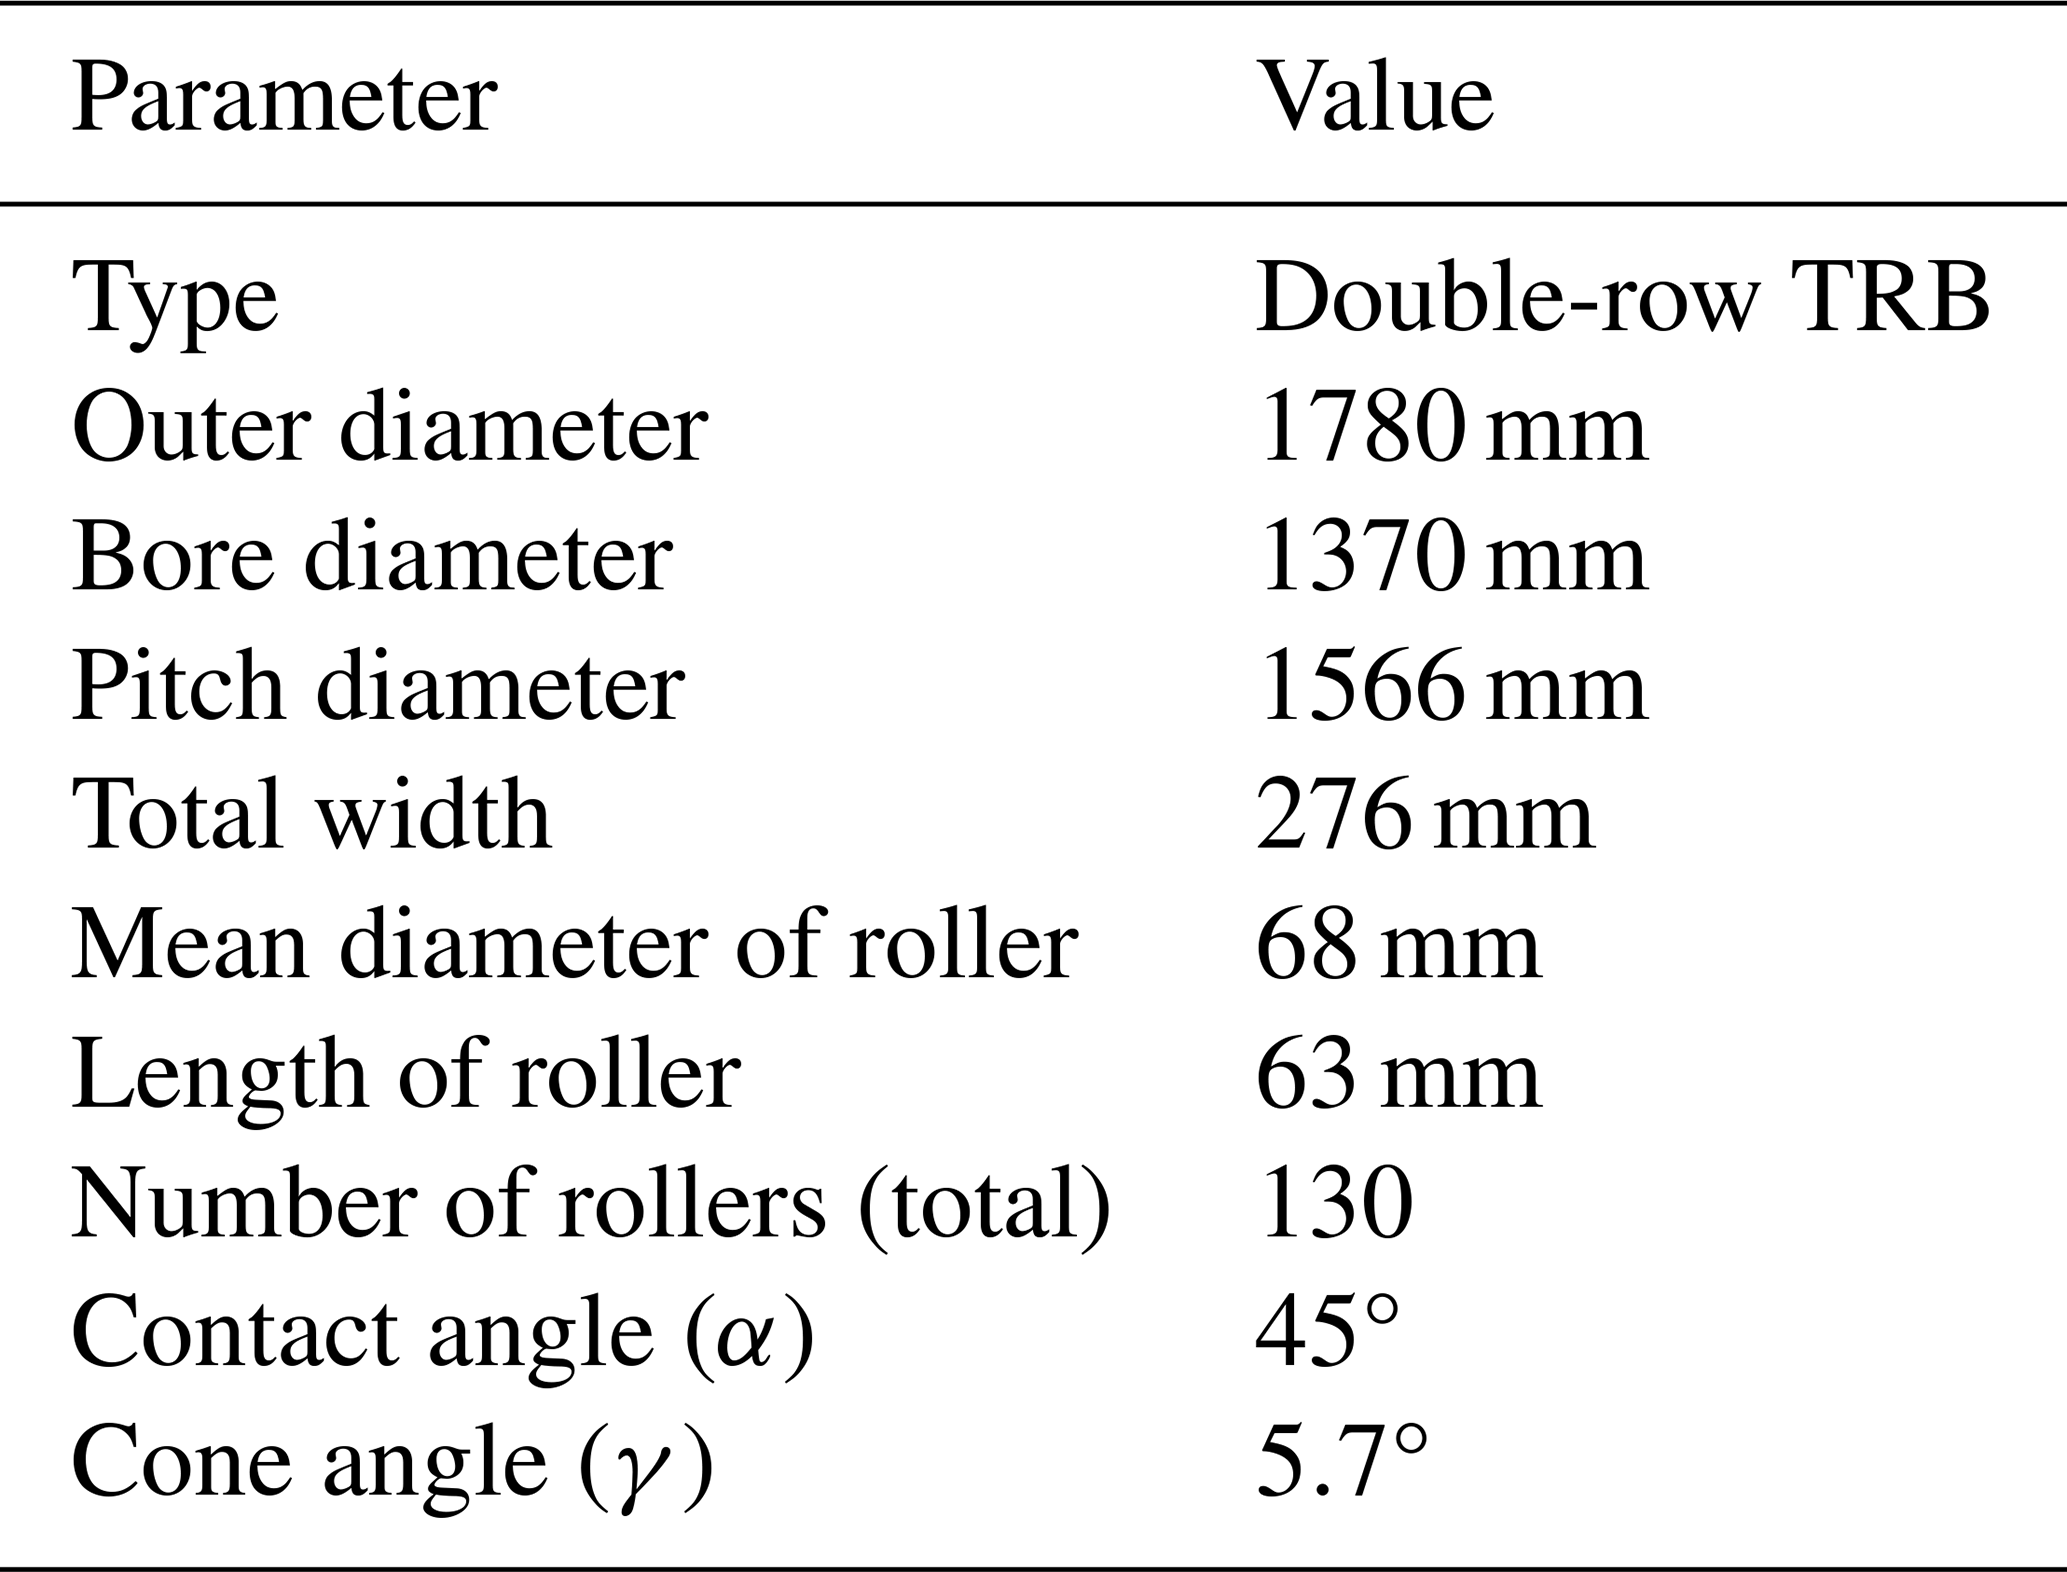
The development of the CFD model for the 415132191 double-row TRB started from the detailed study of its geometry. The main components of the bearing are rollers, cage, seal, inner raceway, and outer raceway. The 3D CAD model of the bearing is shown in Fig. 1a and the main components are highlighted in the section view of the bearing as shown in Fig. 1b. Each row consists of 65 identical sectors making a total of 130 similar sectors. The roller was scaled down by a factor of 0.98 about its center of gravity to increase the clearance between the roller and raceways. This adjustment facilitated the creation of a more uniform, and high- quality mesh near the wall boundaries, thereby avoiding extreme aspect ratios, highly skewed cells, and triangular-based cells without altering the global lubrication behavior under investigation (Maccioni et al., 2025). The key geometric specifications of the bearing are listed in Table 1.
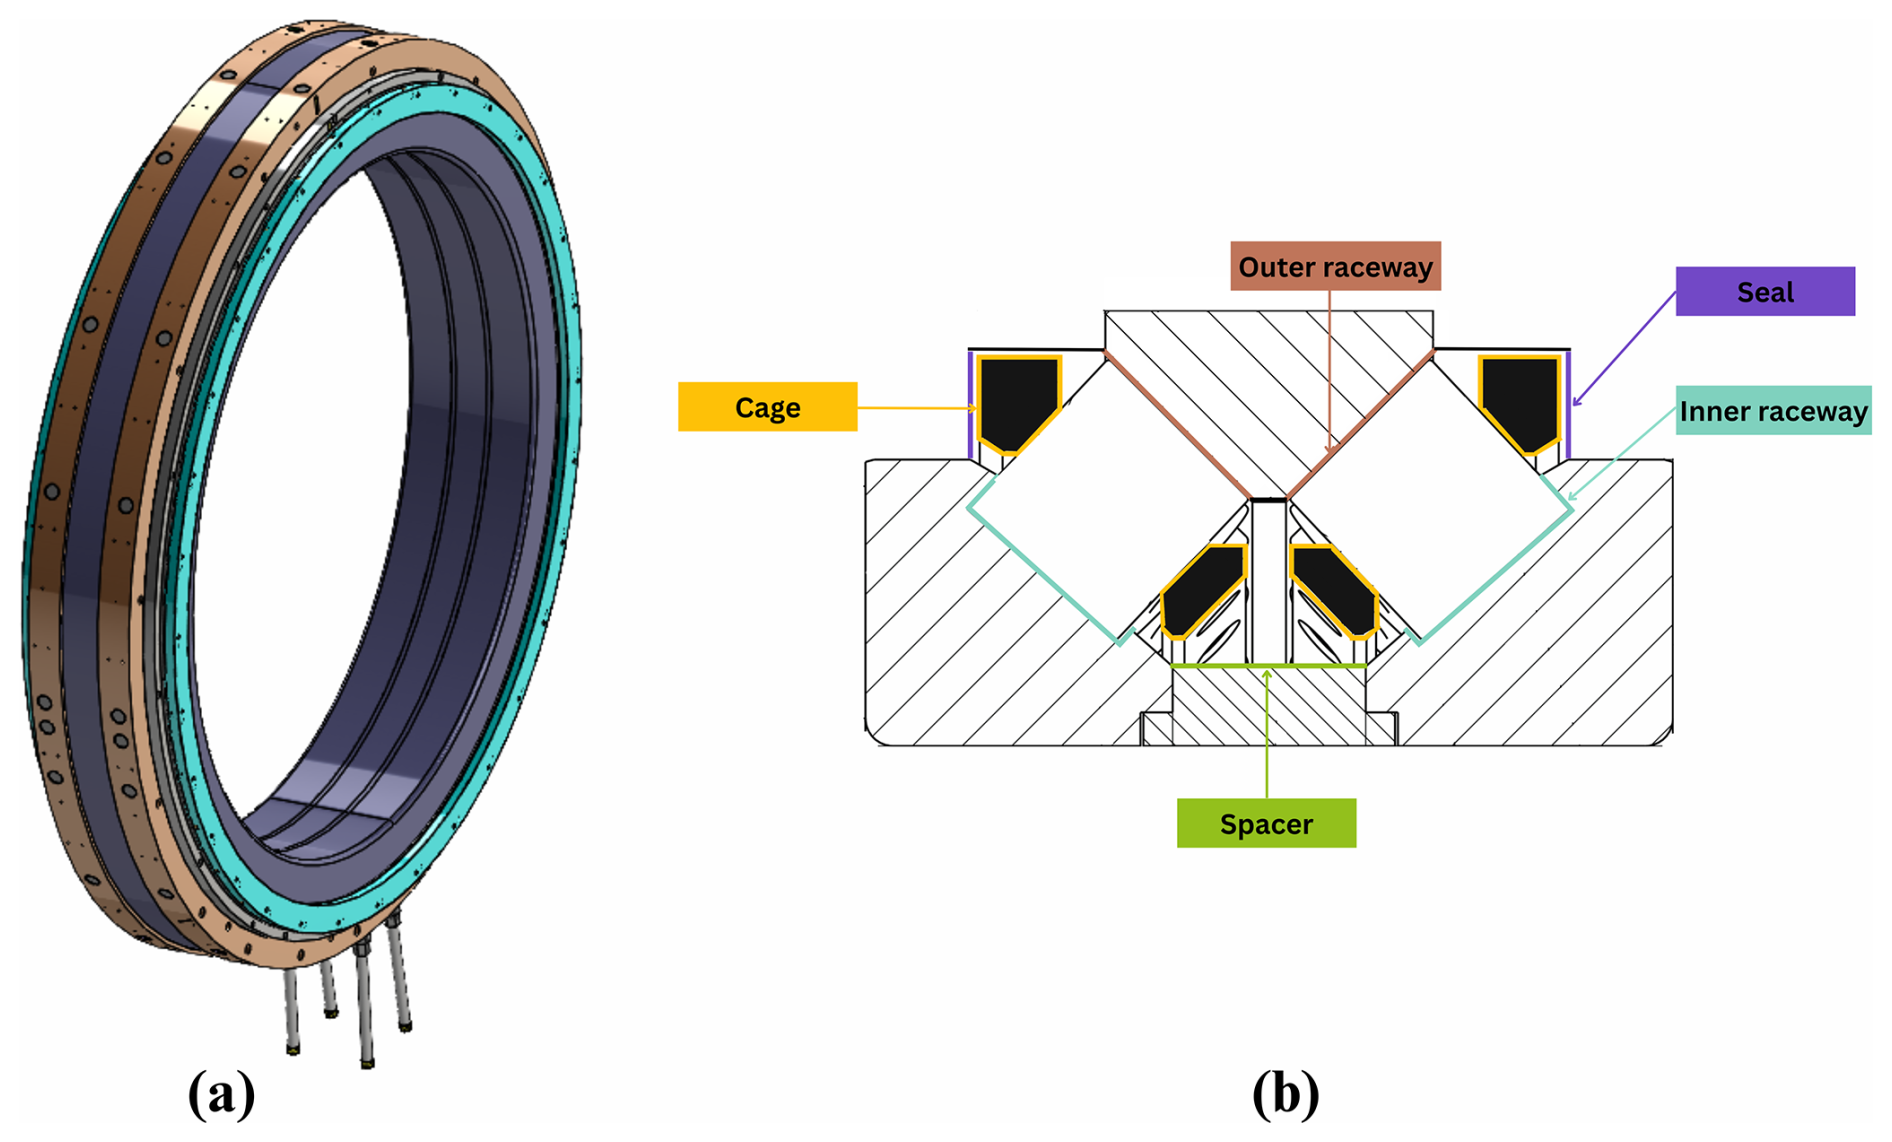
Figure 141513219 double-row TRB: (a) 3-D CAD model, (b) section view with major components highlighted.
2.2 Meshing of double-row TRB
2.2.1 Meshing of a half-sector
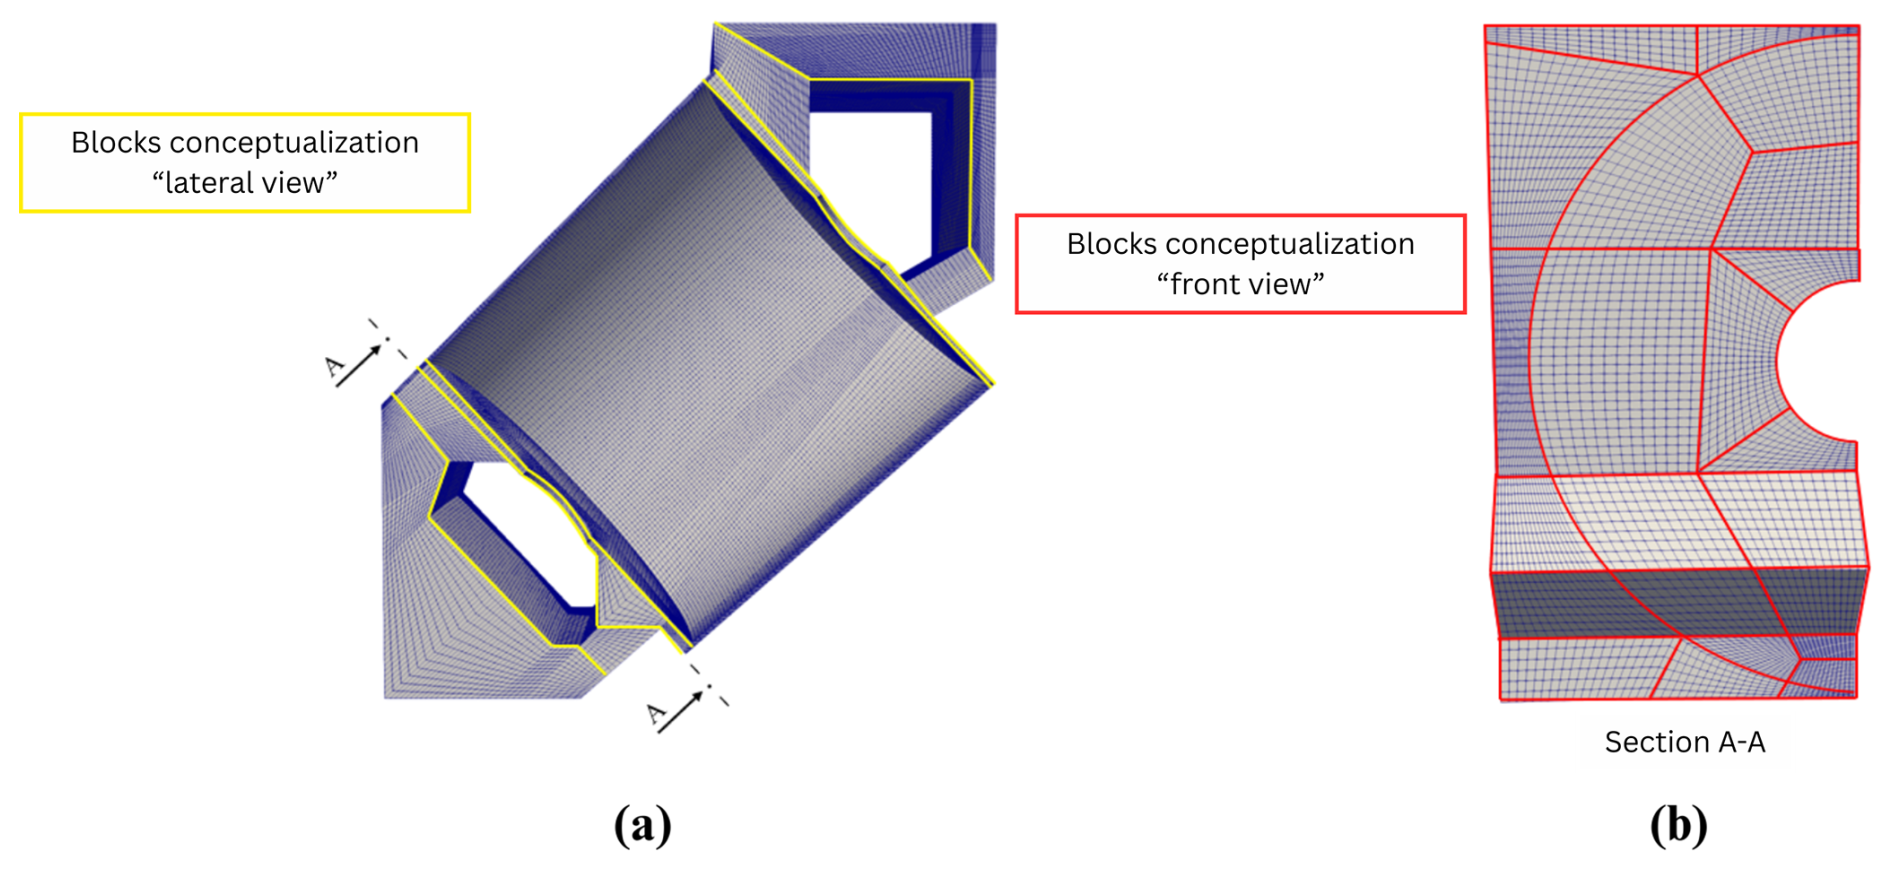
The mesh was generated using the blockMesh utility in OpenFOAM®. Since the bearing contains 65 rollers in each row, it comprises 65 identical sectors. Initially, the mesh was created for a half-sector of the bearing to facilitate structured mesh generation. This half-sector was divided into seven partitions along the lateral direction (Fig. 2a), while the frontal face was segmented into 23 parts following a specific pattern (Fig. 2b). This pattern was consistently applied across all seven lateral partitions, enabling creation of a high-quality structured mesh. Hexahedral blocks were employed to ensure high numerical accuracy (Maccioni et al., 2023b), with each block consisting of eight vertices and spanning the width between adjacent partitions. A total of 123 hexahedral blocks were constructed for this half-sector.
2.2.2 Meshing of full bearing
The creation of the mesh for the entire bearing presented significant challenges. The first major issue stemmed from the fact that the bearing consists of 65 sectors – an odd number. As a result, a simple mirroring approach was not viable, since mirroring would produce an even number of sectors (e.g., 64), leaving the 65th sector unaccounted for. Creating the final sector manually and attempting to stitch it to the existing mesh carried a high risk of misalignment at the interface, potentially compromising mesh quality and numerical accuracy.
The second challenge was related to the scale and complexity of the bearing. Due to the large number of cells involved – on the order of millions – it was impractical to manually define all vertices, blocks, and arc segments directly in OpenFOAM® using the blockMeshDict file. OpenFOAM® does not automatically generate vertices: each one must be explicitly declared. To address both of these issues, a custom MATLAB® script was developed to parametrize the geometry and automate the generation of vertices, blocks, and arcs. This approach ensured consistency, accuracy, and scalability in the mesh generation process.
The previously created half-sector mesh served as the reference, which was rotated through 360° around the bearing axis (x axis) to construct the complete bearing mesh. The rotation was performed in the y–z plane using a standard rotation matrix as shown in Eq. (1).
In this context, α represents the rotation applied to each vertex of the half-sector mesh. Since each bearing row consists of 65 identical sectors, the angular width of each sector is
Each vertex is represented by a 3D coordinate vector as
The script first created the second half of the initial sector by mirroring the z coordinates of the original vertices with respect to the x–y plane, while keeping the x and y coordinates unchanged. This resulted in two adjacent half-sectors forming one complete sector within the same row, symmetrically reflected across the x–y plane.
To complete a full 360° rotation and generate the mesh for the entire bearing, the coordinates of each vertex of this sector were rotated by 5.53° in successive steps around the bearing axis in the y–z plane. For the second sector, the vertex coordinates from the first sector were rotated by 5.53°. For the third sector, the output coordinates from the second sector were again rotated by the same angle, and so on. This recursive approach ensured that each sector was generated based on the immediately preceding one, simulating a cumulative rotation through the full circular geometry. However, certain vertices lying along the boundaries between adjacent sectors were common across sectors due to their symmetry. It is important to note that OpenFOAM® treats vertices with different names as distinct, even if they occupy the same spatial location. This behavior can result in mesh discontinuities at sector interfaces. To preserve mesh continuity and avoid duplicate nodes at shared locations, the script reused these boundary vertices from the previous sector instead of creating new ones. This transformation was implemented via matrix-vector multiplication, as shown below:
Each transformation was executed in the script using a nested for loop, which iterated over all sectors, thereby constructing the complete mesh for 65 sectors within a single bearing row.
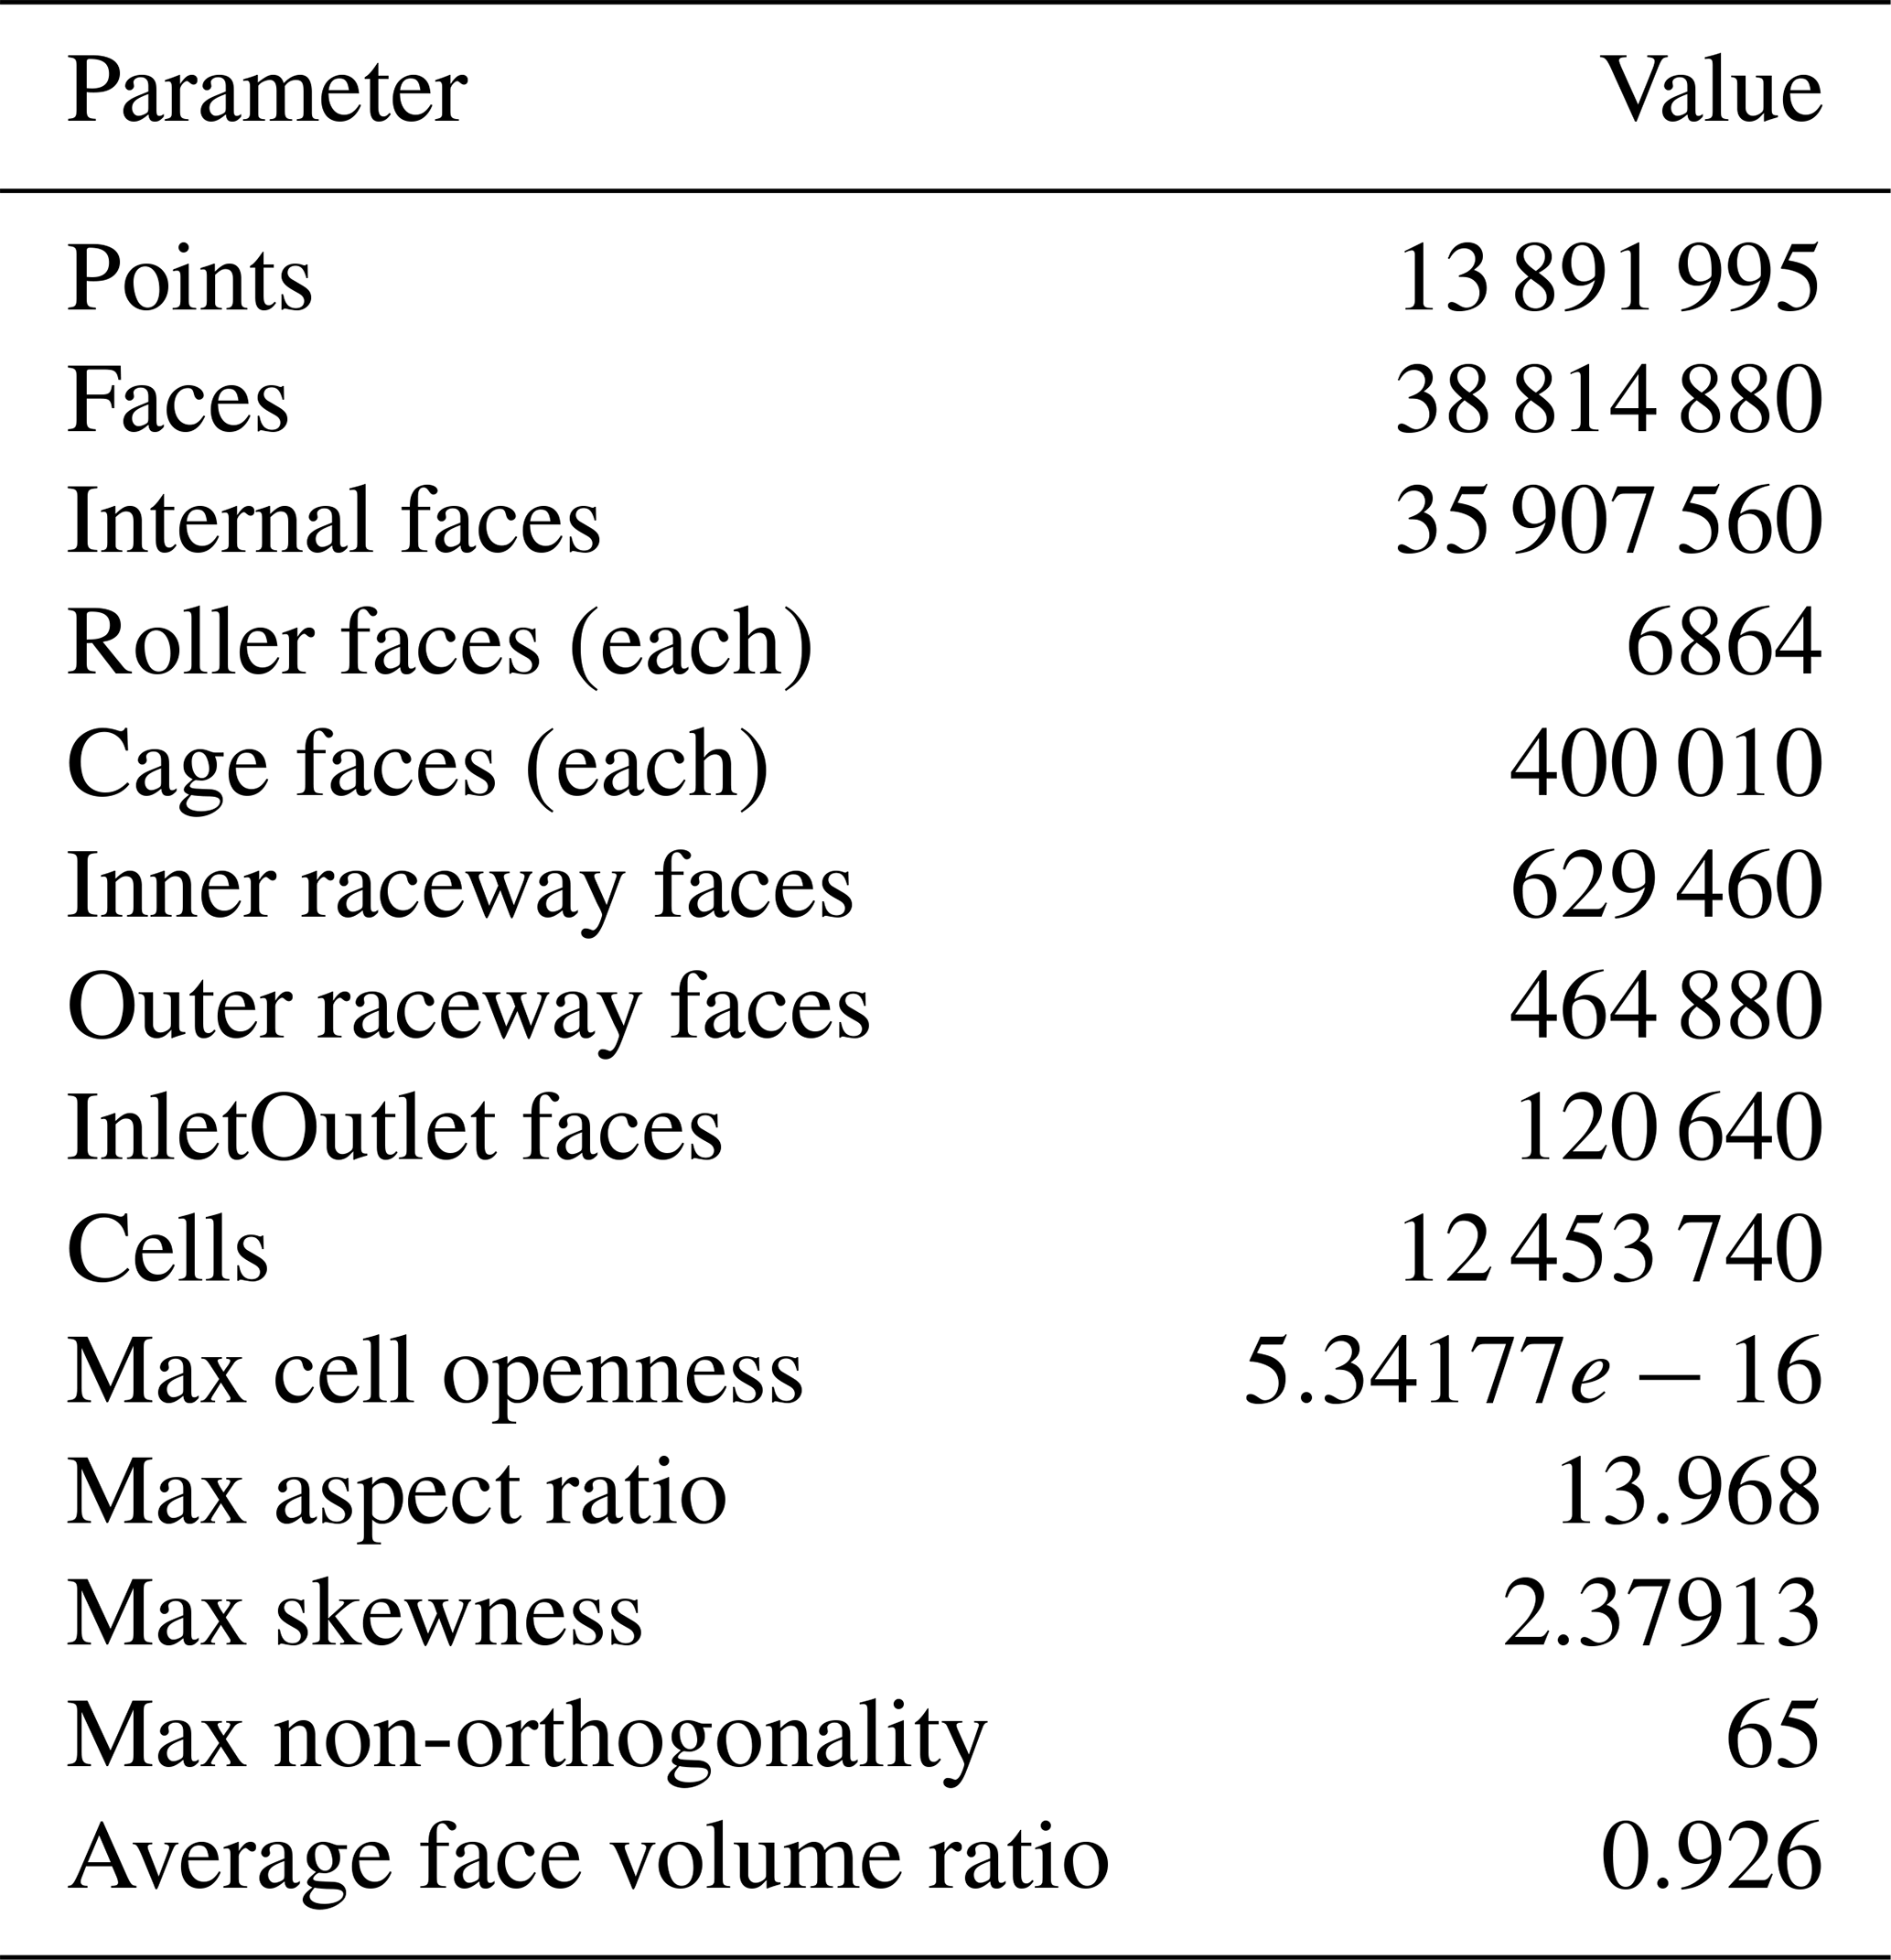
The bearing consists of two rows that are mirror images of each other. This symmetry was used to create the second row. To use the mirror utility, .stl files were created in order to keep the patches for the second row as well. The first row was then mirrored through symmetry. This automated and parametric approach enabled the generation of a high-resolution, structured hexahedral mesh for the full double-row tapered roller bearing geometry. The total cell count reached approximately 12.5 million. The grid for the full geometry is demonstrated in Figs. 3 and 4.
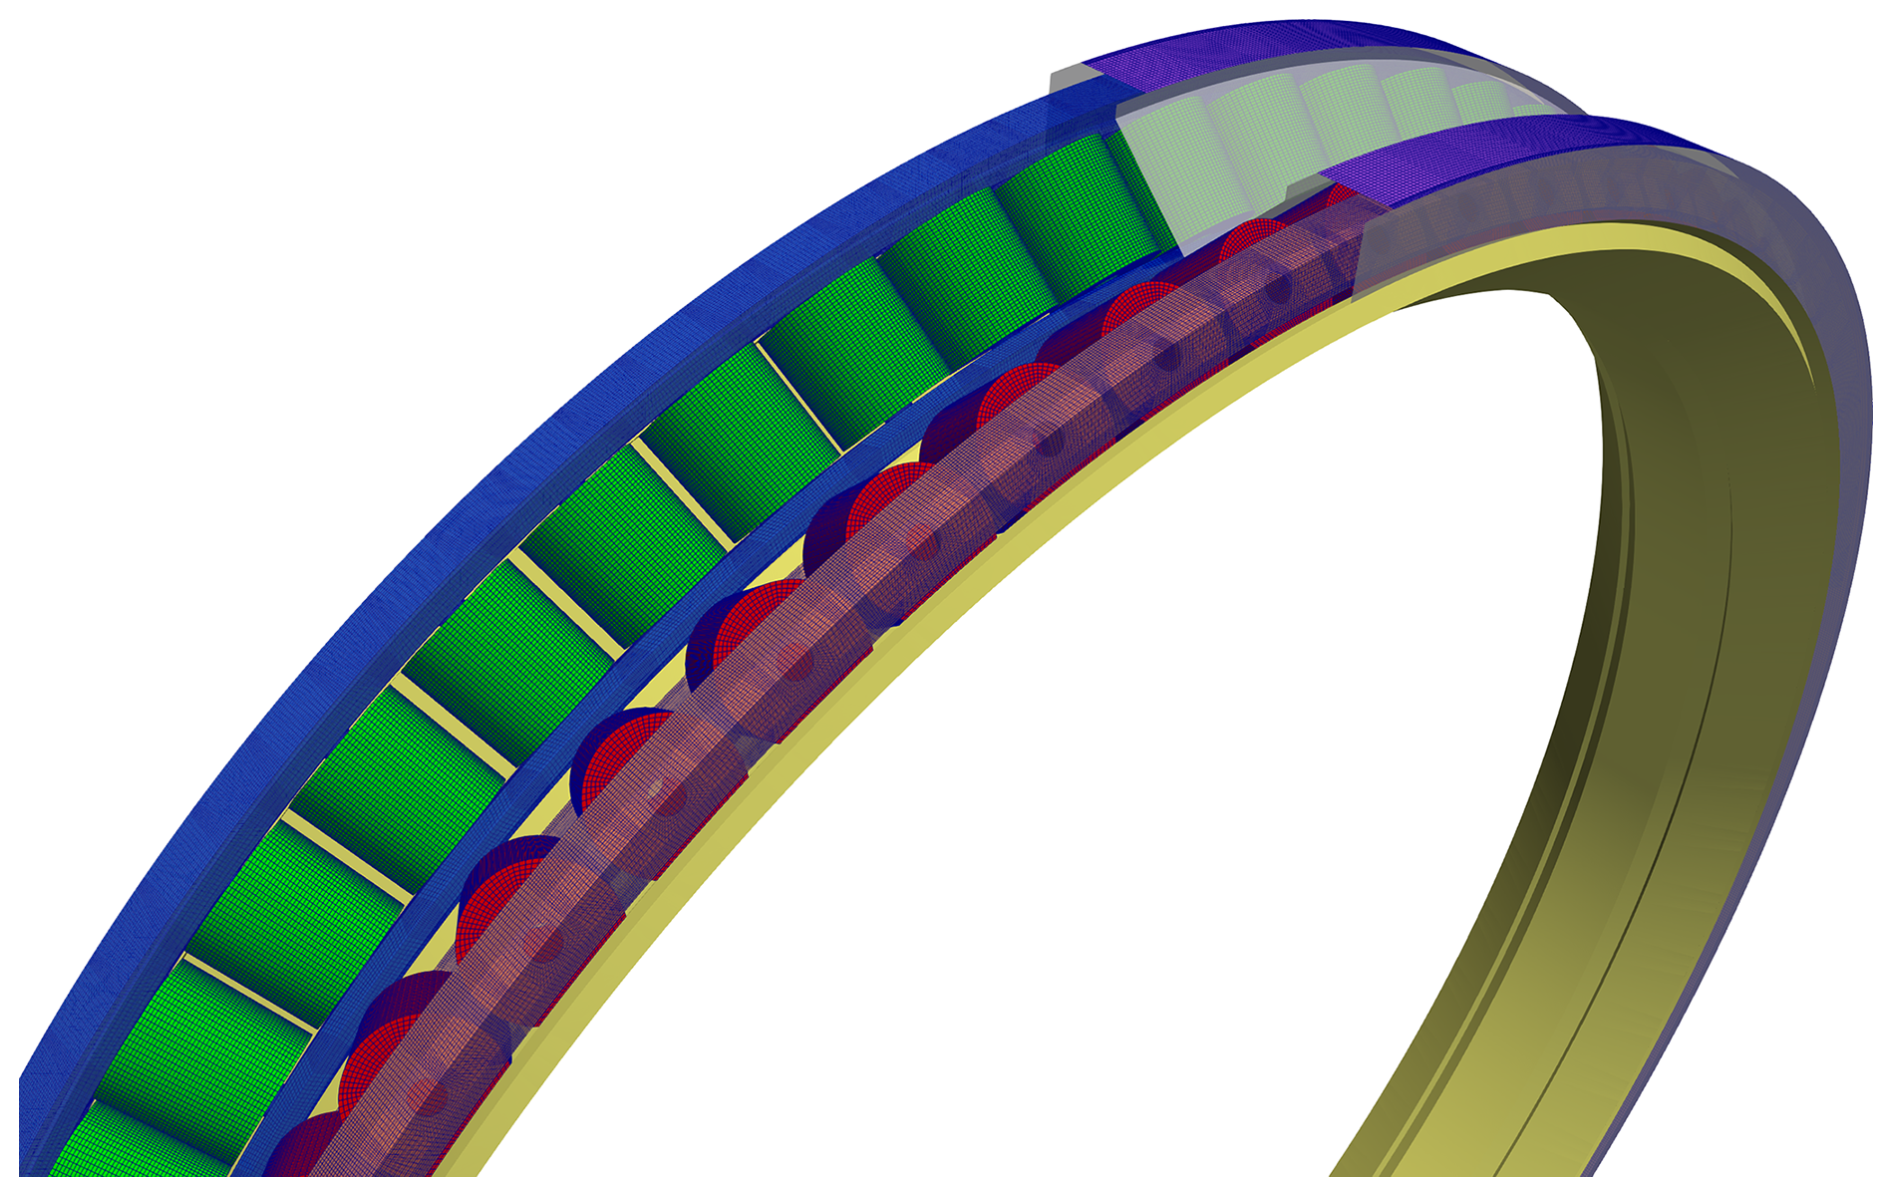
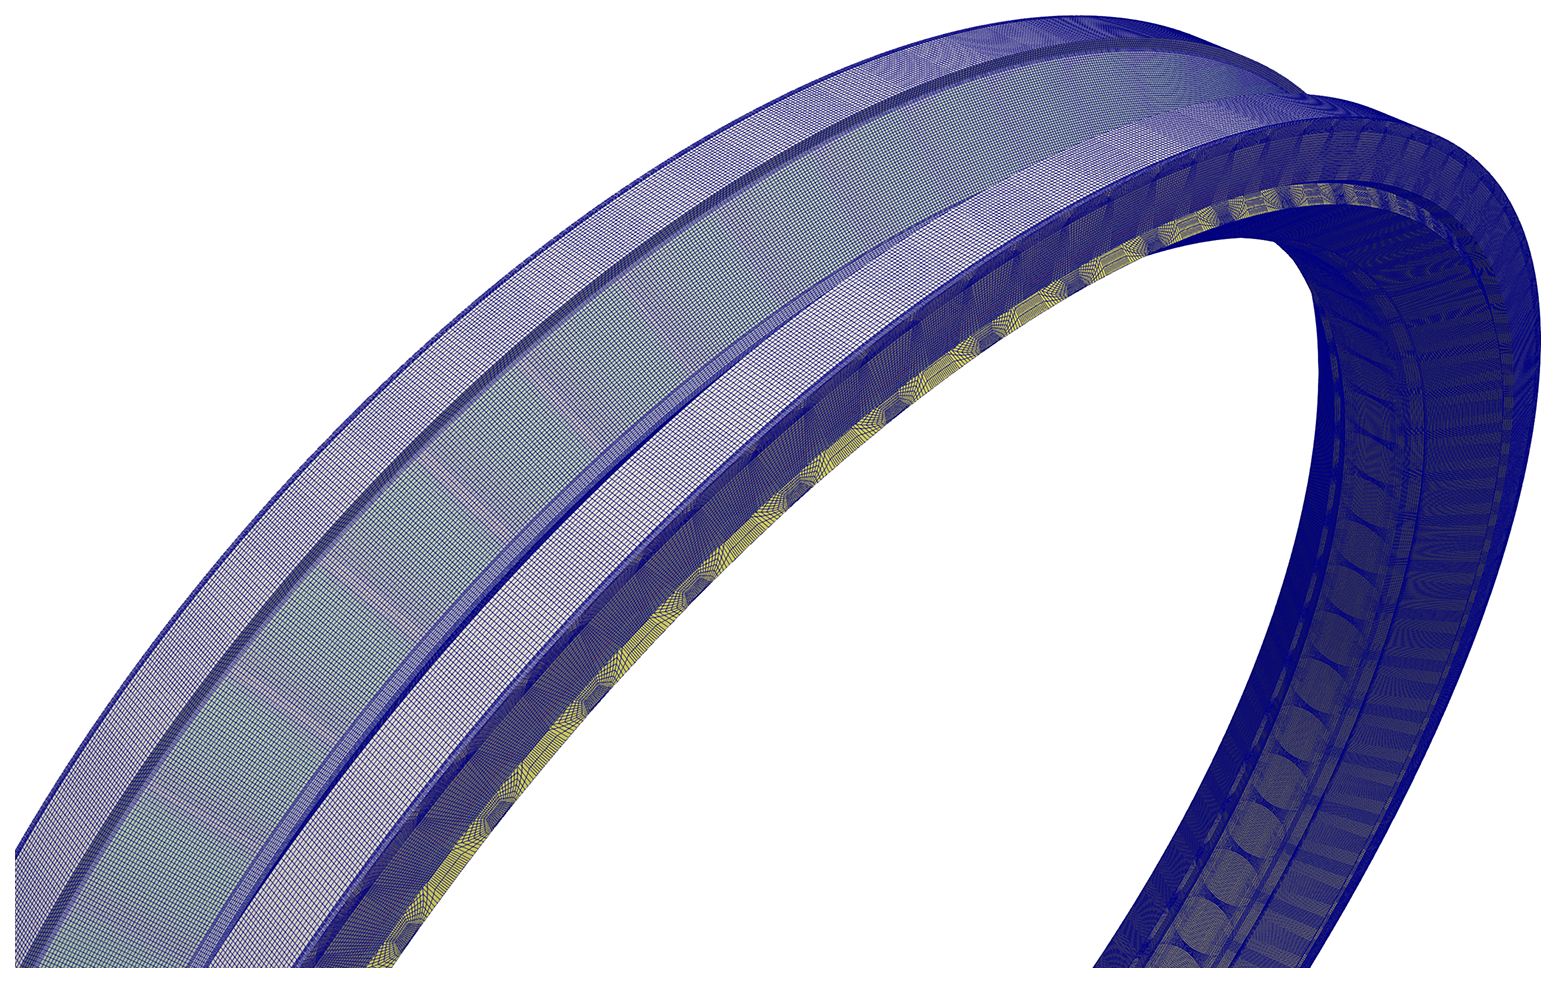
2.2.3 Patches of the modeled bearing
The mesh was divided into multiple regions by defining patches. Patches are collections of boundary faces that represent specific regions within the computational domain. Appropriate boundary conditions (BCs) were then applied to these patches according to the physical conditions. In this study, the entire mesh of the double-row TRB was divided into several patches as shown in Fig. 5a.
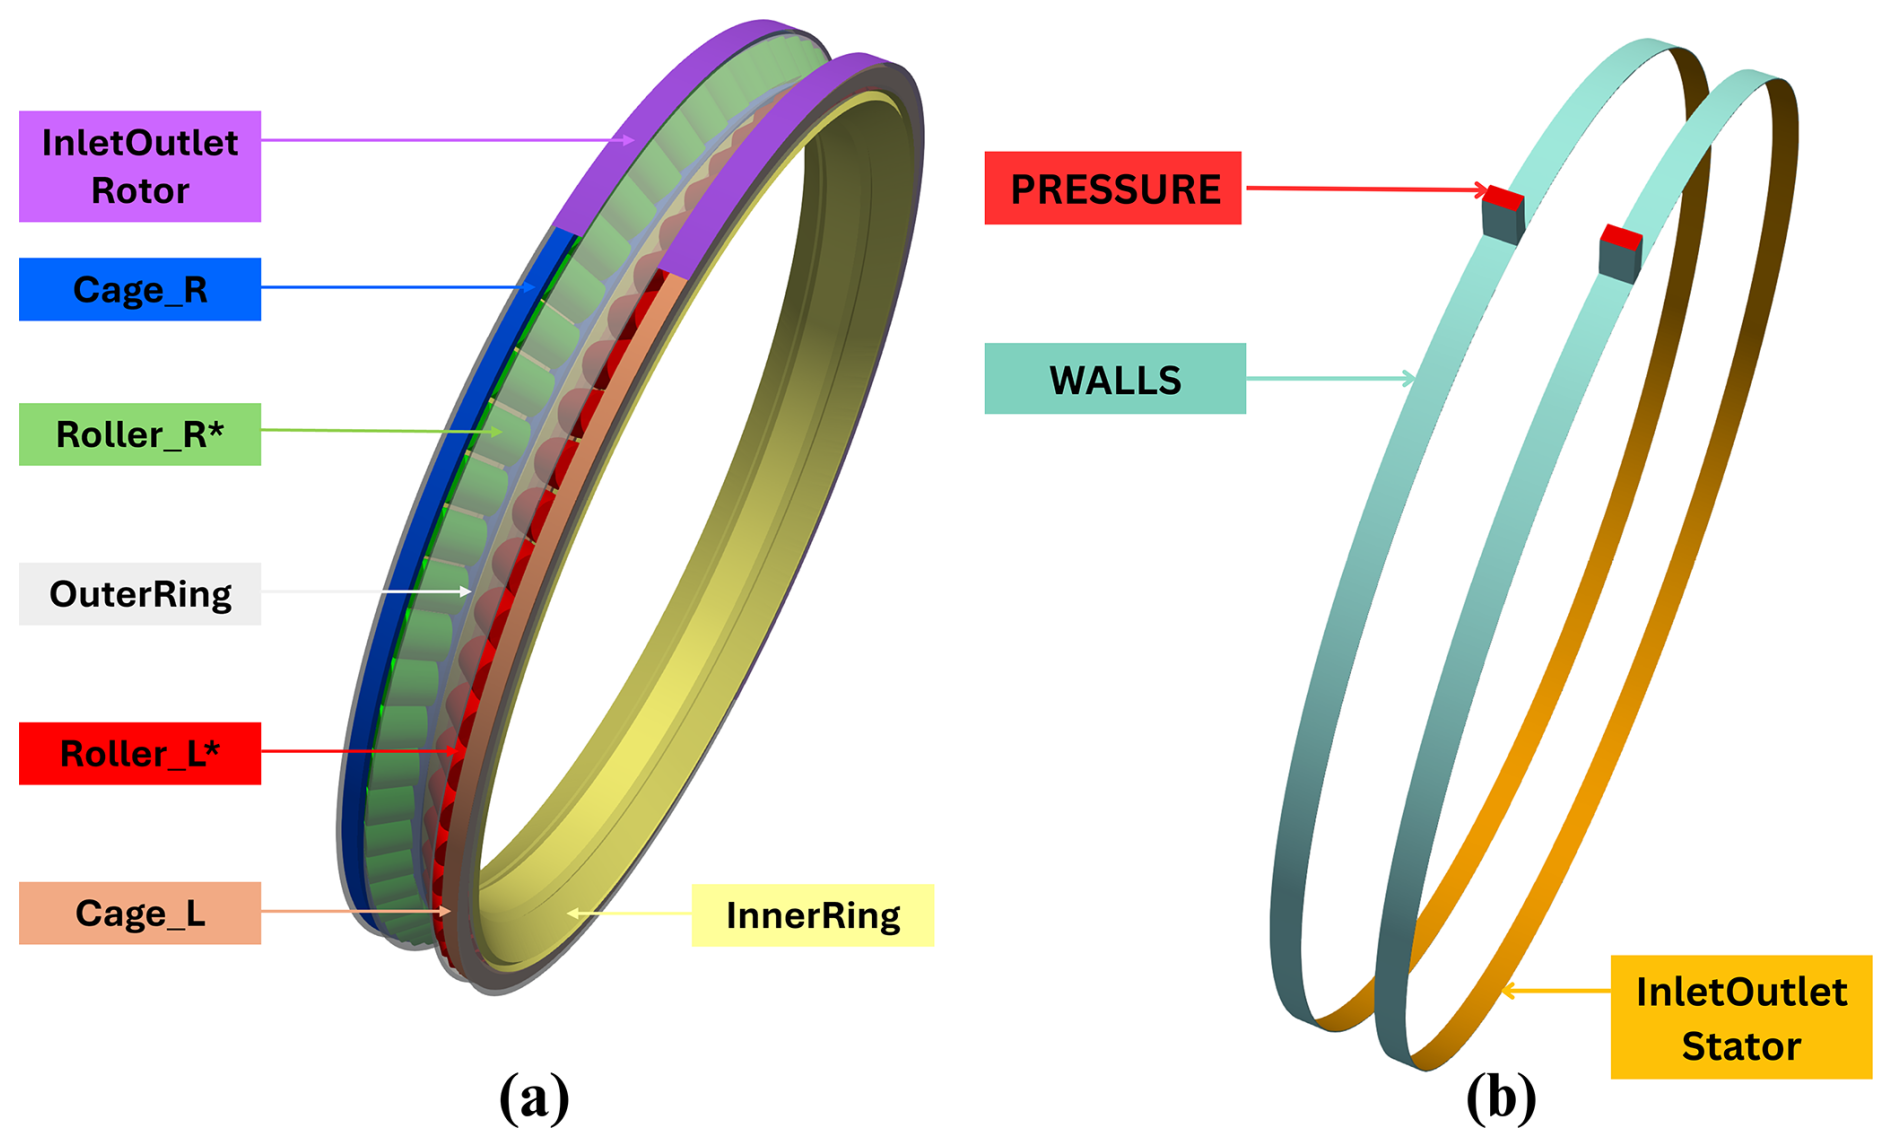
Figure 5(a) Patches corresponding to bearing components. Velocity BCs applied to each patch are cyclicAMI (InletOutlet Rotor), movingWallVelocity (Cage_R), conicalWallVelocity (Roller_R), rotatingWallVelocity (OuterRing), conicalWallVelocity (Roller_L), and movingWallVelocity (Cage_L). (b) Additional patches defined for imposing pressure BCs. Velocity BCs for these patches are zeroGradient (PRESSURE), fixedValue (WALLS), and cyclicAMI (InletOutlet Stator).
Each roller in the left and right rows was defined as a separate patch. The rollers in the left row are shown in red, while those in the right row are shown in green. The right and left cages are displayed in blue and brown, respectively. The “InletOutlet Rotor” patch is shown in purple, the “InnerRing” in yellow, while the “OuterRing” is depicted as transparent. Three additional patches – namely, InletOulet Stator, PRESSURE, and WALLS – were defined to ensure appropriate pressure BCs within the fluid domain (Fig. 5b). It is worth noting that in Fig. 5, two different meshes were used (Fig. 5a and b). This is because the mesh containing the dynamic parts of the bearing (Fig. 5a) needs to move according to the kinematics that will be described in the following sections, whereas the mesh shown in Fig. 5b remains static. The two meshes communicate through two arbitrary mesh interfaces (AMIs), that is, non-conformal interfaces across which the flow fields are exchanged. These are the InletOutlet Rotor interface within mesh (Fig. 5a) and the InletOutlet Stator interface within mesh (Fig. 5b). The inclusion of the external mesh (Fig. 5b) is necessary because the bearing contains a channel that is typically used for grease refilling during maintenance and remains open to ambient pressure during operation. This channel, where the PRESSURE patch is defined, is located above the bearing and can be considered unaffected by the grease flow during rotation. However, even though this channel is not directly influenced by lubricant motion, it was included in the model to provide the system with a consistent pressure reference.
2.2.4 Key parameters of mesh quality
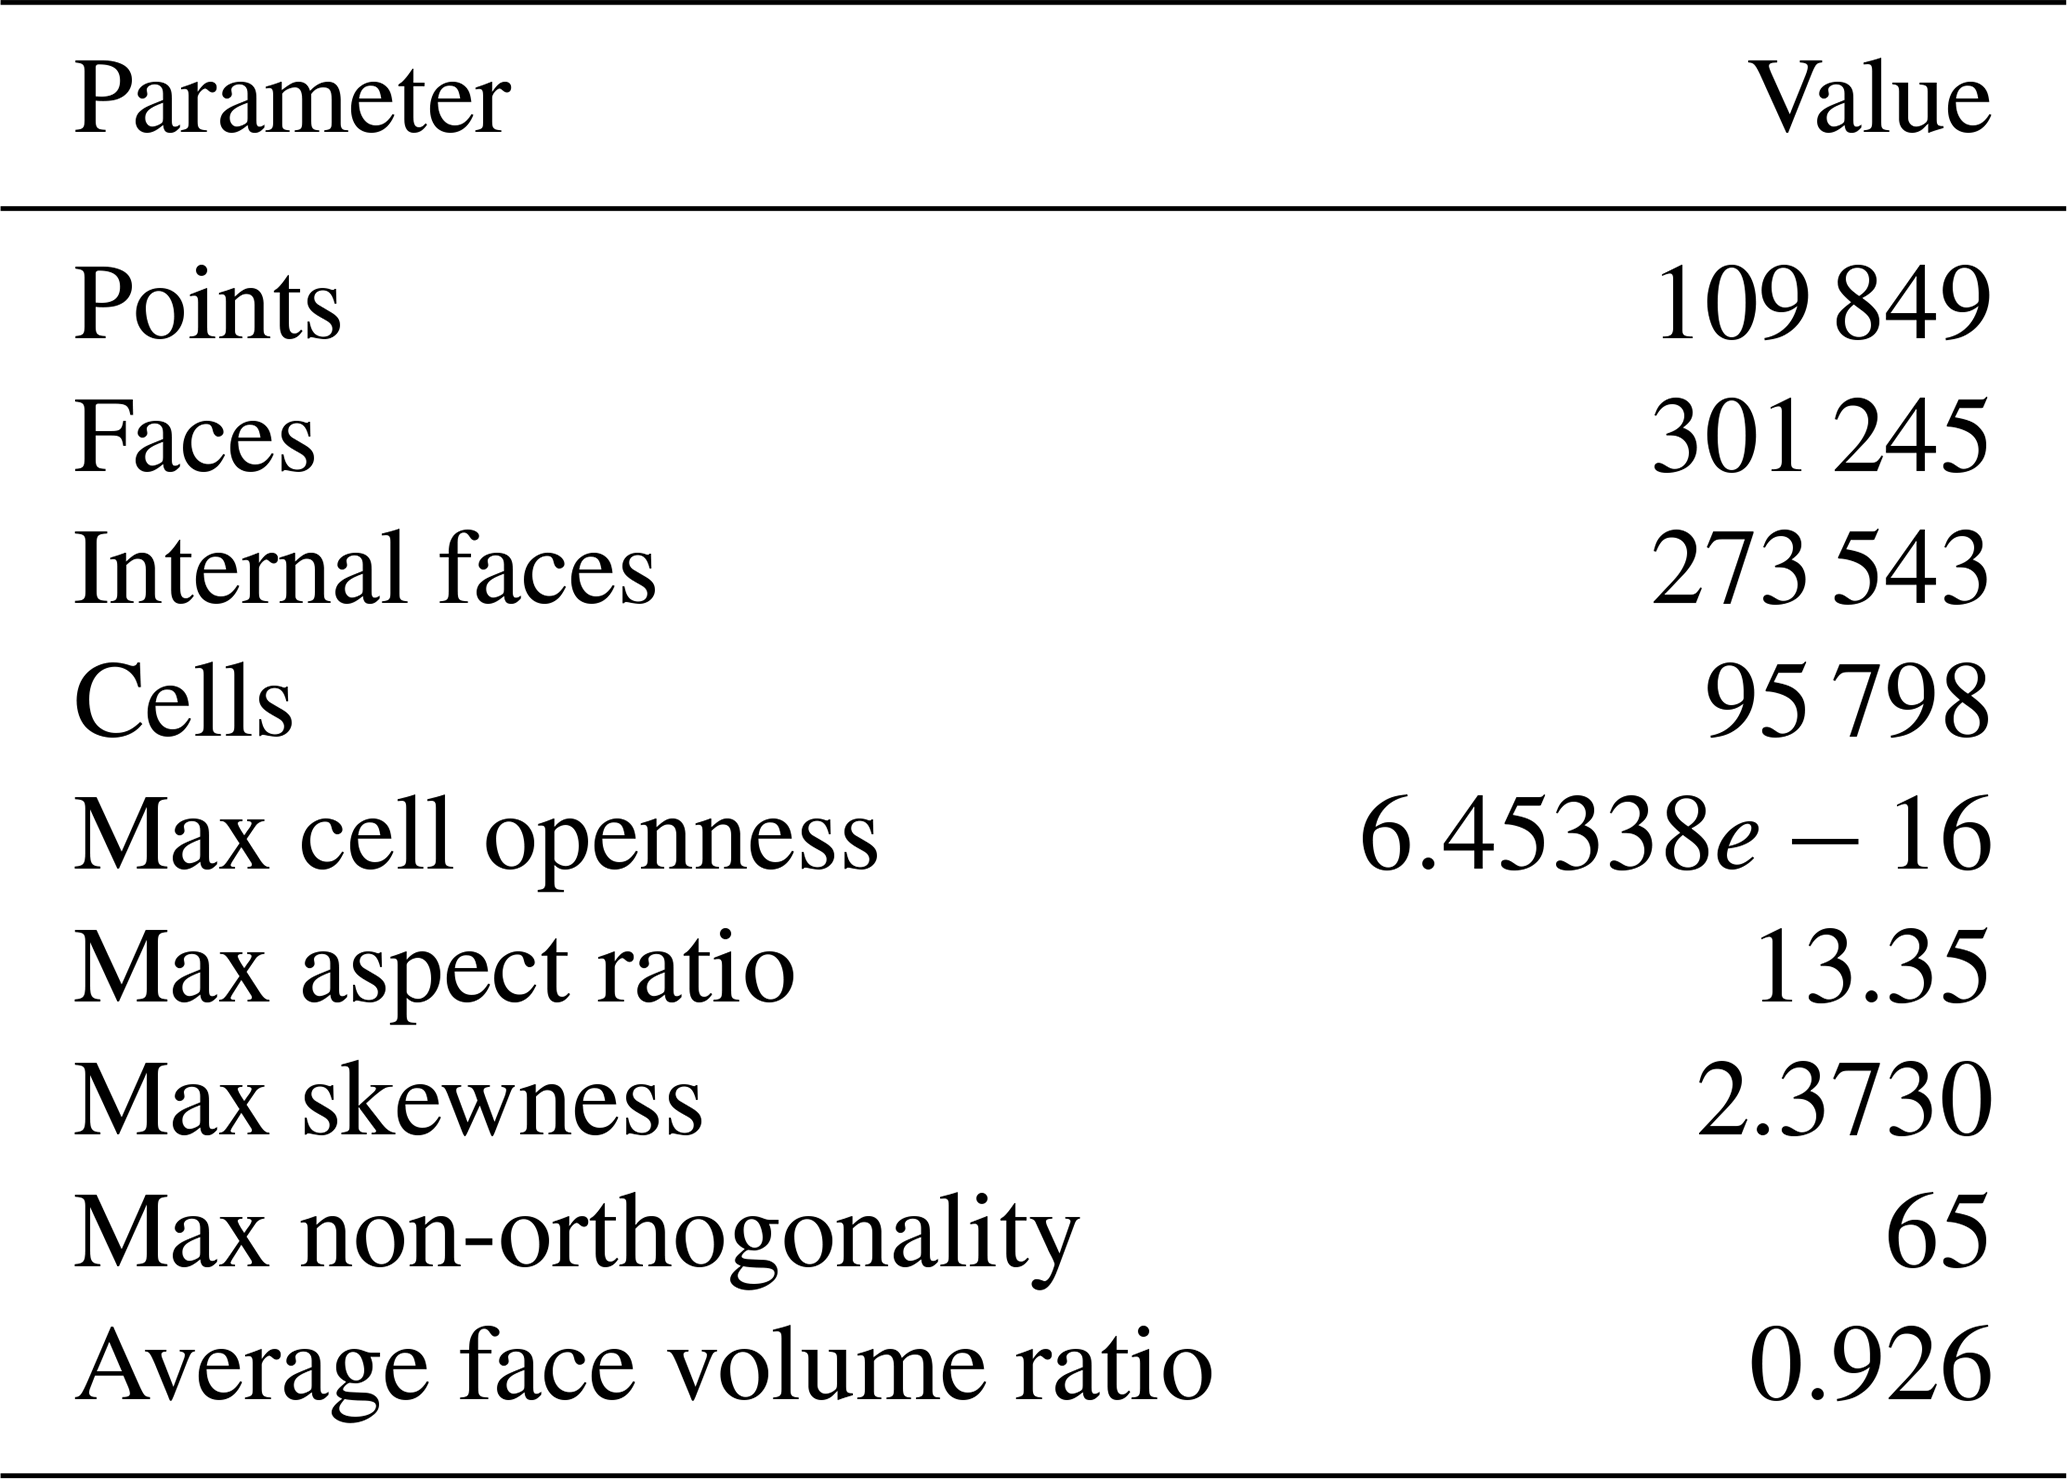
The mesh created for the full bearing was further check for its quality. The utility named checkMesh in OpenFOAM® used for this purpose. The aspect ratio – defined as the ratio of the longest side of a cell to the shortest – had a maximum value of 13.968, which is considered acceptable for a complex geometry such as a large-size bearing; values exceeding 20 may lead to interpolation errors and numerical instability. Cell skewness is a measure of how much the cell deviates from ideal shape. A value of more than 4 may cause numerical errors during simulation. Non-orthogonality is a measure of angle between the normal of face and vector connecting the center of neighboring cell. If the maximum non-orthogonality is more than 70°, it may cause instability in simulation. The face volume ratio is the measure of the difference in volumes of adjacent cells. Abrupt changes in the volume of cells in the mesh can lead to numerical errors. The average value close to 1 shows an excellent mesh quality (OpenFOAM® Foundation, 2024). The key parameters of mesh quality for single sector and full bearing models are listed in Tables 2 and 3, respectively.
2.3 Governing equations
2.3.1 CFD governing equations
Two fundamental laws of conservation were solved in this study, i.e., the law of conservation of mass (continuity equation) and the law of conservation of momentum (Navier–Stokes equation). The fluid domain was considered isothermal; therefore, the energy equation was not solved in the model. Continuity equation for incompressible flow is shown as Eq. (5) and in expanded form in Eq. (6):
where u is the velocity vector. Navier–Stokes equation for incompressible and non-Newtonian fluid is shown as Eq. (7):
where ρ is the fluid density, u is the velocity vector, τ is the stress tensor (includes pressure and viscous stress), ρg represents body forces like gravity, and F includes additional external forces.
2.3.2 Volume of fluid model
In this study, the interaction between grease and air inside the bearing is modeled using the volume of fluid (VoF) approach implemented in OpenFOAM®. This method is particularly suitable for tracking the interface between the two immiscible phases – grease and air – while preserving volume conservation and capturing interface dynamics.
The volume fractions of grease (αgrease) and air (αair) satisfy the relation:
and are used to compute phase-averaged properties such as density, for example:
This formulation enables smooth interpolation of physical properties across the grease–air interface and is critical for resolving free surface evolution under tilt and rotation effects in the bearing cavity.
2.3.3 Kinematics of TRB
The kinematics of key components, i.e., rollers, cage, and inner and outer raceways, play an important role in the CFD modeling of TRB. In the kinematics of a TRB, contact angle (α), roller mean diameter (dR), pitch radius , and rotational directions of shaft speed (ωS), roller speed (ωR), and cage speed (ωC) play a significant role.
Contact angle (α) is the angle between the bearing axis and roller axis. In TRBs, the rollers are cone-shaped with a definite cone angle (γ) and their axes intersect the bearing axis at a common point known as the apex point. This geometric design ensures pure rolling motion of the rollers and facilitates a uniform distribution of radial and axial loads. For a double-row TRB, two apex points opposite to each other are present, each for its respective row. Equations (10) and (11) show that the rotational speed of cage (ωC) and rollers (ωR) can be expressed in terms of these geometric parameters (dR, Dp, and α) and shaft rotational speed ωS (Maccioni et al., 2023a).
ωS is considered the input velocity. Inner raceway rotates with the same velocity as ωS while the outer raceway is stationary.
2.3.4 Lubrication model
In this study, grease is used as a lubricant. Grease is a non-Newtonian fluid exhibiting complex behavior under varying shear rates. At low shear rates, the viscosity of grease is high and behaves as a solid up to its yield point. At high shear rates, viscosity decreases and grease begins to flow. This behavior is called shear thinning, and can be witnessed from the experimental data for the grease used in this study as shown in Fig. 6a.
In the present study, grease is modeled as a homogeneous non-Newtonian fluid using the Herschel–Bulkley formulation, which captures its shear-thinning and yield stress behavior (Pirro and Wessol, 2004). This simplification allows us to focus on the global flow and distribution characteristics of grease within the bearing and neglects inhomogeneities such as aging or phase separation. The Herschel–Bulkley model is represented as Eq. (12):
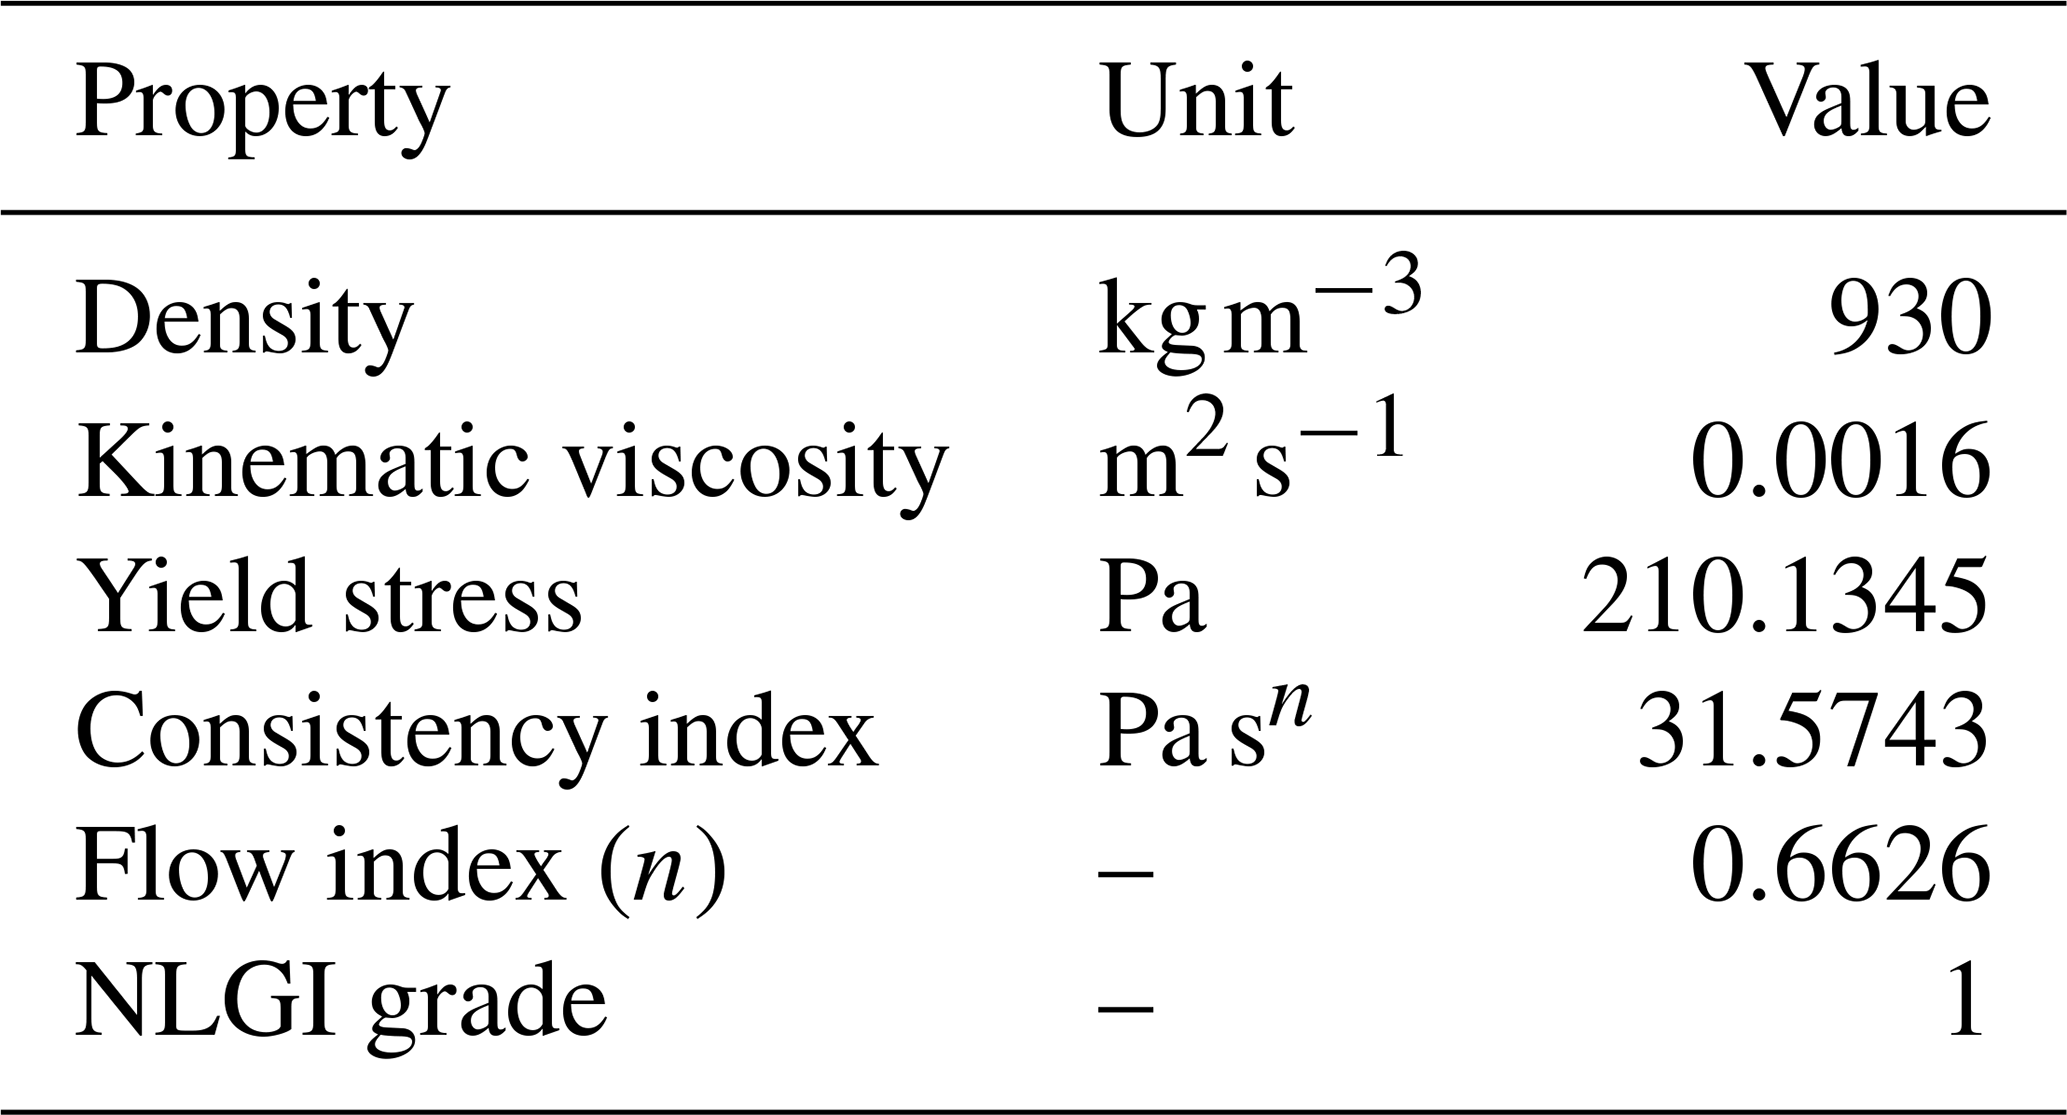
where τ is the shear stress, τy is the yield stress, K is the consistency index, is the shear rate, and n is the flow behavior index. τy, K, and n were determined from experimental data using the concept of curve fitting. MATLAB® script was developed in which sum of squared errors method was implemented to calculate these parameters. Experimental data and calculated data were in strong agreement with each other as shown in Fig. 6b. The full set of determined rheological parameters, i.e., τy=210.1345 Pa, K=31.5743 Pa sn, and n=0.6626, was incorporated directly into the CFD solver. Thus, the complete constitutive definition of grease was used in the simulations, ensuring that its non-Newtonian characteristics were fully represented.
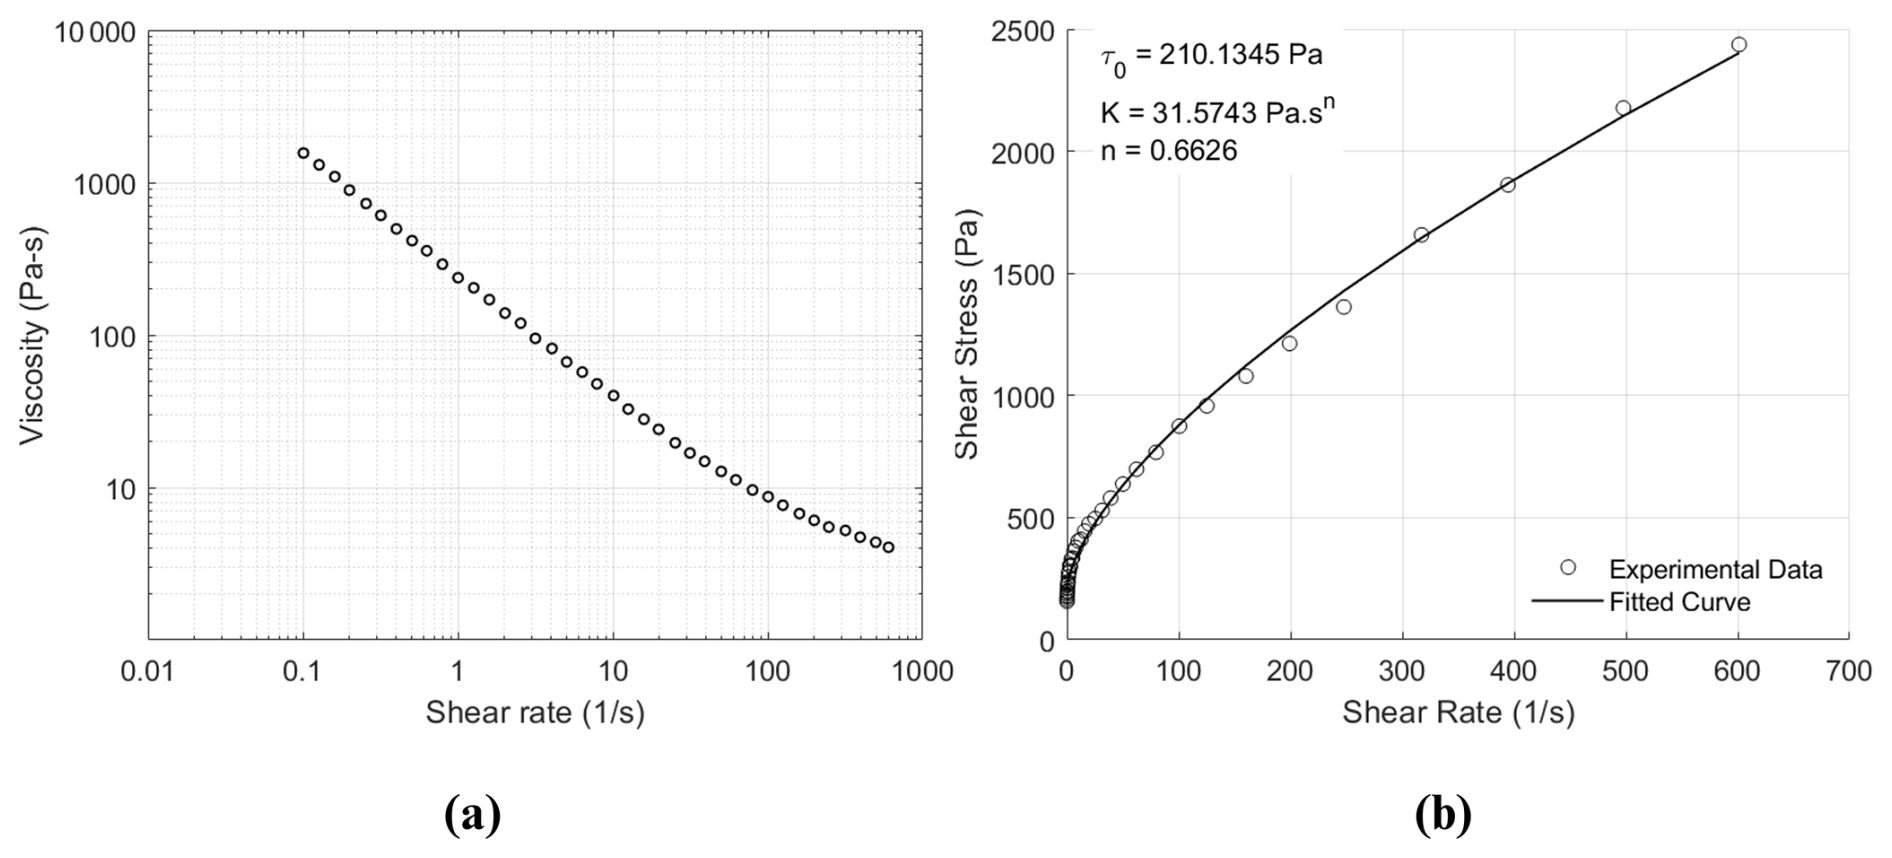
Figure 6Illustrating shear thinning behavior of the grease (at 25 °C) used in this study: (a) experimental data, (b) curve-fitted data.
Some important physical properties of the grease used in this study are listed in Table 4.
2.4 Boundary conditions (BCs)
The interaction of the fluid with the boundaries of the domain in CFD analysis is defined by BCs. Therefore, appropriate BCs play a significant role in accurately replicating the physical conditions in the CFD environment. In this paper, the most appropriate BCs for velocity, relative pressure, and grease volume fraction were applied to respective patches as shown in Table 5.
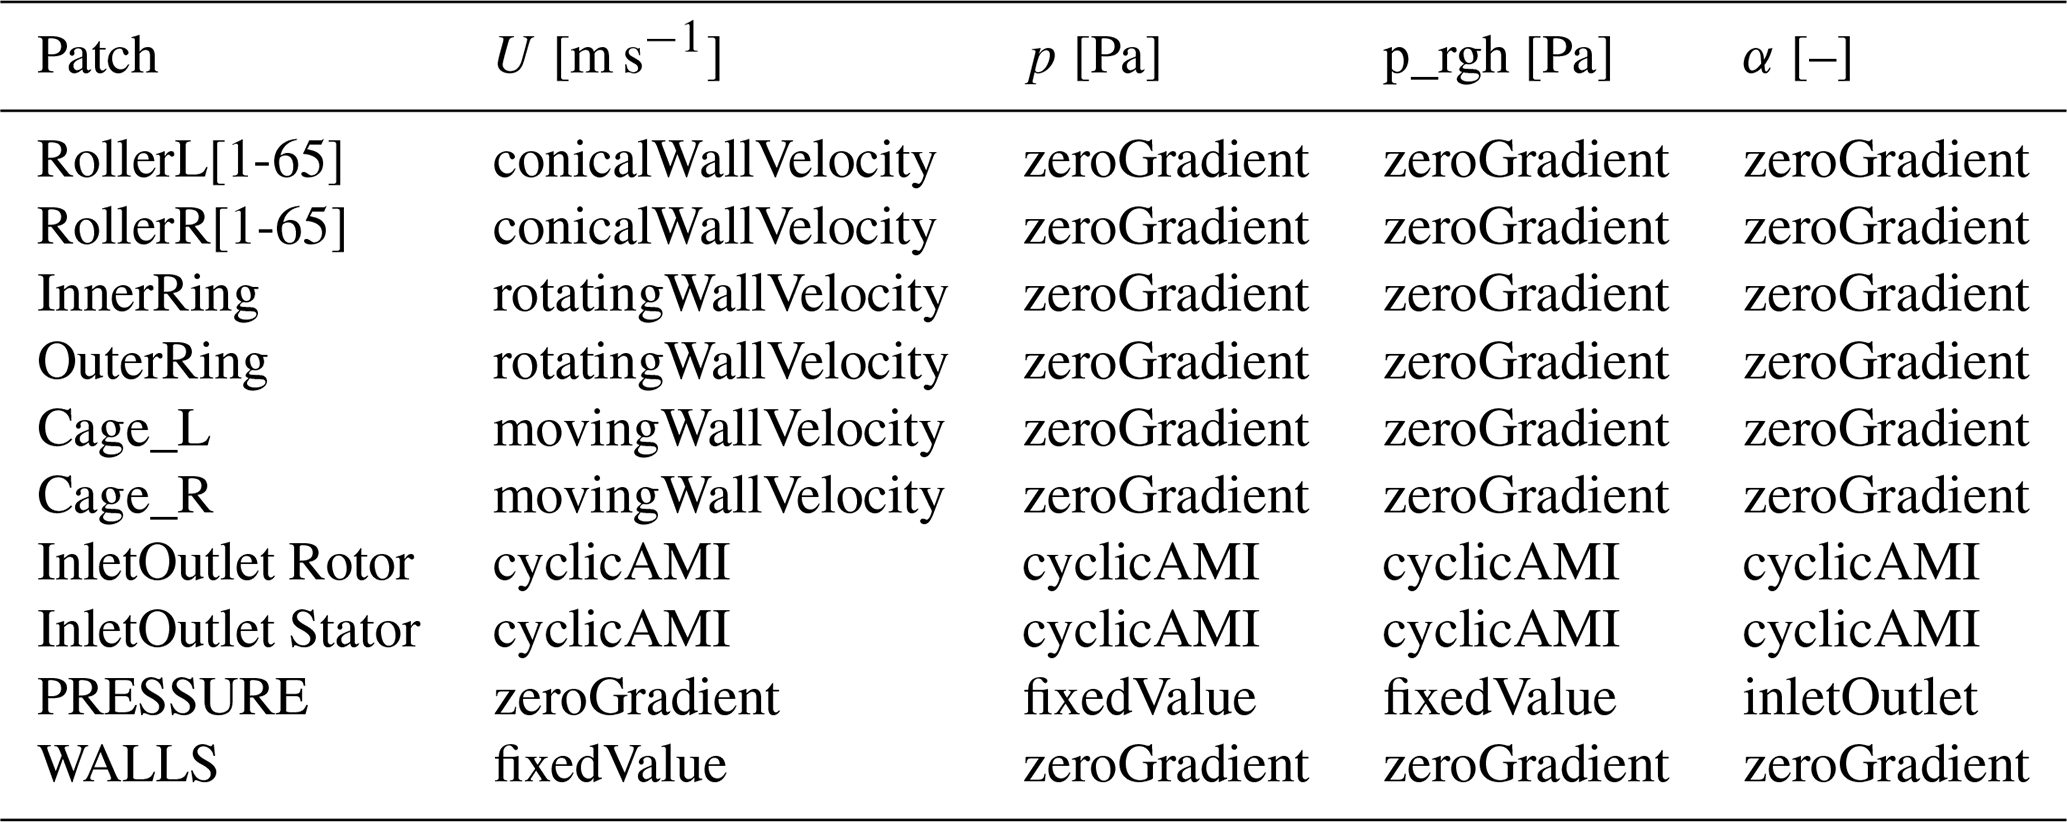
Rigid mesh motion (RMM) model was implemented to ensure the mesh rotation around the bearing axis as single, undeformable entity. In the present study, the mesh rotational speed was set to the same rotational speed as that of the cage. Therefore, movingWallVelocity BCs were applied to cage to ensure zero relative velocity (no slip) between walls of cage and mesh. The rotatingWallVelocity BCs were applied to inner ring and outer ring. Inner ring was rotated around a fixed axis (bearing axis) with the same rotational speed as that of shaft, whereas, outer ring was set as stationary. In the 360° model, the cage was divided into two separate patches corresponding to both the rows of the bearing, and the boundary conditions were applied separately to each. The inner ring and outer ring were each treated as single continuous patches covering both rows of the bearing, and their respective boundary conditions were imposed uniformly over the entire surfaces. The conical rollers exhibit combined motion, i.e., spinning about their own axis (dynamic axis) and rotating around the bearing axis (fixed axis). To replicate this complex combination of motion, a new custom BC, named conicalWallVelocity was applied to each roller in both the rows, as their own axes of rotation were unique. The zeroGradient BCs corresponded to the conditions where the respective variables were not changing in perpendicular direction to the boundary faces. Non-conformal faces with different mesh structures were connected via cyclicAMI (Arbitrary Mesh Interface) BCs. Gravitational effects are significant and are taken into account in this study. Since the bearing is tilted, the components of gravitational acceleration are resolved accordingly and applied to the bearing.
2.5 Solver setup
In this study, the case was considered multiphase, incompressible, laminar, and isothermal. The flow velocities involved in target domain are significantly lower than speed of sound; therefore, grease and air phases were treated as incompressible. The most appropriate solver available in OpenFOAM® is interFoam for solving these conditions. This solver uses the VoF model to solve multiphase flows, and hence it was used in the present study. The numerical stability, convergence, and computational efficiency were ensured by limiting the Courant number (Co) to less than 1. A first-order implicit Euler scheme was used for time discretization, whereas a Gauss gradient scheme was used for computing spatial gradients.
2.6 Experimental setup and validation of model
To validate the numerical model, experiments were first conducted using a custom-designed test rig at the Machine Elements, Gears and Tribology (MEGT) laboratory, as shown in Fig. 7. The test rig consisted of a hydrostatic frictionless support bearing, a horizontal shaft, thermocouples for temperature monitoring, an electric motor, locking assemblies, a loading module, and the test bearing. The test bearing was subjected to an axial load of 3.7 kN to ensure proper roller kinematics, prevent roller skidding, and maintain stable rolling conditions during the experiments. A high-speed camera was installed to capture the real-time evolution of the grease film inside the bearing through direct optical access to the bearing interior.
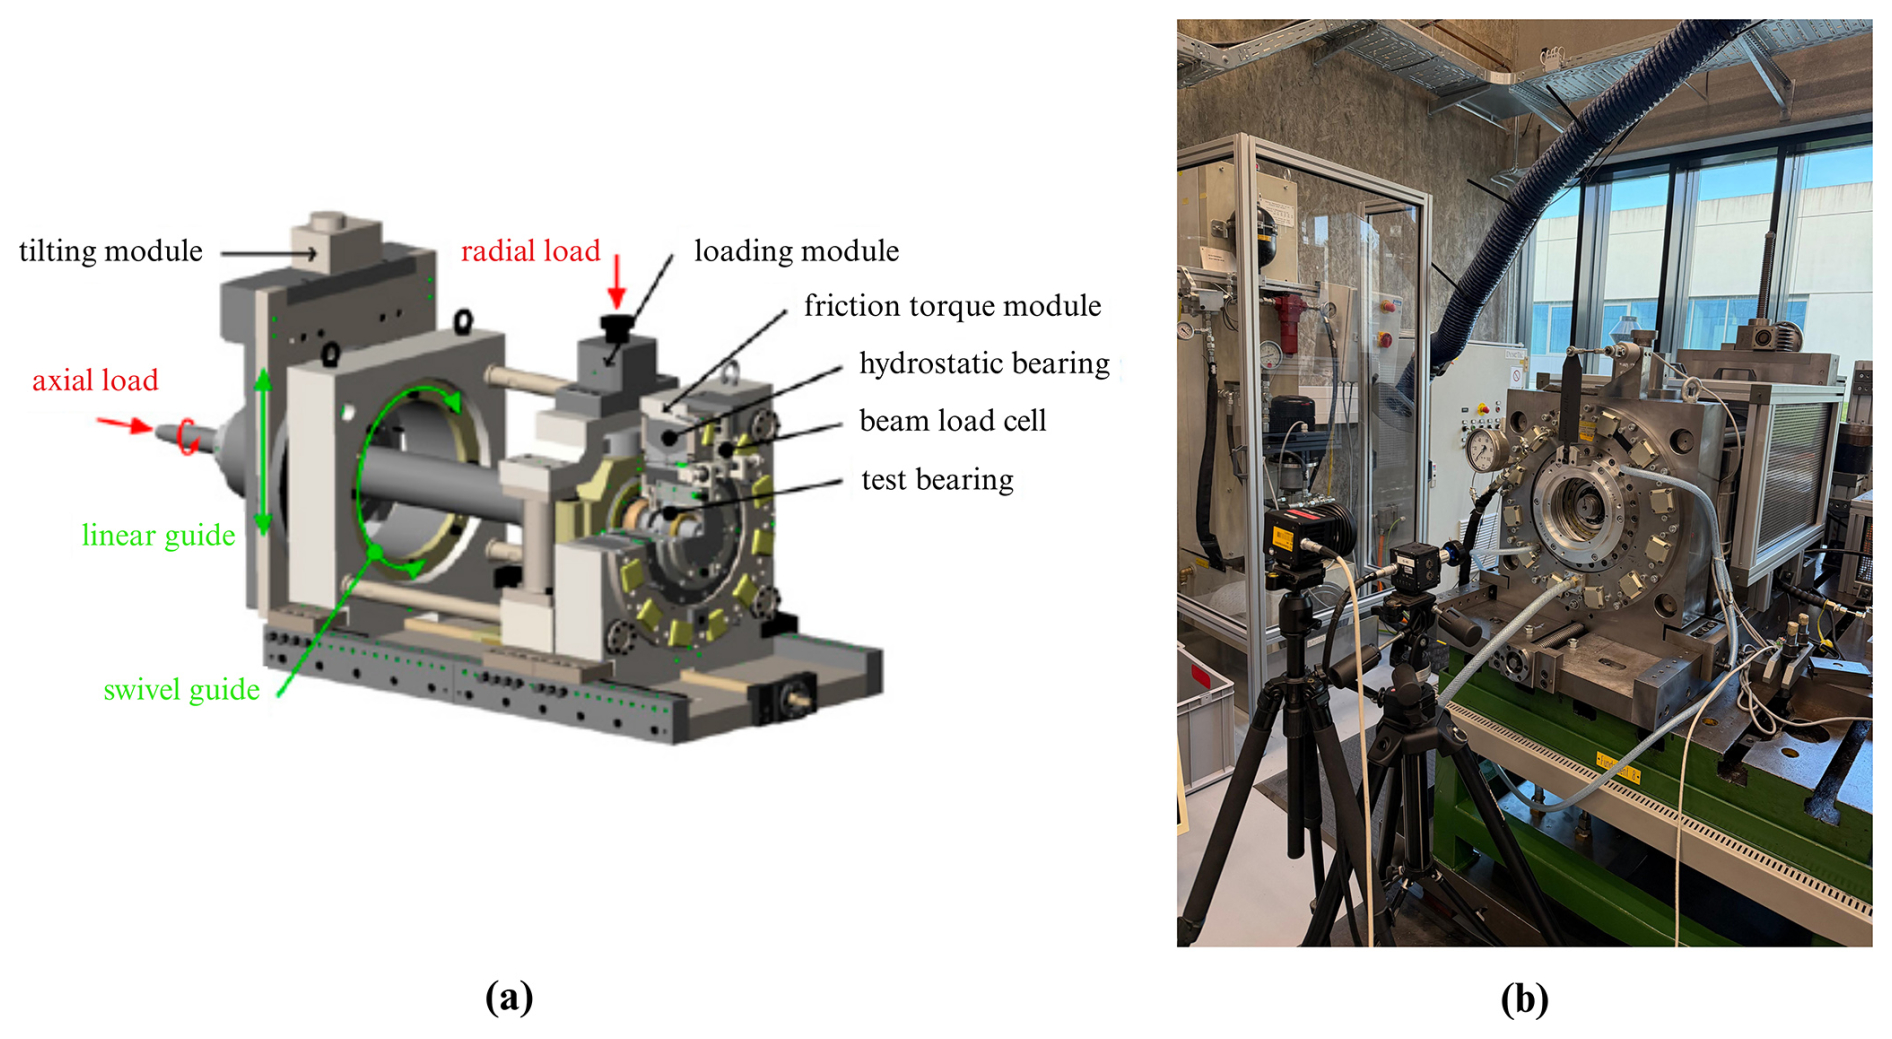
Figure 7Test rig used for the experiments at the MEGT laboratory: (a) 3-D CAD model, (b) experimental setup photograph.
The validation experiments were performed using a 32224-XL TRB (key geometric parameters in Table 6). The bearing was operated at a rotational speed of 500 rpm, while the grease temperature was 25 °C. A grease filling ratio corresponding to 25 % of the total bearing volume was applied prior to the experiments. During operation, the high-speed camera recorded the temporal evolution of the grease film and lubricant distribution inside the bearing for subsequent comparison with the numerical predictions.
Table 6Key geometric parameters of the test bearing (32224-XL).
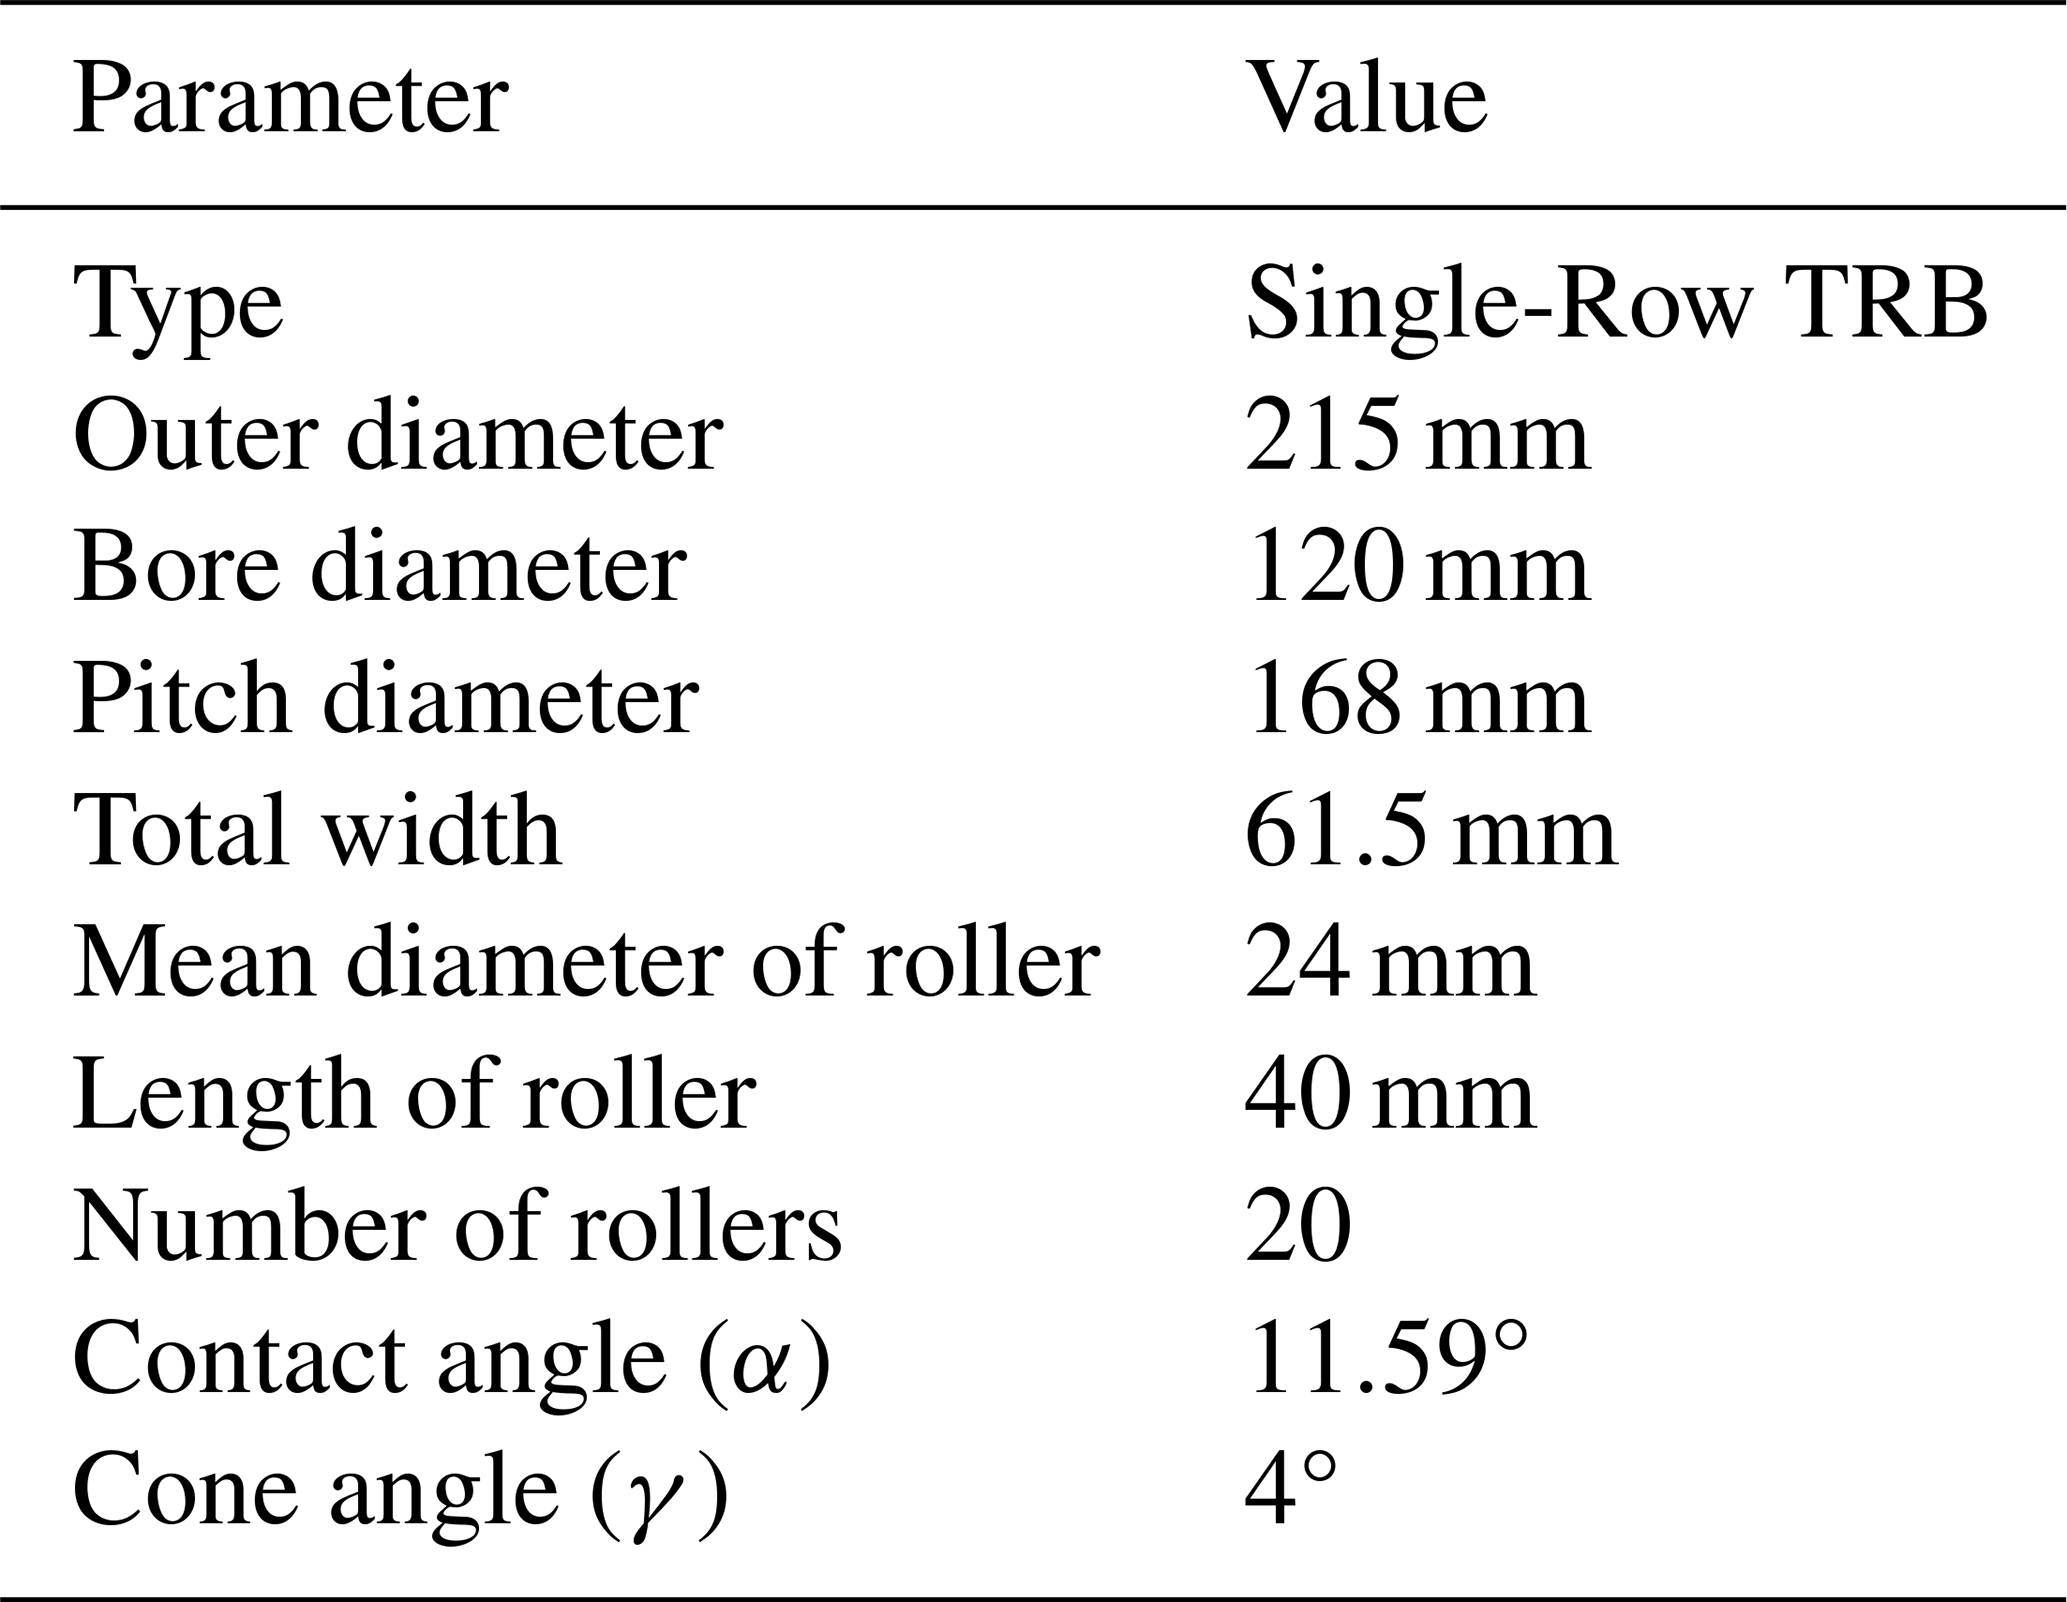
Figure 8 shows the initial grease filling condition inside the bearing. The thick black fluid visible in Fig. 8a represents the grease in the experimental setup. In the experimental images, the red-highlighted regions indicate the observed grease film, as shown in Figs. 8–12.
After one complete rotation of the inner ring, the grease distribution recorded by the high-speed camera is presented in Fig. 9a. A thicker grease film is observed in the upper and lower regions of the bearing, as indicated by the dotted red lines, suggesting localized grease accumulation in these regions. This behavior indicates the initial redistribution of grease caused by roller-induced shear and circumferential transport within the bearing cavity. Figure 10a illustrates the grease distribution after two complete rotations of the inner ring, where grease accumulation is predominantly observed within the lower half of the bearing. The observed downward migration of grease can be attributed to the combined effects of gravity and the progressive displacement of lubricant by the rotating rollers. After the third and fourth rotations, the grease progressively spreads throughout the entire bearing, as clearly shown in Figs. 11a and 12a. This behavior suggests the formation of a more distributed grease film resulting from continuous churning, roller–raceway interaction, and lubricant recirculation within the bearing.
The experimentally observed grease flow behavior was subsequently reproduced using CFD simulations for validation purposes. The same bearing configuration and operating conditions used in the experiments were implemented in the numerical model, including the rotational speed, grease filling ratio, and grease temperature. Although the geometry of the validation bearing differs from that of the wind turbine main bearing investigated in this study, both configurations are TRBs and therefore exhibit similar rolling kinematics and grease transport mechanisms. The objective of the validation is therefore not to demonstrate complete geometric similarity but rather to verify the capability of the proposed numerical framework to reproduce the dominant grease redistribution mechanisms under comparable local geometric and dynamic conditions.
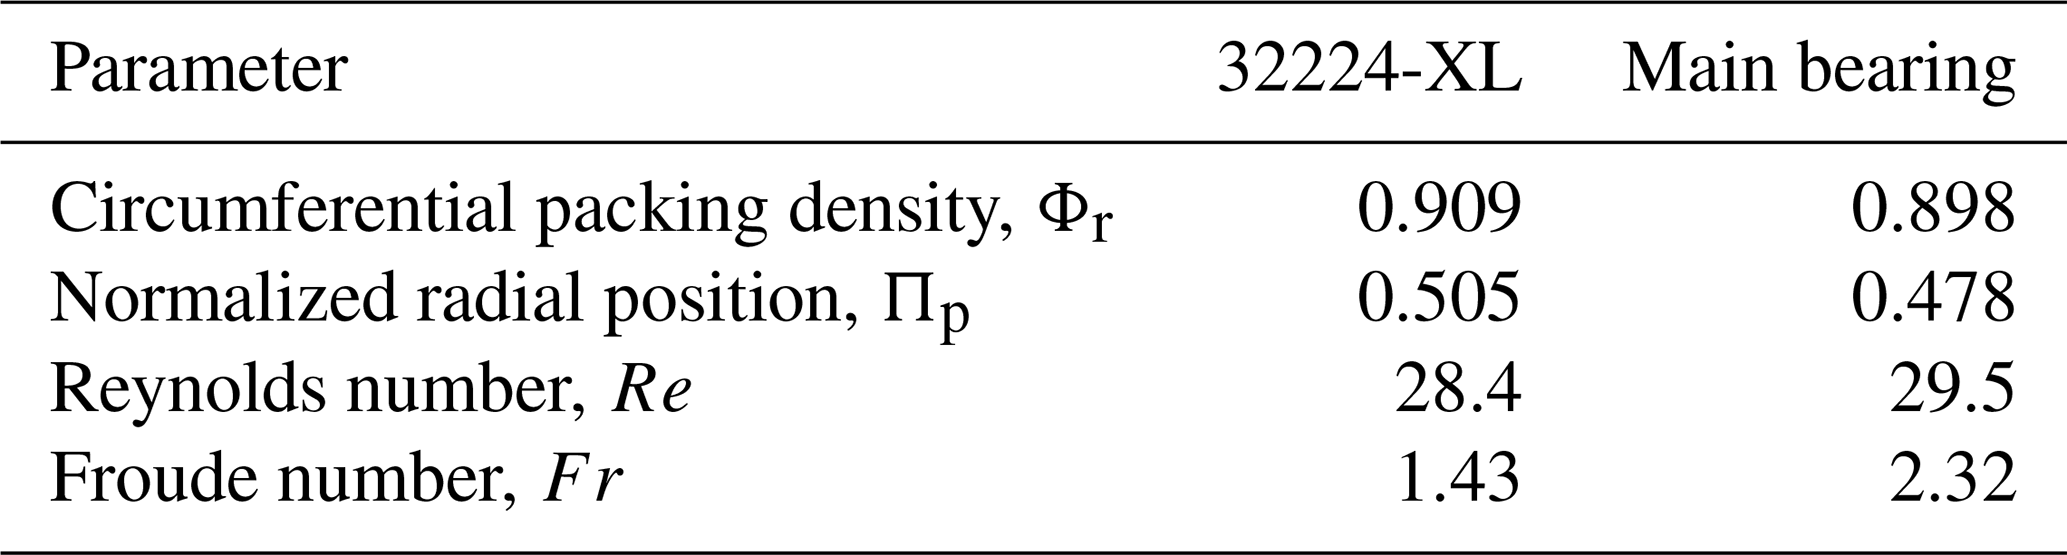
To support this comparison, two local geometric parameters governing grease transport were evaluated. The circumferential packing density of the rolling elements is defined as
where Nrow is the number of rollers in one row, dR is the mean roller diameter. This parameter represents the fraction of the pitch circumference occupied by the rolling elements and therefore characterizes the periodic passages available for grease transport. In addition, the normalized radial position of the roller row is expressed as
where Di and Do denote the bore and outer diameters, respectively. This parameter describes the relative radial location of the rolling elements within the bearing envelope and is relevant to the confinement of the lubricant.
The corresponding geometric similarity parameters are summarized in Table 7. Although the two bearings differ significantly in their overall dimensions, the circumferential packing density and the normalized radial position are in close agreement. This suggests that the local geometric features governing grease transport are well represented in the validation bearing, thereby supporting its suitability for assessing the grease redistribution mechanisms investigated in the present study.
Dynamic similarity was assessed using both the Reynolds and Froude numbers. The Reynolds number was calculated as
where Uc is the cage translational velocity, and ν is the kinematic viscosity of the grease. The Froude number was calculated as
where g is the gravitational acceleration. The Reynolds numbers are approximately 28.4 for the validation bearing and 29.5 for the wind turbine main bearing, indicating that both configurations operate within a comparable Reynolds-number regime and therefore exhibit a similar balance between inertial and viscous forces. The Froude numbers are 1.43 and 2.32 for the validation and wind turbine bearings, respectively. The difference in Froude number reflects the substantially different bearing size and operating speed of the two configurations. Nevertheless, the comparable local geometric characteristics together with the similar Reynolds-number regime indicate that the dominant grease transport mechanisms are well represented by the validation bearing.
Table 7Comparison of geometric and dynamic similarity parameters between the test bearing and the wind turbine main bearing.
The computational mesh for the 32224-XL TRB was generated using the blockMesh utility in OpenFOAM®. The CFD-predicted grease distributions corresponding to the experimental operating conditions are shown in Figs. 8b–12b. After the first rotation of the inner ring, the numerical model predicts localized grease accumulation within the upper and lower regions of the bearing, consistent with the experimentally observed grease redistribution shown in Fig. 9a. After two rotations, the CFD results reproduce the predominant grease accumulation within the lower half of the bearing, indicating the combined influence of gravity and roller-induced lubricant displacement. Following the third and fourth rotations, the numerical model captures the progressive spreading and recirculation of grease throughout the bearing cavity, in good agreement with the experimental observations. Overall, the qualitative comparison between the numerical and experimental results demonstrates strong agreement in the evolution and spatial distribution of the grease film, thereby supporting the validity of the proposed modeling approach.
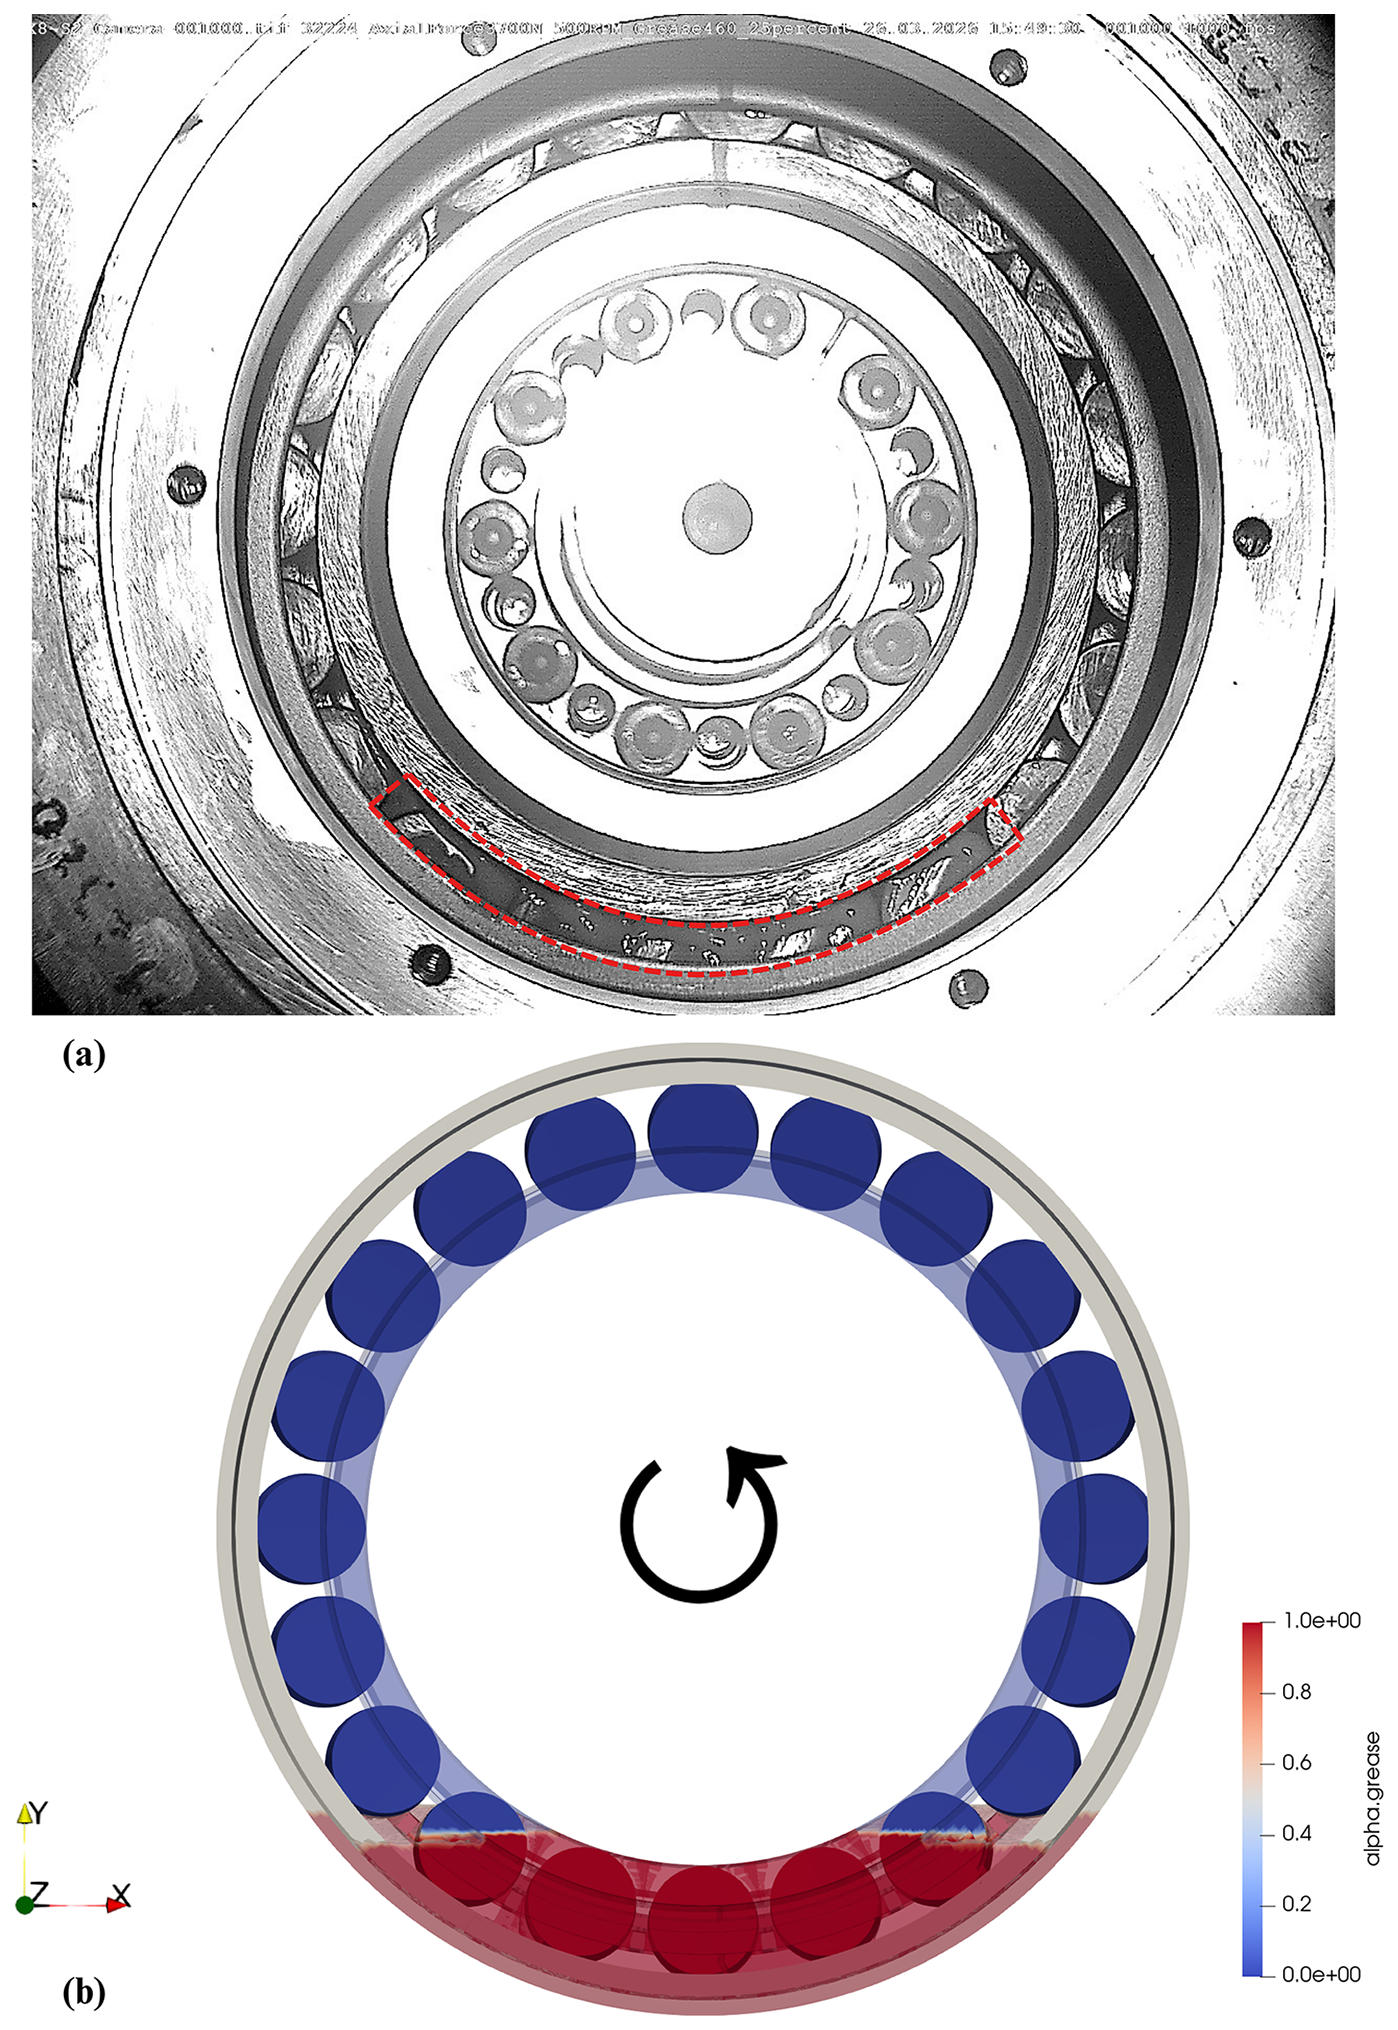
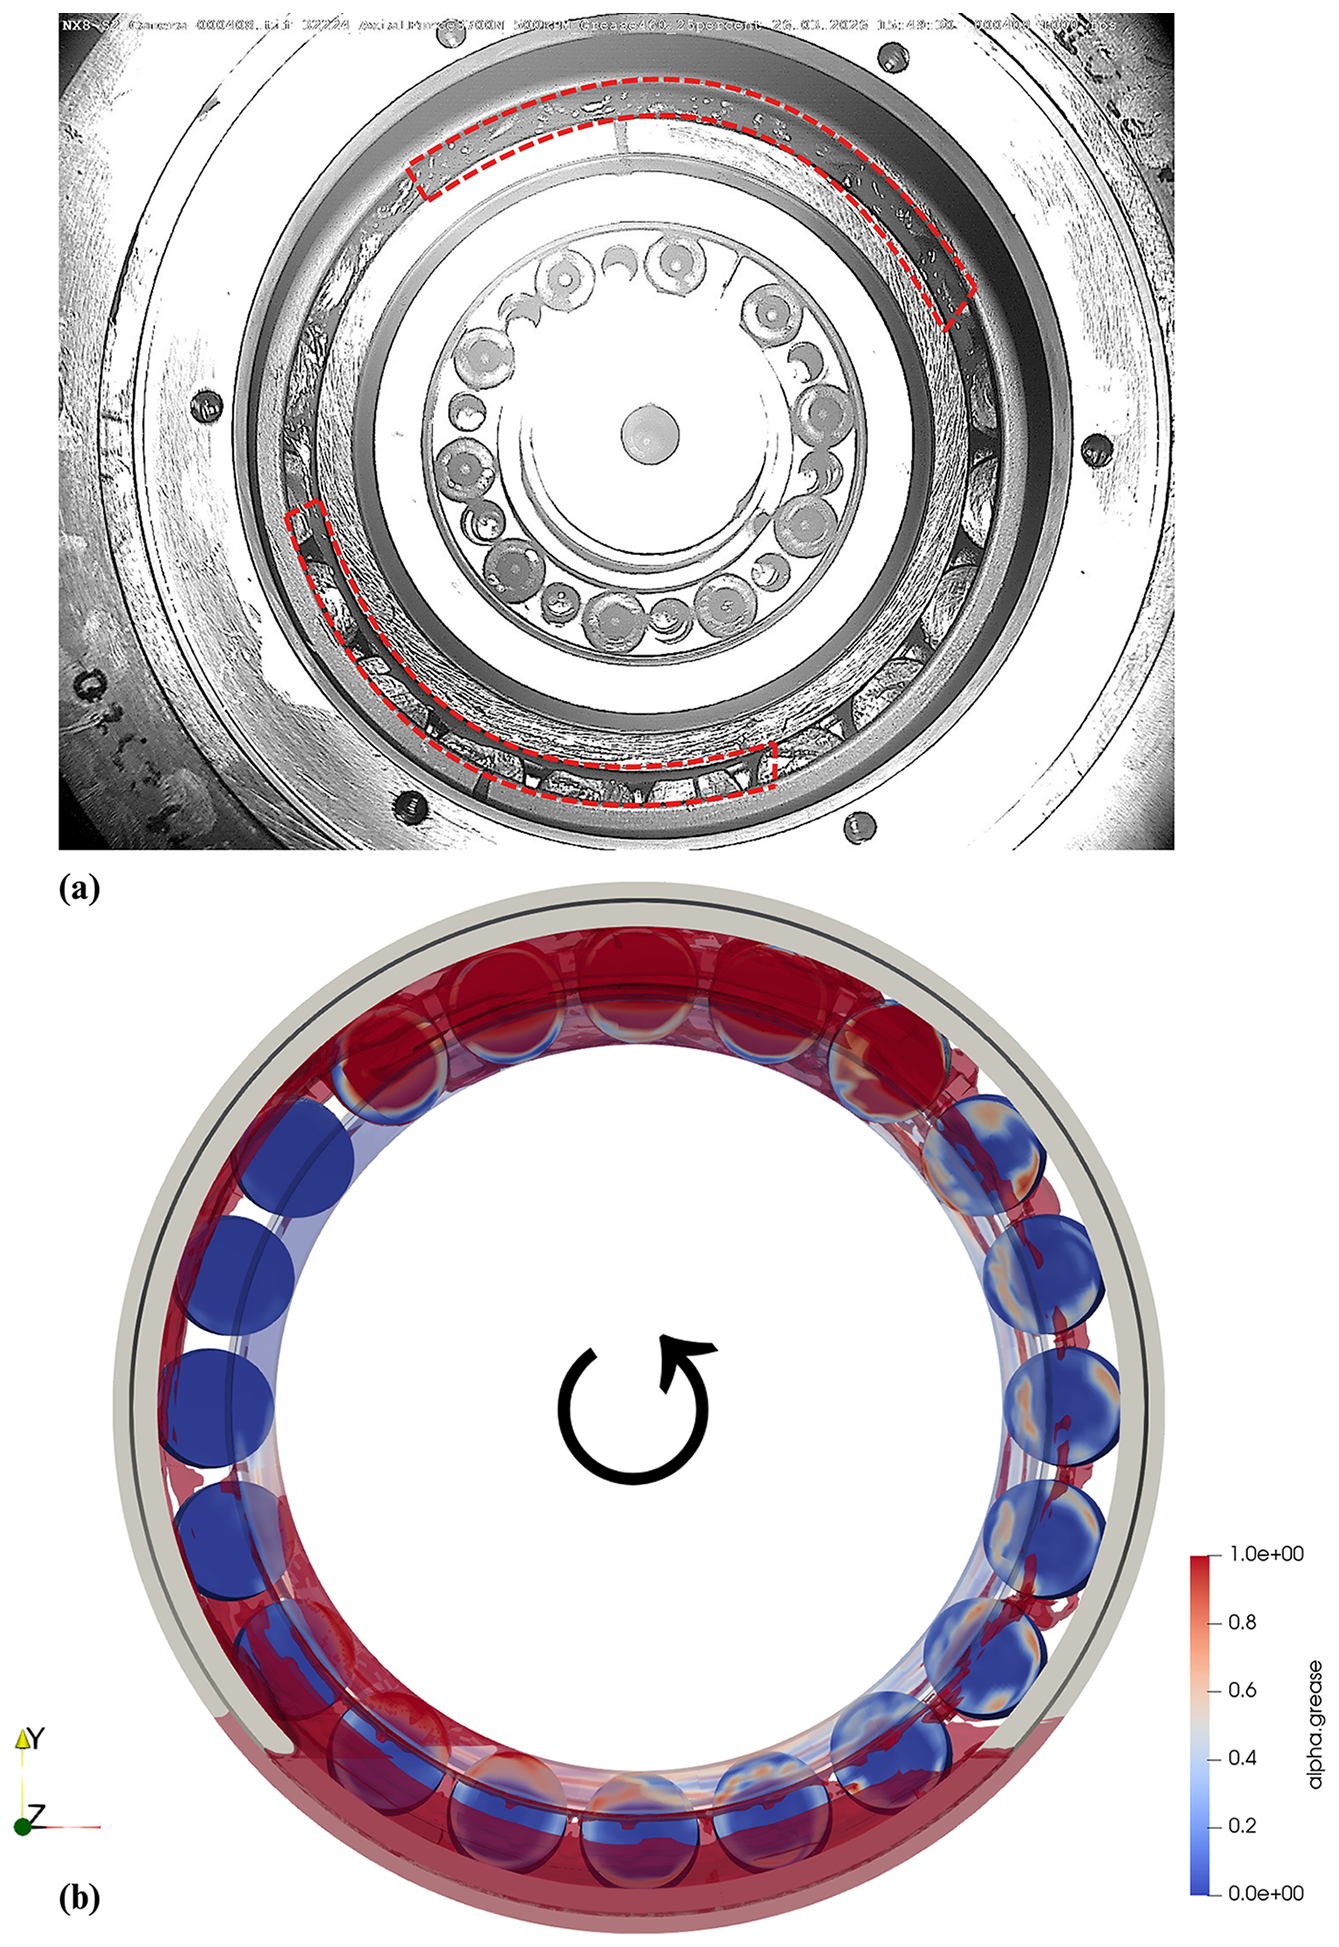
Figure 9Grease distribution after one rotation of inner ring: (a) experimental, (b) numerical model.
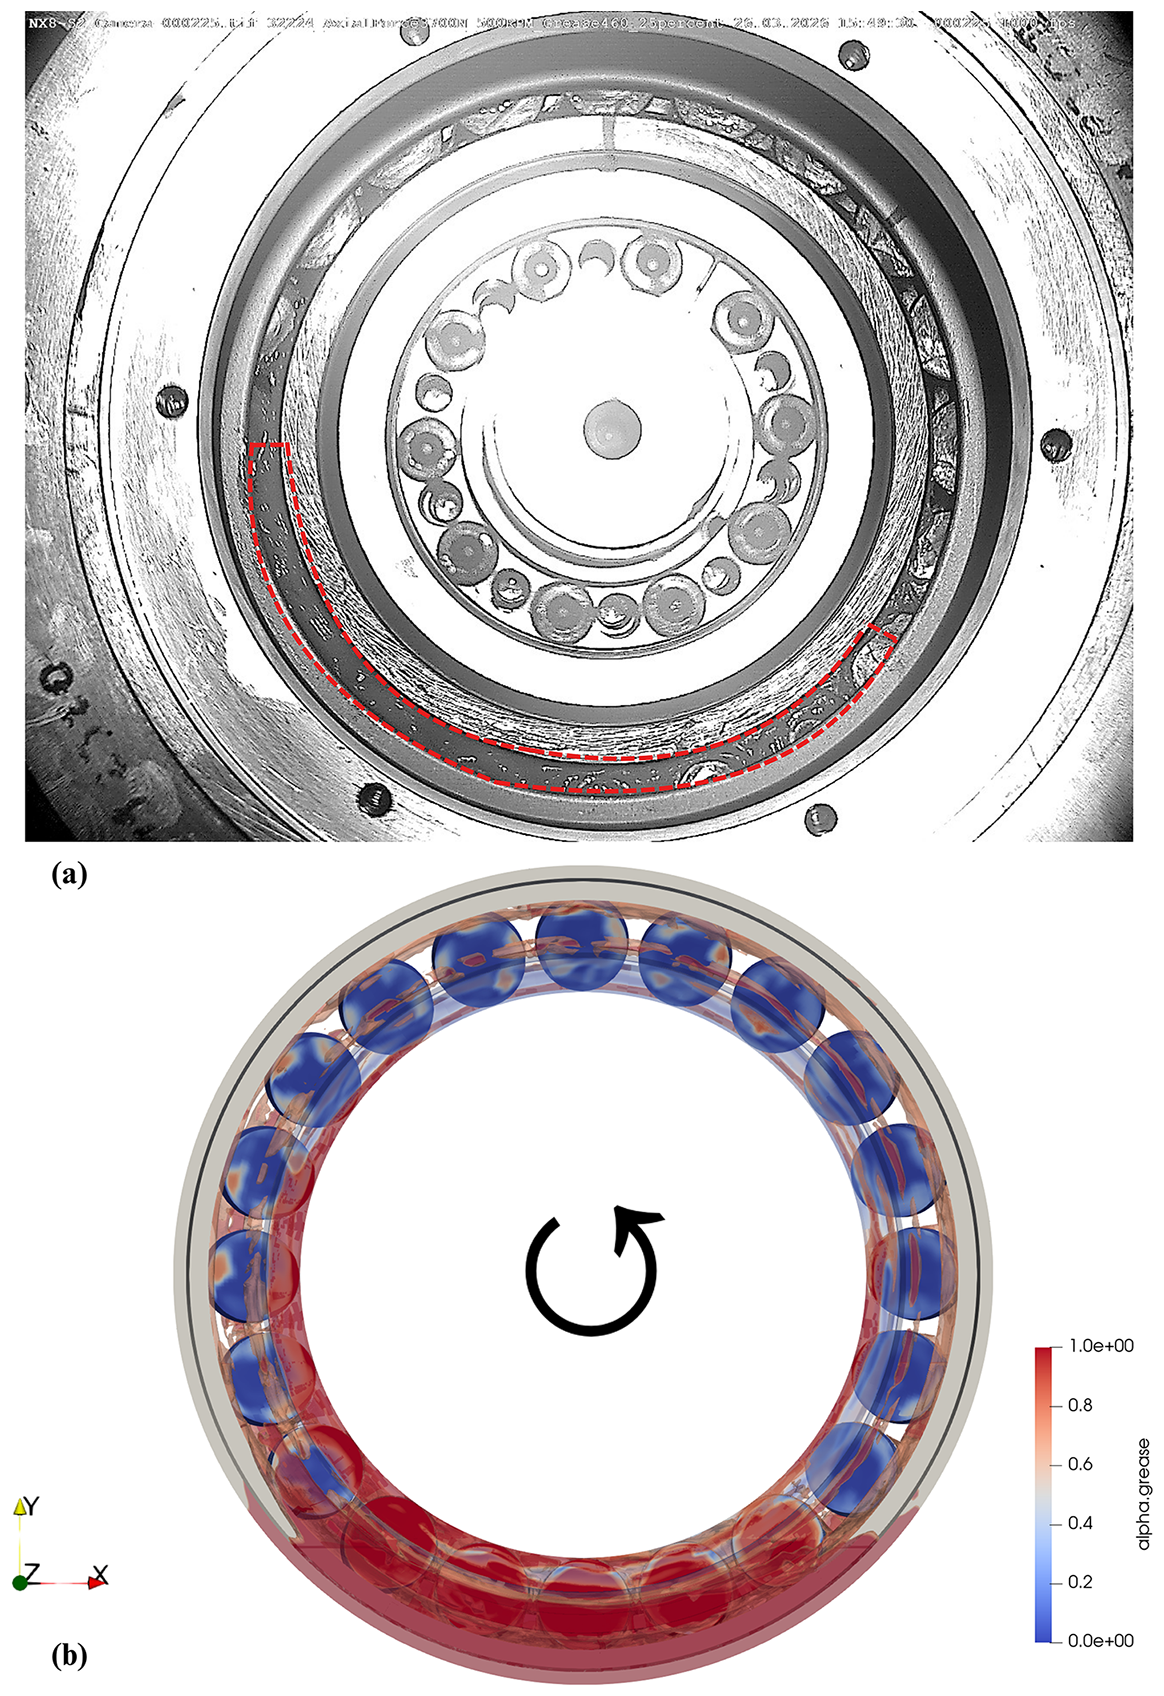
Figure 10Grease distribution after two rotations of inner ring: (a) experimental, (b) numerical model.
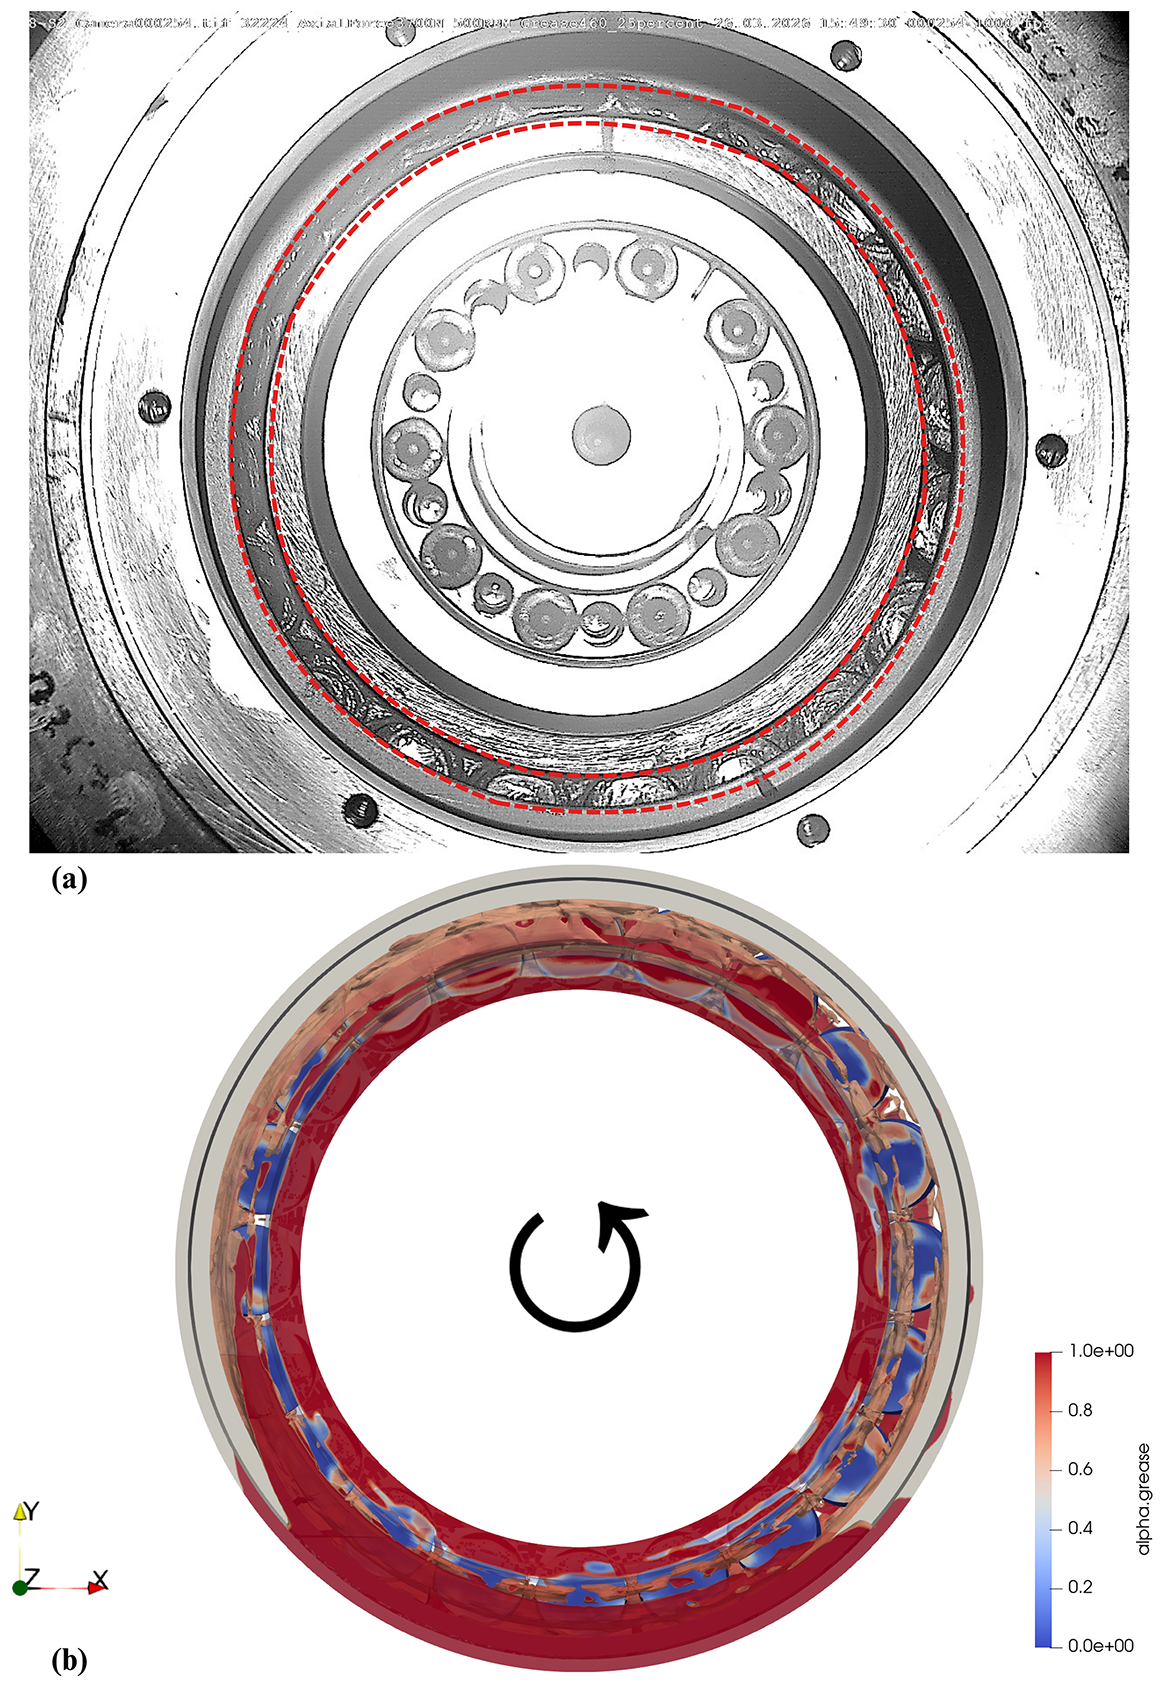
Figure 11Grease distribution after three rotations of inner ring: (a) experimental, (b) numerical model.
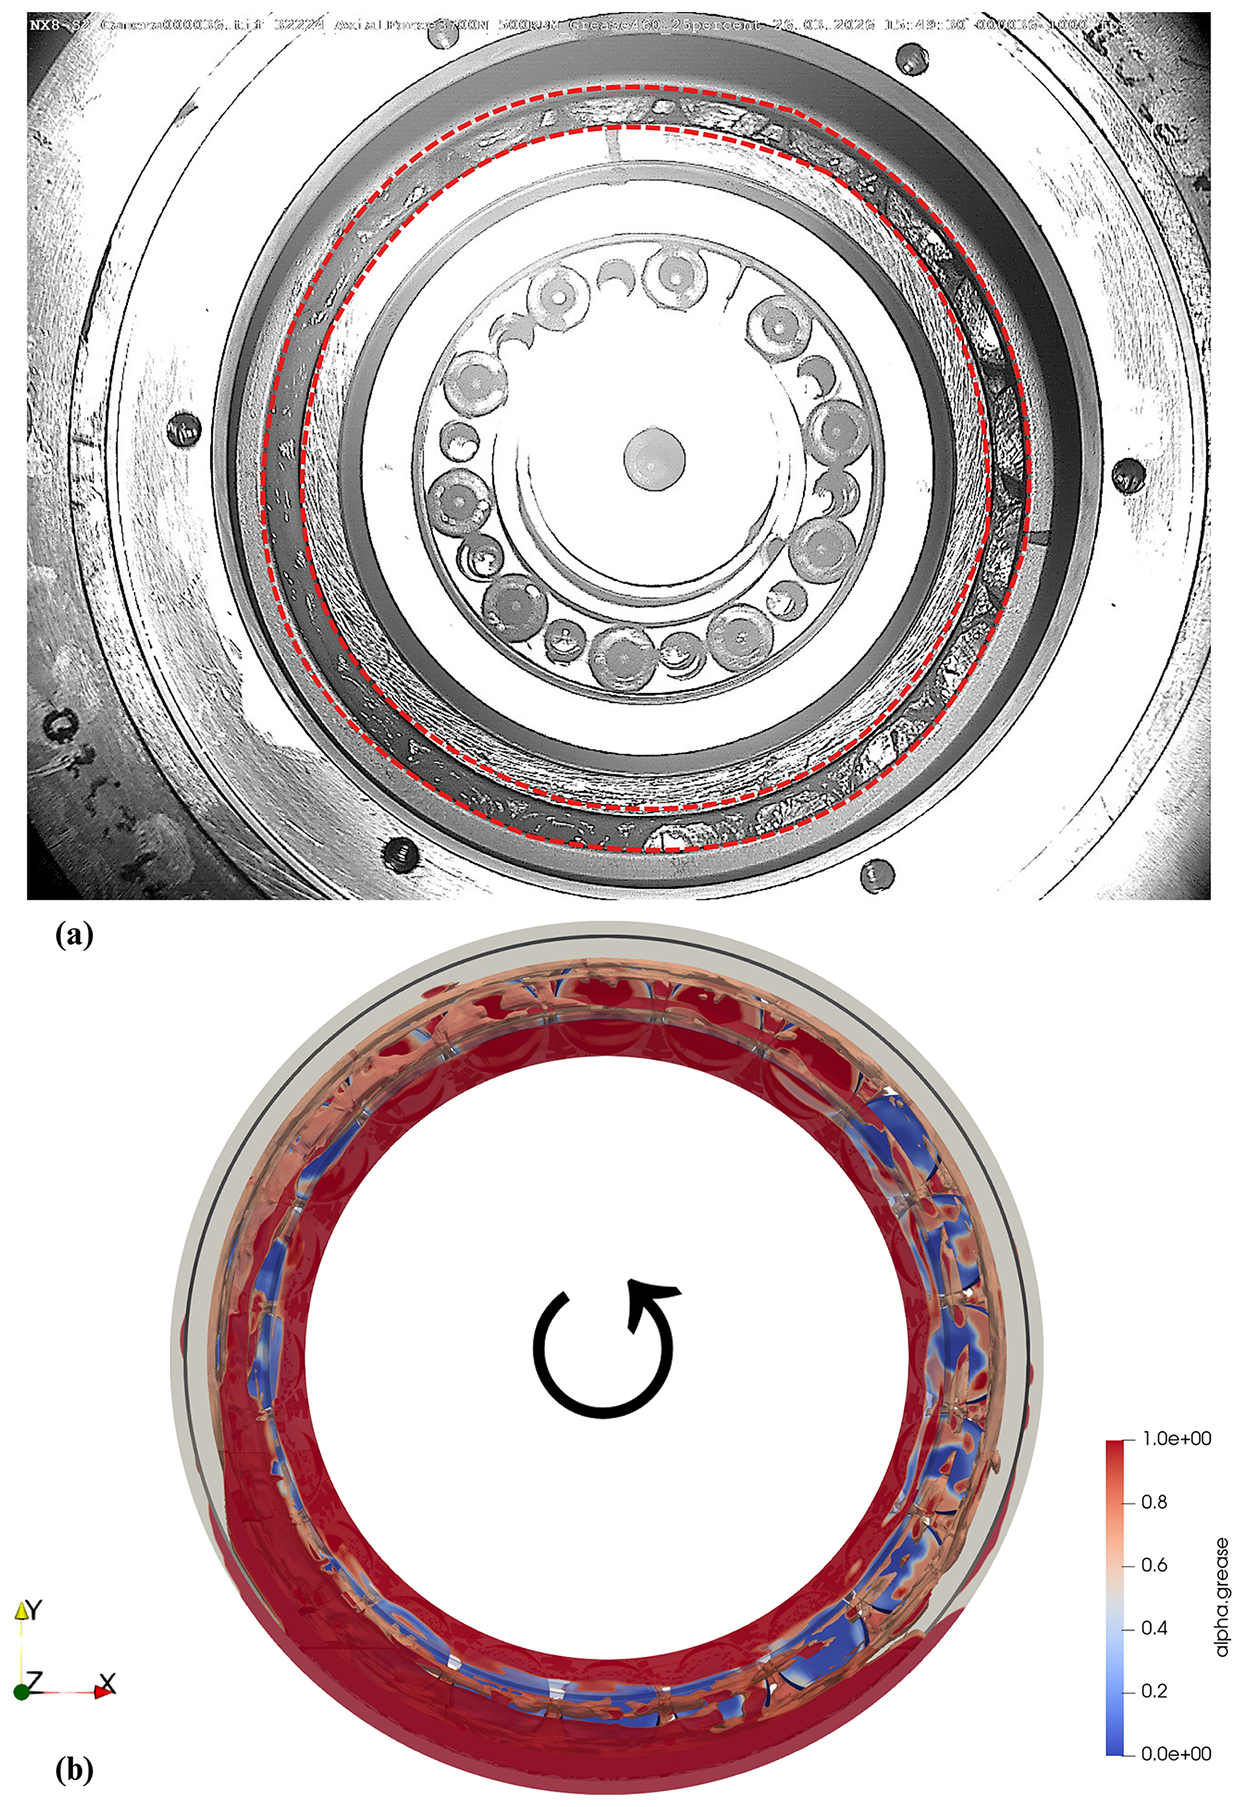
Figure 12Grease distribution after four rotations of inner ring: (a) experimental, (b) numerical model.
It should be noted that the present experimental validation is limited to the transient evolution and spatial distribution of the grease film qualitatively. The experiments validate the capability of the proposed CFD model to reproduce the observed grease redistribution behavior.
2.7 Simulated operating conditions
In this study, the grease filling ratio within the bearing was varied while keeping the rotational speed and other operating conditions constant. It is important to note that when the bearing is initially installed in the wind turbine, it is fully flooded with grease. However, during operation, grease continuously exits through the outlet ports. Although a re-lubrication pump supplies fresh grease to the bearing, the grease filling ratio remains below 50 % of the total volume for most of the operational period. Therefore, the selected grease fill ratios were provided by the industrial partner, reflecting practical operating scenarios. These conditions are summarized in Table 8. The rotational speed chosen corresponds to the rated speed of the wind turbine. All simulations were carried out for one full rotation of the cage due to computational resource limitations, utilizing 24 cores of a high-performance computing (HPC) cluster. One full rotation of the cage corresponds to approximately 7.1 s of simulated time at the rated operating speed. The simulation of this interval required about 35 d of wall-clock time for a single run.
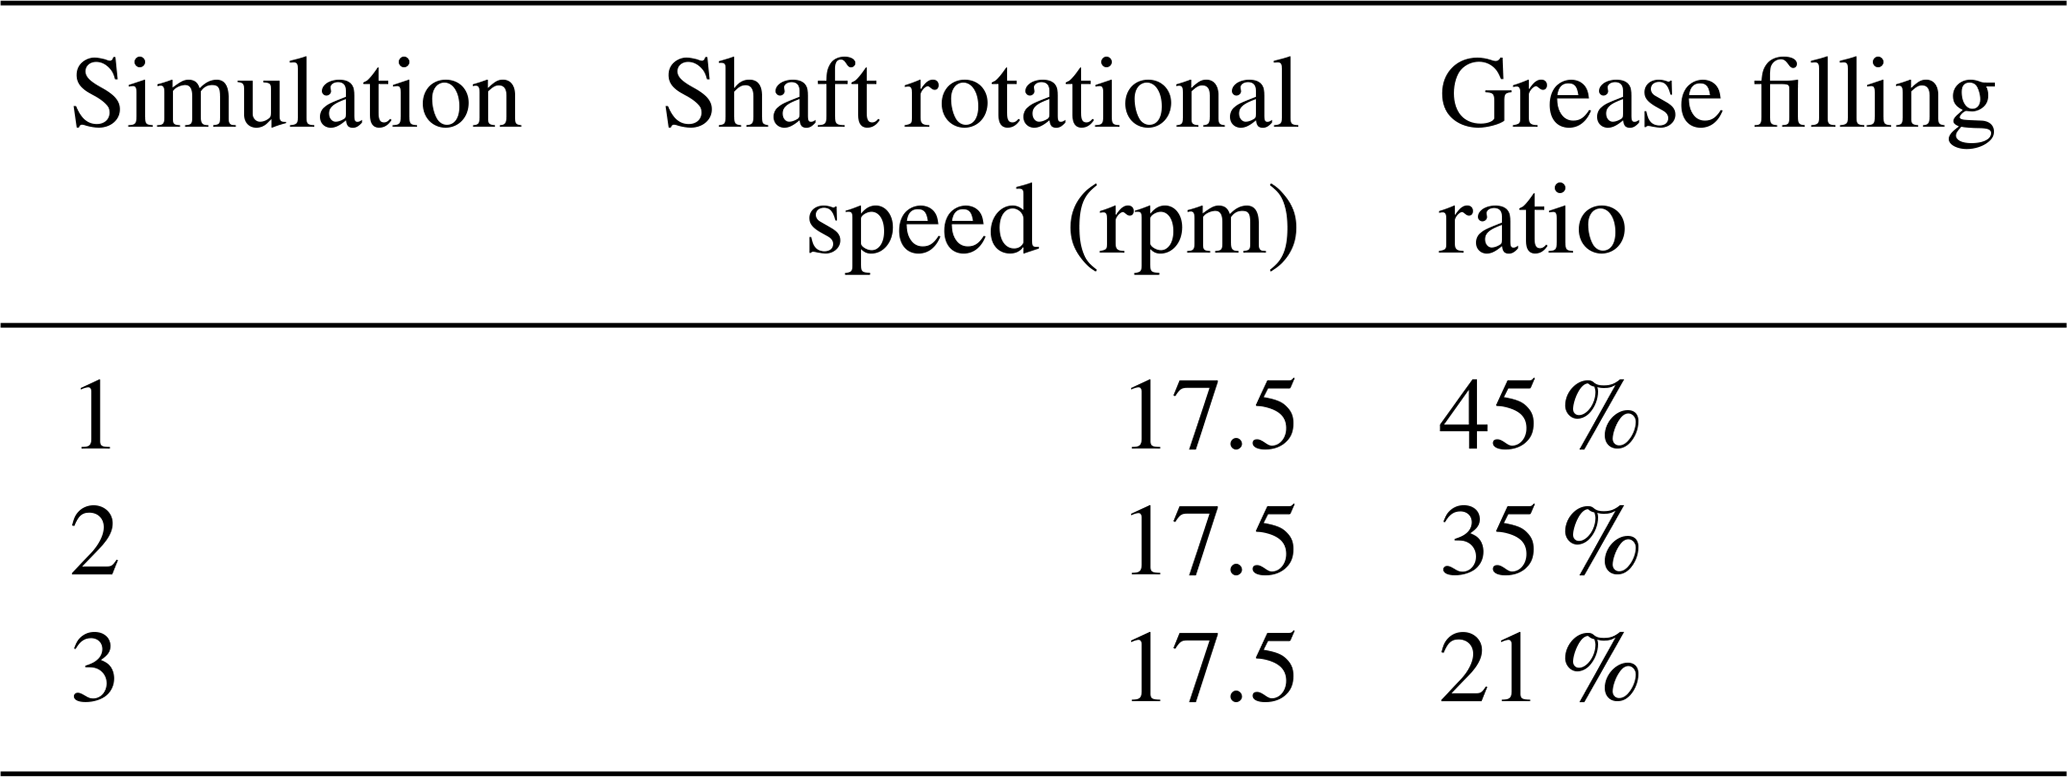
The grease filling ratio for Simulation 3 (21 % of the bearing volume) is considered the most critical condition, as it represents the lowest practical grease level. This level lies just below the outlet port, beyond which the grease volume cannot further decrease due to the port's positioning. This outlet port is closed during operation; therefore, it has not been modeled.
To gain further insight into understanding the behavior of grease within the bearing, an additional simulation was performed to examine the grease settling behavior after the bearing rotation stops following operation. The simulation was carried out for operating conditions, i.e., 45 % filling ratio, 0 rpm, and a temperature of 40 °C. The grease distribution after one complete rotation of cage was taken from the results of simulation 1. At this point, the bearing was brought to a stop (0 rpm), and the grease temperature was maintained at 40 °C. The system was then monitored to observe the redistribution of grease as it gradually settled back toward its pre-rotation state. These operating conditions were designed to replicate a real-world scenario, such as a wind turbine shutdown, to assess how long it would take for the grease to migrate back to the lower region of the bearing under gravity-driven effects.
3.1 Grease distribution
In this study, the grease filling ratios were kept below 50 % of the total volume of the bearing’s lubricating chamber to better represent critical operating conditions. The total volume of bearing's lubricating chamber is 0.035 m3. Figure 13 depicts the respective grease filling ratios for the three simulations.
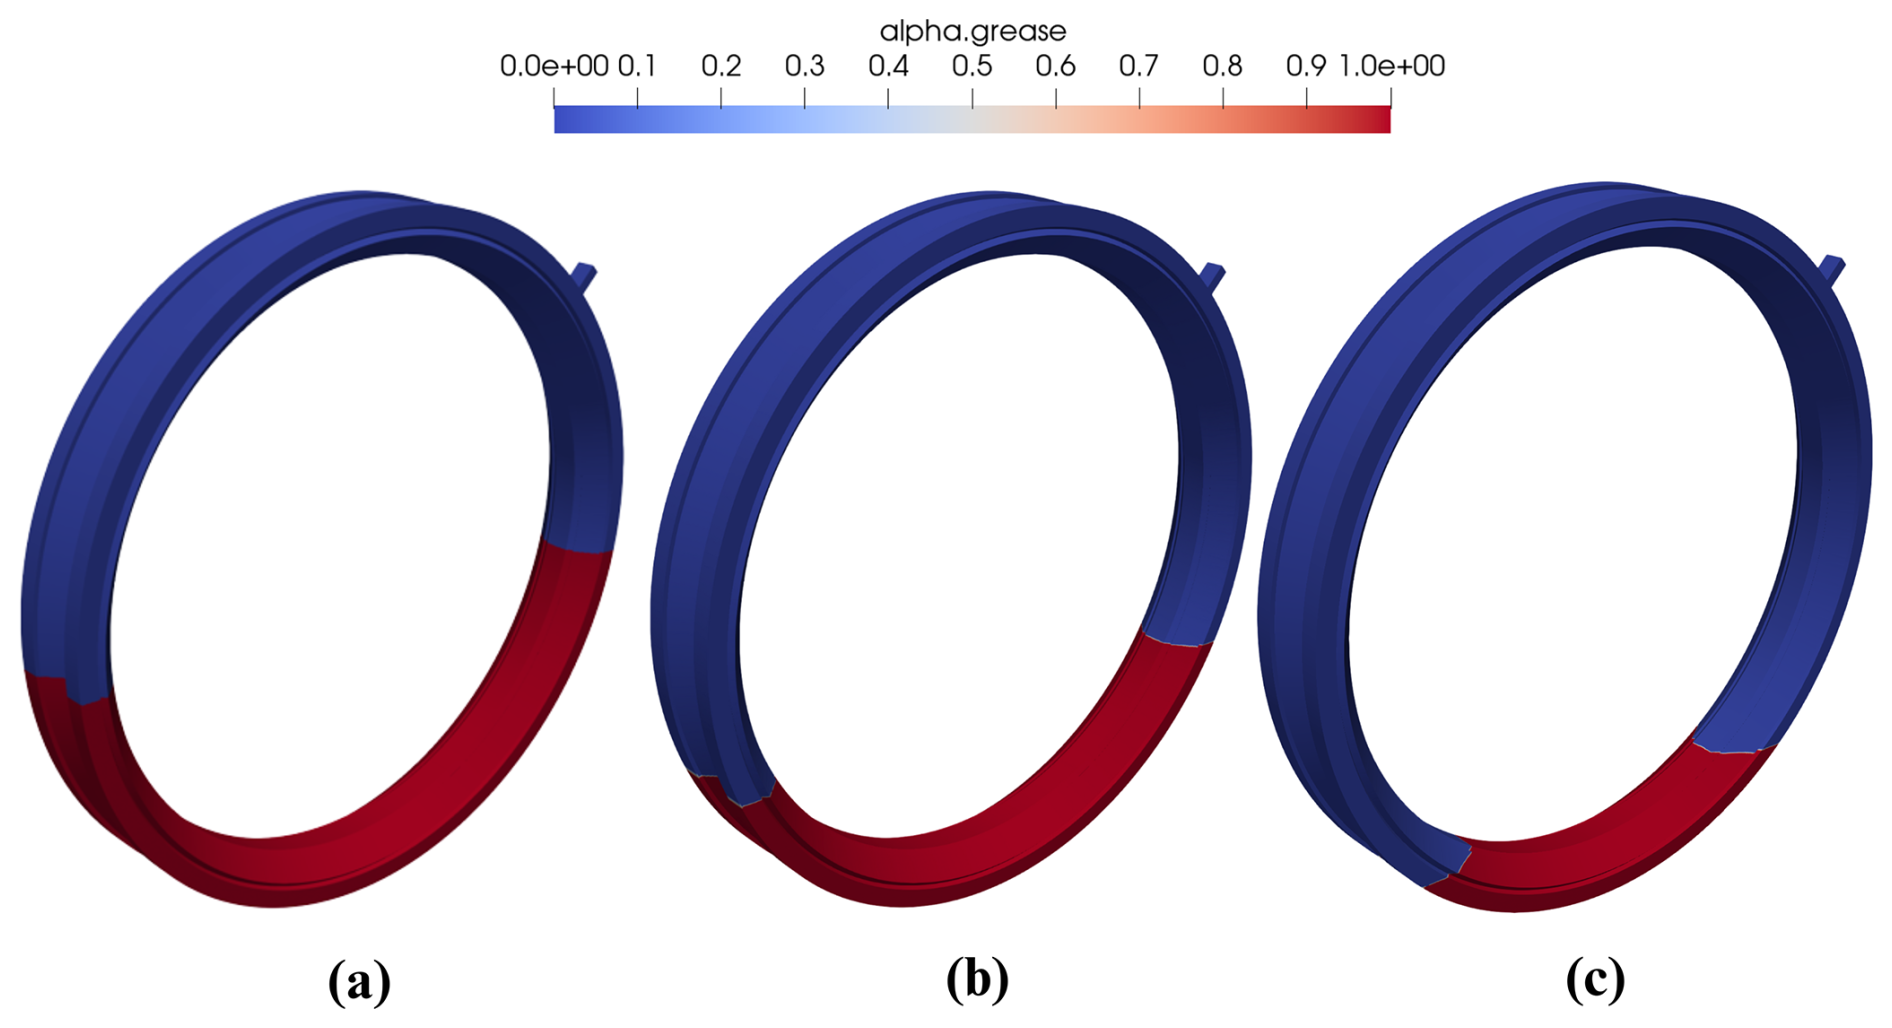
Figure 13Grease filling ratios: (a) 45 %, (b) 35 %, and (c) 21 % of the total volume of bearing's lubricating chamber (images were captured as viewed from MFS).
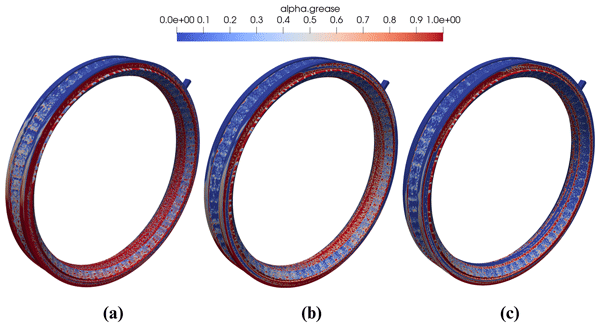
The grease distribution inside the bearing after one complete rotation of the cage is shown in Fig. 14. As observed in Fig. 14, the upper region of the bearing exhibits signs of grease starvation, with noticeably less lubricant compared to the lower region for all the three grease filling ratios. This phenomenon is attributed mainly to the influence of gravity.
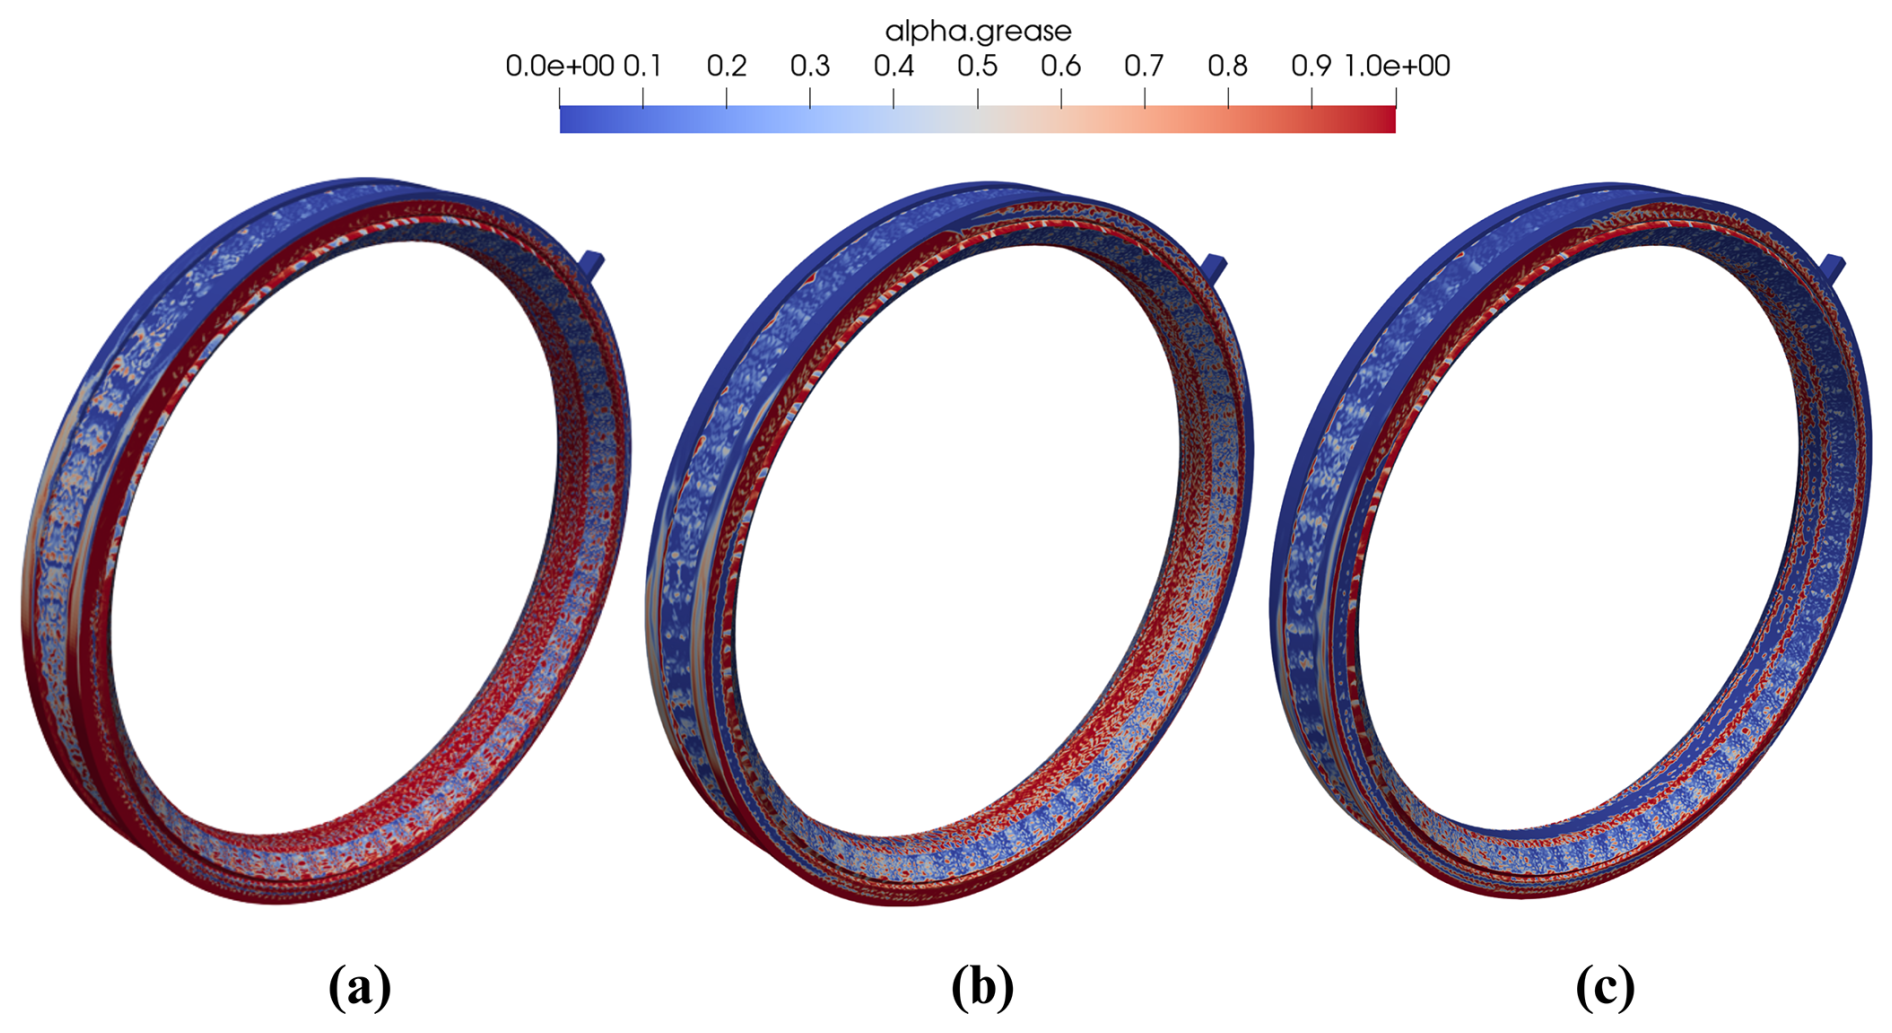
Figure 14Grease distribution after one rotation of cage: (a) 45 %, (b) 35 %, and (c) 21 % grease filling ratios.
The disparity in grease distribution is further illustrated in Fig. 15, which provides a clearer comparison between the top and bottom sections for the three simulations. For 45 % grease filling ratio (Fig. 15a), the wetted volume of the upper part of the bearing is 0.004 m3, whereas the lower part has a wetted volume of 0.011 m3 – approximately 41 % greater than that of the upper region. For 35 % grease filling ratio (Fig. 15b), the wetted volume of the upper part of the bearing is 0.003 m3, whereas the lower part has a wetted volume of 0.009 m3 – approximately 36 % greater than that of the upper region. For 21 % grease filling ratio (Fig. 15c), the wetted volume of the upper part of the bearing is 0.001 m3, whereas the lower part has a wetted volume of 0.006 m3 – approximately 25.6 % greater than that of the upper region.
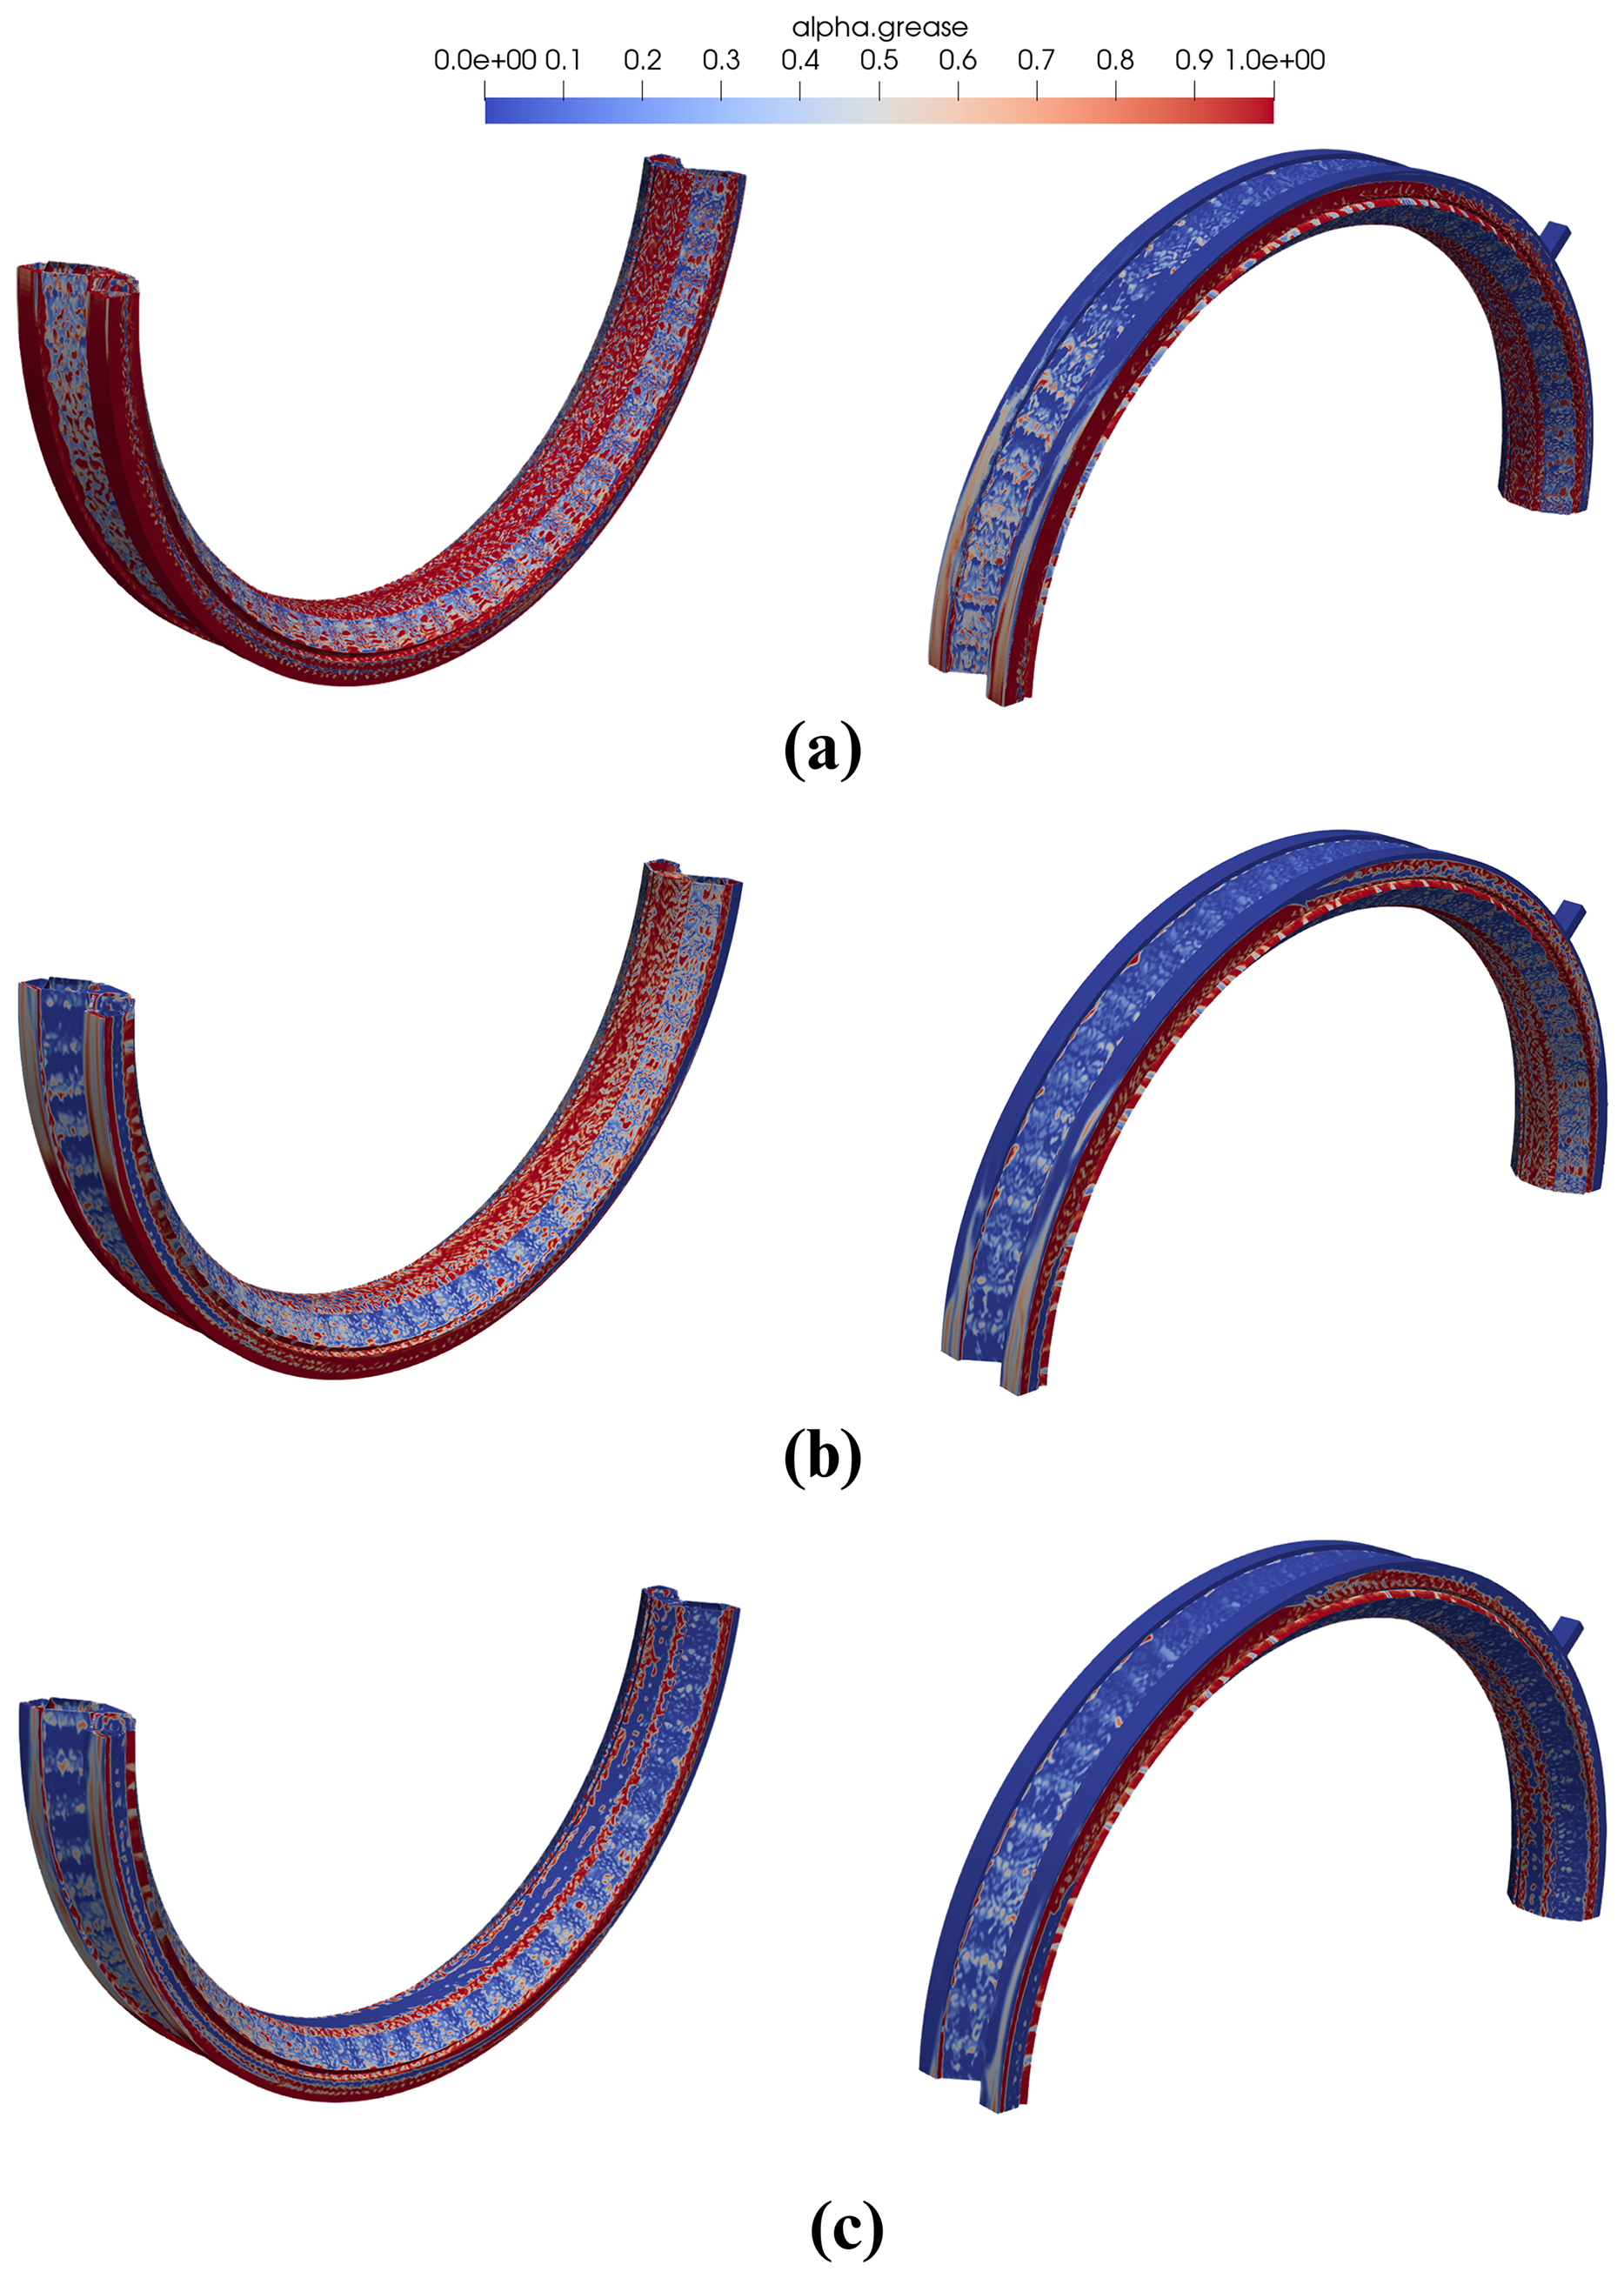
Figure 15Illustration of comparison of grease distribution in top and bottom part of the bearing after one rotation of cage: (a) 45 %, (b) 35 %, and (c) 21 % grease filling ratios.
The tilt of the bearing also influences the grease distribution behavior. To analyze this effect, the two rows of the bearing were separated, and the corresponding grease distribution was captured for each filling ratio as shown in Fig. 16. The total volume of the lubrication chamber for each row is 0.017 m3. After one complete rotation of cage, the wetted volume in the MFS row is 0.009 m3, whereas the hub side (HS) row has a wetted volume of 0.007 m3 for 45 % grease filling ratio (Fig. 16a). This indicates that the MFS row retains approximately 8.5 % more grease than the HS row. For 35 % ratio, the wetted volume in the MFS row is 0.007 m3, whereas the HS row has a wetted volume of 0.005 m3 indicating approximately 7.9 % more grease in the MFS row (Fig. 16b). Similarly for 21 % grease filling ratio, the difference between the wetted volume in MFS and HS row is 6.53 % (Fig. 16c). The results of grease distribution by volume (m3) are summarized in Table 9.
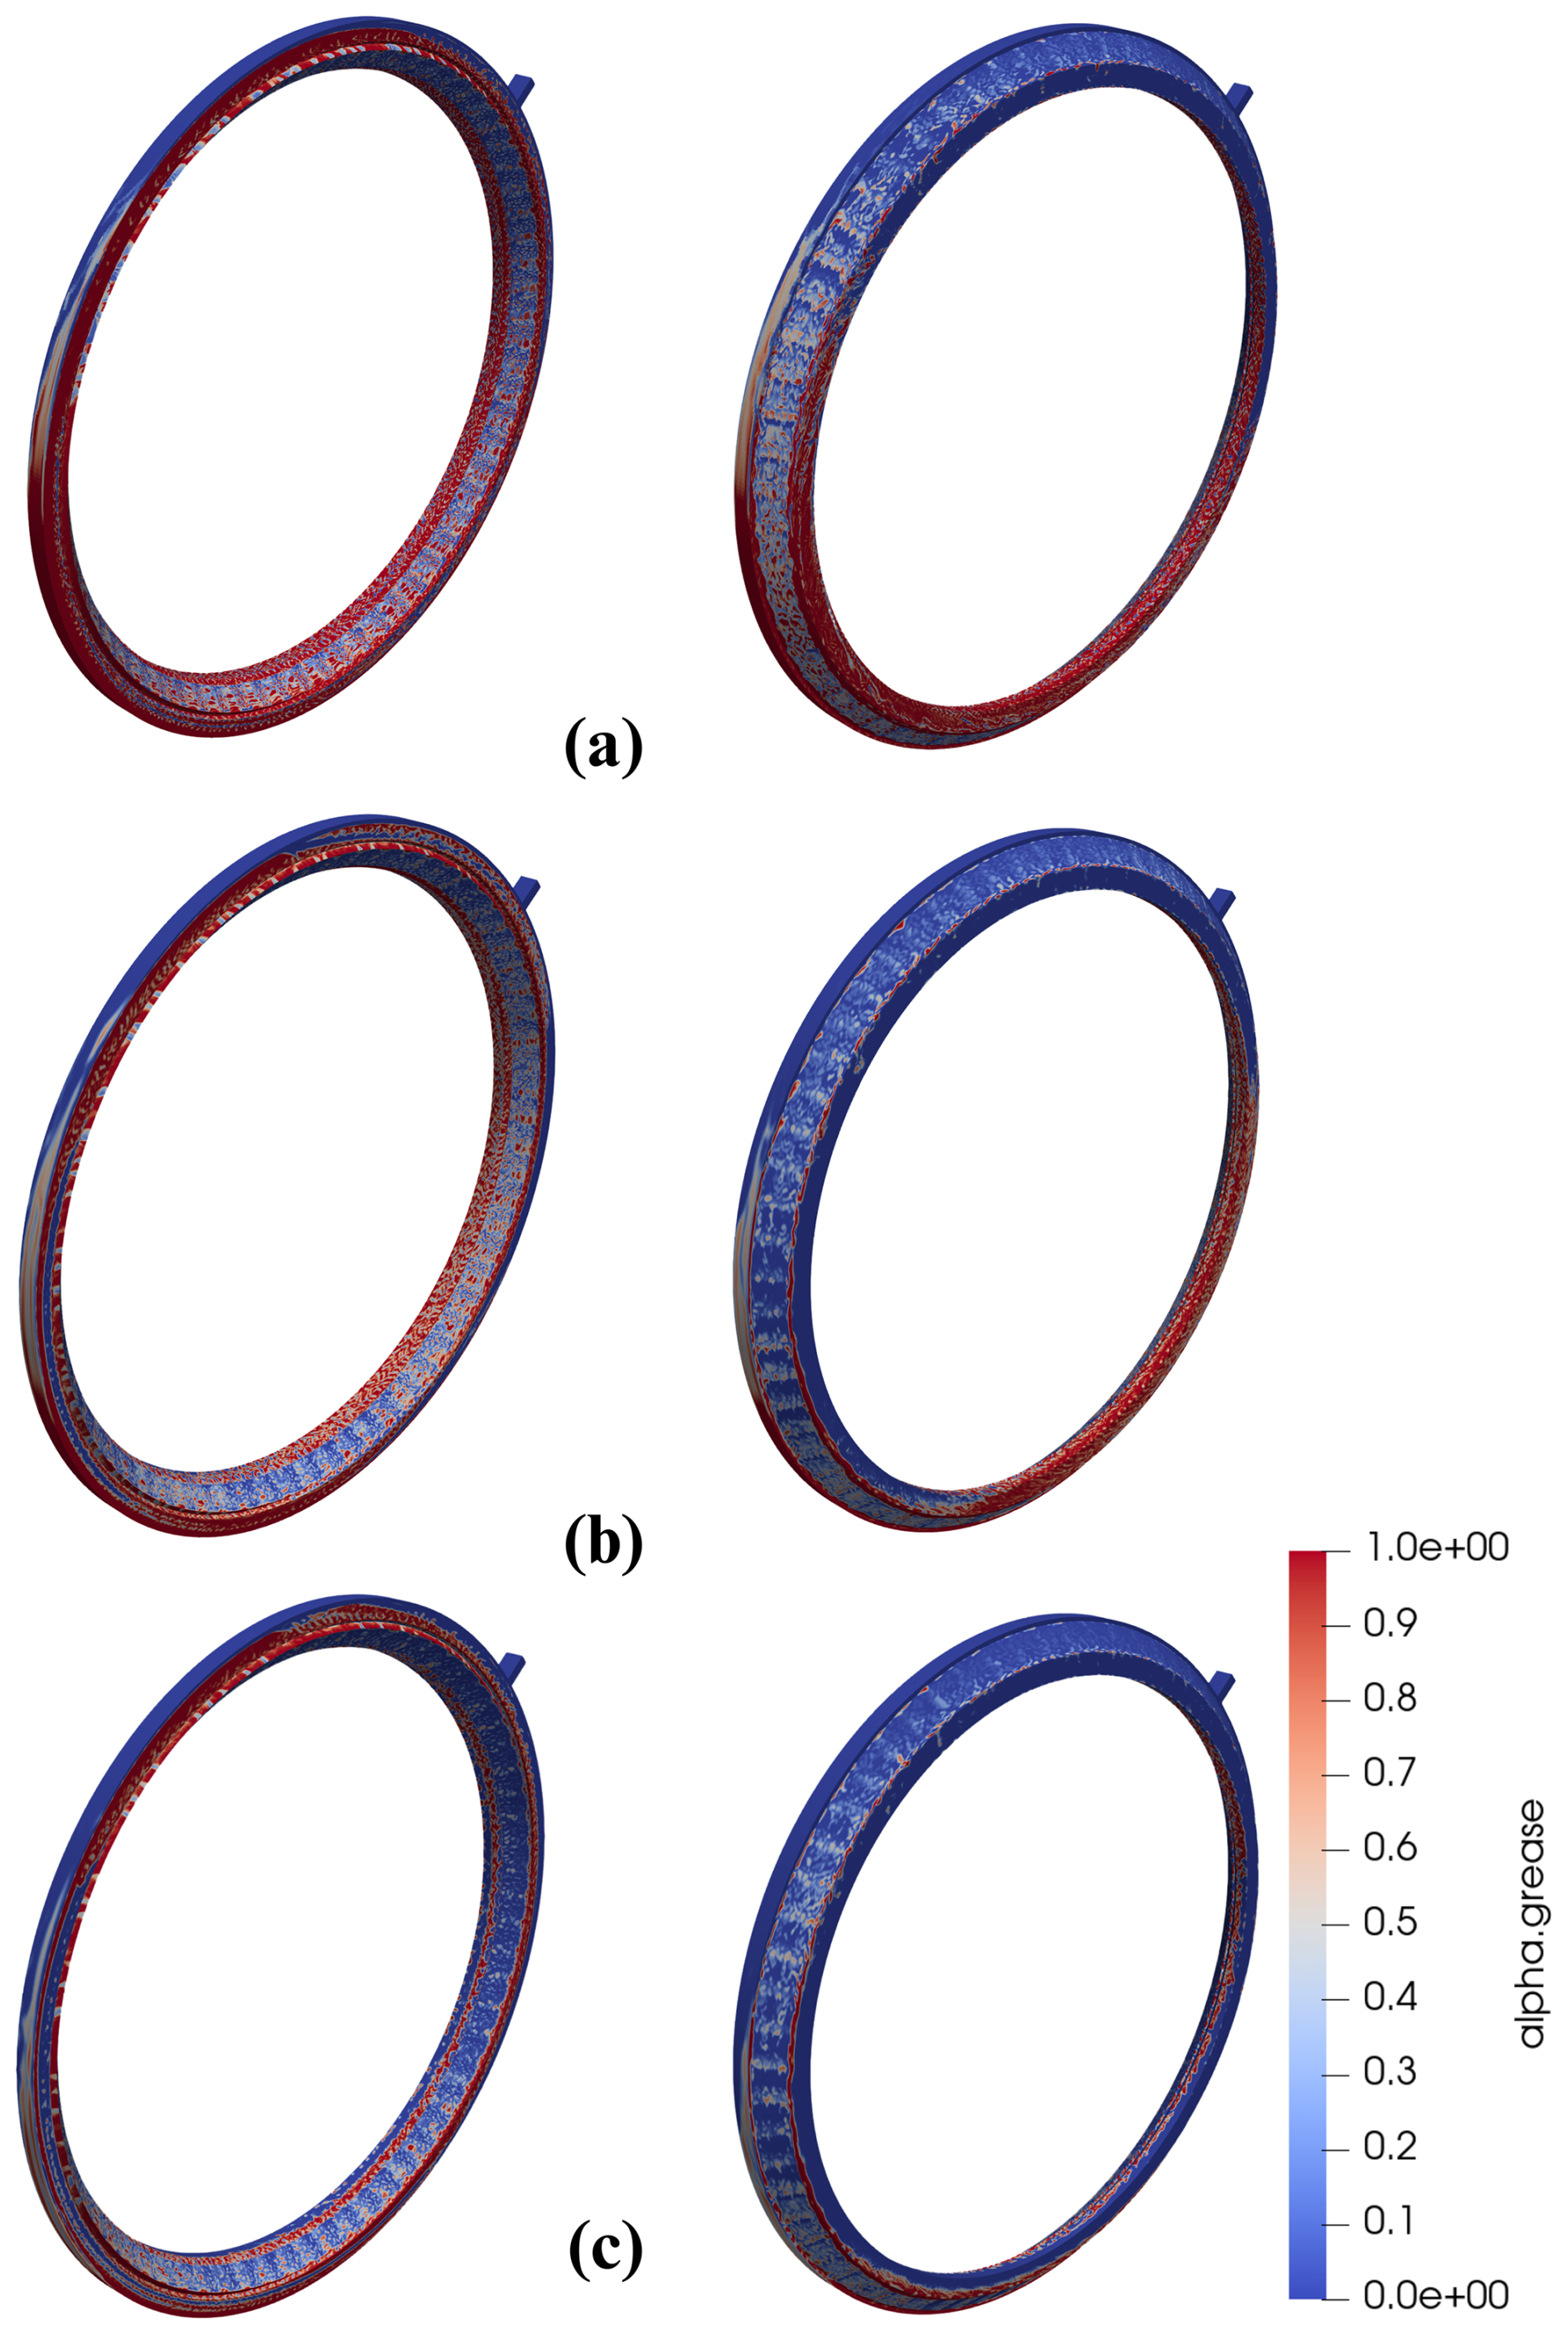
Figure 16Illustration of grease distribution in MFS and HS row after one rotation of cage: (a) 45 %, (b) 35 %, and (c) 21 % grease filling ratios.
Figure 17 illustrates the asymmetric distribution of grease over time. Initially, both rows exhibit equal grease occupancy, as the local stresses remain below the grease yield stress, causing it to behave like a solid, while the bearing tilt of 5° alone is insufficient to induce flow. However, once rotation begins, the grease volume in the MFS row (i.e., the row toward which the bearing is tilted) gradually increases, accompanied by a corresponding decrease in the HS row. This behavior can be attributed to the influence of centrifugal forces, which drive the grease radially outward. Due to the bearing tilt, this outward flow is biased toward the MFS row, resulting in a pressure build-up in that region. This pressure build up gives rise to an interesting phenomenon of grease redistribution that begins to occur after a certain period of time shown in Fig. 17. As the pressure in the MFS row increases, a sufficient pressure gradient is established between the two rows. This gradient drives the grease back toward the HS row, counteracting the centrifugal bias. Eventually, a steady state is reached in which a dynamic equilibrium exists between the centrifugal-driven flow and the pressure-induced backflow. At this stage, the net grease flow between the rows becomes negligible and the grease distribution stabilizes. This redistribution process and the resulting equilibrium are quantitatively captured by the grease occupancy evolution shown in Fig. 17, which provides a clear measure of the redistribution dynamics. In addition, Fig. 18 presents the grease occupancy in each row, normalized with respect to the corresponding initial grease occupancy. Specifically, for each row, the grease volume at a given time is divided by the initial grease volume in that same row, which is taken as the reference value; this normalization is applied independently for each grease filling ratio. This normalization highlights the extent of asymmetric grease distribution between rows for each grease filling ratio. This indicates that asymmetric grease distribution tends to become more pronounced as the grease filling ratio decreases. At lower grease volumes, the grease is more susceptible to centrifugal forces, which preferentially bias its migration toward the MFS row.
Figure 19 illustrates the temporal evolution of the grease film angle (θ) for three different grease filling ratios. The angles are measured with respect to the bottommost part of the bearing (i.e., θ=0°), and represent the extent to which the grease progresses toward the topmost region (θ=180°) under rotation. The initial grease levels in the rotating direction (positive x axis) are approximately 82, 62, and 36° for the 45 %, 35 %, and 21 % filling ratios, respectively. The wetted surfaces were evaluated using the information provided by VoF model. In particular, the VoF formulation supplies both the grease volume fraction, αgrease, which describes the local phase distribution within each computational cell, and the direction of the grease–air interface through the gradient of the volume fraction field. Exploiting this information, the grease-covered area on each cell face was estimated, enabling the reconstruction of the wetted area on the relevant boundary surfaces. These quantities were subsequently used in a post-processing step to distinguish and quantify the boundary regions in contact with grease from those exposed to air.
Figure 19a presents the grease film evolution on the MFS inner raceway. It is evident that, for all three filling ratios, the grease film progresses up to the topmost region of the bearing. However, the time required to reach this position varies with the filling ratio, with higher ratios achieving full coverage more rapidly. The corresponding distribution on the HS inner raceway is shown in Fig. 19b. In this case, the 45 % and 35 % filling ratios allow the grease film to reach the top region, similar to the MFS. However, for the 21 % filling ratio, the grease front diminishes significantly and fails to reach the upper portion, indicating a thinning film and potentially inadequate lubrication in this area.

Figure 19c shows the grease progression on the MFS outer raceway. Only the 45 % filling ratio provides sufficient grease volume to reach the topmost section. For the 35 % and 21 % cases, the upper region remains starved. This behavior can be attributed to the fact that the outer raceway is stationary and, therefore, does not contribute to the centrifugal transport of grease. As a result, the grease tends to remain with the rotating inner raceway and rollers, limiting its migration toward the outer raceway – especially under low grease volumes. Finally, Fig. 19d illustrates the HS outer raceway. In this case, none of the three filling ratios succeed in delivering grease to the top region, leaving it starved throughout the simulation. This consistent starvation across all cases emphasizes the asymmetric grease distribution resulting from the bearing’s tilt and the centrifugal-biased flow towards the MFS side.
It is important to note that in cases where the grease fails to reach the topmost region, the limited amount of grease causes the front to gradually disappear over time. After a certain point, the grease becomes too sparse to form a continuous layer, instead breaking into small dispersed droplets. As a result, it is not possible to extract a well-defined angle of progression beyond this stage. Therefore, data beyond this point were excluded from the graph, as no coherent front exists to track angular progression reliably. The bump observed only for the 45 % filling ratio on the outer raceway reflects a sensitive regime characterized by transient grease accumulation and redistribution.
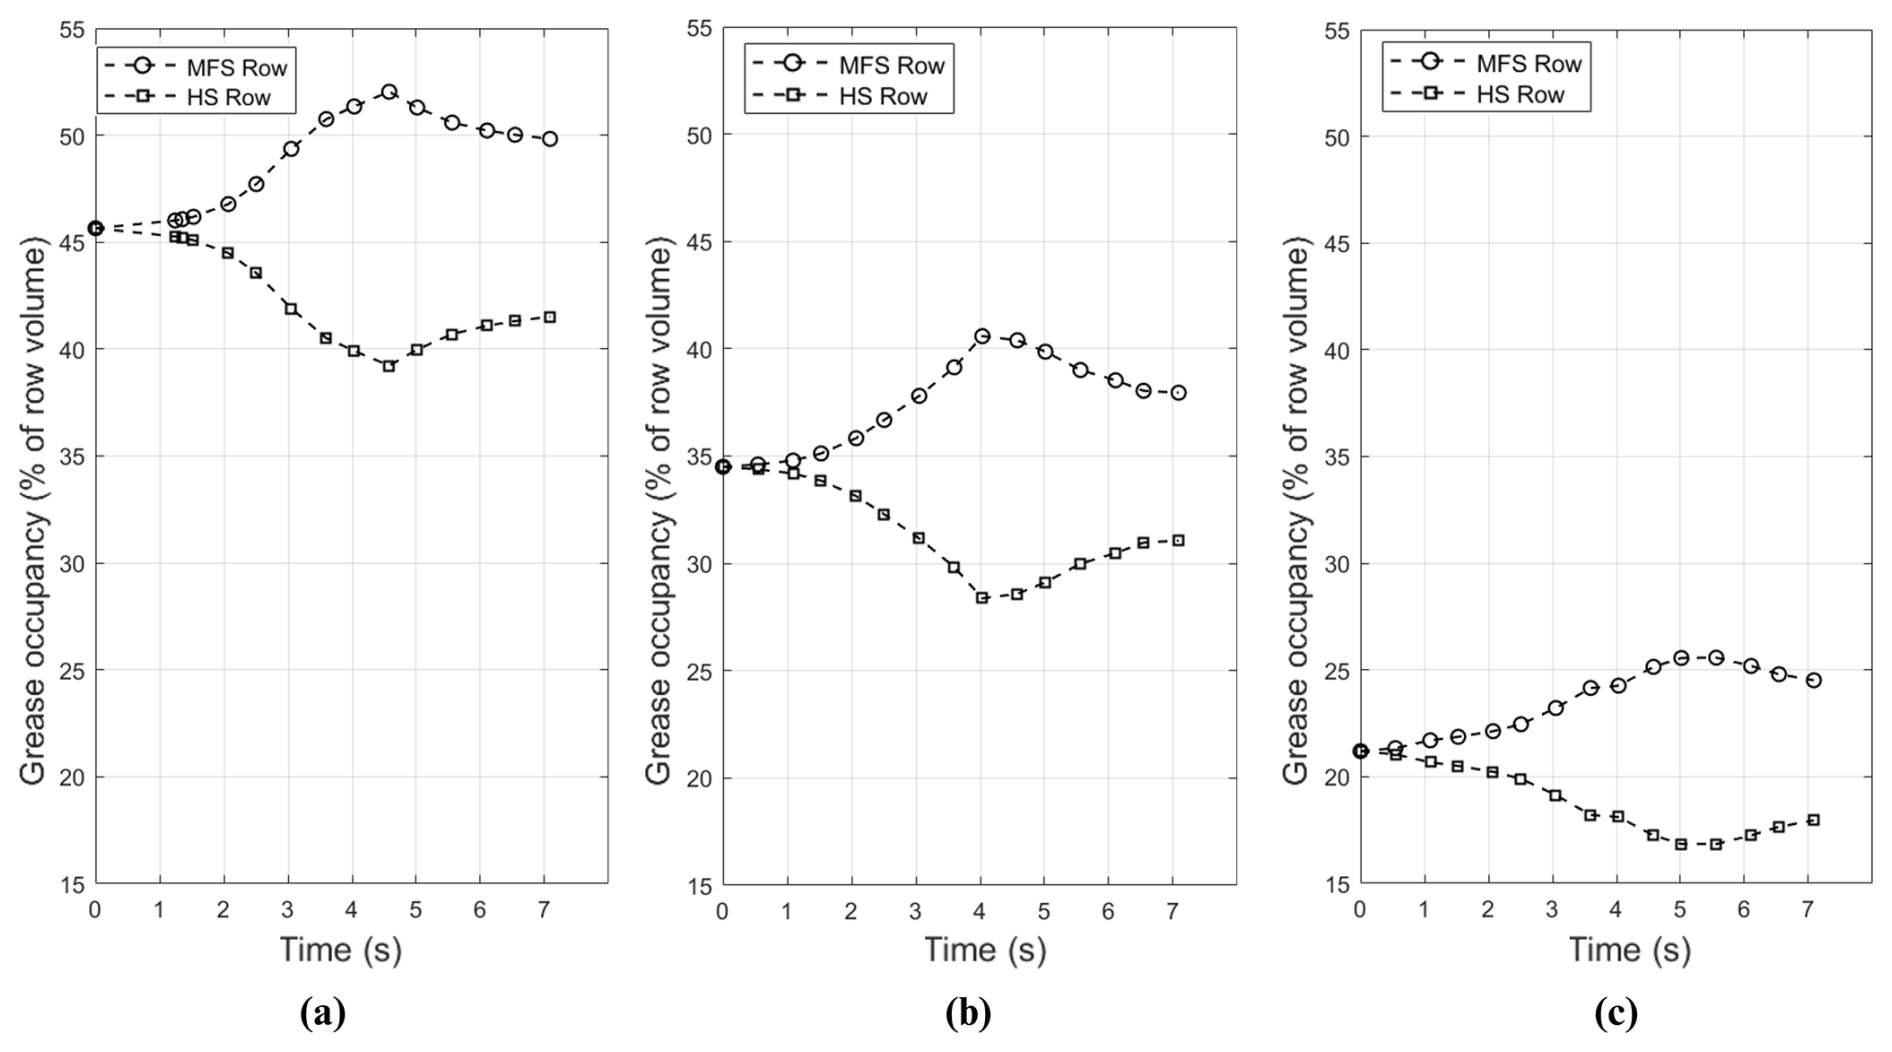
Figure 17Illustration of asymmetrical grease occupancy as a percentage of lubrication chamber volume of each row w.r.t. time: (a) 45 %, (b) 35 %, and (c) 21 % grease filling ratios.
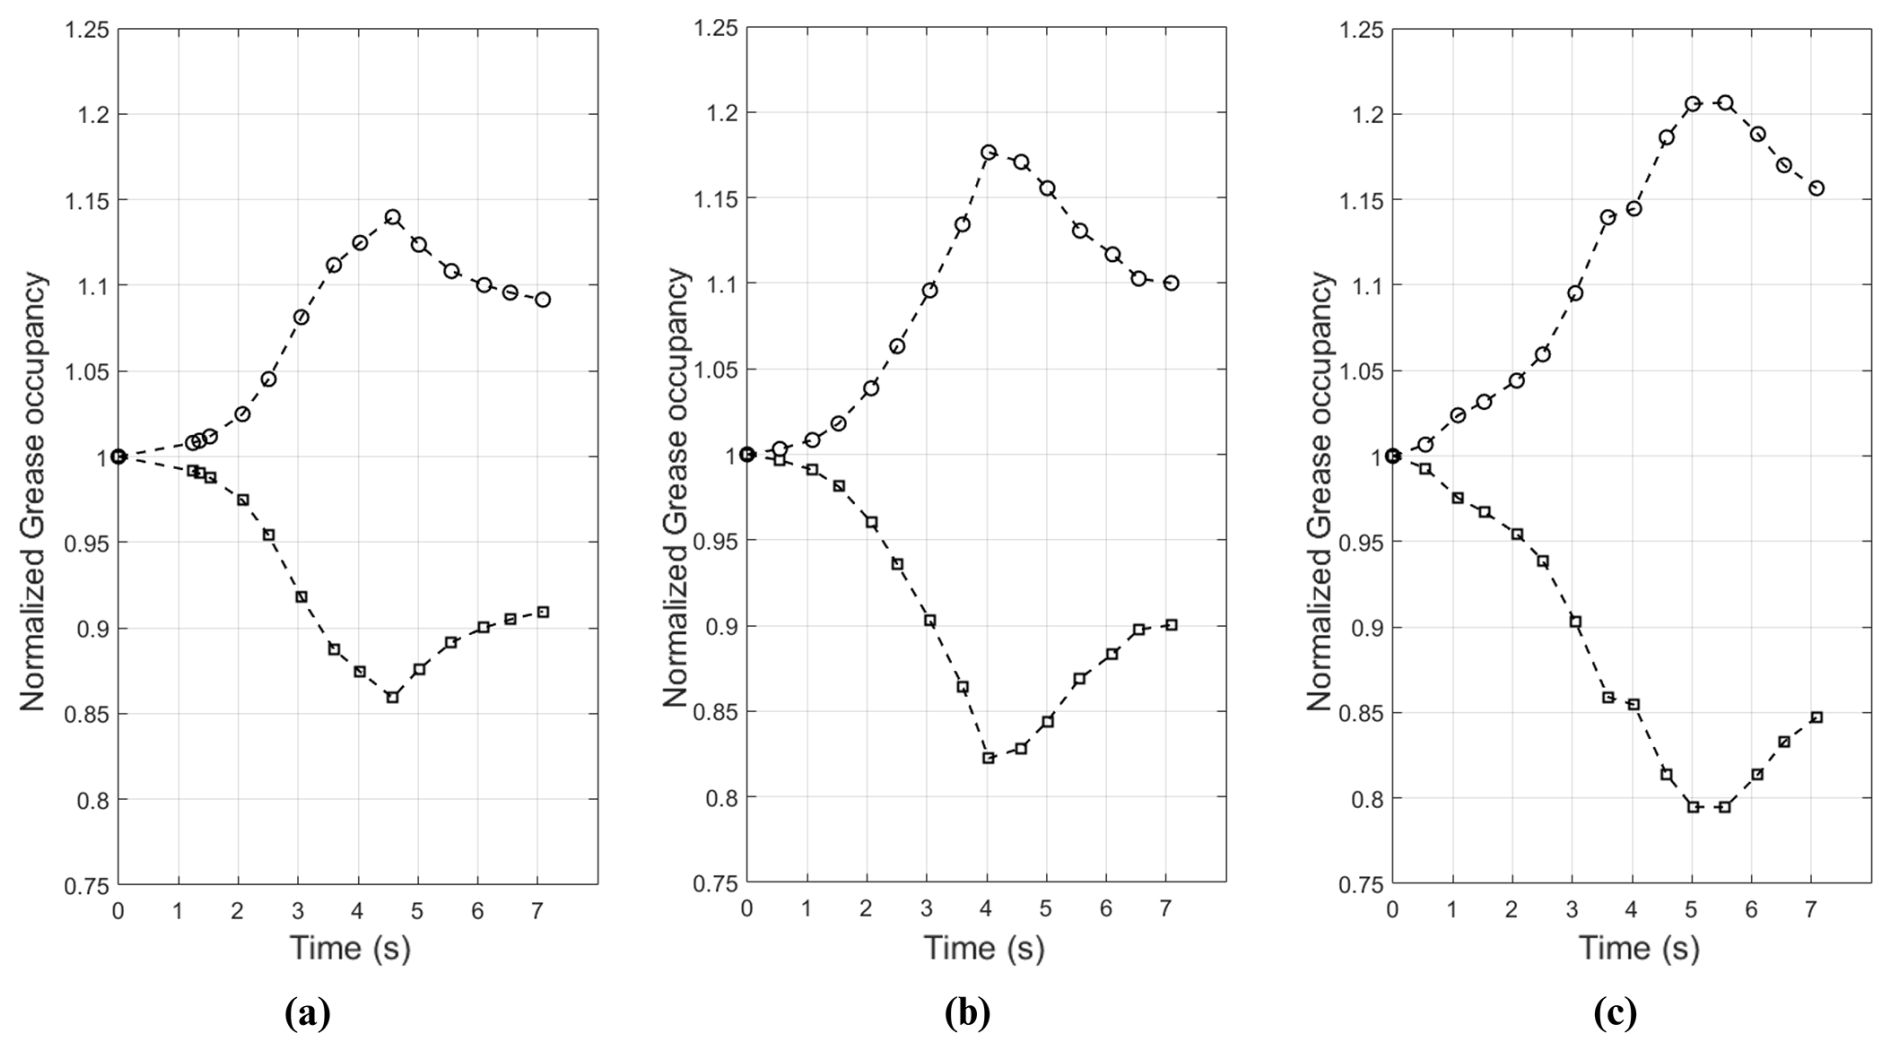
Figure 18Illustration of asymmetrical normalized grease occupancy within each row w.r.t. time: (a) 45 %, (b) 35 %, and (c) 21 % grease filling ratios.
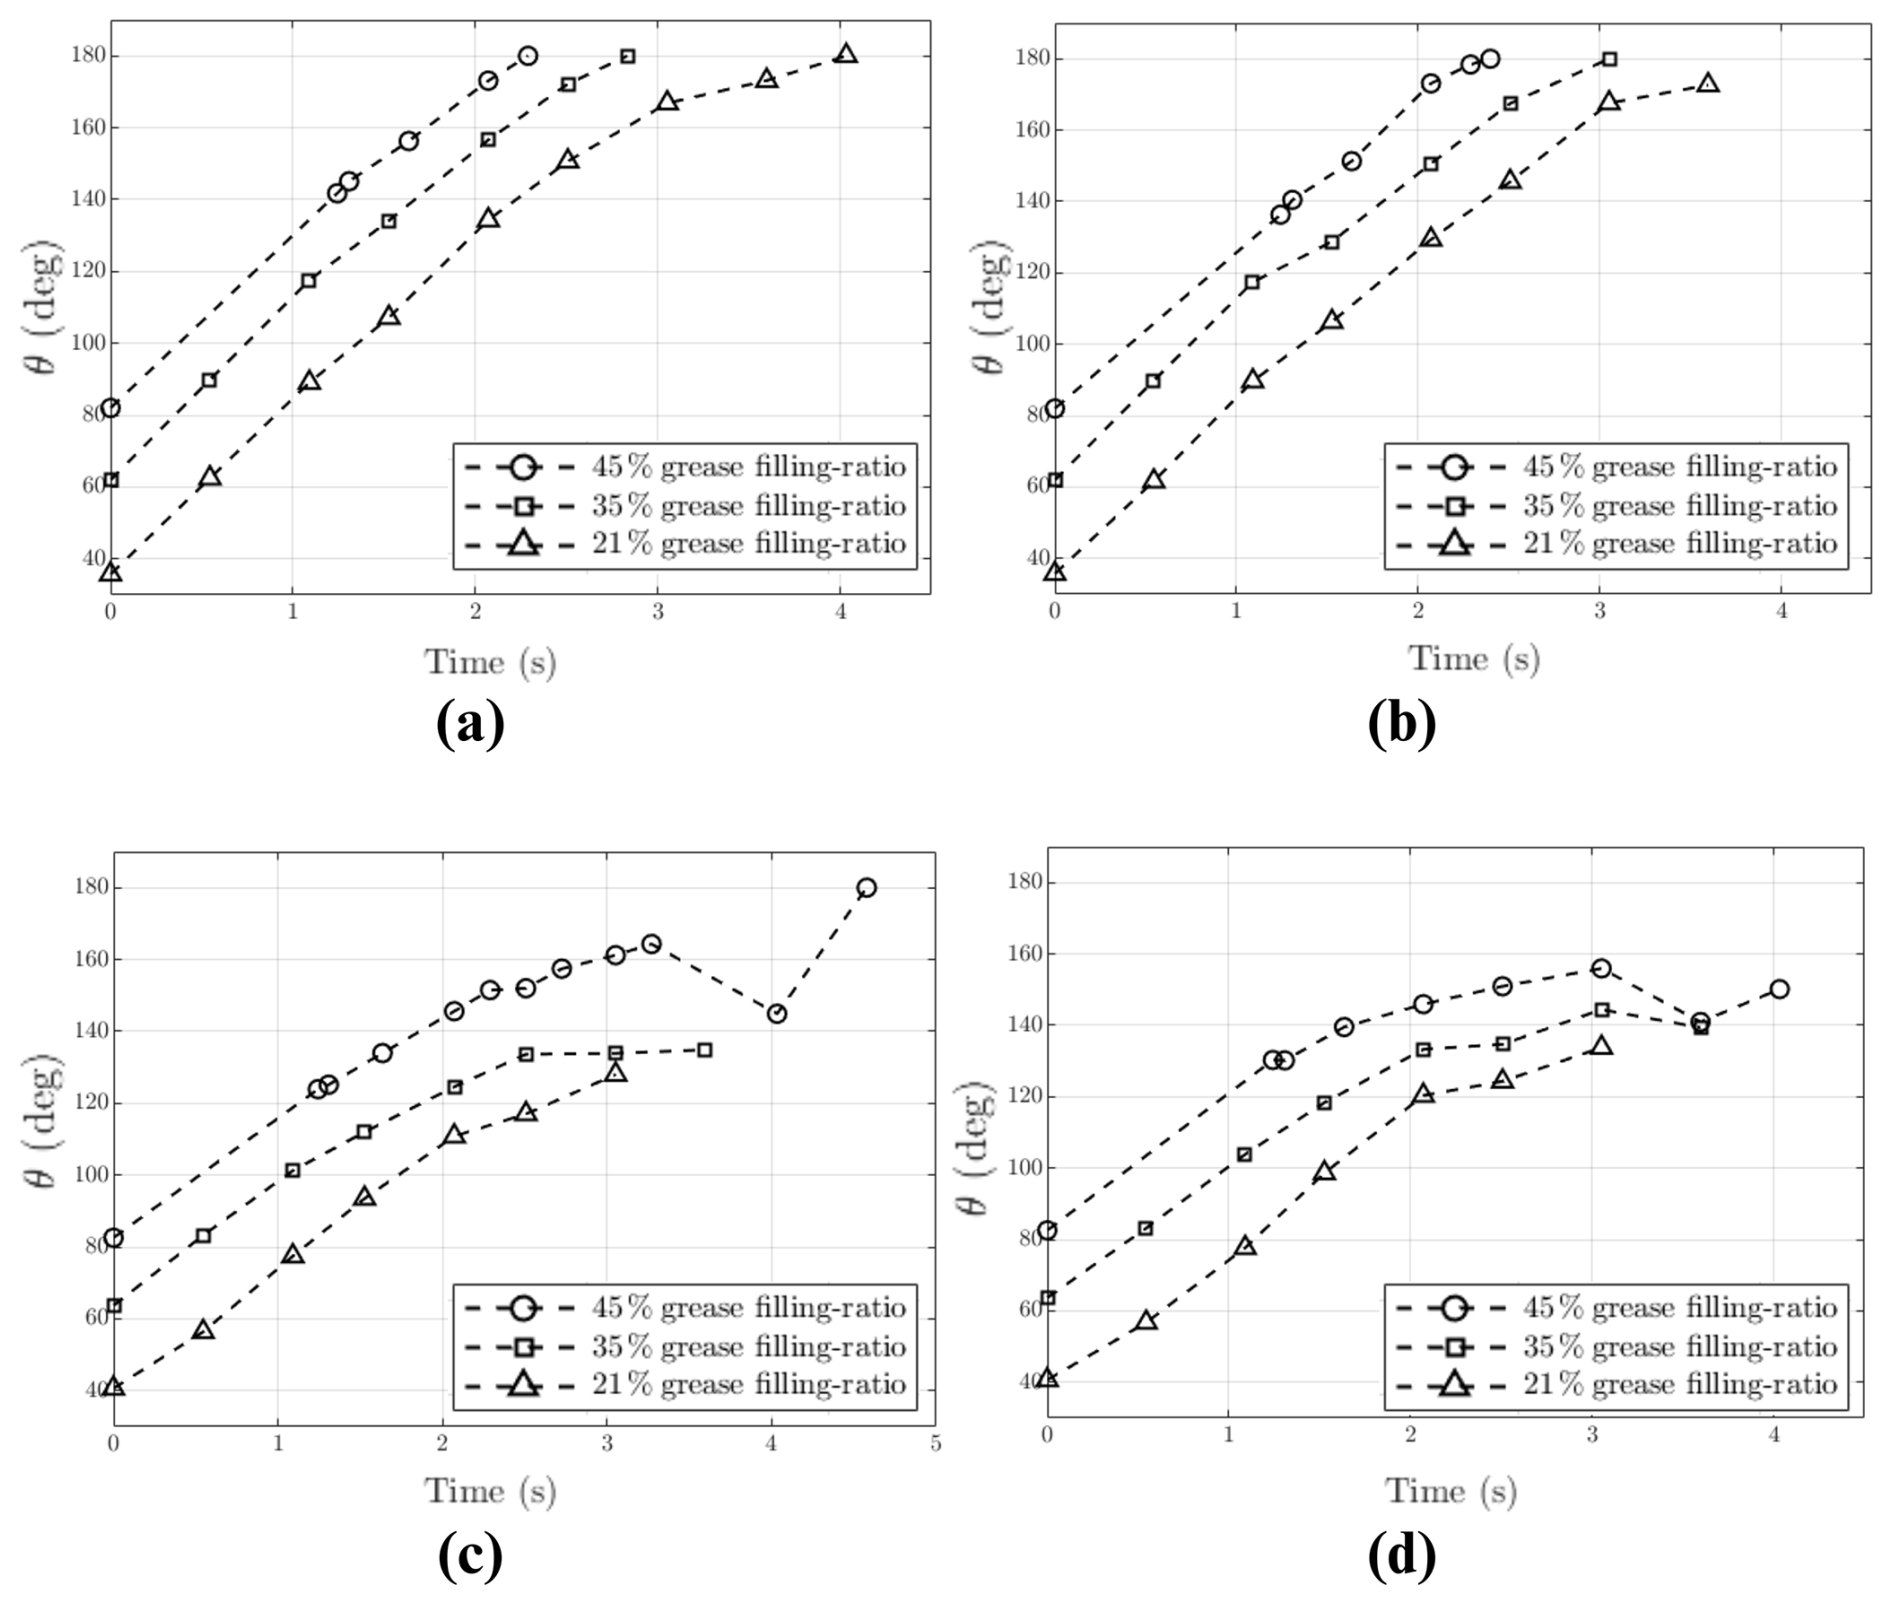
Figure 19Illustration of the temporal distribution of the grease within the range of : (a) MFS inner raceway, (b) HS inner raceway, (c) MFS outer raceway, and (d) HS outer raceway.
3.2 Fluxes
Figures 20 and 21 illustrate the velocity fields in cross-sectional slices taken from planes perpendicular to the bearing axis for the MFS and HS rows, respectively. The velocity field is shown only in grease-dominated regions by applying a grease volume fraction threshold of αgrease of 0.5 or above in the cell. The figures reveal clear differences in the spatial distribution and intensity of grease motion between the different filling ratios. Higher velocities are observed primarily in regions adjacent to the roller surfaces, highlighting the dominant role of squeeze-induced motion, while grease adhering to the inner and outer raceways satisfies the no-slip boundary condition. With increasing filling ratio, the extent of regions exhibiting significant grease motion increases, indicating enhanced internal grease flux within the bearing.
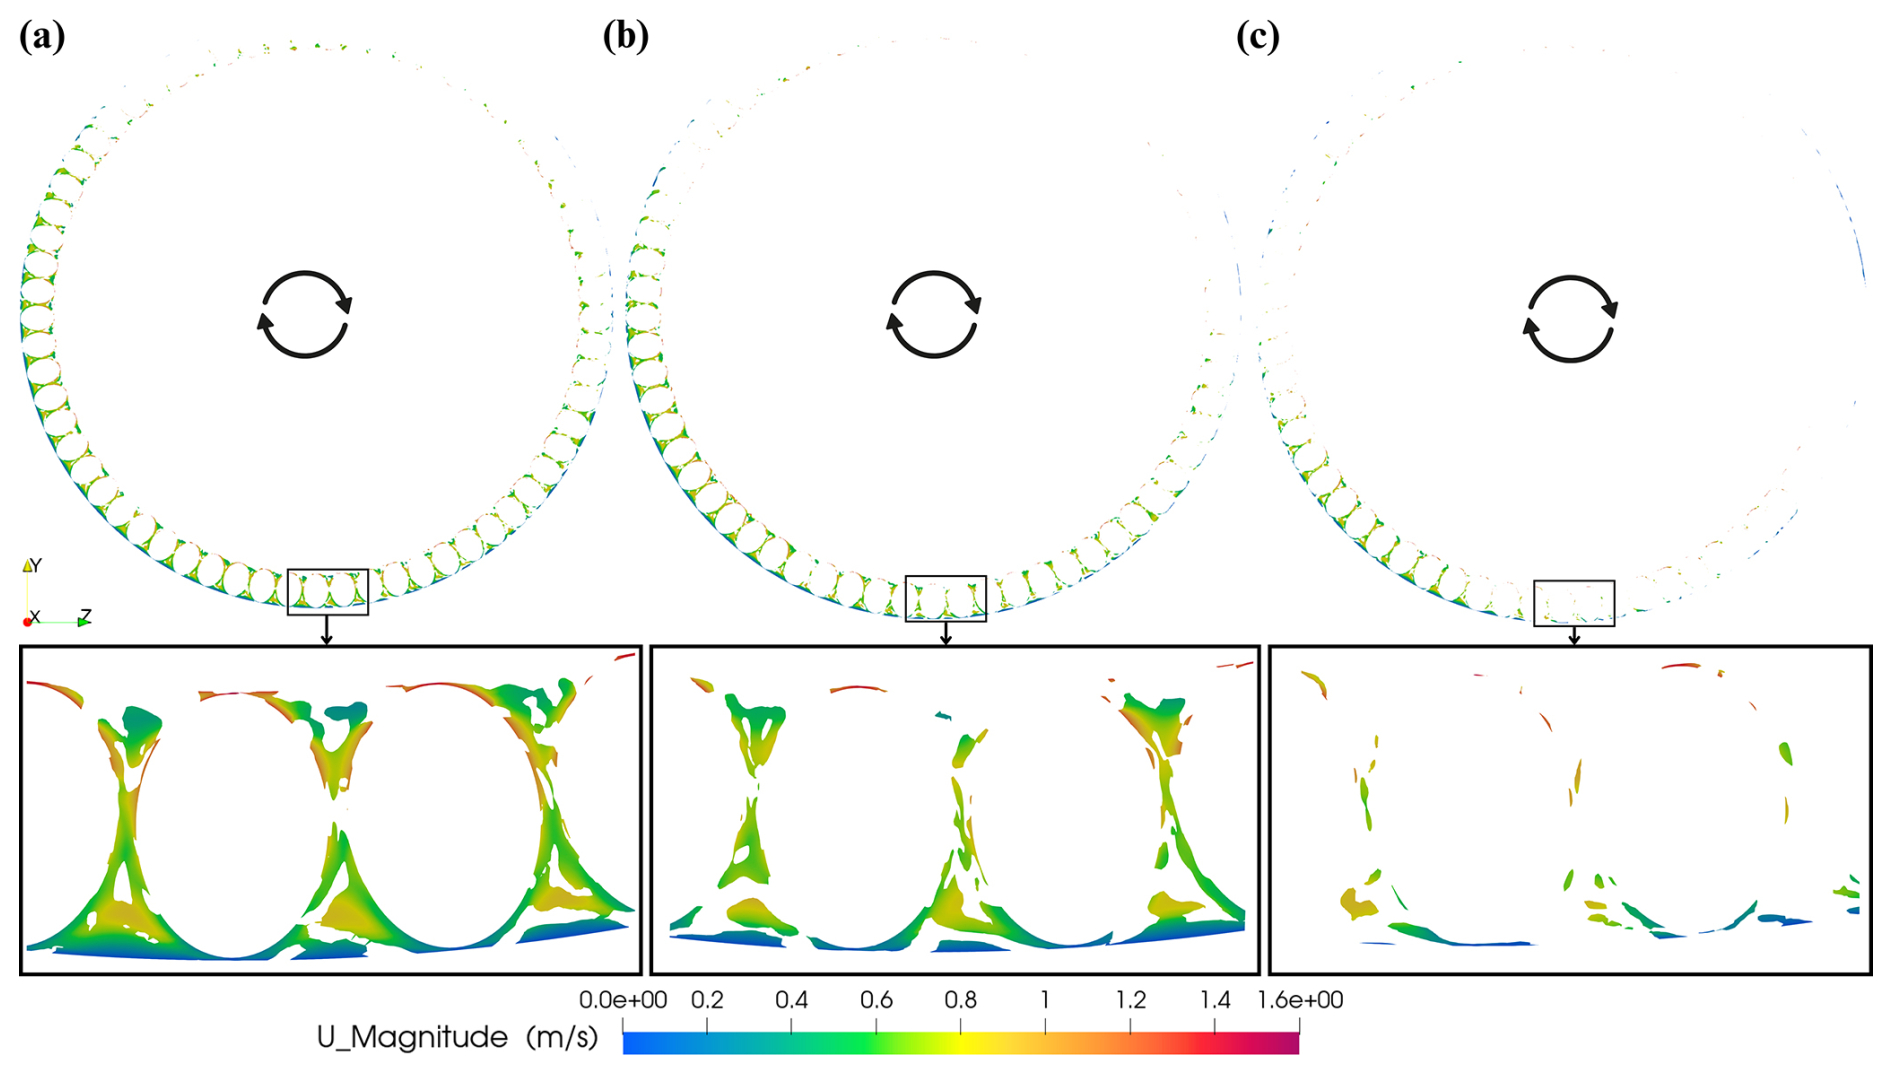
Figure 20Illustration of velocity fields in MFS row after one rotation of cage: (a) 45 %, (b) 35 %, and (c) 21 % grease filling ratios.
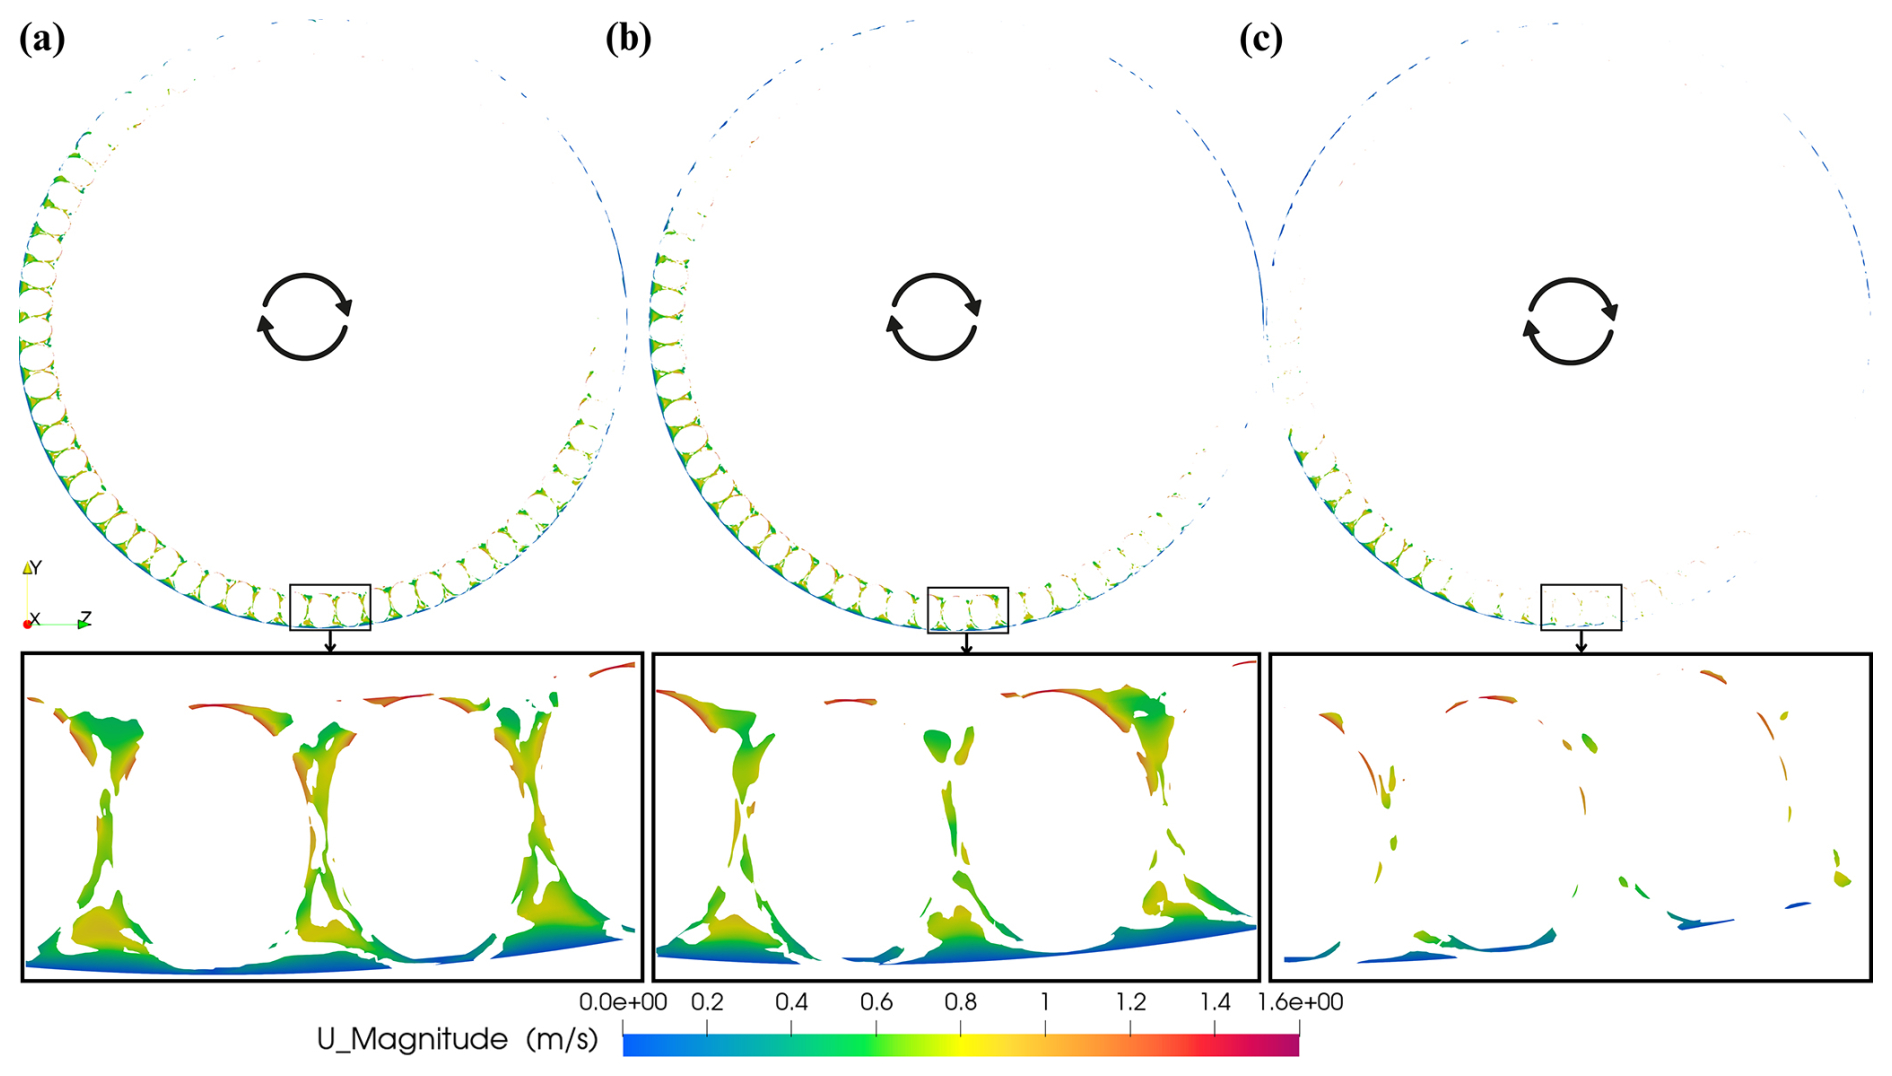
Figure 21Illustration of velocity fields in HS row after one rotation of cage: (a) 45 %, (b) 35 %, and (c) 21 % grease filling ratios.
The pumping effect induced by the rollers, resulting from their tapered geometry, is the displacement of grease in a favorable direction. Figures 22 and 23, corresponding to the MFS and HS rows, respectively, show the axial velocity field in grease-dominated regions. Owing to the tapered geometry, one side of each roller exhibits axial velocity towards the bearing bore, while the other side shows axial velocity away from bearing bore, leading to an asymmetric axial velocity distribution.
On the MFS (Fig. 22), negative axial velocity indicates flow away from bearing bore, whereas positive axial velocity represents flow towards bearing bore. On the HS, the sign convention is opposite (Fig. 23), where positive axial velocity represents flow away from bearing bore, while negative axial velocity represents flow towards bearing bore. In the regions between the rollers, the grease displays coherent axial velocities with a consistent directional bias. Since these regions are not directly attached to the roller surfaces, the observed motion cannot be explained solely by local displacement effects. Instead, it indicates a preferential axial transport of grease, supporting the presence of a pumping tendency arising from the tapered roller geometry and the imposed kinematics. This bidirectional flow pattern highlights the role of tapered rollers (pumping effect) in driving lubricant circulation across the bearing rows.
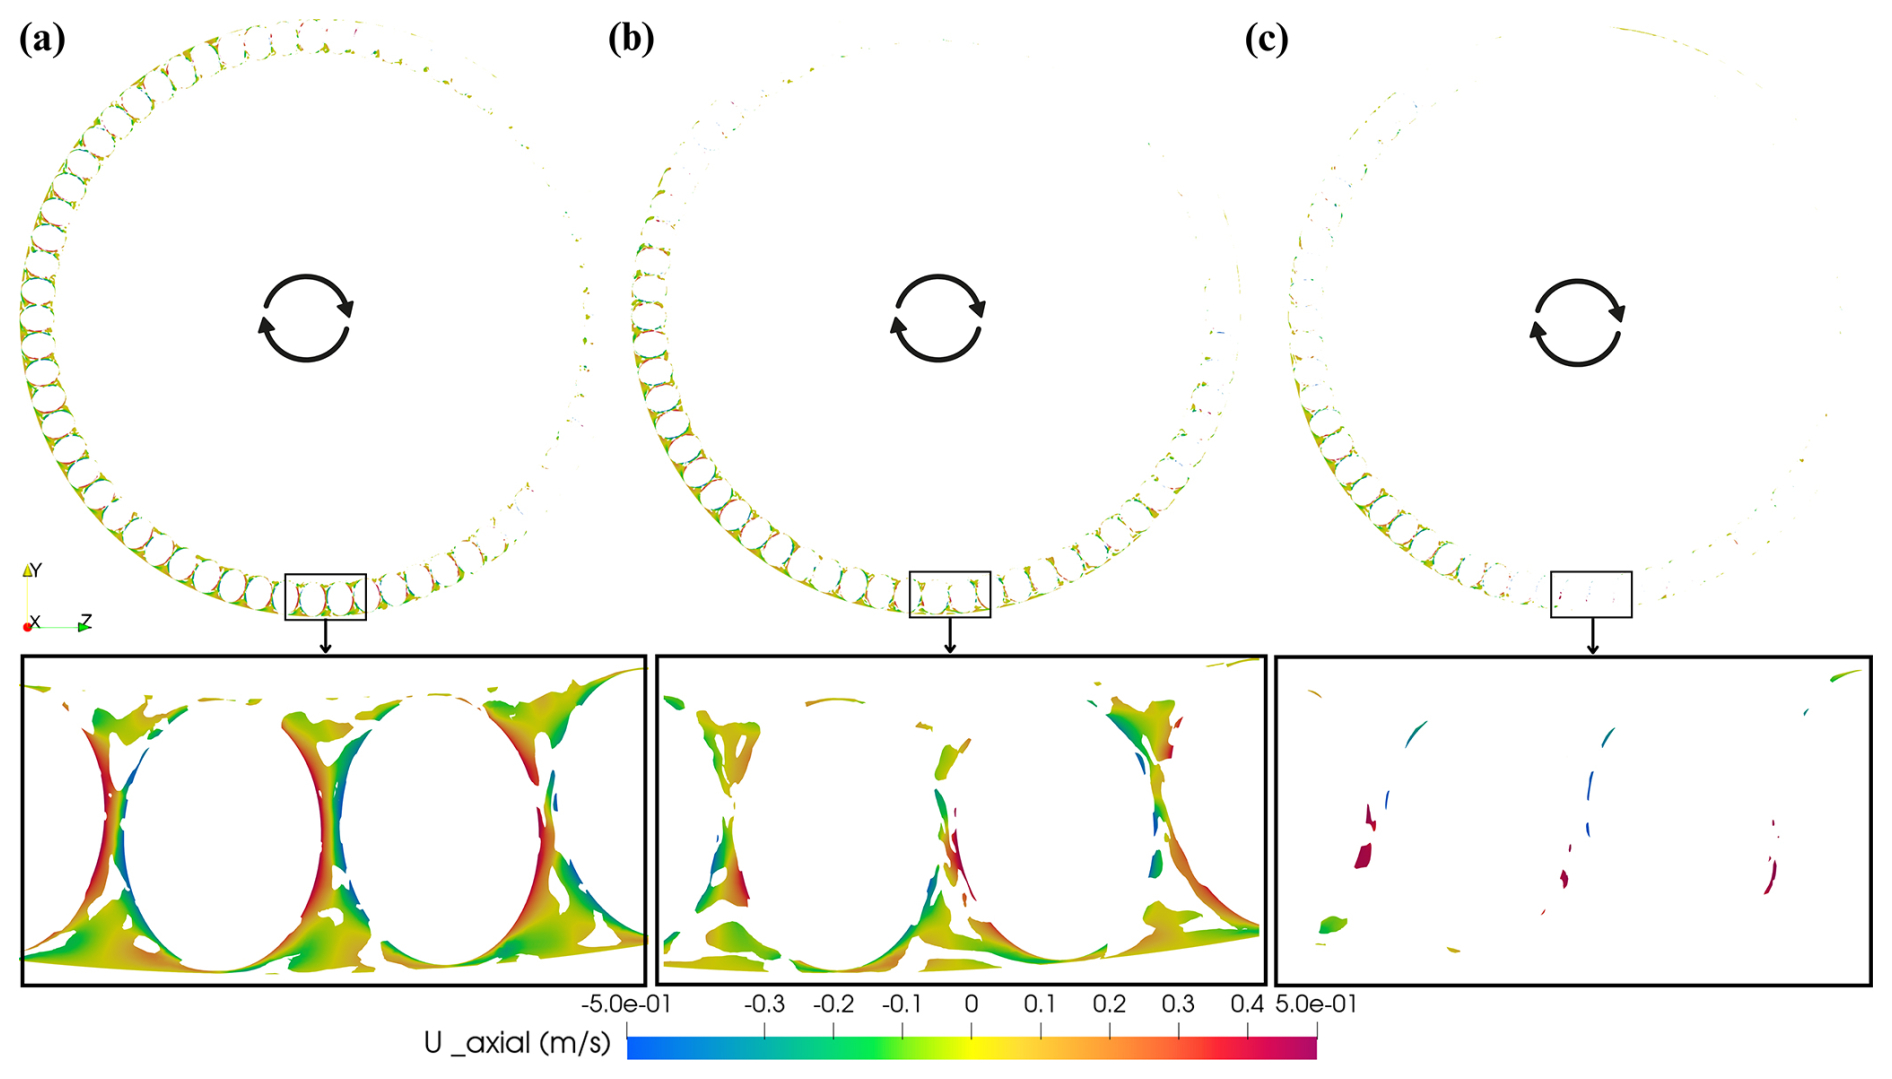
Figure 22Illustration of axial velocity fields in MFS row after one rotation of cage: (a) 45 %, (b) 35 %, and (c) 21 % grease filling ratios.
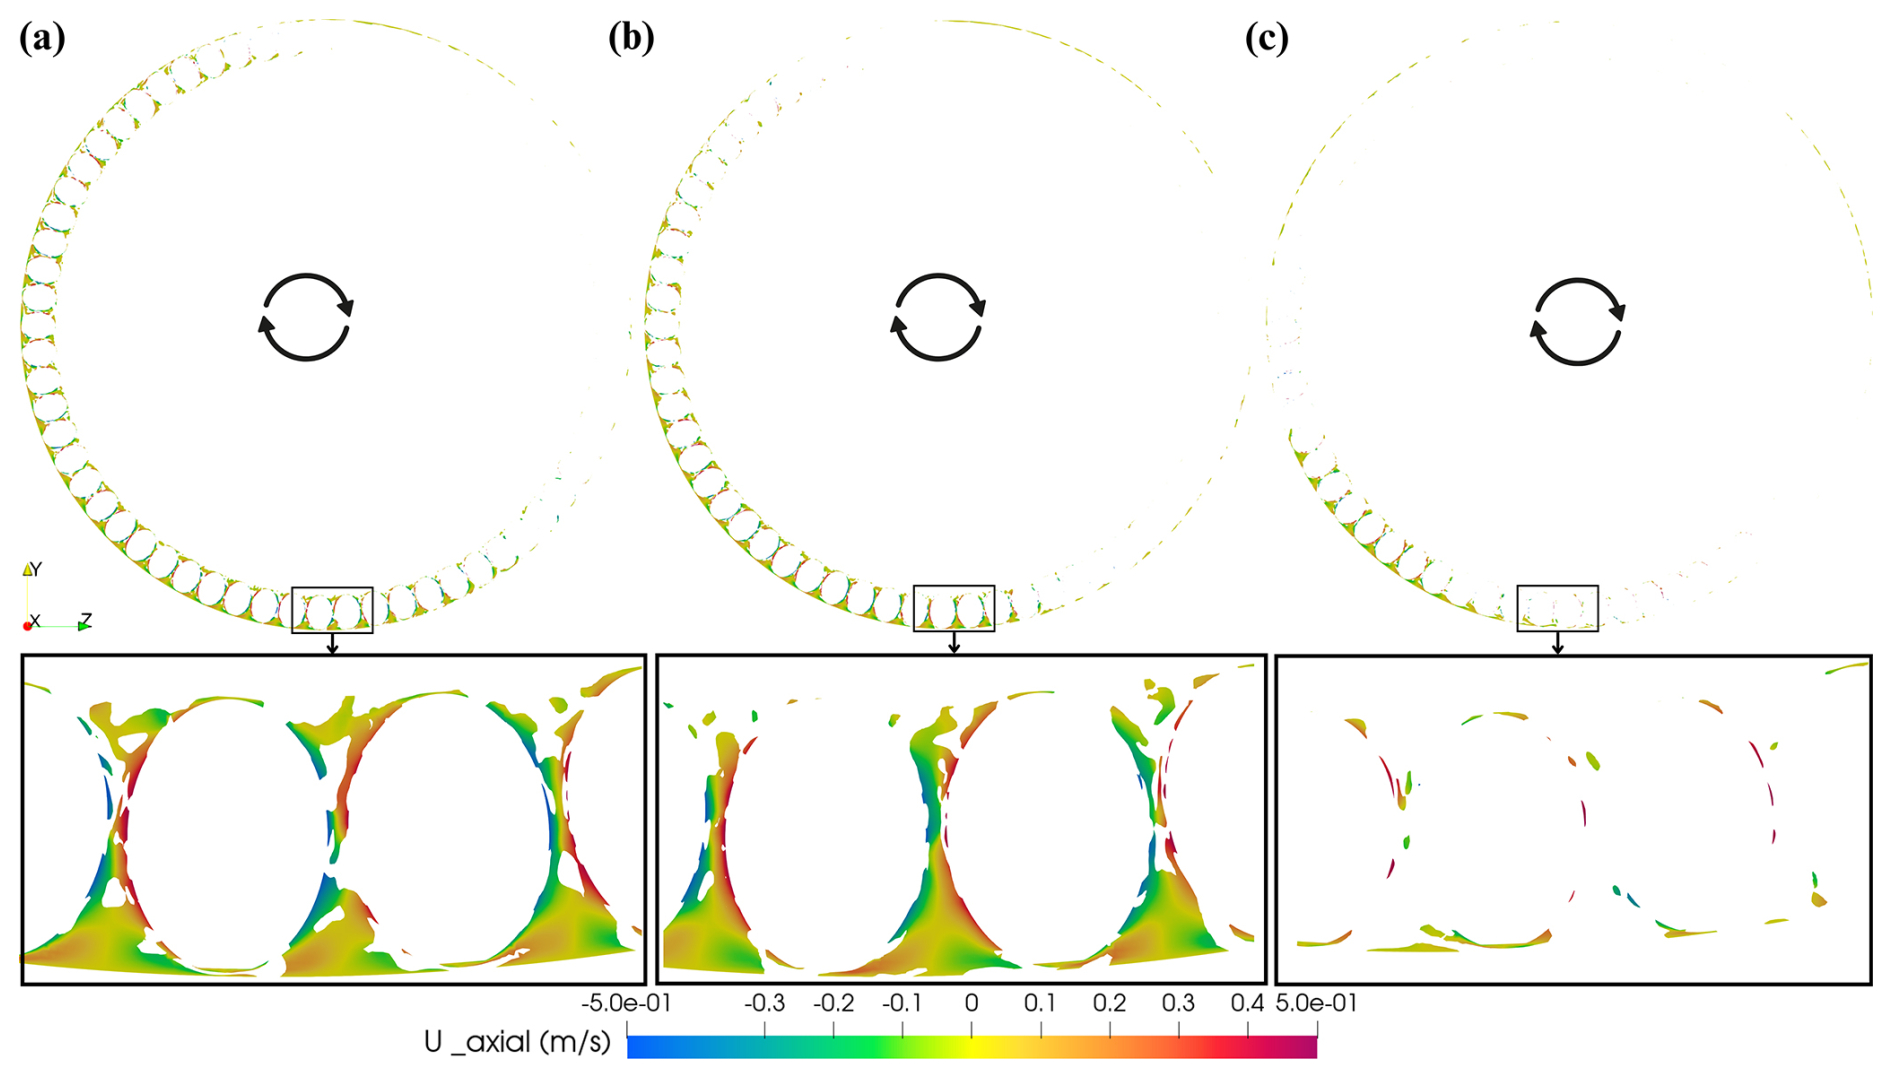
Figure 23Illustration of axial velocity fields in HS row after one rotation of cage: (a) 45 %, (b) 35 %, and (c) 21 % grease filling ratios.
3.3 Pressure fields
The pressure field developed due to grease flow over the roller surfaces and inner raceway is illustrated in Fig. 24. Higher pressure regions are observed in areas with greater lubricant accumulation which is evident from Fig. 24. For 45 % grease filling ratio (Fig. 24a), the pressure developed inside the bearing is higher as compared to 35 % and 21 % filling ratios (Fig. 24b and c, respectively). Notably, steep pressure gradients occur near the contact interfaces between the rollers and raceways, which can be attributed to the squeezing effect of the lubricant in these narrow gaps. Similar pressure profiles were found by Maccioni et al. (2023a) in their study.
The pressure distribution on the bearing seals is of particular importance, as it directly affects the potential of lubricant leakage. The threshold of the pressure for the seal of bearing under investigation is 0.5 bar. Figure 25 presents the pressure profiles on both the MFS and HS seals for the three grease filling ratios. The left column corresponds to the MFS seal, while the right column shows the HS seal. It is evident that the pressure on the seals is highest for the 45 % grease filling ratio (Fig. 25a), followed by 35 % and 21 % (Figs. 25b and c respectively), indicating that increased grease volume leads to greater sealing pressure and potentially a higher risk of leakage. Figure 26 presents the temporal evolution of the maximum total pressure acting on the seals for the different grease filling ratios. The reported pressure corresponds to the total pressure experienced by the seals, including hydrostatic as well as rotational (centrifugal and dynamic) contributions. For all filling ratios, the pressure initially decreases as the grease redistributes within the bearing during the early stages of rotation. When the grease reaches the top region and subsequently starts its downward motion, the pressure increases due to the combined effects of grease accumulation toward the bottom region of the bearing and dynamic contributions, with hydrostatic and inertial pressure contributions acting together to support the load. The magnitude of the maximum seal pressure increases with grease filling ratio; however, this increase remains smooth and does not exhibit any over-linear amplification. Importantly, in all cases the maximum pressure remains well below the sealing pressure limit of 0.5 bar, indicating that seal integrity is maintained and that pressure-driven leakage is unlikely for the investigated operating conditions.
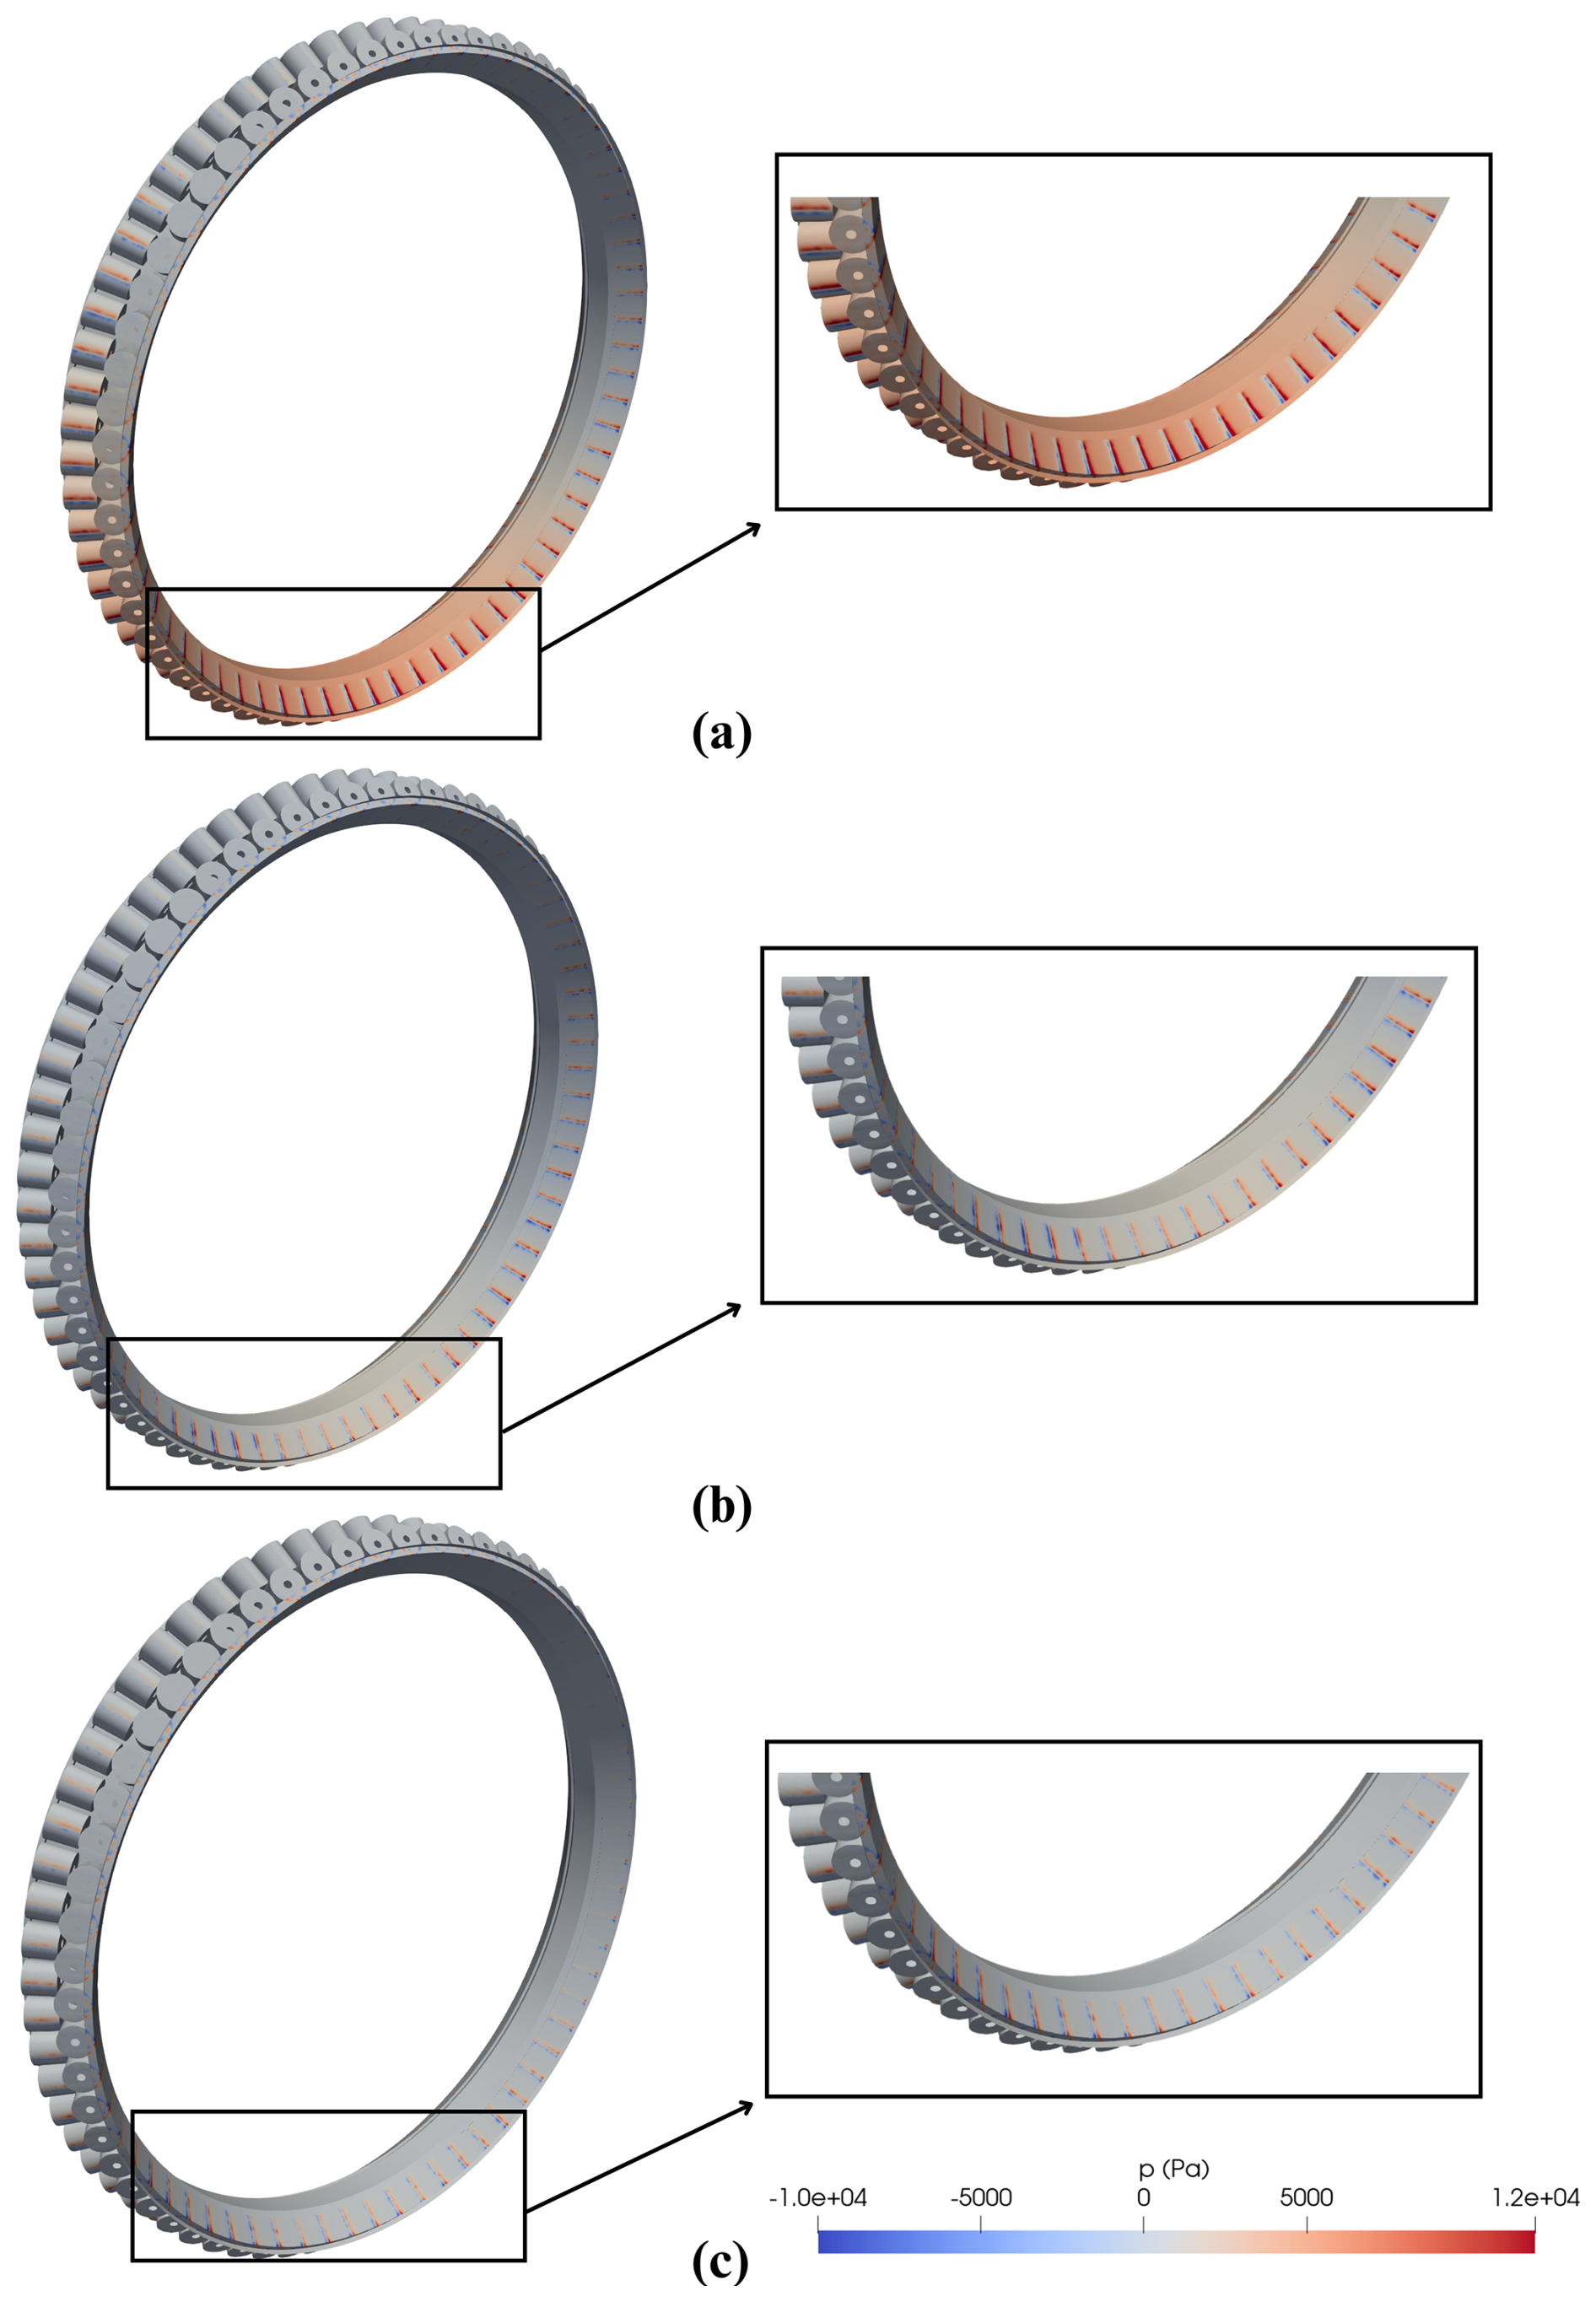
Figure 24Illustration of pressure fields in rollers and inner raceway after one rotation of cage (steep pressure gradients near the contact surfaces): (a) 45 %, (b) 35 %, and (c) 21 % grease filling ratios.
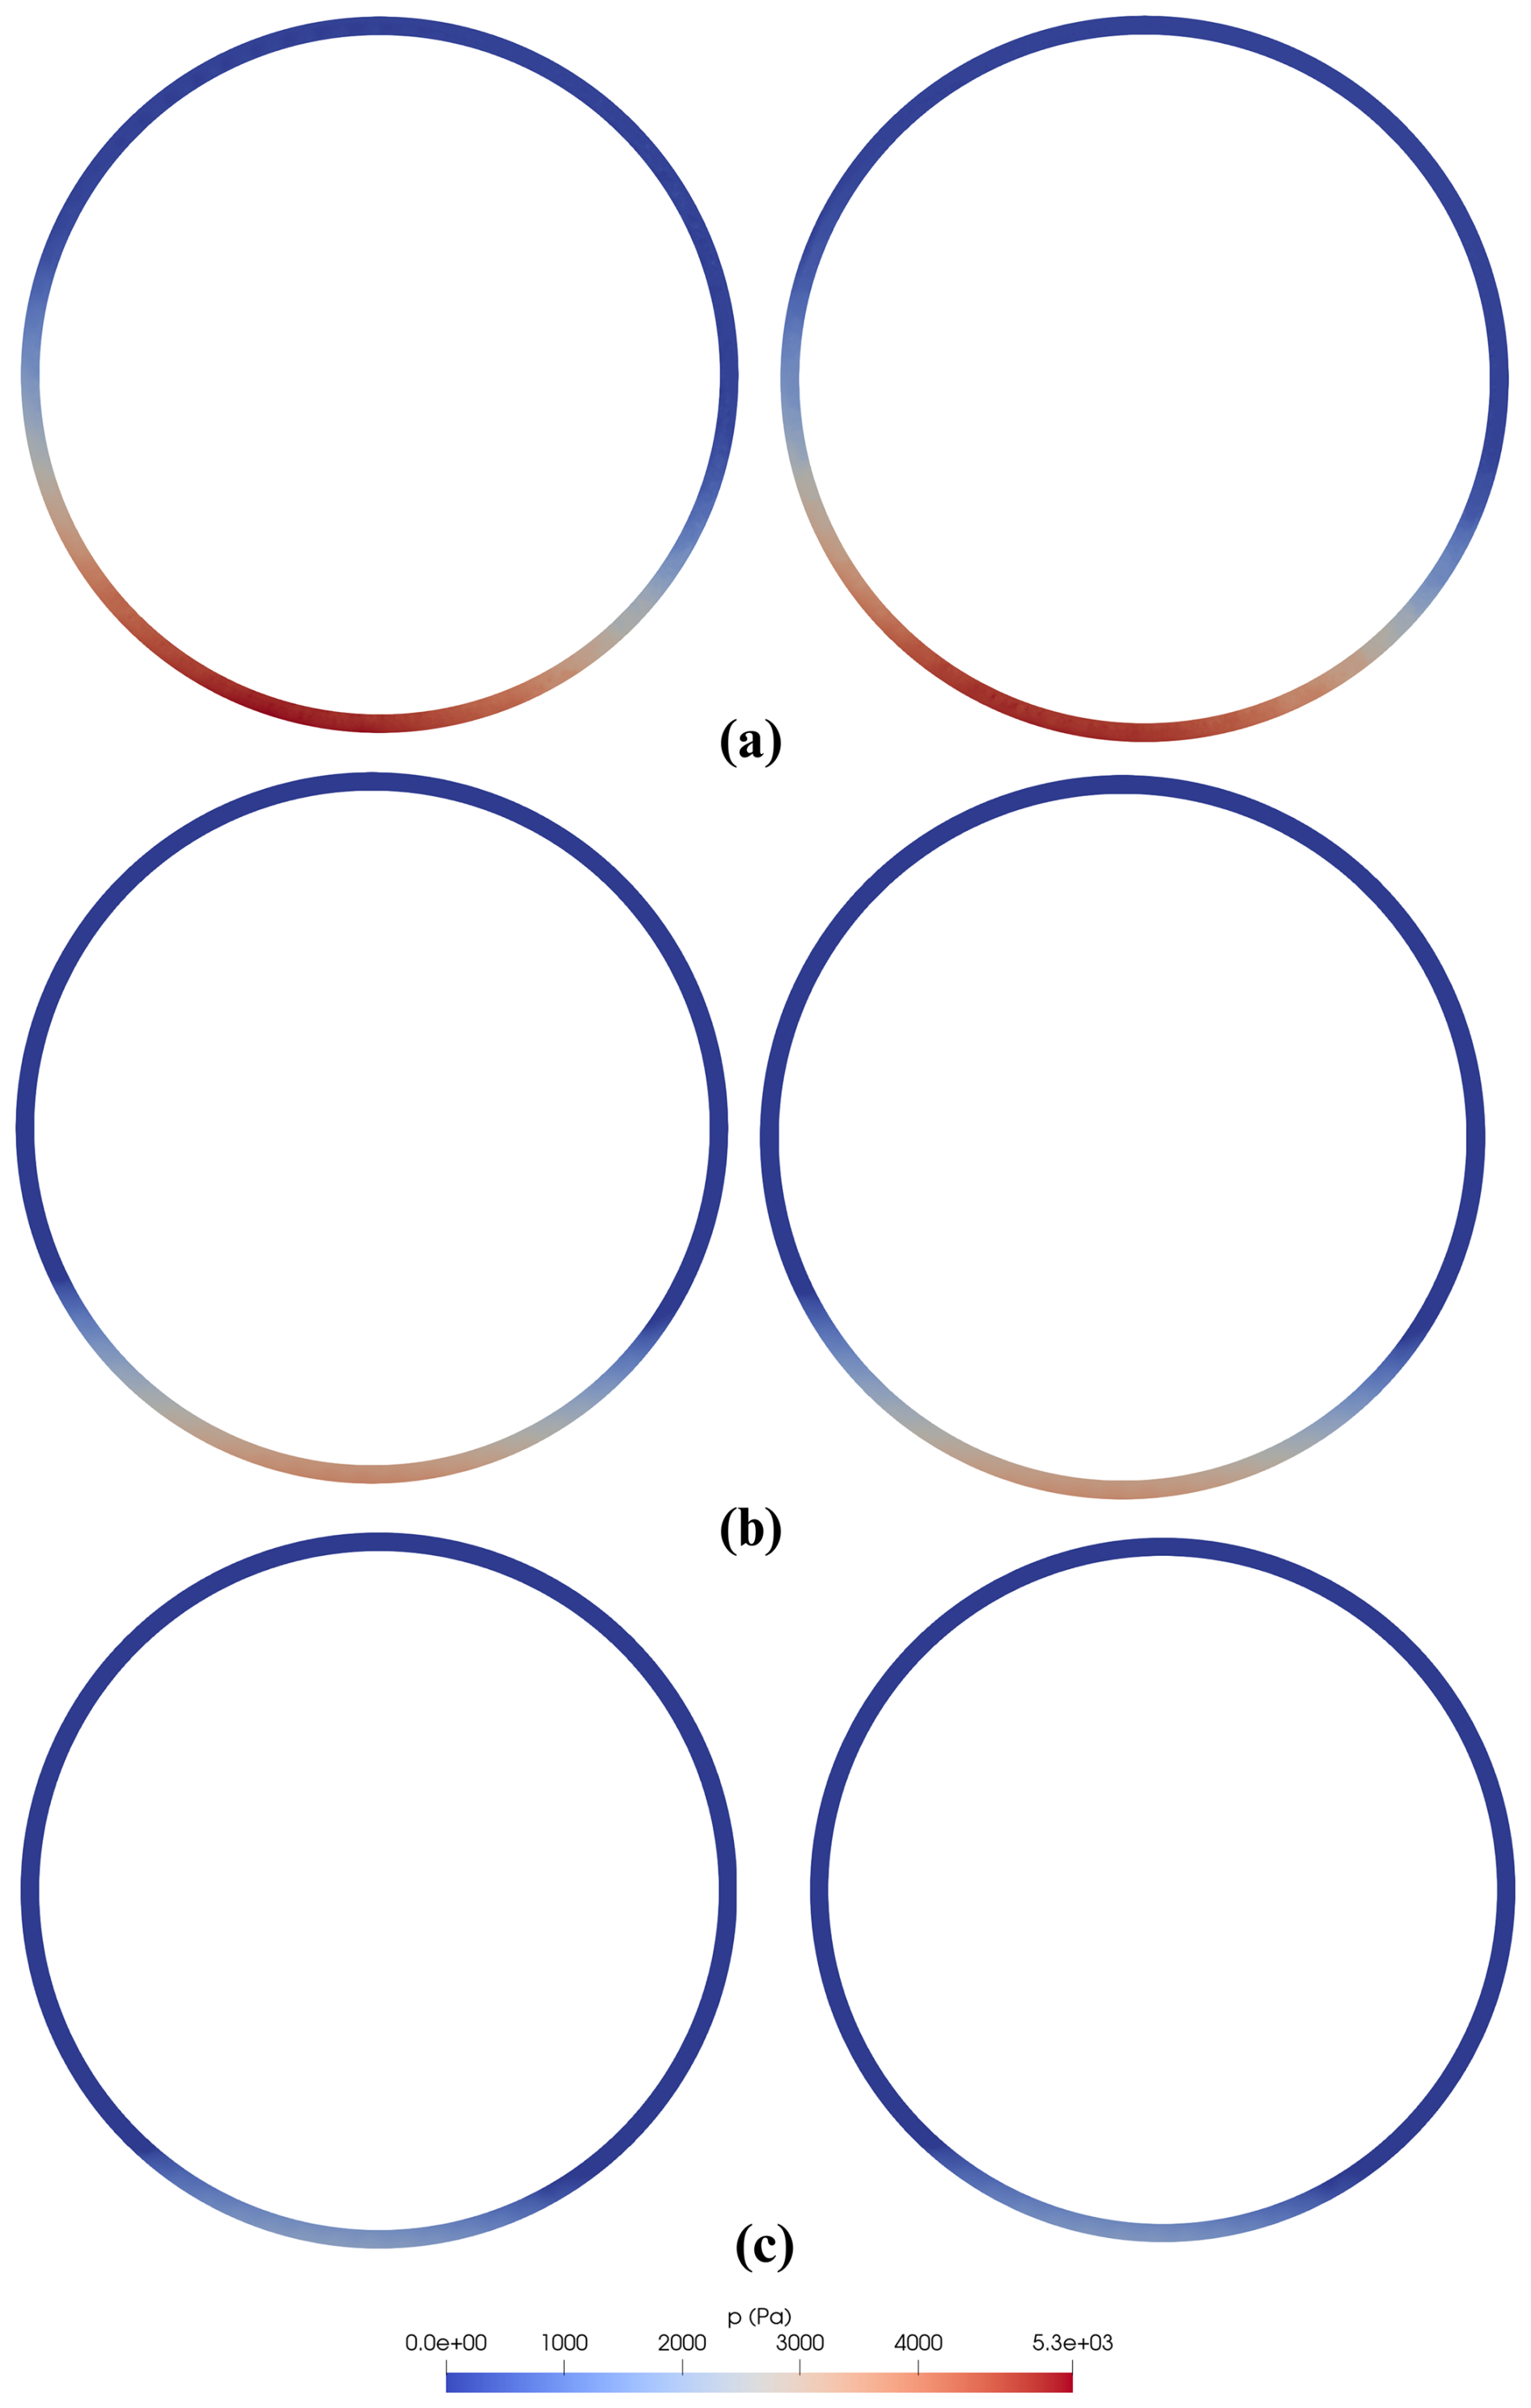
Figure 25Illustration of pressure fields in MFS (left) and HS (right) seals: (a) 45 %, (b) 35 %, and (c) 21 % grease filling ratios.
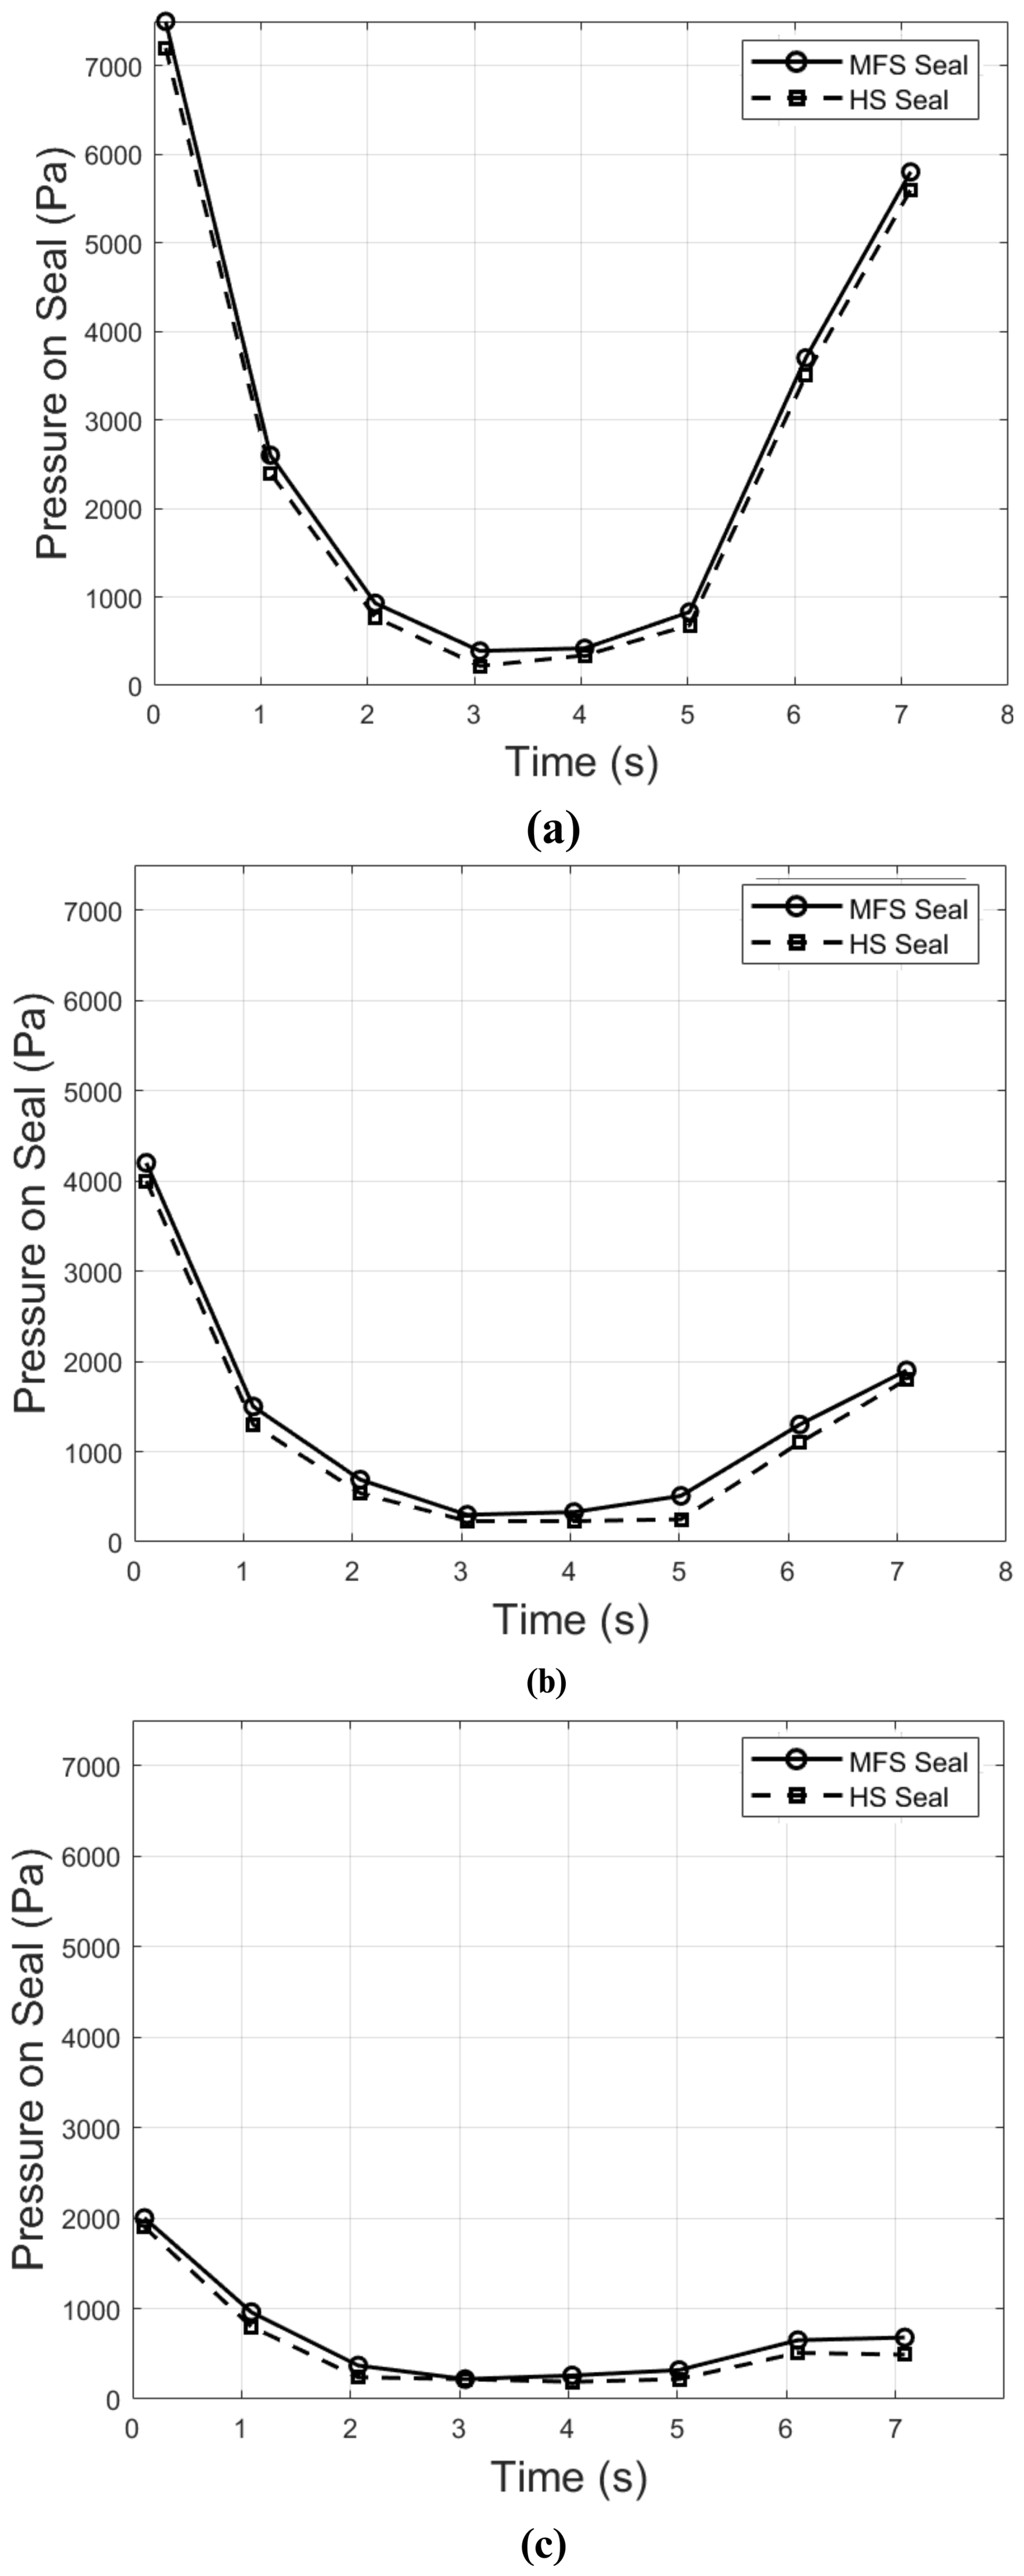
Figure 26Temporal evolution of the maximum total pressure acting on the MFS and HS seals: (a) 45 %, (b) 35 %, and (c) 21 % grease filling ratios.
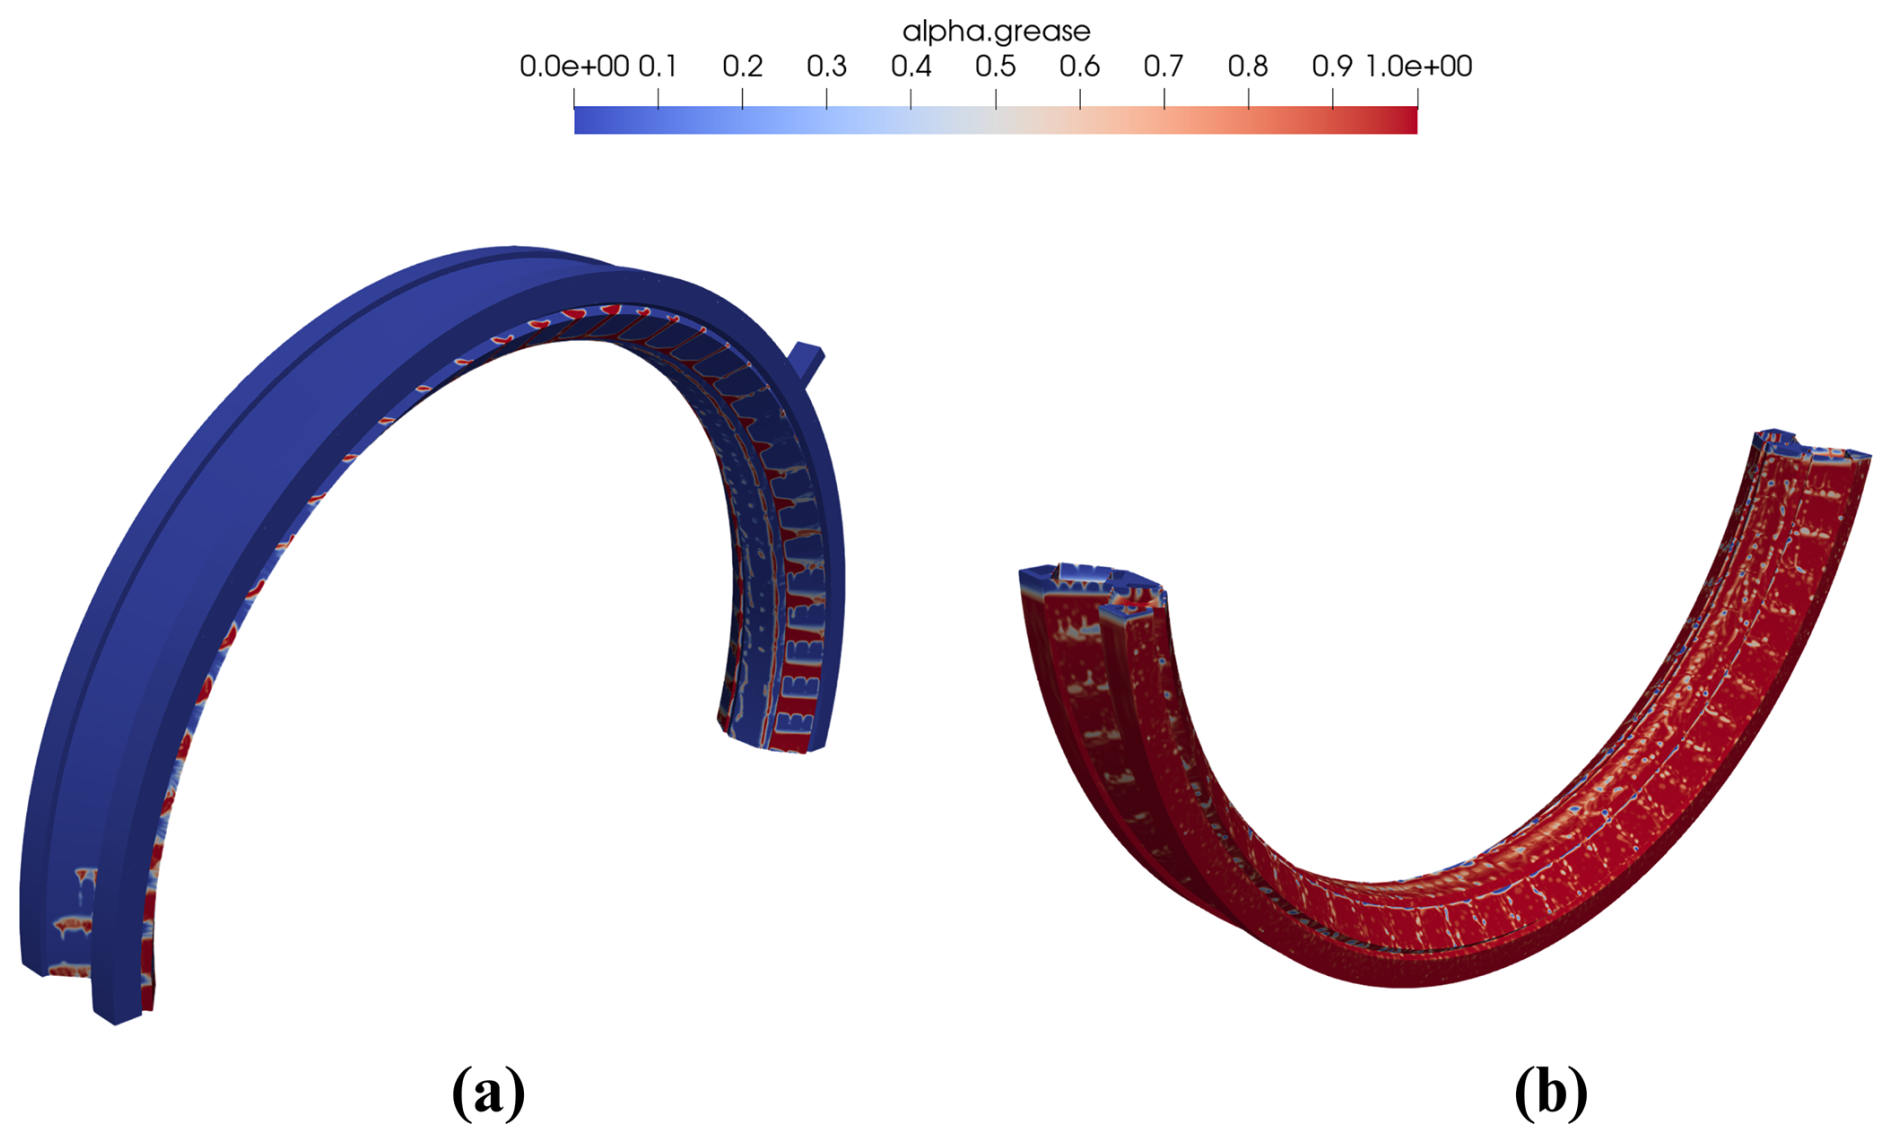
Figure 27Illustration of grease settling behavior for 45 % filling ratio at 40 °C: (a) top part and (b) bottom part.
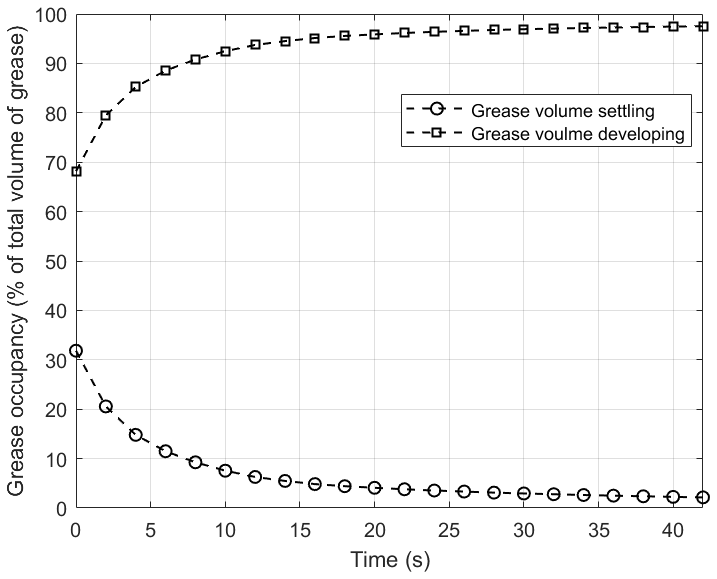
Figure 28Illustration of grease settling behavior for 45 % filling ratio at 40 °C w.r.t. time (s).
3.4 Grease settling behavior
Another important aspect of the lubrication phenomenon inside the bearing is the settling behavior of grease after the bearing stops rotating. To investigate this, a dedicated simulation was performed following the operational scenario described in Sect. 2.7.
The grease distribution across the top and bottom sections of the bearing after 40 s is illustrated in Fig. 27, and the temporal evolution of the settling process is presented in Fig. 28. It is observed that approximately 98 % of the grease volume settled back to the lower region of the bearing within 40 s. It is worth noting that at 40 °C, the kinematic viscosity of the grease decreases to approximately 470 mm2 s−1, which is considerably low for grease. This significant reduction in viscosity facilitates a much faster settling of the grease within the bearing.
The primary objective of this study was to develop a full-scale CFD model of a tilted 41513219 double-row TRB to analyze in detail the behavior of a non-Newtonian lubricant – specifically, grease – under various operating conditions. An extensive 3D hexahedral mesh of the entire bearing geometry was generated in OpenFOAM® using a parametric approach implemented through a custom MATLAB® script. The rollers were scaled down by a factor of 0.98 to prevent the formation of highly skewed cells near the roller–raceway edges. The final mesh comprised approximately 12.5 million cells. A VoF model was employed to accurately capture the interface between grease and air. Grease was treated as a homogeneous non-Newtonian fluid, with its complex rheological characteristics represented using the Herschel–Bulkley formulation.
The developed CFD model successfully captured key lubrication characteristics by simulating bearing behavior at three different grease filling ratios. A detailed analysis of grease distribution within the bearing enabled the identification of critical zones (upper region) prone to grease starvation. The imposed bearing tilt resulted in asymmetric grease distribution between the two rows, leading to greater lubricant accumulation in the MFS row compared to the HS row. Grease fluxes were investigated, revealing both a pumping effect induced by tapered rollers and a squeezing action near the roller-raceway contacts, which together govern lubricant transport within the bearing. Seal pressures were also evaluated to assess the potential risk of grease leakage. The seal of this bearing is designed to withstand a maximum pressure of 0.5 bar. Higher grease filling ratios increase both the pressure magnitude and the spatial extent of the maximum pressurized regions at the seal. The simulated seal pressure is well below this limit.
In this study, simulations were conducted for varying grease filling ratios. The developed model can also be extended to simulate different operating conditions, such as variations in rotational speed and grease rheological properties. Overall, the developed model provides a robust framework for analyzing lubrication behavior in large-scale double-row TRBs and serves as a valuable tool for optimizing lubrication system design which includes inlet–outlet positions, number of inlets–outlets, and flow rates of lubricant. This model can serve as a preliminary screening tool in the presence of seal leakages to evaluate whether pressure rise effects are a plausible cause. A state of the art test rig specifically designed for the main bearings of the wind turbine is in the developing stage which will further enhance the depth of understanding regarding lubrication physics involved in large-size double-row TRBs.
The model and code cannot be shared by the authors with the public.
Conceptualization, MIK, LM, FC; methodology, MIK; software, MIK, LM; validation, MIK; formal analysis, MIK; investigation, MIK; resources, FC; data curation, MIK; writing – original draft preparation, MIK; writing – review and editing, MIK, LM, FC; visualization, MIK; supervision, LM, FC; project administration, FC; funding acquisition, FC. All authors have read and agreed to the published version of the article.
The contact author has declared that none of the authors has any competing interests.
Publisher's note: Copernicus Publications remains neutral with regard to jurisdictional claims made in the text, published maps, institutional affiliations, or any other geographical representation in this paper. The authors bear the ultimate responsibility for providing appropriate place names. Views expressed in the text are those of the authors and do not necessarily reflect the views of the publisher.
The authors gratefully acknowledge the support provided by LEITWIND S.p.A. in carrying out this research.
This research was funded by Piano Nazionale di Ripresa e Resilienza under grant no. DM117 I52B23000570003. The publication of this work is supported by the Open Access Publishing Fund of the Free University of Bozen-Bolzano.
This paper was edited by Yi Guo and reviewed by three anonymous referees.
Aamer, S., Sadeghi, F., Russell, T., Peterson, W., Meinel, A., and Grillenberger, H.: Lubrication, flow visualization, and multiphase CFD modeling of ball bearing cage, Tribol. T., 65, 1088–1098, https://doi.org/10.1080/10402004.2022.2123420, 2022. a
Arya, U., Sadeghi, F., Aamer, S., Meinel, A., and Grillenberger, H.: In Situ Visualization and Analysis of Oil Starvation in Ball Bearing Cages, Tribol. T., 66, 965–978, https://doi.org/10.1080/10402004.2023.2253867, 2023. a
Concli, F., Schaefer, C. T., and Bohnert, C.: Innovative meshing strategies for bearing lubrication simulations, Lubricants, 8, 46, https://doi.org/10.3390/lubricants8040046, 2020. a, b
Feldermann, A., Fischer, D., Neumann, S., and Jacobs, G.: Determination of hydraulic losses in radial cylindrical roller bearings using CFD simulations, Tribol. Int., 113, 245–251, https://doi.org/10.1016/j.triboint.2017.03.020, 2017. a
Gao, P., Tang, W., Cui, Y., Wang, Y., Mo, G., and Yin, J.: Theoretical and Experimental Investigation on Thermal Characteristics of Railway Double-Row Tapered Roller Bearing, Energies, 15, https://doi.org/10.3390/en15124217, 2022a. a
Gao, W., Zhang, S., Li, X., and Liu, Z.: Investigation on the drag effect of a rolling element confined in the cavity of a cylindrical roller bearing, P. I. Mech. Eng. J-J. Eng., 236, 777–785, https://doi.org/10.1177/13506501211026063, 2022b. a
Hart, E., Turnbull, A., Feuchtwang, J., McMillan, D., Golysheva, E., and Elliott, R.: Wind turbine main-bearing loading and wind field characteristics, Wind Energy, 22, 1534–1547, https://doi.org/10.1002/we.2386, 2019. a
Hart, E., Clarke, B., Nicholas, G., Kazemi Amiri, A., Stirling, J., Carroll, J., Dwyer-Joyce, R., McDonald, A., and Long, H.: A review of wind turbine main bearings: design, operation, modelling, damage mechanisms and fault detection, Wind Energ. Sci., 5, 105–124, https://doi.org/10.5194/wes-5-105-2020, 2020. a, b
Hoeprich, M. R.: Grease Performance in Tapered Roller Bearings, World Tribology Congress, 189–190, https://doi.org/10.1115/WTC2005-64352, 2005. a
Hu, J., Wu, W., Wu, M., and Yuan, S.: Numerical investigation of the air–oil two-phase flow inside an oil-jet lubricated ball bearing, Int. J. Heat Mass Tran., 68, 85–93, https://doi.org/10.1016/j.ijheatmasstransfer.2013.09.013, 2014. a
Ishaq Khan, M., Maccioni, L., and Concli, F.: Trends in Lubrication Research on Tapered Roller Bearings: A Review by Bearing Type and Size, Lubricant, and Study Approach, Lubricants, 13, https://doi.org/10.3390/lubricants13050204, 2025. a
Keller, J., Sheng, S., Cotrell, J., and Greco, A.: Wind turbine drivetrain reliability collaborative workshop: a recap, National Renewable Energy Lab.(NREL), Golden, CO (United States), https://doi.org/10.2172/1314863, 2016. a
Khonsari, M. M. and Booser, E. R.: Applied Tribology: Bearing Design and Lubrication, John Wiley & Sons, Hoboken, NJ, https://doi.org/10.1002/9781118700280, 2017. a
Li, M., Lu, F., Bai, X., Zhu, W., and Zhu, R.: Heat-flow coupling variation in double-row tapered-roller bearings during the loss of lubrication process, P. I. Mech. Eng. C-J. Mec., 236, 7500–7510, https://doi.org/10.1177/09544062221075185, 2022. a
Liu, J.: Analysis of tapered roller bearings considering high speed and combined loading, Journal of Tribology, 98, 564–572, https://doi.org/10.1115/1.3452933, 1976. a
Loriemi, A., Jacobs, G., Reisch, S., Bosse, D., and Schröder, T.: Experimental and simulation-based analysis of asymmetrical spherical roller bearings as main bearings for wind turbines, Forsch. Ingenieurwes., 85, 189–197, https://doi.org/10.1007/s10010-021-00462-1, 2021. a
Maccioni, L. and Concli, F.: Computational fluid dynamics applied to lubricated mechanical components: Review of the approaches to simulate gears, bearings, and pumps, Applied Sciences, 10, 8810, https://doi.org/10.3390/app10248810, 2020. a
Maccioni, L., Chernoray, V. G., Bohnert, C., and Concli, F.: Particle Image Velocimetry measurements inside a tapered roller bearing with an outer ring made of sapphire: Design and operation of an innovative test rig, Tribol. Int., 165, 107313, https://doi.org/10.1016/j.triboint.2021.107313, 2022. a
Maccioni, L., Chernoray, V. G., and Concli, F.: Fluxes in a full-flooded lubricated tapered roller bearing: particle image velocimetry measurements and computational fluid dynamics simulations, Tribol. Int., 188, 108824, https://doi.org/10.1016/j.triboint.2023.108824, 2023a. a, b, c
Maccioni, L., Rüth, L., Koch, O., and Concli, F.: Load-Independent Power Losses of Fully Flooded Lubricated Tapered Roller Bearings: Numerical and Experimental Investigation of the Effect of Operating Temperature and Housing Wall Distances, Tribol. T., 66, 1078–1094, https://doi.org/10.1080/10402004.2023.2254957, 2023b. a, b
Maccioni, L., Chernoray, V. G., and Concli, F.: Investigating lubricant behavior in a partially flooded tapered roller bearing: Validation of a multiphase CFD solver for aerated oil sump via particle image velocimetry studies and high-speed camera acquisitions, Tribol. Int., 201, 110274, https://doi.org/10.1016/j.triboint.2024.110274, 2025. a
Mang, T. and Dresel, W.: Lubricants and Lubrication, 2nd edn., Wiley-VCH, Weinheim, Germany, https://doi.org/10.1002/9783527610341, 2007. a
Manjunath, M., Hausner, S., Heine, A., De Baets, P., and Fauconnier, D.: Electrical impedance spectroscopy for precise film thickness assessment in line contacts, Lubricants, 12, 51, https://doi.org/10.3390/lubricants12020051, 2024. a
Marchesse, Y., Changenet, C., and Ville, F.: Drag power loss investigation in cylindrical roller bearings using CFD approach, Tribol. T., 62, 403–411, https://doi.org/10.1080/10402004.2018.1565009, 2019. a
Niemann, G. and Winter, H.: Gears in General, Spur Gears – Fundamentals, Spur Gear Drives, Machine Elements, Springer, Berlin/Heidelberg, Germany, https://doi.org/10.1007/978-3-662-11873-3, 2002. a
OpenFOAM® Foundation: OpenFOAM®: The Open Source CFD Toolbox, OpenFOAM Foundation Ltd., https://www.openfoam.org/ (last access: 15 August 2025), 2024. a
Pirro, D. M. and Wessol, A. A.: Lubrication Fundamentals, 2nd edn., CRC Press, Boca Raton,FL, https://doi.org/10.1201/9781420029239, 2001. a
Russell, T., Sadeghi, F., Peterson, W., Aamer, S., and Arya, U.: A novel test rig for the investigation of ball bearing cage friction, Tribol. T., 64, 943–955, https://doi.org/10.1080/10402004.2021.1953657, 2021. a
Sadeghi, F., Arya, U., Aamer, S., and Meinel, A.: A review of computational fluid dynamics approaches used to investigate lubrication of rolling element bearings, Journal of Tribology, 146, 100801, https://doi.org/10.1115/1.4065663, 2024. a
Santhosh, R., Hee, J. L., Simmons, K., Johnson, G., Hann, D., and Walsh, M.: Experimental investigation of oil shedding from an aero-engine ball bearing at moderate speeds, in: Turbo expo: power for land, sea, and air, vol. 50923, V07AT34A018, American Society of Mechanical Engineers, https://doi.org/10.1115/GT2017-63815, 2017. a
Tong, V.-C. and Hong, S.-W.: Characteristics of tapered roller bearing subjected to combined radial and moment loads, Int. J. Pr. Eng. Man.-GT, 1, 323–328, https://doi.org/10.1007/s40684-014-0040-1, 2014. a
Wen, Y. and Oshima, S.: Oil flow simulation based on CFD for reducing agitation torque of ball bearings, SAE International Journal of Passenger Cars-Mechanical Systems, 7, 1385–1391, https://doi.org/10.4271/2014-01-2850, 2014. a
Wu, W., Hu, C., Hu, J., and Yuan, S.: Jet cooling for rolling bearings: Flow visualization and temperature distribution, Appl. Therm. Eng., 105, 217–224, https://doi.org/10.1016/j.applthermaleng.2016.05.147, 2016. a
Zhu, W., Zhu, R., Tang, X., Lu, F., Bai, X., Wu, X., and Li, F.: CFD-based analysis of oil and gas two-phase flow characteristics in double-row tapered roller bearings with different rib structures, Applied Sciences, 12, 1156, https://doi.org/10.3390/app12031156, 2022. a
This number represents the bearing reference code.