
the Creative Commons Attribution 4.0 License.
the Creative Commons Attribution 4.0 License.
 | 09 Oct 2026
Fatigue crack growth in elastomers for leading-edge erosion protection of wind turbine blades
Jakob Ilsted Bech

Jamie Engelhardt Simon
Fatigue crack growth has been observed as a prominent damage mode in rain erosion of wind turbine blades, where it is driven by cyclic pulse loading from liquid droplet impacts. This study investigates fatigue crack growth in a thermoplastic polyurethane elastomer used for leading-edge protection, linking repeated droplet impacts to controlled cyclic loading in a lab test. The plane strain tensile double-slit test method is employed to determine the actual tearing energy during fatigue crack growth. A new analysis technique evaluates tearing energy throughout the test by tracking strain energy evolution with crack length. A novel test fixture with circular grip faces was developed to ensure efficient gripping of polymer sheets. It is examined how the interval between successive load pulses, the dwell time, affects fatigue crack growth per cycle, denoted as .
The material exhibits pronounced visco-elastic behavior, including cyclic stress softening. It may take several hundred cycles to stabilize, with repeatable stress–strain loops, requiring a run-in period before crack growth assessment. Tests with shorter dwell times need more cycles to reach stabilization. Two dwell times are applied: 0.1 and 1 s. Longer dwell times allow greater recovery between load pulses, reducing cyclic softening. When is plotted against maximum strain, the cracks grow faster at longer dwell times. However, when plotted against tearing energy, the data collapse onto a single curve, indicating that tearing energy governs fatigue crack growth independently of dwell time. Measured crack growth rates span from to mm per cycle, while tearing energies below a threshold of approximately 2100 J m−2 result in significantly lower growth values of to mm per cycle. This testing approach is novel for leading-edge protection materials, and crack growth resistance could become a key parameter in standards, material development, and erosion-safe turbine operation.
- Article
(7633 KB) - Full-text XML
- BibTeX
- EndNote


Polymer-based coatings shield wind turbine blades from UV radiation, moisture, and impacting particles, and they provide a smooth surface, which is essential for aerodynamic efficiency. Leading-edge erosion (LEE) of wind turbine blades, due to impacts with rain droplets and other particles, is a common failure type that causes loss of surface material (Caboni et al., 2025), roughening and degradation of aerodynamic performance (Vimalakanthan et al., 2023), and, in severe cases, exposure of the structural composite (Keegan et al., 2013; Maniaci et al., 2022). The consequences are loss of annual energy production of wind farms (Visbech et al., 2024) and costly repairs (Mishnaevsky et al., 2020). Wind turbine blade coatings are based on polymer resins, with some filler materials (Mishnaevsky et al., 2020), and can be roughly categorized into hard and soft coatings. Hard coatings are typically used as top coatings that cover the entire blades. In contrast, soft coatings are used as leading-edge protection (LEP), because they are generally more energy absorbing and resilient to impact loading from rain droplets and airborne particles. The list of modern LEP systems also includes pre-molded polymer shells and tapes that are typically soft.
The mode of damage and how it initiates, and propagates, varies for different types of leading-edge protection (Maniaci et al., 2022). The durability of LEP systems is often quantified by the so-called whirling arm rain erosion test (RET), in which a rotor, the blades of which are covered by the specific LEP system, rotates at high speed in an artificially generated rain field (DNVGL-RP0171, 2018; Bech et al., 2022). The test is typically designed so that each part of the leading-edge impacts identical measures of rain droplets, whereas the impact speed increases linearly with the radius. For homogeneous coatings that exhibit continuous progressive erosion behavior, the damage initiates where the impact velocity is highest after a certain quantity of impacted rain. In the regions of lower impact speed, the damage initiates later. For these LEP systems, rain erosion can be modeled and analyzed as a fatigue process, where damage accumulates as a linear function of the quantity of impacted rain and a power function of the impact velocity (Eisenberg et al., 2018; DNVGL-RP0573, 2020). Some finite-element-based erosion models employ a similar stress-based damage criterion, assuming a homogeneous material exhibiting a progressive damage behavior (Amirzadeh et al., 2017; Doagou-Rad et al., 2020). This assumption tends to hold for classic hard and brittle coating types. Modern soft LEP materials are typically tough with visco-elastic behavior. These tend to fail in a less predictable manner, dominated by initiation and propagation of local cracks (Kinsley et al., 2025). Rupture in this class of LEP materials may initiate from defects or inhomogeneities and propagate as fatigue cracks (Fæster et al., 2021), as is also the case for blade structures (Riddle et al., 2018).
1.1 Stresses, strains, and fracture upon impact
Upon impact between a droplet and the blade surface, transient stresses occur and propagate in microseconds. By numerical modeling, local strains up to 80 % and strain rates as high as 103 to 106 s−1 are predicted (Adler et al., 1996; Doagou-Rad et al., 2020). The actual magnitude and orientation of stresses imposed by a droplet impact depend on the impact velocity and size of the droplet, and the hyper visco-elastic and acoustic properties of the surface material. Research by Bowden et al. (1961) showed experimentally how a single impact from a high speed water jet can cause fracture. Distinct fracture patterns depended on the material properties. For a hard elastic polymer, they observed ring-shaped cracks at the surface, some distance from the impact center. For rubber and other soft polymers, cracks were observed inside the bulk of the material, below the impact center. For concentric repeated impacts, as in the single point impact fatigue test (SPIFT), similar crack patterns are observed (Fraisse et al., 2018; Johansen, 2020). The fatigue cracks initiate after a number of impacts, the number depending on the impact velocity. The location and orientation of the cracks are also directly linked to the stress patterns regarding the impact on the specific materials. For hard elastic coatings, the ring-shaped cracks initiate at the surface, then propagate at each subsequent impact, in a cone shape into the material. For soft hyper visco-elastic materials, the fatigue cracks initiate inside the material, beneath the impact center, and progress radially in a star-shaped pattern.
For the randomly distributed droplet impacts in rain erosion, an infinitesimal material element will be exposed to transient loads at different magnitudes and orientations (Hu et al., 2021). The position and orientation of the maximum local peak stress will change from one impact to another. In this case, cracks may occur at randomly distributed inhomogeneities and defects, and the distinct crack patterns, as observed in single point impact fatigue, may not be present. In both cases, it is a reasonable hypothesis that crack growth depends on three factors: (1) the rate and magnitude of the transient stresses and strains that are generated by the impacting droplets and controlled by the hyper visco-elastic properties of the impacted material, (2) the position, orientation, and length of existing cracks, and (3) the material's resistance to crack initiation and growth. Evans et al. (1980) presented a fracture-mechanics-based model for droplet impact on an elastic substrate with a crack. They established a criterion to predict whether a crack would propagate upon impact of a spherical liquid projectile, depending on the radius, density, and velocity of the projectile, the crack length, and the elastic modulus and critical crack intensity factor of the impacted material. They defined the “damage threshold velocity” as a function of the abovementioned parameters.
1.2 Time dependencies in crack growth and rain erosion testing
For soft visco-elastic materials, the stresses and strains at impact are time and rate dependent (Jespersen et al., 2023). This may also be the case for the parameters governing crack growth in rate-dependent materials, as demonstrated by Cardwell et al. (1993).
Hoksbergen et al. (2022) explore the Springer model for a range of materials. The Springer model does not account for rate-dependent properties. However, Hoksbergen notes that, for visco-elastic materials, the material data entering the model must be obtained at the relevant high strain rates. Herring et al. (2021) make the Springer analysis based on actual fatigue data. They fit the model with RET data by assuming a correlation between the strain rate and the ultimate strength of the material. Later research by Jones et al. (2023) concludes that the visco-elastic properties, obtained by a DMA test, govern the rain erosion performance. Kinsley et al. (2025) perform RET at different droplet impact frequencies while maintaining the impact speed. They describe a threshold impact frequency below which the LEP shows an elastic high-cycle fatigue damage mechanism, and above which it changes to a brittle low-cycle fatigue behavior.
Using a single point impact fatigue test, Johansen (2020) demonstrates that the number of impacts to crack initiation depends not only on the impact velocity but also decreases with decreasing time interval between impacts. This effect is partly due to hysteresis-induced heating and partly due to the time-dependent recovery between subsequent impacts. Verma et al. (2025) examine similar correlations, applying a pulsating jet type of rain erosion test. They conclude that increased impact frequency results in fewer impacts before the end of incubation occurs. They attribute this to the material recovery effect between successive impacts. They also apply dry intervals, where the test is paused for a period and then resumed. Dry intervals lead to increased lifetime of the coatings, as it is also described by Kinsley et al. (2025) for the whirling arm RET. Time-dependent recovery can be observed directly in the cyclic tensile loading of visco-elastic materials. When cyclic tension load is applied with a constant amplitude of elongation, and the material is not allowed enough time to recover fully between each load cycle, the material gradually loses stiffness, and the load-displacement loop converges after a number of cycles. The work of deformation, or strain energy, is then reduced from the initial cycle to the state where the loops stabilize (Bai et al., 2020). This, known as the Mullins effect, or stress softening, can be either reversible or irreversible. Harbour et al. (2007) examined the effect of pauses for rubber in a plane strain fatigue crack growth test. They applied sequences of loading pulses, with fixed strain amplitudes, separated by pauses, dwell times, and observed that the crack growth rates increased for increased dwell times. It may seem contradictory that increased dwell time leads to longer life in RET (Kinsley et al., 2025; Verma et al., 2025) while it causes increased crack growth rates in fracture mechanics testing (Harbour et al., 2007). However, this is likely because the droplet impact test is load or energy driven, because the impact energy in each successive droplet is constant, whereas the fatigue crack growth test is displacement controlled, and, consequently, stress softening causes the stiffness, maximum load, and strain energy to decrease with increasing cycle number. Dwell times allow the material to recover and the next load sequence will resume at a higher stiffness compared to the later cycles of the previous sequence. In fatigue crack growth testing, the time interval between individual load pulses, the dwell period, can also affect the crack growth rate (Ghosh et al., 2014).
1.3 Fatigue crack growth characterization
The crack growth behavior of materials is studied in the field of fracture mechanics, which correlates crack growth with material properties and loading conditions. The critical energy release rate, Gc, is a material property that determines the energy per area required to propagate a crack. The energy release rate, G, for an elastically loaded specimen with a crack can be equated with the potential strain energy that is released when the crack propagates. The corresponding property for crack growth on thin sheets made of materials such as rubber is often denoted tearing energy, T (Rivlin et al., 1953). The pure shear tensile test, also called the plane strain test with one or two slits, is often used for crack growth testing. The specimen is wide and has a short distance between the grips. Hence the material is constrained from contraction in the width direction. The cracks can grow in steady state because the test specimen, when correctly proportioned, has a stress-free section behind the crack tips and a section of uniform plane strain ahead of the crack tips. From an energy balance analysis Rivlin et al. (1953) shows that the tearing energy is given by
By J integral analysis, Rice (1968) also arrives at J=wh0, where w is the strain energy density in the section of plane strain, and h0 is the initial length of the specimen (distance between grips) in the non-strained condition. T is also used as the load parameter in the plane strain fatigue crack growth test (Gent et al., 1964), where for rubber there is a fatigue limit of T, below which the crack growth is negligible (Lake et al., 1965). Cardwell et al. (1993) demonstrated that the strain energy function depends on the loading rate and correlates with the visco-elastic properties.
Thus, two essential parameters must be determined throughout a fatigue crack growth (FCG) test using the plane strain test setup. One is the lengths of cracks versus the number of cycles. The other is the actual tearing energy imposed during growth of the fatigue cracks. For the latter, the strain energy density in the plane strain zone must be determined. Different approaches are used to measure and calculate the actual strain energy density and tearing energy imposed on the crack during FCG testing. Stadlbauer et al. (2013), using a single-edge notch specimen tension test setup, used the positive part of the area under the force-deflection (FD) curve (the strain energy), the length of the un-cracked ligament, and the initial height to determine the tearing energy. Ghosh et al. (2014) determined the crack growth rate vs. tearing energy curve using a strain energy density function constructed from the loading response of an uncracked specimen. For both methods, edge effects affect the accuracy of the strain energy density determined for the plane strain zone.
For the plane strain tensile test, the grips need to be wide to ensure the plane strain constraint. Rubber-like materials are difficult to grip because of their softness and the large strains often applied. When using traditional tensile grips with plane jaw faces, the material tends to slip when a tensile strain is applied, because the material contracts in the thickness direction in and near the gauge section. Molded test specimens with beads and specially designed grips are used in some laboratories (Ghosh et al., 2014). However, it is often desirable to test specimens cut from sheet material. For this purpose, a varying grip pressure can be a solution. Kocjan et al. (2023) presented a grip design, clamping a sheet between a knurled cylinder and a semicircular part, allowing for a varying compression ratio along the grip section.
A material's resistance against rain erosion can be characterized by its ability to resist damage initiation and progression and by the rate at which damage propagates once it has initiated (Pugh et al., 2021). Several authors suggest that the rain erosion performance of LEP materials may be correlated with fracture toughness and crack sensitivity (Evans et al., 1980; Keegan et al., 2013; Pugh et al., 2021). In design, testing, and analysis of wind turbine blade structures, fracture mechanics has become a well established field of research (Amirafshari et al., 2021; Ji et al., 2014). Fracture mechanics testing and analysis is also applied to cyclically loaded elastomer materials, such as compounds for tires and drive belts (Sundararman et al., 2009; Ghosh et al., 2014). However, fracture-mechanics-based analysis and mechanical characterization of leading-edge protection for wind turbine blades have not been found in the literature by the present authors. The present paper proposes to introduce fracture mechanics as a novel direction in the analysis and mechanical characterization of leading-edge protection materials and systems for wind turbine blades.
1.4 Motivation and problem statement
Recent literature shows that fatigue crack growth is an important damage mode in leading-edge erosion on wind turbine blades. Several testimonies from partners in the IEA Wind Task 46 and at the annual International Symposium on Leading Edge Erosion indicate that localized cracking, compared to progressive erosion, is becoming an increasingly dominant mode of damage for modern LEP systems. This is also the case for the LEP system examined in the present paper. Rain-erosion testing and subsequent X-ray computed tomography analysis of the eroded sample revealed locally occurring cracks surrounded by virtually undamaged material; see Fig. 1.
In rain erosion, droplets impacting on the surface generate stress waves, which propagate through the material, potentially causing transient opening and closing of the cracks. Under such cyclic loading, cracks may propagate due to the increase in strain energy in the material near the crack tip. The correlations between crack tip loading, and fatigue crack growth rate can be characterized by fracture mechanics testing.
Although fracture mechanics concepts, such as the critical tearing energy threshold for negligible crack growth, are well established for a range of elastomer materials and applications, the corresponding knowledge for leading-edge protection (LEP) systems remains limited. In particular, the influence of loading conditions representative of liquid droplet impact (such as loading rate, dwell period, and load amplitude) on the tearing energy threshold governing fatigue crack growth in modern LEP materials has not been investigated.
The paper therefore introduces a fracture mechanics test to characterize an LEP material. The study investigates the effect of dwell time, load amplitude, and tearing energy on the fatigue crack growth rate in a polyurethane-based LEP material containing pre-existing cracks.
The paper is structured with a methods section (Sect. 2), introducing a novel method for determining the tearing energy T in fatigue crack growth testing, and describing the experimental test setup, design considerations, and data analysis. Section 3 contains the results and related observations and discussion. Section 4 presents the conclusions, perspectives, and suggestions for future work. Appendix A1 provides a list of abbreviations and general nomenclature. It also includes two tables that will be referenced throughout the paper.
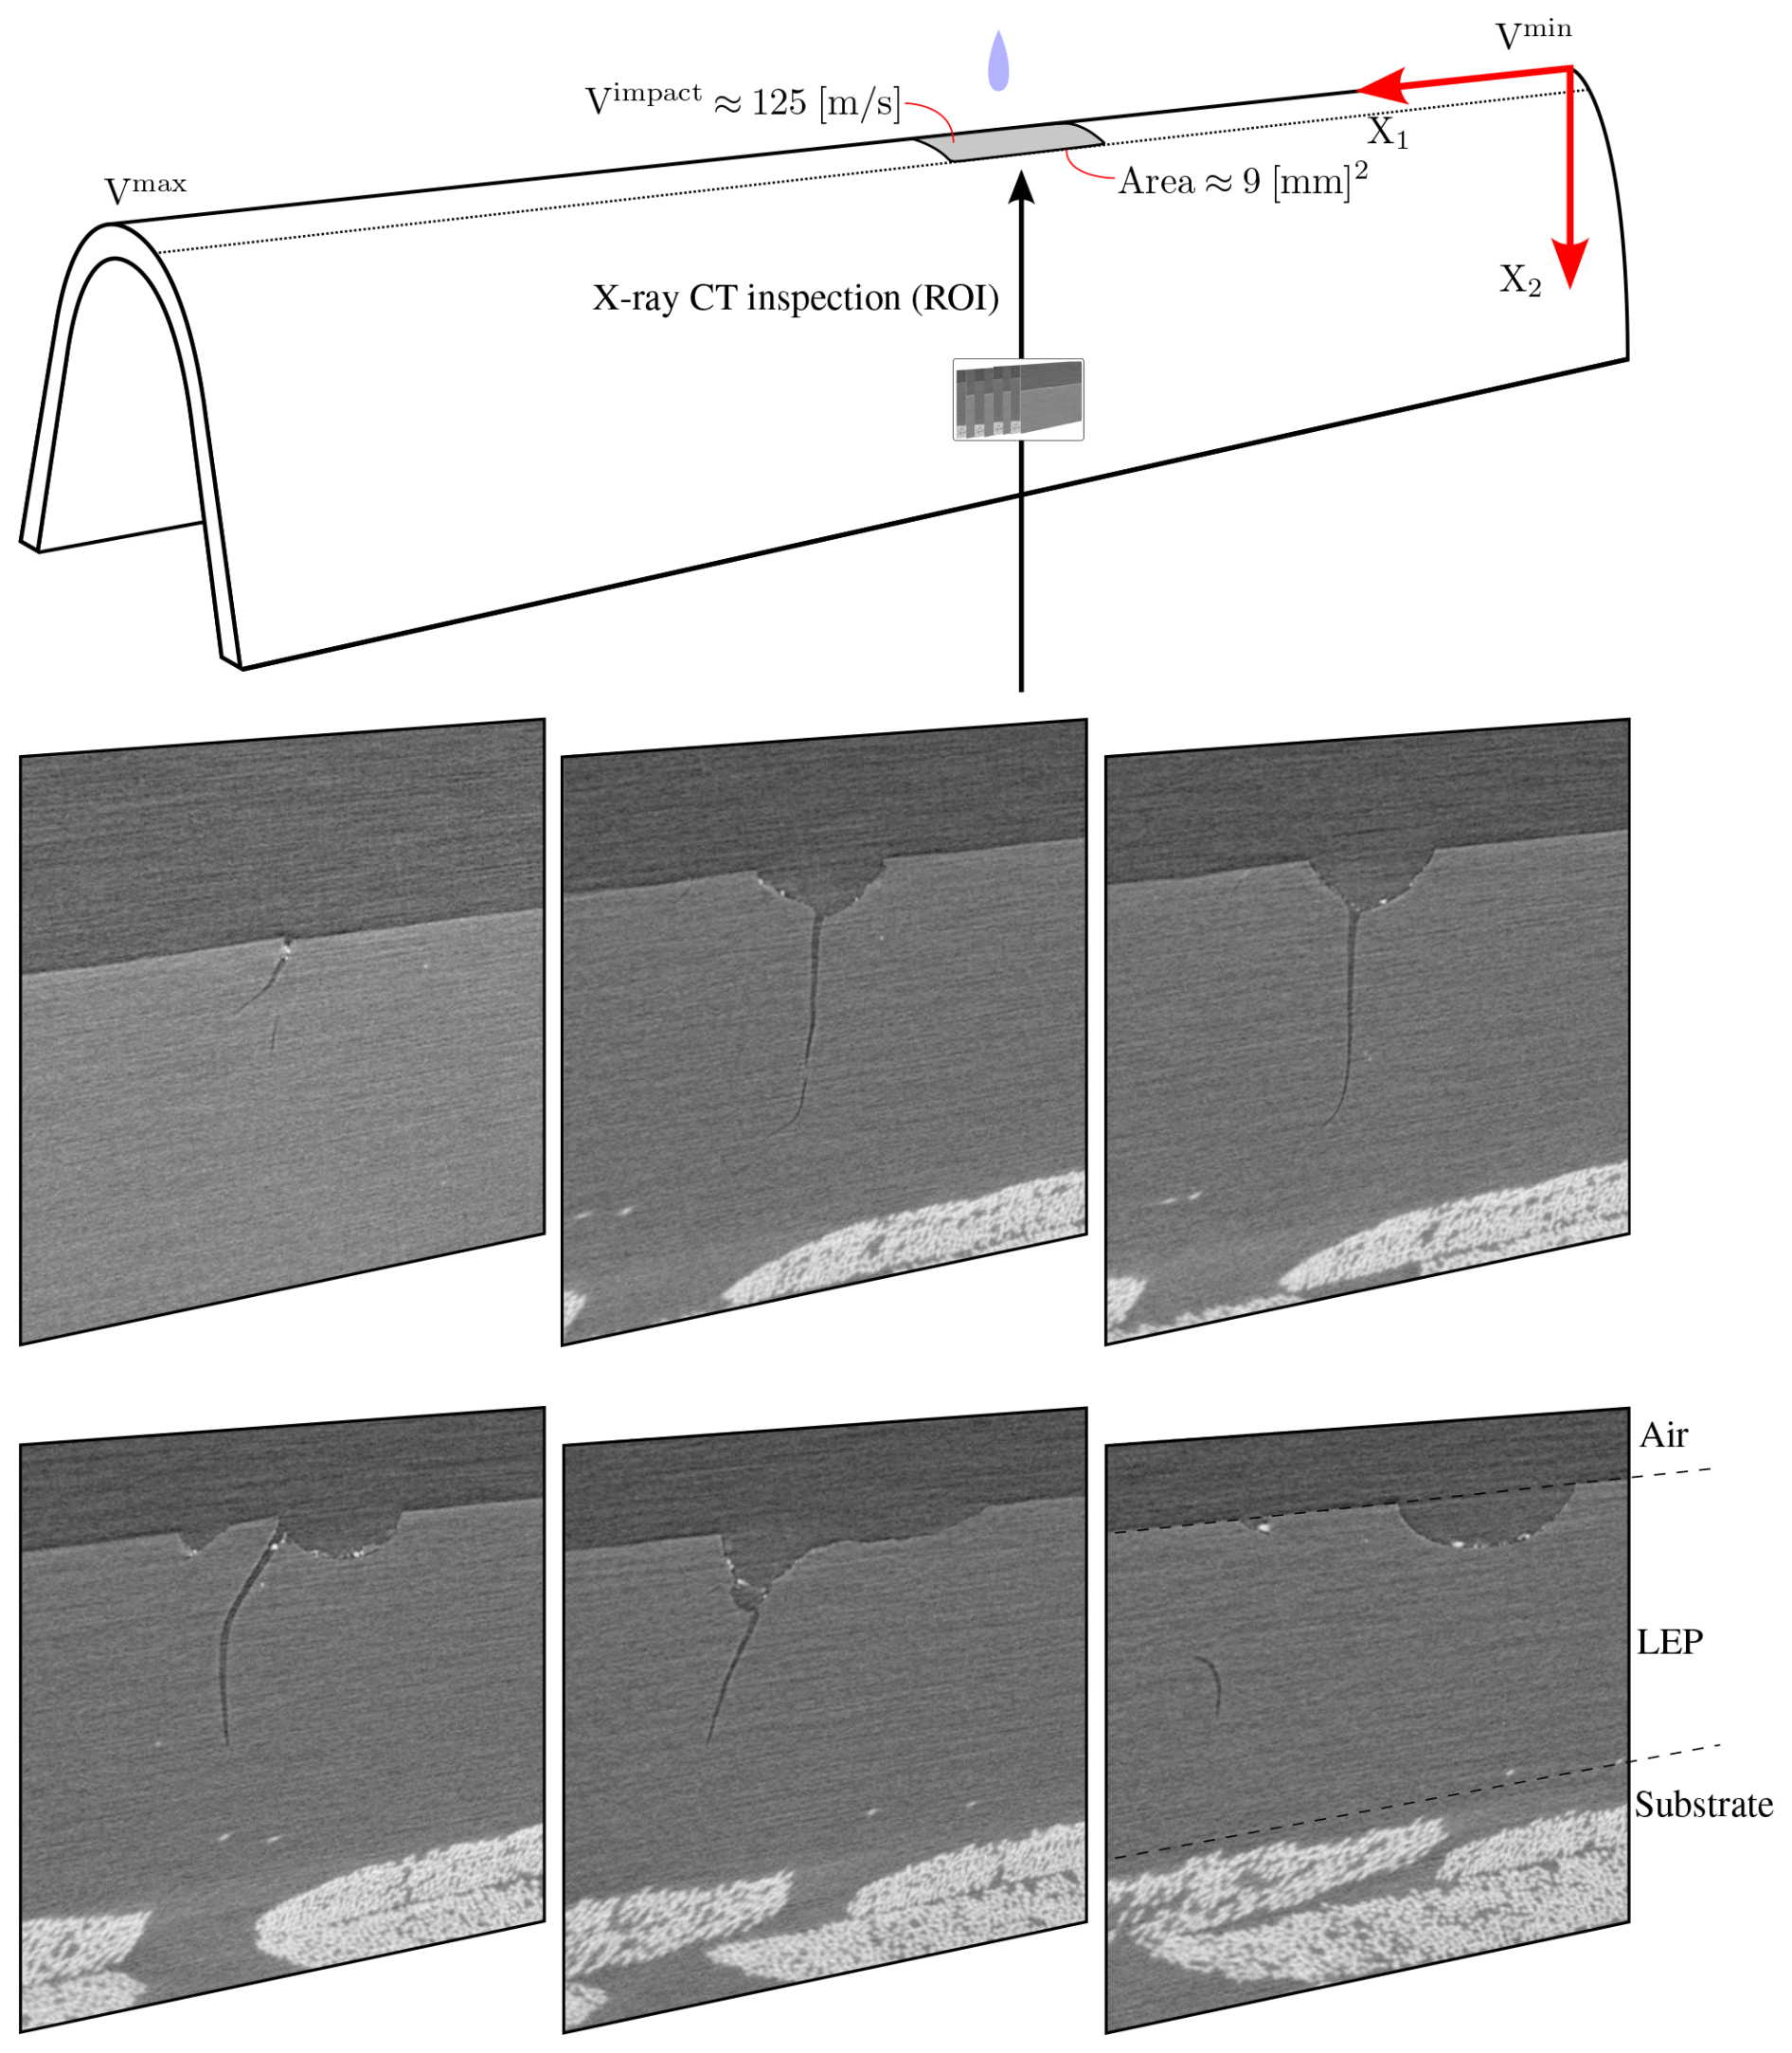
Figure 1X-ray CT (computed tomography) inspection ROI (region of interest) and representative cross-sectional images illustrating spatial crack patterns after RET exposure in a laboratory-scale sample. Please note that the RET-sample is not to scale.
The experiments of the present paper were designed to characterize the cyclic crack growth behavior of an elastomeric polyurethane sheet. A new fixture with semi-circular grip faces was developed to ensure efficient gripping of the elastomer sheet. To account for the loading conditions of rain impact, a pulse loading scheme is applied, where a short pulse is followed by a dwell time before the next loading pulse.
2.1 Determining the tearing energy in fatigue crack growth testing
The plane strain test with two slits, also known as the pure shear test, was chosen for fatigue crack growth (FCG) testing because it emulates steady-state crack growth and simplifies the analysis due to a plane strain zone between the crack tips (Rivlin et al., 1953). A two-slit configuration was chosen because it gives symmetric loading on the fixture and load cell, as well as twice the quantity of crack growth data, , per test. Please consider the setup in Fig. 2. A thin sheet is clamped at the upper and lower edges, where it is constrained from deformation in the horizontal direction or 1-direction. The specimen is shown in the unloaded condition where the cracks are closed, and the dimensions are width l0, length h0, and thickness b0. At the free edges it has slits or pre-cracks of length a1 and a2.
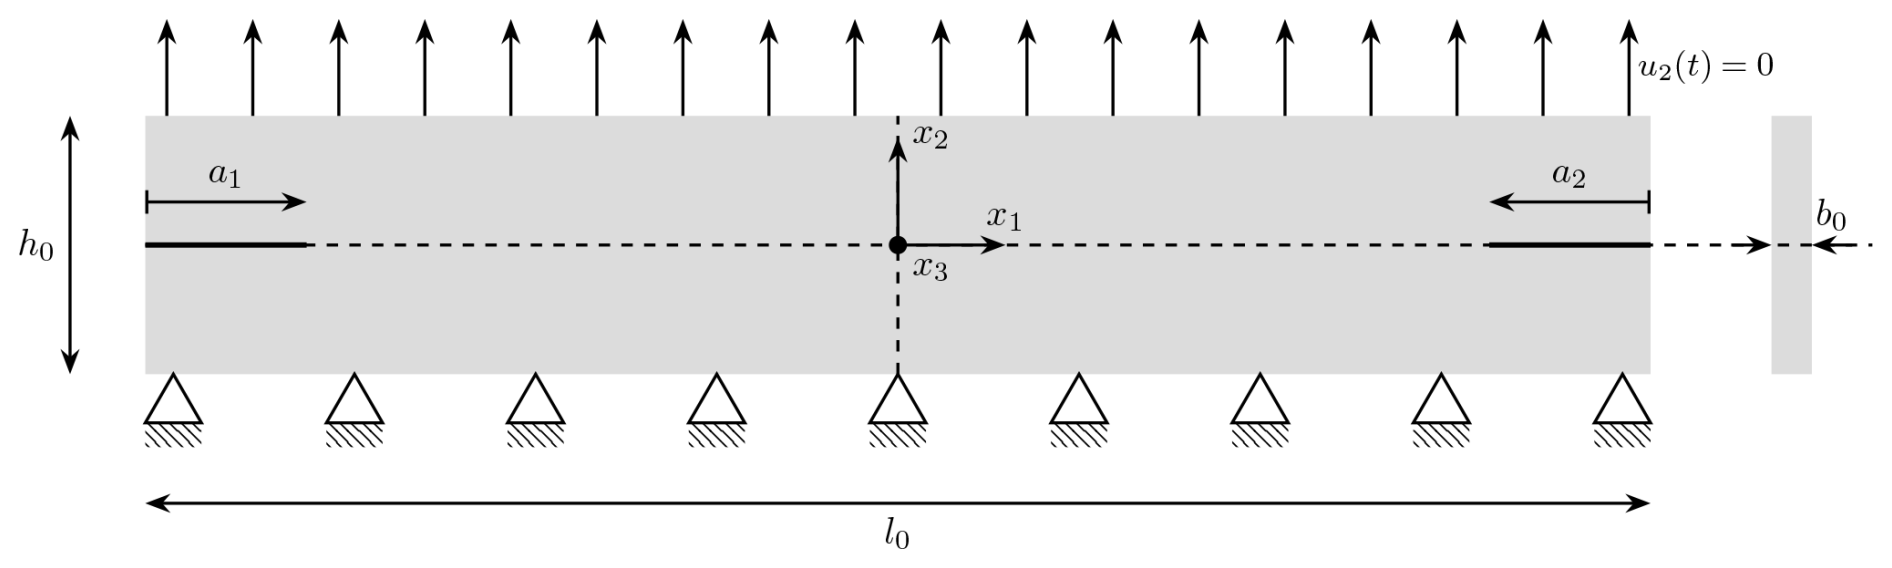
Figure 2Schematic of the unloaded plane strain double-slit tension setup for a thin sheet with l0, h0, and b0 representing the initial width, height and thickness, respectively. The crack lengths are denoted a1 and a2.
In this work, the tearing energy will be determined by comparing two stages of the FCG test, at cycle N and at cycle N+ΔN. In each load cycle, the test specimen is exposed to a uniform displacement u2(t) along the x1, x3 plane at ; see Fig. 3. Three zones, A, B, and C, of different deformation states can be identified. The following assumptions apply to the analysis. (1) The cracks are sufficiently long to leave zone A stress free. (2) The distance between the two crack tips is long enough to have zone C, which is not affected by the strain field near the crack tips. (3) The aspect ratio of zone C is high enough to ensure a uniform plane strain condition in zone C with zero strain in the x1 direction. (4) Each load cycle applies the same elongation u2 to the specimen, and the hysteresis behavior (cyclic stress–strain behavior) is independent of the number of load cycles throughout the analysis.
The strain energy applied to stretch the specimen is divided into two contributions, corresponding to zone B and zone C. So . The strain energy, WC, of the plane strain zone will be determined by following the FCG test from cycle N to cycle N+ΔN. In this interval the two cracks grow by Δa1 and Δa2, and consequently, the width of zone C of plane strain is reduced from LC to , as illustrated in Fig. 3.
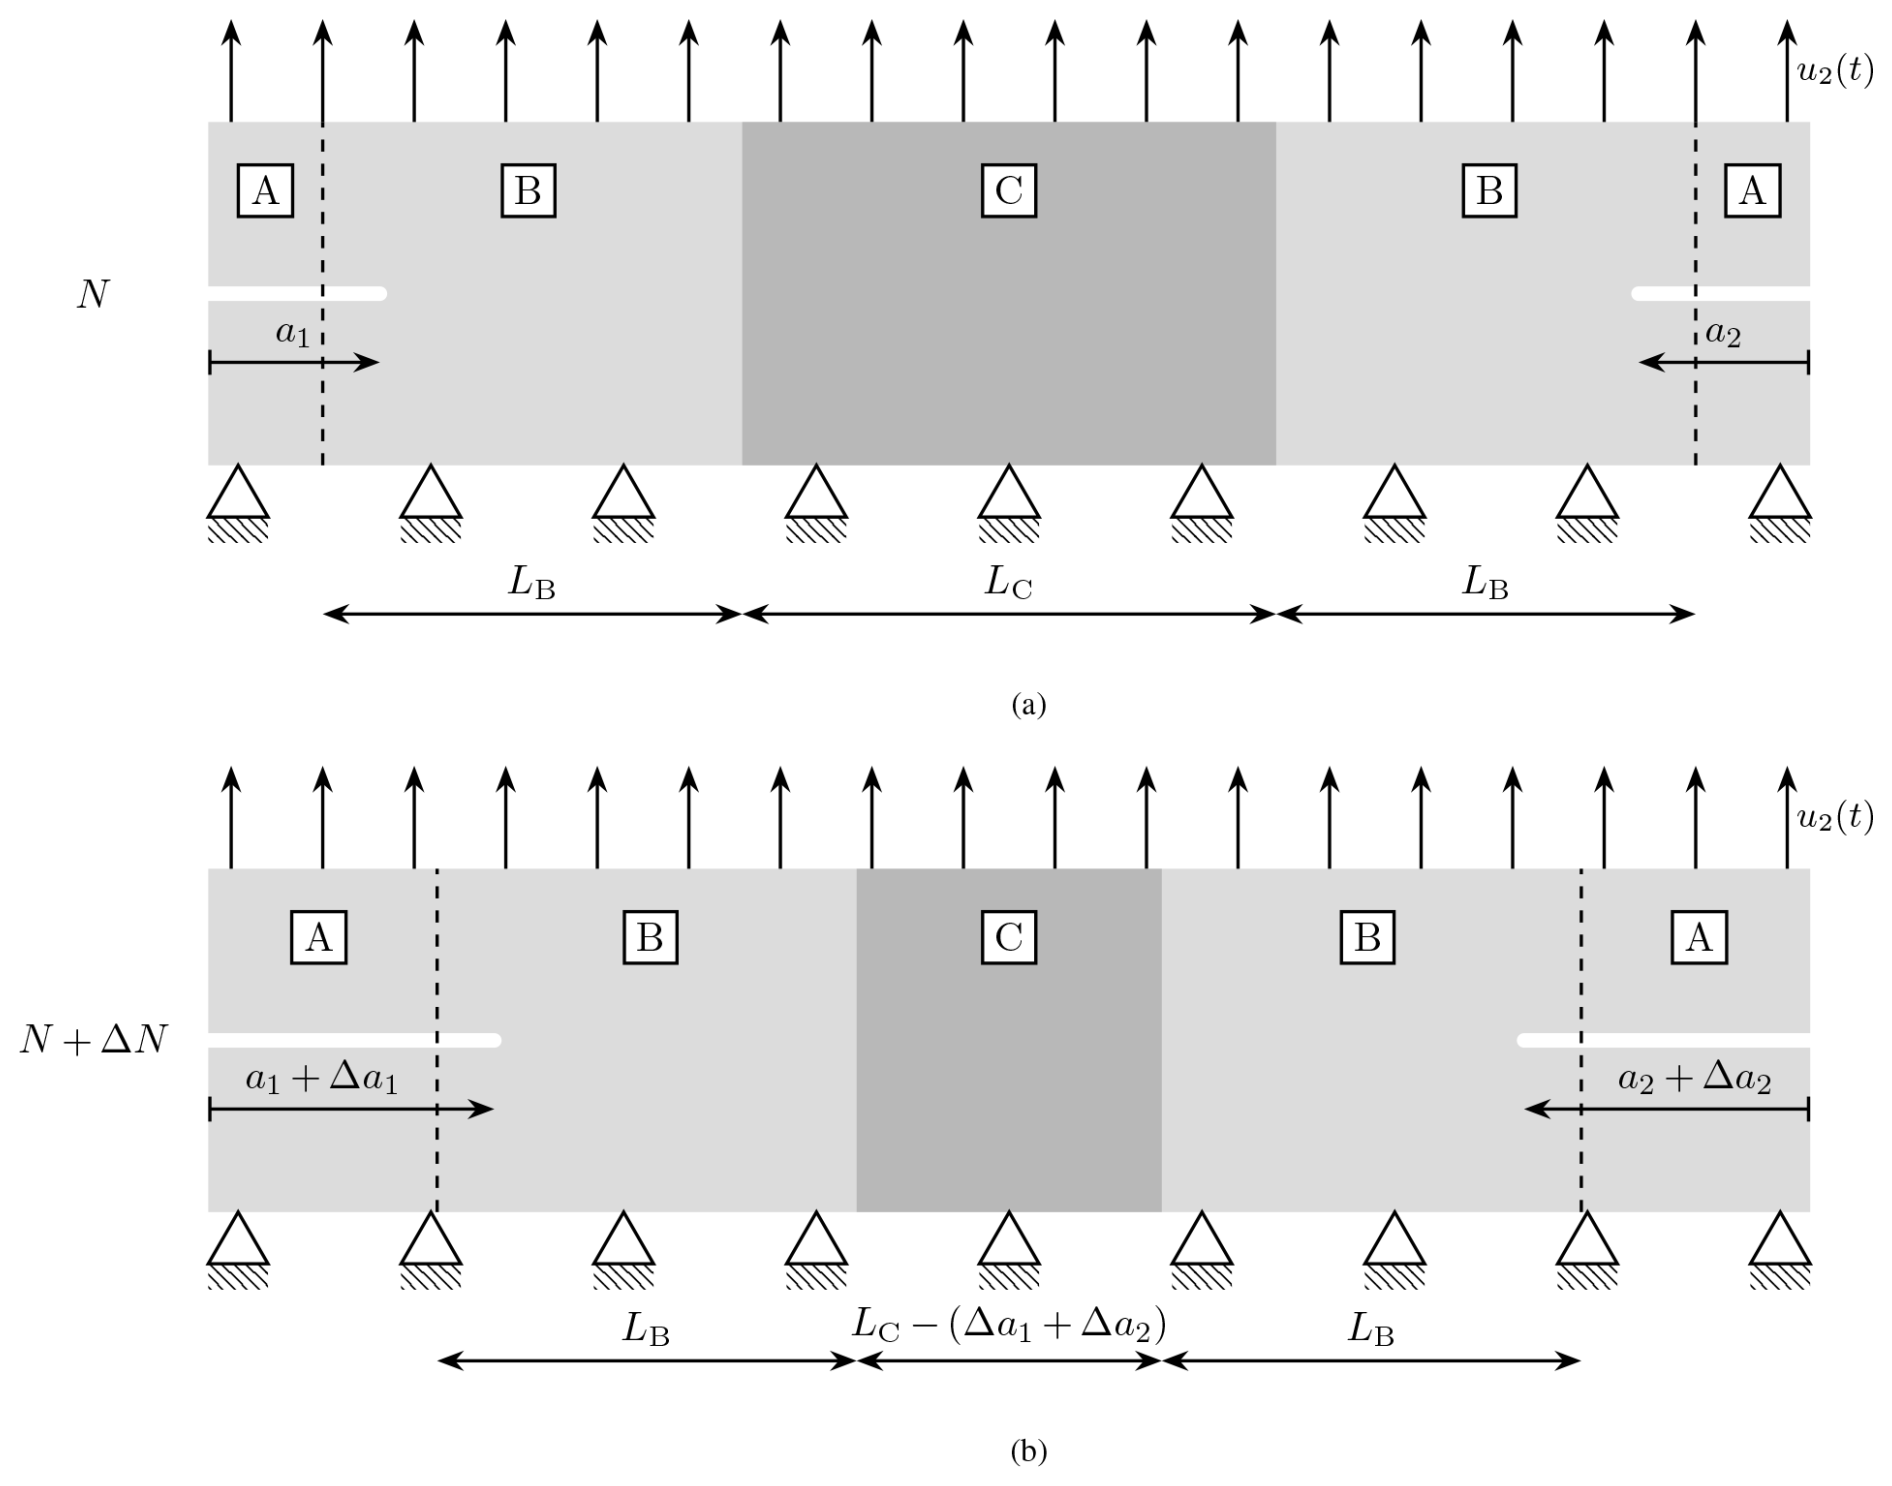
Figure 3Specimen for the plane strain with two-slit test in a loaded condition, where the sheet is exposed to a uniform displacement u2 along the x1,x3 plane at : (a) at cycle N with crack lengths a1 and a2 and (b) cycle N+ΔN with crack lengths a1+Δa1 and a2+Δa2.
As the cracks propagate with increasing cycle count, the remaining ligament between the crack tips decreases; consequently, the load and the work required to stretch the specimen, the strain energy W, decrease proportionally. Zone A is stress-free, and zone B, which includes the complicated stress fields at the crack tip, is identical at both stages. Thus, the change in strain energy from cycle N to cycle N+ΔN corresponds to the contribution of the part of zone C, of width (Δa1+Δa2), which is present in cycle N and has been removed in cycle N+ΔN.
The strain energy contribution of the removed part of zone C is given by , as depicted in Fig. 4.
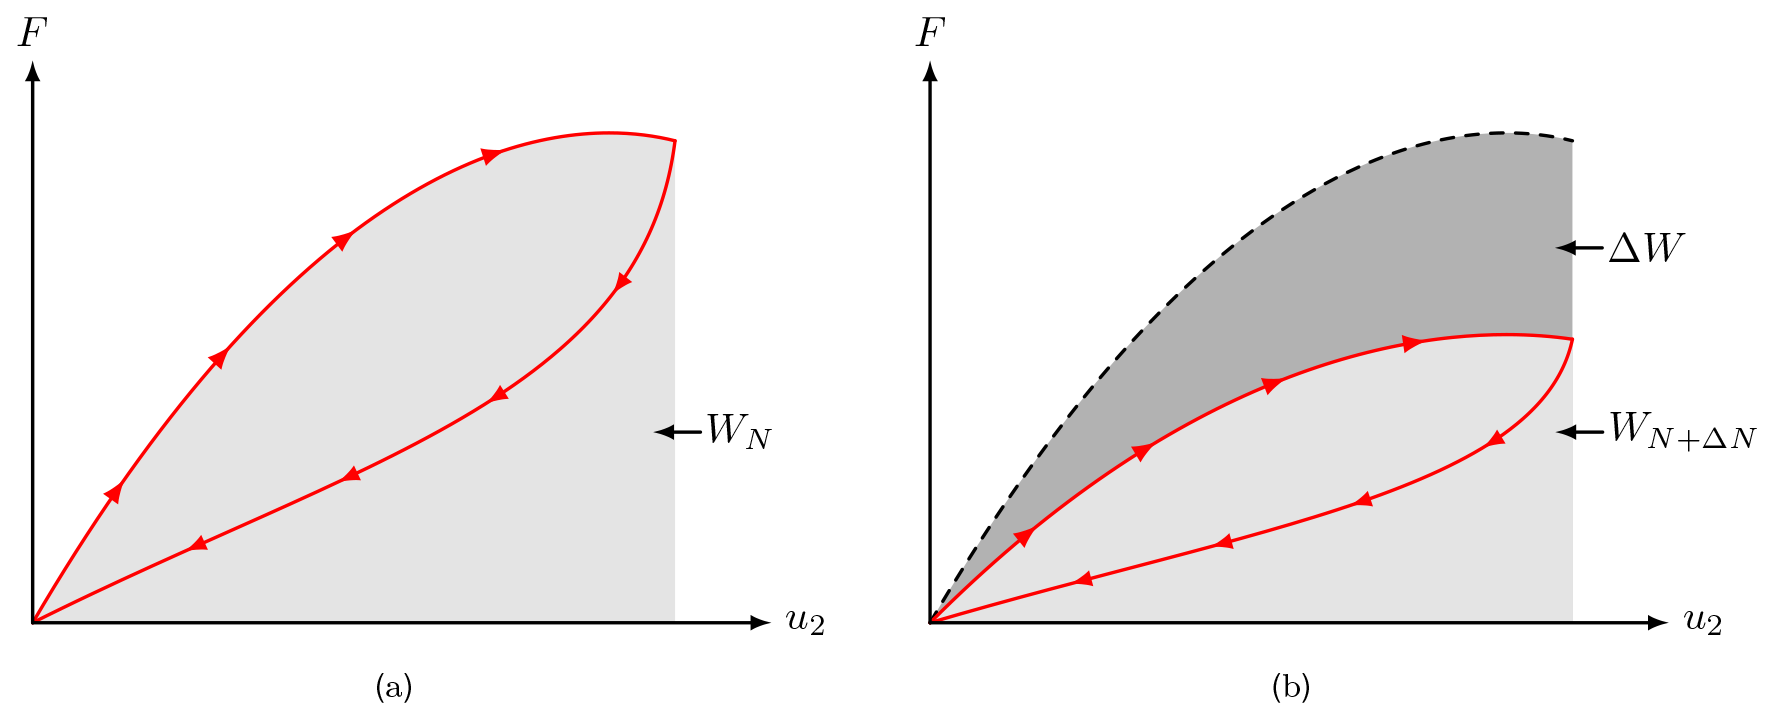
Figure 4Load-displacement curves illustrating the strain energy, which is (a) WN for cycle N with distance between crack tips L and (b) WN+ΔN for cycle N+ΔN with distance between crack tips L−ΔL.
In cycle N, the strain energy is
The contribution from zone C is
where w is the strain energy density in zone C. While WB remains constant, in cycle N+ΔN, the contribution to the strain energy of zone C is reduced to . The difference in strain energy from cycle N to cycle N+ΔN can now be written
Isolating w and inserting it in Eq. (1) yields
Equation (5) will be used to determine T in the FCG test.
2.2 Experimental test setup, design considerations, and sample preparation
The test fixture designed for the present study adapts to the concept of partially circular grip faces as illustrated in Fig. 5. The inner grip face is 90° of a cylinder with radius ri=11.5 mm. Its concave counterpart has a slightly larger radius, ro, leaving space for the test material between the two. The grip pressure at 90° is determined by the tension of the bolts, whereas at 0° the specimen is restricted by the geometry of the fixture and compressed to fit in the gap ro−ri, which is approximately two-thirds of the specimen thickness. The tests reported in this paper were conducted using a prototype fixture manufactured by 3D printing in PLA plastic.
The fixture was mounted in an Instron E3000 electro-pulse test machine. The test specimens were cut into rectangular shapes of 80×46 mm. Precuts of 15 mm in length were cut with a doctor's blade. The specimens were clamped in the test fixture shown in Fig. 5. The fixture design enables a gripping zone of 80 mm width, and the gripping mechanism maintains grip even at high strains and substantial contraction in the thickness direction. The specimens were clamped in the full width. The initial free length between the grips was 10 mm.
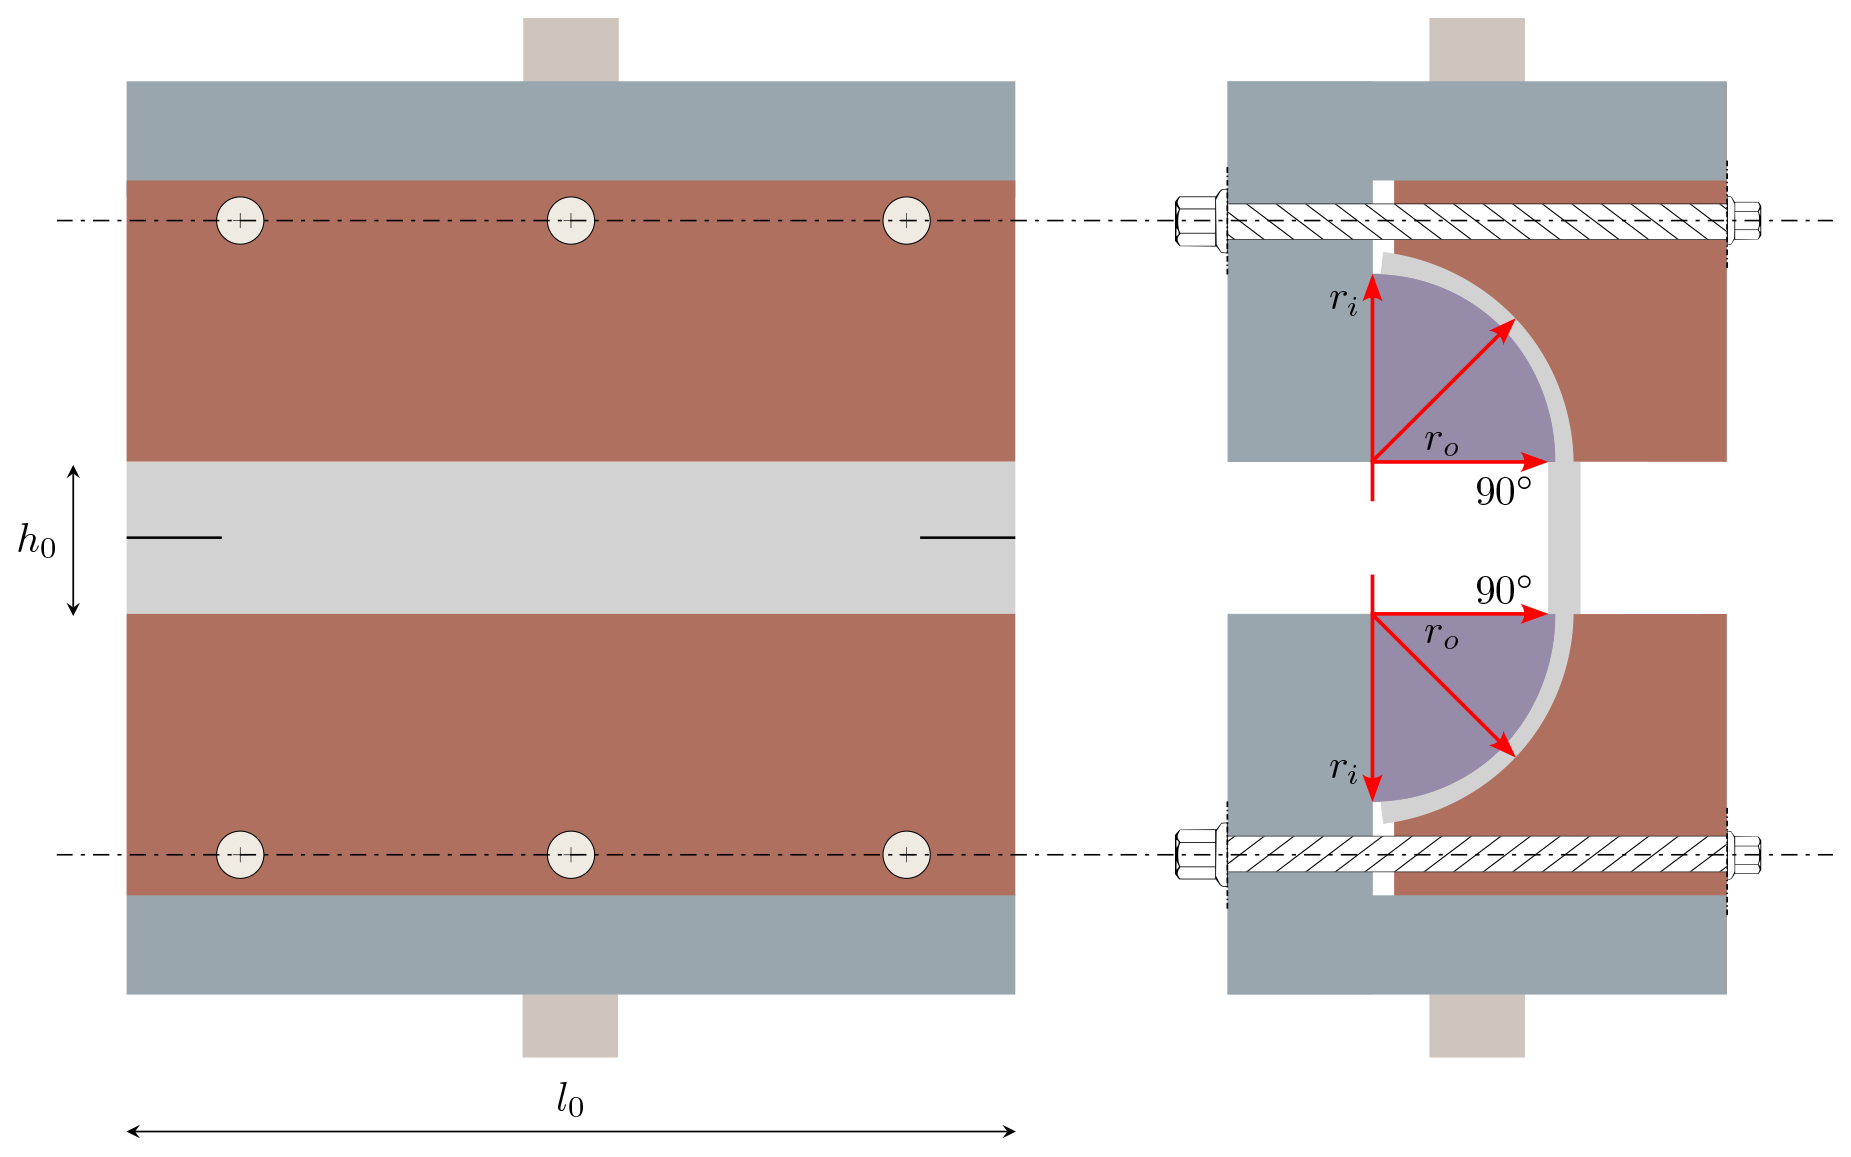
Figure 5Graphical and conceptual representation of the grip design: front view and side view.
2.3 Specific impact frequency and loading conditions
In rain erosion, the specific impact frequency (ASTM G73), , is a factor indicating the frequency of impacts per projected area, a, of an impacting liquid body of volume, b. In a rain field with evenly distributed spherical droplets of diameter, d, the specific impact frequency, fi, is calculated by Eq. (6).
where Vimpact is the impact velocity of the droplet relative to the exposed body. The volume concentration of liquid in a rain field, Ψ, is obtained from the rainfall rate, , and the terminal falling velocity of the droplet, Vdroplet, as
In the crack growth test, the period between successive droplet impacts is simulated by applying a dwell time, td, between load pulses. The dwell time was chosen based on impact frequencies computed from data, using the findings from Bech et al. (2018, 2022) (Please see Tables A2 and A3). Although, the characteristic impact period is within the range from 1 to 100 s, the dwell times employed in this study are 0.1 and 1 s. The parameters were chosen due to time constraints and observable differences in stable hysteresis loops.
The displacement control module utilizes a time-dependent sinusoidal displacement profile to simulate the transient impact response between a wind turbine blade and a single water droplet. The waveform is characterized by a pulse time, tp, and a dwell time, td. The minimum-to-maximum displacement ratio is set to zero to replicate a scenario in which the transient stress response from a single droplet impact has fully decayed before the next impact occurs, controlled through ϕ, representing the load-active values of time during the fatigue process.
The displacement profile is given in Eq. (8) and depicted in Fig. 6:
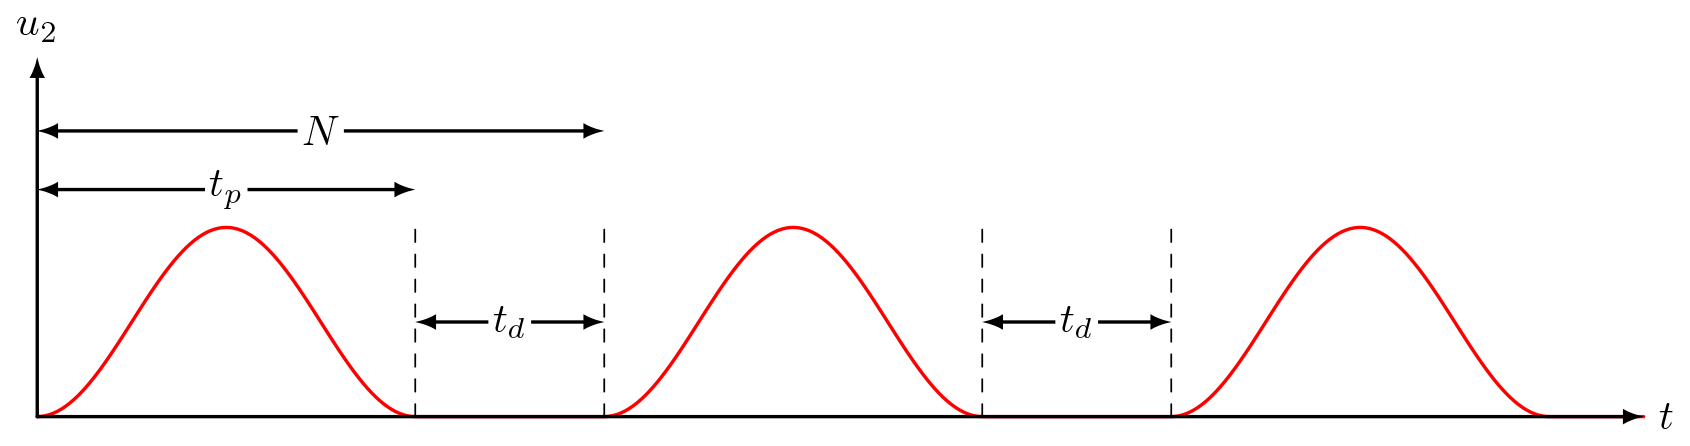
Figure 6Illustrating the cyclic disposition during fatigue loading, programmed into the position control software. The module utilizes a displacement control setting with a load and unload profile described by a sinus function. The parameters td and tp are short for dwell and pulse times, respectively, with N representing a full cycle period.
When the pulse displacement is applied, after a running-in period, the two cracks typically grow at approximately constant and similar rates. During the test, data of load and position peak values, as well as full hysteresis loops, are acquired at regular intervals. In parallel, a digital camera is configured to capture an image of the specimen at the peak displacement and crack opening at set intervals. The test continues until a minimum peak load criterion is reached, typically when the remaining section between the crack tips is reduced to approximately 10–20 mm.
2.4 Analysis of crack growth experiment
The strain energy, W, applied to the specimen during a single cycle, is computed as the integral of the load over the displacement curve from minimum to maximum elongation, at set intervals, during the FCG experiment. The crack lengths, a1 and a2, are determined by measuring the change in pixels from cycle N to N+ΔN, followed by conversion using the pixel-to-millimeter ratio. The work and crack distances are plotted against the number of cycles, as illustrated in Fig. 7a and b. Domain II constitutes the analysis region of interest. This interval is reached when the cracks grow at approximately similar rates, , and the material has reached stable values in terms of . The crack growth rates and tearing energy are determined from the slope in domain II, as seen in Fig. 7b and c.
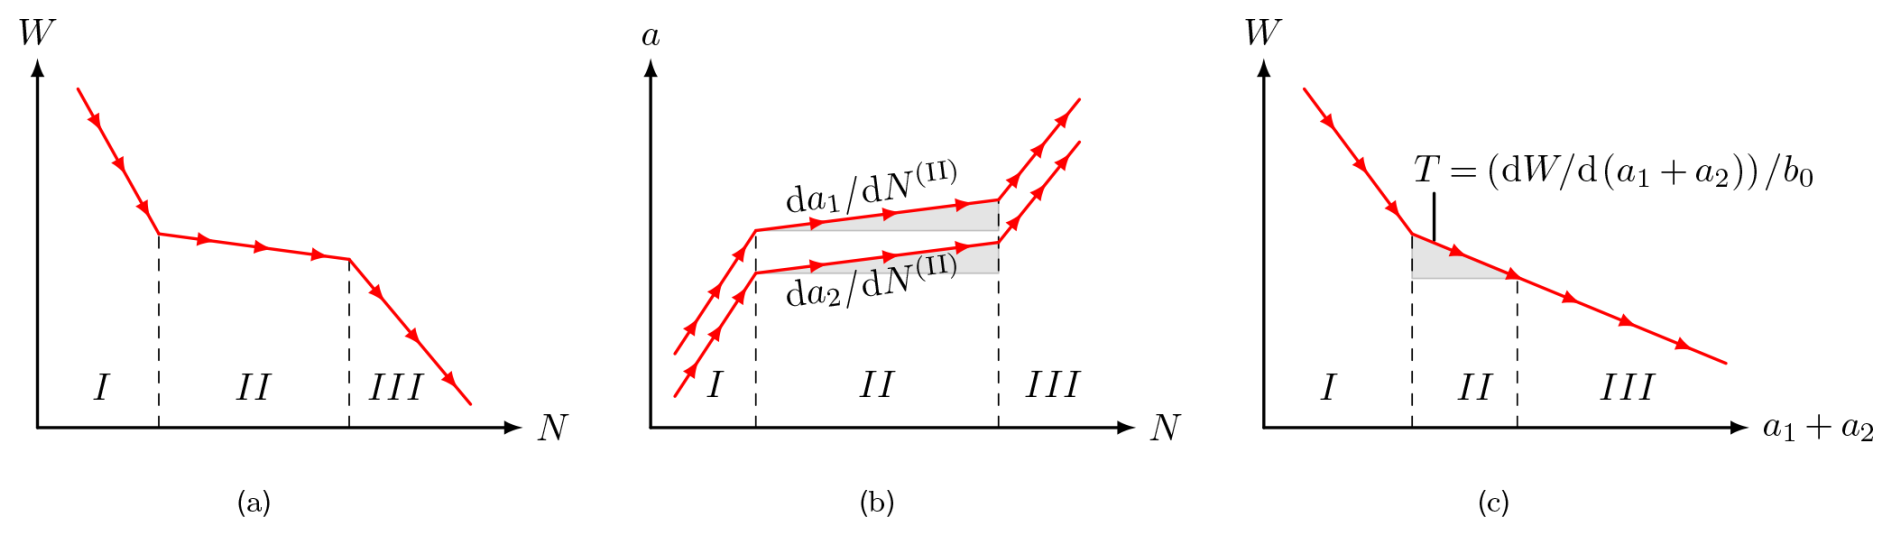
Figure 7Illustrating the determination process for evaluating crack growth rate and tearing energy: (a) strain energy, W, and (b) crack lengths, a1 a2, plotted versus cycle number, N. (c) The tearing energy, T, is determined from the slope in domain II. Domain II constitutes the region where the two cracks grow at approximately equal rates, , and where W is not affected by stress softening.
The current analysis considers an LEP layer with pre-existing cracks, as illustrated in Fig. 1. When droplets impact the surface, stress waves propagate through the material, potentially causing transient opening and closing of the cracks. Under such cyclic loading, a crack may grow by a distance, da, depending on the crack tip loading and the material’s resistance to crack growth.
In this work, the crack growth behavior is characterized in terms of the relationship between the crack growth per cycle, , and the crack tip loading expressed as the tearing energy, T. This relationship is determined experimentally using a cyclic plane strain fatigue test with two slits, in which two cracks are subjected to controlled cyclic loading. A dwell time is incorporated between loading cycles to account for the time-dependent relaxation of the material.
This approach enables direct measurement of as a function of T under conditions relevant to rain erosion. For visco-elastic materials, the stress–strain response depends on the time interval between successive load cycles. On a wind turbine blade, the time between rain droplet impacts varies with rain intensity, droplet size, and blade velocity. By introducing a dwell period in the fatigue crack growth test, this effect is explicitly represented in the experimental methodology.
3.1 The effect of dwell period in cyclic loading
Figures 8 and 9 show, respectively, the load–displacement curves for an un-cracked specimen, illustrating the hysteresis loops of the initial cycle and cycle number 2000, and the corresponding maximum loads as a function of cycle number for different dwell times.
For a dwell time of 0.1 s, the maximum load and strain energy decrease from approximately 221 N and 0.28 J in cycle 1 to 126 N and 0.15 J in cycle 2000; see Fig. 8a. After the test, the material is left to recover for 10 min. Then, a new test sequence is done with a dwell time of 1 s. In the first cycle, the material has almost recovered to its initial state with a maximum load and strain energy of 215 N and 0.27 J, followed by a reduction at cycle 2000 to 171 N and 0.22 J, Fig. 8b. The material is left to recover for an additional 10 min, and the test is repeated with a dwell time of 10 s. Again, the material almost recovers to its original state with a measured maximum load and strain energy of 218 N and 0.28 J, followed by a reduction at cycle 2000 to 211 N and 0.27 J, Fig. 8c. Here, the material almost fully recovers between the successive cycles.
The number of cycles required to stabilize the maximum load decreases with increasing dwell time, indicating that the material's load-carrying capacity (energy uptake) is significantly reduced when insufficient time is allowed for relaxation to happen between successive load cycles Fig. 9a and b. Additionally, the gradient of the load–unload curve from the initial to stabilization phase undergoes a notable change for td=0.1 but not for td=10 s. Moreover, the ability to restore load-carrying capacity and curve shape suggests reversible molecular changes within the rubbery phase of the elastomeric system, attributed to the Mullins effect (Harwood et al., 1965), commonly referred to as stress softening. Most notably, the Mullins effect depends on the dwell time (i.e., the time between two cycles). When the dwell time is reduced to 1 s or 0.1 s, both stiffness and energy density decrease. This dependence shows that the stress-softening response, stiffness, and strain energy density require a run-in period before reaching stable values/conditions, as seen in Fig. 9a and b. The electro-pulse test machine was unable to maintain a constant load amplitude as the specimen stiffness decreased. This is the reason why load cycles with low stiffness result in higher maximum displacement, as seen in Fig. 8a and b.
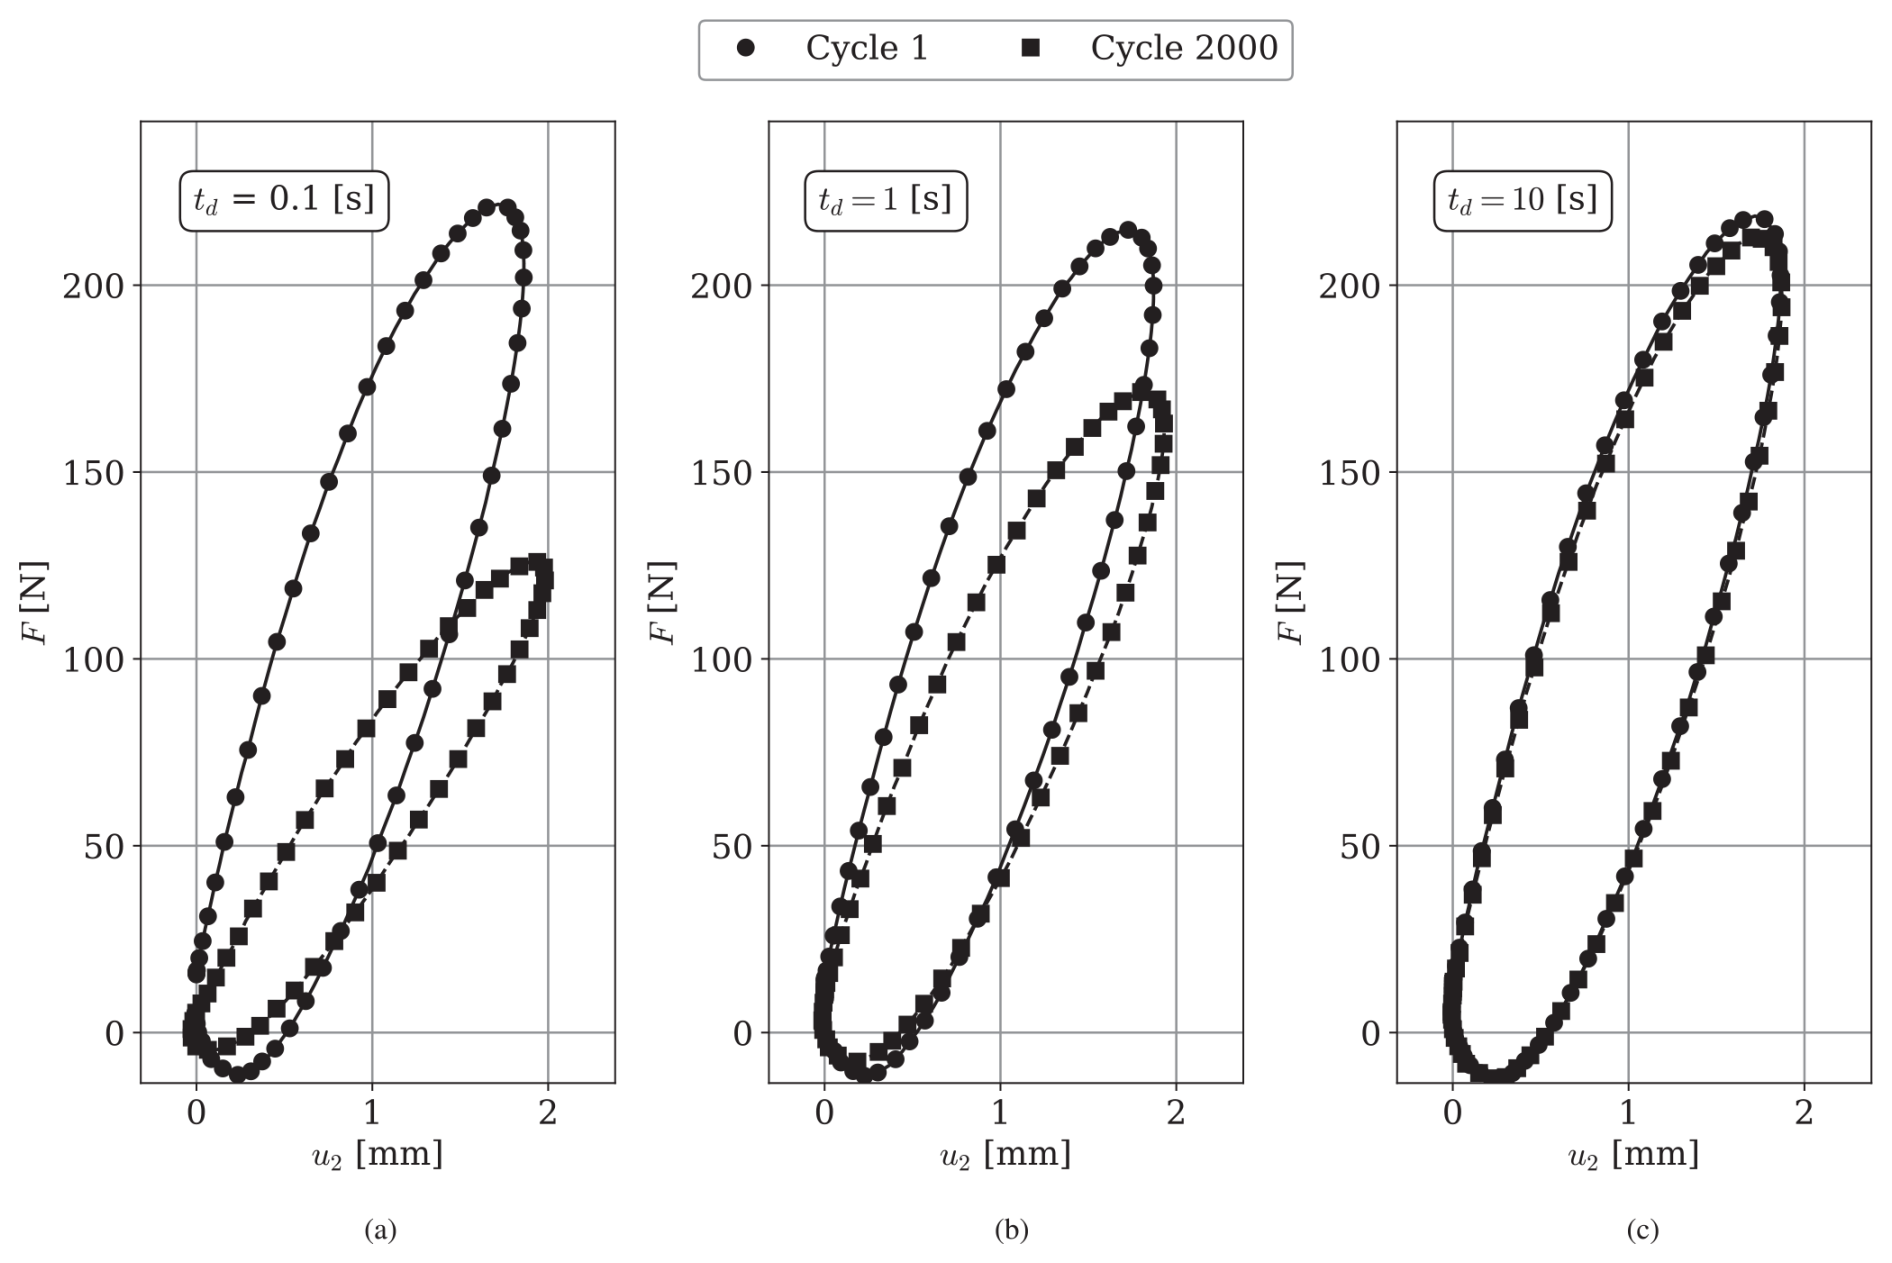
Figure 8Illustration of load-displacement curves for an uncracked specimen under pulsed loading with a pulse time of tp=0.1 s, maximum displacement of u2=1.9–2 mm, and dwell times s for the initial (cycle 1) and (cycle 2000) hysteresis loops. Panels (a), (b), and (c) constitute data from the same sample, which were tested sequentially with a 10 min recovery period between each test.
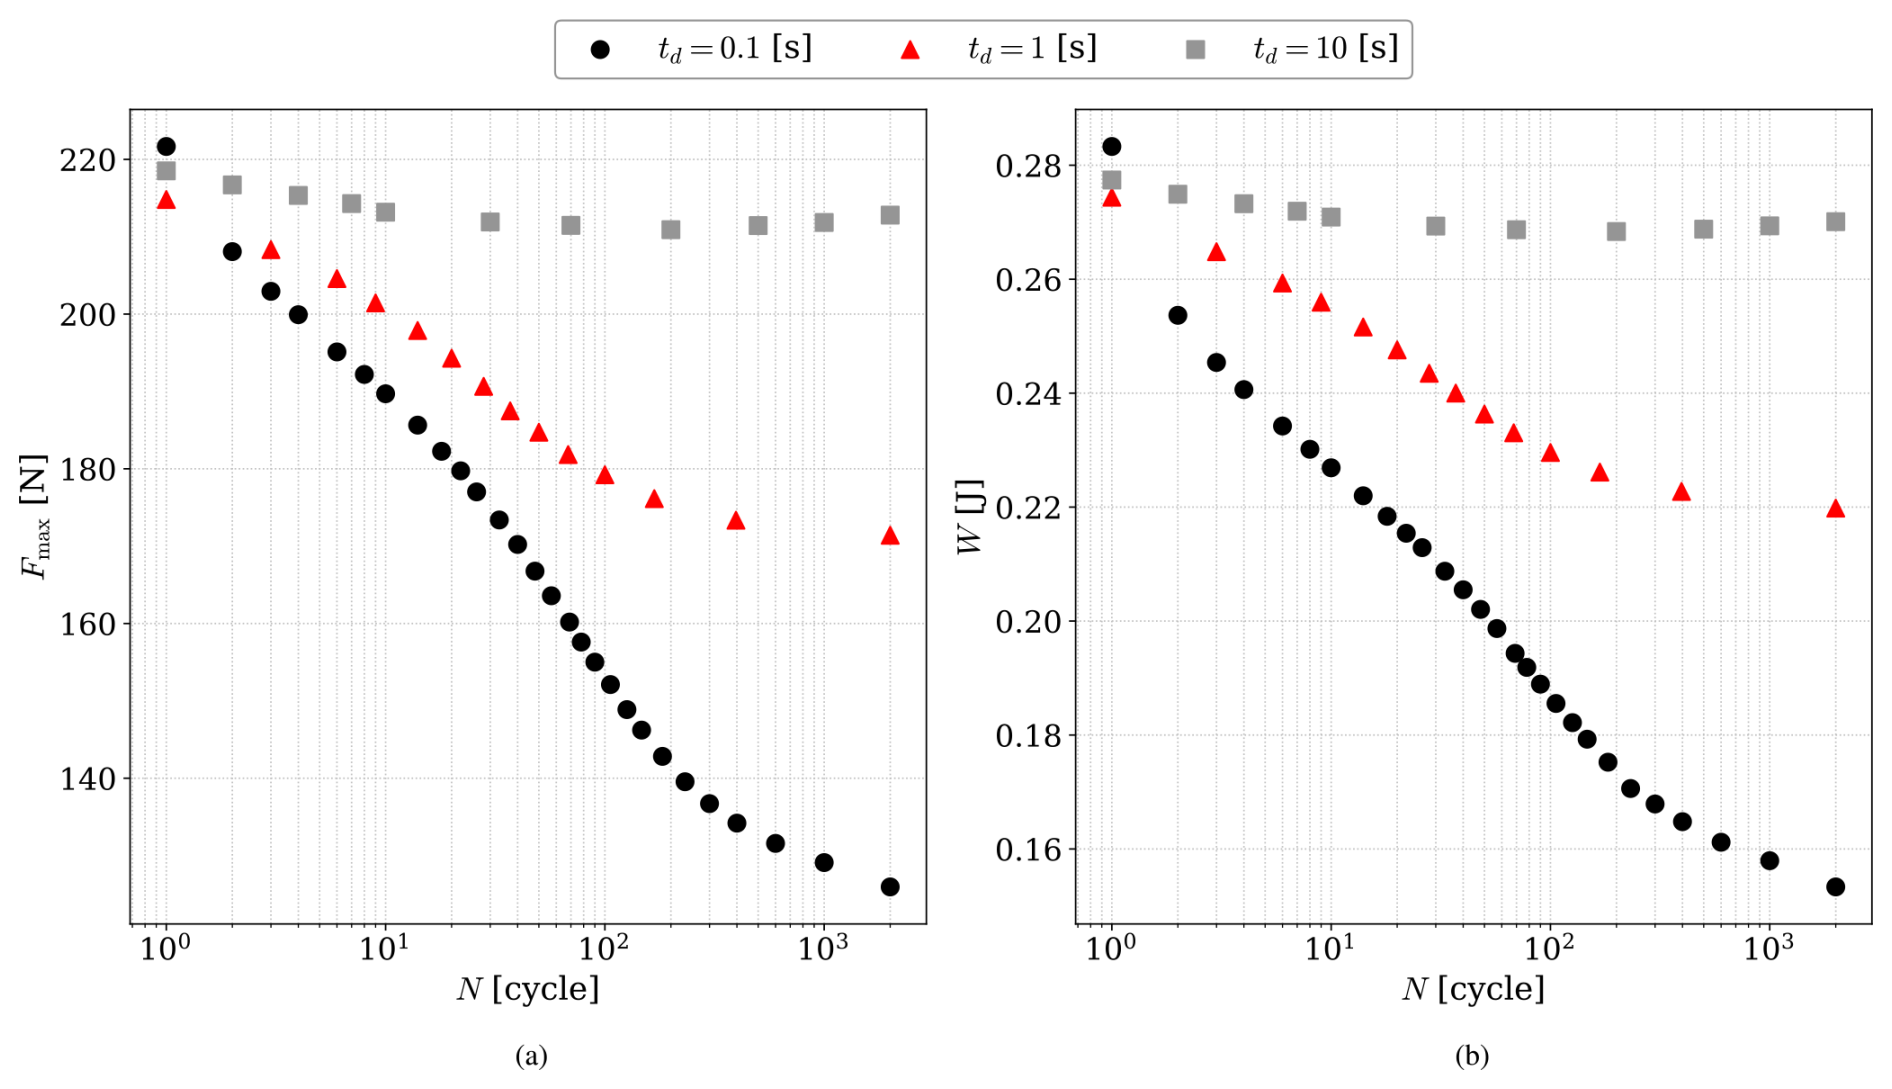
Figure 9Illustration of the maximum load, Fmax, (a) and strain energy, W, (b) versus cycle number under pulsed loading with a pulse time of tp=0.1 s, maximum displacement of u2=1.9–2 mm, and dwell times s.
3.2 Fatigue crack growth observations and analysis
Each test is conducted and analyzed as described in the methods section. Here, we describe in detail the observations, features, and analysis of three selected tests, namely tests no. 1, 2, and 3, for which differing crack growth behaviors are observed.
Figure 14 shows plots of the numerical data extracted from these three tests, with crack lengths versus cycle number in the first column, loading strain energy versus cycle number in the second column, and loading strain energy versus the sum of crack lengths in the third column. The absolute value of the linear regression is the basis for calculating the tearing energy using Eq. (5). For each individual test, , , and are evaluated in cycle interval II, where the rates are approximately constant. The data are summarized in Table 1.
Table 1Cycle interval II in Fig. 10: crack growth rate, tearing energy parameters, and R2 values from the linear fits to determine the tearing energy for tests 1, 2, and 3.

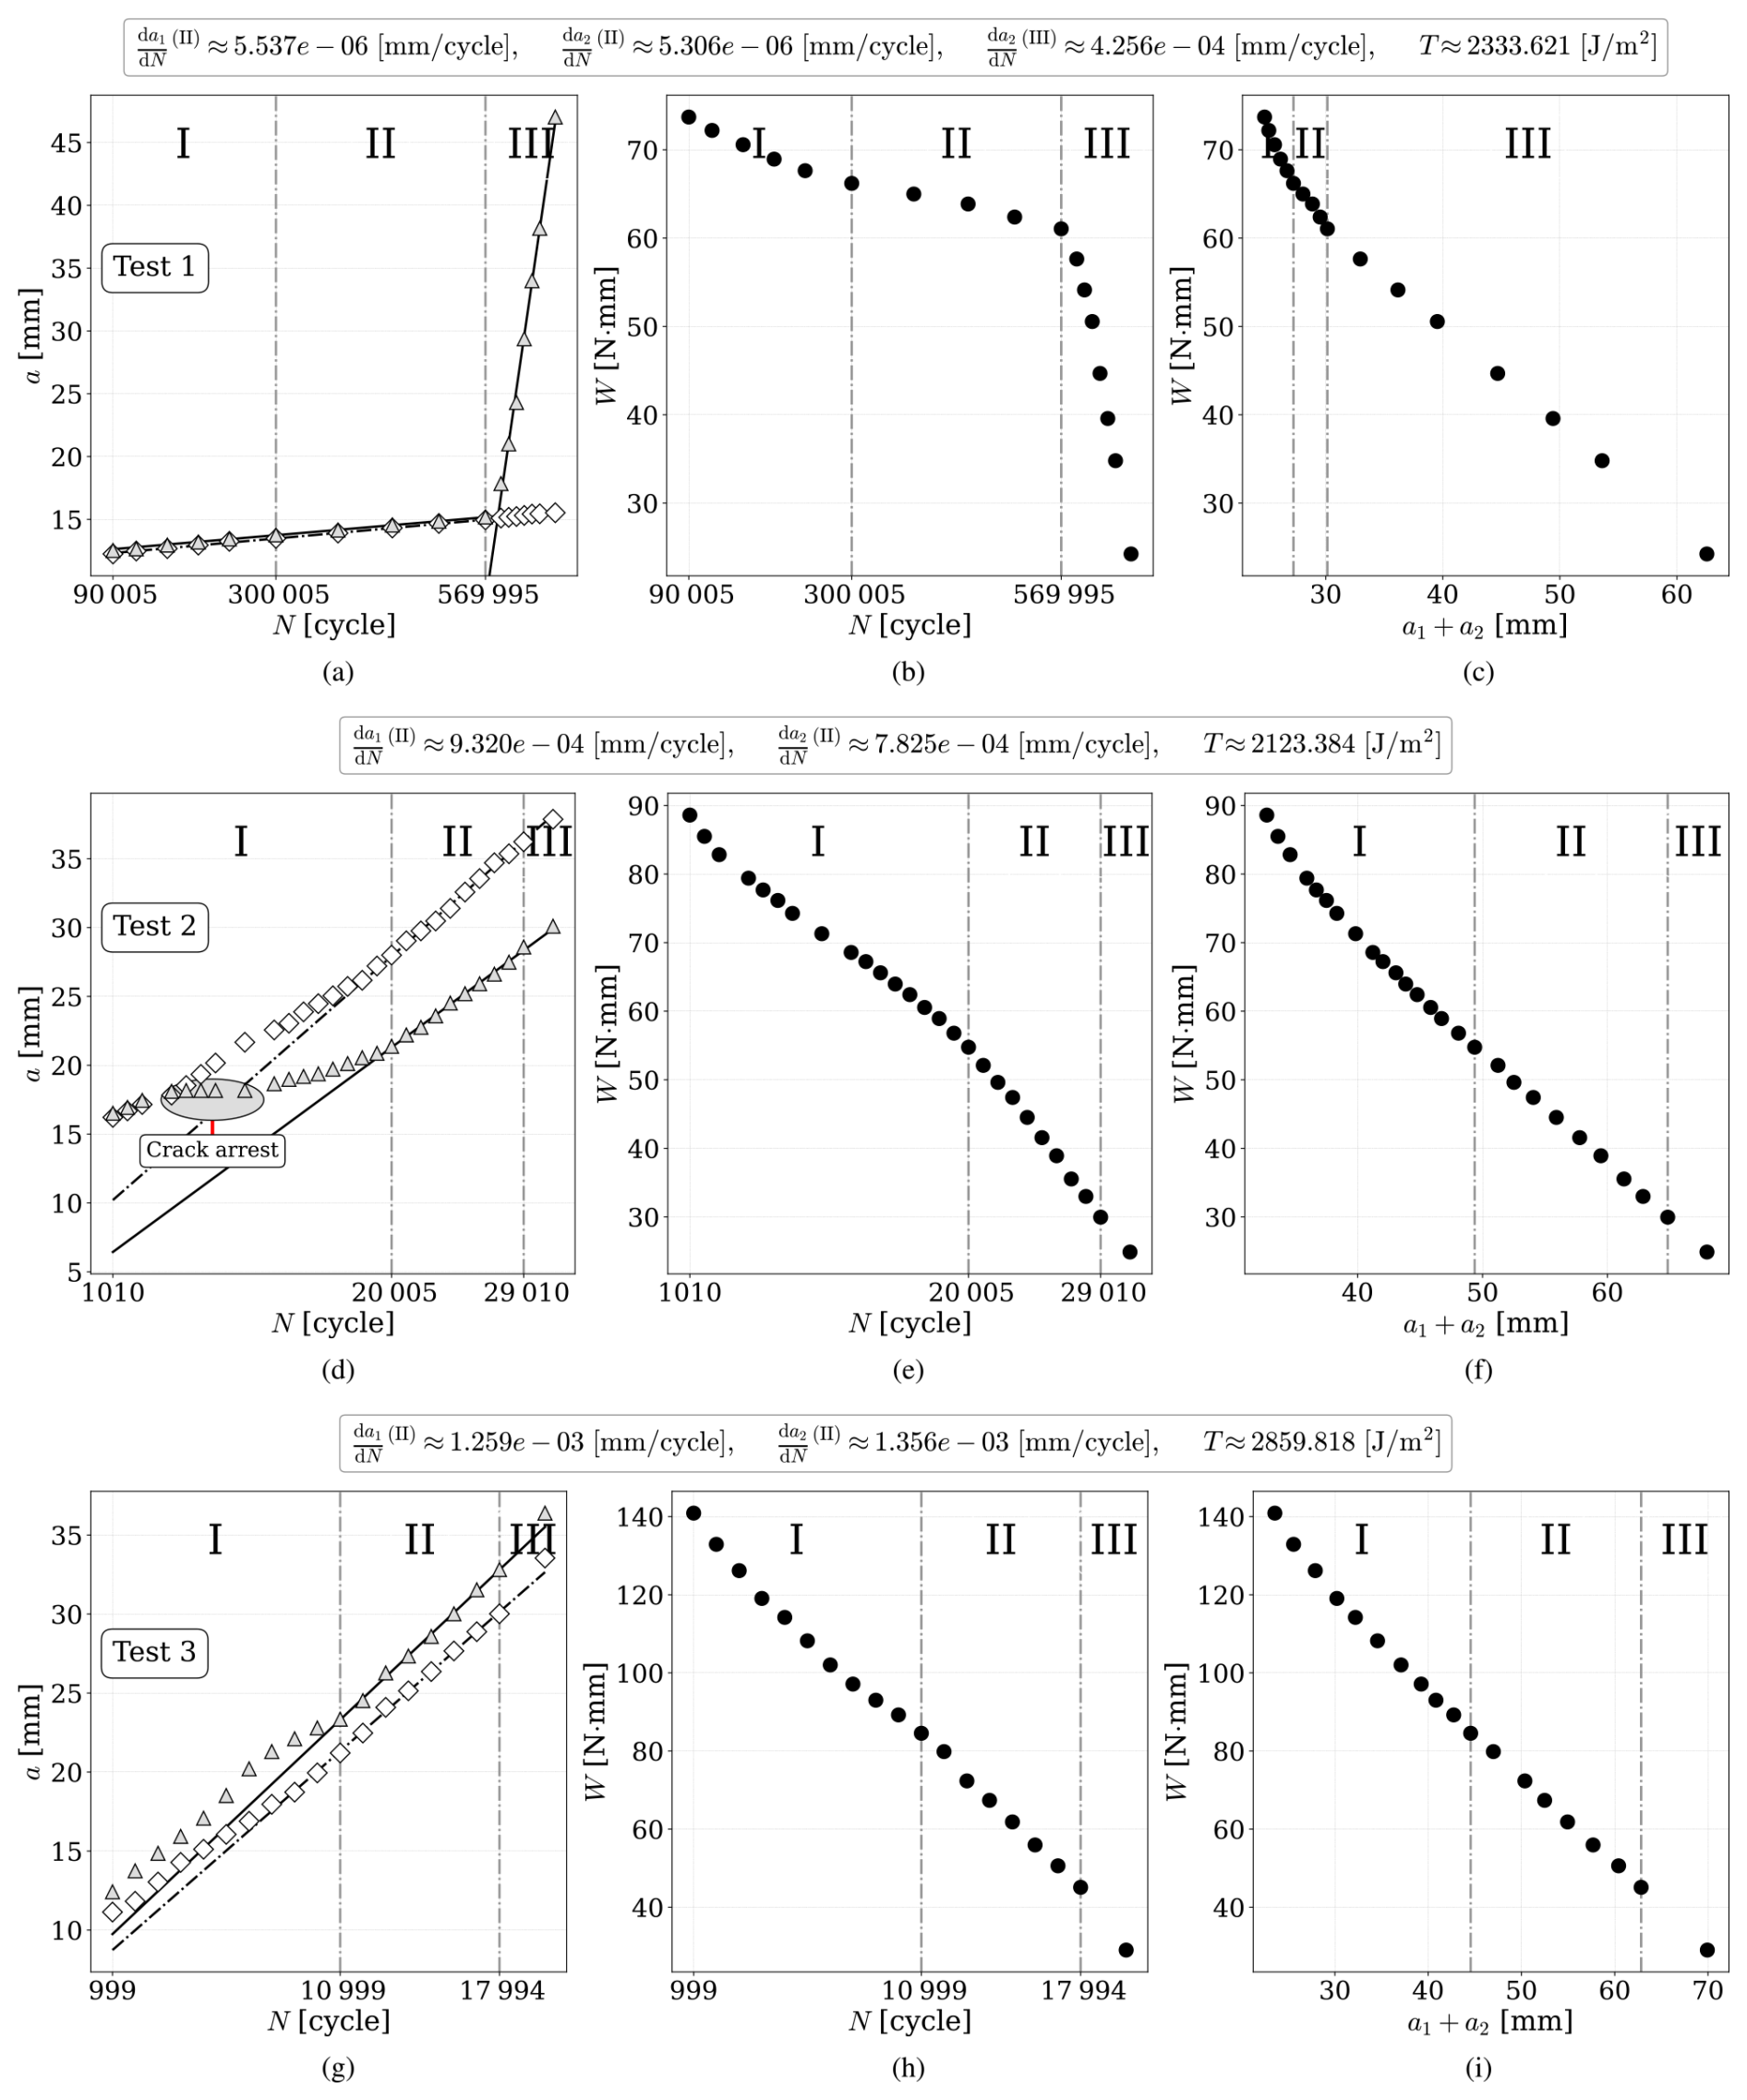
Figure 10First row is specimen no. 1, second is no. 2, and third is no. 3: (a, d, g) crack length versus number of cycles, (b, e, h) loading strain versus N, and (c, f, i) loading strain versus the sum of crack lengths.
In the typical scenario, the two cracks grow at approximately constant, and similar rates. However, for some tests, discrepancies are observed, which will be addressed in the following.
For test no. 1, Fig. 11, the two cracks grow at a rate of around mm per cycle for almost 570 000 cycles. Subsequently, the right crack instantly jumps to a rate of mm per cycle, also observed within domain III in Fig. 10a. Such an abrupt change in crack growth rate was also seen in another specimen. It may indicate that this test was loaded just below a threshold tearing energy and that the threshold was exceeded for one crack after 570 000 cycles. This may be caused by a slight misalignment of the grips or uneven gripping along the width of the test specimen. It may also be a consequence of the slight increase in peak displacement as the specimen stiffness decreases due to the growing cracks.
Another feature is observed for test no. 2, Fig. 12, where the two cracks initially grow at identical rates until around 5000 cycles, when the right crack stops while the left crack continues, highlighted as the crack arrest region in Fig. 10d. At around 10 000 cycles, the right crack finds its way around what appears to be a tough inhomogeneity, and the crack resumes propagation. It then accelerates until around 20 000 cycles, where it reaches its initial rate and grows at the same rate as the left crack. Looking carefully at the photos, it can also be seen that the right crack has followed a path that has been affected by the tough inhomogeneity.
Figure 13 shows images from test no. 3, where both cracks grow at a relatively constant rate of approximately mm per cycle throughout the experiment. A kink angle appears after 5397 cycles in the left crack, changing the propagation direction of both cracks. This behavior may arise from local material inhomogeneity or a slight misalignment or variation in the gripping pressure along the width of the specimen. The change in propagation direction will modify the local strain and stress fields due to a change in principal orientation relative to the global loading direction. However, the calculated work of loading does not indicate any significant change associated with the kink formation, nor is a deviation observed in the crack growth rate, as seen in Fig. 10a and b. This indicates that the tearing energy, which governs crack advance, is not significantly affected by changes in the direction of crack growth.
These observations indicate that a threshold tearing energy exists below which the fatigue crack growth rate is of the order of nanometers per cycle and above which the rates are in the micrometer per cycle range. This threshold may be somewhere in the interval T=2000–2400 J m−2. The versus tearing energy values for all test in the present campaign are presented in the next subsection.
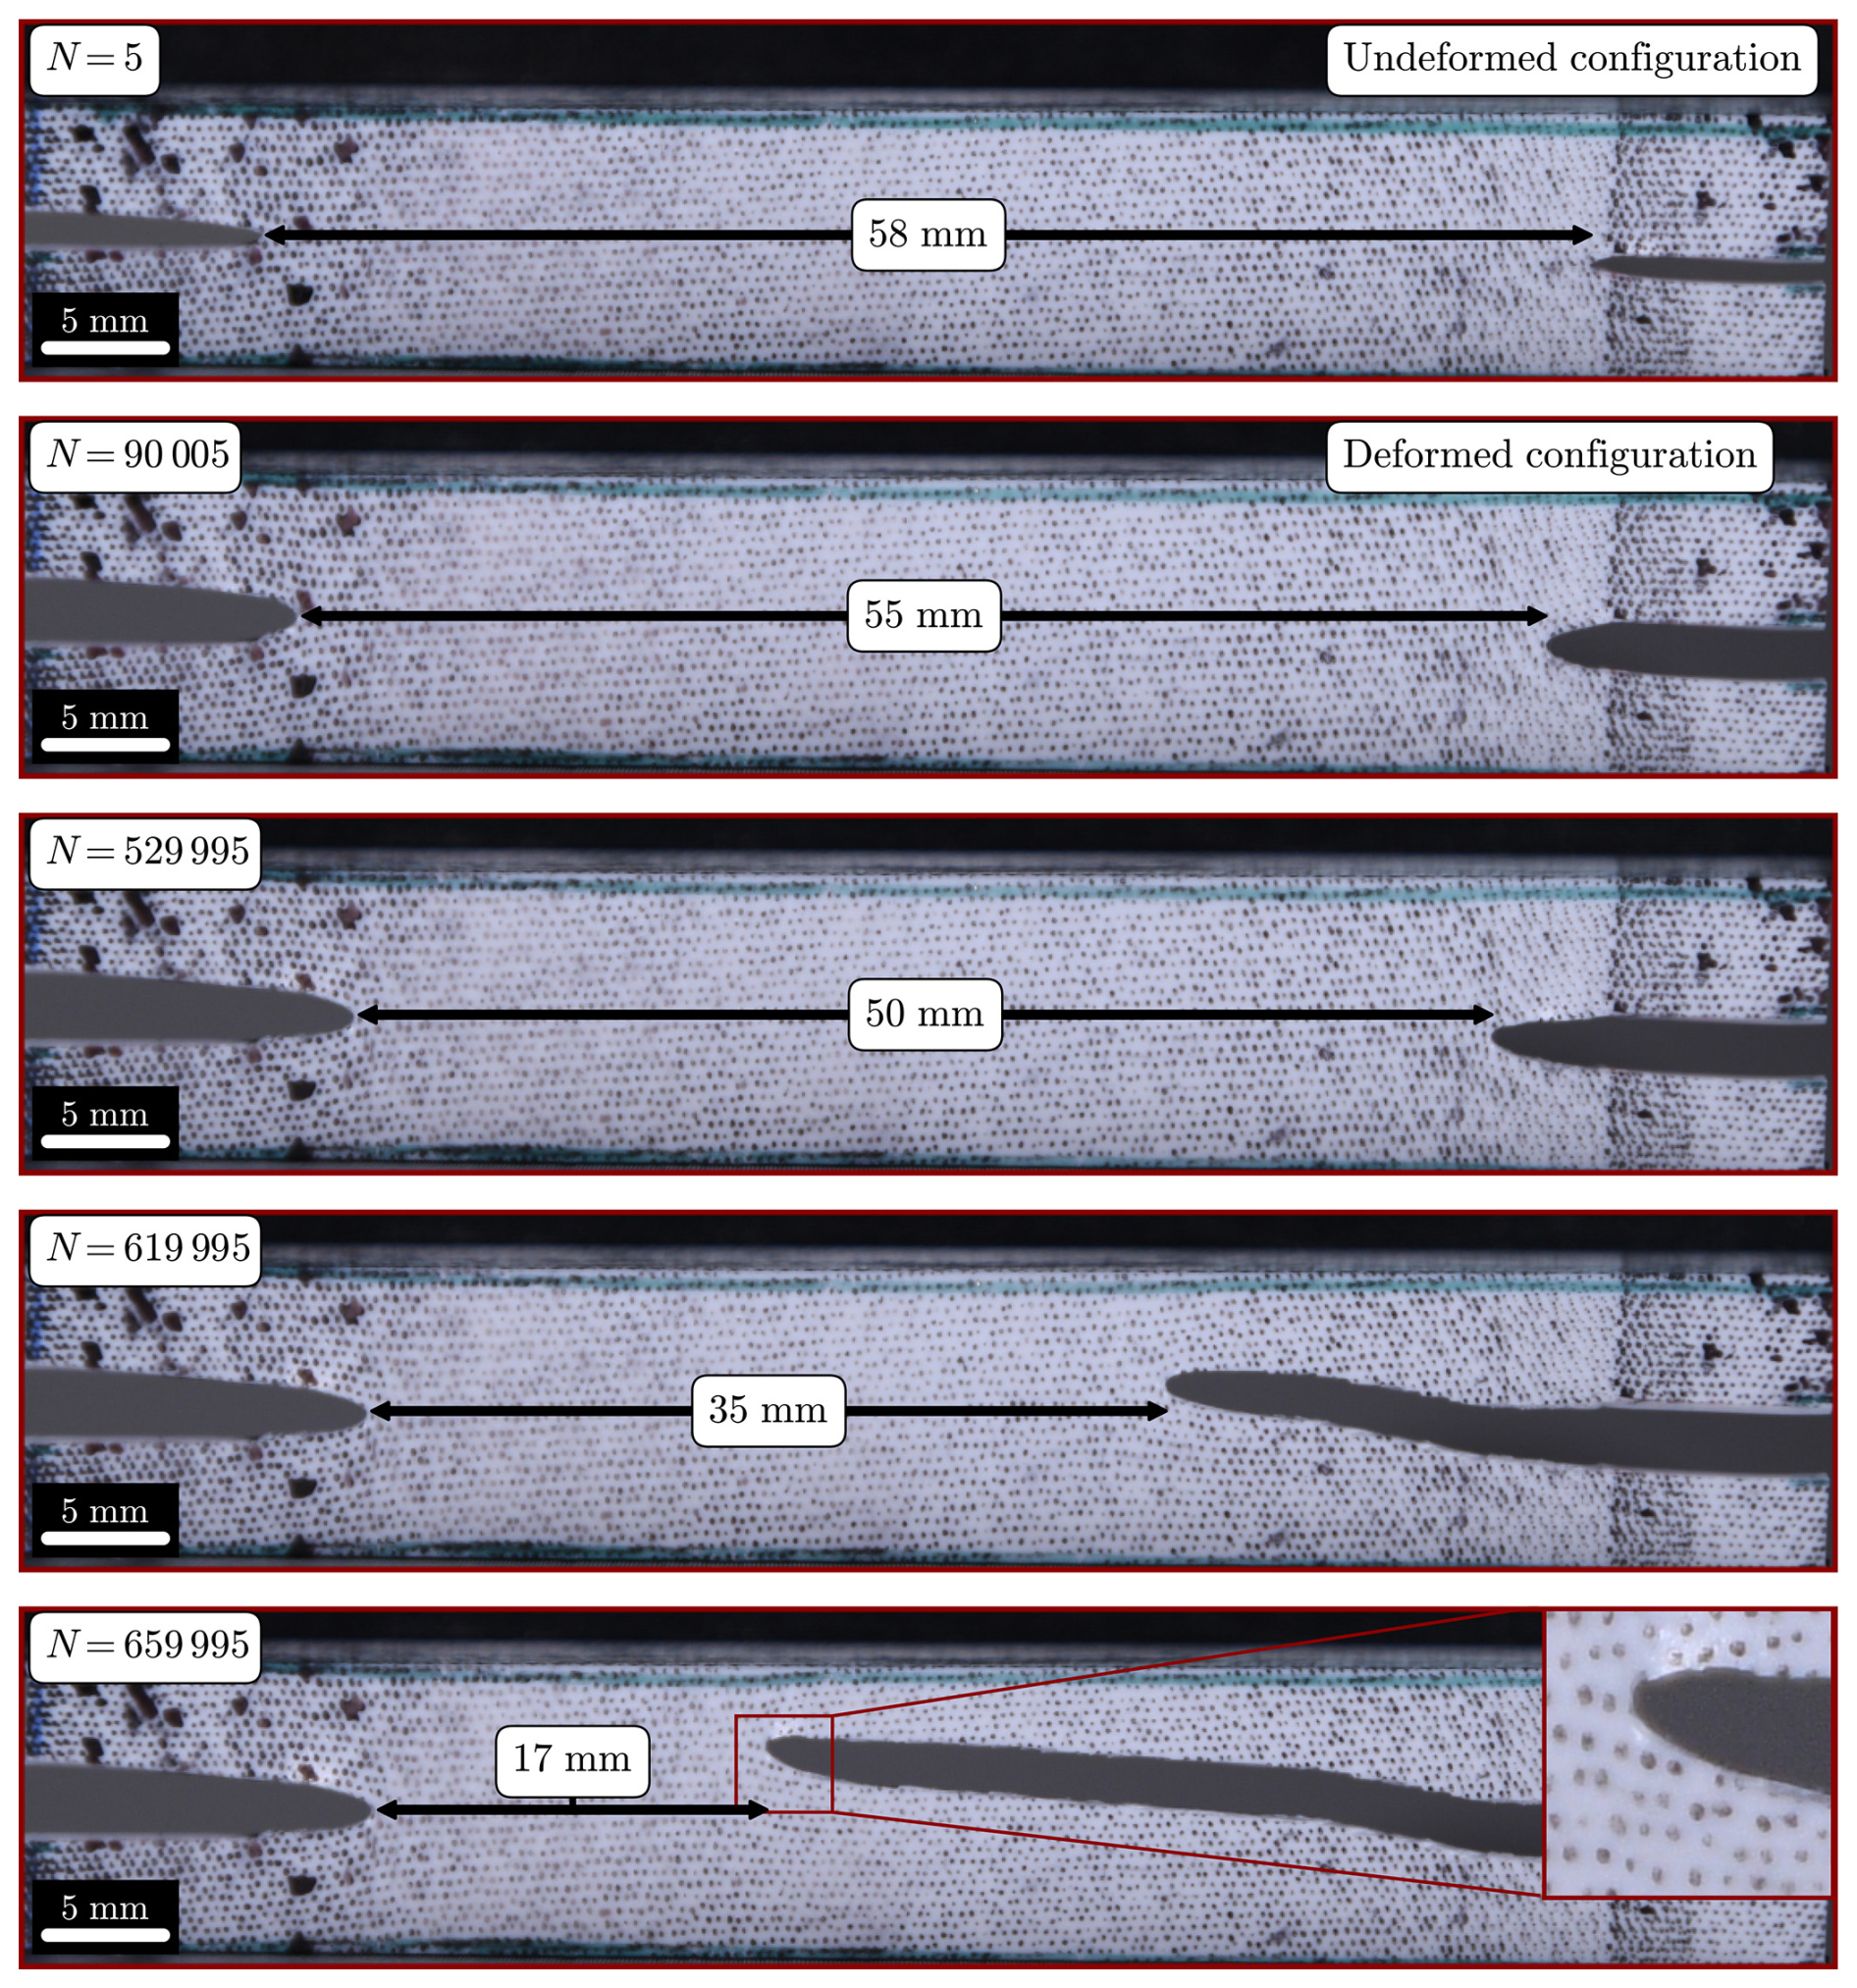
Figure 11Fatigue crack growth observation of specimen no. 1 during pulse loading, exposed to a maximum displacement of [mm] with a dwell time td=0.1 [s] and initial crack length a0=10 [mm]. Numerical data equivalent to the first row in Fig. 10.
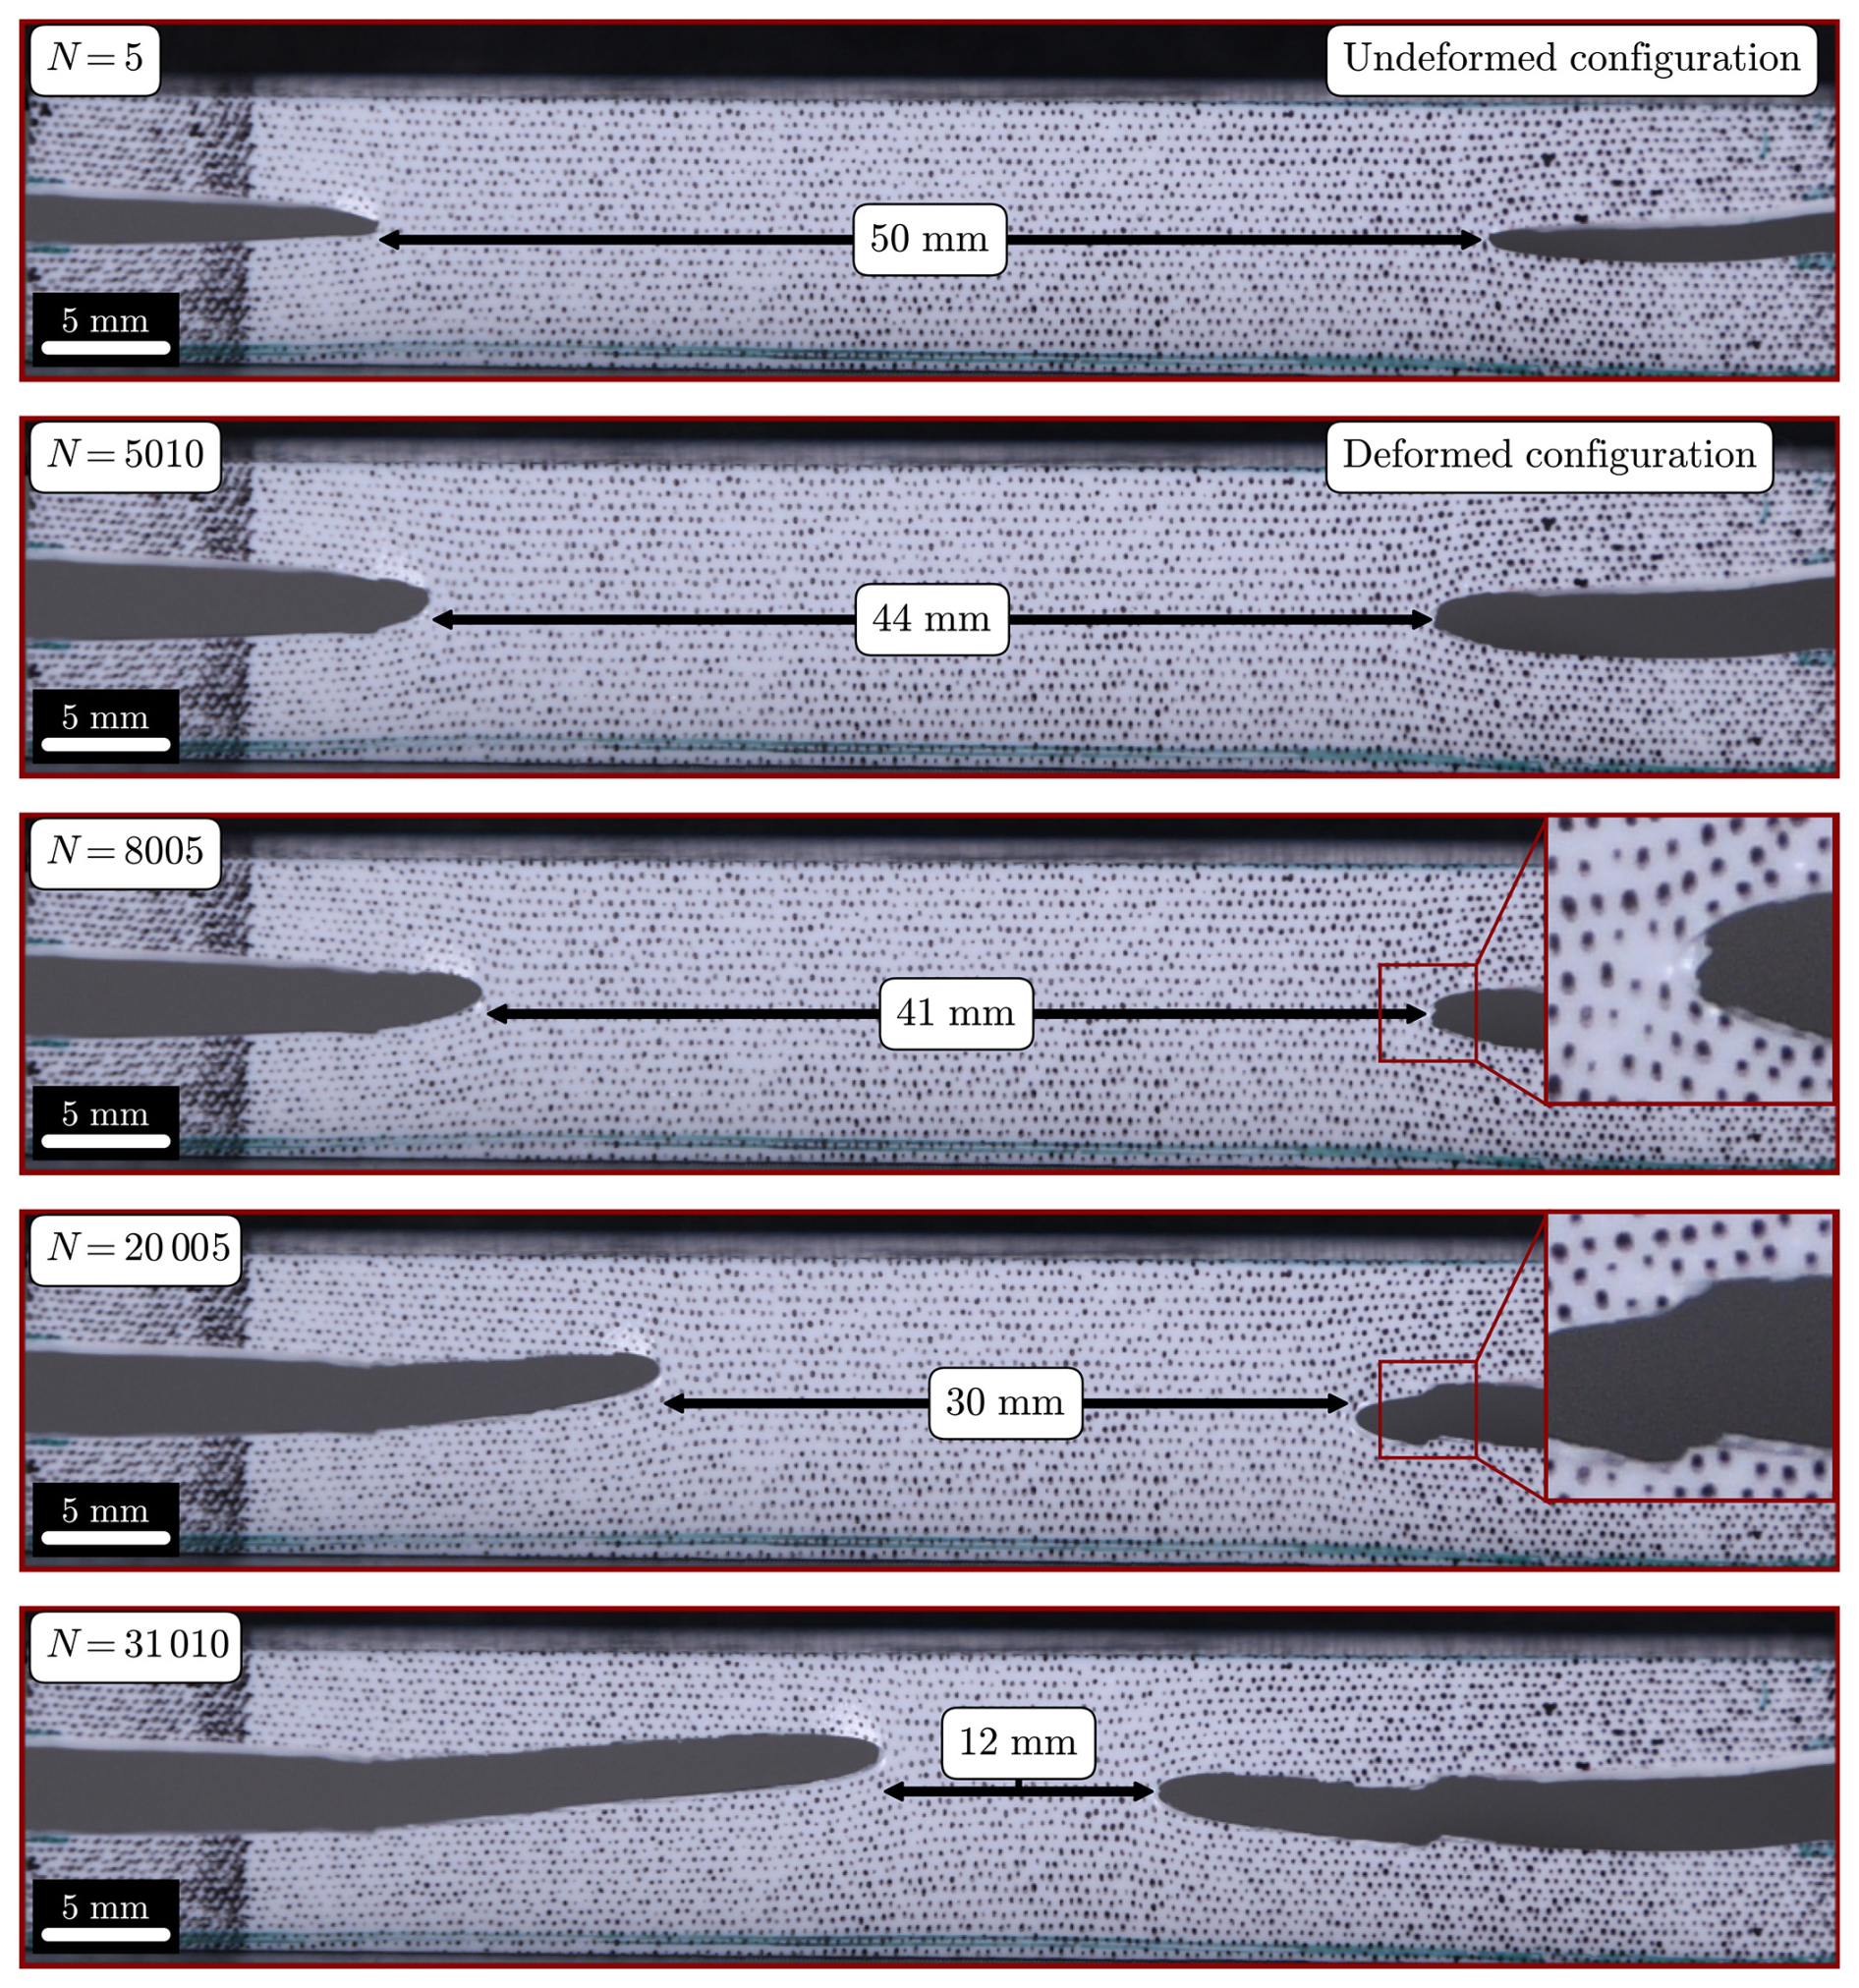
Figure 12Fatigue crack growth observation of specimen no. 2 during pulse loading, exposed to a maximum displacement of [mm] with a dwell time td=0.1 [s] and initial crack length a0=15 [mm]. Numerical data equivalent to the second row in Fig. 10.
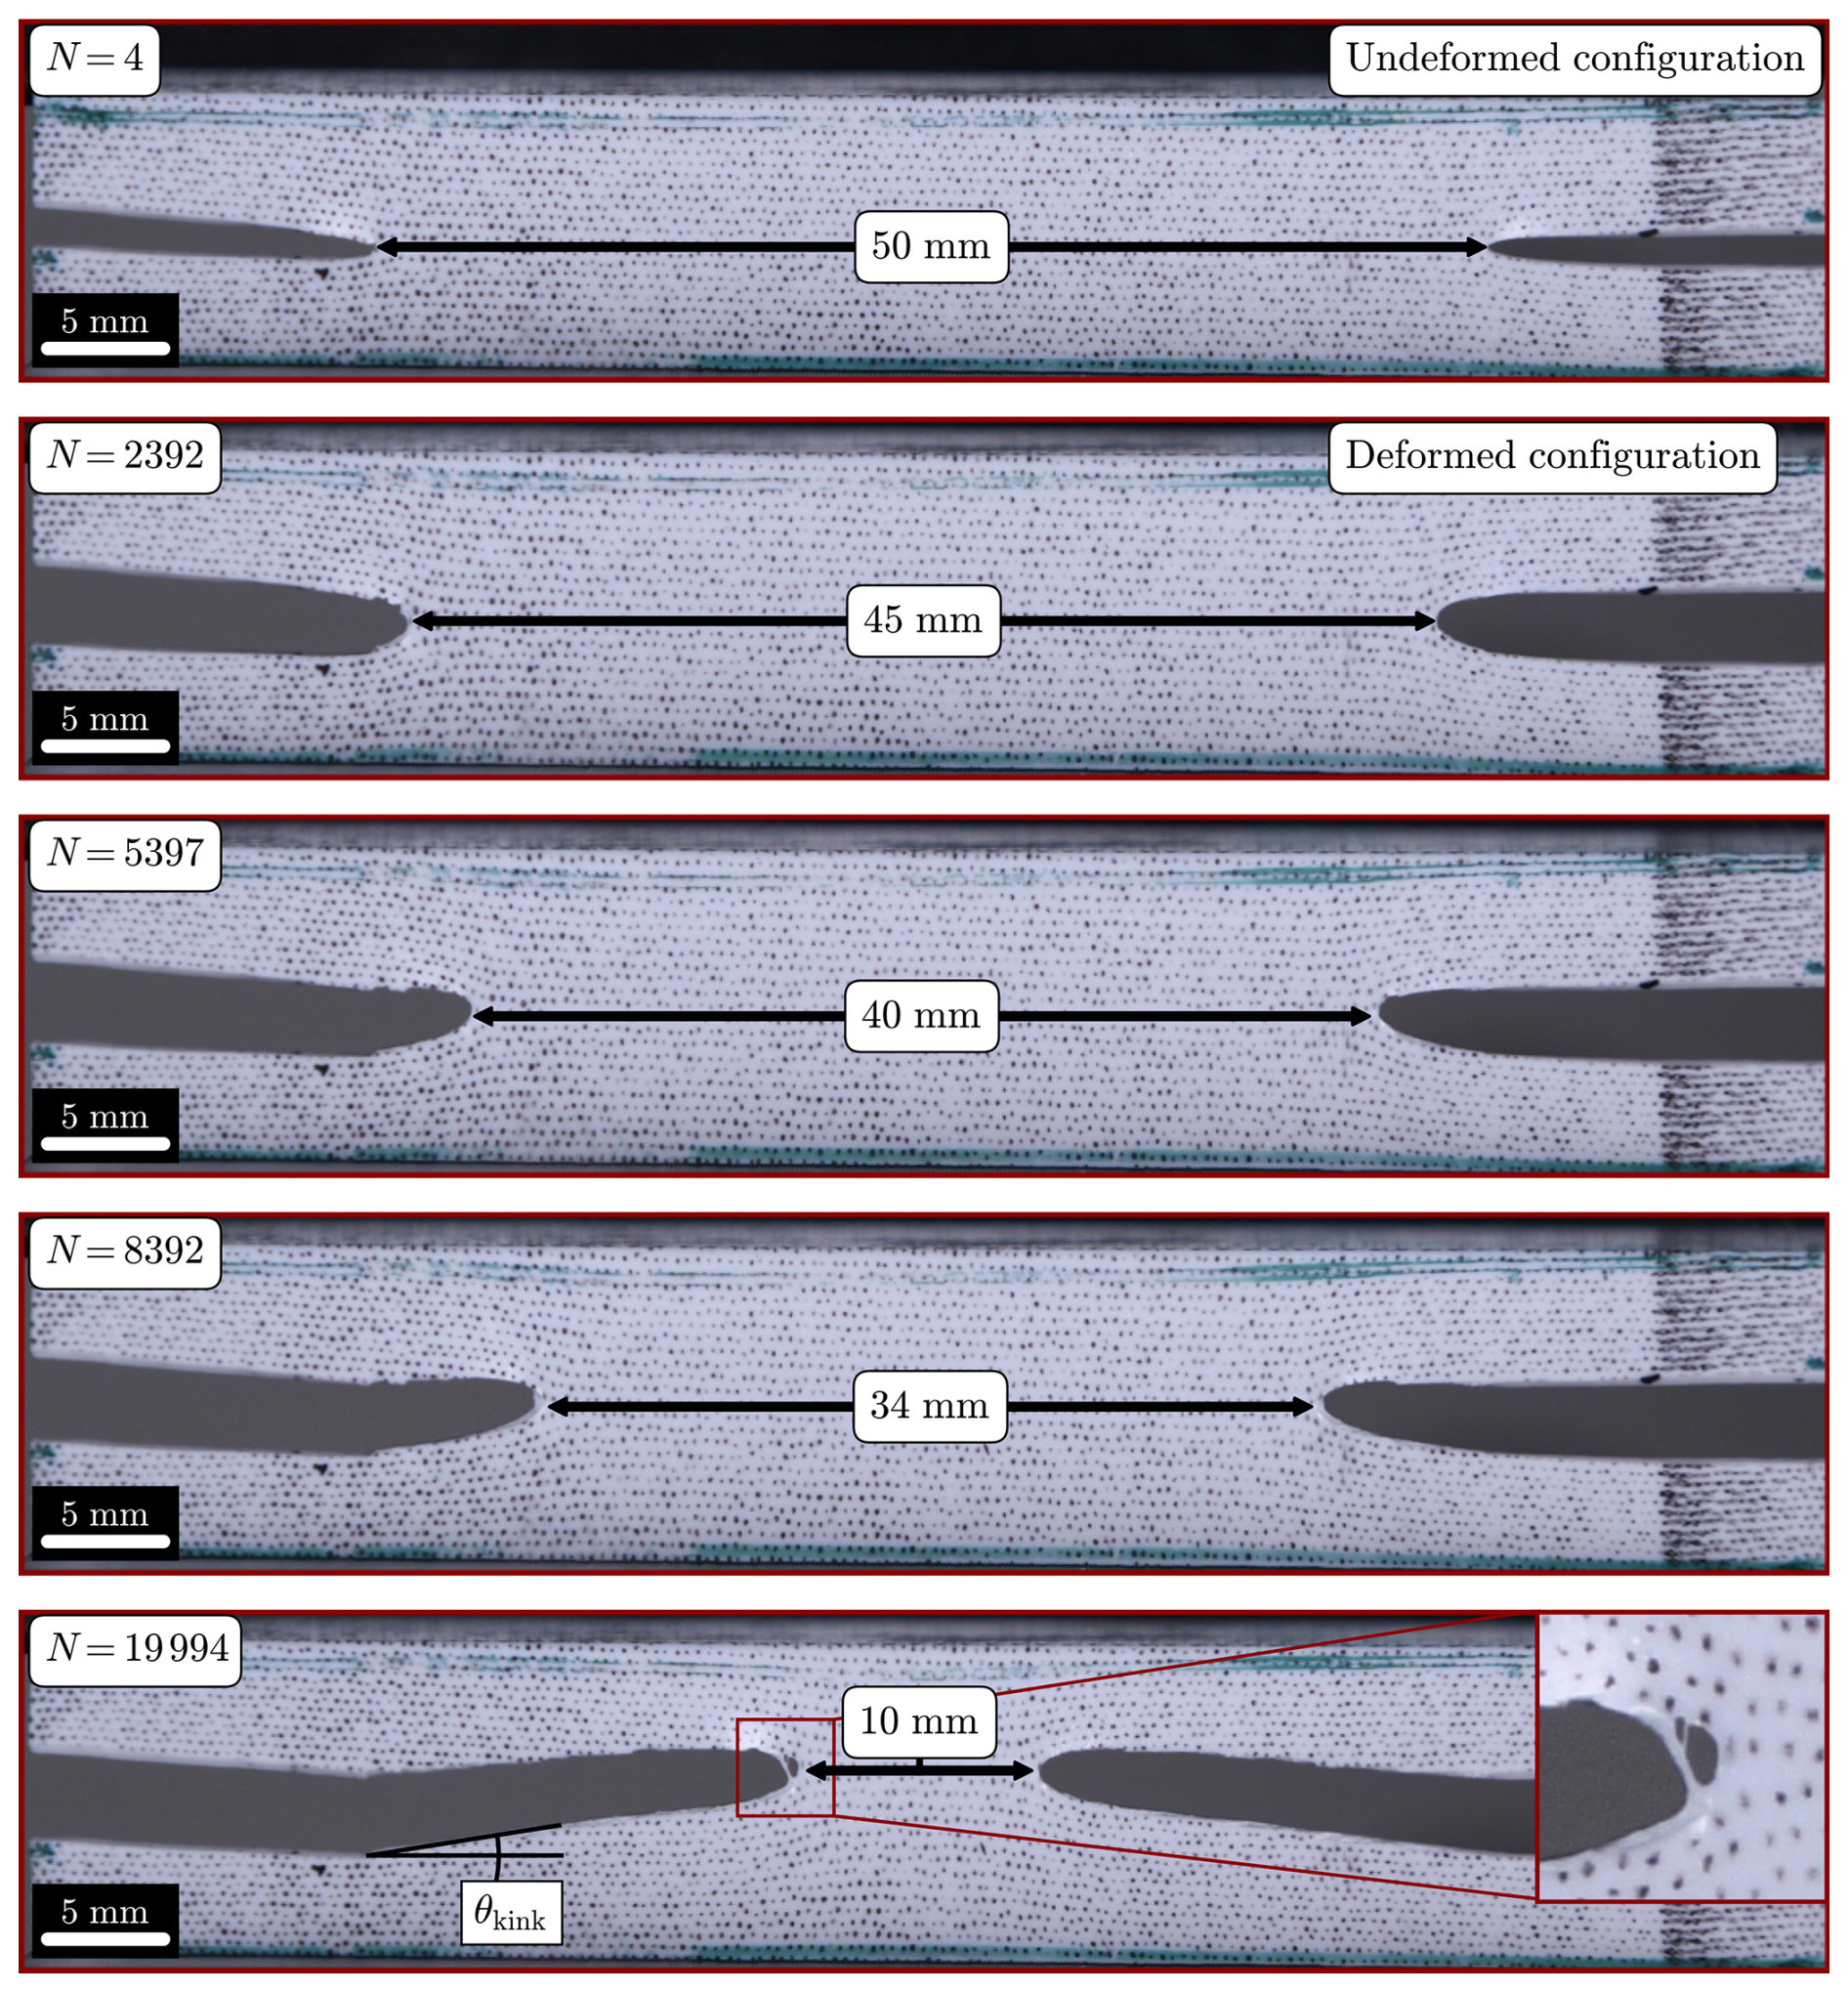
3.3 The effect of strain and tearing-energy on crack growth rate
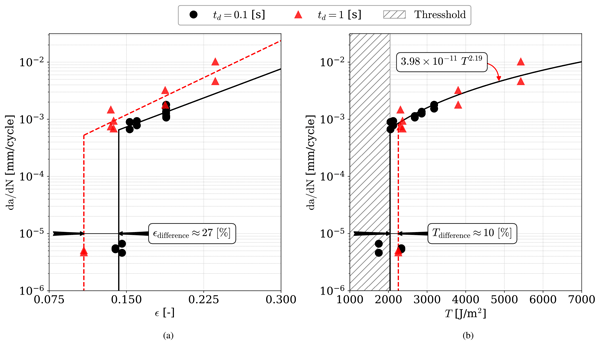
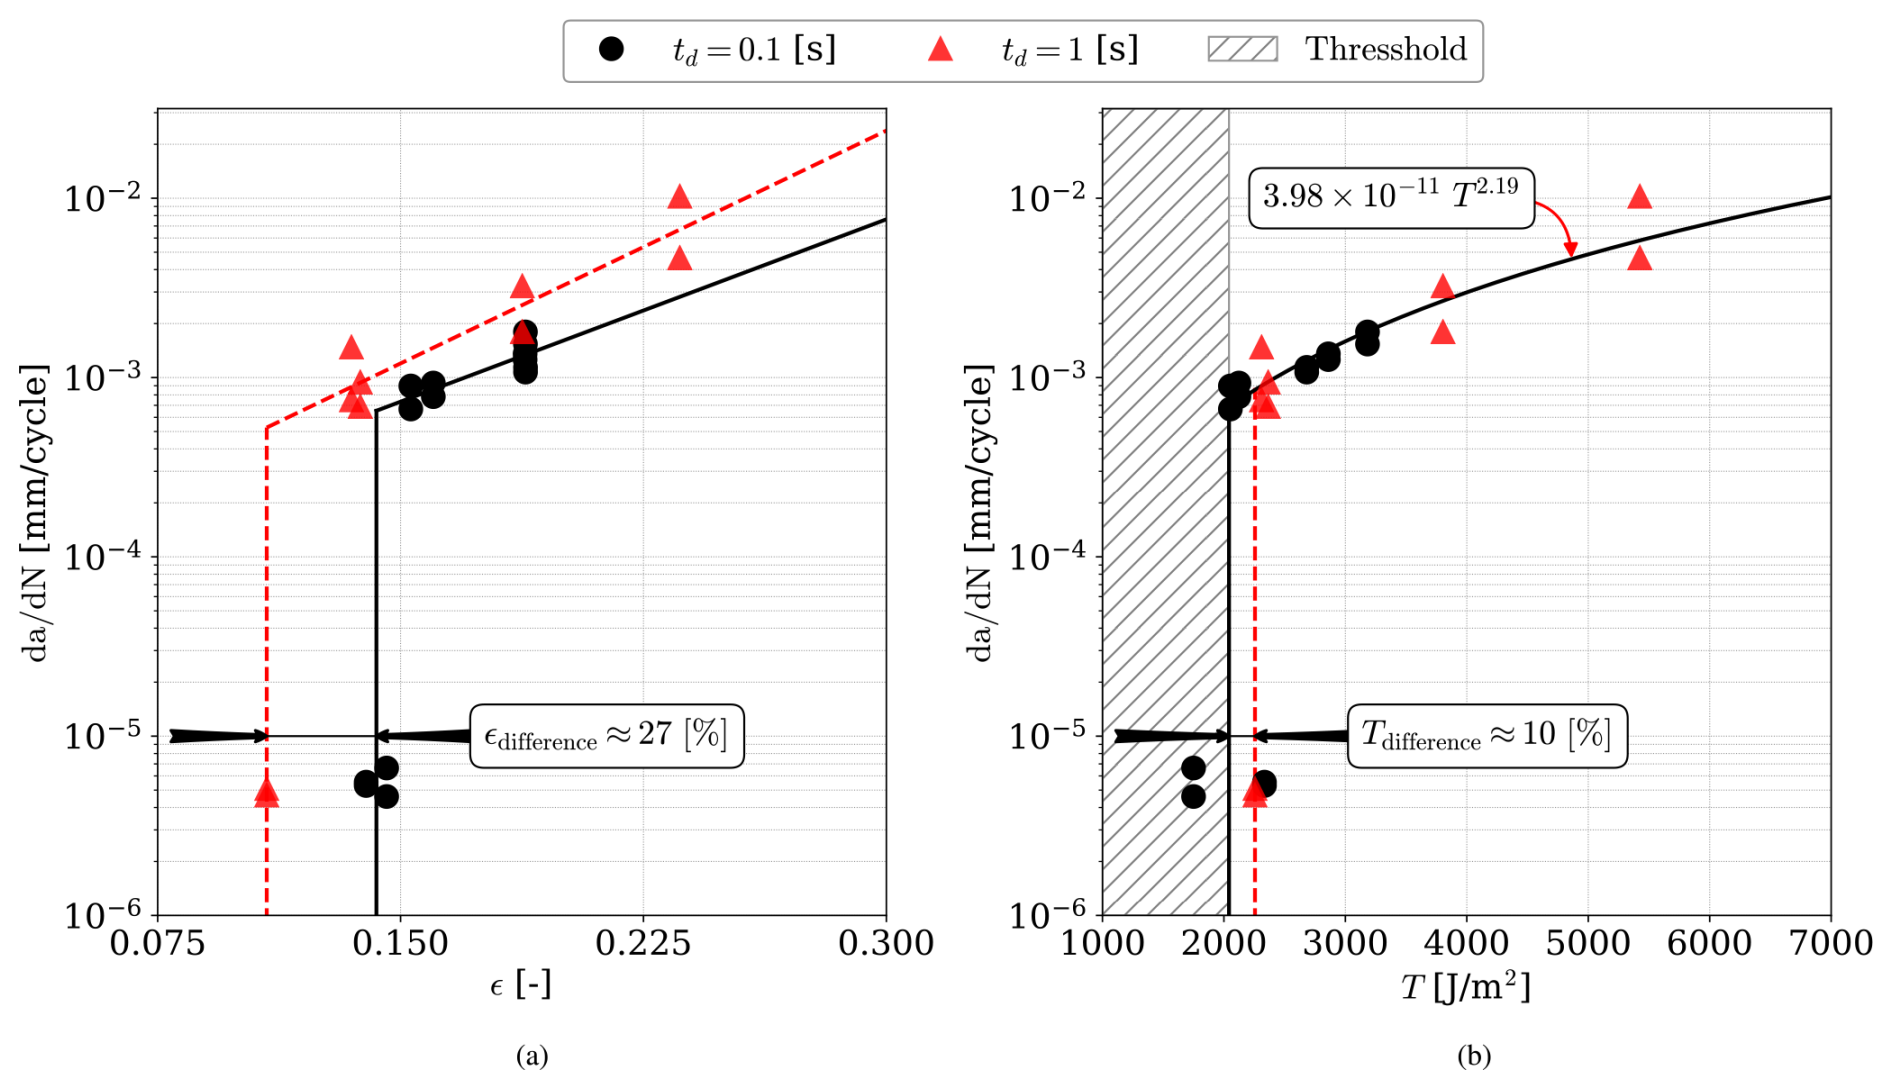
Figure 14a shows the crack growth rate versus the maximum strain for dwell times of s.
The strain threshold between slow and fast crack growth is higher for the experiments conducted with a dwell time of td=0.1 s compared to the data points obtained using a dwell time equivalent to td=1 s. The relative percentage difference is approximately εdifference=27 %, as depicted in Fig. 14a. Following the trend lines in the growth regimes, it can be stated that for a given input strain, the crack grows faster for td=1 s than for td=0.1 s. Accordingly, for a given crack growth rate, the quantity of strain required to reach an equivalent growth rate is greater for td=0.1 s than for td=1 s. This implies that longer dwell times allow for a greater quantity of strain energy to be imparted into the system for a given peak strain, thus increasing the tearing energy that drives both crack initiation and accelerated crack growth.
However, it can be observed from Fig. 14b that, when inspecting the tearing energy, T, versus the crack growth rate, , the data tend to collapse for the two dwell times, s, although with a slight difference in tearing energy threshold of Tdifference=10 %. The crack growth rate over tearing energy is largely independent of dwell time for the values tested. Fitting a power law to both td=0.1 and td=1 data for values above 10−4 mm per cycle gives . In contrast, Ghosh et al. (2014) finds that dwell time does affect the same correlation in rubber compounds for tires. The preliminary data suggest a tearing energy threshold, below which crack growth is negligible. With the reservation of limited data points, the threshold is estimated by computing J m−2 of the data below mm per cycle with a Tstd≈200 J m−2.
The test data used to calculate the crack growth rate, , and the tearing energy, , are the load, the position of the actuator, the positions of the crack tips, and the initial thickness of the sheet. The relative uncertainties in load, position of the actuator, and thickness of the specimen are roughly 1 % each. The largest source of uncertainty in the crack growth rate is related to the positions of the crack tips, which are determined by digital image analysis. The pixel size corresponds to 0.02 mm, and the uncertainty in the crack tip position is estimated to be ±3 pixels. Below the threshold, the crack growth and tearing energy are typically evaluated in 1 mm of crack growth intervals, leading to combined uncertainties greater than 10 %. Above the threshold, the evaluation length is roughly 10 mm and the uncertainty is roughly 2 %.
Table 2Fitted coefficients for the power-curve description of crack growth rate and corresponding R2 value. These were obtained by combining data from the two dwell times with mm per cycle.

The fracture mechanics approach to LEE is probably more appropriate for the assessment of modern LEPs, which fail by local defect-induced fatigue cracking, compared to the current stress-based linear damage summation approach, which assumes homogeneous properties and continuous progressive damage. Using fatigue crack growth testing of a polyurethane elastomer sheet, this study shows that dwell time influences the stress softening and crack growth rate when assessed against peak strain but not when evaluated against tearing energy. The main messages to convey are as follows.
-
The material system exhibits significant time-dependent relaxation during fatigue testing, attributed partly to cyclic stress softening, the Mullins effect. For the short dwell time of 0.1 s, a higher number of cycles is required to reach a stable state with identical successive load cycles, compared to the longer dwell times of 1 and 10 s. Lower dwell times also cause lower peak load and strain energy per cycle when the material has stabilized. The test is considered steady state, and material assessment can be conducted when two criteria are fulfilled: (1) the crack growth rates and are nearly similar and constant and (2) the rate of work over crack propagation, , is constant. A run-in period is required before material assessment can be conducted. Therefore, a strain–energy density function obtained from a monotonic tensile test, as used in conventional methods, is not applicable. Instead, the energy must be evaluated from hysteresis loops recorded for each individual test with its specific test parameters, after the material has stabilized.
-
The crack growth rates vary from a few nanometers per cycle below the threshold to some micrometers per cycle above the threshold. In most cases, the rates are identical for the two cracks and constant for the greater part of the test. However, in some tests one of the cracks may stop temporarily or suddenly jump to a higher rate of growth.
-
When crack growth rate was assessed against peak nominal strain, shorter dwell times produced an approximately 27 % higher threshold. Conversely, longer dwell times promoted faster growth at a given maximum strain by enabling greater strain energy input. However, when expressed in terms of tearing energy, the datasets for dwell times between 0.1 and 1 s nearly coincide, with only about a 10 % difference in tearing energy threshold. This indicates that once a stable energy state and mature crack front are established, growth is governed predominantly by the tearing energy rather than by strain.
-
The data suggest the existence of a tearing energy threshold below which crack growth is negligible. With the caveat of limited data points, this threshold is estimated as approximately 2100 J m−2 with a standard deviation of about 200 J m−2.
A key finding is the threshold tearing energy below which the fatigue crack growth is negligible. This behavior is particularly valuable for several emerging applications.
-
A future parametric model should reflect the role of the governing parameters and properties determining impact fatigue crack growth thresholds for impact on a layered visco-elastic LEP structure. This would imply a dynamic fracture mechanics model that incorporates visco-elastic properties, layered structures, delaminations, and cracks of different lengths and orientations. This model should be used to specify target properties when formulating new solutions and to facilitate specification for LEP materials in design guidelines and recommended practices for wind turbine blades.
-
Fracture mechanics in design of LEP materials and systems will provide a mechanistic basis for evaluating LEP systems prior to conventional rain erosion testing and account for basic material properties. By quantifying crack driving forces, energy dissipation mechanisms, and crack growth thresholds, it becomes possible to optimize LEP materials and designs for resistance to crack initiation and propagation. This includes tailoring visco-elastic and fracture mechanics properties, interfaces, and layer thicknesses to eliminate fatigue cracking and delamination under cyclic impact loading.
-
Erosion safe operation (Bech et al., 2018) is a mitigating strategy that prevents or delays leading-edge erosion. Here, the tearing energy threshold for fatigue crack growth could be used as a curtailment criterion, in the sense that rotor speed should be kept below a fatigue crack growth propagation threshold, which is a function of LEP properties and meteorological conditions, like drop size, liquid water content, and type of precipitation.
Fracture mechanics thus offers a potential paradigm shift in handling leading-edge erosion of wind turbine blades, and the topic will be pursued and developed in future research. The effect of ultra-high strain rates, characteristic for impact, on fatigue crack growth must be explored. Possibly, low temperatures could be used to mimic high strain rates, as it is common practice for visco-elastic properties, using the principle of time–temperature superposition. Rain erosion tests with applied, controlled defects should be conducted to establish empirical correlations between fracture mechanics properties and crack growth in rain erosion testing.
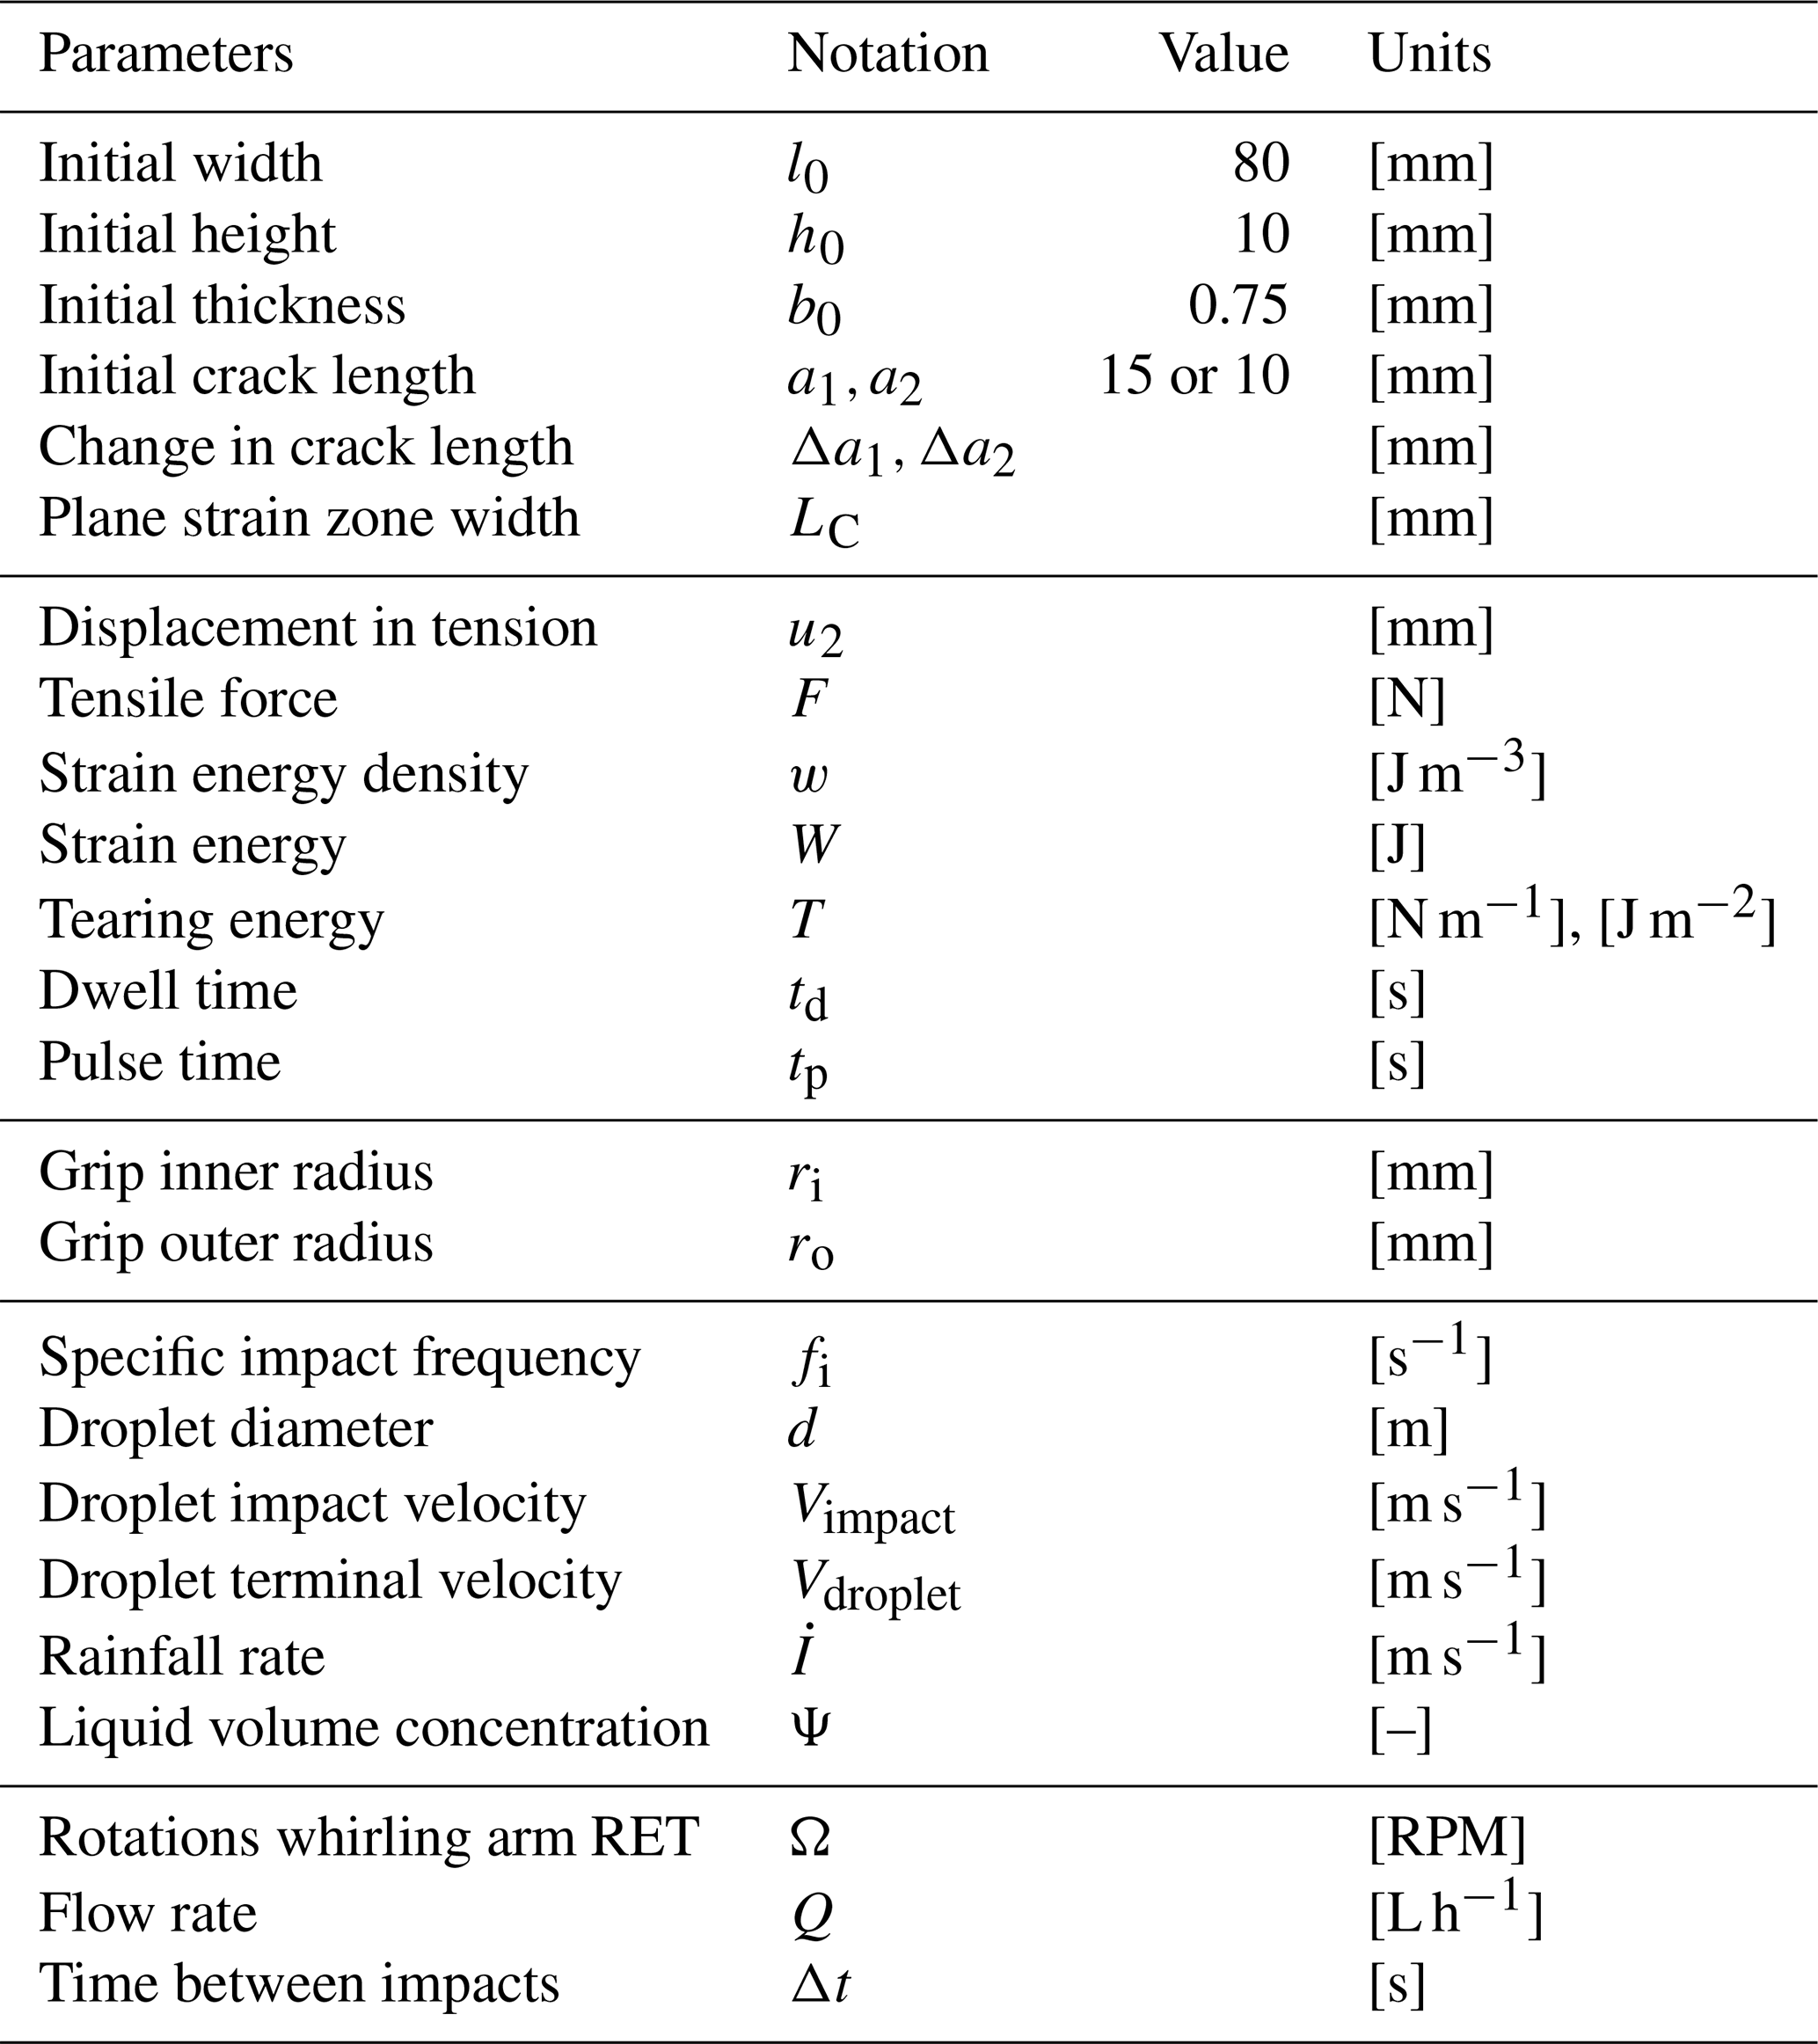
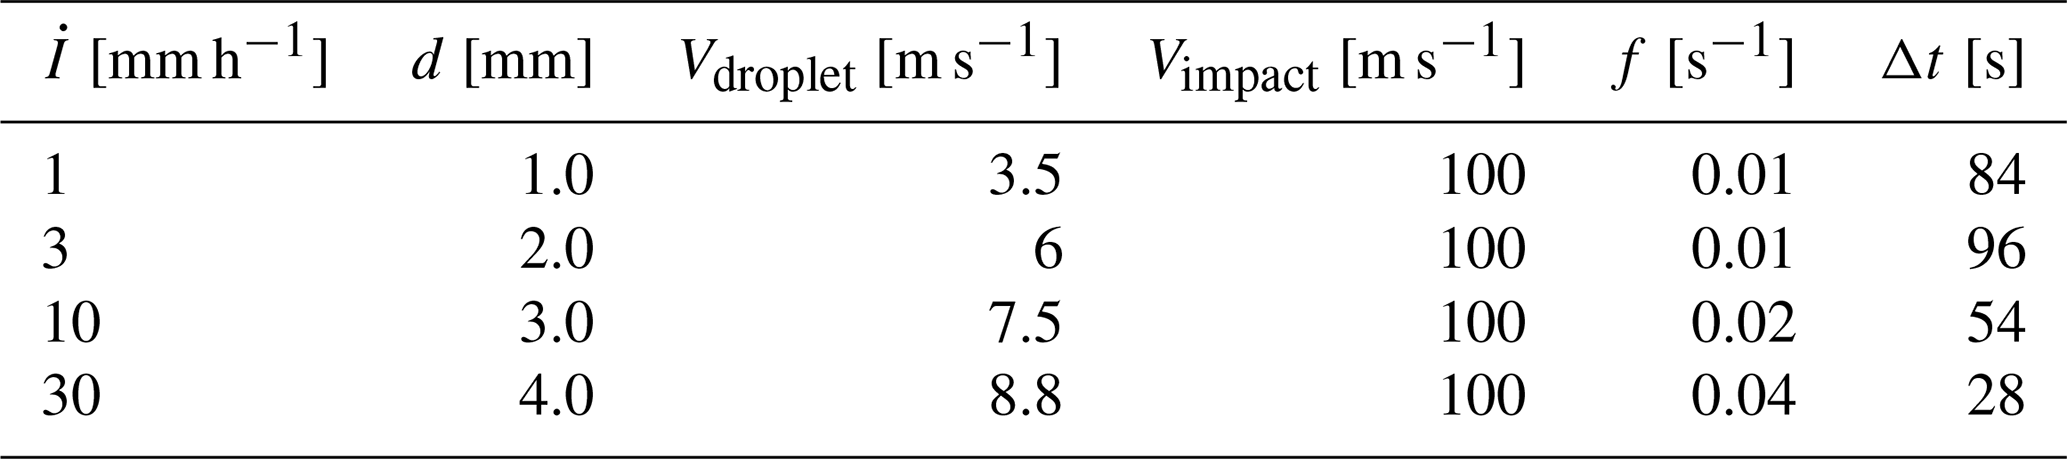
Table A3Rain erosion test parameters at accelerated test speeds, from Bech et al. (2022).

The software code for calculating the tearing energy is available on request.
The images and the raw data from the test are available on request.
Author J. I. Bech conducted the experiments and literature study of fatigue studies in rubber-like materials and was the primary contributor to the analysis method presented in Sect. 2.1. Authors J. I. Bech and J. E. Simon contributed equally to the conceptualization, methodology, data analysis, and writing of this paper. Both authors have read and approved the final article and share equal authorship.
The contact author has declared that neither of the authors has any competing interests.
Publisher's note: Copernicus Publications remains neutral with regard to jurisdictional claims made in the text, published maps, institutional affiliations, or any other geographical representation in this paper. The authors bear the ultimate responsibility for providing appropriate place names. Views expressed in the text are those of the authors and do not necessarily reflect the views of the publisher.
The authors would like to acknowledge Théo Larue for contributing to the development of the fixture and Bent F. Sørensen for healthy debates regarding the J integral and tearing energy. We would also like to acknowledge Charlotte B. Hasager and Kristine M. Jespersen for their reviews.
The authors used ChatGPT and Copilot to refine wording and improve readability in parts of the article. All edits were reviewed by the authors, who take full responsibility for the final content.
Jamie Simon acknowledges the funding of grant no. 2108-00011B from the Innovation Fund Denmark. EU Horizon grant no. 101058054 TURBO is acknowledged for supporting the development of the test method and the fixture for the plane strain crack growth test.
This paper was edited by Julie Teuwen and reviewed by two anonymous referees.
Adler, W. F. and Mihora, D. J.: Analysis of polyurethane advanced rotor blade erosion protection system, Kaman Aerospace Corporation, Bloomfield, CT, Appendix E, https://apps.dtic.mil/sti/pdfs/ADA314355.pdf (last access: 19 December 2024), 1996. a
Amirafshari, P., Brennan, F., and Kolios, A.: A fracture mechanics framework for optimising design and inspection of offshore wind turbine support structures against fatigue failure, Wind Energ. Sci., 6, 677–699, https://doi.org/10.5194/wes-6-677-2021, 2021. a
Amirzadeh, B., Louhghalam, A., Raessi, M., and Tootkaboni, M.: A computational framework for the analysis of rain-induced erosion in wind turbine blades, part II, Elsevier, 163, 44–54, https://doi.org/10.1016/j.jweia.2016.12.007, 2017. a
Bai, L., Qv, P., and Zheng, J.: Colorless, transparent, and healable silicone elastomers by introducing Zn (II) – carboxylate interactions via aza-Michael reaction, J. Mater. Sci, 55, 14045–14057, https://doi.org/10.1007/s10853-020-04997-6, 2020. a
Bech, J. I., Hasager, C. B., and Bak, C.: Extending the life of wind turbine blade leading edges by reducing the tip speed during extreme precipitation events, Wind Energ. Sci., 3, 729–748, https://doi.org/10.5194/wes-3-729-2018, 2018. a, b, c
Bech, J. I., Johansen, N. F. J., Madsen, M. B., Hannesdóttir, Á., and Hasager, C. B.: Experimental study on the effect of drop size in rain erosion test and on lifetime prediction of wind turbine blades, Renew. Energy, 197, 776–789, https://doi.org/10.1016/j.renene.2022.06.127, 2022. a, b, c
Bowden, F. P. B. and Brunton, J. H.: The deformation of solids by liquid impact at supersonic speeds, Proc. Roy. Soc., 263, 433–450, https://doi.org/10.1098/rspa.1961.0172, 1961. a
Caboni, M., Schwarz, A. E., Slot, H., and van der Mijle Meijer, H.: Estimating microplastic emissions from offshore wind turbine blades in the Dutch North Sea, Wind Energ. Sci., 10, 1123–1136, https://doi.org/10.5194/wes-10-1123-2025, 2025. a
Cardwell, B. J. and Yee, A. F.: Rate and temperature effects on the fracture toughness of a rubber-modified epoxy, Polymer, 34, 1695–1701, https://doi.org/10.1016/0032-3861(93)90329-9, 1993. a, b
DNVGL, DNVGL-RP-0171: Testing of rotor blade erosion protection systems, https://www.dnv.com/energy/standards-guidelines/dnv-rp-0171-testing-of-rotor-blade-erosion-protection-systems/ (last access: 15 September 2026), 2018. a
DNVGL, DNVGL-RP-0573: Evaluation of erosion and delamination for leading edge protection systems of rotor blades, https://www.dnv.com/energy/standards-guidelines/dnv-rp-0573-evaluation-of-erosion-and-delamination-for-leading-edge-protection-systems-of-rotor-blades/ (last access: 15 September 2026), 2020. a
Doagou-Rad, S. and Mishnaevsky, L.: Rain erosion of wind turbine blades: computational analysis of parameters controlling the surface degradation, Meccanica, 55, 725–743, https://doi.org/10.1007/s11012-019-01089-x, 2020. a, b
Eisenberg, D., Laustsen, S., and Stege, J.: Wind turbine blade coating leading edge rain erosion model: Development and validation, Wind Energy, 21, 1–10, https://doi.org/10.1002/we.2200, 2018. a
Evans, A. G., Ito, Y. M., and Rosenblatt, M.: Impact damage thresholds in brittle materials impacted by water drops, J. Appl. Phys., 51, 2473–2482, https://doi.org/10.1063/1.328021, 1980. a, b
Fæster, S., Johansen, N. F.-J., Mishnaevsky, L. Jr., Kusano, Y., Bech, J. I., and Madsen, M. B.: Rain erosion of wind turbine blades and the effect of air bubbles in the coatings, Wind Energy, 24, 1071–1082, https://doi.org/10.1002/we.2617, 2022. a
Fraisse, A., Bech, J. I., Borum, K. K., Fedorov, V., Johansen, N. F.-J., McGugan, M., Mishnaevsky, L. Jr., and Kusano, Y.: Impact fatigue damage of coated glass fibre reinforced polymer laminate, Renew. Energy, 126, 1102–1112, https://doi.org/10.1016/j.renene.2018.04.043, 2018. a
Gent, A. N., Lindley, P. B., and Thomas, A. G.: Cut growth and fatigue of rubbers. I. The relationship between cut growth and fatigue, J. Appl. Polym. Sci., 8, 455–466, https://doi.org/10.1002/app.1964.070080129, 1964. a
Ghosh, P., Stocek, R., Gehde, M., Mukhopadhyay, R., and Krishnakumar, R.: Investigation of fatigue crack growth characteristics of NR/BR blend based tyre tread compounds, Int. J. Fract., 188, 9–21, https://doi.org/10.1007/s10704-014-9941-9, 2014. a, b, c, d, e
Harbour, R.J., Fatemi, A., Mars, W.V.: The Effect of a Dwell Period on Fatigue Crack Growth Rates in Filled SBR and NR, Rubber Chem. Technol., 80, 838–853, https://doi.org/10.5254/1.3539420, 2007. a, b
Harwood, J. A. C., Mullins, L., and Payne, A. R.: Stress Softening in Natural Rubber Vulcanizates. Part II. Stress softening in Pure Gum and Filler Loaded Rubbers, J. Polym. Sci., 9, 3011–3021, https://doi-org.proxy.findit.cvt.dk/10.1002/app.1965.070090907, 1965. a
Herring, R., Domenech, L., Renau, J., Šakalytė, A., Ward, C., Dyer, K., and SGánchez, F.: Assessment of a wind turbine blade erosion lifetime prediction model with industrial protection materials and testing methods, Coatings, 11, https://doi.org/10.3390/coatings11070767, 2021. a
Hoksbergen, N., Akkerman, R., and Baran, I.: The Springer Model for Lifetime Prediction of Wind Turbine Blade Leading Edge Protection Systems: A Review and Sensitivity Study, Materials (Basel), 15, https://doi.org/10.3390/ma15031170, 2022. a
Hu, W., Chen, W., Wang, X., Jiang, Z., Wang, Y., Verma, A. S., Teuwen, J. J. E.: A computational framework for coating fatigue analysis of wind turbine blades due to rain erosion, Renew. Energy, 170, 236–250, https://doi.org/10.1016/j.renene.2021.01.094, 2021. a
Ji, Y. M., and Han, K. S.: Fracture mechanics approach for failure of adhesive joints in wind turbine blades, Renew. Energy, 65, 23–28, https://doi.org/10.1016/j.renene.2013.07.004, 2014. a
Jespersen, K. M., Eftekhar, M., Frost-Jensen Johansen, N., Bech, J. I., Mishnaevsky, L., and Mikkelsen, L. P.: High rate response of elastomeric coatings for wind turbine blade erosion protection evaluated through impact tests and numerical models, Int. J. Impact Eng., 179, 104643, https://doi.org/10.1016/j.ijimpeng.2023.104643, 2023. a
Johansen, N. F.-J.: Test Methods for Evaluating Rain Erosion Performance of Wind Turbine Blade Leading Edge Protection Systems, PhD thesis, Technical University of Denmark, 165 pp., https://orbit.dtu.dk/en/publications/test-methods-for-evaluating-rain-erosion-performance-of-wind-turb, 2020. a, b
Jones, S. M., Rehfeld, N., Schreiner, C., and Dyer, K.: The development of a novel thin film test method to evaluate the rain erosion resistance of polyaspartate-based leading edge protection coatings, 14, https://doi.org/10.3390/coatings13111849, 2023. a
Keegan, M. H., Nash, D. H., and Stack, M. M.: On erosion issues associated with the leading edge of wind turbine blades, J. Phys. D: Appl. Phys., 46, 383001, https://doi.org/10.1088/0022-3727/46/38/383001, 2013. a, b
Kinsley, P., Porteous, S., Jones, S., Subramanian, P., Campo, O., and Dyer, K.: Limitations of Standard Rain Erosion Tests for Wind Turbine Leading Edge Protection Evaluation, Wind, 5, 1–20, https://doi.org/10.3390/wind5010003, 2025. a, b, c, d
Kocjan, T., Nagode, M., Klemenc, J., and Oman, S.: On fatigue crack growth testing and analysis of non-crystallising rubber using planar tension specimen, Polym. Test., 117, 107819, https://doi.org/10.1016/j.polymertesting.2022.107819, 2023. a
Lake, G. J. and Lindley, P. B.: The mechanical fatigue limit for rubber, J. Appl. Polym. Sci., 9, 1233–1251, https://doi.org/10.1002/app.1965.070090405, 1965. a
Maniaci, D., MacDonald, H., Paquette, J., and Clarke, R.: Leading Edge Erosion Classification System, Sandia National Laboratories (SNL), Albuquerque, NM, and Livermore, CA (United States), 52 pp., https://doi.org/10.2172/2432094, 2022. a, b
Mishnaevsky, L. and Thomsen, K.: Costs of repair of wind turbine blades: Influence of technology aspects, Wind Energy, 23, 2247–2255, https://doi.org/10.1002/we.2552, 2020. a
Mishnaevsky, L., Fæster, S., Mikkelsen, L. P., Kusano, Y., and Bech, J. I.: Micromechanisms of leading edge erosion of wind turbine blades: X-ray tomography analysis and computational studies, Wind Energy, 23, 547–562, https://doi.org/10.1002/we.2441, 2020. a
Pugh, K., Nash, J. W. K., Stack, M. M., and Reaburn, G.: Review of analytical techniques for assessing rain drop erosion resistance of materials, 14th Conference on Sustainable Development of Energy, Water and Environment Systems – Dubrovnik, Croatia, 1–6 Oct 2019, https://pureportal.strath.ac.uk/en/publications/review-of-analytical-techniques-for-assessing-rain-drop-erosion-r/ (last access: 15 September 2026), 2019. a, b
Rice, J. R.: A path independent integral and the approximate analysis of strain concentration by notches and cracks, J. Appl. Mech., 35, 379–388, https://doi.org/10.1115/1.3601206, 1968. a
Riddle, T. W., Nelson, J. W., and Cairns, D. S.: Effects of defects in composite wind turbine blades – Part 3: A framework for treating defects as uncertainty variables for blade analysis, Wind Energ. Sci., 3, 107–120, https://doi.org/10.5194/wes-3-107-2018, 2018. a
Rivlin, R. S. and Thomas, A. G.: Rupture of Rubber. I. Characteristic Energy for Tearing, J. Polym. Sci., 10, 291–318, https://doi.org/10.1002/pol.1953.120100303, 1953. a, b, c
Stadlbauer, F., Koch, T., Planitzer, F., Fidi, W., and Archodoulaki, V. M.: Setup for evaluation of fatigue crack growth in rubber: Pure shear sample geometries tested in tension-compression mode, Polym. Test., 32, 1045–1051, https://doi.org/10.1016/j.polymertesting.2013.06.003, 2013. a
Sundaraman, S., Hu, J., Chen, J., and Chandrashekhara, K.: Temperature dependent fatigue-failure analysis of V-ribbed serpentine belts, Int. J. Fatigue, 31, 1262–1270, https://doi.org/10.1016/j.ijfatigue.2009.01.019, 2009. a
Verma, A. S., Wu, C.-Y., Díaz, M. A., and Teuwen, J. J. E.: Analyzing rain erosion using a Pulsating Jet Erosion Tester (PJET): Effect of droplet impact frequencies and dry intervals on incubation times, Wear, 562–563, https://doi.org/10.1016/j.wear.2024.205614, 2025. a, b
Vimalakanthan, K., van der Mijle Meijer, H., Bakhmet, I., and Schepers, G.: Computational fluid dynamics (CFD) modeling of actual eroded wind turbine blades, Wind Energ. Sci., 8, 41–69, https://doi.org/10.5194/wes-8-41-2023, 2023. a
Visbech, J., Göçmen, T., Özçakmak, Ö. S., Meyer Forsting, A., Hannesdóttir, Á., and Réthoré, P.-E.: Aerodynamic effects of leading-edge erosion in wind farm flow modeling, Wind Energ. Sci., 9, 1811–1826, https://doi.org/10.5194/wes-9-1811-2024, 2024. a
- Abstract
- Introduction
- Method for testing and analyzing fatigue crack growth in elastomer sheet
- Results and discussion
- Conclusions, perspectives and future work
- Appendix A
- Code availability
- Data availability
- Author contributions
- Competing interests
- Disclaimer
- Acknowledgements
- Financial support
- Review statement
- References
- Abstract
- Introduction
- Method for testing and analyzing fatigue crack growth in elastomer sheet
- Results and discussion
- Conclusions, perspectives and future work
- Appendix A
- Code availability
- Data availability
- Author contributions
- Competing interests
- Disclaimer
- Acknowledgements
- Financial support
- Review statement
- References