
the Creative Commons Attribution 4.0 License.
the Creative Commons Attribution 4.0 License.
 | 15 Oct 2026
The HRRR Meteorology, Energy, and Transmission (MET) Toolkit: advancing high-resolution atmospheric data for contiguous US energy applications

Emina Maric
Ulrike Egerer
Grant Buster
Luke Lavin
Pavlo Pinchuk
Brandon Benton
David D. Turner
High-quality, multiyear atmospheric data are foundational for power system planning and grid integration. While the legacy Wind Integration National Dataset (WIND) Toolkit has long served as the industry standard, its historical record ends in 2013, leaving a critical gap in current modeling capabilities. Modern alternatives, such as the WIND Toolkit Long-term Ensemble Dataset (WTK-LED) and its Climate variant, offer extended coverage but exhibit higher wind speed biases and are computationally intensive to produce. This study introduces the High-Resolution Rapid Refresh Meteorology, Energy, and Transmission (HRRR MET) Toolkit, a repackaged version of the National Oceanic and Atmospheric Administration's native HRRR data. The HRRR MET Toolkit is designed to overcome the significant technical barriers associated with accessing native HRRR formats by providing a streamlined, user-friendly dataset with high vertical resolution at power-generation-relevant heights. To ensure seamless continuity for long-term studies, the HRRR MET Toolkit is provided on the same uniform 2 km horizontal grid as the legacy WIND Toolkit, offering both modern accessibility and spatial consistency with the established historical record. To evaluate potential performance gains, we also assessed an experimental bias-corrected version using quantile mapping against the WIND Toolkit as a climatological reference. We provide a comprehensive validation of both HRRR variants alongside the WTK-LED, its Climate variant, and the 2023 National Offshore Wind (NOW-23) dataset against long-term observations across the contiguous United States. Results indicate that the HRRR MET Toolkit significantly outperforms the WTK-LED suite; for instance, it reduces hub-height average wind speed bias to 0.10 m s−1 (compared to 0.82 m s−1 for the WTK-LED) and achieves an hourly wind speed correlation of 0.82. Critically, the comparison between the native and bias-corrected HRRR variants reveals that the statistical correction offers marginal benefits and in some cases exacerbates positive wind speed biases in complex terrain. We conclude that the native HRRR physics are sufficiently robust for energy applications and therefore recommend the HRRR MET Toolkit as a highly accessible, accurate, and less complex standard for modern power system studies in the United States.
- Article
(17718 KB) - Full-text XML
- BibTeX
- EndNote


This work was authored in part by the National Laboratory of the Rockies for the U.S. Department of Energy (DOE), operated under contract no. DE-AC36-08GO28308. Funding provided by US Department of Energy Office of Critical Minerals and Energy Innovation Integrated Energy Systems Office. The views expressed in the article do not necessarily represent the views of the DOE or the US Government. The US Government retains and the publisher, by accepting the article for publication, acknowledges that the US Government retains a nonexclusive, paid-up, irrevocable, worldwide license to publish or reproduce the published form of this work, or allow others to do so, for US Government purposes.
High-quality land-based and offshore wind and other atmospheric data covering multiple years of weather patterns are essential for planning and operating power systems with increasing shares of wind energy generation. With wind energy generation exceeding 10 % of annual electricity generation in the United States in 2022 (U.S. Energy Information Administration, 2023), accurate and temporally extensive wind resource data can improve efficiency of the North American power system. The energy community increasingly relies on large-scale modeled datasets to support long-term planning, grid operations, and resource assessment.
Historically, the National Laboratory of the Rockies' (NLR's) Wind Integration National Dataset (WIND) Toolkit (Draxl et al., 2015) has served as the gold standard for such analyses in North America, providing high-resolution meteorological data for the years 2007–2013 with a relatively low wind speed bias. More recently, the NLR released the WIND Toolkit Long-term Ensemble Dataset (WTK-LED) (Draxl et al., 2024) and its Climate variant (a 20-year, 4 km resolution continental simulation developed to provide a climatological record) to extend this record. However, these newer datasets present some trade-offs: they are computationally expensive to produce, and recent evaluations – derived from a comparison of legacy and modern validation analyses (Draxl et al., 2015, 2024) as well as the analysis presented herein – show they exhibit larger biases against meteorological observations than the legacy WIND Toolkit. For offshore wind analysis, the NLR released the 2023 National Offshore Wind (NOW-23) dataset (Bodini et al., 2024), which spans over 20 years but currently lacks continuous updates and has not been validated across all modeled regions. Consequently, these datasets do not fully meet all the best-practice criteria outlined by the Energy Systems Integration Group for modern power systems planning (Energy Systems Integration Group, 2023), particularly regarding multi-decadal coverage and a mechanism for continuous annual extension.
To address the need for a continuously updatable, high-fidelity dataset, the community has increasingly looked toward archived data from operational weather forecast models. The National Oceanic and Atmospheric Administration's (NOAA's) High-Resolution Rapid Refresh (HRRR) model (Dowell et al., 2022) provides an hourly updating operational weather forecast capability across the contiguous United States (CONUS). The potential of the HRRR archive for renewable energy applications was recognized early on: James et al. (2017) developed a unified high-resolution wind and solar energy dataset from the 2013–2015 HRRR record, and James et al. (2018) extended this effort to offshore wind speed estimates. Both studies included comparisons against the legacy WIND Toolkit using 80 m winds, thereby anticipating the transition to the HRRR-based energy dataset described herein. However, three significant barriers have historically prevented the widespread use of archived native HRRR data in power system analyses. First, the native data are stored in GRIB formats on hybrid levels that are difficult for energy modelers to utilize. Second, the model provides limited vertical resolution at heights relevant to modern wind turbines. Third, while HRRR shows strong weather forecast skill, previous studies have documented some wind speed biases (Buster et al., 2024b), particularly in regions with complex terrain (Pichugina et al., 2019; Collins et al., 2024) and for offshore ramp events (Yin and Peña, 2024).
To close this gap, the NLR developed the HRRR Meteorology, Energy, and Transmission (MET) Toolkit. This initiative provides a streamlined, energy-ready version of the HRRR (2015–2025) by performing spatial regridding, vertical interpolation, and temporal gap-filling. Critically, to maintain continuity with a decade of industry-standard modeling, the HRRR MET Toolkit is provided on the same horizontal grid as the legacy WIND Toolkit, ensuring the data are both accessible and spatially consistent with the historical record. Furthermore, motivated by the high accuracy of and desire of consistency with the legacy WIND Toolkit, the NLR also developed an experimental bias-corrected version (BC-HRRR) (Buster et al., 2024b, c). This version applies a quantile mapping methodology to anchor the HRRR distribution to the legacy WIND Toolkit's climatological baseline. This study presents both the native HRRR MET Toolkit and the BC-HRRR variant to determine whether statistical post-processing adds significant value over a robustly repackaged operational dataset.
Validation of wind resource datasets is fundamental for their acceptance in stakeholder applications; while modeled data provide consistent spatiotemporal coverage, they remain prone to systematic errors and biases when compared to in situ measurements. The Energy Systems Integration Group (Energy Systems Integration Group, 2023) explicitly identifies validation “against real conditions” as a primary requirement for high-quality resource datasets intended for power systems analyses. Ideally, models are validated against direct wind speed measurements from meteorological towers or remote sensing devices taken at commercial hub heights. Significant validation efforts have been undertaken internationally to meet this standard, most notably for the New European Wind Atlas. This initiative utilized an extensive network of masts and large-scale lidar campaigns to validate wind climates across Europe (Dörenkämper et al., 2020; Murcia et al., 2022; Cheynet et al., 2025). However, replicating this level of validation across North America remains challenging. The public availability of multi-decadal, (sub-)hourly time series at nominal turbine hub heights (approximately 80–140 m) is limited, creating a validation gap for large-scale spatiotemporal datasets in the United States.
While valuable validation studies exist within the North American domain, they typically face at least one of three critical limitations: low measurement height, restricted geographic scope, or reliance on vertical extrapolation. First, many studies rely on observations well below modern hub heights (Sheridan et al., 2025b, a) as they often depend on towers ranging from 10 to 60 m. Even the recent comprehensive validation of the WTK-LED Climate dataset by Peco et al. (2026) utilized 26 towers where the vast majority of sensors were located well below 100 m, failing to fully capture the wind shear profile relevant to modern rotors. Second, to overcome height limitations, researchers sometimes extrapolate near-surface measurements to hub height using power law, logarithmic profiles, or machine learning (Bodini et al., 2023), an approach that introduces additional uncertainty to the validation. Third, studies that do utilize high-quality hub-height data are often geographically restricted or dataset-specific. This includes validations focused exclusively on offshore environments (Optis et al., 2020b; Sheridan et al., 2026), a single site in Oklahoma (Pronk et al., 2022) or in the southeastern United States (Liu et al., 2025), or several sites all located within the Columbia River Gorge (Bianco et al., 2019). A recent and notable exception by Wilczak et al. (2024) provided a continent-wide validation of hub-height winds across the contiguous United States; however their work was focused on evaluating a global reanalysis product (ERA5). Consequently, a comprehensive, continent-wide validation at hub height that inter-compares the full suite of modern, high-resolution national datasets remains outstanding in the published literature.
In this paper, we perform a comprehensive comparison and validation of an entire suite of wind resource datasets for CONUS: the legacy WIND Toolkit, WTK-LED, WTK-LED Climate, NOW-23, the HRRR MET Toolkit, and BC-HRRR. We specifically investigate the value of bias-correcting an existing operational meteorological dataset (HRRR) to a wind-energy-specific baseline (WIND Toolkit) and whether these datasets can effectively replace the computationally intensive simulation of new datasets. To answer these questions, we inter-compare the individual models and subsequently validate them against observations across CONUS using multiyear measurement periods at hourly resolution. Section 2 introduces the modeled datasets used in our work, which are inter-compared in Sect. 3. Section 4 presents the observational datasets and methods used for model validation, the results of which are described in Sect. 5. We conclude and suggest future directions in Sect. 6.
A variety of wind resource datasets have been developed to support the US power system sector, ranging from historical reanalysis-type products to operational forecast-based models. While the legacy WIND Toolkit (Draxl et al., 2015) served as the industry standard for a decade, its temporal coverage ended in 2013, necessitating the development of the next-generation products described in this section. A table comparing the main technical specifications of the various datasets is included in the Appendix (Table A1).
2.1 WTK-LED and its Climate variant
The WTK-LED represents a significant update to the legacy WIND Toolkit, transitioning from a deterministic framework to a dataset that provides high-resolution time series alongside some model uncertainty estimates (Draxl et al., 2024). The dataset was generated using the Weather Research and Forecasting (WRF) model (v4.1.3) with boundary conditions provided by the ERA5 reanalysis (Hersbach et al., 2020). The core WTK-LED CONUS product provides data at a 2 km horizontal resolution and a 5 min temporal resolution. While originally released for the 2018–2020 period, additional years (2014–2015) have since been added and made publicly available. To characterize the wind resource across the entire rotor layer of modern turbines, the vertical grid includes nine heights between 10 and 200 m (10, 40, 60, 80, 100, 120, 140, 160, and 200 m).
To complement the high-resolution short-term simulations, the WTK-LED Climate variant was developed by Argonne National Laboratory. This climate-scale simulation covers the North American continent at a 4 km spatial resolution and 1 h temporal resolution, spanning a 20-year period from 2001 to 2020. While WTK-LED Climate offers a more robust climatological record, initial validations across 13 CONUS sites have shown a generally positive wind speed bias ranging from 0.5 to 2 m s−1, with performance metrics varying significantly by site and terrain complexity (Draxl et al., 2024).
2.2 NOW-23
The NOW-23 dataset is an offshore-specific, WRF-based product that supersedes the offshore components of the original WIND Toolkit (Bodini et al., 2024). NOW-23 provides a state-of-the-art wind resource atlas for all US offshore waters (excluding Alaska), covering the Atlantic, Pacific, Gulf of Mexico, Hawaii, and Great Lakes regions. Unlike the uniform national approach of WTK-LED, NOW-23 employs a regional tuning strategy. For each offshore region, the WRF model (v4.2.1) setup was selected based on validation against available observations (e.g., buoys and lidars) to account for unique regional meteorological phenomena. NOW-23 offers a consistent 20-year record (starting in 2000 and extending to 2019–2022, depending on the region) with 2 km horizontal resolution and 5 min temporal resolution. The dataset is particularly optimized for energy applications, featuring 12 vertical levels in the lowest 300 m of the atmosphere to accurately resolve the wind profile across the rotor disk. Validation efforts for NOW-23 (Bodini et al., 2024) have demonstrated its superior accuracy compared to legacy products.
2.3 HRRR MET Toolkit
The HRRR is an operational, hourly updating, convection-allowing atmospheric model developed by the NOAA. Built on the Advanced Research Weather Research and Forecasting core, the HRRR covers CONUS with a 3 km horizontal resolution (Dowell et al., 2022). The model is initialized hourly using a hybrid ensemble-variational data assimilation system that integrates radar reflectivity and other conventional observations to accurately capture mesoscale weather phenomena. Since its initial operational implementation in September 2014, the HRRR has undergone continuous development, resulting in four distinct versions (HRRRv1 through HRRRv4) that introduced improvements in physics and data assimilation (Table 1). The HRRR is known to be a highly accurate operational weather forecast model in the United States (James et al., 2022). Previous validation efforts show native HRRR data better match available wind generation observations than common alternatives like ERA5 (Hersbach et al., 2020) and MERRA-2 (Gelaro et al., 2017) at a hub height of 80 m (Millstein et al., 2023), although with a tendency to underestimate winds in selected US regions and for some wind speed ranges (Buster et al., 2024b; Pichugina et al., 2019; Collins et al., 2024; Yin and Peña, 2024).
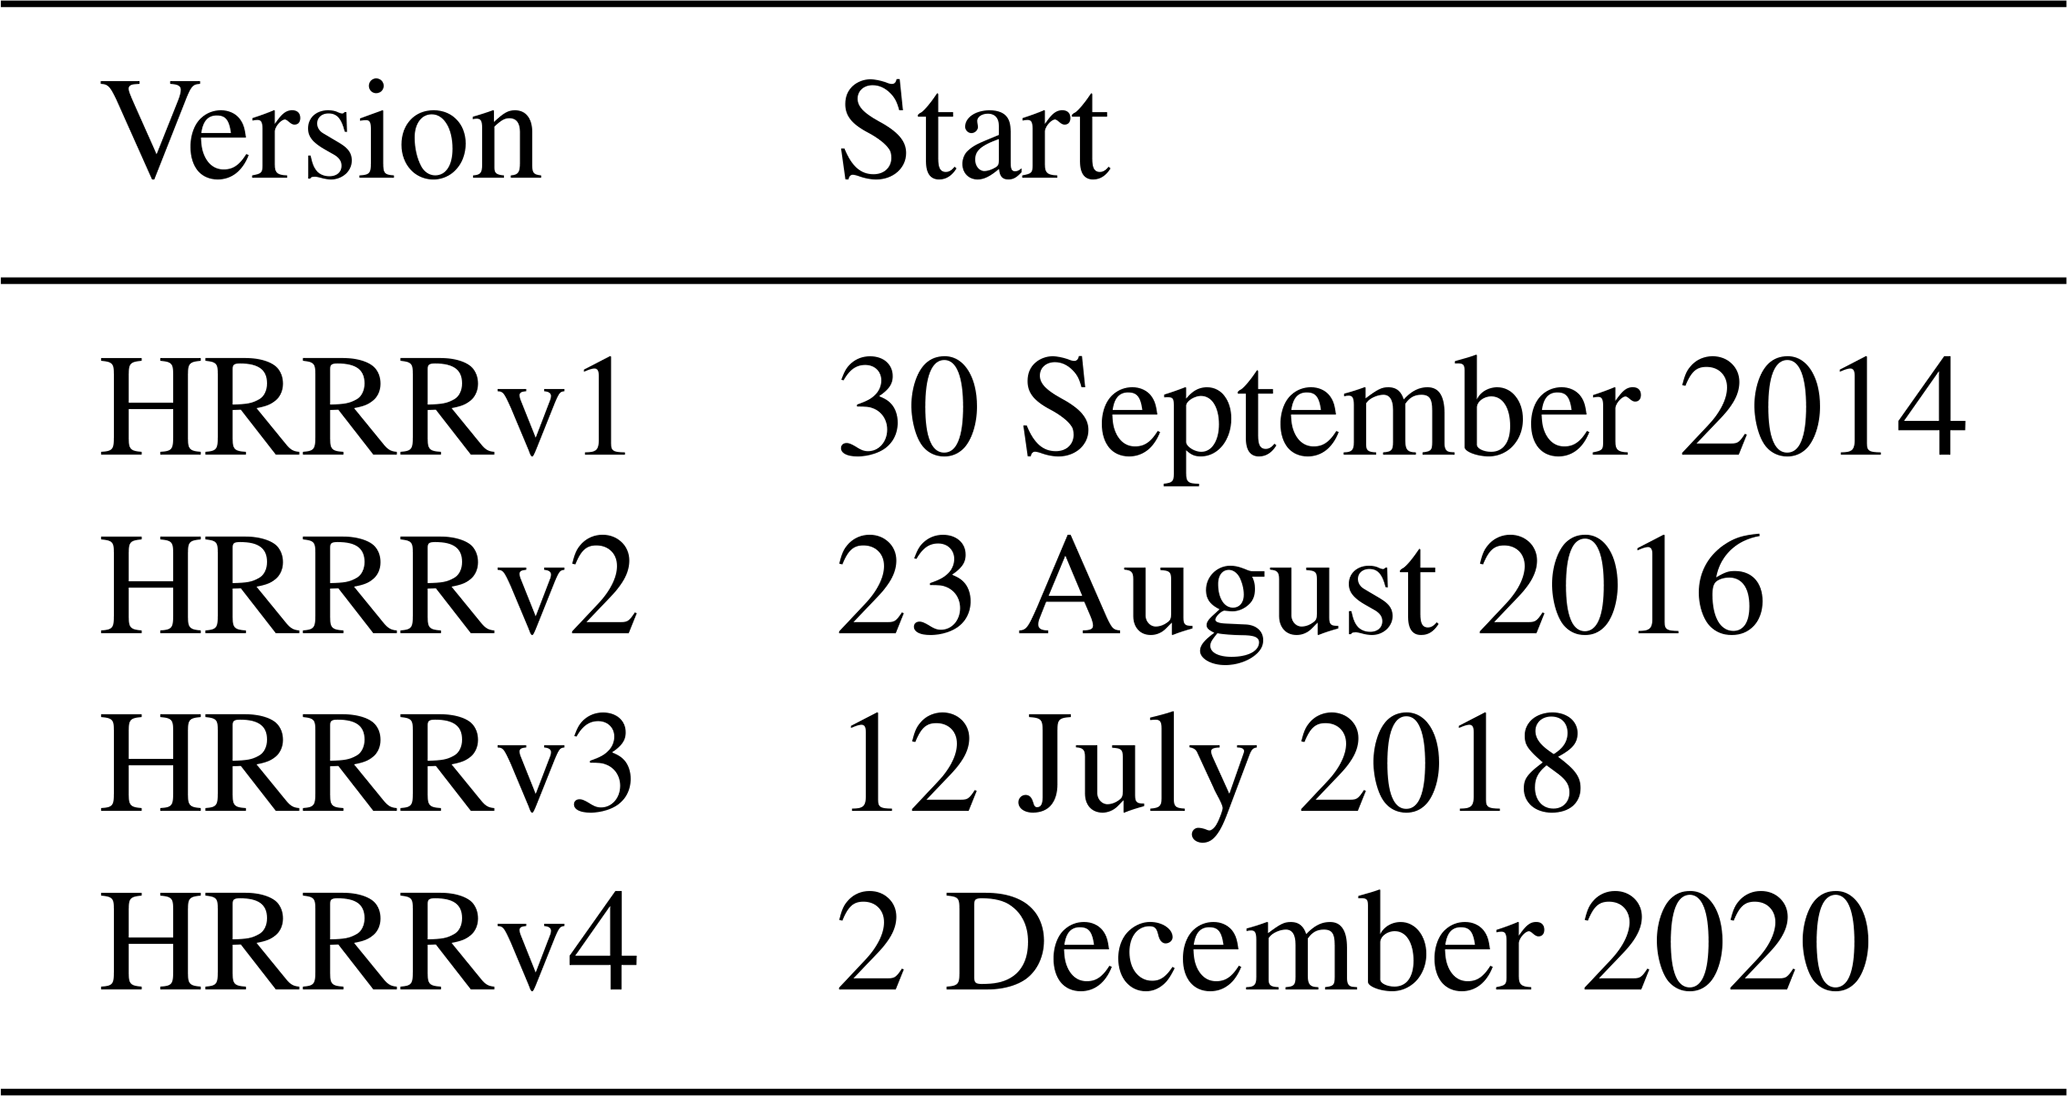
Unlike reanalysis datasets (e.g., ERA5 or MERRA-2) that are generated retrospectively with a frozen model configuration, the HRRR archive consists of real-time operational forecasts. While the HRRR provides a highly accurate record, the nature of the operational archive presents significant challenges for power system applications: the data are distributed as individual hourly GRIB files containing instantaneous fields with forecast lead times ranging from 0 h (analysis) to up to 48 h, stored on irregular hybrid vertical levels that offer limited resolution at modern turbine heights, and containing various temporal gaps (prior to 2019) in the public archive.
To resolve these barriers, the NLR developed the HRRR MET (Meteorology, Energy, and Transmission) Toolkit. This toolkit “repackages” the native HRRR archive into a continuous, energy-ready dataset that is both accessible and spatially consistent with legacy NLR datasets. The creation of the HRRR MET Toolkit involves a multistage processing pipeline:
-
Data acquisition and formatting. We acquire open-source HRRR data from the NOAA in GRIB format. To ensure the most realistic representation of atmospheric conditions, we utilize the f02 forecast hour (2 h after initialization) rather than the analysis hour (f00). This choice allows for sufficient model spin-up, balancing the ingested observational data with the model's physical consistency. James et al. (2017) discuss the rationale for preferring short-range HRRR forecasts over the f00 analysis in detail, having adopted the same approach for their HRRR-based renewable energy dataset (see also Vibrant Clean Energy, 2024). We compile these hourly forecasts to create a continuous historical record.
-
Spatial regridding. To ensure compatibility with the widely used the WIND Toolkit, we regrid the native 3 km HRRR data onto the 2 km WIND Toolkit spatial grid. This is achieved using inverse distance-weighted (IDW) interpolation with the four nearest neighbors. Each HRRR grid cell is matched to the four nearest WIND Toolkit grid cells, and the resulting value is calculated by weighting the neighbors inversely by distance, preserving spatial variability while aligning the projections. However, users should be aware that interpolating from a coarser grid to a finer grid inherently smooths the data without generating new physical information. While the four-point IDW interpolation introduces modest additional spatial smoothing, the primary constraint is dynamical: established spectral analyses indicate that internal numerical diffusion limits the effective resolution of WRF-based models to approximately 7Δx (Skamarock, 2004). Consequently, while the HRRR MET Toolkit is provided on a 2 km grid, the native 3 km HRRR – and by extension, this regridded dataset – resolves true physical features at scales of roughly 20 km.
-
Vertical interpolation. The HRRR model natively stores data on irregular hybrid sigma-pressure levels, which vary spatially and temporally. Common turbine hub heights (e.g., 60–140 m) typically fall between the lower model levels (e.g., 8, 23, 53, 106, and 198 m). We calculate the HRRR native level heights above ground as the geopotential height minus the model's orography. We linearly interpolate wind speeds from these time-varying native levels to fixed heights above ground level. The resulting HRRR MET Toolkit dataset provides wind resource variables at the same vertical levels as the WIND Toolkit: 10, 20, 40, 60, 80, 100, 120, 140, 160, 180, 200, 220, 240, 260, 280, 300, 400, and 500 m. This method is computationally efficient and preserves negative wind shear profiles critical for wind power analysis. It makes the data immediately usable for industry-standard power conversion models.
-
Temporal gap filling. The public HRRR f02 native files contain missing data, specifically 1789 missing hours between 2015 and 2018 (approximately 5.1 % of the period). To provide a complete hourly record, we employ a hierarchical gap-filling strategy.
-
Alternative forecast horizons. Missing f02 time steps are populated using forecasts from previous initialization hours, utilizing horizons up to f06 (e.g., filling a missing 06:00 UTC f02 using the f03 forecast initialized at 03:00 UTC).
-
Pressure-level data. If native-level data are unavailable through f06, we utilize f02 pressure-level data, which have significantly fewer gaps (only 47 missing hours in the 2015–2017 period).
-
Linear interpolation. For the remaining 25 h of missing data (all in 2016, including 1 full missing day), values are linearly interpolated between the closest available valid time steps.
-
The HRRR MET Toolkit currently covers 2015–2025 and is intended to be extended annually. The following variables are available as 60 min instantaneous data: boundary layer height, friction velocity, latent heat flux, precipitation rate, pressure, relative humidity, roughness length, sensible heat flux, skin temperature, specific humidity, temperature, wind direction, and wind speed. Note that boundary layer height, friction velocity, latent heat flux, roughness length, and sensible heat flux are not available for the HRRRv1 period.
Radiation and solar irradiance variables were not included in the current release. For high-fidelity solar resource data in the United States, users typically rely on the National Solar Radiation Database (NSRDB; Sengupta et al., 2018). Users specifically requiring solar data that are physically consistent with the HRRR MET Toolkit meteorology can extract shortwave and longwave radiation fields directly from the native NOAA HRRR archive. However, systematically evaluating the accuracy of these native HRRR radiation fields against the NSRDB remains an important area for future research, particularly to support combined wind–solar grid integration studies. Should solar radiation variables be incorporated into a future release of the HRRR MET Toolkit, we note that – in contrast to the wind fields, for which the f02 forecast is preferred to allow model spin-up – the HRRR downward shortwave radiation is most accurate at the 0 h analysis time (f00), as the HRRR exhibits a positive shortwave radiation bias that grows with forecast horizon (Benjamin et al., 2025).
Characterization of wind speed in the HRRR MET Toolkit
Since it is a newly released dataset, here we provide a climatological characterization of the hub-height wind conditions as modeled in the HRRR MET Toolkit dataset. Figure 1 shows the mean wind speeds for the 2015–2025 period at 100 m (a proxy for land-based hub height). We note that the HRRR dataset spans four model versions (HRRR v1–v4; Table 1), each introducing improvements in model physics and data assimilation. The impact of these version transitions on temporal consistency of the dataset is analyzed in Sect. 5 (Fig. 18).
The annual cycle of 100 m wind speed, expressed as the difference in each month's mean from the overall annual mean, is shown in Fig. 2. Overall, the wind resource is larger in the winter and early spring months across the majority of CONUS, with the lowest wind speeds occurring in the summer. The Atlantic coast exhibits the largest magnitude in the annual cycle, whereas the magnitude is more limited in the central US wind belt, where the majority of wind turbines are currently deployed.
The diurnal cycle, expressed as the difference in each UTC hour's mean from the overall mean, is presented in Fig. 3. A stronger diurnal cycle is observed in the mountainous areas of the western US and in the southern portion of the central US (around Texas), characterized by stronger winds in the local evening (03:00 UTC) and lowest winds in the local morning (16:00 UTC). The timing of the cycle varies geographically: mountain regions show an earlier cycle, where stronger winds begin after local noon and end around midnight. In contrast, the Central Plains exhibit a delayed cycle, with stronger winds starting in the late evening and lasting through dawn, a phenomenon potentially linked to the frequent nocturnal low-level jets in those regions.
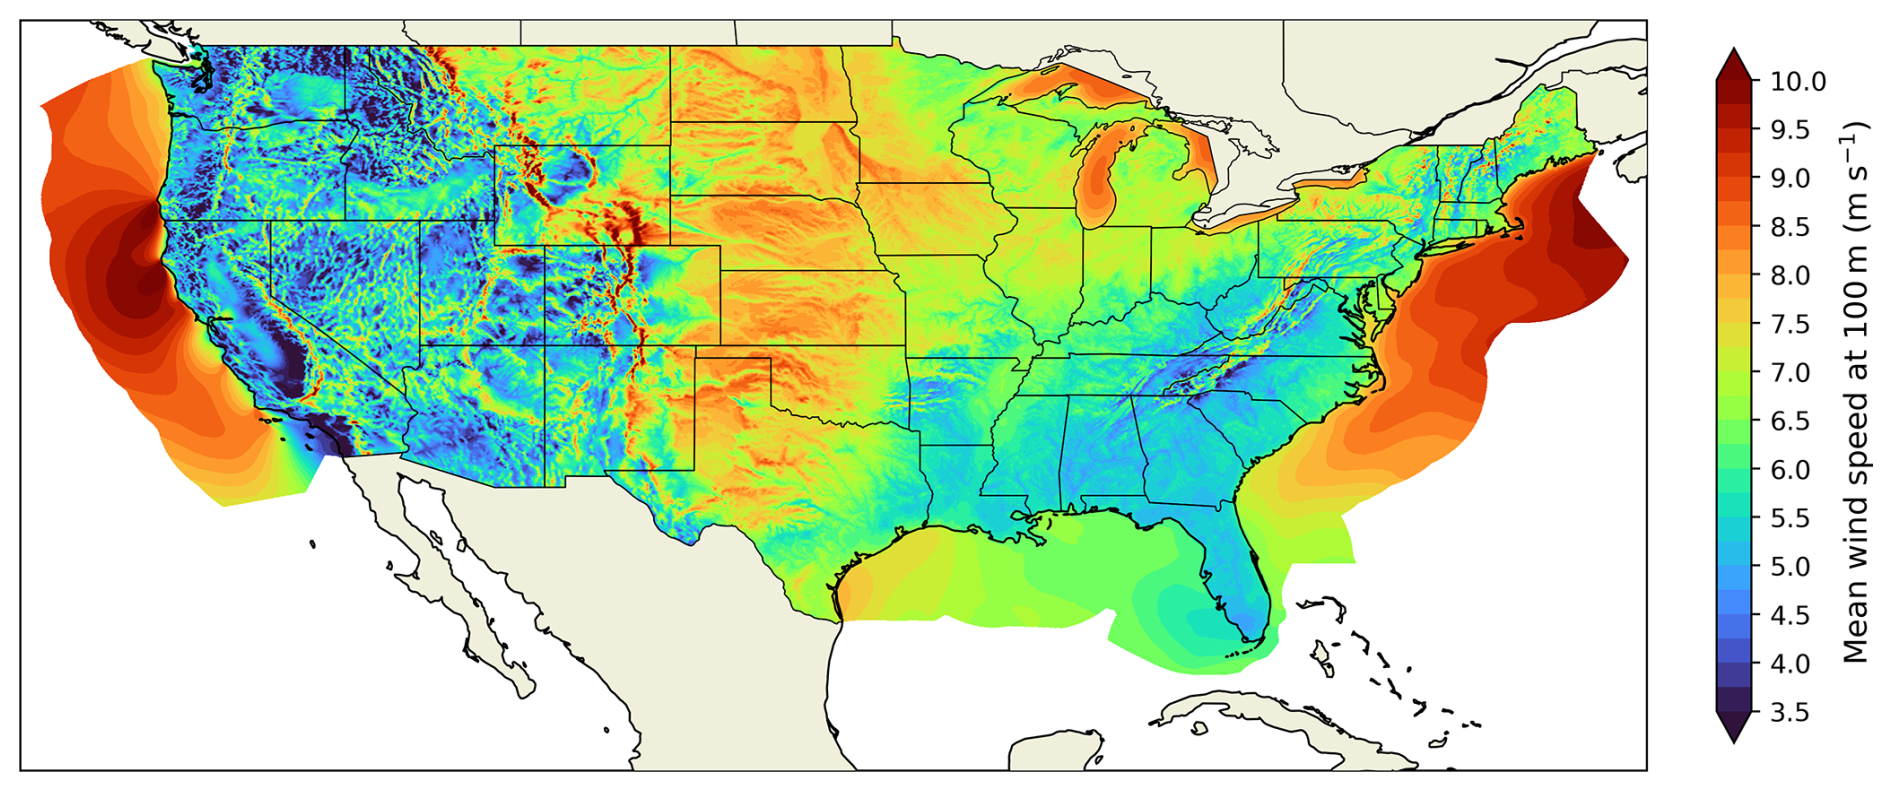
Figure 1Mean 100 m wind speed from the HRRR MET Toolkit (2015–2025).
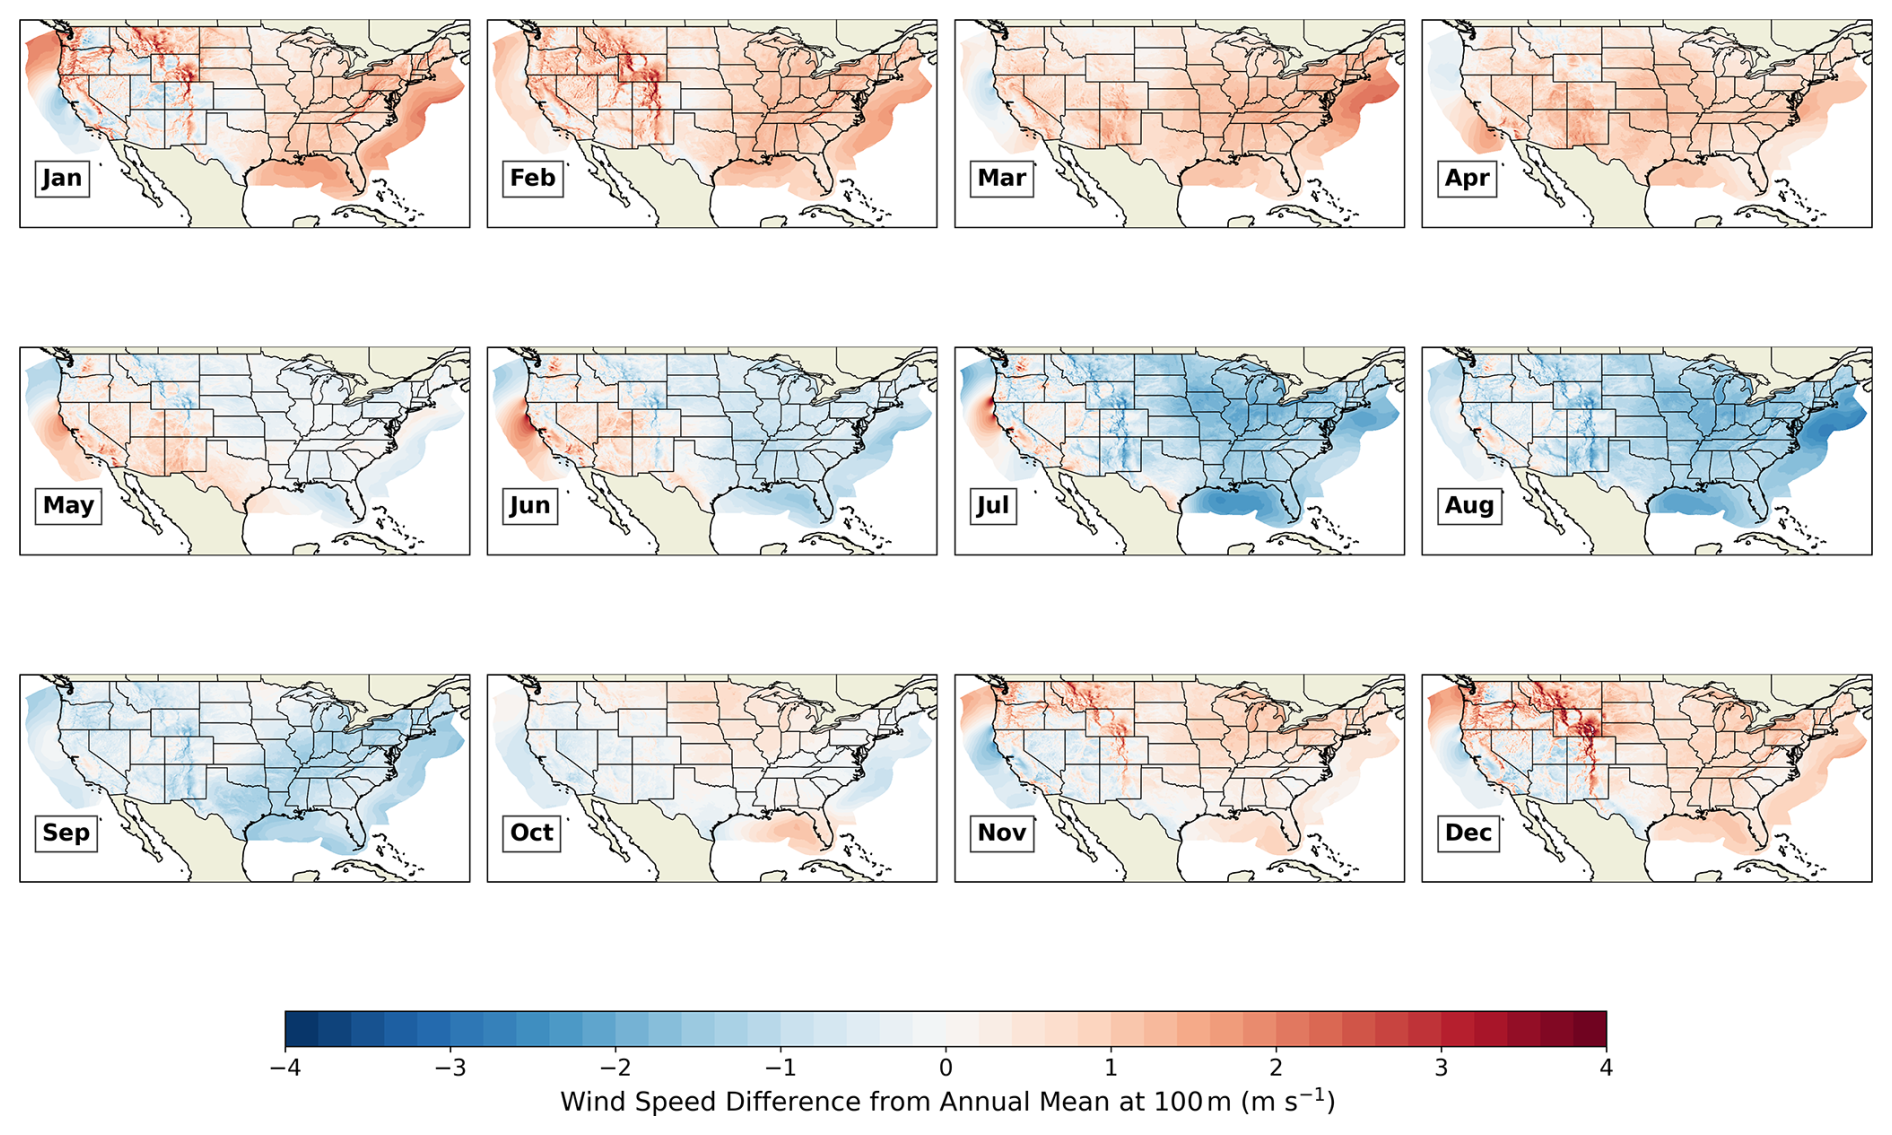
Figure 2Maps showing the annual cycle of 100 m wind speed in the HRRR MET Toolkit, expressed in terms of the difference for each month's mean wind speed from the overall mean.
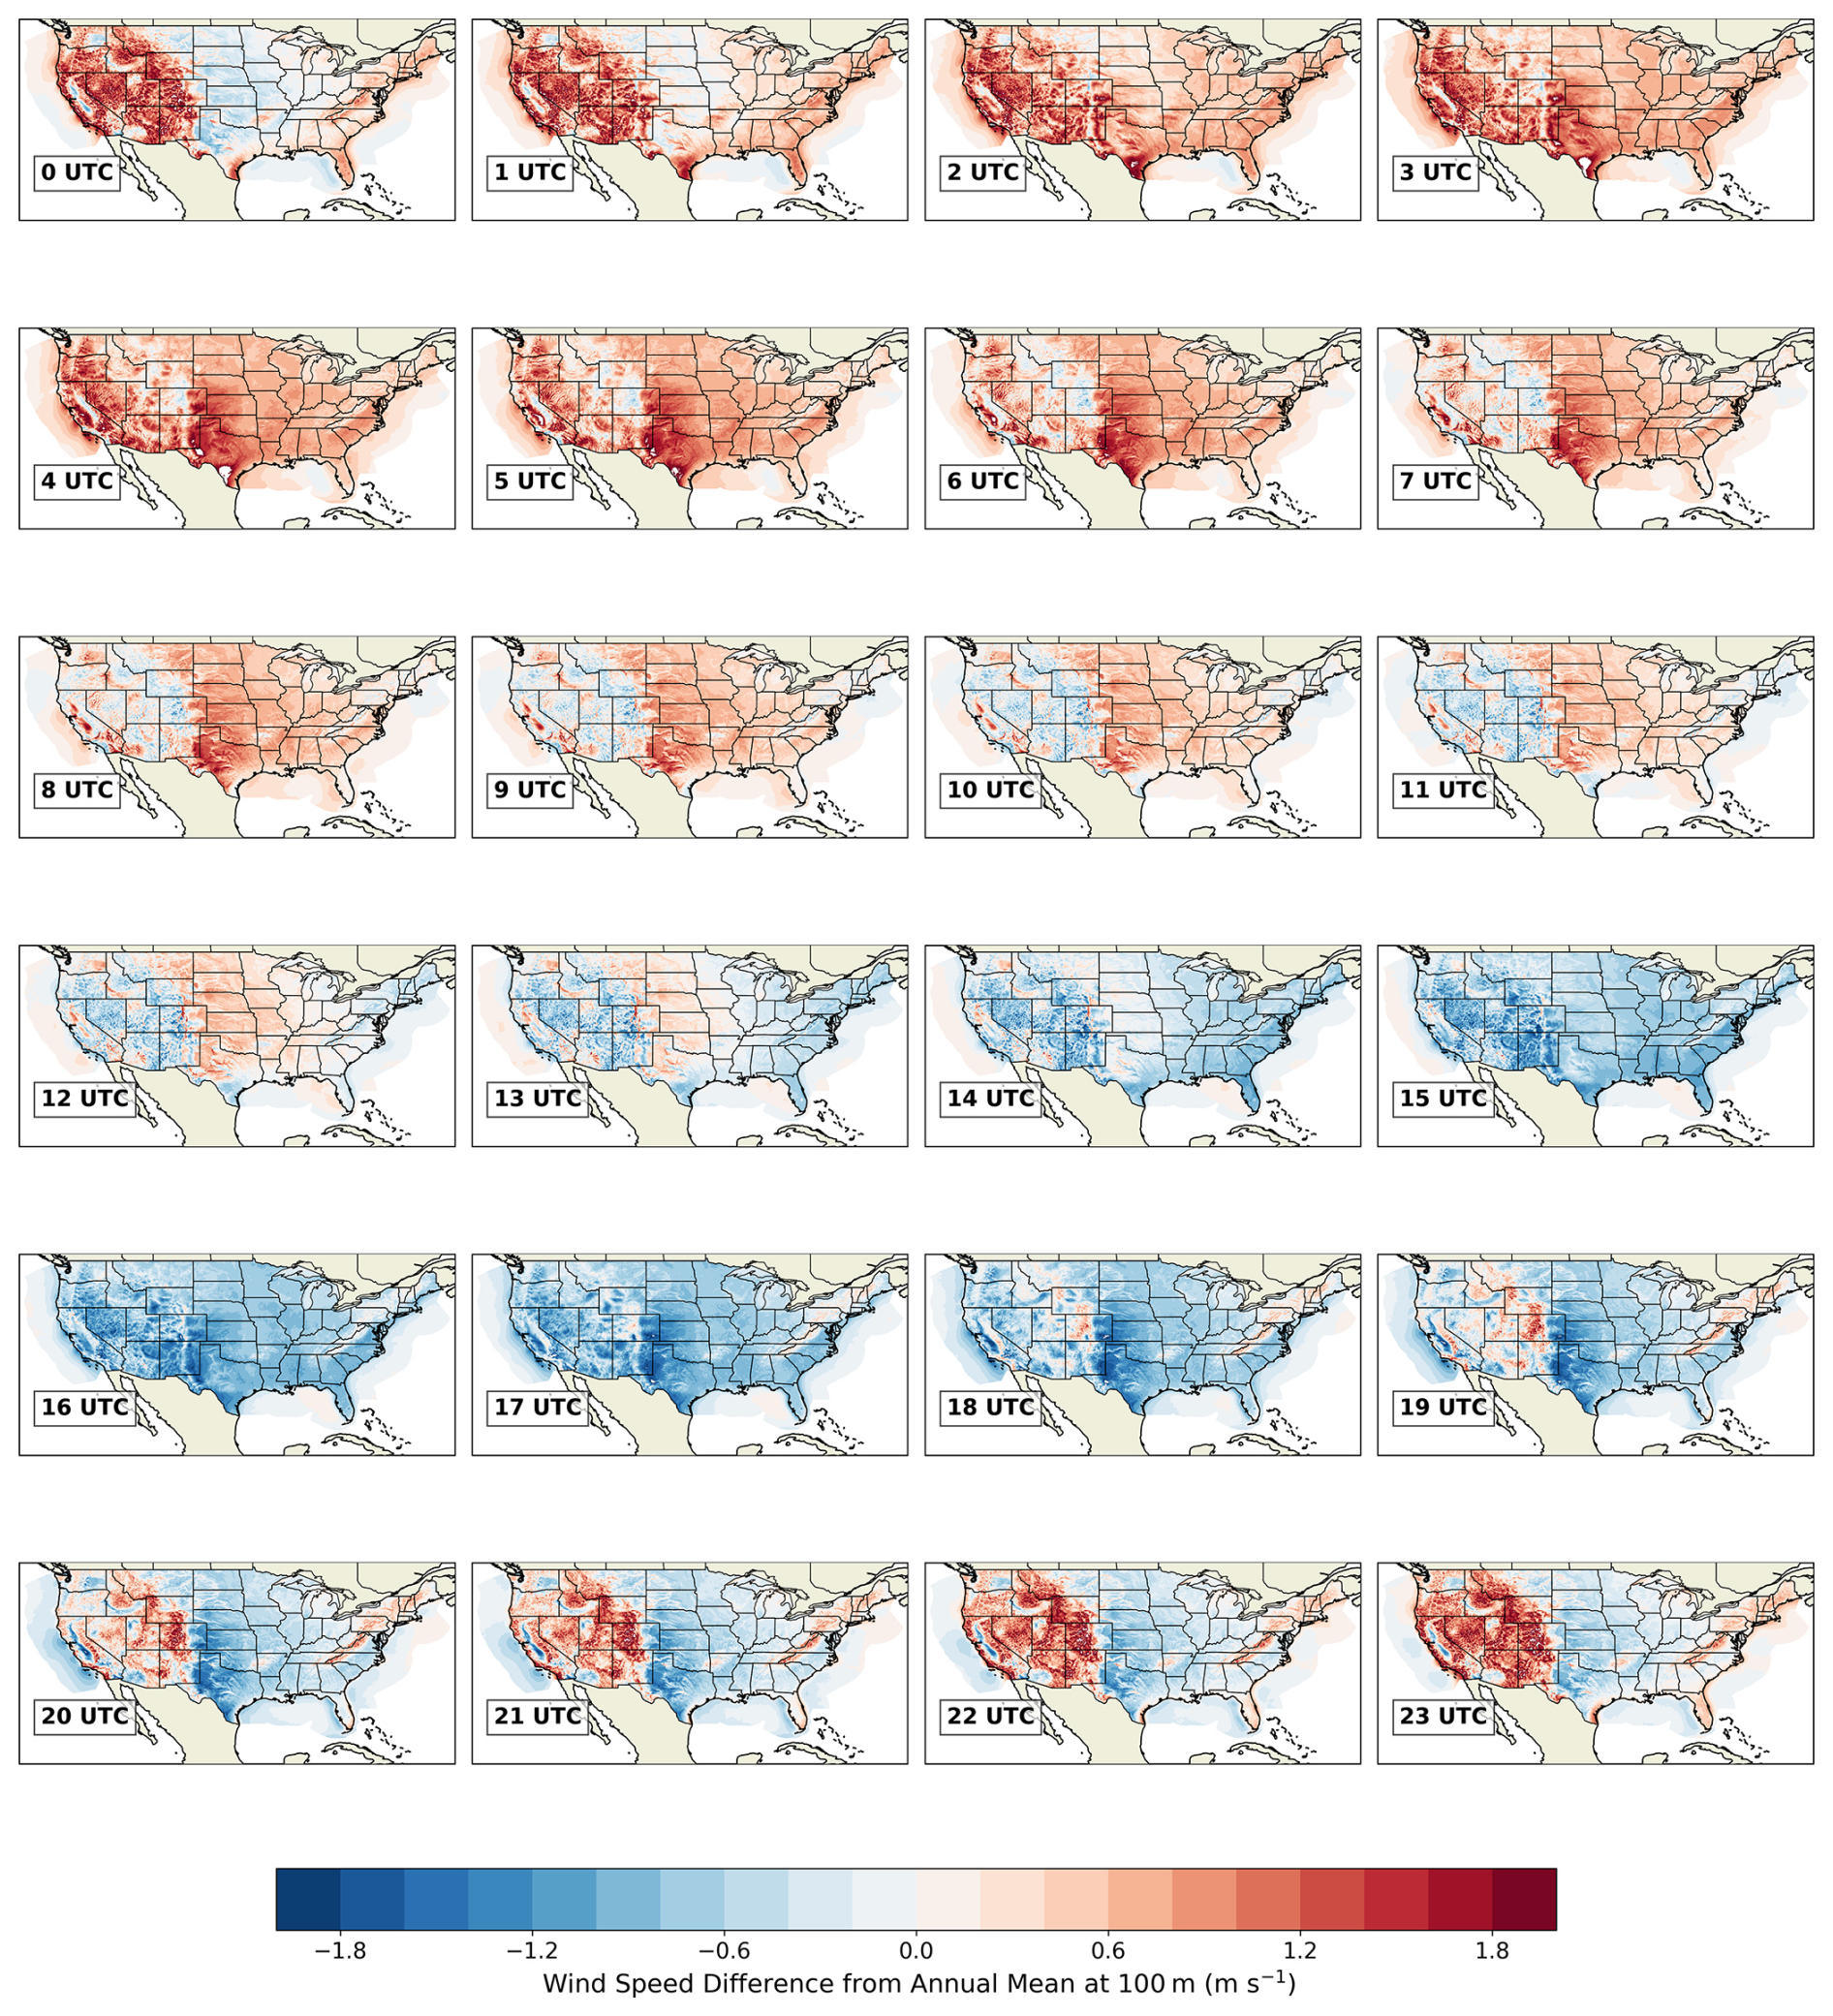
Figure 3Maps showing the diurnal cycle of 100 m wind speed in the HRRR MET Toolkit, expressed in terms of the difference for each (UTC) hour's mean wind speed from the overall mean.
2.4 BC-HRRR
The BC-HRRR dataset is an experimental variant (2015–2023) derived from the HRRR MET Toolkit, developed to consider whether applying a statistical bias correction (BC) against a wind-energy-specific baseline could improve the accuracy of the operational data; the effectiveness of this BC approach is evaluated in Sect. 5 and discussed in Sect. 6. The “BC” in BC-HRRR refers to a quantile mapping bias correction (Maraun, 2016) applied to the interpolated wind speeds to anchor the HRRR distribution to the WIND Toolkit baseline. The corrected wind speed xBCHRRR is calculated as
where CDFHRRR is the cumulative distribution function of the 2015–2023 HRRR MET Toolkit data, and is the inverse CDF of the 2007–2013 WIND Toolkit data. This process is performed with CDFs unique to each spatial grid point and height level using 100 quantiles sampled with an inverse log relationship to better resolve the high-wind-speed tail of the distribution. By construction, the quantile mapping procedure eliminates mean distributional differences between the HRRR and the WIND Toolkit at each grid point and height level. Due to standard numerical interpolation between discrete quantiles, negligible residual differences remain (±0.03 m s−1), meaning the long-term mean wind speed bias is effectively zero (see Appendix C). We note that wind direction is not affected by this correction. Also, future work may explore the use of quantile delta mapping (Cannon et al., 2015) as a method to allow for long-term trends and annual deviations in wind resource from the WIND Toolkit baseline. Appendix B analyzes ERA5 long-term data to assess the extent to which the WIND Toolkit period represents long-term conditions. We utilize ERA5 reanalysis data for this assessment because it provides a consistent, multi-decadal dataset necessary for evaluating relative temporal variability. We acknowledge that ERA5 is not bias-free; for instance, Wilczak et al. (2024) and Pronk et al. (2022) have documented systematic wind speed biases in ERA5 over the contiguous United States. However, ERA5 is used here exclusively to evaluate internal temporal shifts rather than as a validation reference. Because our analysis focuses strictly on relative temporal anomalies – comparing specific ERA5 epochs against the ERA5 long-term mean – these systematic biases are effectively differenced out.
The following variables are included as 60 min instantaneous data in BC-HRRR: wind speed and direction at 10, 20, 40, 60, 80, 100, 120, 140, 160, 180, and 200 m; temperature at 2, 10, 20, 40, 60, 80, 100, 120, 140, 160, 180, and 200 m; pressure at 0 m; cumulative precipitation; and specific and relative humidity at 2 m.
It is critical to validate synthetic wind resource datasets to ensure their suitability for power systems analysis (Energy Systems Integration Group, 2023). Direct validation against in situ measurements is the gold standard and is the subject of Sects. 4 and 5. However, continental-scale validation at modern turbine hub heights is constrained by the scarcity of publicly available, long-term observational campaigns. Thus, it is also important to characterize the relationship between the different wind resource datasets across the United States. Understanding these differences is critical for users intending to concatenate multiple datasets to create multi-decadal records or those transitioning established workflows from legacy products to newer ones.
We present a comprehensive inter-comparison of all overlapping dataset pairs in Fig. 4. To ensure a fair, like-for-like comparison that isolates model differences from inter-annual climate variability, each pairwise difference (row minus column) in this matrix is computed exclusively using the overlapping temporal periods for that specific dataset pair. We note that this strict temporal matching differs from the experimental bias correction methodology used for BC-HRRR (Sect. 2.4). In that experimental approach, the WIND Toolkit (2007–2013) was deliberately used as a climatological target for the HRRR (2015–2023) despite the absence of temporal overlap – a constraint necessitated by dataset availability but justified by the representativeness of the WIND Toolkit epoch for long-term CONUS wind conditions (see Appendix B). For the direct model inter-comparisons presented here, however, exact temporal overlap is strictly required.
The WIND Toolkit is excluded from this matrix because it shares minimal temporal overlap with the other datasets, intersecting only with NOW-23 and WTK-LED Climate. Readers interested in a comparison between the WIND Toolkit and NOW-23 are referred to Bodini et al. (2024).
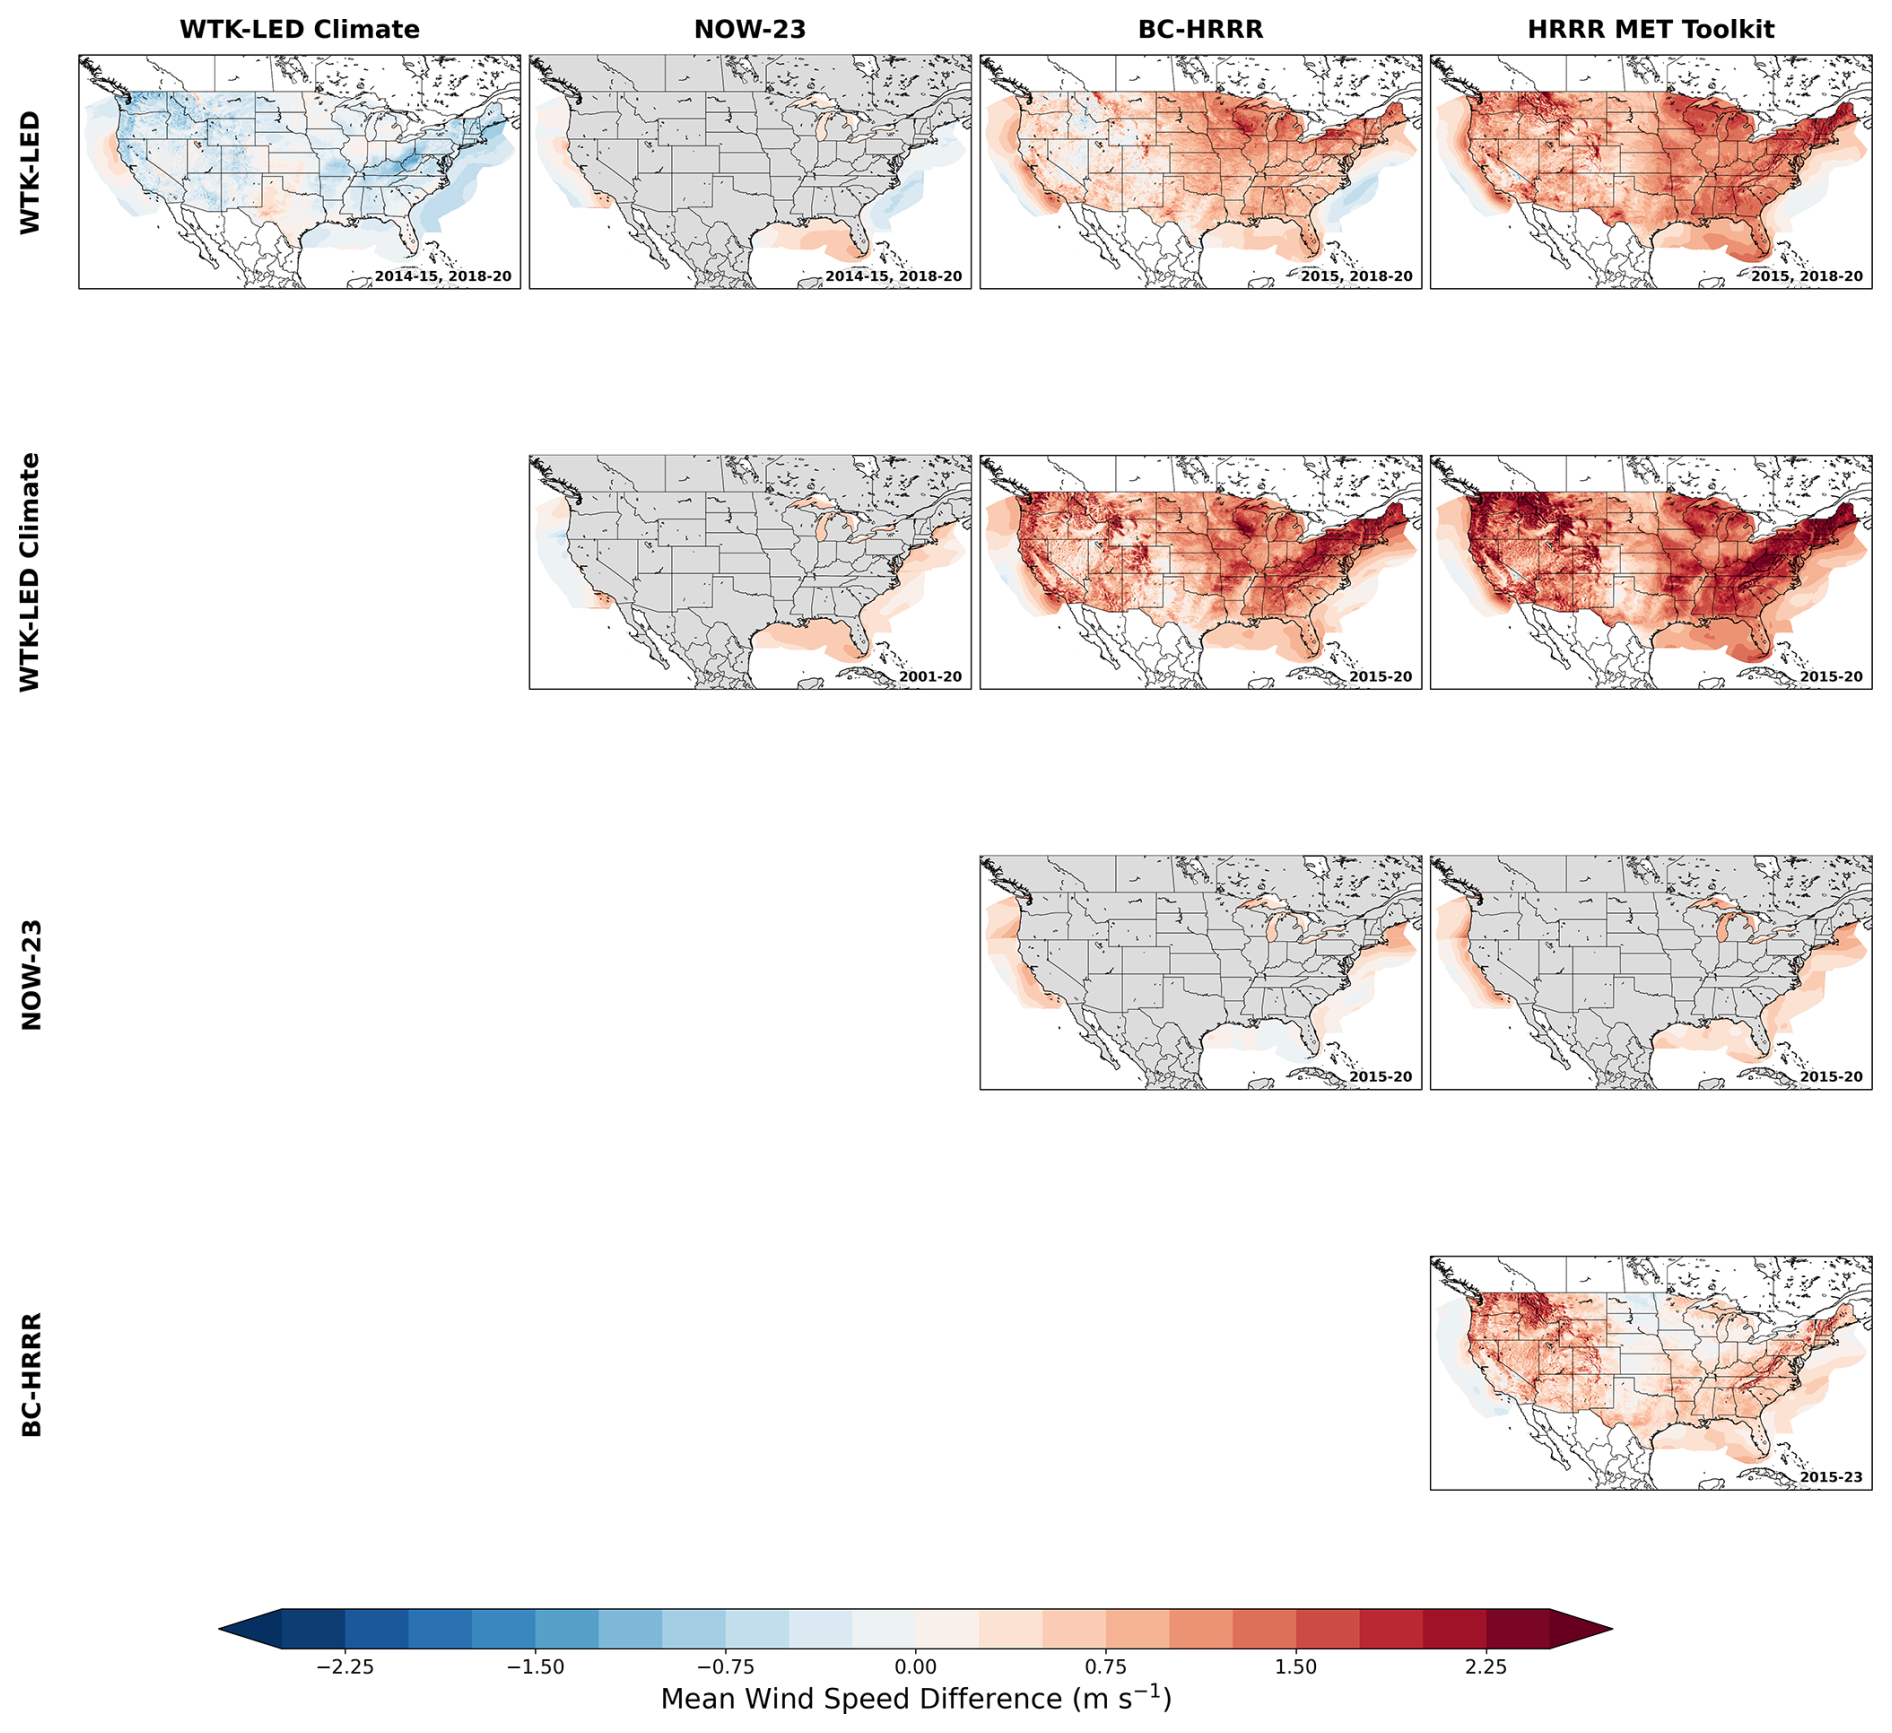
Figure 4Matrix of pairwise mean 100 m wind speed differences between the considered modeled datasets. Each panel displays the mean difference calculated as the dataset on each row minus the dataset on each column. Differences are computed using only the overlapping time periods available for each specific pair, as indicated by the year labels in the bottom-right corner of each panel. Onshore regions are masked in gray for comparisons involving NOW-23, which is exclusively an offshore dataset.
The inter-comparison reveals a systematic divergence between the WTK-LED family and the HRRR-based products. As illustrated in the upper-right quadrant of Fig. 4, both WTK-LED and WTK-LED Climate exhibit consistently higher mean wind speeds than the HRRR products across the majority of the CONUS domain. Subsequent validation (Sects. 4 and 5) confirms that the lower wind speeds in the HRRR MET Toolkit and BC-HRRR represent a significant gain in accuracy, as the legacy WTK-LED products tend to overestimate the resource. Notably, the two WTK-LED variants show relatively strong internal consistency, with the original WTK-LED modeling slightly stronger winds (mean differences <0.5 m s−1) than its Climate counterpart (except for some larger deviations in the eastern United States).
For the offshore resource, comparisons involving the regionally segmented NOW-23 dataset reveal that it generally predicts slightly higher wind speeds than BC-HRRR and the HRRR MET Toolkit. The closest agreement occurs off the southern Pacific coast, Gulf of Mexico, and off the southern Atlantic coast. This alignment is likely driven by methodological similarities, as these regions utilized a planetary-boundary-layer scheme (see details in Table A1) for NOW-23 that is consistent with the WIND Toolkit (which serves as the bias correction proxy for BC-HRRR). In contrast, BC-HRRR models lower mean wind speeds than NOW-23 in other coastal regions, though these differences typically remain below 1 m s−1. Overall, dataset spread is notably more muted offshore than onshore, suggesting higher modeling consensus in marine environments.
Finally, comparing BC-HRRR against the HRRR MET Toolkit (processed with identical regridding and interpolation but without bias correction) isolates the specific impact of the quantile mapping. The most pronounced adjustments occur in the complex terrain of the western United States and the Appalachian Mountains, where BC-HRRR yields higher mean 100 m wind speeds. Conversely, in the “wind belt” in the central United States – the region currently hosting the highest density of land-based wind capacity – the differences are minimal.
Observational datasets for model validation were selected to span a range of geographies, climates, and land–sea interfaces across CONUS to ensure that model strengths and weaknesses are captured across multiple environments. We prioritize datasets that are publicly accessible, consistently archived, and with near-hub-height measurements (e.g., tall towers and lidars). This allows a more direct and physically meaningful comparison to model wind speeds at heights relevant for the wind energy industry without relying on vertical extrapolation methods. We further target long, continuous time series, prioritizing datasets with multiyear records and at least hourly resolution to capture diurnal cycles. The observational data selected for this study are summarized in Table 2, and Fig. 5 shows a terrain map with the observational stations.
Table 2Summary of observational datasets used in this study. The temporal range indicates the period used in our validation analysis. For offshore stations, the last column reports the approximate distance to the nearest shoreline.
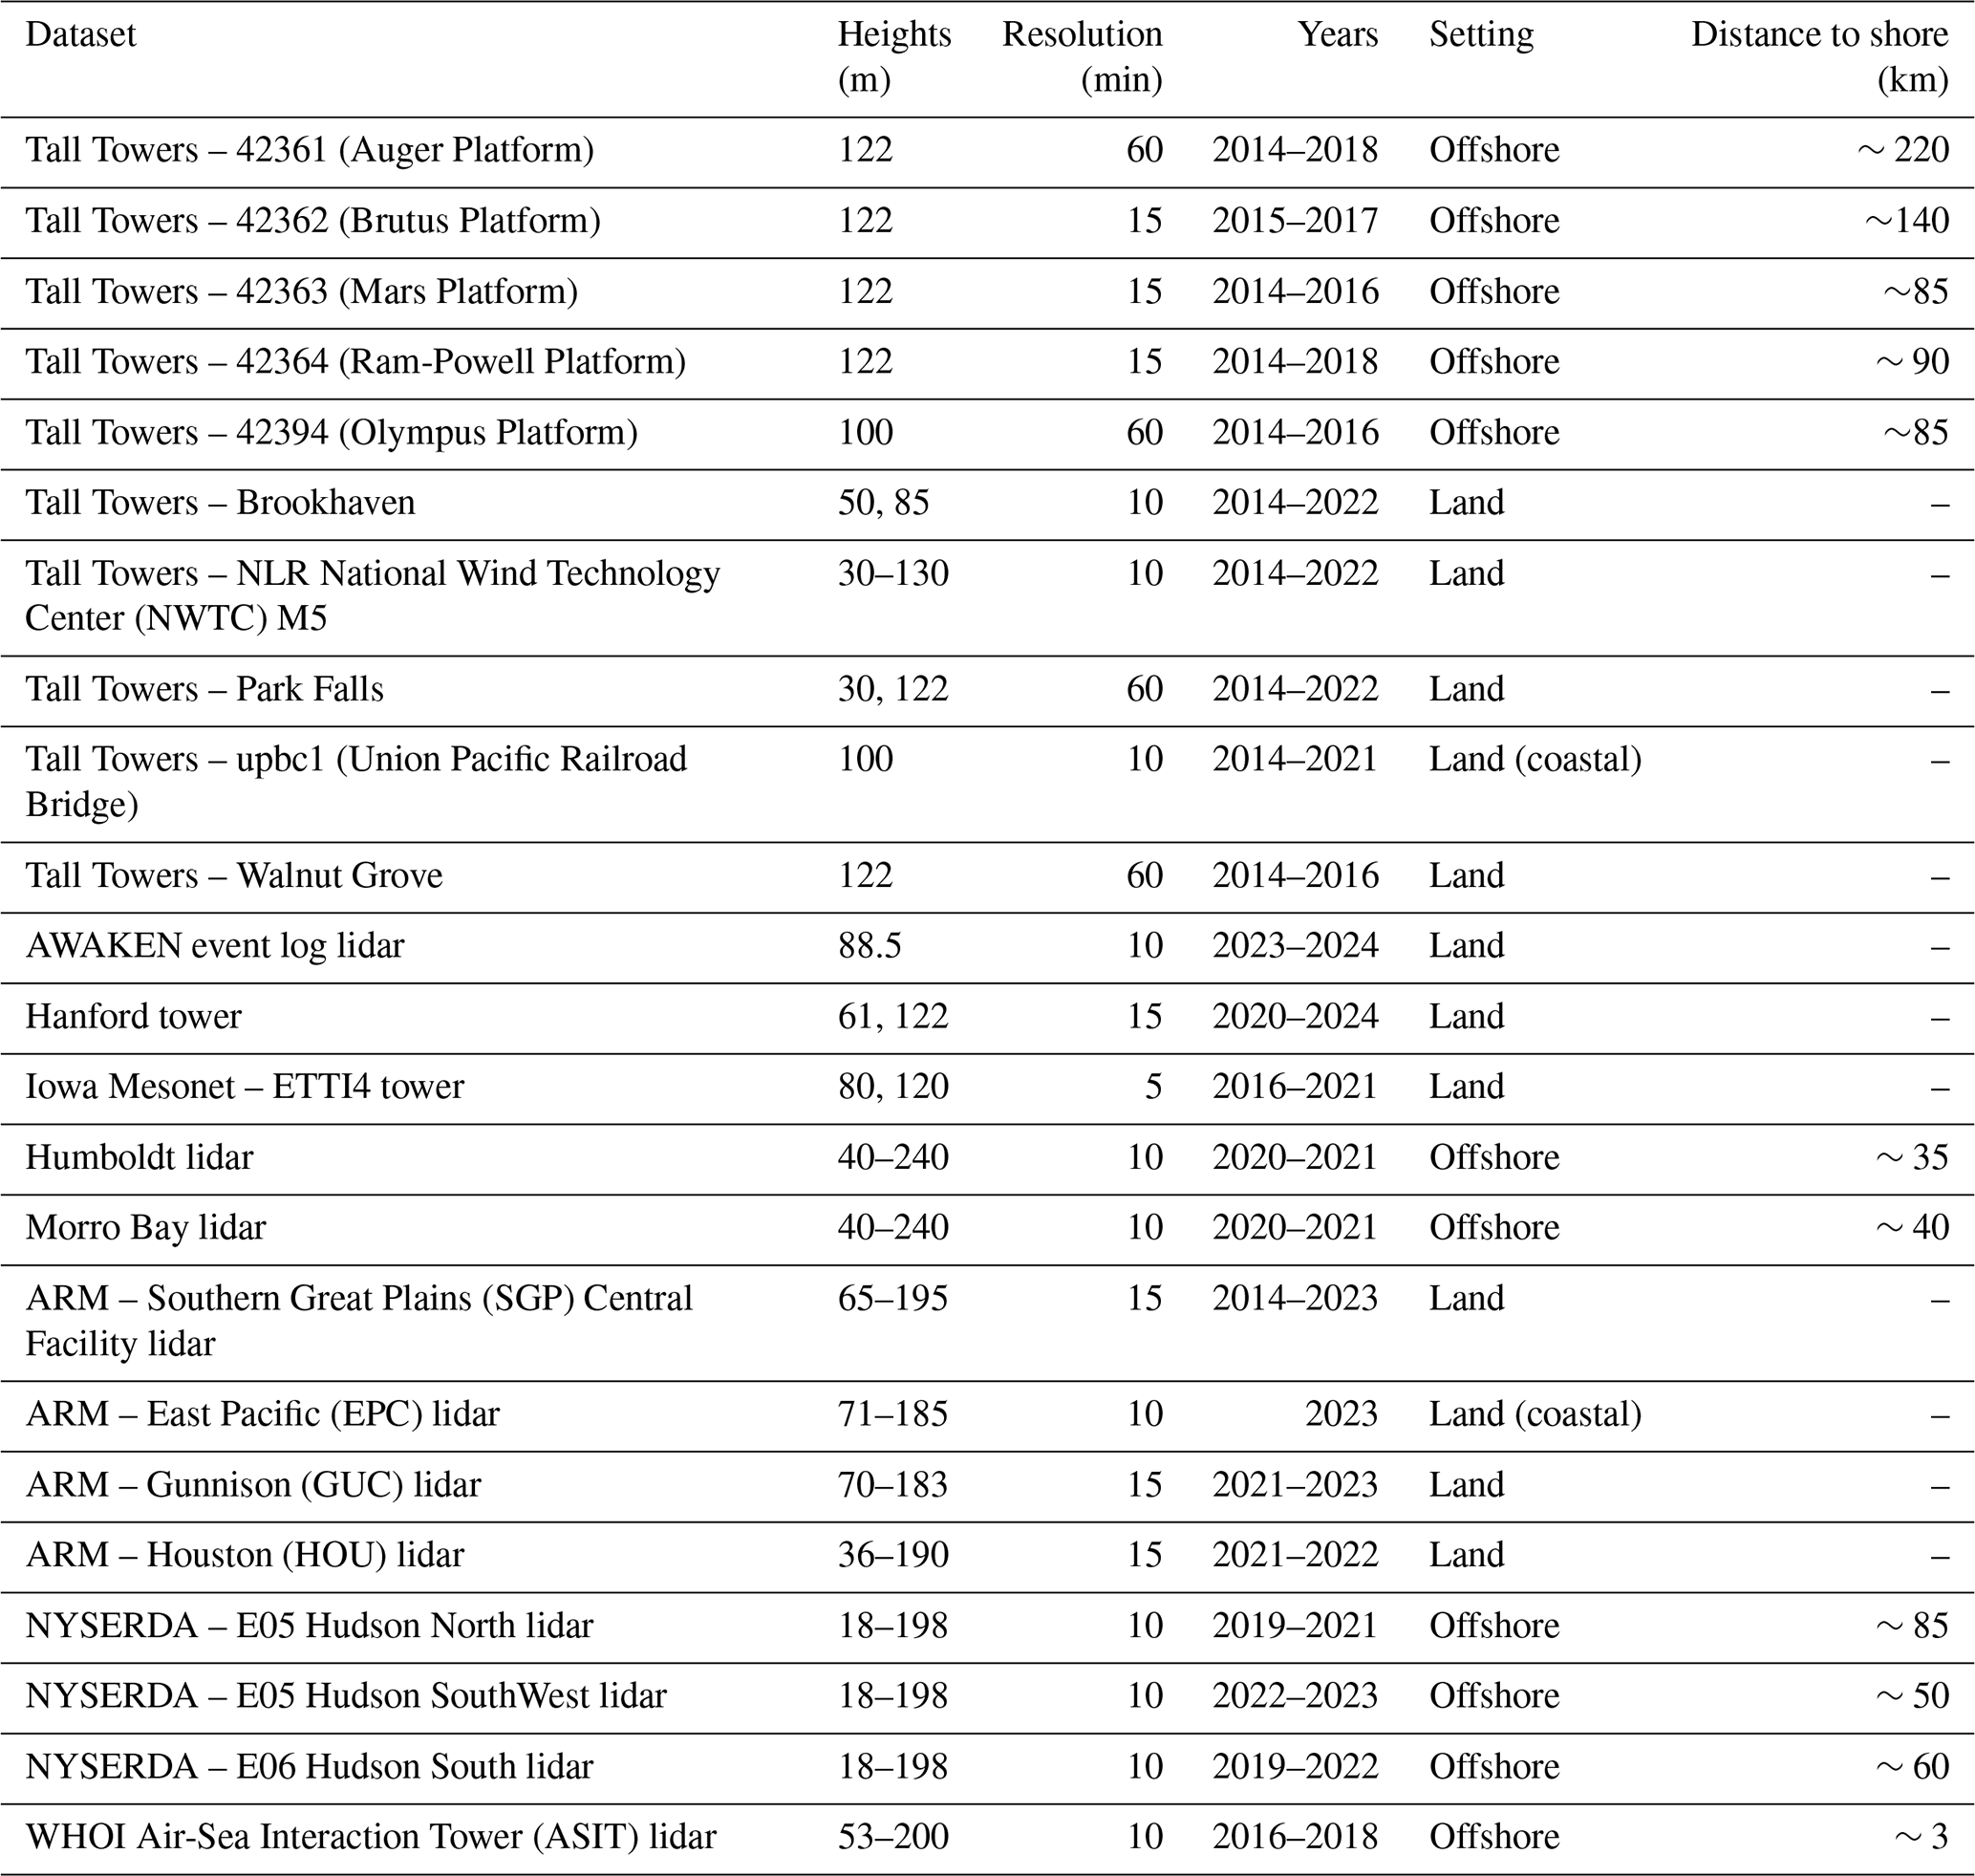
The five Gulf of Mexico stations (42361–42364 and 42394) consist of anemometers mounted on structures atop large offshore oil and gas platforms. While sensor heights range from 100 to 122 m above mean sea level, the host platforms have topside decks sitting roughly 12–34 m above the waterline, and their structures can induce localized flow distortion and wakes. That said, the anemometers are positioned approximately 65–110 m above the main deck level, placing them above the zone of most severe structural blockage. Because platform-specific structural metadata are absent from the public database, no external flow distortion corrections were applied beyond the standard quality control filtering used across the whole Tall Tower Dataset (Ramon et al., 2020), as described below (see Step 2b).
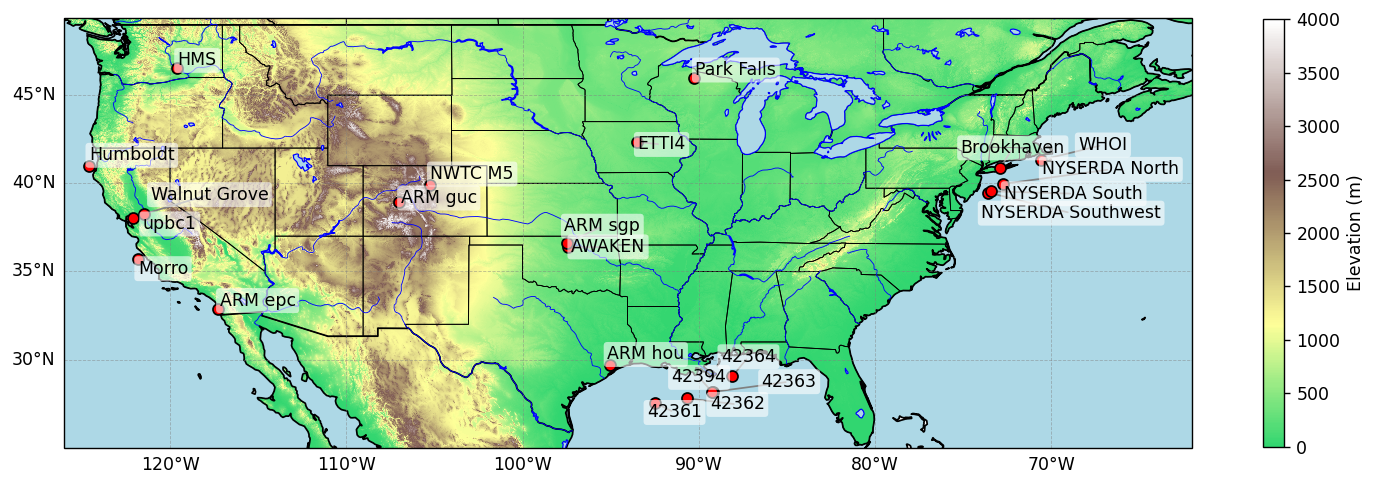
Figure 5Map of the observational stations used for model validation. Terrain height data are derived from https://apps.nationalmap.gov/downloader (last access: 13 October 2026) and down-sampled to 1 km resolution.
We validate model performance against wind speed observations. The steps for preparing the observations and model data for comparison include the following.
- 1.
Download observations and standardize them into a common format across all sites. For lidar datasets, if not already provided, calculate wind speed and wind direction from velocity–azimuth–display scans (Frehlich et al., 2006).
- 2.
Apply data quality control (QC) for wind speed observations:
- a.
Apply dataset-specific QC flags that are recommended in the source datasets. For the Tall Tower Dataset (Ramon et al., 2020), we apply the Quality Control Software Suite for Tall Towers (QCSS4TT) quality flags and retain only observations with QC flag = 1 (passing all applicable checks). The QCSS4TT includes a dedicated tower shadow test that removes wake-contaminated observations at stations with more than one anemometer at a given height (the specific stations are not identified in the public metadata). For the Iowa Mesonet ETTI4 tower, which has dual anemometers on opposing booms at each height, we select the upwind sensor at each time step based on concurrent measurements, explicitly excluding tower-wake-affected observations.
- b.
Filter outliers: values outside of 2 times the standard deviation within a rolling 6 h window and wind speeds over certain station-specific thresholds, defined based on maximum wind speed occurrences at each site.
- c.
For the raw lidar datasets (ARM SGP, GUC, and EPC): apply signal-to-noise ratio filter with a site-specific signal-to-noise ratio threshold (−19 dB for ARM SGP, −20 dB for GUC and EPC) that effectively filters out noise.
- d.
Exclude suspicious data (e.g., negative wind speeds, repeated values, long near-zero runs).
- e.
Fix time stamp, time zone, and unit errors.
- a.
- 3.
Extract model data (WTK-LED, WTK-LED Climate, NOW-23, HRRR MET Toolkit, and BC-HRRR) at the nearest grid point to each observational site.
- 4.
Resample all data. We evaluate the WRF-based models using hourly instantaneous values, as some modeled datasets are restricted to this resolution. For the observations, however, we calculate hourly averages (centered on the model output time) to ensure consistency across sites, as certain datasets are provided solely as hourly means and preclude the derivation of instantaneous values.
- 5.
Linearly interpolate model data at the heights of each observational site.
- 6.
Keep all the time stamps at which the observations overlap with at least one modeled dataset.
Optis et al. (2020a) provide recommendations for metrics when comparing model vs. observational datasets. Following these recommendations, we calculate the modeled wind speed (U) bias at each site (and height) as
the centered root-mean-square error (cRMSE) as
and the Pearson correlation coefficient r. To compare probability density functions (PDFs) of wind speed, we use the Wasserstein distance (or Earth mover's distance, EMD, Lupu et al., 2017, and Hahmann et al., 2020). The Wasserstein distance provides a physically interpretable measure of dissimilarity between two probability distributions by quantifying the minimum “effort” required to transform one distribution into the other. It captures differences in PDF shape, spread, and tail behavior, making it well suited for evaluating model–observation discrepancies. In one dimension, the first-order Wasserstein distance between two PDFs F(U) is defined as
The Wasserstein distance is expressed in the same physical units as the distribution (e.g., m s−1 for wind speed), and a value of 0 indicates identical distributions.
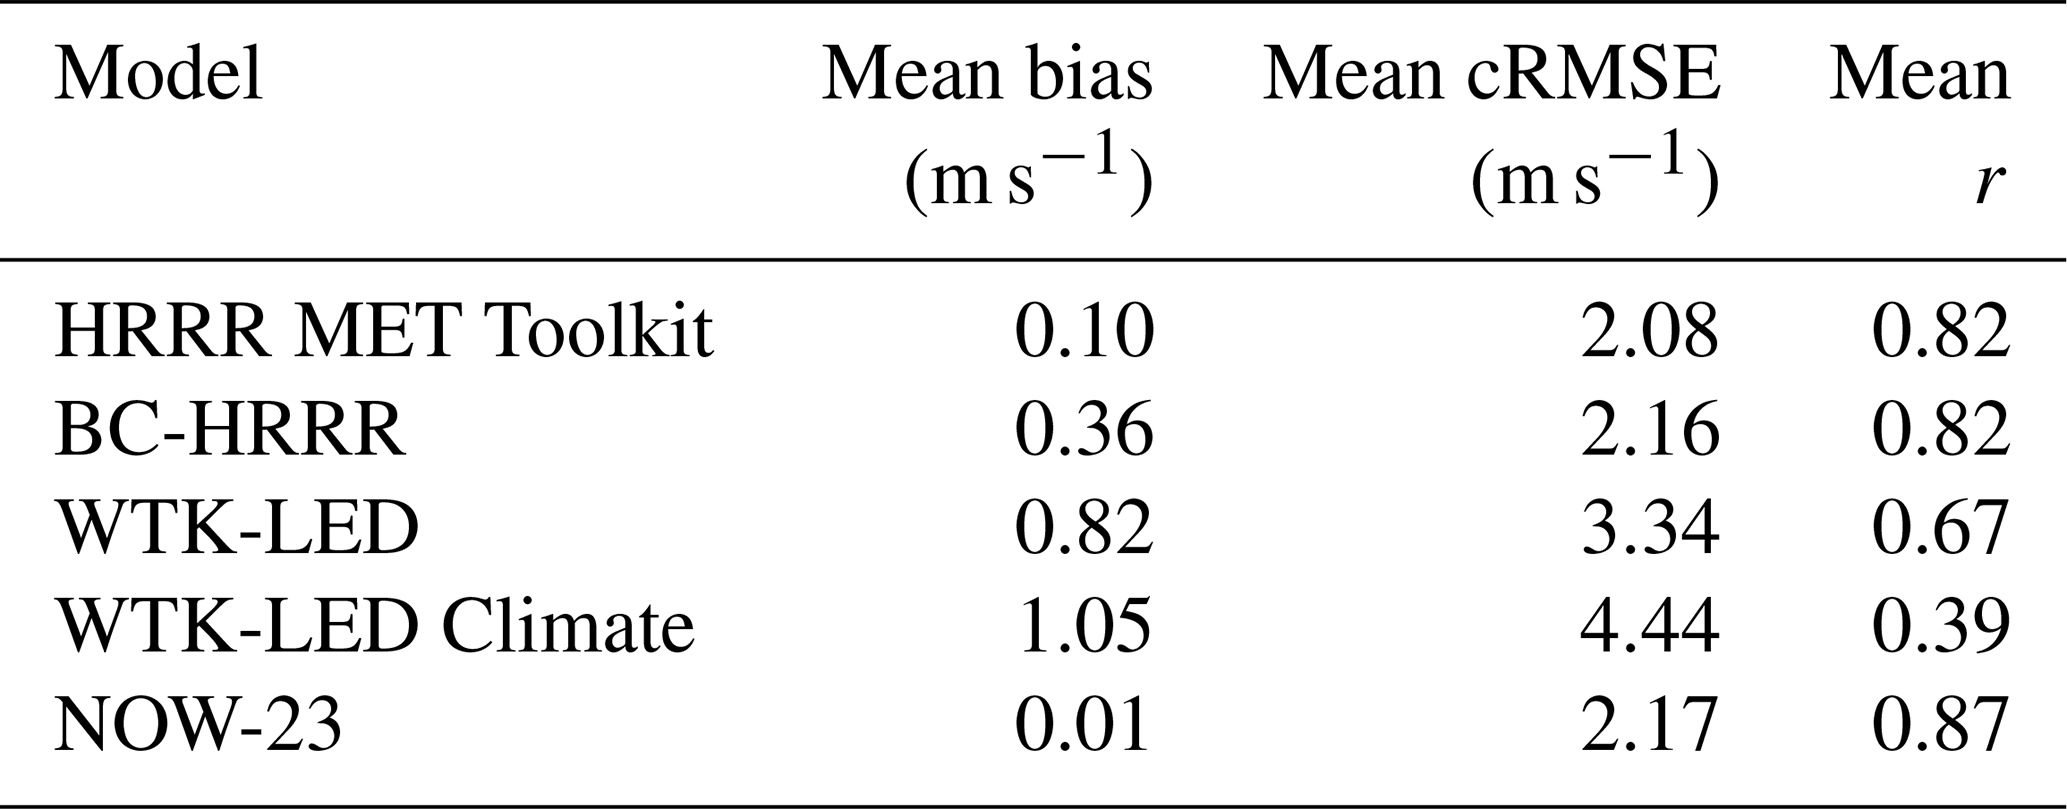
We first validate model performance at heights relevant to commercial wind turbines. For each station, we select the measurement height closest to 100 m (land-based) or 140 m (offshore) to serve as a proxy for hub height. Figure 6 summarizes validation metrics across all sites, and Table 3 provides the aggregate means. A clear performance hierarchy emerges: the HRRR-based products (HRRR MET Toolkit and BC-HRRR) and the offshore-specific NOW-23 consistently outperform the WTK-LED family. Averaged across all stations, the HRRR MET Toolkit and BC-HRRR achieve Pearson correlation coefficients (r) of 0.82, significantly surpassing WTK-LED (0.67) and WTK-LED Climate (0.39). Similarly, the cRMSE is substantially lower for the HRRR family (≈ 2.1 m s−1) compared to WTK-LED (3.3 m s−1) and WTK-LED Climate (4.4 m s−1). For offshore stations, NOW-23 demonstrates superior performance, achieving the lowest mean bias (0.02 m s−1) and highest correlation (0.87) of any dataset, validating its regional tuning strategy. The HRRR-based products also perform robustly in offshore environments, closely trailing NOW-23, whereas the WTK-LED variants show significant degradation. While correlation and cRMSE favor the HRRR family and NOW-23, wind speed bias exhibits more complex behavior. All models generally display a positive domain-averaged bias, but magnitudes vary. WTK-LED Climate exhibits the largest average positive bias (1.05 m s−1), followed by WTK-LED (0.82 m s−1). Notably, the bias correction applied to BC-HRRR shifts the results relative to the HRRR MET Toolkit. In the aggregate, the HRRR MET Toolkit has a lower mean bias (0.10 m s−1) than BC-HRRR (0.36 m s−1); however, these global averages mask important regional distinctions detailed below. Also, we note that residual tower shadowing may systematically depress observed wind speeds, contributing to the apparent positive model biases documented at sites where the tower wake effect could not be accounted for. This effect would not be present at the lidar-based validation sites, which are not subject to tower wake contamination.
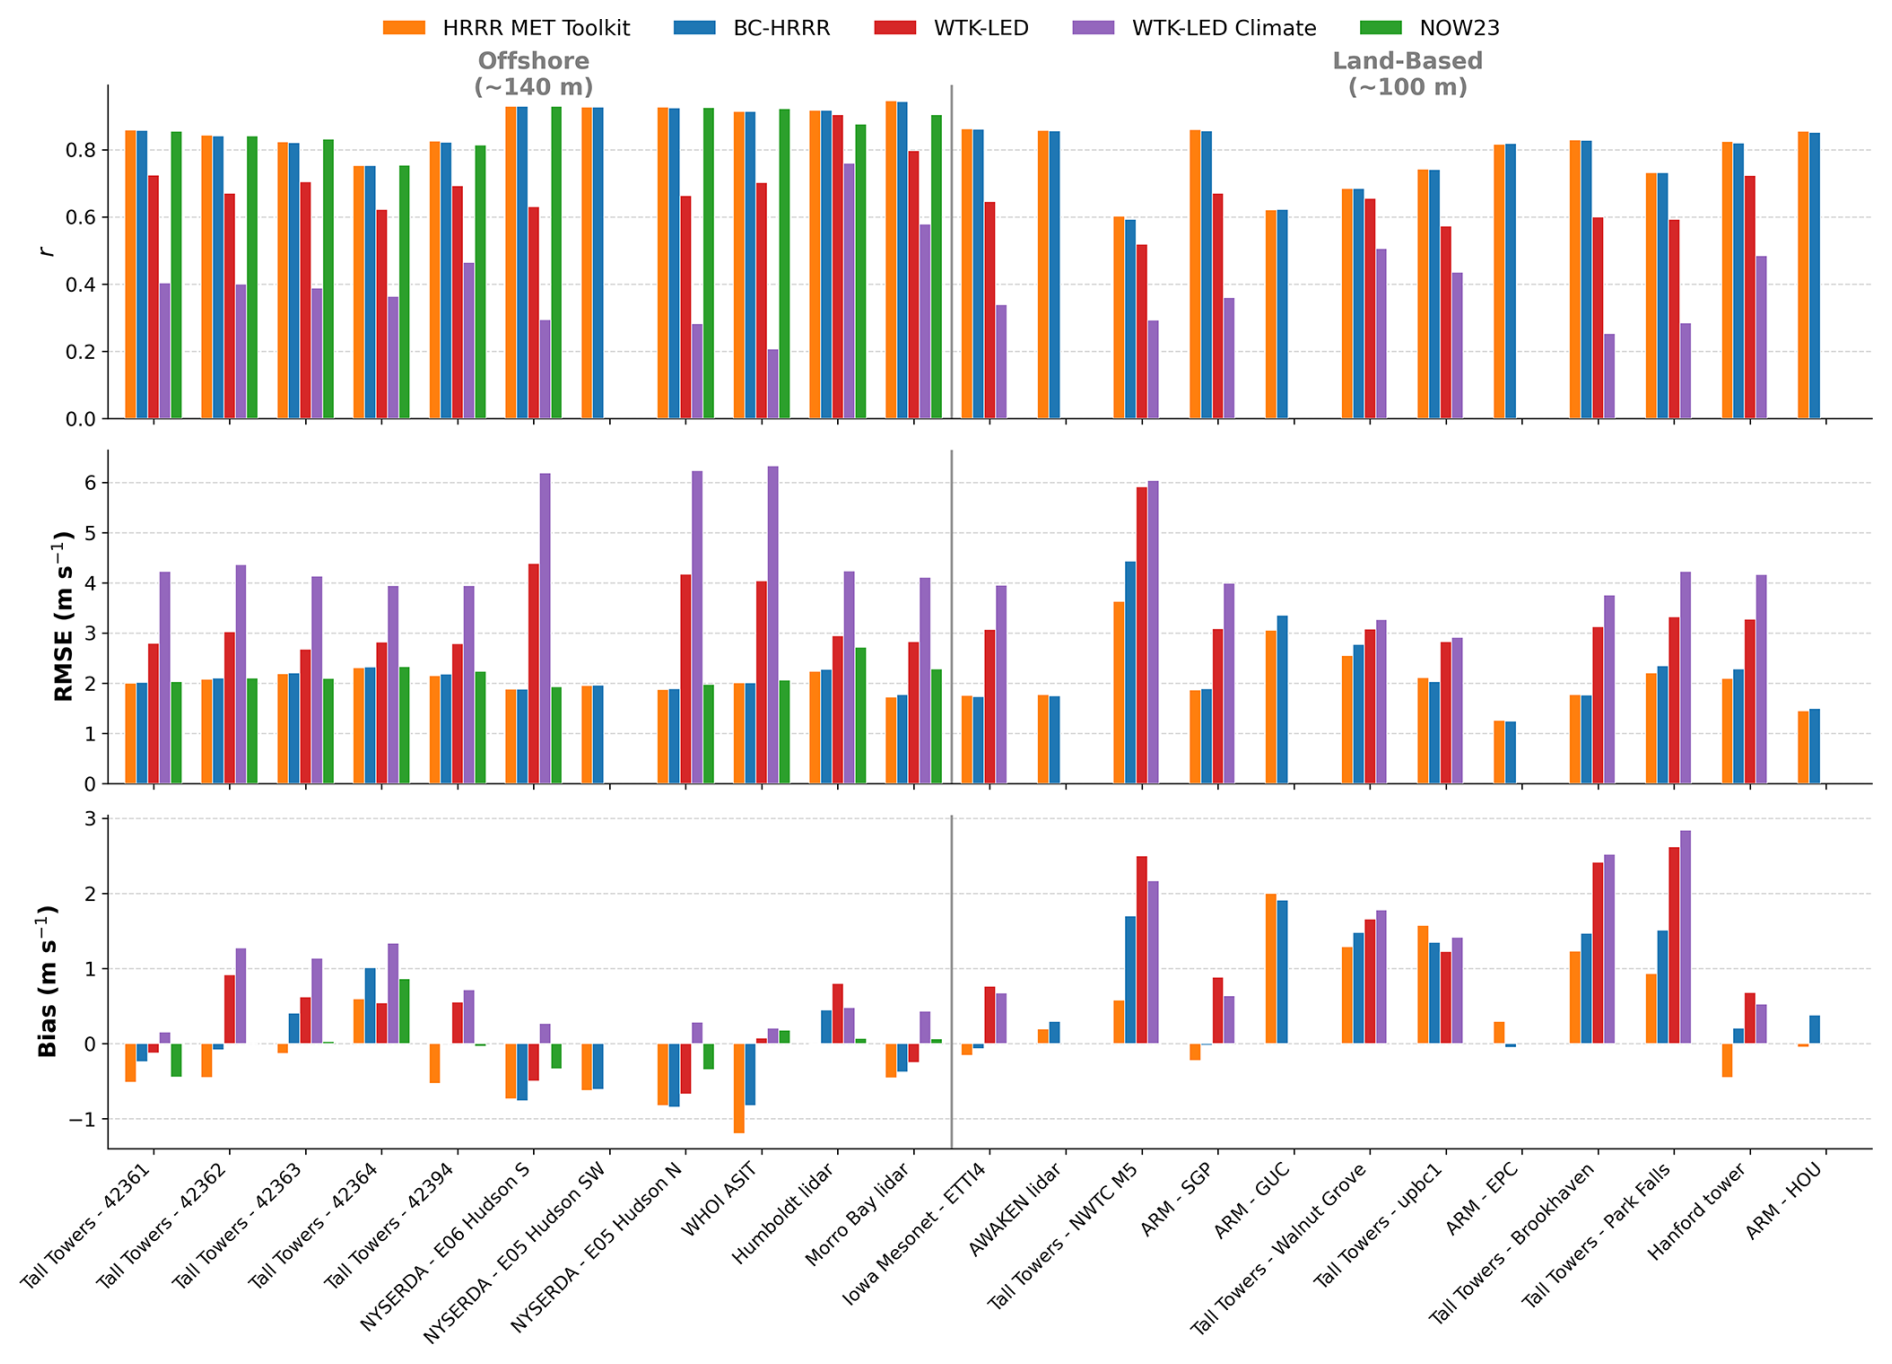
Figure 6Hub-height validation metrics (bias, cRMSE, and r) for each station and model. Metrics are computed over the station-specific periods that overlap each model's availability within 2015–2025. The vertical dashed line separates offshore sites (left) from land-based stations (right).
Table 3Mean hub-height performance metrics by model, averaged over all stations (corresponding to averages from Fig. 6).
To ensure a strict inter-comparison, we restrict the subsequent station-level analysis to overlapping temporal periods where all modeled datasets are available (2015, 2018, 2019, and 2020). Figures 7 and 8 show the PDFs of wind speeds. Onshore, HRRR MET Toolkit and BC-HRRR distributions align closely with observations, whereas WTK-LED products exhibit broader distributions and overpredict the frequency of high wind speeds. This distributional offset drives the higher positive biases in WTK-LED. Agreement is highest at sites with simple terrain (e.g., ARM SGP, Iowa Mesonet), whereas all models struggle to capture distributions in complex terrain (e.g., NWTC M5), highlighting the limitations of mesoscale modeling in resolving localized flow. Offshore (Fig. 8), all datasets better match observed distributions, with NOW-23 providing the best fit (in terms of bias and correlation), followed closely by the HRRR-based products (with the HRRR MET Toolkit showing the lowest cRMSE). Furthermore, the comparison reveals generally better model–lidar agreement than model–tower agreement. This discrepancy is consistent with the presence of residual tower shadowing effects at certain tower locations. Aerodynamic wake contamination from the tower geometry can artificially decelerate the incoming flow, shifting true high-wind-speed observations into lower-velocity bins. This structural artifact inflates the apparent low-wind frequency and truncates the high-wind tail in the tower-derived PDFs – a signature likely affecting stations such as upbc1, Brookhaven, and Park Falls. These distributional characteristics reinforce our earlier interpretation: a portion of the apparent positive model bias at tall tower locations likely reflects a localized measurement artifact rather than an unmitigated model deficiency alone.
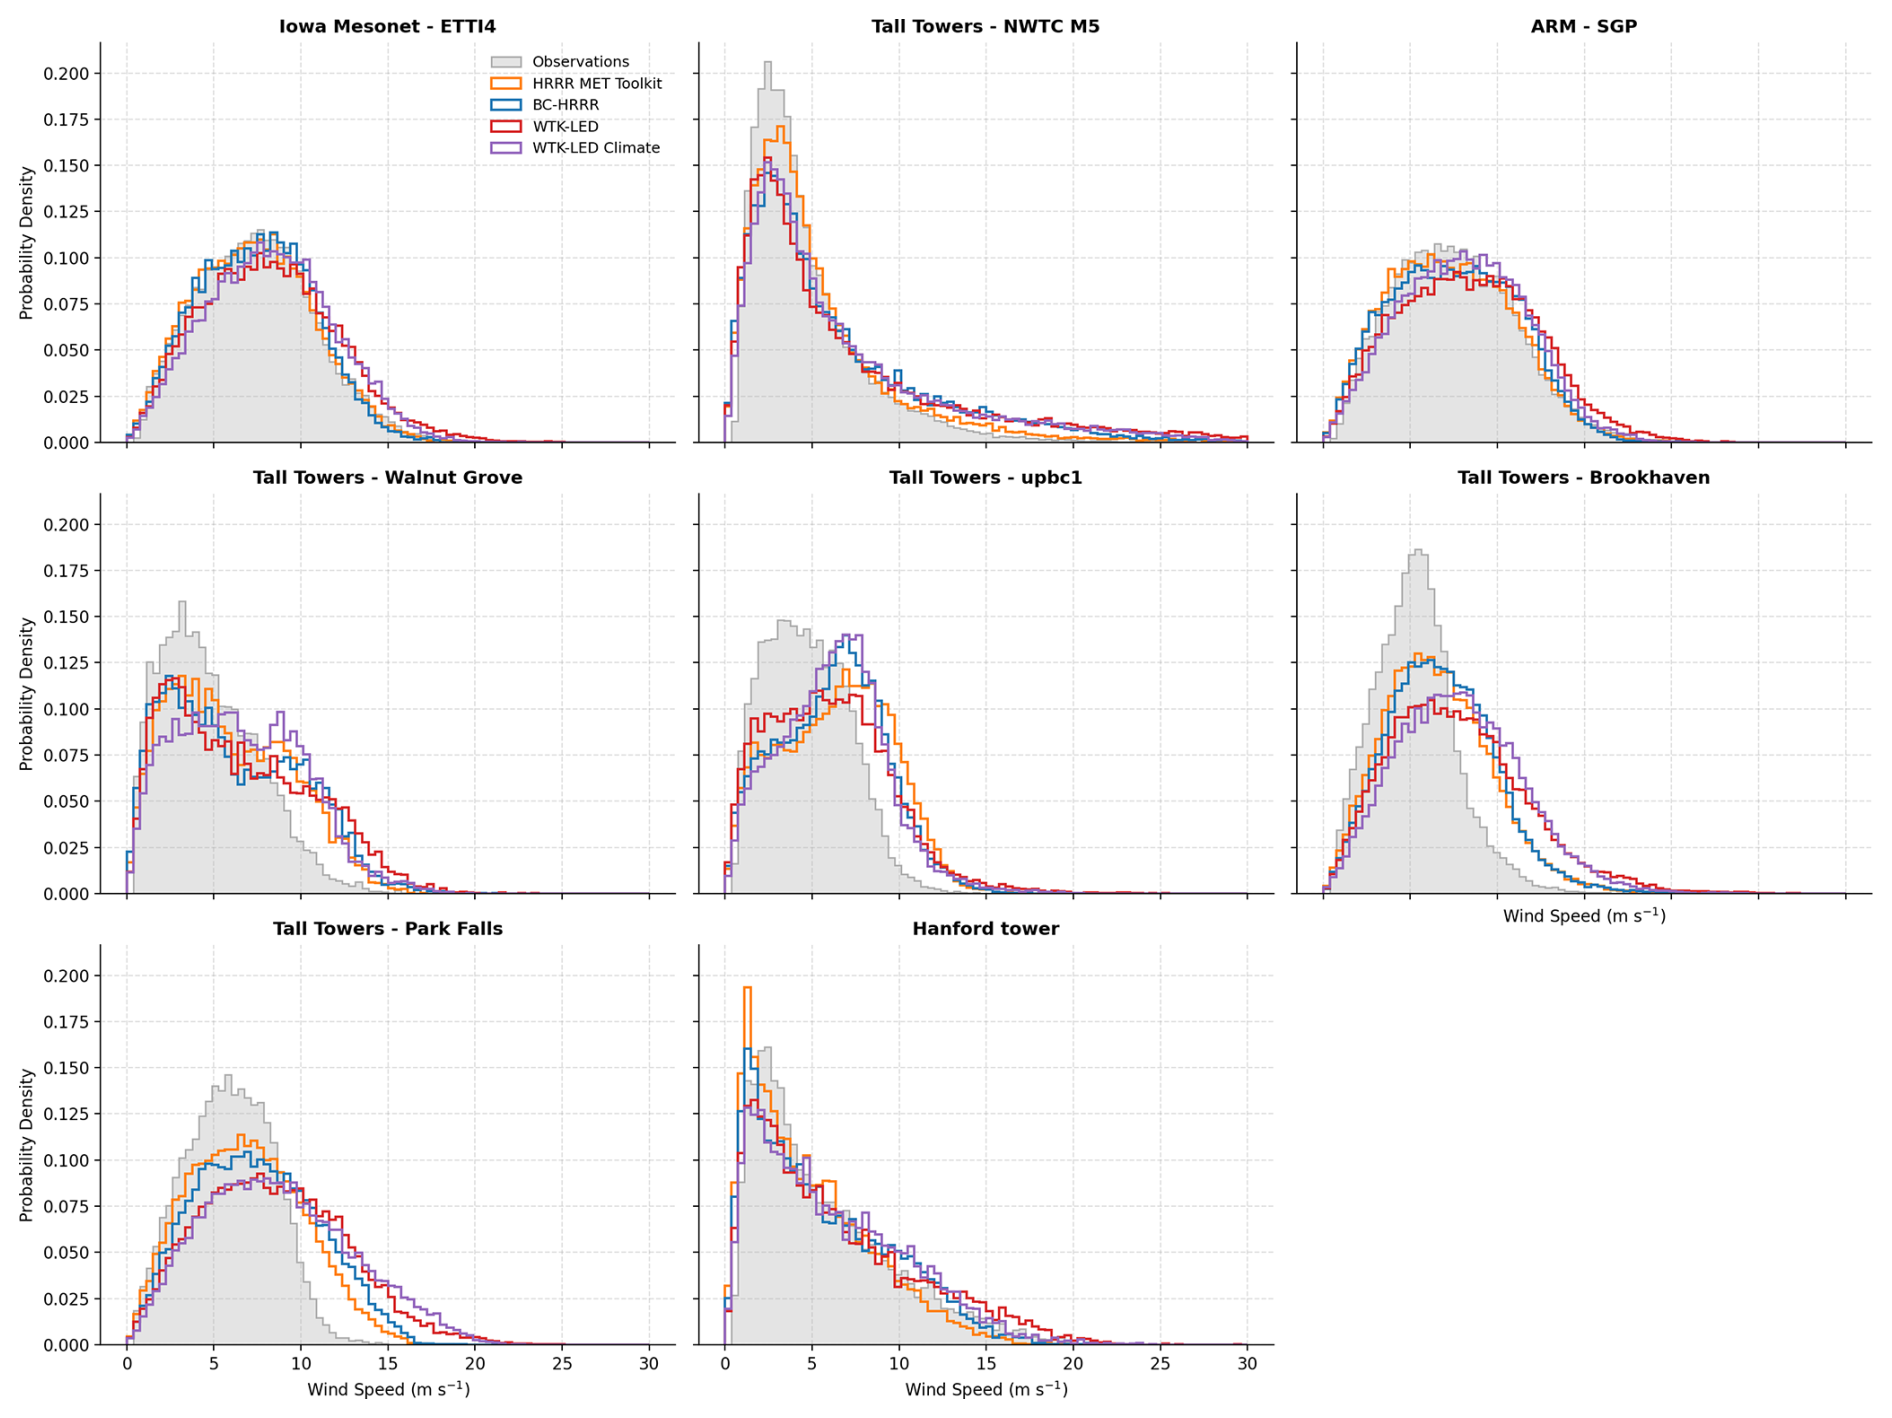
Figure 7PDFs for land-based sites comparing observed and modeled hub-height (closest height to 100 m with observations) wind speeds over 2015, 2018, 2019, and 2020.
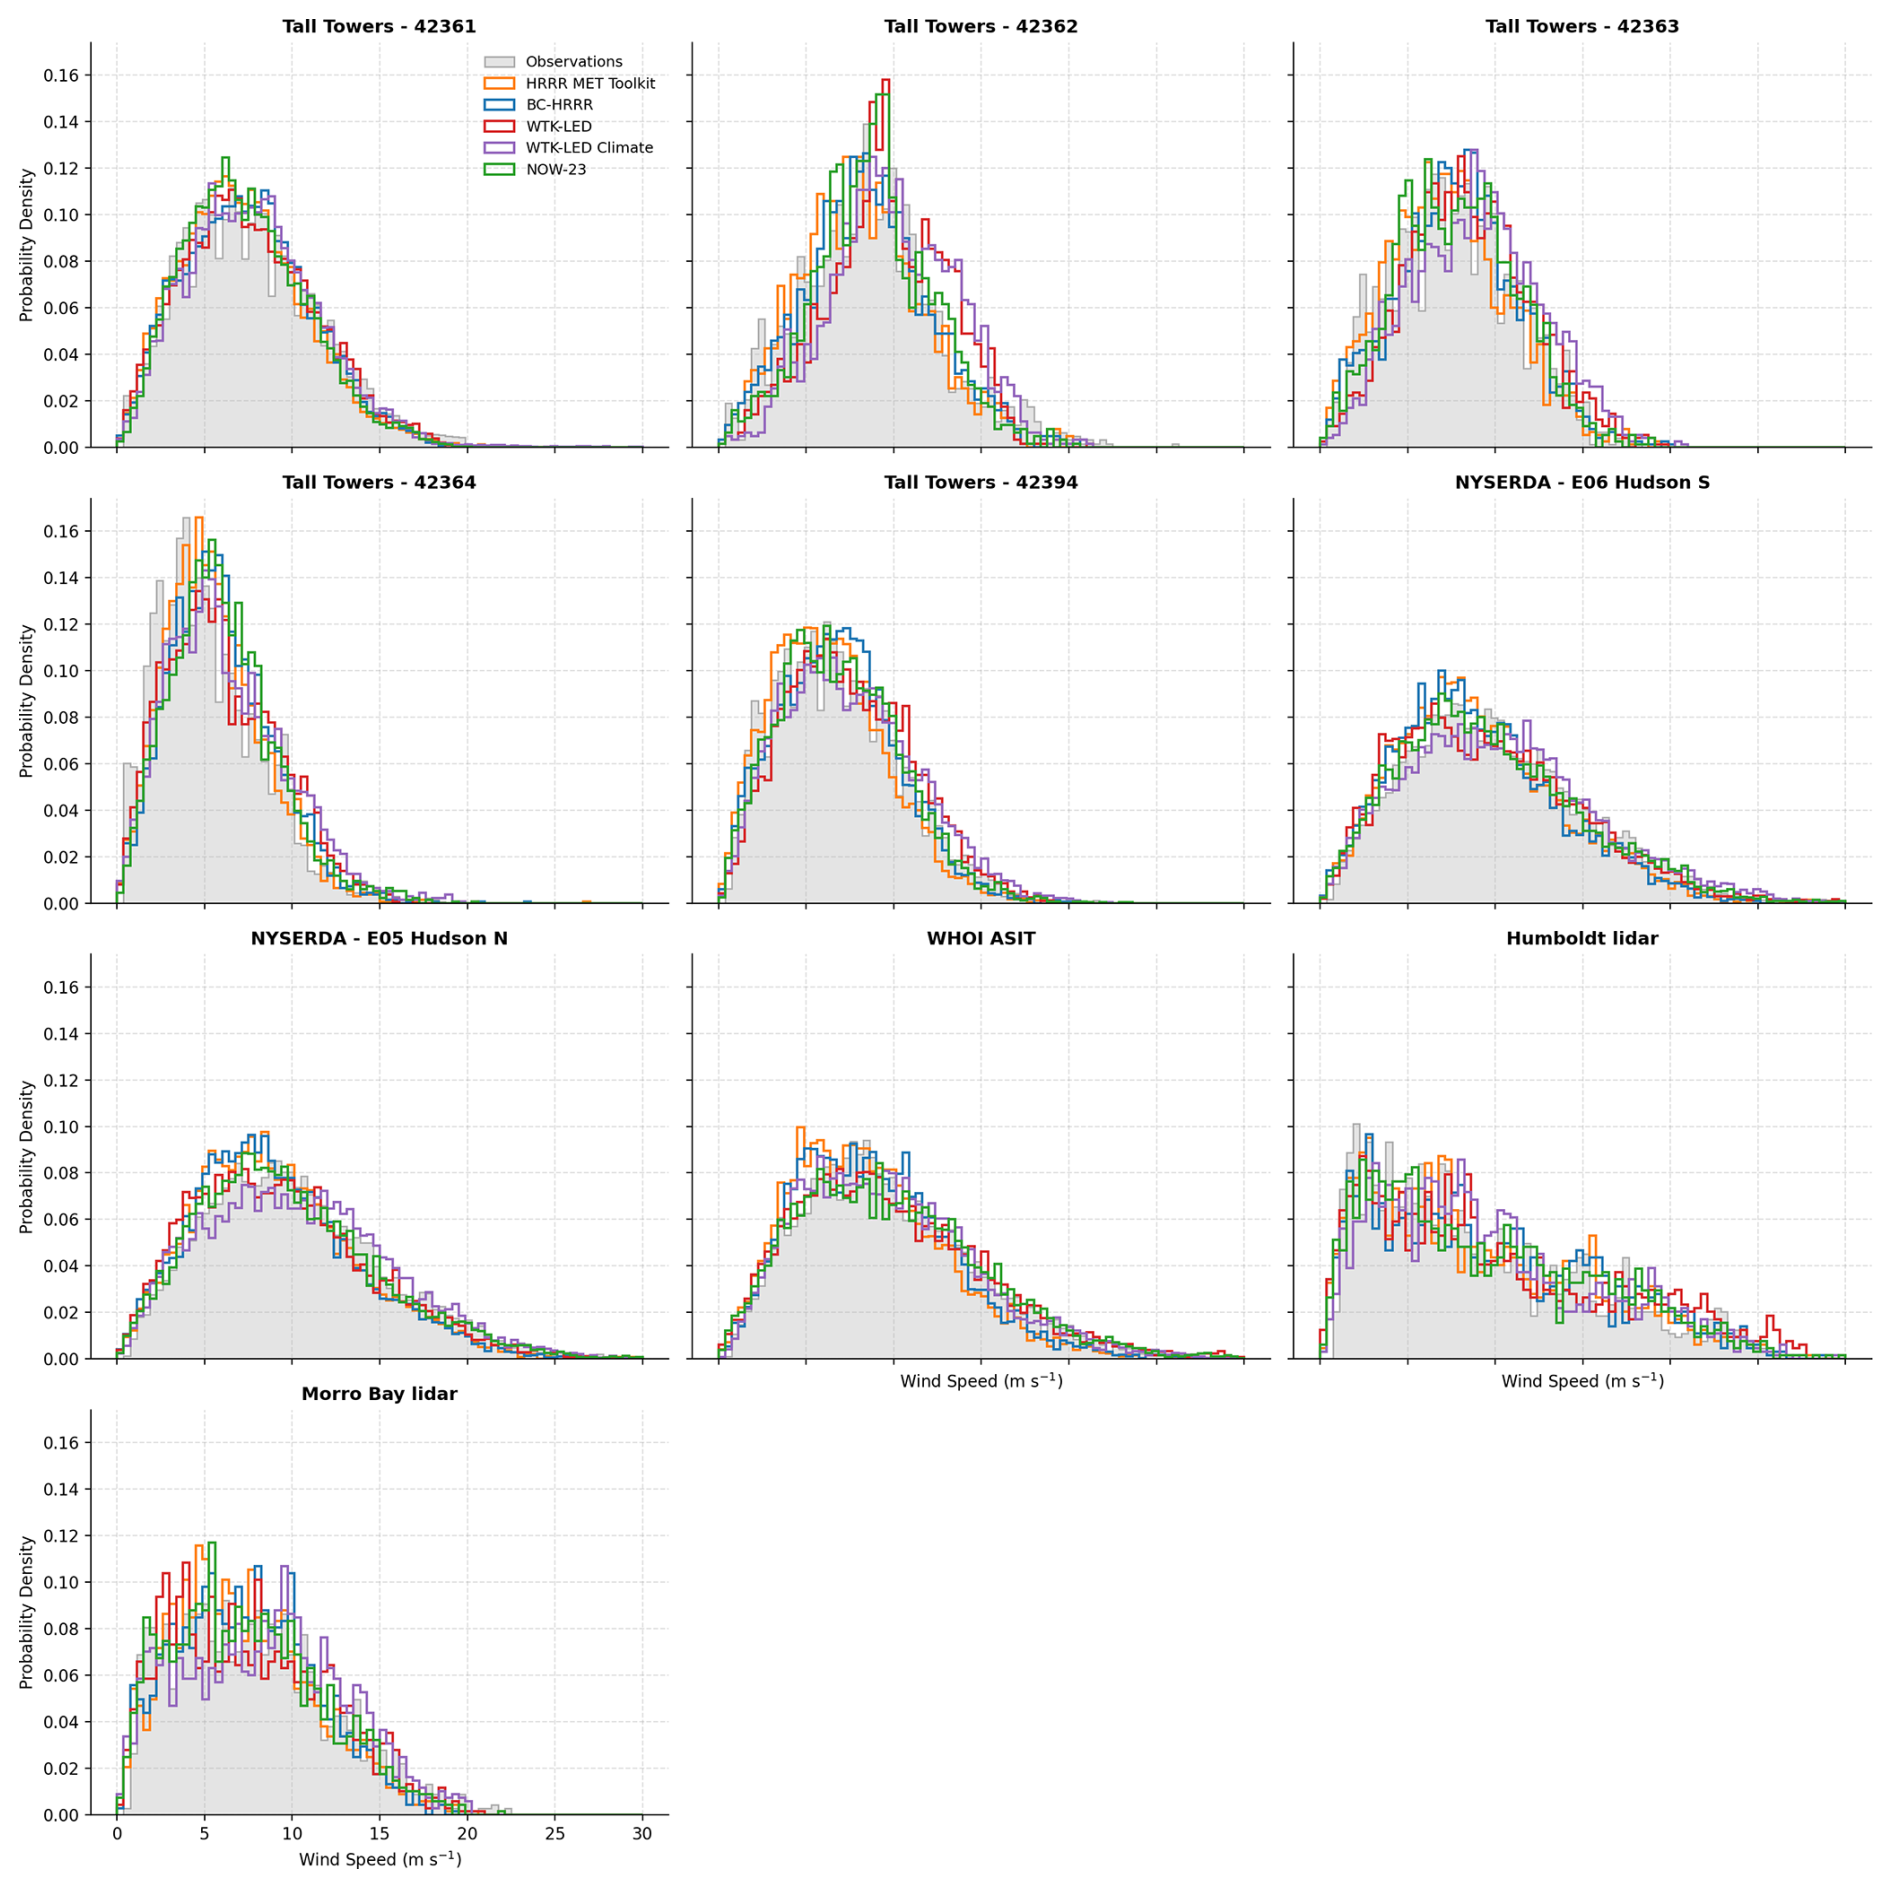
Figure 8PDFs for offshore sites comparing observed and modeled hub-height (closest height to 140 m with observations) wind speeds over 2015, 2018, 2019, and 2020.
Figure 9 presents a “scorecard” heatmap of validation metrics for the overlapping period, clarifying the regional impact of the bias correction in BC-HRRR. For offshore sites, the HRRR MET Toolkit exhibits an average negative bias (mean −0.53 m s−1). The bias correction successfully mitigates this underspeeding, improving the BC-HRRR offshore mean bias to −0.23 m s−1 (closer to the NOW-23 benchmark of 0.02 m s−1). Conversely, at land-based sites where the HRRR MET Toolkit already possesses a positive mean bias (0.57 m s−1), the bias correction – which anchors the distribution to the legacy WIND Toolkit – increases the positive bias to 0.92 m s−1. This suggests that the onshore positive bias in BC-HRRR relative to the HRRR MET Toolkit reflects the spatial heterogeneity of WIND Toolkit biases: the quantile mapping anchors the HRRR distribution to a reference that is itself positively biased relative to observations in complex terrain. In offshore environments, where the WIND Toolkit is better calibrated, the same correction reduces the negative bias present in the native HRRR. Despite this shift, BC-HRRR maintains the high correlation and low cRMSE of the native HRRR MET Toolkit, offering a significant improvement over the WTK-LED family (mean land-based cRMSE: 3.46 m s−1).
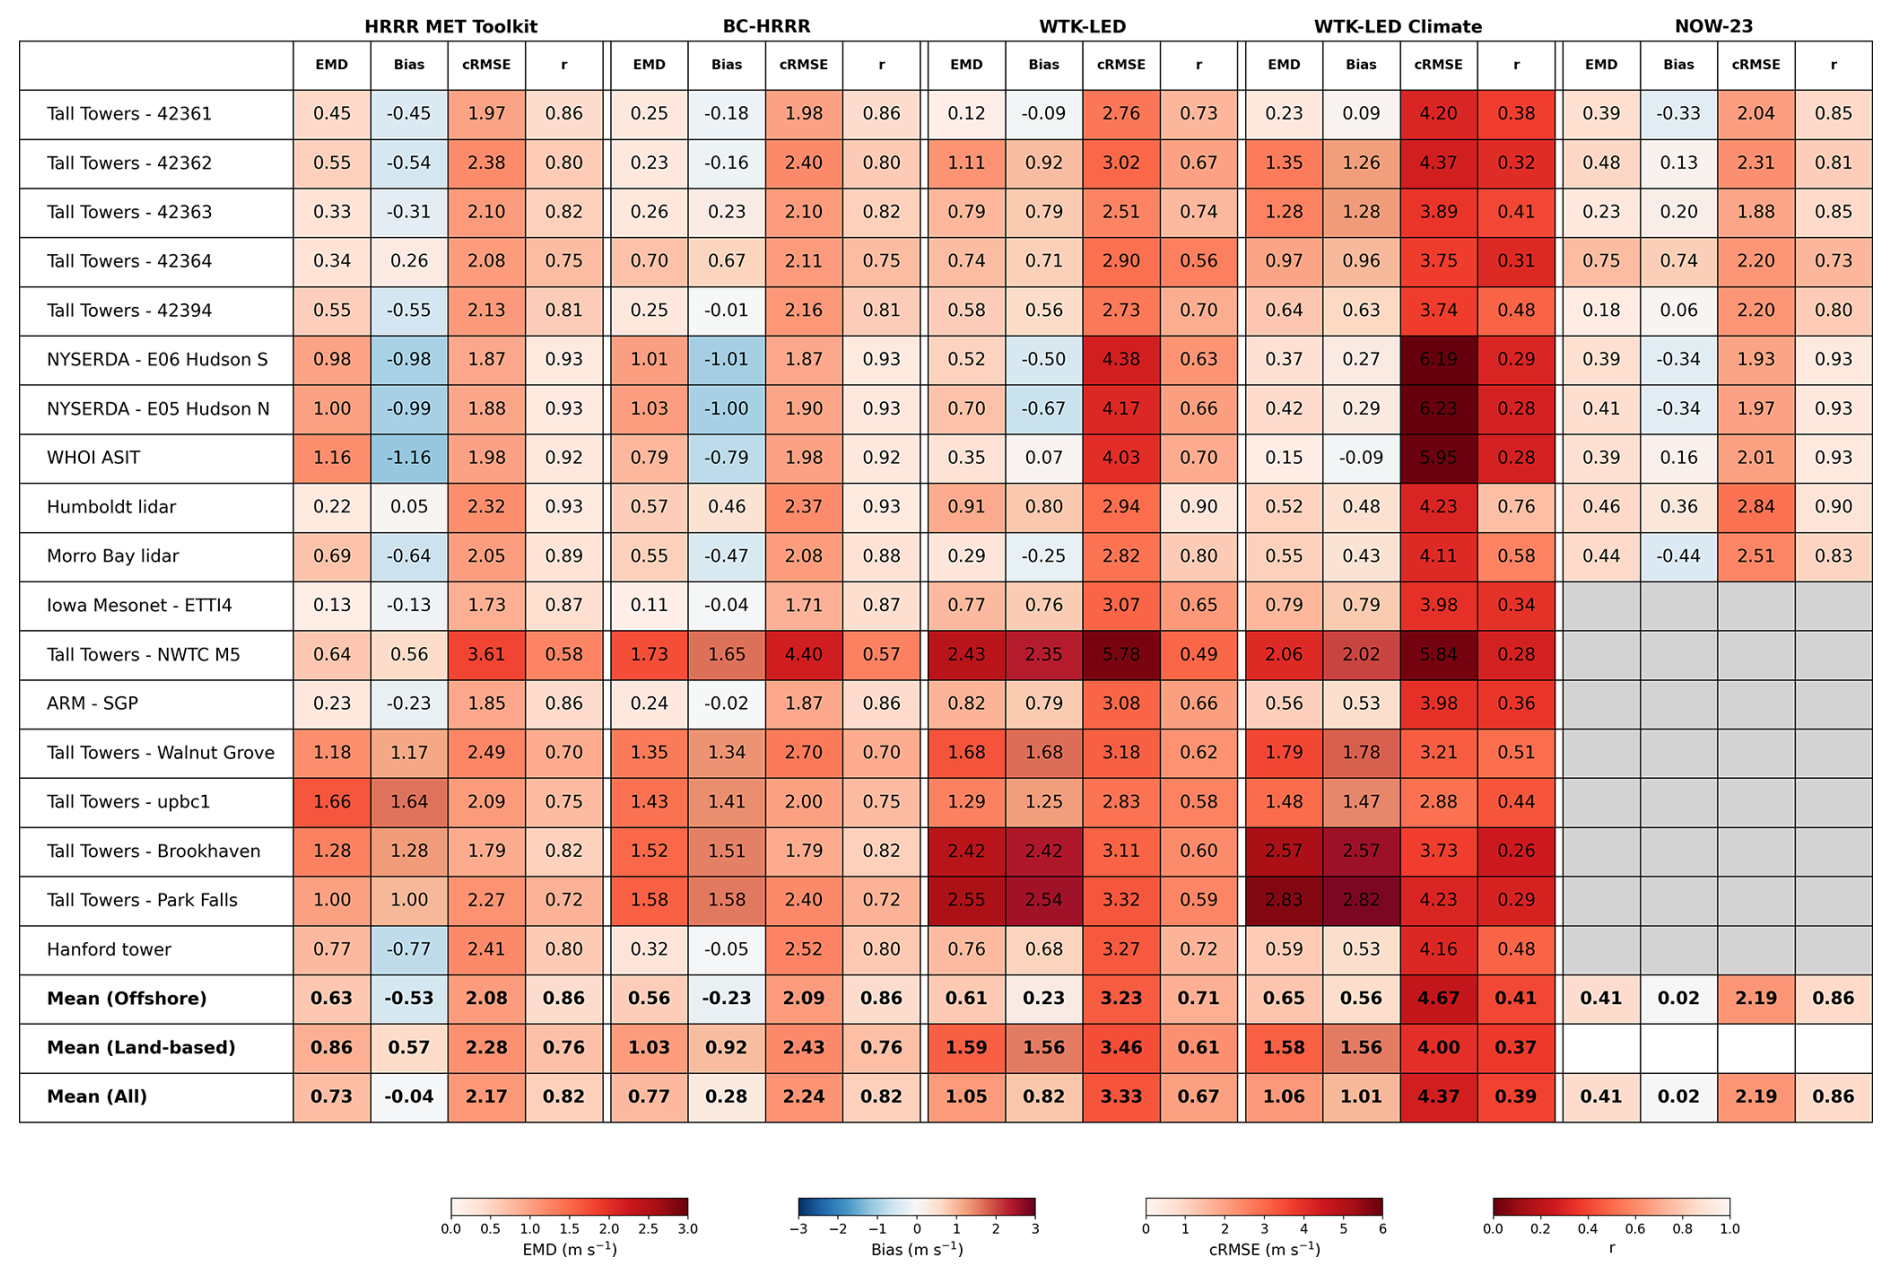
Figure 9Scorecard for metrics per station and average metrics (across 2015, 2018, 2019, and 2020).
The spatial distribution of validation metrics (Figs. 10–12) reveals coherent regional structures aligned with terrain complexity. Bias maps (Fig. 10) indicate that offshore and flat inland sites generally exhibit near-zero bias across most models, reflecting reduced terrain forcing and homogeneous flow. In contrast, complex terrain and coastal transition zones pose challenges, particularly for WTK-LED and WTK-LED Climate, which display large positive biases consistent with unresolved subgrid variability. The HRRR-based models demonstrate smaller biases overall, though the land–sea contrast remains evident. Correlation (Fig. 11) and cRMSE (Fig. 12) degrade markedly in regions of complex terrain, particularly throughout the western United States. This pattern is consistent across all models, suggesting that unresolved terrain-driven variability may impose a fundamental limit on the agreement achievable between mesoscale models and point observations.
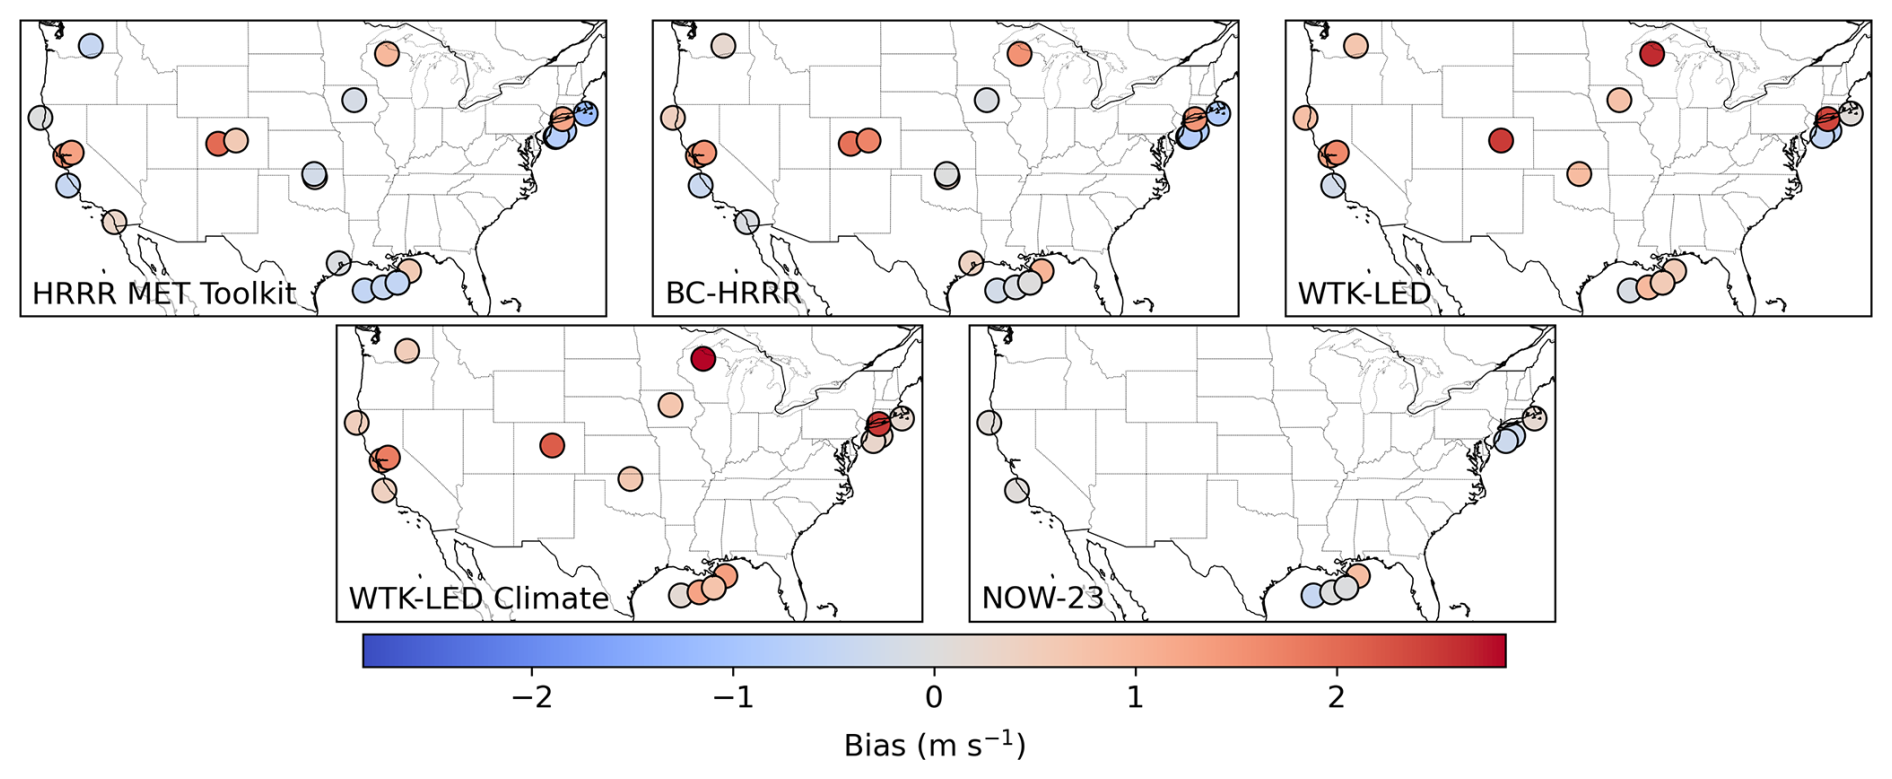
Figure 10Maps showing hub-height wind speed bias over the full period of record of each modeled dataset.
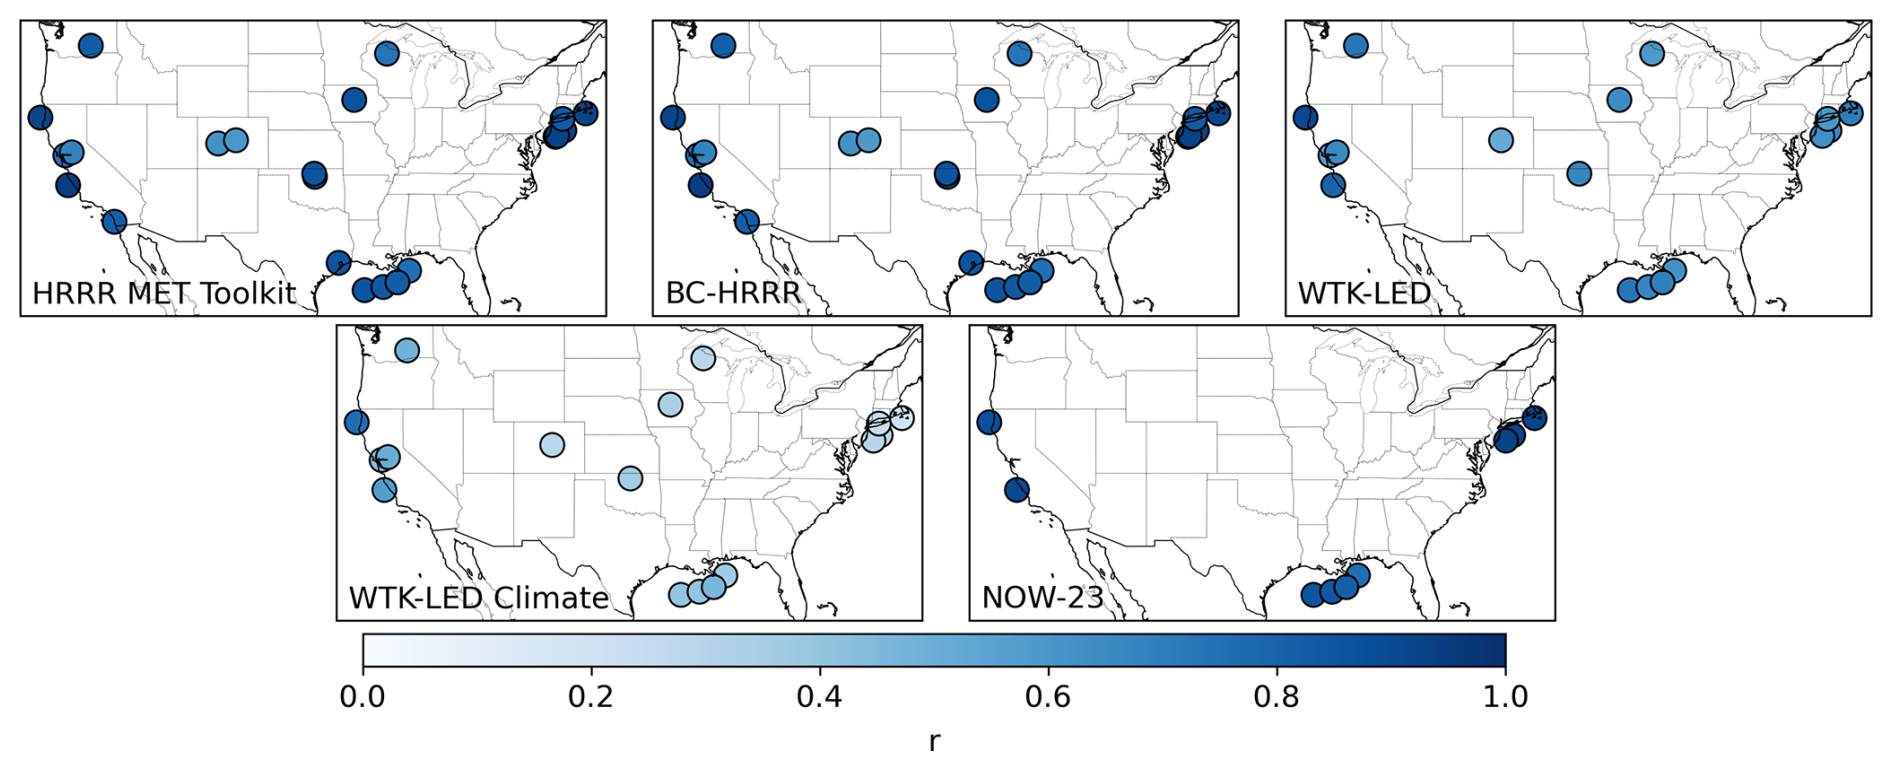
Figure 11Maps showing hub-height wind speed correlation coefficient over the full period of record of each modeled dataset.
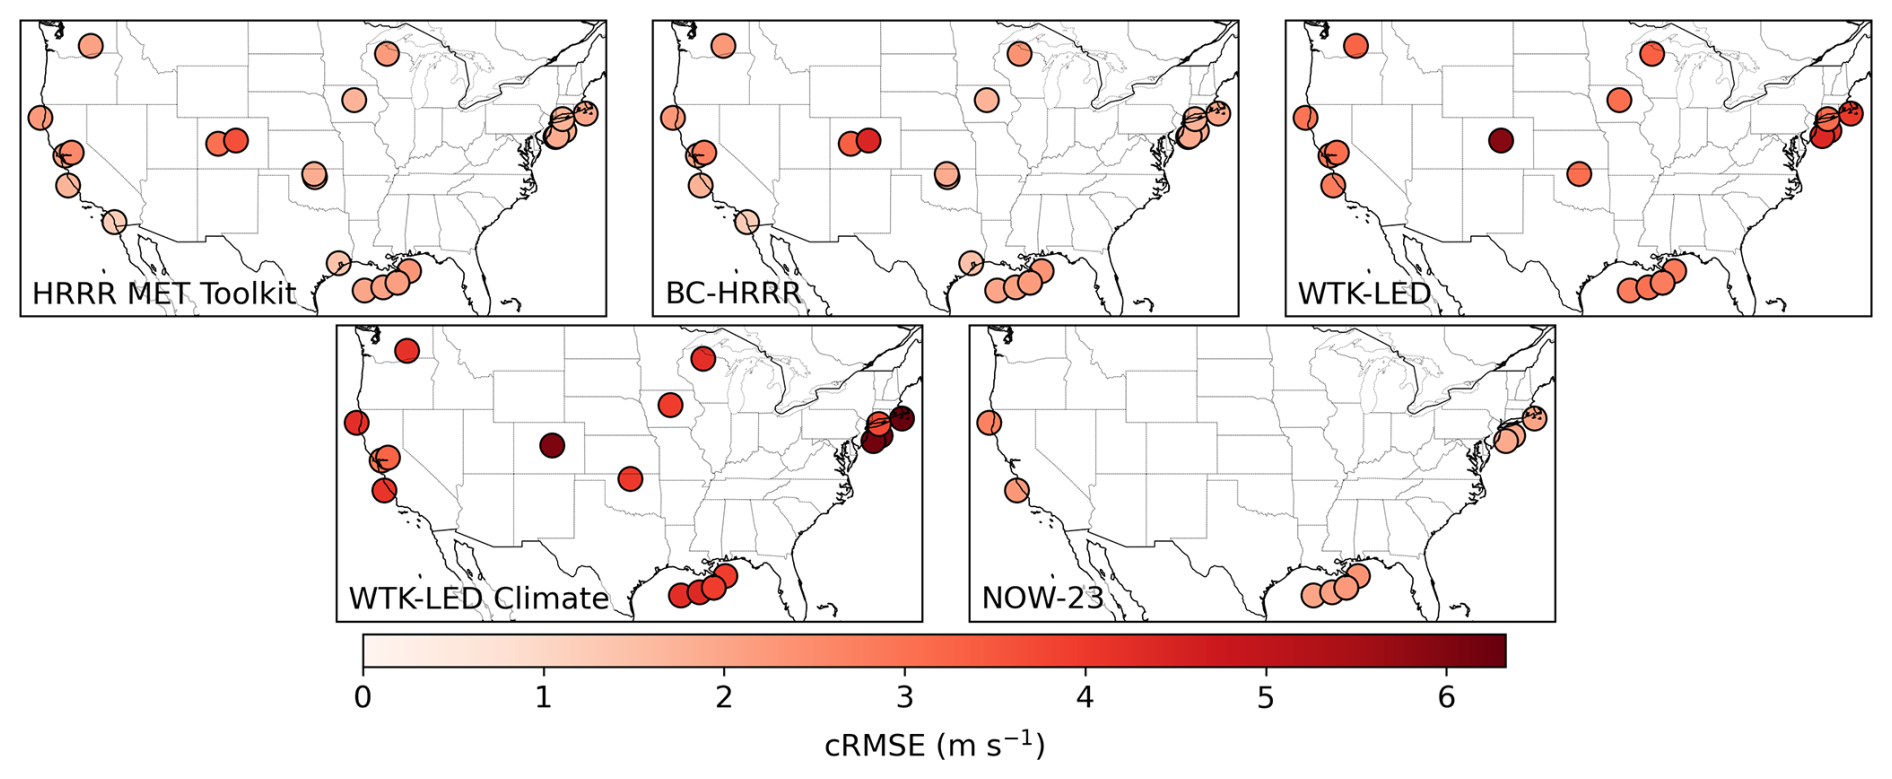
Figure 12Maps showing hub-height wind speed cRMSE over the full period of record of each modeled dataset.
The dependence of model performance on terrain complexity is more systematically quantified in Fig. 13, which plots metrics against the standard deviation of terrain height within a 20 km radius of each station. We observe a log-linear degradation in performance for all datasets as terrain complexity increases: correlation decreases and cRMSE increases, consistent with known limitations of WRF in resolving complex flow (e.g., Carvalho et al., 2012). While all models suffer in rugged environments, the HRRR-based products maintain a performance advantage over WTK-LED across the complexity spectrum. Notably, the bias for the WTK-LED family remains high regardless of terrain, whereas the HRRR family shows lower biases that scale with complexity.
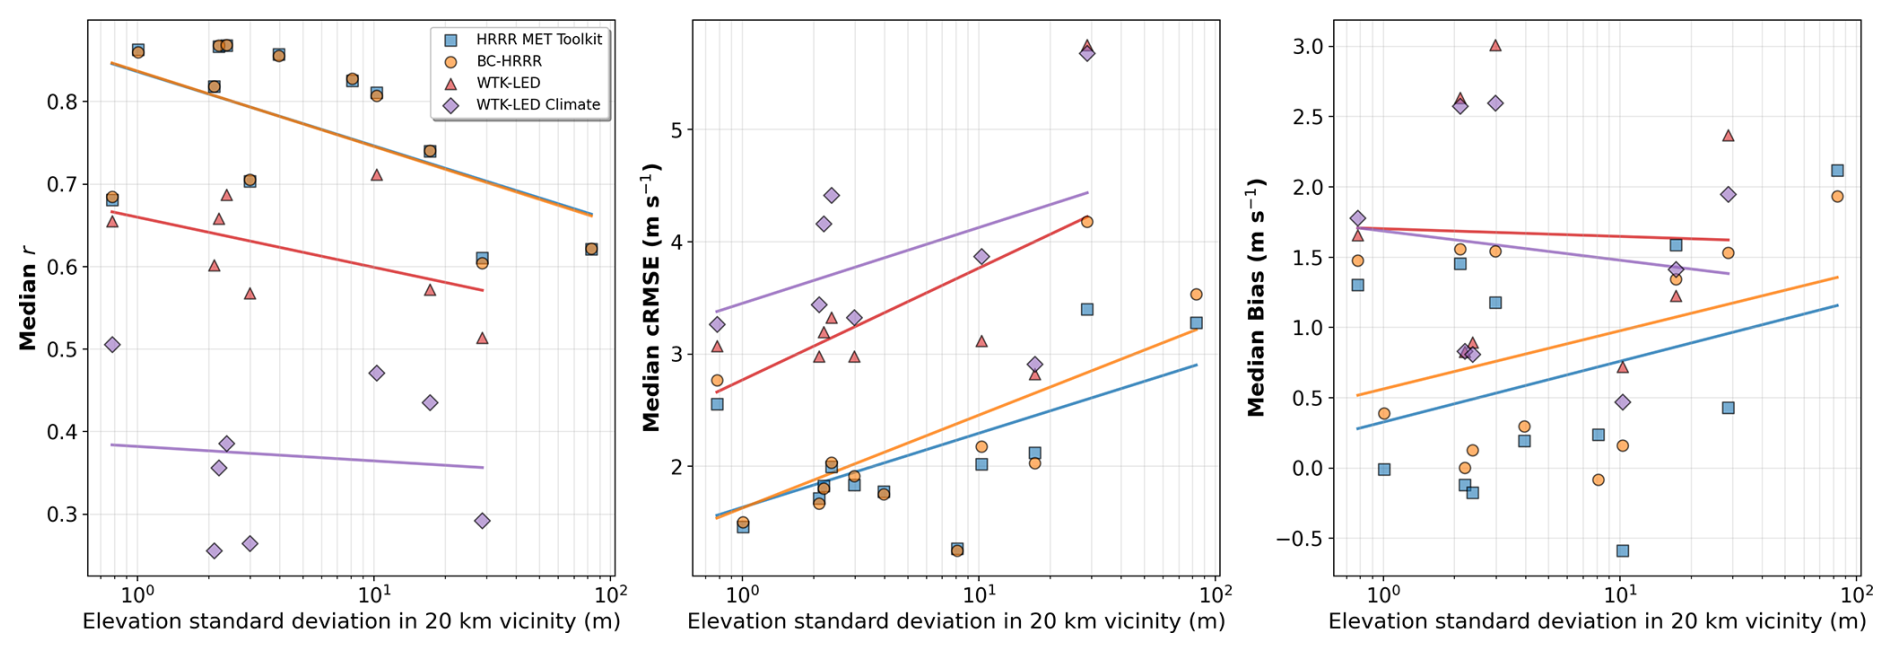
Figure 13Correlation r (left), cRMSE (center), and bias (right) depending on terrain complexity (standard deviation of terrain height within a 20 km radius). Metric values are medians across all heights per measurement station. NOW-23 data and offshore stations are not shown because terrain complexity does not impact offshore sites. Note that the correlation statistics between the HRRR MET Toolkit and BC-HRRR in the left panel are nearly identical, and thus the data overlap.
A regime-dependent evaluation of model behavior, binned by observed wind speed (Fig. 14), reveals a pronounced dependence of bias on wind speed magnitude. Across all models, positive biases are largest at low wind speeds and generally decrease as wind speeds increase. Several datasets transition toward negative bias in the highest bins, indicating a tendency to overpredict light winds and underpredict strong winds. The WTK-LED Climate dataset exhibits the largest biases throughout the distribution and the most distinct shift toward negative bias at high wind speeds, whereas the HRRR-based products and NOW-23 maintain smaller biases across most regimes. Notably, BC-HRRR does not show larger biases than the HRRR MET Toolkit for either very low or very high wind speeds, when the effects of the bias correction might mute extremes. Additionally, cRMSE increases monotonically with wind speed for all datasets, reflecting the expected growth in absolute error magnitude as wind speed variability increases. We omit Pearson's correlation coefficients from this binned analysis, as restricting observations to narrow ranges artificially reduces variance, rendering r a measure of scatter rather than true model skill.
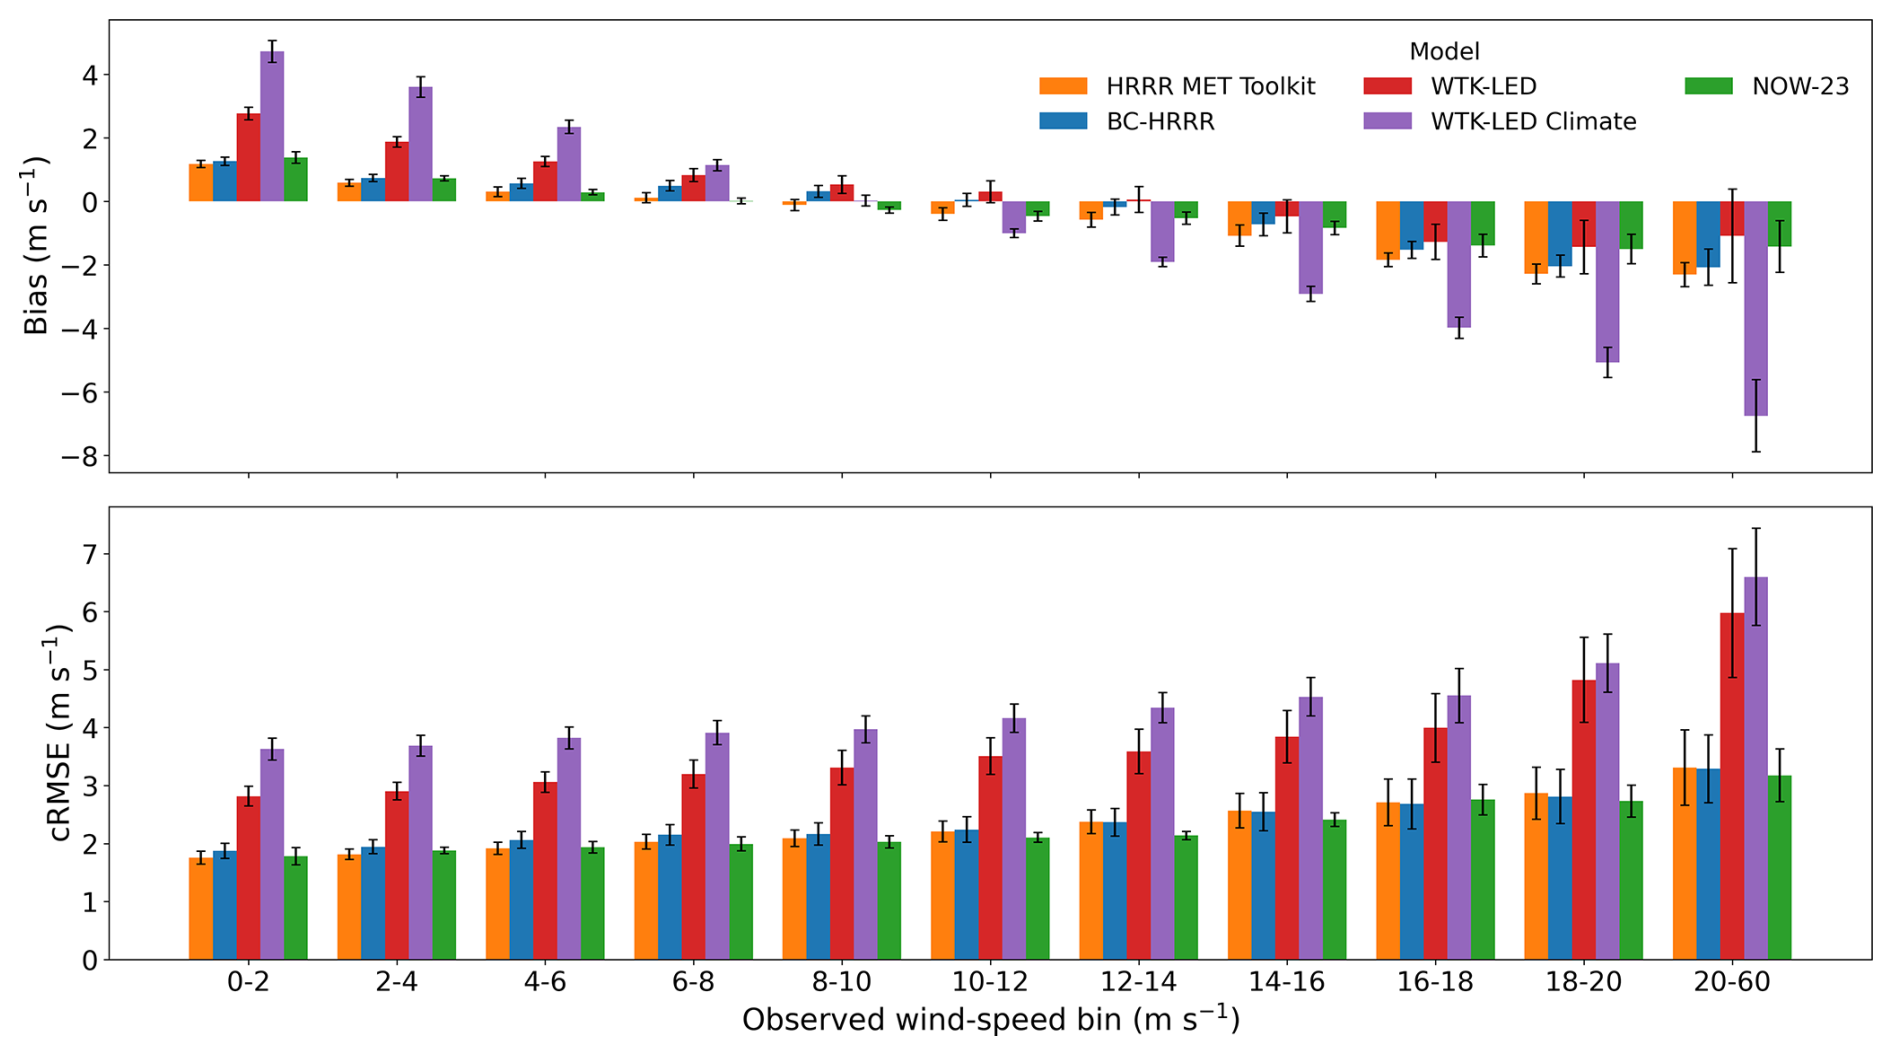
Figure 14Hub-height validation metrics as a function of observed wind speed, averaged across all stations. Top: bias; bottom: cRMSE.
Figure 15 illustrates the diurnal variation in hub-height validation metrics. The left column displays metrics averaged across all observational stations, with shaded regions denoting the interquartile range (IQR; 25th–75th percentile) at each local hour. The IQR characterizes site-to-site variability robustly, minimizing sensitivity to outliers – a critical feature given the diversity of terrains and flow regimes in the CONUS-wide station network. Across the diurnal cycle, the relative performance hierarchy remains consistent with the aggregated results. WTK-LED Climate exhibits the largest biases and cRMSE and the lowest correlations at all hours. In contrast, the HRRR-based products and NOW-23 show substantially improved performance, with NOW-23 behaving comparably to the HRRR family, reflecting its strong offshore validation. The most distinct diurnal structure appears in the bias. For all datasets, positive biases peak during the night and early morning, reaching a minimum between late morning and afternoon (approximately 09:00–16:00 local time). This behavior aligns with the daily cycle of boundary layer stability. During daytime convective conditions, enhanced turbulent mixing deepens the boundary layer and reduces vertical wind shear, improving the coupling between hub-height winds, surface forcing, and the larger-scale flow. Under these conditions, mesoscale models generally represent mean hub-height winds more accurately. Conversely, stable nighttime conditions suppress turbulence and increase sensitivity to surface-layer and planetary-boundary-layer parameterizations. This regime often promotes complex phenomena – such as nocturnal low-level jets, drainage flows, and terrain-induced decoupling – that are known to exacerbate model errors (Deppe et al., 2013; Bianco et al., 2019; Olson et al., 2019). The diurnal trend in cRMSE, which shows higher values at night and a minimum during the day, is consistent with this stability-driven contrast in predictability. To determine whether this aggregate diurnal signal is uniform across the network or driven by specific locations, the right column of Fig. 15 presents station-resolved diurnal cycles for the HRRR MET Toolkit. Stations are ranked by diurnal amplitude (defined as the peak-to-trough range of the metric over 24 h). The eight stations with the largest amplitudes are highlighted in color, while the remaining stations appear in gray. The multi-station median (black line) shows a much flatter profile than the high-amplitude stations, indicating that pronounced diurnal variability is not universal but rather concentrated at a subset of sites. These high-amplitude stations likely correspond to environments with strong stability transitions or locally forced circulations – such as complex terrain or coastal zones – consistent with the terrain-dependent degradation identified in Fig. 13. These results confirm that while diurnal performance variability is a robust feature at the continental scale, its magnitude is strongly site-dependent and linked to local flow complexity.
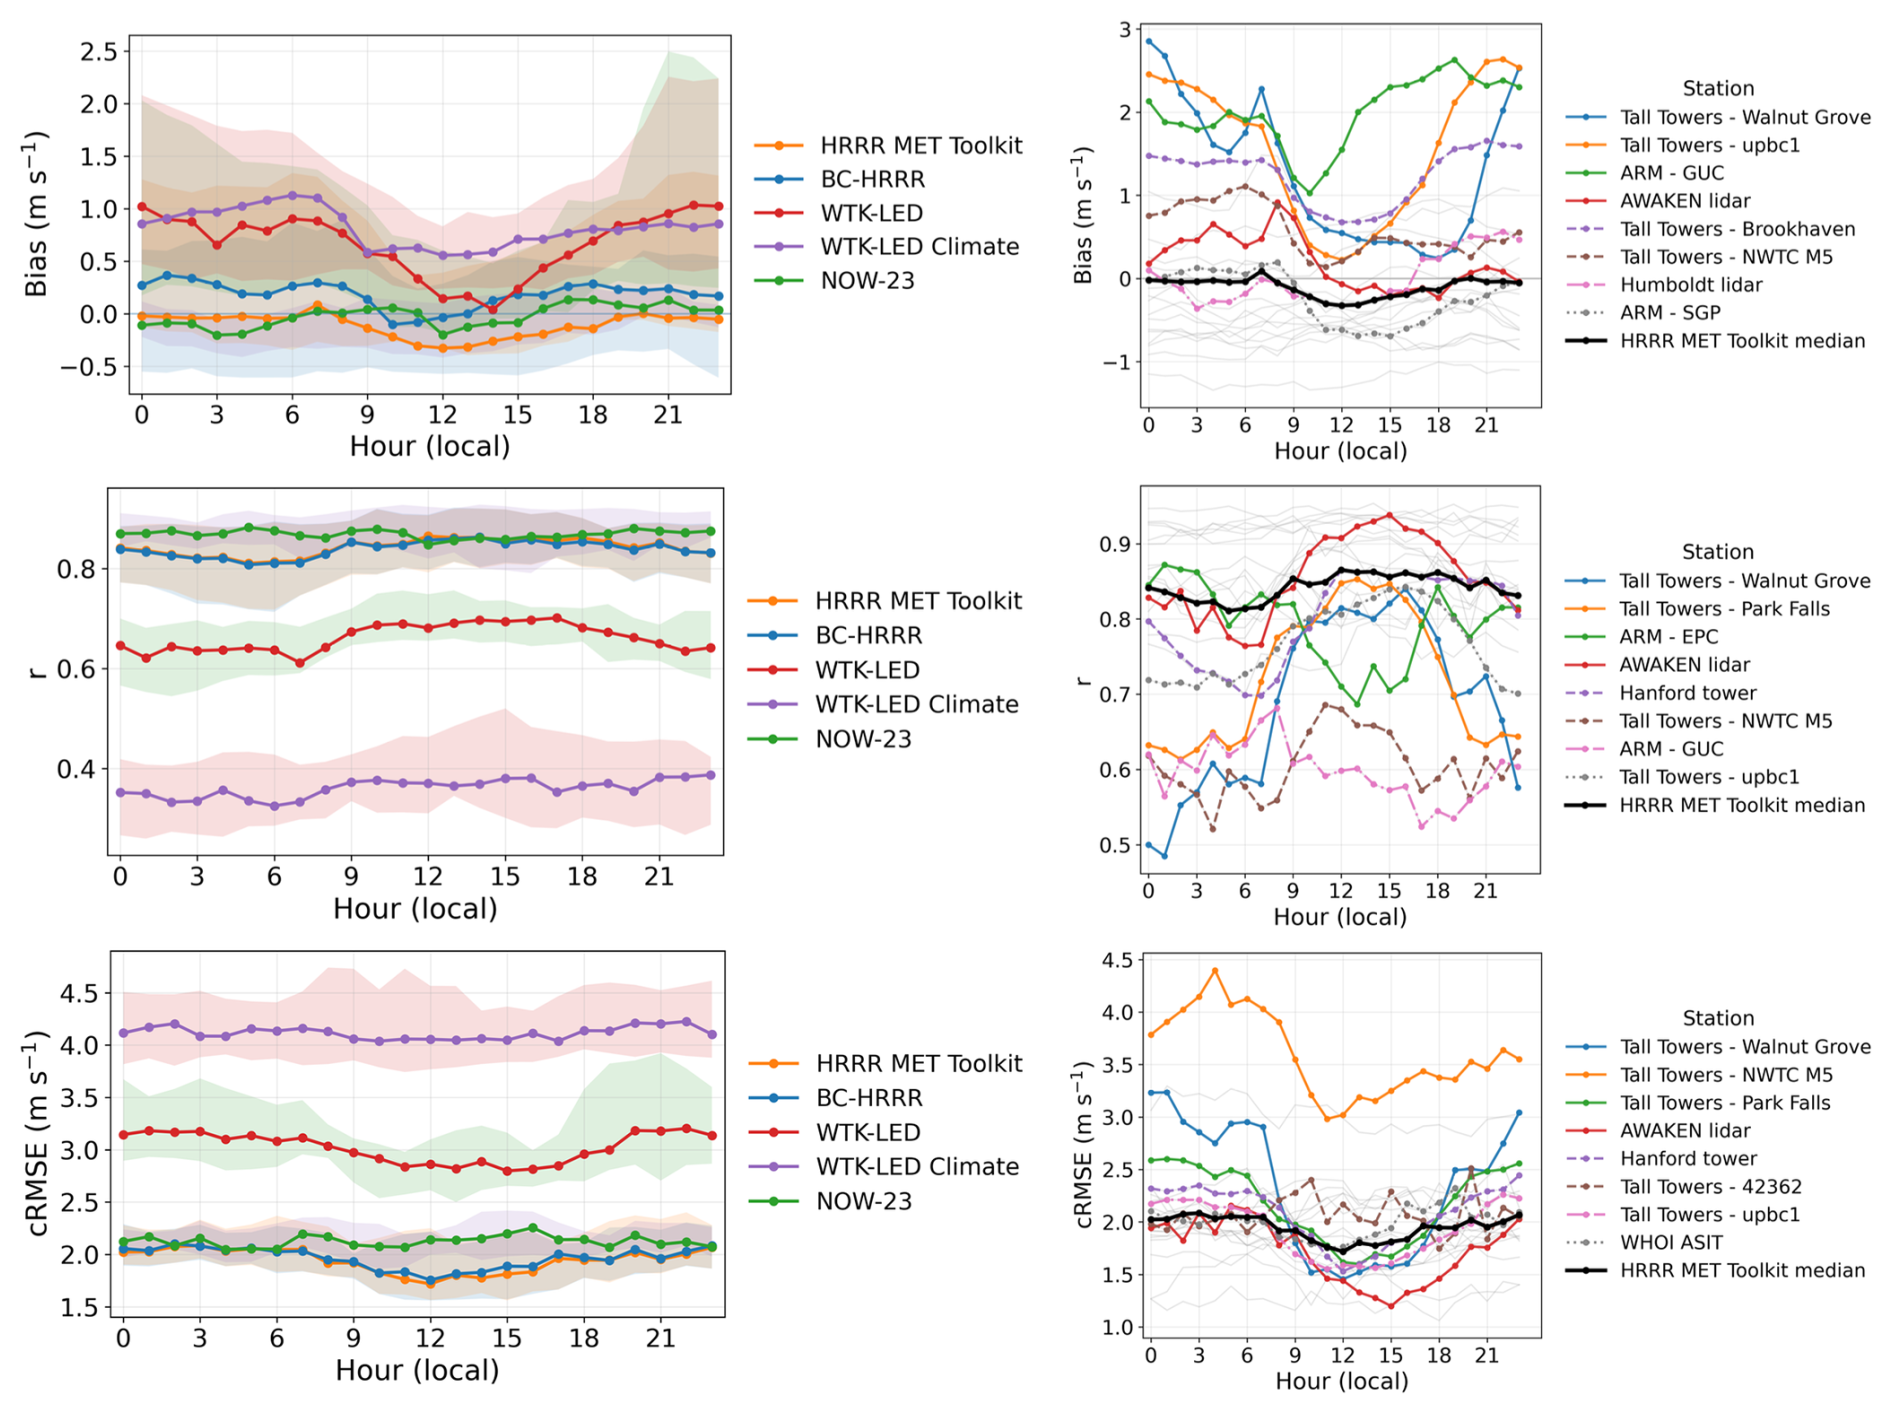
Figure 15Diurnal variation in hub-height bias, r, and cRMSE. The left column shows station-averaged metrics with interquartile range (IQR) shading. The right column details station-level diurnal cycles for the HRRR MET Toolkit, highlighting the eight stations with the largest diurnal amplitude (colored lines) against the remaining stations (gray lines) and the network median (black line).
Seasonally (Fig. 16), the relative performance hierarchy remains consistent: HRRR-based products and NOW-23 outperform the WTK-LED family across all months. Among metrics, correlation displays the clearest seasonal dependence, with lower values in summer and peaks in winter/spring. This likely reflects enhanced summer convective activity and atmospheric instability, which drive small-scale intermittency that mesoscale models struggle to resolve at the point scale (Bianco et al., 2019; Liu et al., 2025). Consequently, temporal coherence degrades during the warm season even where mean errors remain modest. In contrast, bias and cRMSE show weaker seasonal structure when averaged across the domain. The substantial width of the IQR bands suggests that systematic offsets are driven less by seasonality and more by site-specific factors – such as terrain complexity and surface roughness – consistent with prior findings that terrain exerts a stronger control on hub-height performance than season alone (Carvalho et al., 2012).
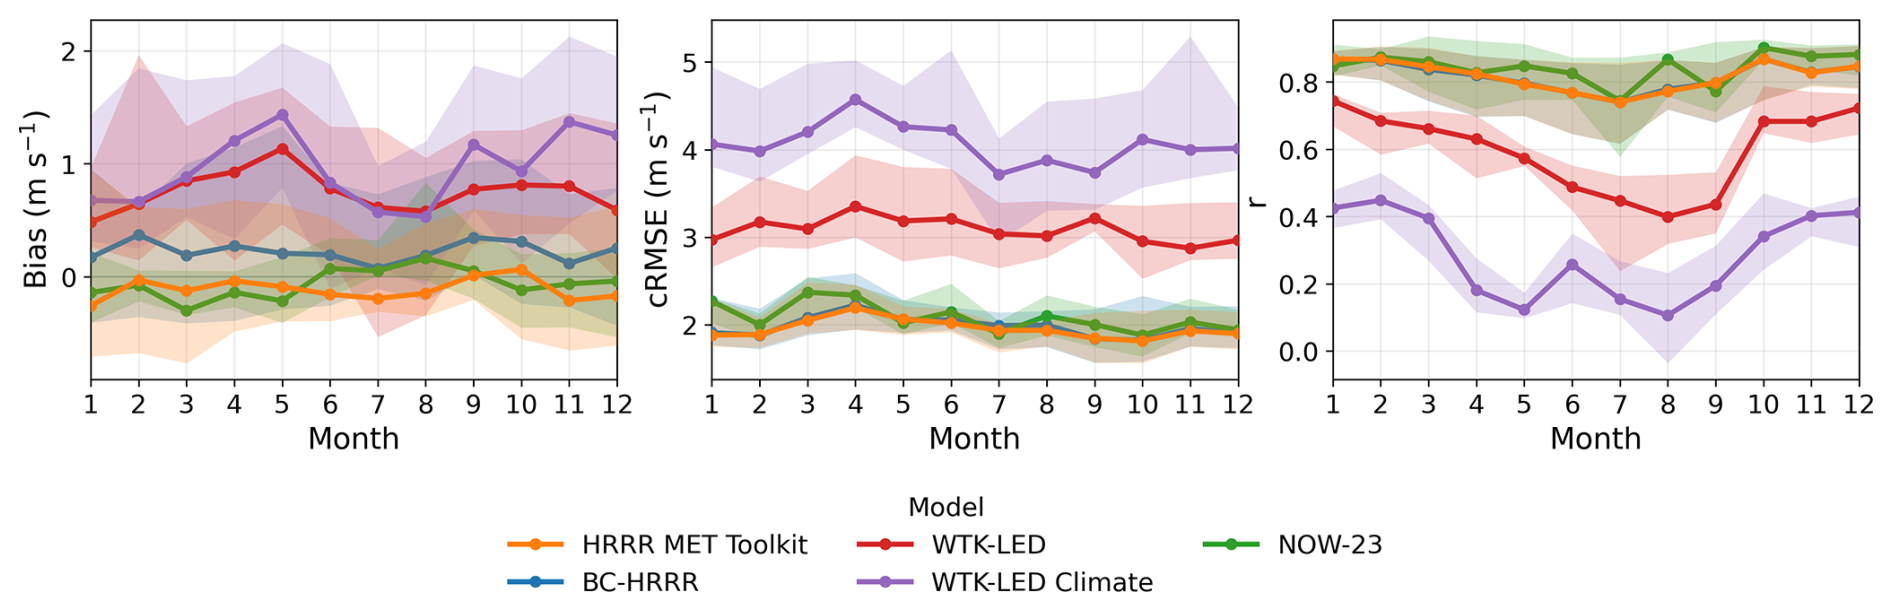
Figure 16Monthly variation in hub-height validation metrics. Lines show metrics averaged across all observational stations, while shaded regions indicate the interquartile range (25th–75th percentile) across stations for each month.
Figure 17 illustrates validation metrics calculated against observation sites that provide multilevel measurements. A consistent trend is observed where cRMSE increases with height for all models. This degradation is likely driven by the higher mean wind speeds experienced at greater altitudes, where absolute errors naturally scale with the magnitude of the wind vector. Correlation and bias show more variability between stations, without a singular dominant vertical trend. However, the general coherence of the HRRR MET Toolkit with observations across these levels confirms that the vertical interpolation strategy effectively preserves the shear signal inherent in the native HRRR model data, making it suitable for analyzing wind resource across the entire rotor-swept area.
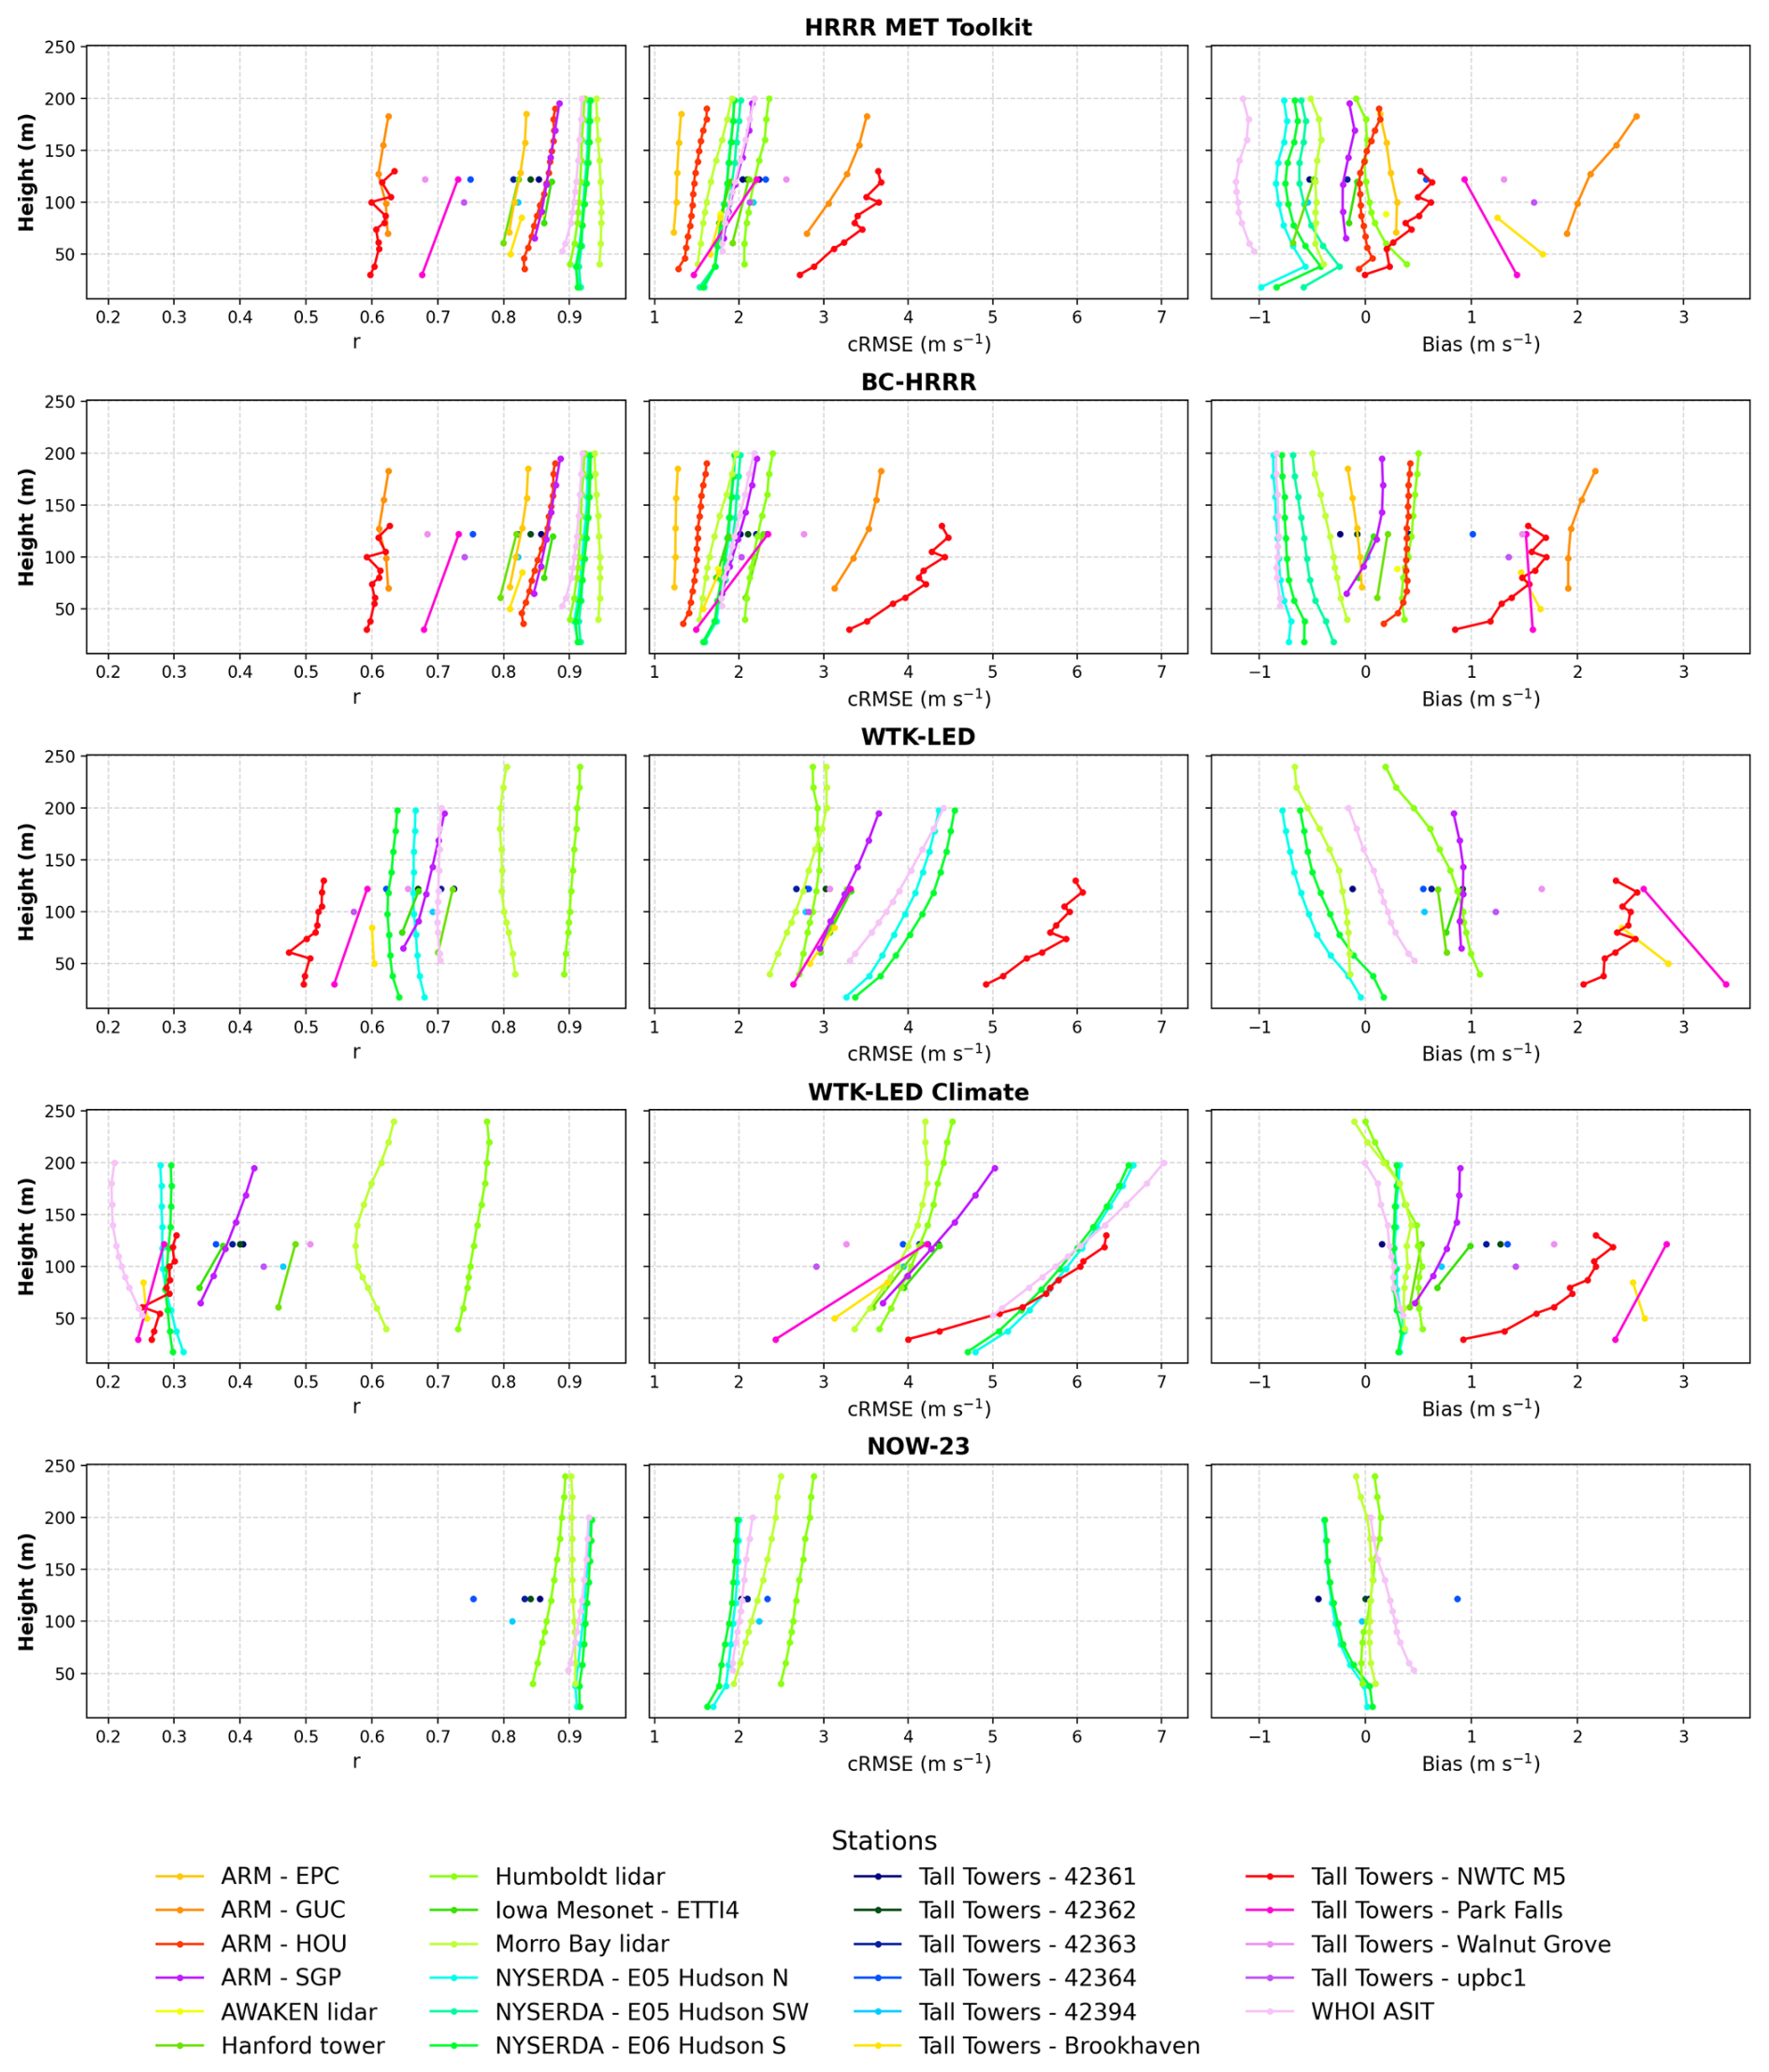
Figure 17Validation metrics as a function of observational heights for all models and observation stations.
Finally, as an operational weather model, the HRRR has undergone several major upgrades since 2014 (Table 1). A critical question for long-term resource assessment is whether these version changes introduce artificial steps or trends in the dataset's accuracy. Figure 18 displays the temporal evolution of weekly validation metrics for the HRRR MET Toolkit, averaged across the 16 stations that span multiple HRRR versions. The analysis reveals a positive trend in model performance over time, corresponding to improvements in the underlying HRRR model physics and data assimilation systems. From HRRRv1 to HRRRv4, the station-averaged correlation improves from approximately 0.67 to 0.8, cRMSE decreases from 2.2 to 1.8 m s−1, and mean bias drops significantly from 0.7 to 0.1 m s−1. These results align with findings from Bianco et al. (2025), who reported improved ramp forecasting skill and reduced error in HRRRv4 compared to v3, as well as the results shown in James et al. (2022), who performed a similar analysis using wind observations at 10 m. To ensure these trends reflect model improvements rather than changes in the observational network quality, we performed an identical analysis on the WTK-LED dataset (which uses a frozen model configuration) and observed no such temporal trends. This confirms that the HRRR MET Toolkit (and BC-HRRR) benefits from the continuous evolution of the operational HRRR system, providing a dataset that becomes increasingly accurate in the recent record. It is worth noting that at least some of these improvements – particularly the transition to HRRRv3 and v4 – were facilitated by the collaborative DOE–NOAA–private sector field campaigns under the Wind Forecast Improvement Projects (WFIP and WFIP2), which identified and helped correct systematic HRRR model errors (Bianco et al., 2019; Olson et al., 2019). This demonstrates the value of sustained investment in targeted field campaigns for operational model improvement. A related open question concerns the degree to which the HRRR's performance advantage stems from its advanced data assimilation system versus improvements in model physics. One approach to disentangle these contributions would be to evaluate HRRR skill at longer forecast horizons (e.g., hour 18 or 48), where the memory of assimilated observations decays, and performance differences would reflect physical parameterization quality more directly. This is an important avenue for future research.
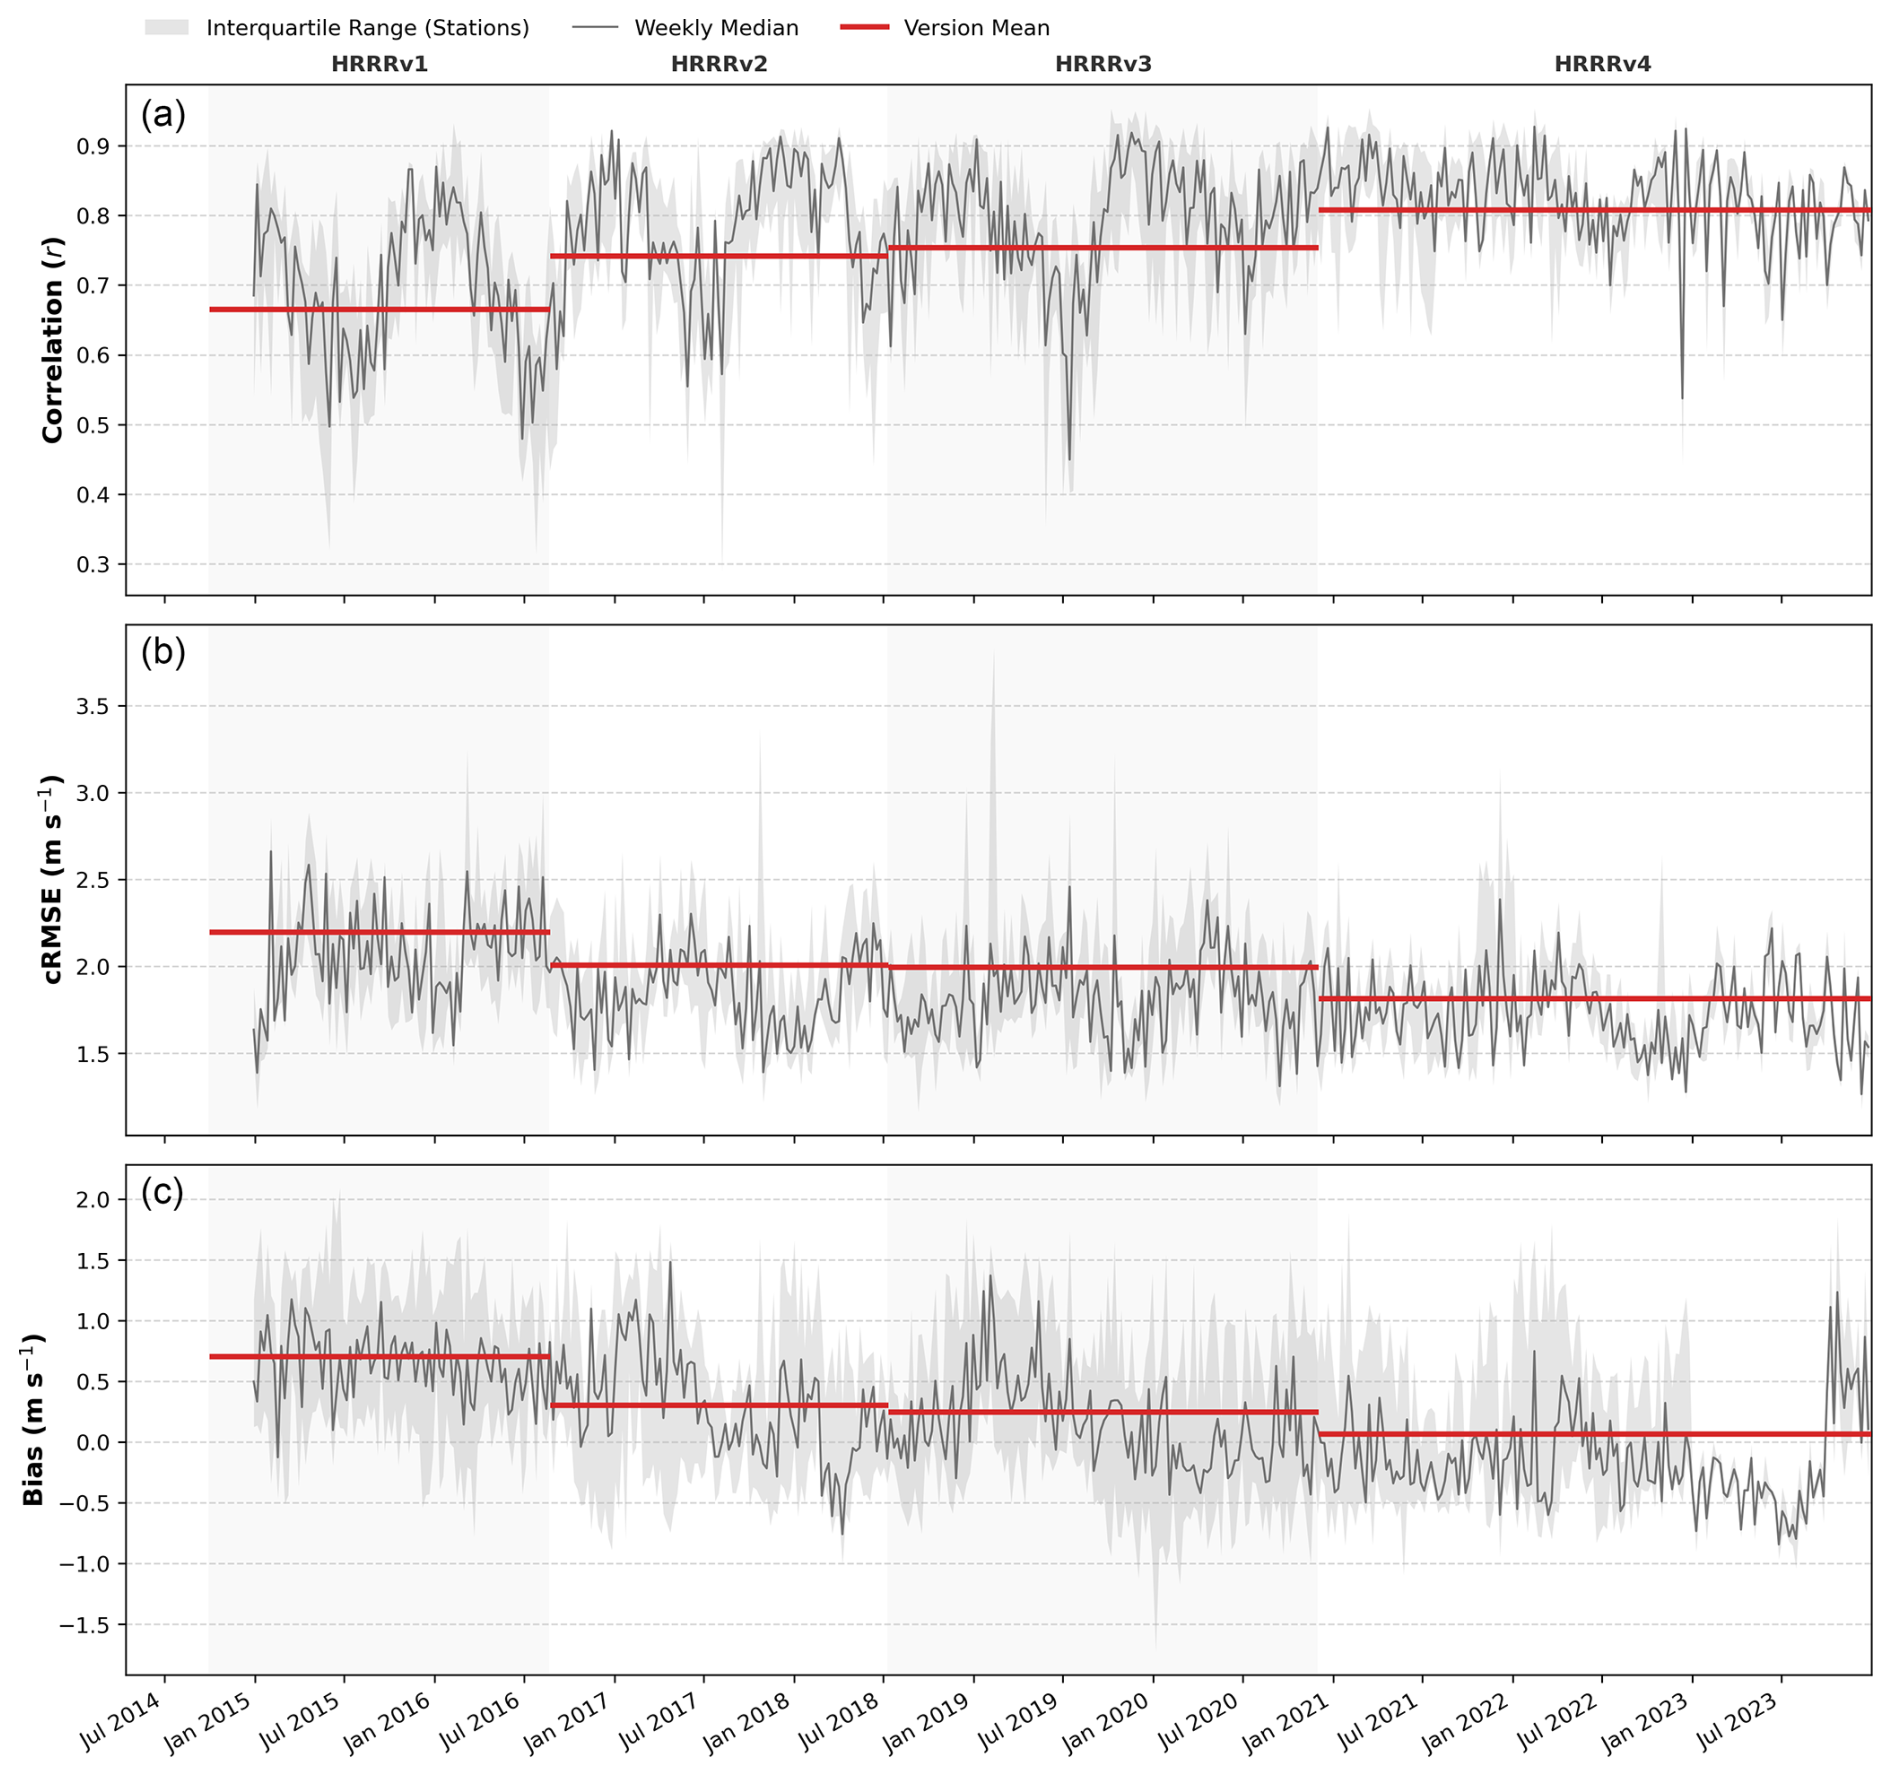
Figure 18Temporal evolution of HRRR MET Toolkit validation metrics from 2015 to 2023 (as only one observational site has observations after early 2024), categorized by the underlying operational HRRR model version. The panels display the weekly (a) Pearson's correlation coefficient, (b) cRMSE, and (c) bias. The solid dark-gray line represents the weekly median across all validation stations, while the light-gray shading denotes the interquartile range (25th–75th percentile), illustrating variability across sites. Thick horizontal red lines indicate the mean performance for each distinct HRRR version period (delineated by alternating background shading).
In this study, we introduce the HRRR MET (Meteorology, Energy, and Transmission) Toolkit and perform the first comprehensive, multi-model validation of wind resource datasets across CONUS at utility-scale hub heights. By repackaging the operational HRRR archive into a user-friendly format and anchoring it to the same uniform 2 km horizontal grid as the legacy WIND Toolkit, the HRRR MET Toolkit provides a seamless, high-resolution wind resource record spanning 2015–2025. This bridges the critical gap between historical industry-standard products and modern operational forecasts.
Our validation against a diverse set of tall meteorological towers and lidars yields several key findings. First, the HRRR-based datasets (the HRRR MET Toolkit and its experimental BC-HRRR variant) consistently outperform the computationally intensive WTK-LED and WTK-LED Climate datasets. Across all stations, the HRRR MET Toolkit achieves a significantly higher correlation (0.82 vs. 0.67) and lower average hub-height bias (0.10 vs. 0.82 m s−1) than WTK-LED. This suggests that leveraging continuously updated operational weather forecast models, which benefit from advanced data assimilation, is a more effective and efficient strategy for maintaining current historical records than running static WRF hindcasts.
Second, our results demonstrate that the experimental bias correction applied to BC-HRRR does not universally improve the accuracy of the native HRRR model. While the correction effectively mitigates some negative biases in offshore environments, it provides marginal benefits in land-based regions and can actually exacerbate positive biases in mountainous or topographically complex terrain. These findings indicate that the native HRRR physics are already robust for energy applications without the added complexity of statistical post-processing. We conclude that a uniform, country-wide bias correction against legacy datasets is not a universal solution, especially when it introduces non-stationarity risks in extreme event analysis.
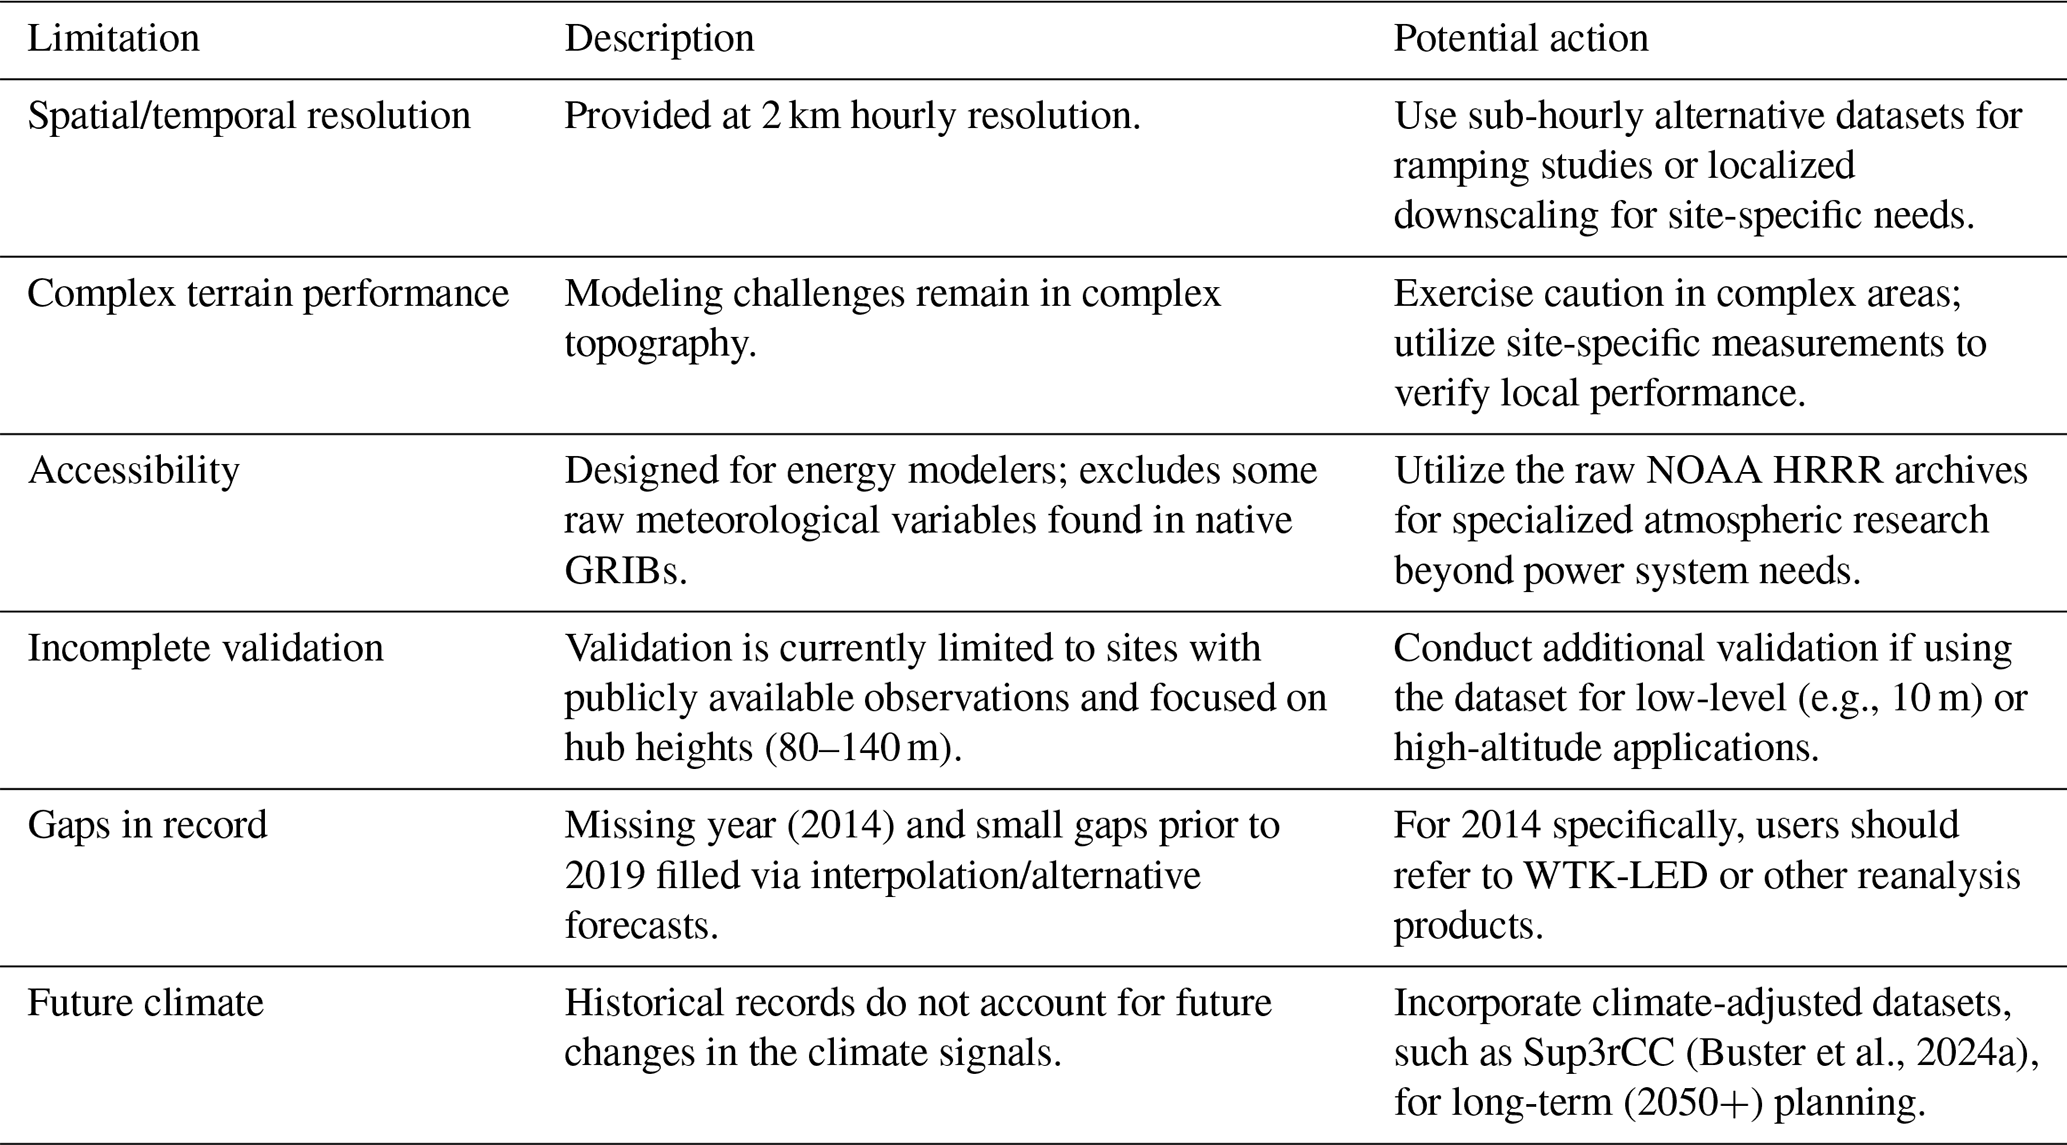
(Buster et al., 2024a)Table 4Limitations of the HRRR MET Toolkit dataset and potential user actions.
It is also important to acknowledge several potential sources of uncertainty inherent to the validation process itself. First, the observational “ground truth” is subject to measurement errors specific to the instrumentation and inconsistencies in quality control processes and site standards across the diverse observational networks used. Second, methodological uncertainties arise from comparing grid-based models to point measurements; this includes spatial representation errors inherent in mapping a 2 km grid cell to a specific instrumentation location, as well as vertical interpolation uncertainties stemming from the linear interpolation of coarser model levels to specific sensor heights. Third, despite rigorous filtering, some validation sites may still be impacted by microscale surroundings or complex local flow features that are unsuitable for mesoscale model validation. Finally, the results are conditioned by the geographic representativeness of the available validation locations and the partly varying validation time periods across datasets. While a different constellation of validation sites might yield slightly different error statistics, the broad spatial distribution of the current sites suggests that the overall conclusions regarding the relative performance of the datasets remain robust.
Ultimately, the HRRR MET Toolkit represents a marked improvement in data accessibility and usability over the native HRRR archive. The native data are distributed in complex GRIB formats on irregular hybrid vertical levels that vary in height over time and space, creating a significant barrier to entry for energy analysts. The HRRR MET Toolkit removes these barriers by providing a regularized, user-friendly dataset interpolated to standard wind-energy-specific heights. Furthermore, the toolkit's accuracy naturally improves over time as it tracks updates to the underlying NOAA operational model. The HRRR MET Toolkit is publicly available through the NLR Open Energy Data Initiative (OEDI) and the Wind Resource Database (WRDB). Users should remain aware of the specific regional nuances and limitations summarized in Table 4.
Technical specifications of modeled datasets are reported in Table A1.
Table A1Comparison of technical specifications for the WIND Toolkit, WTK-LED, WTK-LED Climate, NOW-23, and HRRR.
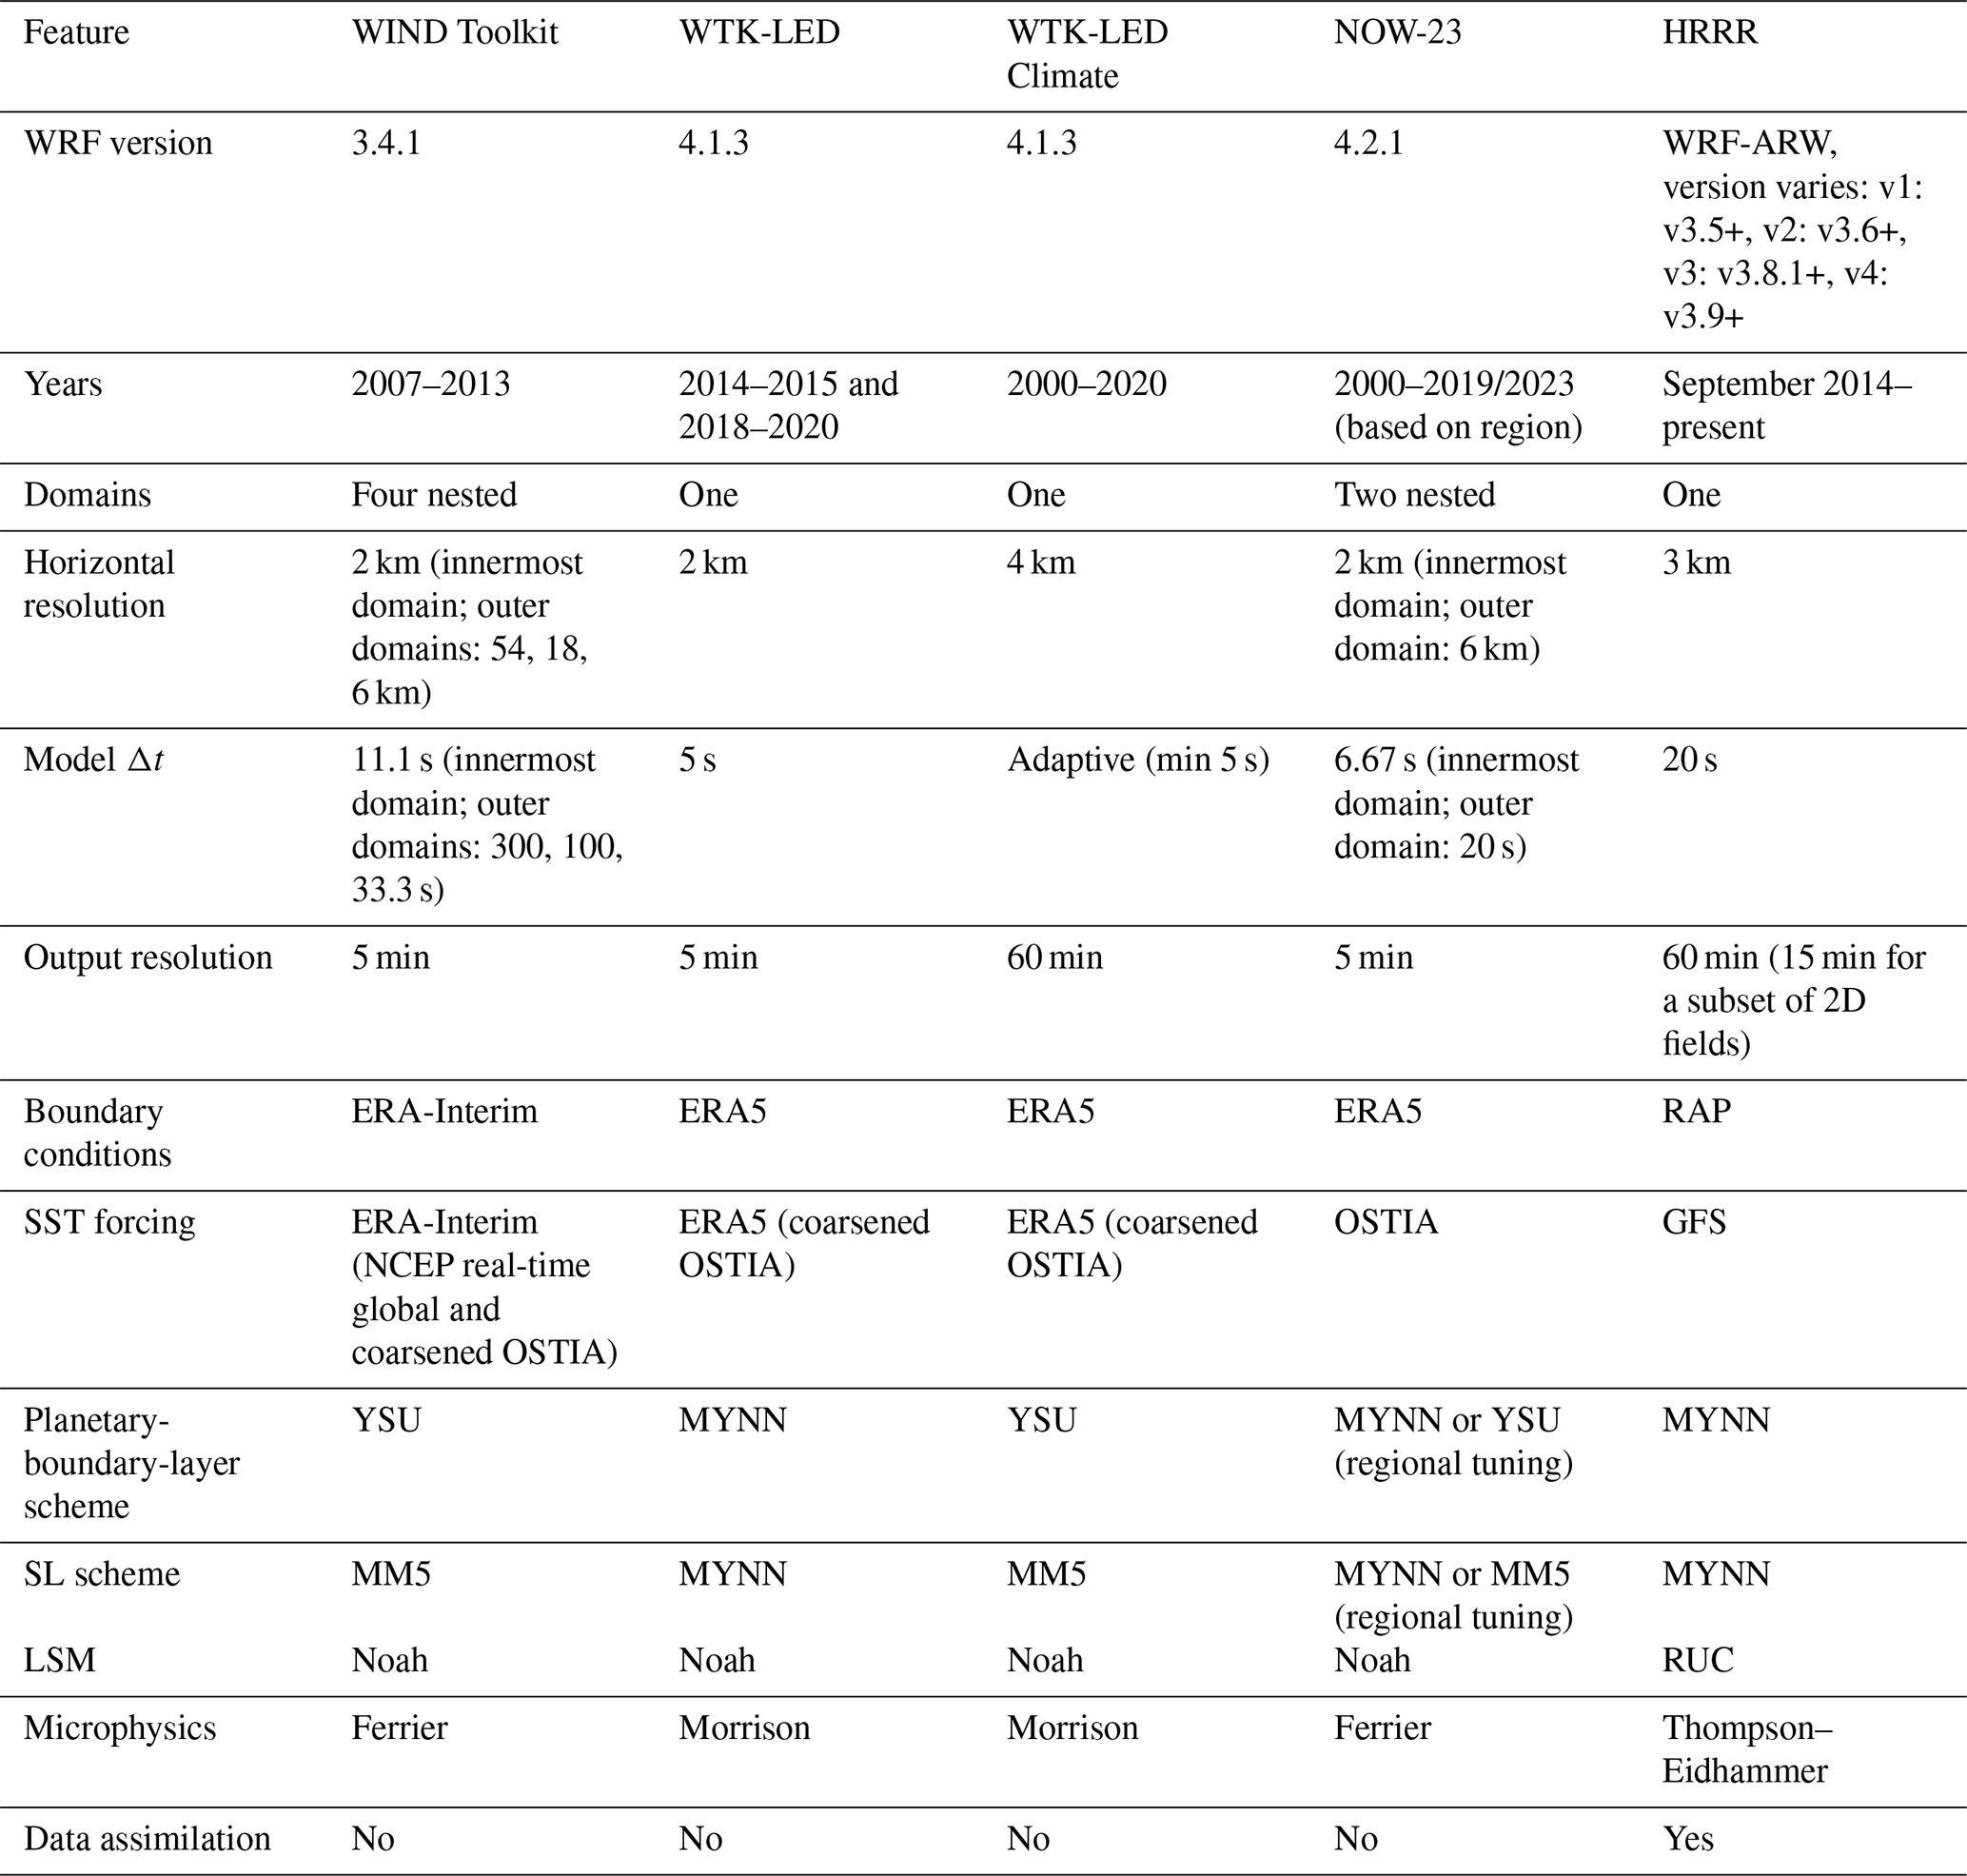
SST: sea surface temperature; SL: surface layer; LSM: land surface model; MYNN: Mellor–Yamada–Nakanishi–Niino; YSU: Yonsei University; MM5: fifth-generation Penn State/National Center for Atmospheric Research mesoscale model; OSTIA: operational sea surface temperature and sea ice analysis; RAP: rapid refresh; RUC: rapid update cycle; ERA5: ECMWF reanalysis v5; GFS: Global Forecast System; NCEP: National Centers for Environmental Prediction.
The bias correction method used to produce BC-HRRR assumes stationarity in the wind speed distribution. A consequence of this approach is that extreme high-wind events in the BC-HRRR are constrained by the WIND Toolkit record, potentially masking long-term climatic trends or extreme events unique to the recent period. Future iterations of this dataset may employ quantile delta mapping (Cannon et al., 2015) to better preserve these non-stationary signals.
It is important to assess whether the WIND Toolkit period (2007–2013) is representative of the long-term conditions over CONUS and whether the BC-HRRR period and the WIND Toolkit period share a similar wind climatology, given that the WIND Toolkit is used as the basis for bias correction. We use ERA5 reanalysis data (Hersbach et al., 2020) for this assessment, as they offer a consistent dataset for evaluation over the long term, though we note that ERA5 itself possesses a known overall negative bias across much of the contiguous United States (Wilczak et al., 2024).
Figure B1 illustrates the spatiotemporal variability in ERA5 100 m wind speed changes over time. Overall, the wind resource during the WIND Toolkit period is representative of long-term wind conditions (1940–2025) over CONUS, especially onshore. Temporal variability is limited to less than 0.1 m s−1 in most areas, with the exception of some offshore regions (especially off the Pacific coast). The ERA5 data also indicate that the shift in wind resource magnitude between the WIND Toolkit period and the BC-HRRR period (2015–2023) exhibits distinct spatial variability across the contiguous United States. While the eastern and northwestern US experienced slightly lower wind speeds during the recent BC-HRRR period, much of the central wind corridor and the southwest saw slight increases. Because our bias correction process anchors the 2015–2023 HRRR data to the 2007–2013 WIND Toolkit distribution, this temporal mismatch means the resulting BC-HRRR product may exhibit minor, regionally dependent biases relative to actual ground observations taken during the 2015–2023 period (e.g., a slight positive bias in the east and northwest and a slight negative bias in the central US). However, the magnitude of these temporal differences remains generally minimal across the onshore domain (average < 0.2 m s−1), with the largest anomalies restricted primarily to offshore regions.
To further confirm this representativeness at hub height across the domain, we extracted 100 m hourly wind speed data from ERA5 at a geographically distributed set of locations covering the years 2000–2024. Because the observational sites used in this study are unevenly distributed, the specific locations used here were selected to ensure a robust spatial sampling across CONUS, including both onshore and offshore location (Fig. B2). The distribution of temporal differences confirms the spatial findings: while the WIND Toolkit period is slightly above the long-term average, the magnitude of the difference is small (0.05 m s−1 on average). Similarly, the BC-HRRR period is slightly less windy than the WIND Toolkit period, but the differences are negligible. This confirms that the WIND Toolkit epoch is a suitable candidate for use as the basis for bias correction.
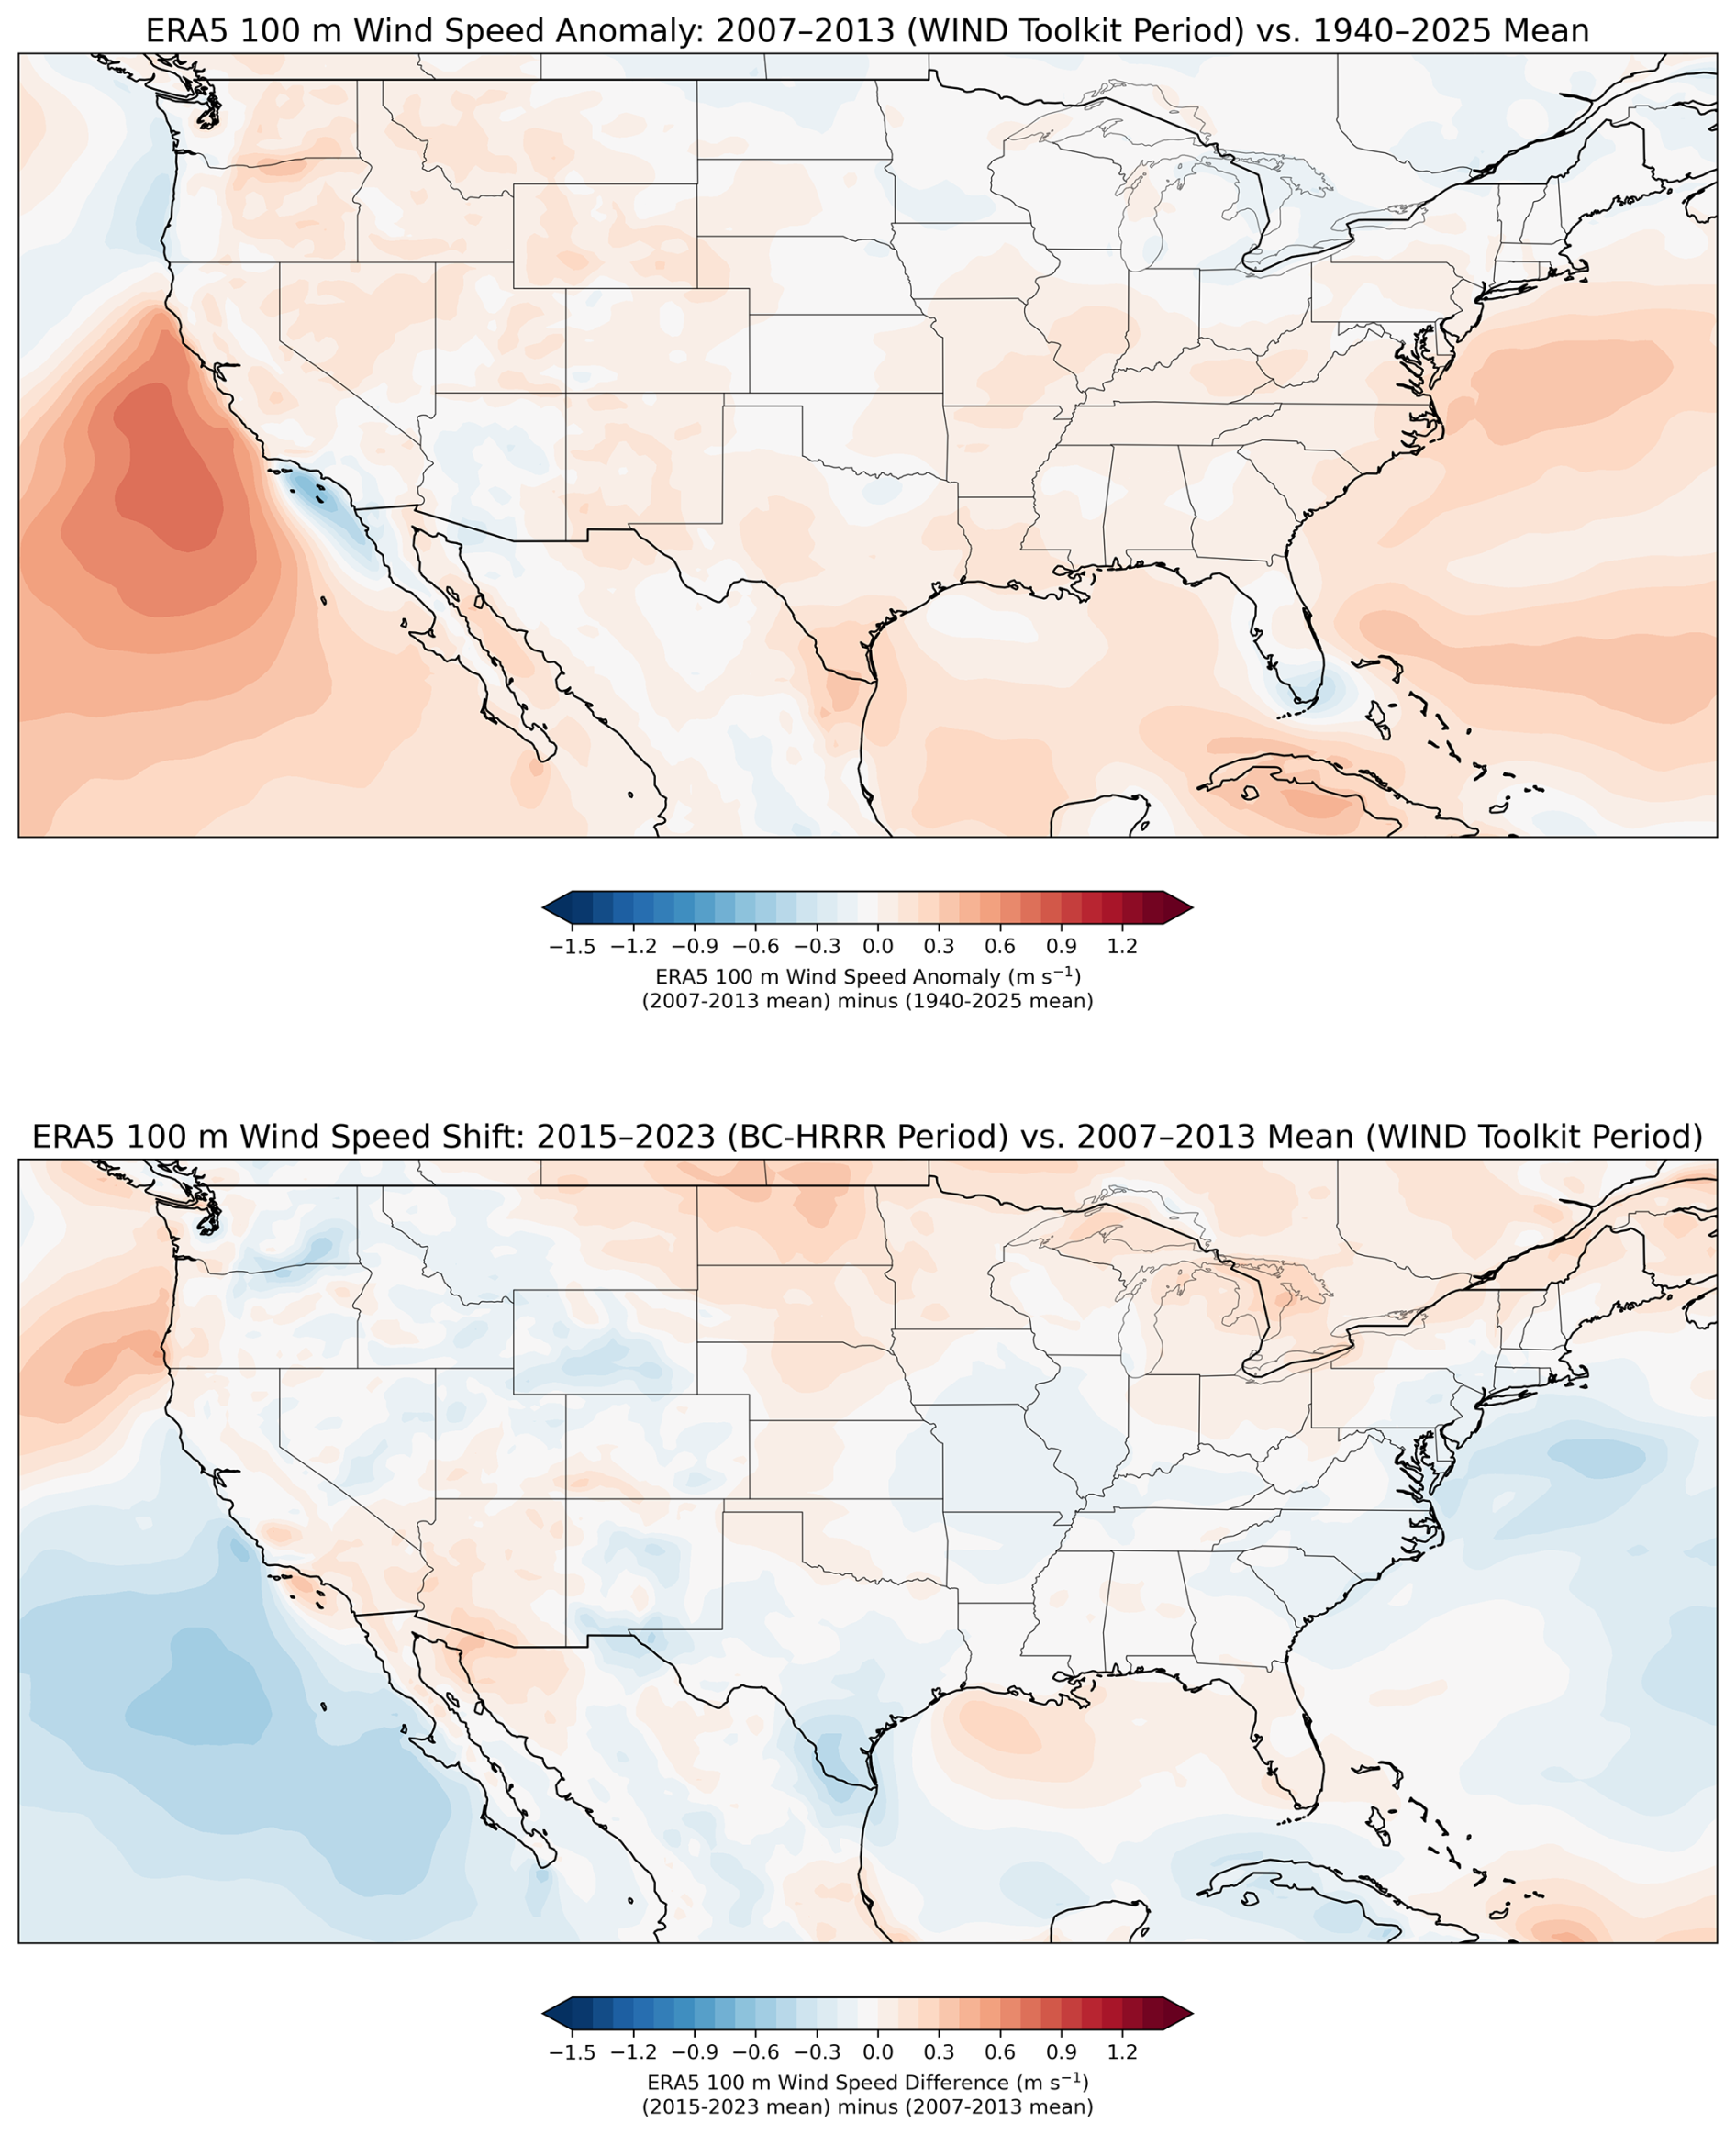
Figure B1Spatiotemporal variability in ERA5 100 m wind speeds over the contiguous United States. Note that both panels utilize only ERA5 data to evaluate shifts between specific epochs. Top: the anomaly of the WIND Toolkit reference period (2007–2013) relative to the long-term climatology (1940–2025), illustrating the representativeness of the WIND Toolkit epoch. Bottom: the shift in wind resource magnitude during the BC-HRRR period (2015–2023) compared to the WIND Toolkit period.
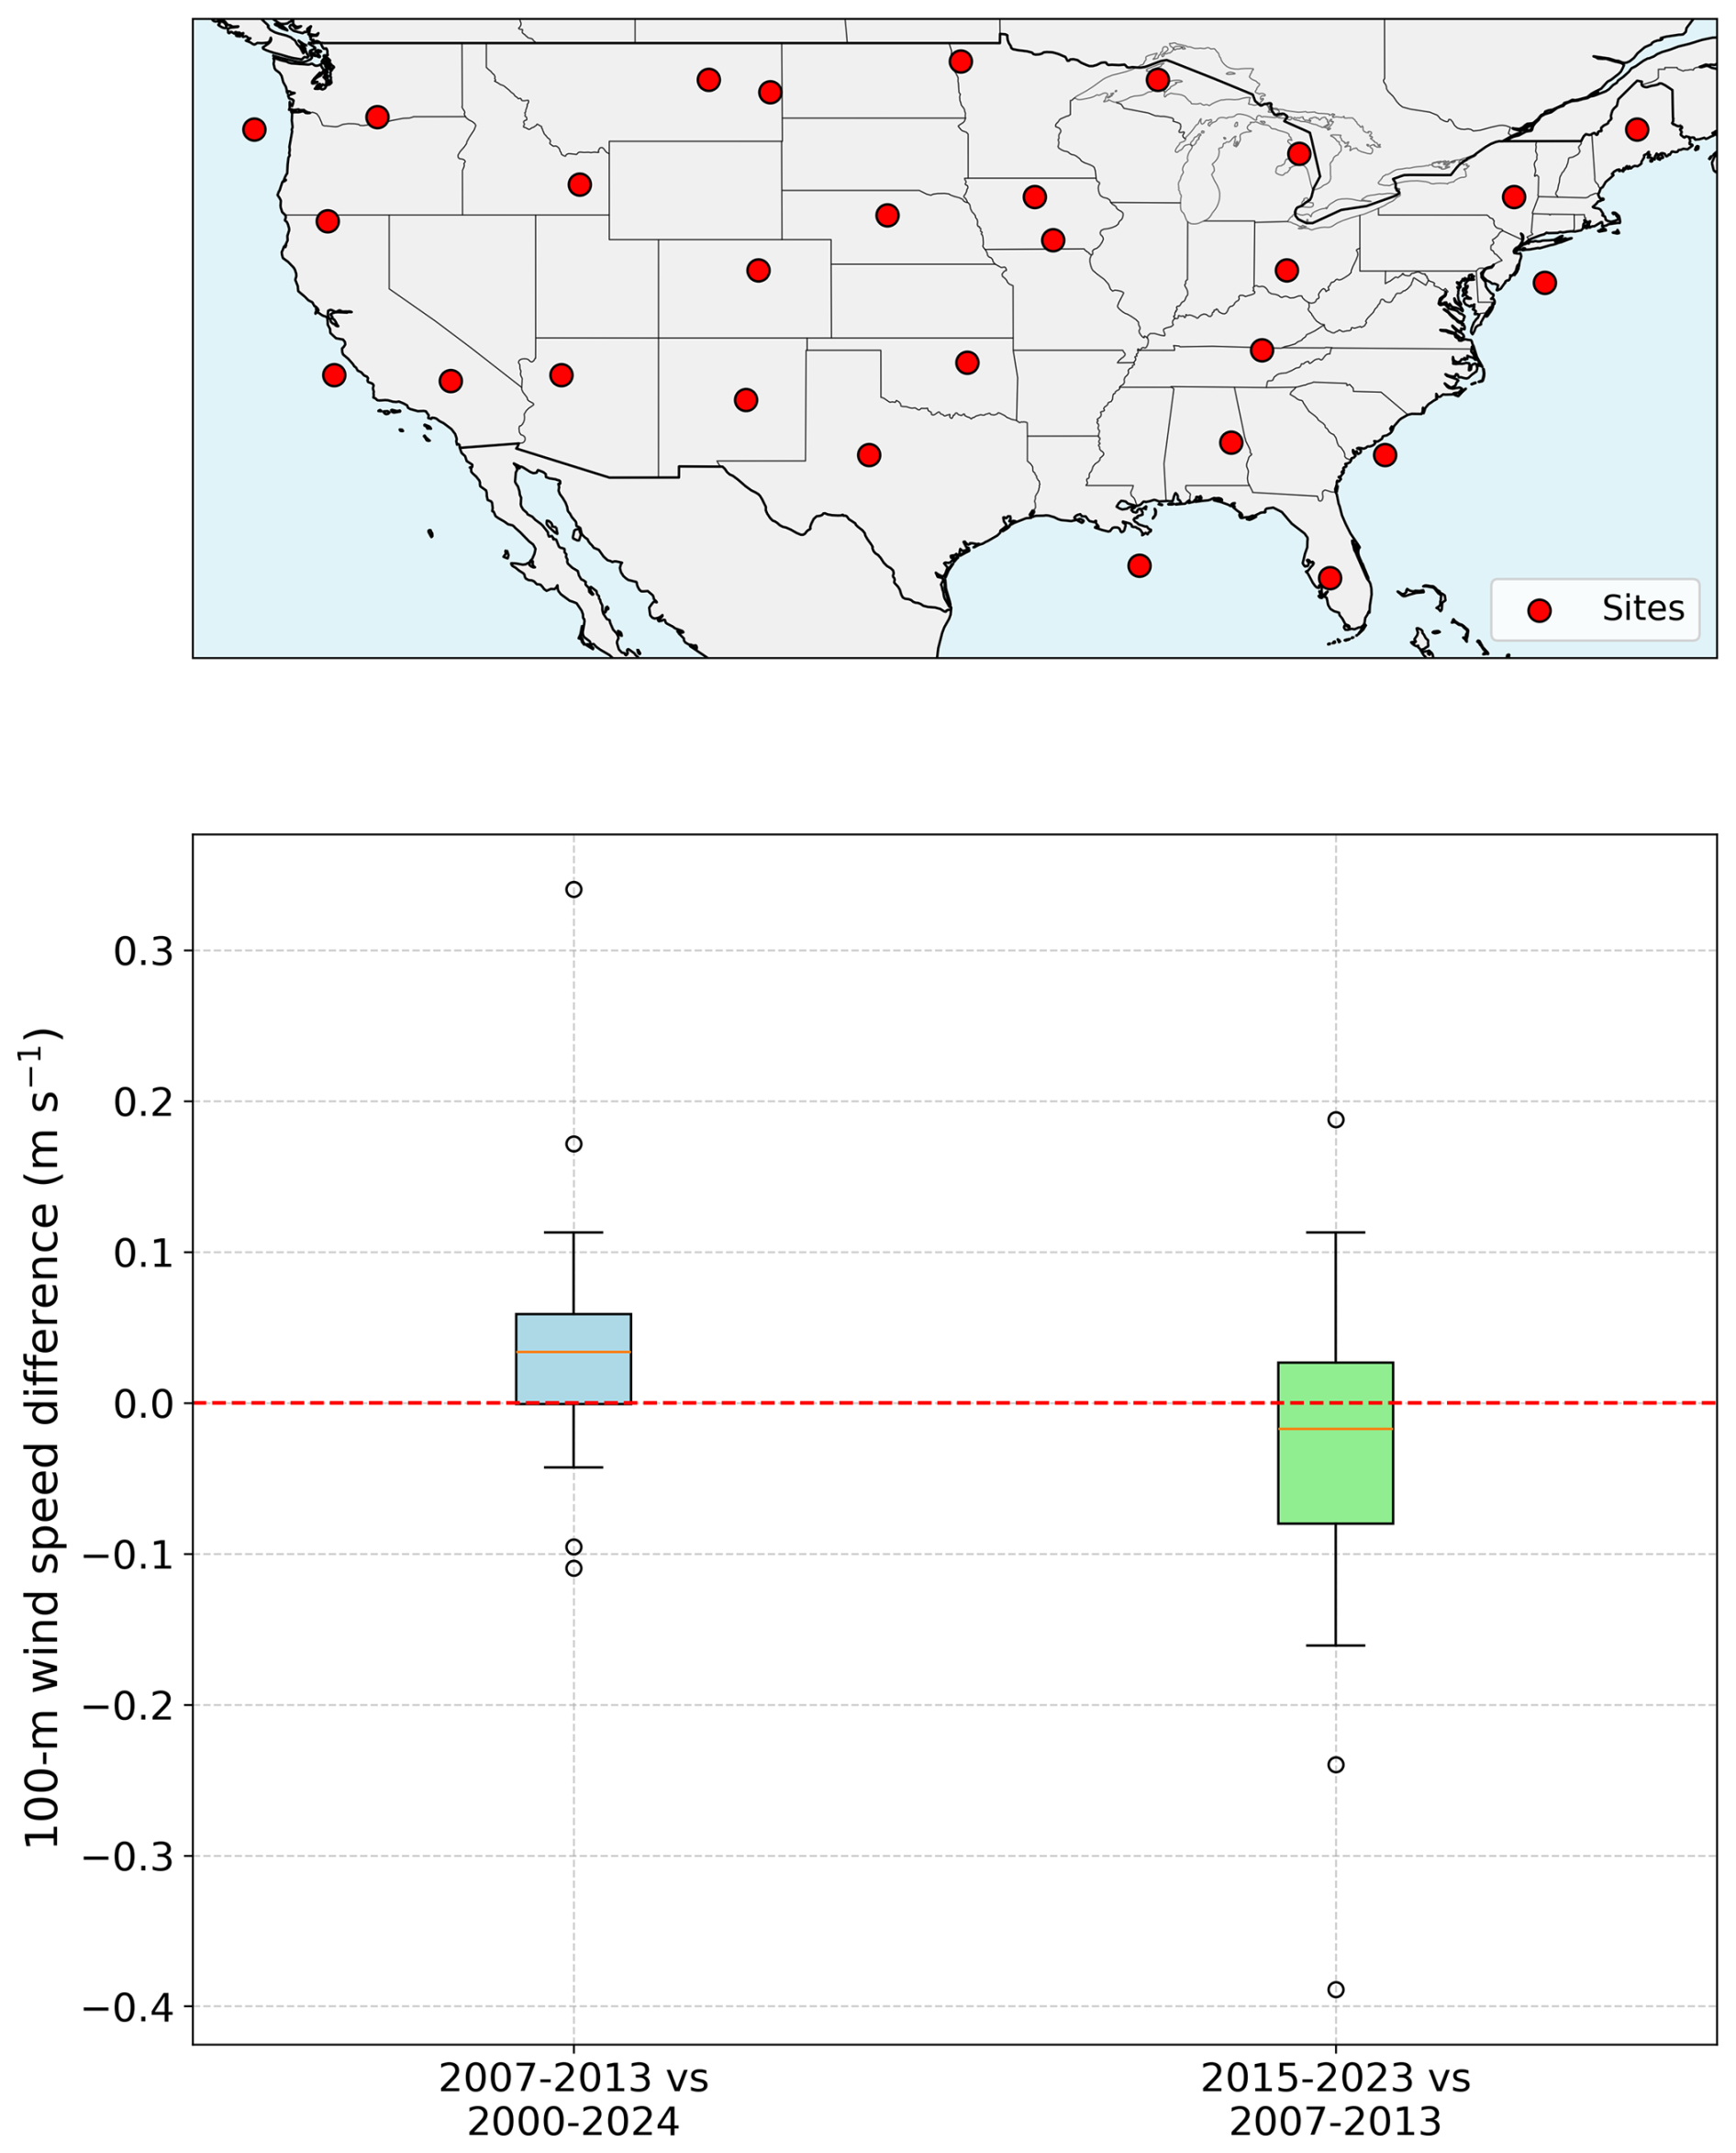
Figure B2Top: map of locations at which 100 m ERA5 hourly wind speed was extracted. Bottom: distribution of ERA5 100 m wind speed differences across these sites. The left boxplot shows the anomaly of the WIND Toolkit reference period (2007–2013) relative to the long-term climatology (2000–2024), while the right boxplot illustrates the shift in wind resources during the BC-HRRR period (2015–2023) compared to the WIND Toolkit period.
The WIND Toolkit serves as the distributional target for the quantile mapping bias correction. Comparing their climatological statistics verifies that the bias correction has successfully harmonized the datasets, enabling their combined use as a 16-year record. Figure C1 shows the difference in mean 100 m wind speed. The observed mean differences are negligible (<0.03 m s−1) across the majority of the domain, confirming that BC-HRRR successfully anchors the modern HRRR era to the legacy WIND Toolkit baseline.
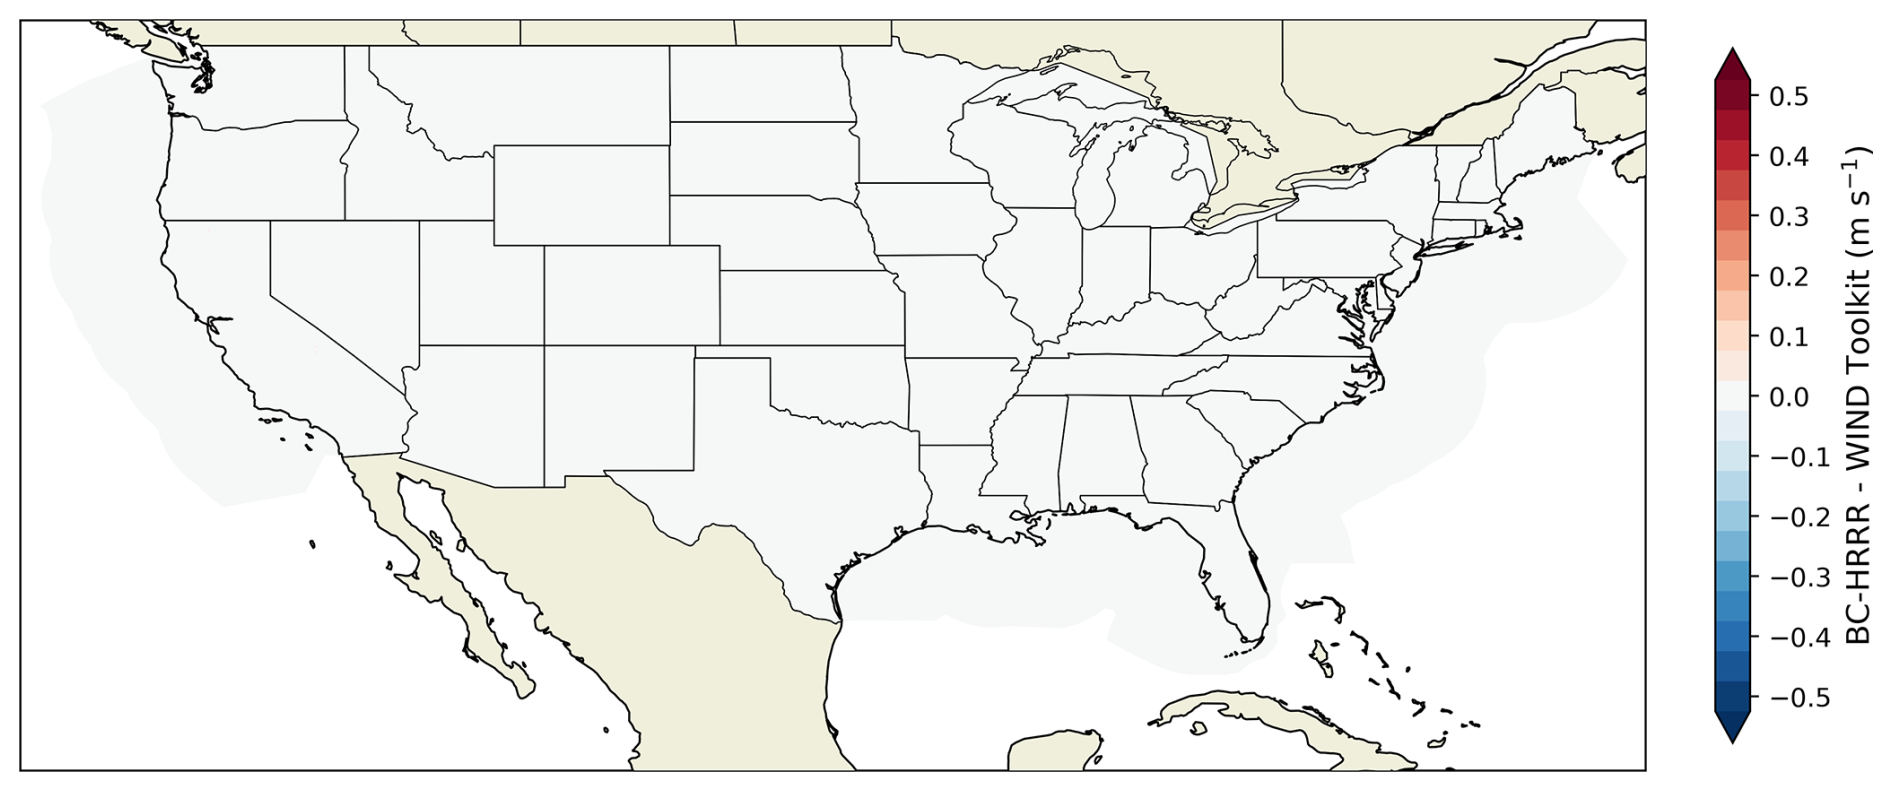
Figure C1Difference in mean 100 m wind speed between the BC-HRRR and the WIND Toolkit. Values represent the BC-HRRR climatological mean (2015–2023) minus the WIND Toolkit climatological mean (2007–2013).
The post-processed modeled data distributed by the NLR (WIND Toolkit, WTK-LED, WTK-LED Climate, NOW-23, HRRR MET Toolkit, and BC-HRRR) are stored in Hierarchical Data Format version 5 (HDF5) on the NLR's Kestrel high-performance computing system. To support broad dissemination, the datasets are also hosted on the Amazon Web Services (AWS) Simple Storage Service (S3) as part of the Open Energy Data Initiative (OEDI). The HDF5 files contain self-describing metadata – including variable names, units, coordinate systems, and spatial/temporal resolutions – ensuring the data are FAIR (findable, accessible, interoperable, and reusable). Users can access the data through two primary channels.
-
Wind Resource Database (WRDB). For general users, the datasets are integrated into the NLR Wind Resource Database (https://wrdb.nrel.gov/; National Laboratory of the Rockies, 2024). This web-based platform allows users to visualize layers, select specific locations or regions (e.g., US counties), filter by year and variable, and download the resulting subsets in common formats (currently .csv).
-
Direct Cloud/API access. For bulk access or programmatic analysis, the data are served via the HDF Group's Highly Scalable Data System (HSDS). This architecture allows users to slice and extract specific subsets of the multi-terabyte dataset without downloading full files. A repository of example Python scripts is provided to demonstrate how to connect to the HSDS service, query specific spatiotemporal subsets, and process the data. Detailed documentation and these resources can be accessed at https://developer.nlr.gov/docs/wind/wind-toolkit/ (last access: 13 October 2026).
For further assistance, a dedicated user support team is available at wrdb@nlr.gov.
Native HRRR data can be downloaded from the NOAA's web page at https://rapidrefresh.noaa.gov/hrrr/ (last access: 13 October 2026).
Observations used for model validation are stored (in a common .nc format) at https://doi.org/10.5281/zenodo.18177810 (Bodini et al., 2026).
NB and GB led the development of the HRRR MET Toolkit dataset. LL and GB led the development of the BC-HRRR dataset. PP and BB developed the software infrastructure for BC-HRRR data processing. DDT provided expertise on the HRRR model. NB coordinated the work and led the data analysis. EM and UE performed the model validation. NB, EM, and UE led the manuscript preparation. All authors reviewed the manuscript draft.
The contact author has declared that none of the authors has any competing interests.
The views expressed in the article do not necessarily represent the views of the DOE, NOAA, or the US Government.
Publisher's note: Copernicus Publications remains neutral with regard to jurisdictional claims made in the text, published maps, institutional affiliations, or any other geographical representation in this paper. The authors bear the ultimate responsibility for providing appropriate place names. Views expressed in the text are those of the authors and do not necessarily reflect the views of the publisher.
This work would not be possible without the significant efforts by the NOAA to produce and maintain the HRRR.
Collecting and storing atmospheric observations is a challenging task, and the authors would like to acknowledge all the people and institutions involved in the collection of observations used for model validation. Some data were obtained from the Atmospheric Radiation Measurement User Facility, a US Department of Energy Office of Science user facility managed by the Biological and Environmental Research program. Some data were obtained from the Wind Data Hub funded by the US Department of Energy, Office of Critical Minerals and Energy Innovation, and operated and maintained by Pacific Northwest National Laboratory at https://wdh.energy.gov (last access: 13 October 2026). We acknowledge the use of data from the Woods Hole Oceanographic Institution (WHOI) MetOcean Data Initiative, collected by WHOI. We also thank the Barcelona Supercomputing Center for providing access to the Tall Tower Dataset. Data were also obtained from the Iowa Environmental Mesonet, maintained by the Department of Agronomy at Iowa State University. Finally, we acknowledge the Hanford Meteorological Station, managed by Hanford Mission Integration Solutions for the US Department of Energy, for the provision of meteorological data from the Hanford Site. A portion of this research was performed using computational resources sponsored by the US Department of Energy's Office of Critical Minerals and Energy Innovation and located at the National Laboratory of the Rockies.
This paper was edited by Jennifer King and reviewed by two anonymous referees.
Benjamin, S. G., James, E. P., Turner, D. D., Balmes, K. A., Sedlar, J., Lantz, K. O., Jensen, A. A., Riihimaki, L. D., and Augustine, J. A.: Excessive downward shortwave radiation in the HRRR and RAP weather models and testing strategies for improvements, Mon. Weather Rev., 153, 2279–2293, https://doi.org/10.1175/MWR-D-25-0094.1, 2025. a
Bianco, L., Djalalova, I. V., Wilczak, J. M., Olson, J. B., Kenyon, J. S., Choukulkar, A., Berg, L. K., Fernando, H. J. S., Grimit, E. P., Krishnamurthy, R., Lundquist, J. K., Muradyan, P., Pekour, M., Pichugina, Y., Stoelinga, M. T., and Turner, D. D.: Impact of model improvements on 80 m wind speeds during the second Wind Forecast Improvement Project (WFIP2), Geosci. Model Dev., 12, 4803–4821, https://doi.org/10.5194/gmd-12-4803-2019, 2019. a, b, c, d
Bianco, L., Mendeke, R., Lindblom, J., Djalalova, I. V., Turner, D. D., and Wilczak, J. M.: Evaluating the ability of the operational High Resolution Rapid Refresh model version 3 (HRRRv3) and version 4 (HRRRv4) to forecast wind ramp events in the US Great Plains, Wind Energ. Sci., 10, 2117–2136, https://doi.org/10.5194/wes-10-2117-2025, 2025. a
Bodini, N., Castagneri, S., and Optis, M.: Long-term uncertainty quantification in WRF-modeled offshore wind resource off the US Atlantic coast, Wind Energ. Sci., 8, 607–620, https://doi.org/10.5194/wes-8-607-2023, 2023. a
Bodini, N., Optis, M., Redfern, S., Rosencrans, D., Rybchuk, A., Lundquist, J. K., Pronk, V., Castagneri, S., Purkayastha, A., Draxl, C., Krishnamurthy, R., Young, E., Roberts, B., Rosenlieb, E., and Musial, W.: The 2023 National Offshore Wind data set (NOW-23), Earth Syst. Sci. Data, 16, 1965–2006, https://doi.org/10.5194/essd-16-1965-2024, 2024. a, b, c, d
Bodini, N., Egerer, U., and Maric, E.: Formatted hub-height wind speed observations across the Continental United States, Zenodo [data set], https://doi.org/10.5281/zenodo.18177810, 2026. a
Buster, G., Benton, B. N., Glaws, A., and King, R. N.: High-resolution meteorology with climate change impacts from global climate model data using generative machine learning, Nature Energy, https://doi.org/10.1038/s41560-024-01507-9, 2024a. a
Buster, G., Pinchuk, P., Lavin, L., Benton, B., and Bodini, N.: Bias Corrected NOAA HRRR Wind Resource Data for Grid Integration Applications, Open Energy Data Initiative (OEDI), National Renewable Energy Lab (NREL) [data set], https://doi.org/10.25984/2480349, 2024b. a, b, c
Buster, G., Pinchuk, P., Lavin, L., Benton, B., and Bodini, N.: Bias Correcting NOAA’s High-Resolution Rapid Refresh (HRRR) Wind Resource Data for Grid Integration Applications, Tech. Rep. NREL/PR-6A20-91749, National Renewable Energy Laboratory, https://doi.org/10.2172/2479268, 2024c. a
Cannon, A. J., Sobie, S. R., and Murdock, T. Q.: Bias Correction of GCM Precipitation by Quantile Mapping: How Well Do Methods Preserve Changes in Quantiles and Extremes?, J. Climate, 28, 6938–6959, https://doi.org/10.1175/JCLI-D-14-00754.1, 2015. a, b
Carvalho, D., Rocha, A., Gómez-Gesteira, M., and Santos, C.: A sensitivity study of the WRF model in wind simulation for an area of high wind energy, Environ. Model. Softw., 33, 23–34, https://doi.org/10.1016/j.envsoft.2012.01.019, 2012. a, b
Cheynet, E., Diezel, J. M., Haakenstad, H., Breivik, Ø., Peña, A., and Reuder, J.: Tall wind profile validation of ERA5, NORA3, and NEWA datasets using lidar observations, Wind Energ. Sci., 10, 733–754, https://doi.org/10.5194/wes-10-733-2025, 2025. a
Collins, E., Lebo, Z. J., Cox, R., Hammer, C., Brothers, M., Geerts, B., Capella, R., and McCorkle, S.: Forecasting High Wind Events in the HRRR Model over Wyoming and Colorado. Part I: Evaluation of Wind Speeds and Gusts, Weather Forecast., 39, 705–723, https://doi.org/10.1175/WAF-D-23-0036.1, 2024. a, b
Deppe, A. J., Gallus Jr., W. A., and Takle, E. S.: A WRF ensemble for improved wind speed forecasts at turbine height, Weather Forecast., 28, 212–228, https://doi.org/10.1175/WAF-D-11-00112.1, 2013. a
Dörenkämper, M., Olsen, B. T., Witha, B., Hahmann, A. N., Davis, N. N., Barcons, J., Ezber, Y., García-Bustamante, E., González-Rouco, J. F., Navarro, J., Sastre-Marugán, M., Sīle, T., Trei, W., Žagar, M., Badger, J., Gottschall, J., Sanz Rodrigo, J., and Mann, J.: The Making of the New European Wind Atlas – Part 2: Production and evaluation, Geosci. Model Dev., 13, 5079–5102, https://doi.org/10.5194/gmd-13-5079-2020, 2020. a
Dowell, D. C., Alexander, C. R., James, E. P., Weygandt, S. S., Benjamin, S. G., Manikin, G. S., Blake, B. T., Brown, J. M., Olson, J. B., Hu, M., Smirnova, T. G., Ladwig, T., Kenyon, J. S., Ahmadov, R., Turner, D. D., Duda, J. D., and Alcott, T. I.: The High-Resolution Rapid Refresh (HRRR): An Hourly Updating Convection-Allowing Forecast Model. Part I: Motivation and System Description, Weather Forecast., 37, 1371–1395, https://doi.org/10.1175/WAF-D-21-0151.1, 2022. a, b
Draxl, C., Clifton, A., Hodge, B.-M., and McCaa, J.: The Wind Integration National Dataset (WIND) Toolkit, Appl. Energ., 151, 355–366, https://doi.org/10.1016/j.apenergy.2015.03.121, 2015. a, b, c
Draxl, C., Wang, J., Sheridan, L., Jung, C., Bodini, N., Buckhold, S., Aghili, C., Peco, K., Kotamarthi, R., Kumler, A., Phillips, C., Purkayastha, A., Young, E., Rosenlieb, E., and Tinnesand, H.: WTK-LED: The WIND Toolkit Long-Term Ensemble Dataset, Tech. Rep. NREL/TP-5000-88457, National Renewable Energy Laboratory, https://doi.org/10.2172/2473210, 2024. a, b, c, d
Energy Systems Integration Group: Weather Dataset Needs for Planning and Analyzing Modern Power Systems (Full Report), Tech. rep., Energy Systems Integration Group, Reston, VA, a Report of the Weather Datasets Project Team, https://www.esig.energy/weather-data-for-power-system-planning (last access: 13 October 2026), 2023. a, b, c
Frehlich, R., Meillier, Y., Jensen, M. L., Balsley, B., and Sharman, R.: Measurements of Boundary Layer Profiles in an Urban Environment, J. Appl. Meteorol. Climatol., 45, 821–837, https://doi.org/10.1175/JAM2368.1, 2006. a
Gelaro, R., McCarty, W., Suárez, M. J., Todling, R., Molod, A., Takacs, L., Randles, C. A., Darmenov, A., Bosilovich, M. G., Reichle, R., Wargan, K., Coy, L., Cullather, R., Draper, C., Akella, S., Buchard, V., Conaty, A., da Silva, A. M., Gu, W., Kim, G.-K., Koster, R., Lucchesi, R., Merkova, D., Nielsen, J. E., Partyka, G., Pawson, S., Putman, W., Rienecker, M., Schubert, S. D., Sienkiewicz, M., and Zhao, B.: The Modern-Era Retrospective Analysis for Research and Applications, version 2 (MERRA-2), J. Climate, 30, 5419–5454, https://doi.org/10.1175/JCLI-D-16-0758.1, 2017. a
Hahmann, A. N., Sīle, T., Witha, B., Davis, N. N., Dörenkämper, M., Ezber, Y., García-Bustamante, E., González-Rouco, J. F., Navarro, J., Olsen, B. T., and Söderberg, S.: The making of the New European Wind Atlas – Part 1: Model sensitivity, Geosci. Model Dev., 13, 5053–5078, https://doi.org/10.5194/gmd-13-5053-2020, 2020. a
Hersbach, H., Bell, B., Berrisford, P., Hirahara, S., Horányi, A., Muñoz-Sabater, J., Nicolas, J., Peubey, C., Radu, R., Schepers, D., Simmons, A., Soci, C., Abdalla, S., Abellan, X., Balsamo, G., Bechtold, P., Biavati, G., Bidlot, J., Bonavita, M., De Chiara, G., Dahlgren, P., Dee, D., Diamantakis, M., Dragani, R., Flemming, J., Forbes, R., Fuentes, M., Geer, A., Haimberger, L., Healy, S., Hogan, R. J., Hólm, E., Janisková, M., Keeley, S., Laloyaux, P., Lopez, P., Lupu, C., Radnoti, G., de Rosnay, P., Rozum, I., Vamborg, F., Villaume, S., and Thépaut, J.-N.: The ERA5 global reanalysis, Q. J. Roy. Meteor. Soc., 146, 1999–2049, https://doi.org/10.1002/qj.3803, 2020. a, b, c
James, E. P., Benjamin, S. G., and Marquis, M.: A unified high-resolution wind and solar dataset from a rapidly updating numerical weather prediction model, Renew. Energ., 102, 390–405, https://doi.org/10.1016/j.renene.2016.10.059, 2017. a, b
James, E. P., Benjamin, S. G., and Marquis, M.: Offshore wind speed estimates from a high-resolution rapidly updating numerical weather prediction model forecast dataset, Wind Energy, 21, 264–284, https://doi.org/10.1002/we.2161, 2018. a
James, E. P., Alexander, C. R., Dowell, D. C., Weygandt, S. S., Benjamin, S. G., Manikin, G. S., Brown, J. M., Olson, J. B., Hu, M., Smirnova, T. G., Ladwig, T., Kenyon, J. S., and Turner, D. D.: The High-Resolution Rapid Refresh (HRRR): An Hourly Updating Convection-Allowing Forecast Model. Part II: Forecast Performance, Weather Forecast., 37, 1397–1417, https://doi.org/10.1175/WAF-D-21-0130.1, 2022. a, b
Liu, Y., Feng, S., Berg, L. K., Wharton, S., Arthur, R., Turner, D. D., and Fast, J. D.: Benchmarking near surface winds in the HRRR analyses using multi-source observations over complex terrain in the southeastern United States, J. Appl. Meteorol. Climatol., 64, 1307–1322, https://doi.org/10.1175/JAMC-D-24-0163.1, 2025. a, b
Lupu, N., Selios, L., and Warner, Z.: A new measure of congruence: The Earth Mover's Distance, Polit. Anal., 25, 95–113, https://doi.org/10.1017/pan.2017.2, 2017. a
Maraun, D.: Bias Correcting Climate Change Simulations – A Critical Review, Current Climate Change Reports, 2, 211–220, https://doi.org/10.1007/s40641-016-0050-x, 2016. a
Millstein, D., Jeong, S., Ancell, A., and Wiser, R.: A database of hourly wind speed and modeled generation for US wind plants based on three meteorological models, Sci. Data, 10, 883, https://doi.org/10.1038/s41597-023-02804-w, 2023. a
Murcia, J. P., Koivisto, M. J., Luzia, G., Olsen, B. T., Hahmann, A. N., Sørensen, P. E., and Als, M.: Validation of European-scale simulated wind speed and wind generation time series, Appl. Energ., 305, 117794, https://doi.org/10.1016/j.apenergy.2021.117794, 2022. a
National Laboratory of the Rockies: Wind Resource Database (WRDB), https://wrdb.nlr.gov (last access: 13 October 2026), 2024. a
Olson, J. B., Kenyon, J. S., Djalalova, I., Bianco, L., Turner, D. D., Pichugina, Y., Choukulkar, A., Toy, M. D., Brown, J. M., Angevine, W. M., Akish, E., Bao, J.-W., Jimenez, P., Kosovic, B., Lundquist, K. A., Draxl, C., Lundquist, J. K., McCaa, J., McCaffrey, K., Lantz, K., Long, C., Wilczak, J., Banta, R., Marquis, M., Redfern, S., Berg, L. K., Shaw, W., and Cline, J.: Improving wind energy forecasting through numerical weather prediction model development, B. Am. Meteorol. Soc., 100, 2201–2220, 2019. a, b
Optis, M., Bodini, N., Debnath, M., and Doubrawa, P.: Best Practices for the Validation of U.S. Offshore Wind Resource Models, Tech. rep., National Renewable Energy Laboratory, Golden, CO (United States), https://doi.org/10.2172/1755697, 2020a. a
Optis, M., Kumler, A., Scott, G., Debnath, M., and Moriarty, P.: Validation of RU-WRF, the Custom Atmospheric Mesoscale Model of the Rutgers Center for Ocean Observing Leadership, Tech. Rep. NREL/TP-5000-75209, National Renewable Energy Laboratory, https://www.nlr.gov/docs/fy20osti/75209.pdf (last access: 13 October 2026), 2020b. a
Peco, K., Wang, J., Jung, C., Sever, G., Sheridan, L., Feinstein, J., Kotamarthi, R., Draxl, C., Young, E., Purkayastha, A., and Kumler, A.: Evaluation of a high-resolution regional climate simulation for surface and hub-height wind climatology over North America, Wind Energ. Sci., 11, 13–35, https://doi.org/10.5194/wes-11-13-2026, 2026. a
Pichugina, Y. L., Banta, R. M., Bonin, T., Brewer, W. A., Choukulkar, A., McCarty, B. J., Baidar, S., Draxl, C., Fernando, H. J. S., Kenyon, J., Krishnamurthy, R., Marquis, M., Olson, J., Sharp, J., and Stoelinga, M.: Spatial Variability of Winds and HRRR–NCEP Model Error Statistics at Three Doppler-Lidar Sites in the Wind-Energy Generation Region of the Columbia River Basin, J. Appl. Meteorol. Climatol., 58, 1633–1656, https://doi.org/10.1175/JAMC-D-18-0244.1, 2019. a, b
Pronk, V., Bodini, N., Optis, M., Lundquist, J. K., Moriarty, P., Draxl, C., Purkayastha, A., and Young, E.: Can reanalysis products outperform mesoscale numerical weather prediction models in modeling the wind resource in simple terrain?, Wind Energ. Sci., 7, 487–504, https://doi.org/10.5194/wes-7-487-2022, 2022. a, b
Ramon, J., Lledó, L., Pérez-Zanón, N., Soret, A., and Doblas-Reyes, F. J.: The Tall Tower Dataset: a unique initiative to boost wind energy research, Earth Syst. Sci. Data, 12, 429–439, https://doi.org/10.5194/essd-12-429-2020, 2020. a, b
Sengupta, M., Xie, Y., Lopez, A., Habte, A., Maclaurin, G., and Shelby, J.: The National Solar Radiation Data Base (NSRDB), Renewable and Sustainable Energy Reviews, 89, 51–60, https://doi.org/10.1016/j.rser.2018.03.003, 2018. a
Sheridan, L. M., Duplyakin, D., Phillips, C., Tinnesand, H., Rai, R. K., Flaherty, J. E., and Berg, L. K.: Evaluating the potential of short-term instrument deployment to improve distributed wind resource assessment, Wind Energ. Sci., 10, 1451–1470, https://doi.org/10.5194/wes-10-1451-2025, 2025a. a
Sheridan, L. M., Wang, J., Draxl, C., Bodini, N., Phillips, C., Duplyakin, D., Tinnesand, H., Rai, R. K., Flaherty, J. E., Berg, L. K., Jung, C., Young, E., and Kotamarthi, R.: Performance of wind assessment datasets in United States coastal areas, Wind Energ. Sci., 10, 1551–1574, https://doi.org/10.5194/wes-10-1551-2025, 2025b. a
Sheridan, L. M., Krishnamurthy, R., Nguyen, T. M., Chen, Y.-L., Gustafson Jr., W. I., Liu, Y., Hsiao, F., Newsom, R. K., Spicer, P., Kassianov, E., Pekour, M., Bodini, N., and Severy, M.: Performance of reanalysis and mesoscale models off the coast of Hawai'i, Wind Energ. Sci., 11, 2257–2285, https://doi.org/10.5194/wes-11-2257-2026, 2026. a
Skamarock, W. C.: Evaluating Mesoscale NWP Models Using Kinetic Energy Spectra, Mon. Weather Rev., 132, 3019–3032, https://doi.org/10.1175/MWR2830.1, 2004. a
U.S. Energy Information Administration: Annual Energy Outlook 2023, Tech. rep., U.S. Energy Information Administration, https://www.eia.gov/outlooks/aeo/pdf/AEO2023_Narrative.pdf (last access: 13 October 2026), 2023. a
Vibrant Clean Energy: Vibrant Clean Energy Resource Adequacy Renewable Energy (RARE) Power Dataset (Version 1.0.0), Zenodo [data set], https://doi.org/10.5281/zenodo.13937522, 2024. a
Wilczak, J. M., Akish, E., Capotondi, A., and Compo, G. P.: Evaluation and Bias Correction of the ERA5 Reanalysis over the United States for Wind and Solar Energy Applications, Energies, 17, 1667, https://doi.org/10.3390/en17071667, 2024. a, b, c
Yin, Y. and Peña, M.: Analysis of bias correction of HRRR model outputs for offshore wind power ramp events, Renew. Energ., 228, 120581, https://doi.org/10.1016/j.renene.2024.120581, 2024. a, b
- Abstract
- Copyright statement
- Introduction
- Modeled datasets
- Inter-comparison of modeled datasets
- Data and methods for model validation
- Results of model validation
- Discussion and conclusions
- Appendix A: Technical specifications of modeled datasets
- Appendix B: Analysis of representativeness of WIND Toolkit period for bias correction
- Appendix C: Comparison between BC-HRRR and the WIND Toolkit
- Data availability
- Author contributions
- Competing interests
- Disclaimer
- Acknowledgements
- Review statement
- References
- Abstract
- Copyright statement
- Introduction
- Modeled datasets
- Inter-comparison of modeled datasets
- Data and methods for model validation
- Results of model validation
- Discussion and conclusions
- Appendix A: Technical specifications of modeled datasets
- Appendix B: Analysis of representativeness of WIND Toolkit period for bias correction
- Appendix C: Comparison between BC-HRRR and the WIND Toolkit
- Data availability
- Author contributions
- Competing interests
- Disclaimer
- Acknowledgements
- Review statement
- References