
the Creative Commons Attribution 4.0 License.
the Creative Commons Attribution 4.0 License.
 | 23 Oct 2026
A real-time IoT, LLM, AI-supported wind turbine failure prediction system
İlhan Gamze Saygı

Sara Mahyanbakhshayesh
Berdan Ak
Mehmet Hilal Özcanhan
Mehmet Süleyman Ünlütürk
Wind and solar energy are two popular alternative energy sources. However, wind turbines are larger and more complex than solar panels. Accordingly, wind turbines are more exposed to environmental factors and therefore more prone to mechanical failures. Our work improves the reliability and efficiency of wind energy systems by presenting an artificial intelligence (AI)-based system that predicts mechanical gearbox and electrical failures. Historical data are aggregated with real-time sensor data to train the prediction model. Apart from related mechanical and environmental data, sensors provide real-time vibration, internal nacelle temperature, wind speed, and noise and smoke levels. The developed system integrates AI and large language model (LLM)-based interfaces for real-time interactive monitoring of turbines. The user interface of the developed system allows users to receive informative responses on performance, detected risks, predicted failures, and energy production levels. The developed model has been validated using 5-fold cross-validation based on accuracy, precision, recall, F1 score, and ROC-AUC. The model achieves approximately 89.68 % accuracy, 90.08 % F1 score, 95.65 % ROC-AUC, and novel metric 65.13 % overall performance. The performance results demonstrate the promising potential of AI- and LLM-integrated systems for wind energy applications. Prototype data, labeled via the XGBoost model trained with SCADA data, was retrained using the LightGBM algorithm, achieving 98.37 % accuracy, 99.16 % F1 score, 98.95 % ROC-AUC and 94.65 % overall performance; the analysis indicated that the inclusion of the newly added gas and sound sensors improved the predictive performance of the student model on the pseudo-labeled prototype dataset.
- Article
(10546 KB) - Full-text XML
- BibTeX
- EndNote


1.1 Background
Maintaining the reliability of wind turbines is a significant engineering challenge due to their constant exposure to harsh environmental conditions. Since traditional reactive and periodic maintenance methods are costly and operationally inefficient, artificial intelligence (AI) and machine learning (ML)-based predictive maintenance has emerged as a crucial solution. By analyzing real-time sensor data, these systems can detect early failure patterns in critical components, such as gearboxes and electrical systems, preventing costly downtime.
Supporting this transition, research demonstrates that combining physical thermal models with ML significantly improves fault prediction and explainability (Corley et al., 2021; Khan et al., 2023). For instance, large-scale analyses using decision tree methods on bearing and lubricant temperatures have achieved approximately 92 % accuracy (Hsu et al., 2020).
Furthermore, integrating large language models (LLMs) has transformed traditional static monitoring dashboards into interactive AI systems. Recent models, such as Generative Pre-trained Transformer (GPT)-4 and DeepSeek-V3, have demonstrated strong performance in generating structured classification workflows and synthetic datasets for fault diagnosis (Tan and Carroll, 2025; Zhang et al., 2025). By allowing operators to query complex data in natural language, these multi-modal frameworks significantly enhance the scalability, predictive accuracy, and overall intelligence of modern energy monitoring systems.
1.2 Problem statement
Wind turbines routinely face unexpected mechanical and electrical failures that disrupt production and drive maintenance costs upward. Existing supervisory control and data acquisition (SCADA)-based threshold methods offer limited diagnostic capability because they are unable to interpret complex correlations across heterogeneous sensor inputs. Consequently, modern predictive maintenance systems must incorporate AI-based analytics, Internet of Things (IoT) connectivity, and transparent explainability tools to achieve reliable and early fault prediction. Consequently, AI-driven, IoT-supported, and explainable predictive maintenance systems are required instead of reactive monitoring approaches.
The remainder of this study is organized as follows. Section 2 reviews the related literature and establishes our contributions relative to the state of the art. Section 3 details the materials, data preprocessing pipelines, and the system architecture of the Smart Wind Turbine Failure Prediction System (SWTFPS). Section 4 describes the interactive LLM-based user interface and communication integration components. Section 5 presents the experimental results and a comparative model performance analysis. Section 6 provides a comprehensive discussion of the findings and outlines system limitations, followed by Sect. 7, which concludes the study and suggests directions for future work.
To ensure a cohesive and deeply developed scientific narrative, this study is systematically structured around two primary interconnected core contributions rather than disconnected engineering steps: first, a multi-modal real-time predictive engine was established that bridges large-scale historical industrial SCADA datasets with live hardware-level IoT telemetry. It is demonstrated how the predictive precision of wind turbine failure diagnostics is dramatically improved by transferring machine learning decision boundaries from industrial scales to a localized physical prototype and enriching this pipeline with newly introduced gas and acoustic sensors. Second, a live conversational decision-support framework is introduced that integrates this predictive engine with an interactive domain-grounded large language model (LLM). This system successfully translates complex high-frequency multi-modal sensor states into explainable, actionable natural language recommendations for operators. Every subsequent section of this article directly supports these two pillars: Sects. 3 and 5 focus on the mathematical validation, feature selection, and transfer accuracy of the predictive engine, while Sects. 4 and 6 detail the integration, real-time communication protocols, and interactive utility of the explainable conversational interface.
Another study by Zhang et al. (2023) proposed a convolutional network, a multi-scale temporal convolutional network to balance the data, achieving 93.4 % accuracy. Amin et al. (2022) combined cyclostationary analysis with a convolutional neural network (CNN) to detect gearbox faults using generated data, achieving 89 % accuracy even under variable wind conditions. In another study, a SCADA-based system was developed. Using neural networks for temperature anomaly detection in gearboxes and generators, failures were predicted up to 17 h in advance with high accuracy (Alzawaideh et al., 2021). A prior study evaluated 16 supervised models on SCADA data, identifying random forest (RF) and extra trees (ET) as the best performers for detecting faults 24 h in advance (de Lima Munguba et al., 2024). Inturi et al. (2021) applied multi-level data fusion of vibration, acoustic, and oil sensors with system, achieving 92 % accuracy in gearbox fault classification. Meyer (2022) developed a fully automated CNN approach using vibration spectrograms, achieving 100 % accuracy for laboratory data without manual feature engineering. Ogaili et al. (2024) used an eXtreme Gradient Boosting (XGBoost) classifier to detect blade faults, such as erosion and twisting, with 99.4 % accuracy. Pham and Han (2025) designed a Bi-LSTM (bidirectional long short-term memory) model with an attention mechanism, achieving 99.40 % accuracy and providing 62 h early warnings. Puruncajas et al. (2025) developed a normal behavior model using SCADA temperature data, detecting gearbox anomalies 9 months before failure. Santiago et al. (2024) reviewed deep learning models for predictive maintenance, highlighting a research gap in their application to direct-drive and synchronous generators systems. Yu et al. (2021) proposed a convolutional network using wavelet packet coefficients, achieving over 99 % accuracy in noisy environments. Zeng et al. (2023) introduced an estimation model to establish dynamic thresholds for anomaly detection, outperforming standard alarm systems. Zhang et al. (2023) combined CNN and (long short-term memory) LSTM to predict bearing temperatures from SCADA data, detecting anomalies earlier than single-model approaches. Finally, Zhang and Wang (2014) used an artificial neural network (ANN) with backpropagation on SCADA data to predict bearing temperatures, issuing warnings 3 months in advance without additional sensors.
The existing literature extensively utilizes SCADA data and various deep learning architectures (CNNs, LSTMs, transformers) for vibration analysis. However, significant gaps remain in integrating user interaction and failure prediction within a single system, because most studies rely on single-source data and present results through static dashboards rather than interactive interfaces. While pioneering studies have recently explored the utility of large language models (LLMs) in wind energy systems (for instance, Tan and Carroll (2025) leverage LLMs to optimize gearbox failure prediction, and Zhang et al. (2025) propose multi-modal training frameworks for fault diagnosis), their applications are primarily restricted to offline environments, static datasets, or synthetic data generation. A major research gap persists in physically bridging live multi-modal sensor telemetry with conversational interfaces for real-time, closed-loop operations. To address this, our SWTFPS introduces complete end-to-end operational integration. Unlike prior frameworks that rely on static database queries or offline diagnostic workflows, our system directly couples a physical wind turbine prototype's multi-modal IoT sensor network with cloud-hosted databases, automated high-performance ML classifiers (XGBoost/LightGBM), and an interactive LLM-based assistant. Thus, our core novelty lies in the real-time, synchronized execution of physical edge telemetry, immediate predictive diagnostic modeling, and conversational reasoning within a single unified monitoring platform. To address these gaps, this study delivers three key scientific and technical contributions.
-
Multi-modal feature enrichment and domain adaptation strategy. We introduce a systematic framework to bridge historical industrial-scale SCADA telemetry with localized IoT prototype data. We demonstrate that transferring predictive boundaries from a SCADA-trained model to a localized prototype, while enriching the model input space with previously unexploited localized sensors (acoustic and gas), systematically refines fault prediction capabilities under highly imbalanced operating conditions.
-
Domain-grounded conversational decision support. We established a novel integration of real-time machine learning predictive engines with an interactive natural language large language model (LLM) interface. This advances traditional static dashboards by transforming high-frequency multi-modal sensor inputs and failure probabilities into explainable, context-aware, and actionable maintenance recommendations for operators.
-
Rigorous empirical benchmarking and evaluation metric. We conduct a comprehensive performance evaluation of 11 diverse machine learning algorithms. Furthermore, we propose and validate a novel overall performance (OP) metric that integrates both positive predictive strengths and uncertainty/error penalties (such as LogLoss and Brier error), providing a highly balanced evaluation framework for predictive maintenance systems operating on imbalanced datasets.
The methodological framework of SWTFPS is built upon three phases: (1) the construction of hardware infrastructure equipped with multi-modal sensors for real-time data acquisition, (2) the development and evaluation of machine learning models to detect mechanical and electrical anomalies, and (3) the integration of a large language model (LLM) interface to facilitate interactive decision support and data visualization.
3.1 Materials: custom-made small wind turbine prototype
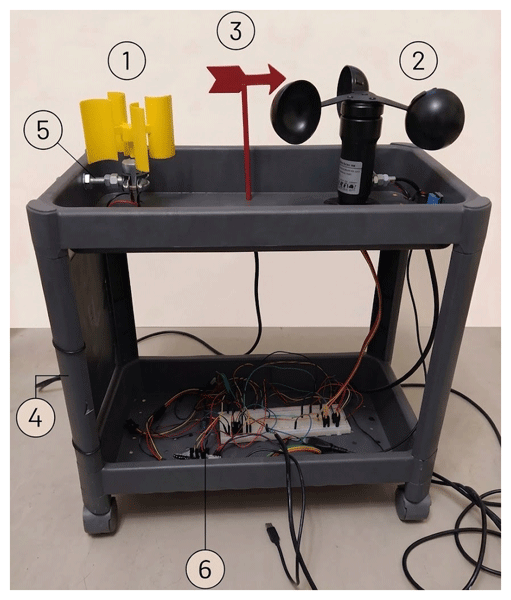
A prototype has been designed and constructed to add newly available sensor data to traditional SCADA data. The prototype shown in Fig. 1 consists of six main components.
-
The primary mechanical vertical axis wind turbine (VAWT) captures wind energy.
-
An anemometer measures real-time wind speed.
-
A wind vane monitors wind direction.
-
The structural frame chassis supports the turbine and electronic components.
-
A DC generator converts mechanical rotation into electrical energy.
-
The control circuitry houses the Espressif ESP32 microcontrollers and sensors. Dual ESP32 units operate within a network environment with a minimum bandwidth of 10 Mbps and a latency below 50 ms.
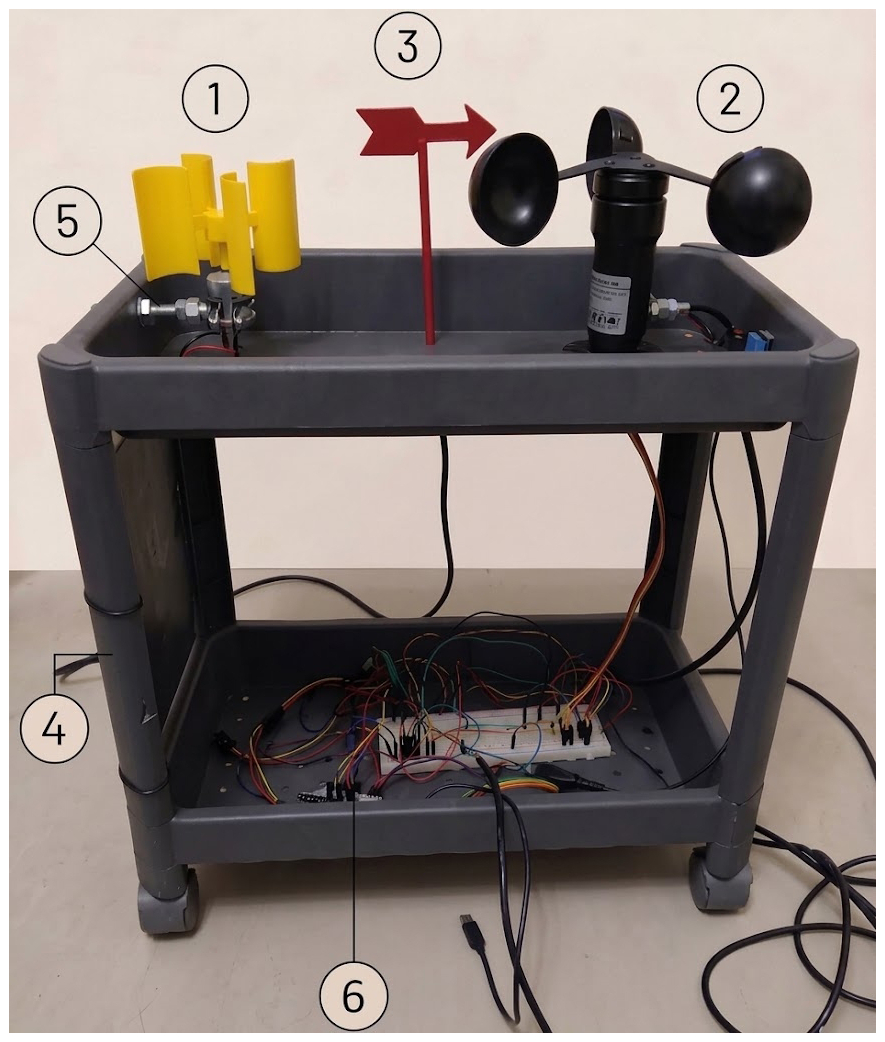
Two ESP32 microcontrollers are utilized to manage multiple real-time sensor inputs. All collected data are stored with timestamps. The circuit diagram for sensor integration is shown in Fig. 2. Three DHT11 modules track temperature and humidity gradients across different sections of the system, while gas and sound sensors monitor atmospheric quality and acoustic emissions. A piezoelectric sensor is used to detect structural vibrations. A line detect sensor is used to measure the blade speed to ensure synchronization with wind speed. An INA219 power-monitoring module is integrated to capture precise current and voltage data from the turbine's output.
3.2 Materials: data from the prototype
3.2.1 Prototype dataset and descriptive statistics
By carefully mapping the physical components, a real-world industrial wind turbine was modeled at a laboratory scale. The prototype utilizes an array of sensors to capture critical environmental and mechanical variables and preserves data structures for ensuring operational fidelity. Our physical model bridges the gap between theoretical SCADA datasets and live IoT data. Detailed descriptive statistics regarding the collected 2453 instance data from the prototype are presented in Table 1.
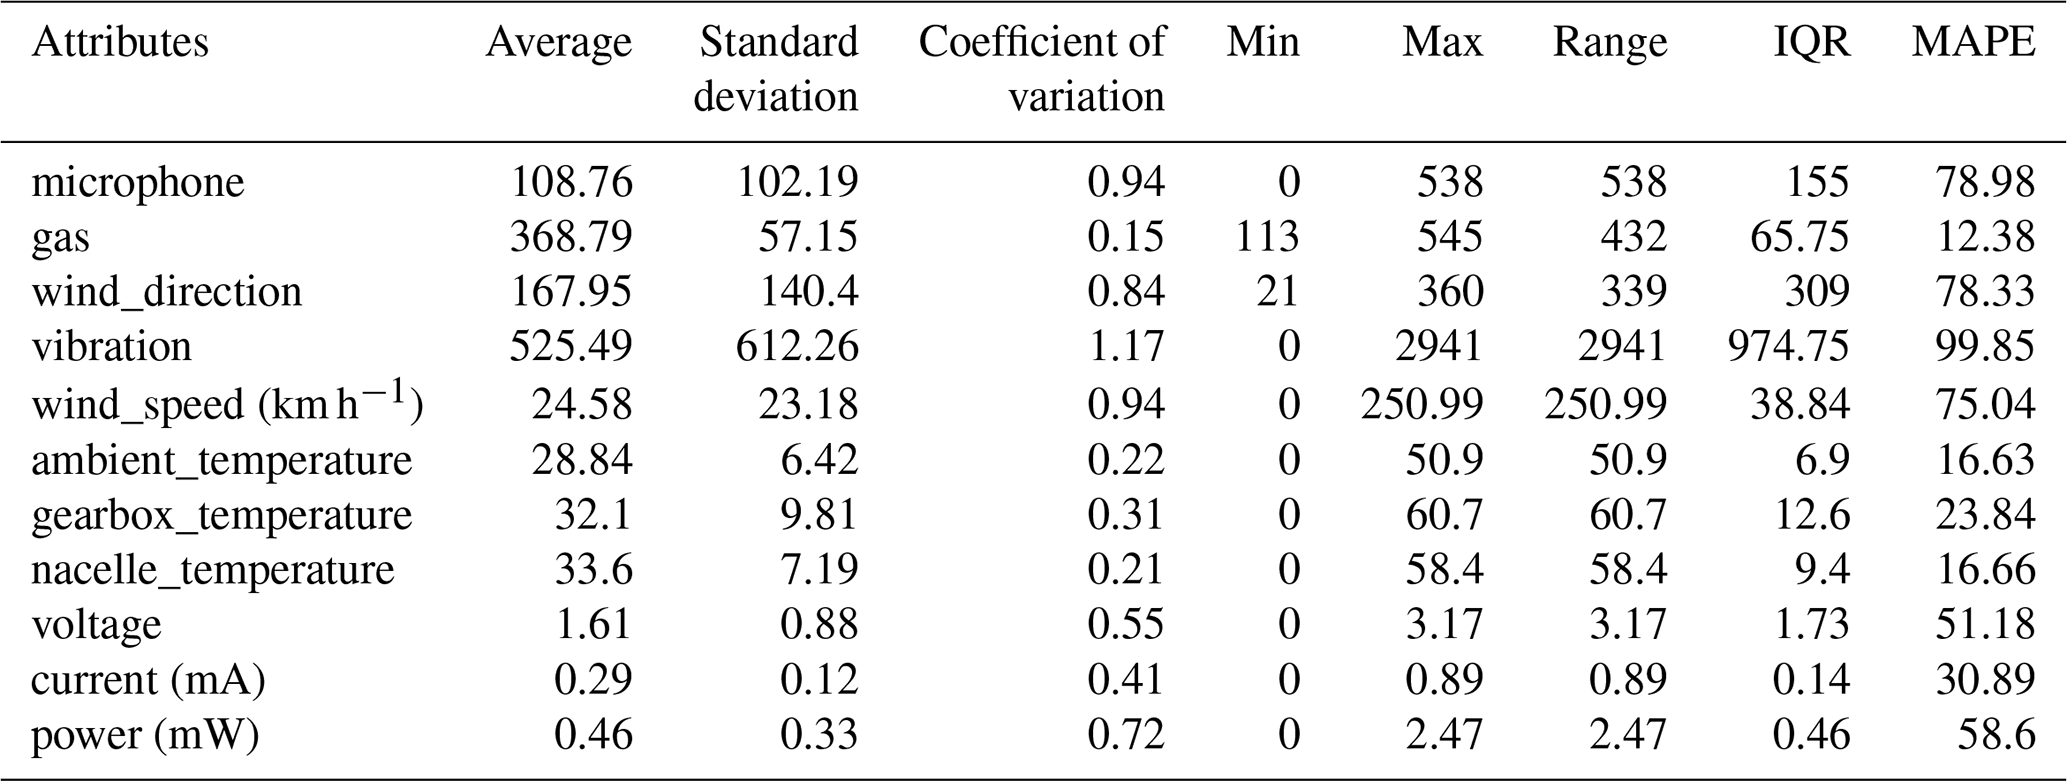
All wind speed values in Table 1 are recorded in kilometers per hour (km h−1); the average operational wind speed of 24.58 km h−1 corresponds to approximately 6.83 m s−1, which falls within standard wind turbine site averages.
The data collected from the prototype have been pre-processed. Principal component analysis (PCA) was used to visualize the data. To detect outliers, the 1.5 × IQR (interquartile range) rule, rolling window analysis, K means clustering, and density-based spatial clustering of applications with noise (DBSCAN) were applied as in Fig. 3. A min–max scaler was used for normalization and feature scaling. Multi-class categorical features were mapped to numerical values. Non-predictive columns with zero standard deviation were removed. Features and target labels were prepared for machine learning. The dataset was initially divided into two subsets: 80 % for model development and 20 % as a hold-out test set for final evaluation. To reduce overfitting, the development subset was further evaluated using 5-fold cross-validation, where each fold consisted of 80 % training data and 20 % validation data. Time window sliding was employed to identify and filter statistical outliers within localized temporal segments, removing extreme values while preserving the overall trend of the turbine's operational signals. The imbalanced dataset was handled through data-level methods. To prevent data leakage, the dataset was split chronologically. A novel K means undersampling approach was then applied exclusively to the training set, balancing the classes by reducing “Normal” instances to representative centroids matching the “Failure” count.
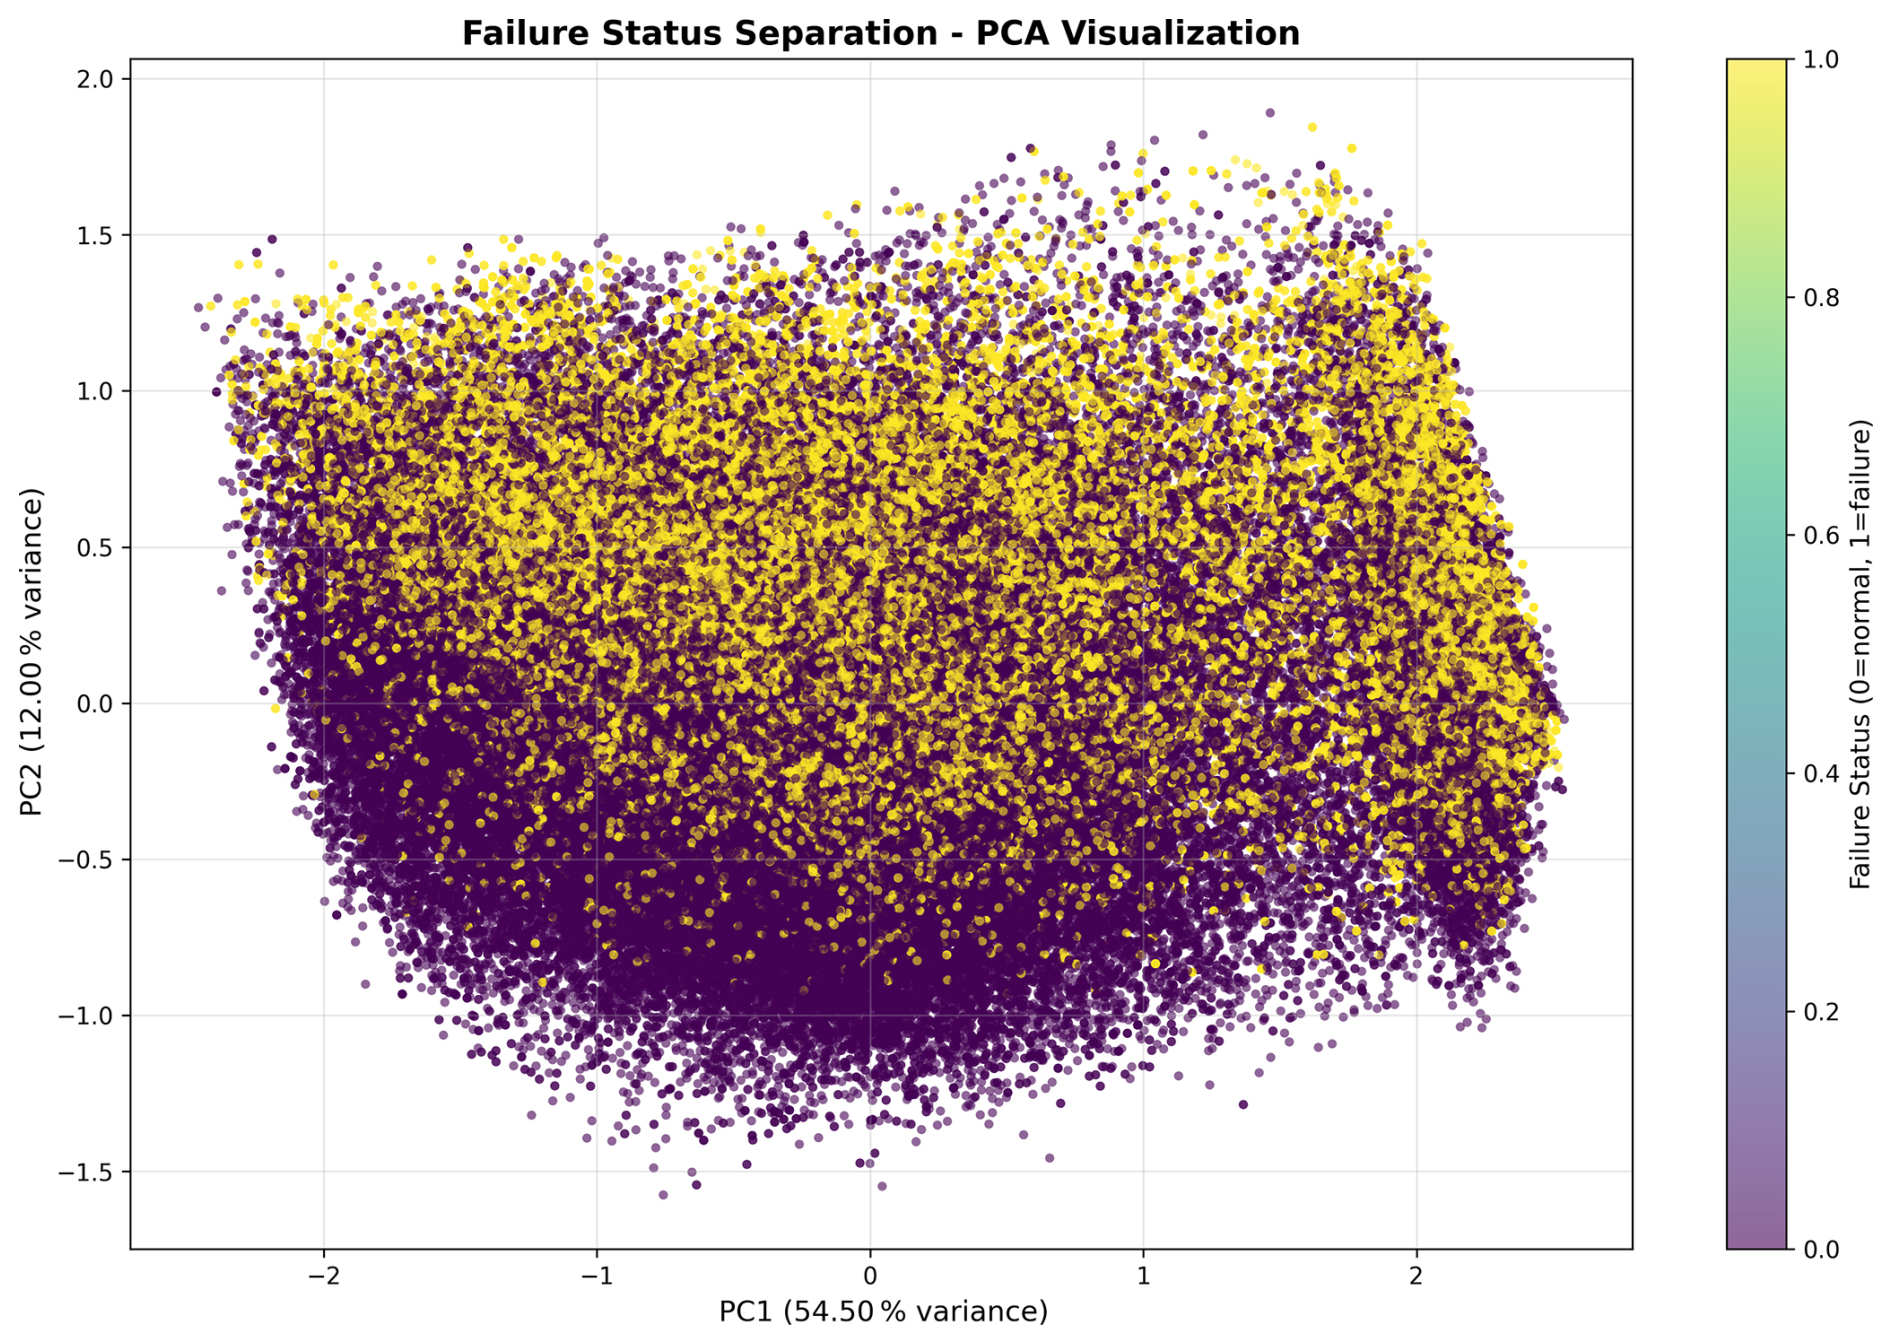
The pre-processing pipeline ensured that the data were suitable for various machine learning algorithms, while mitigating issues such as skewness, imbalance, or feature misrepresentation.
To systematically manage the high temporal density and exceptional volume of the raw telemetry streams, a temporal aggregation preprocessing pipeline was established. Raw high-frequency signals were grouped and averaged over specified temporal windows to filter out transient sensor noise and capture robust steady-state operational trends. This step was crucial to ensure a lightweight data footprint compatible with the real-time constraints of low-power ESP32 microcontrollers and our 15 s IoT transmission cycle. However, this window-based averaging process inevitably collapses the fine-grained, continuous chronological step-by-step sequences, resulting in the loss of continuous sequential timestamp dependencies. Consequently, sequential multivariate time series models (such as long short-term memory (LSTM) or gated recurrent units (GRU)), which strictly require unbroken chronologically ordered temporal matrices, were mathematically unsuitable for this preprocessed dataset. The predictive maintenance objective was thus formulated as a highly optimized non-sequential classification problem over the aggregated tabular feature space.
To rigorously evaluate the transferability and diagnostic robustness of the proposed teacher–student paradigm under real-world conditions, a separate, independent testing dataset was compiled from the physical prototype. Unlike the primary dataset which utilizes high-confidence teacher-generated pseudo-labels for training, this independent testing set was manually labeled to establish an absolute physical ground-truth benchmark. The manual labeling process was executed by directly cross-referencing our precise physical experiment logs, which meticulously recorded the exact timestamps of every physical failure injection (such as blade imbalances, mechanical gear friction, and electrical short-circuits) on the prototype turbine. This independent, ground-truth-verified dataset serves as an unseen testing environment to evaluate both the SCADA-only teacher model and the multi-sensor student model under identical physical operational anomalies.
3.2.2 Prototype data labeling methodology
Given the practical and safety constraints of inducing catastrophic physical failures on the hardware prototype, obtaining direct experimental ground-truth labels was unfeasible. To address this, a model-driven pseudo-labeling approach has been adapted which serves as a pragmatic domain adaptation strategy. The optimal XGBoost classifier, pre-trained on labeled industrial SCADA data (Kasimov, 2024), was utilized as a “teacher” model to annotate the unlabeled prototype telemetry based on shared physical indicators (such as temperatures, wind speed, and voltage). Although this semi-supervised label propagation does not substitute for physical destructive testing, it establishes a mathematically structured baseline. This allows us to systematically analyze how the inclusion of previously unavailable localized sensors (gas and noise) modifies the feature space and improves the predictive capability of the “student” LightGBM model.
To label the raw prototype dataset in the absence of physical failure logs, a two-stage transfer learning (teacher–student) workflow has been implemented. This framework leverages the predictive rules learned from the large-scale, historical SCADA dataset to annotate the real-time prototype stream.
-
Stage 1 (teacher-driven annotation). The optimized SCADA-trained XGBoost model was utilized as a “teacher” model. Crucially, because this model was not trained on the prototype's unique sensors (gas, acoustic/microphone, and piezoelectric vibration), the annotation was performed using only the overlapping features present in both datasets (ambient temperature, wind speed, wind direction, nacelle temperature, gearbox temperature, and voltage). The new sensor inputs were masked during this phase to prevent input mismatch or data leakage.
-
Stage 2 (student-model retraining). Once the binary status labels (Normal vs. Failure) were generated, a separate LightGBM model was trained as a student model. Unlike the teacher, this model was trained on the full prototype feature set, including the newly introduced acoustic, gas, and vibration variables. This sequential design allowed the student model to mathematically map the correlations between these novel IoT sensor inputs and the predicted operational states, showing that the added physical dimensions significantly enhance failure prediction accuracy.
3.3 SCADA dataset pre-processing
The specific dataset utilized is the large-scale “Wind Turbine SCADA Data for Early Fault Detection”. A detailed description of the data, engineering units, and sensor types is available in Kasimov (2024). The dataset covers 89 cumulative years of operational data derived from 36 industrial-scale wind turbines across three geographically distinct wind farms, as summarized in Table 2. The SCADA dataset initially had a significant imbalance, with 87.2 % “Normal” operations and only 12.8 % as “Failure” events. A balancing procedure was implemented.
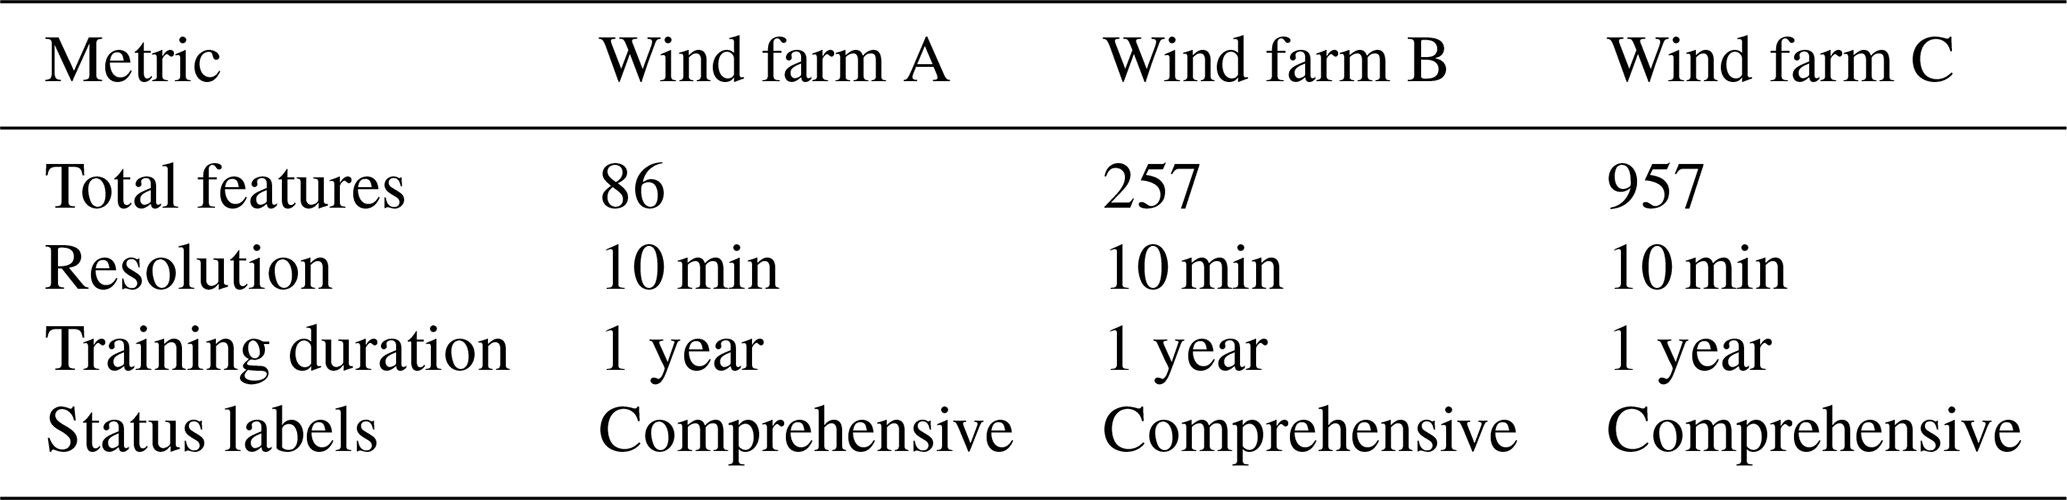
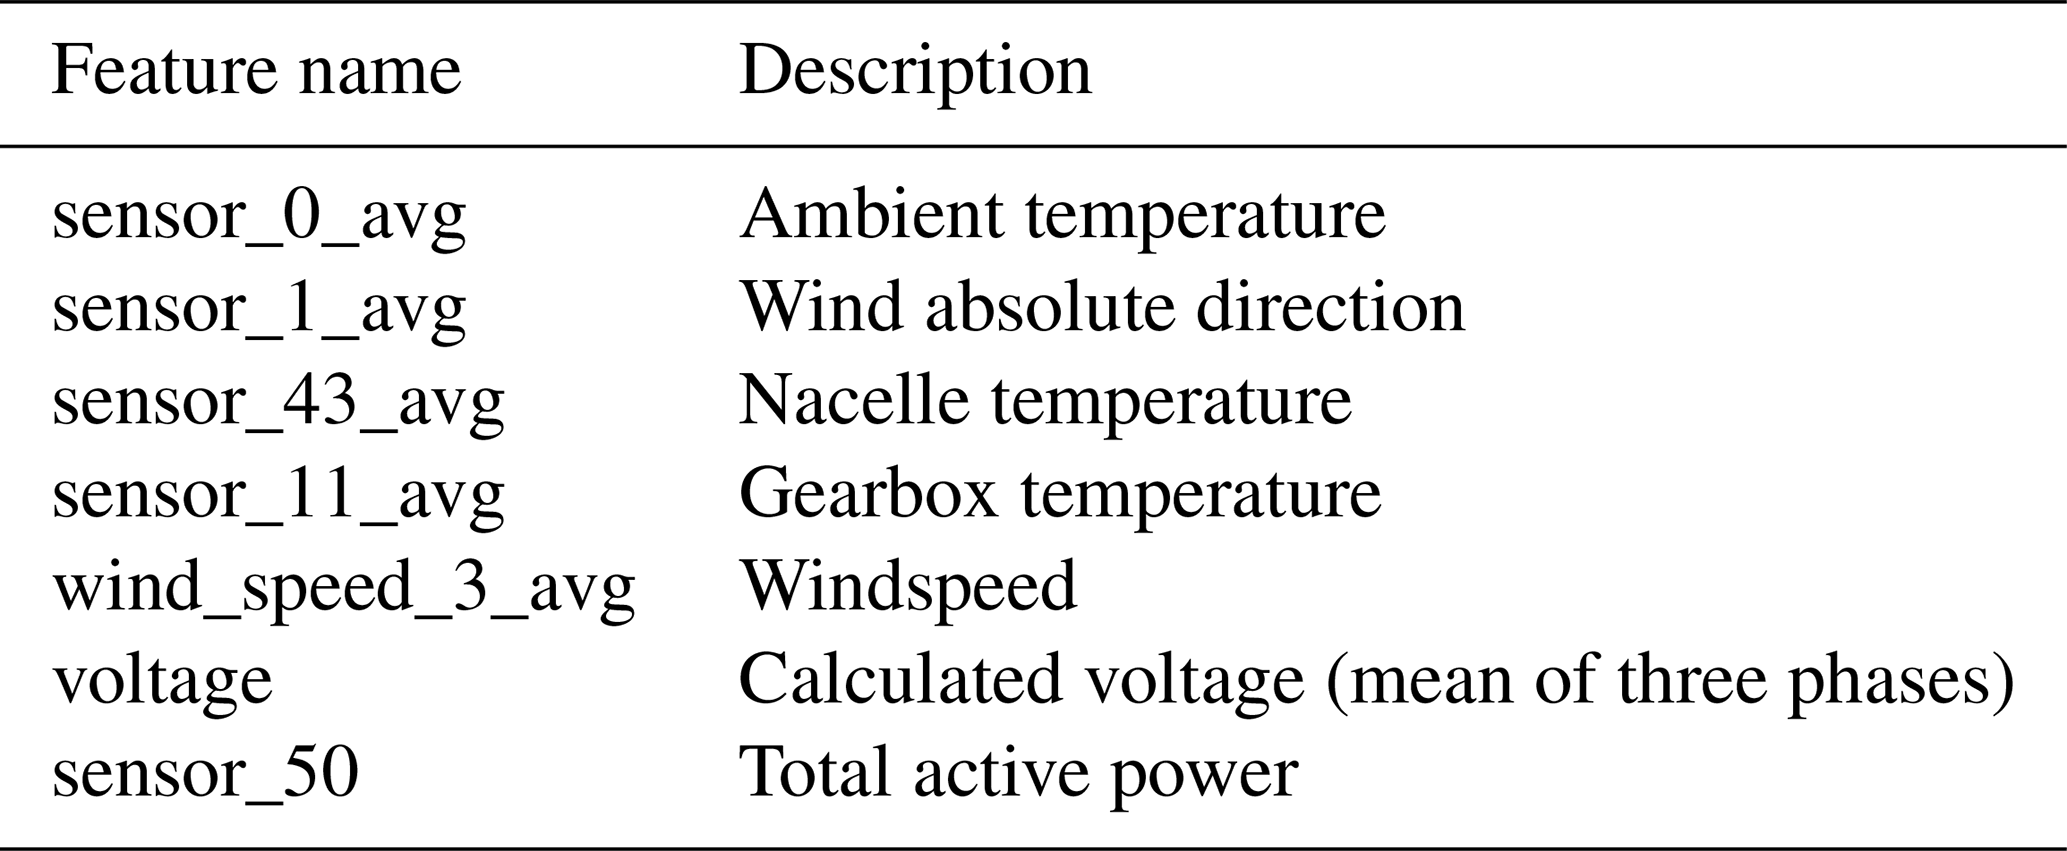
To simplify high-dimensional SCADA data, a feature-extraction process was implemented to capture the industrial three-phase alternating current (AC) power characteristics. The three separate voltage readings from the original dataset (sensor_32_avg, sensor_33_avg, and sensor_34_avg) were combined into a single “calculated voltage” feature by averaging them. The final SCADA feature set is shown in Table 3.
3.4 Methods: our SWTFPS architecture
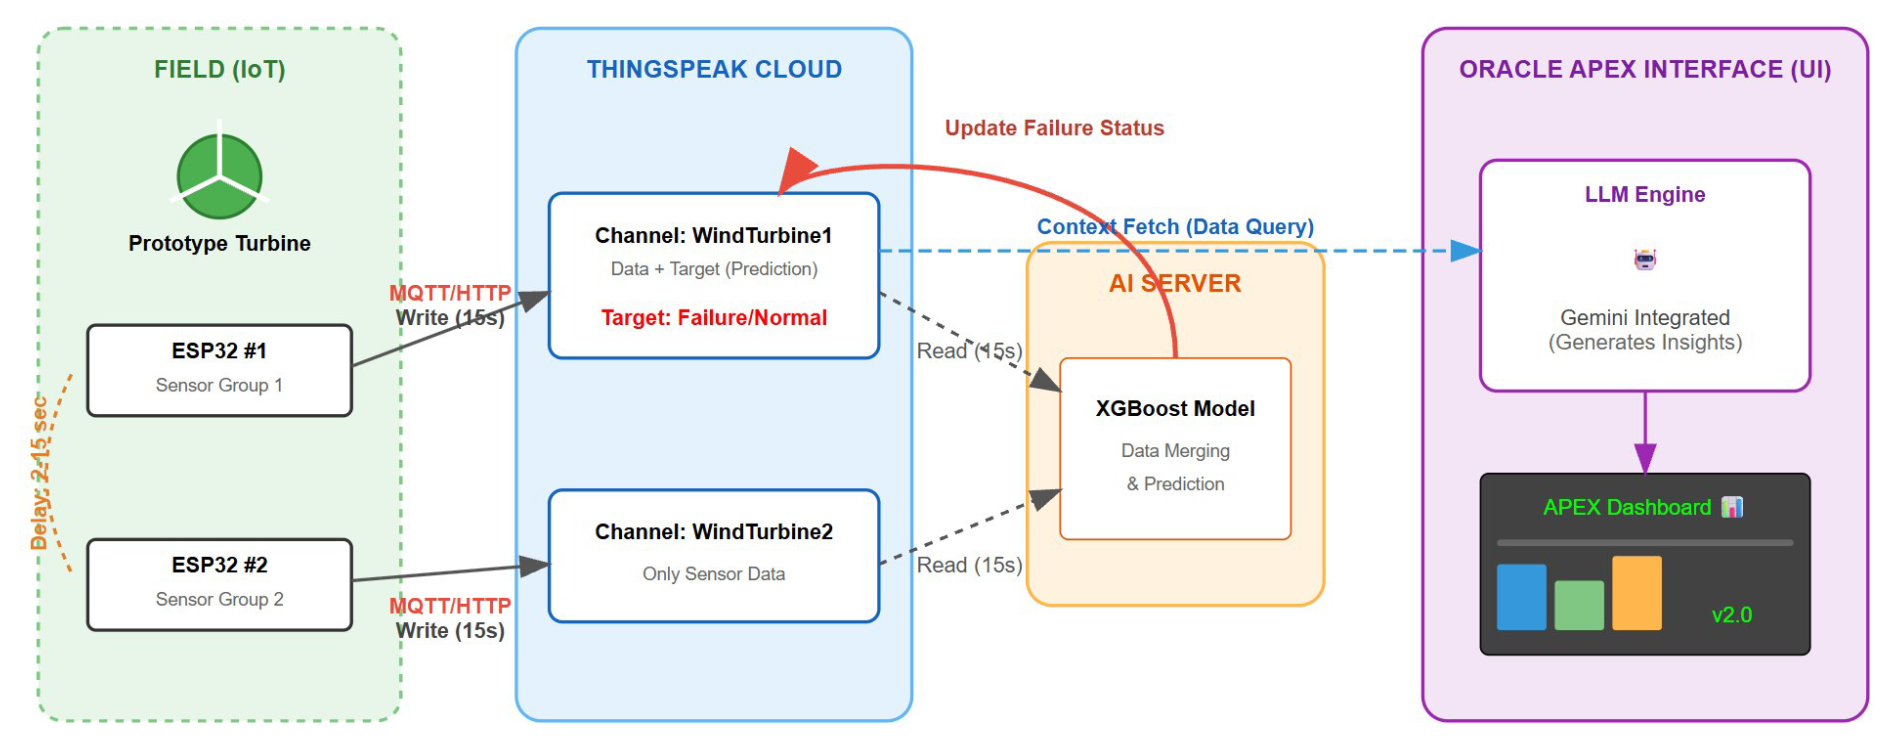
The proposed system is a multi-layered architecture (Fig. 4) that integrates traditional data with real-time data stored on a cloud service. The system transmits operational metrics to the ThingSpeak IoT platform (MathWorks, 2026). The integrated data are then analyzed using machine learning algorithms and the Gemini API before being visualized in Oracle APEX (Oracle Corporation, 2026).
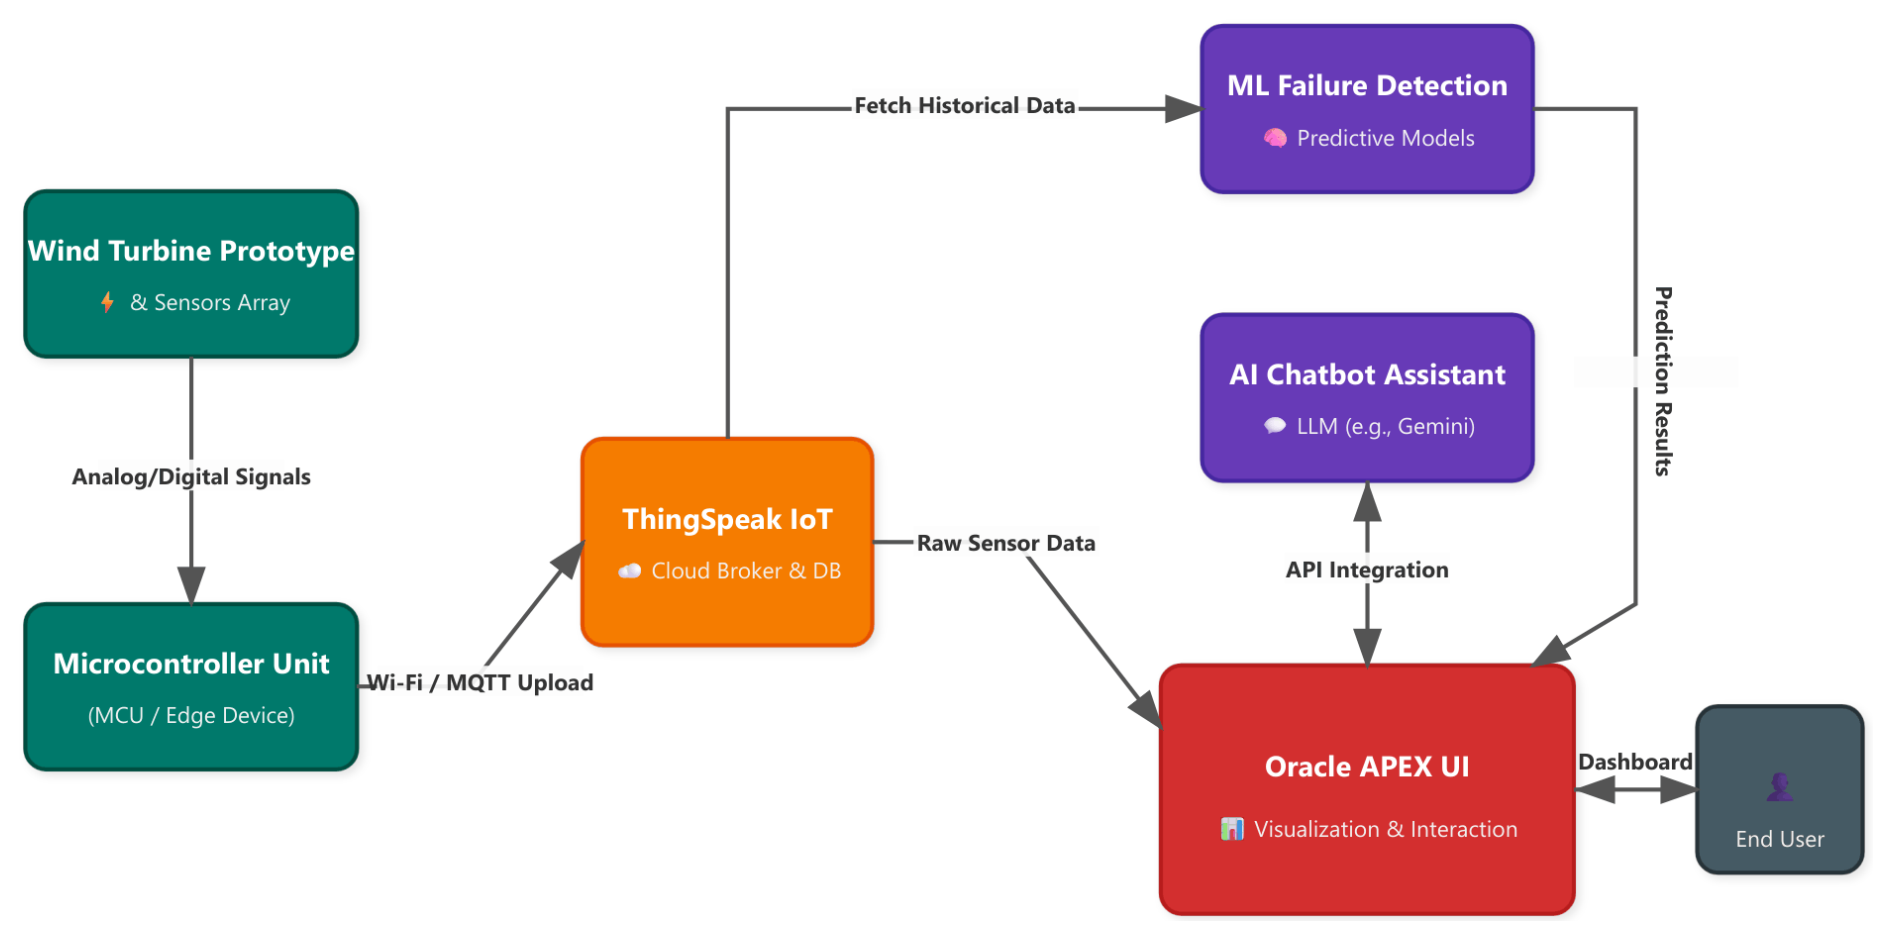
For real-time operation, the system utilizes the secure communication pipeline shown in Fig. 5, which employs both the hypertext transfer protocol (HTTP) and message queuing telemetry transport (MQTT) protocols. The ESP32 units act as publishers sending data to distinct topics (WindTurbine1, WindTurbine2). The Python AI server acts as a subscriber, continuously retrieving raw data, performing failure predictions, and writing diagnostic feedback for the user.
3.5 Evaluated models for decision support
The system analyzes sensor data to detect potential faults in mechanical gearboxes and electrical systems at an early stage of operation. To achieve the highest precision, 11 different machine learning models (Table 7) were evaluated.
Among the evaluated models, XGBoost emerged as the optimal choice due to its superior ability to handle non-linear sensor relationships and deliver the highest predictive performance. Ultimately, the system utilizes this optimized model to provide actionable diagnostic outputs, including failure probability, risk levels, and the overall anomaly status of wind turbines. After the data pre-processing and model optimization stages, the optimal XGBoost model was integrated into the physical system for real-time operational tests. Physical prototype tests have shown that the model successfully maintains a 15 s data collection cycle. Data transfer and analysis are completed within 5 s, panel updates within 3 s, and chat responses within 10 s. Synchronization between ESP32 units was maintained, and the system returned to normal operation within 15 s without data loss.
Figure 6 illustrates the machine learning workflow, including the train–test split, 5-fold cross-validation, and pseudo-labeling, where an XGBoost teacher model using 7 inputs generates labels for a LightGBM student model incorporating 3 additional sensor features, with final evaluation on the unseen hold-out test set.
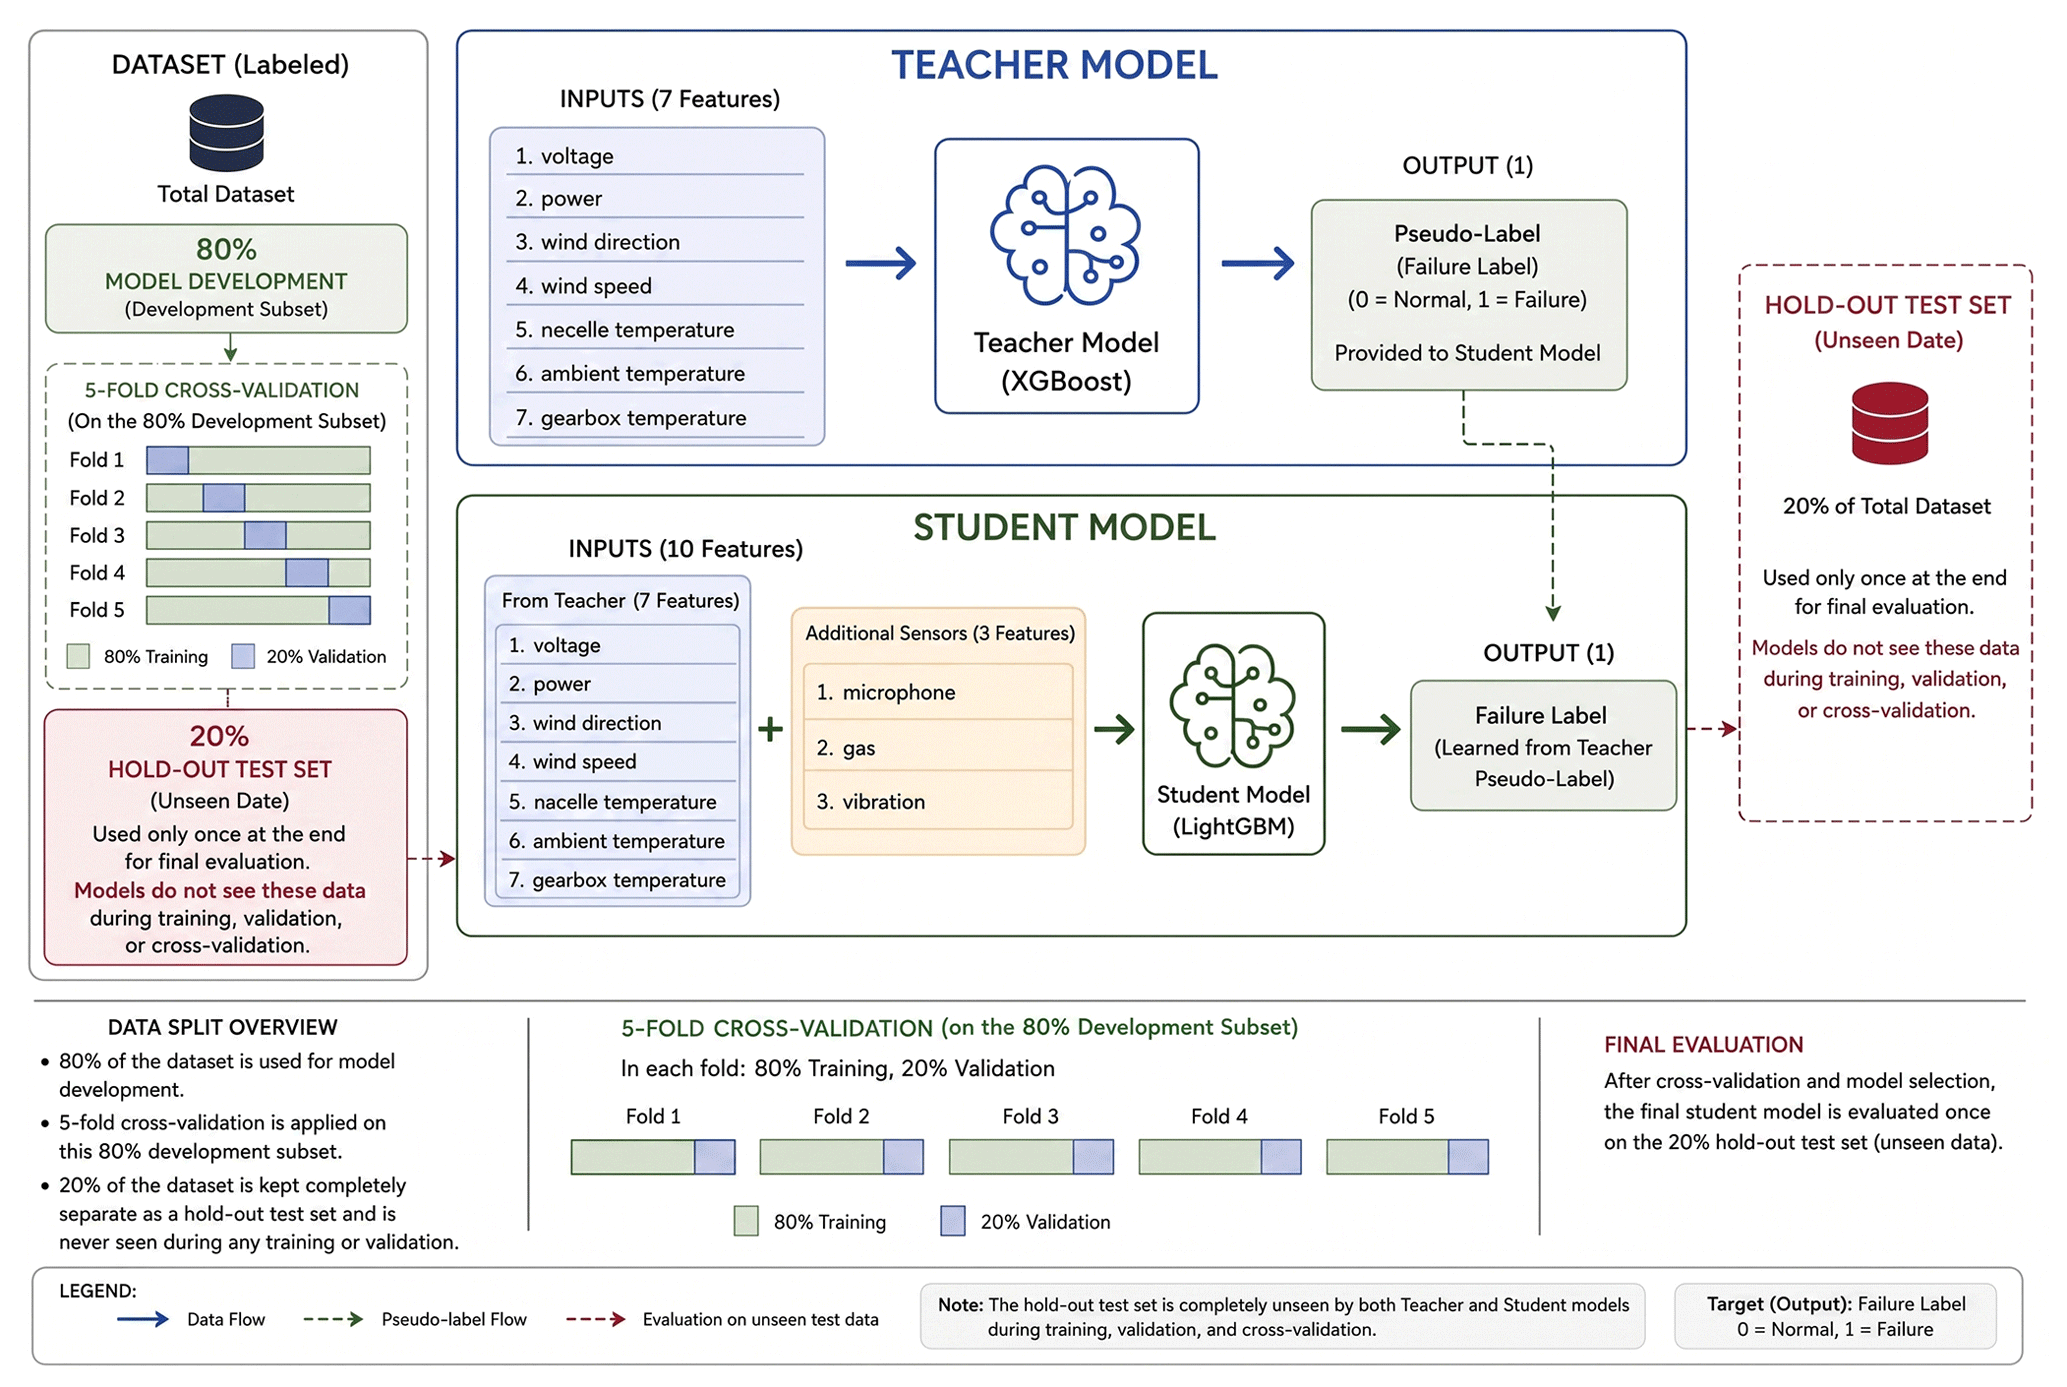
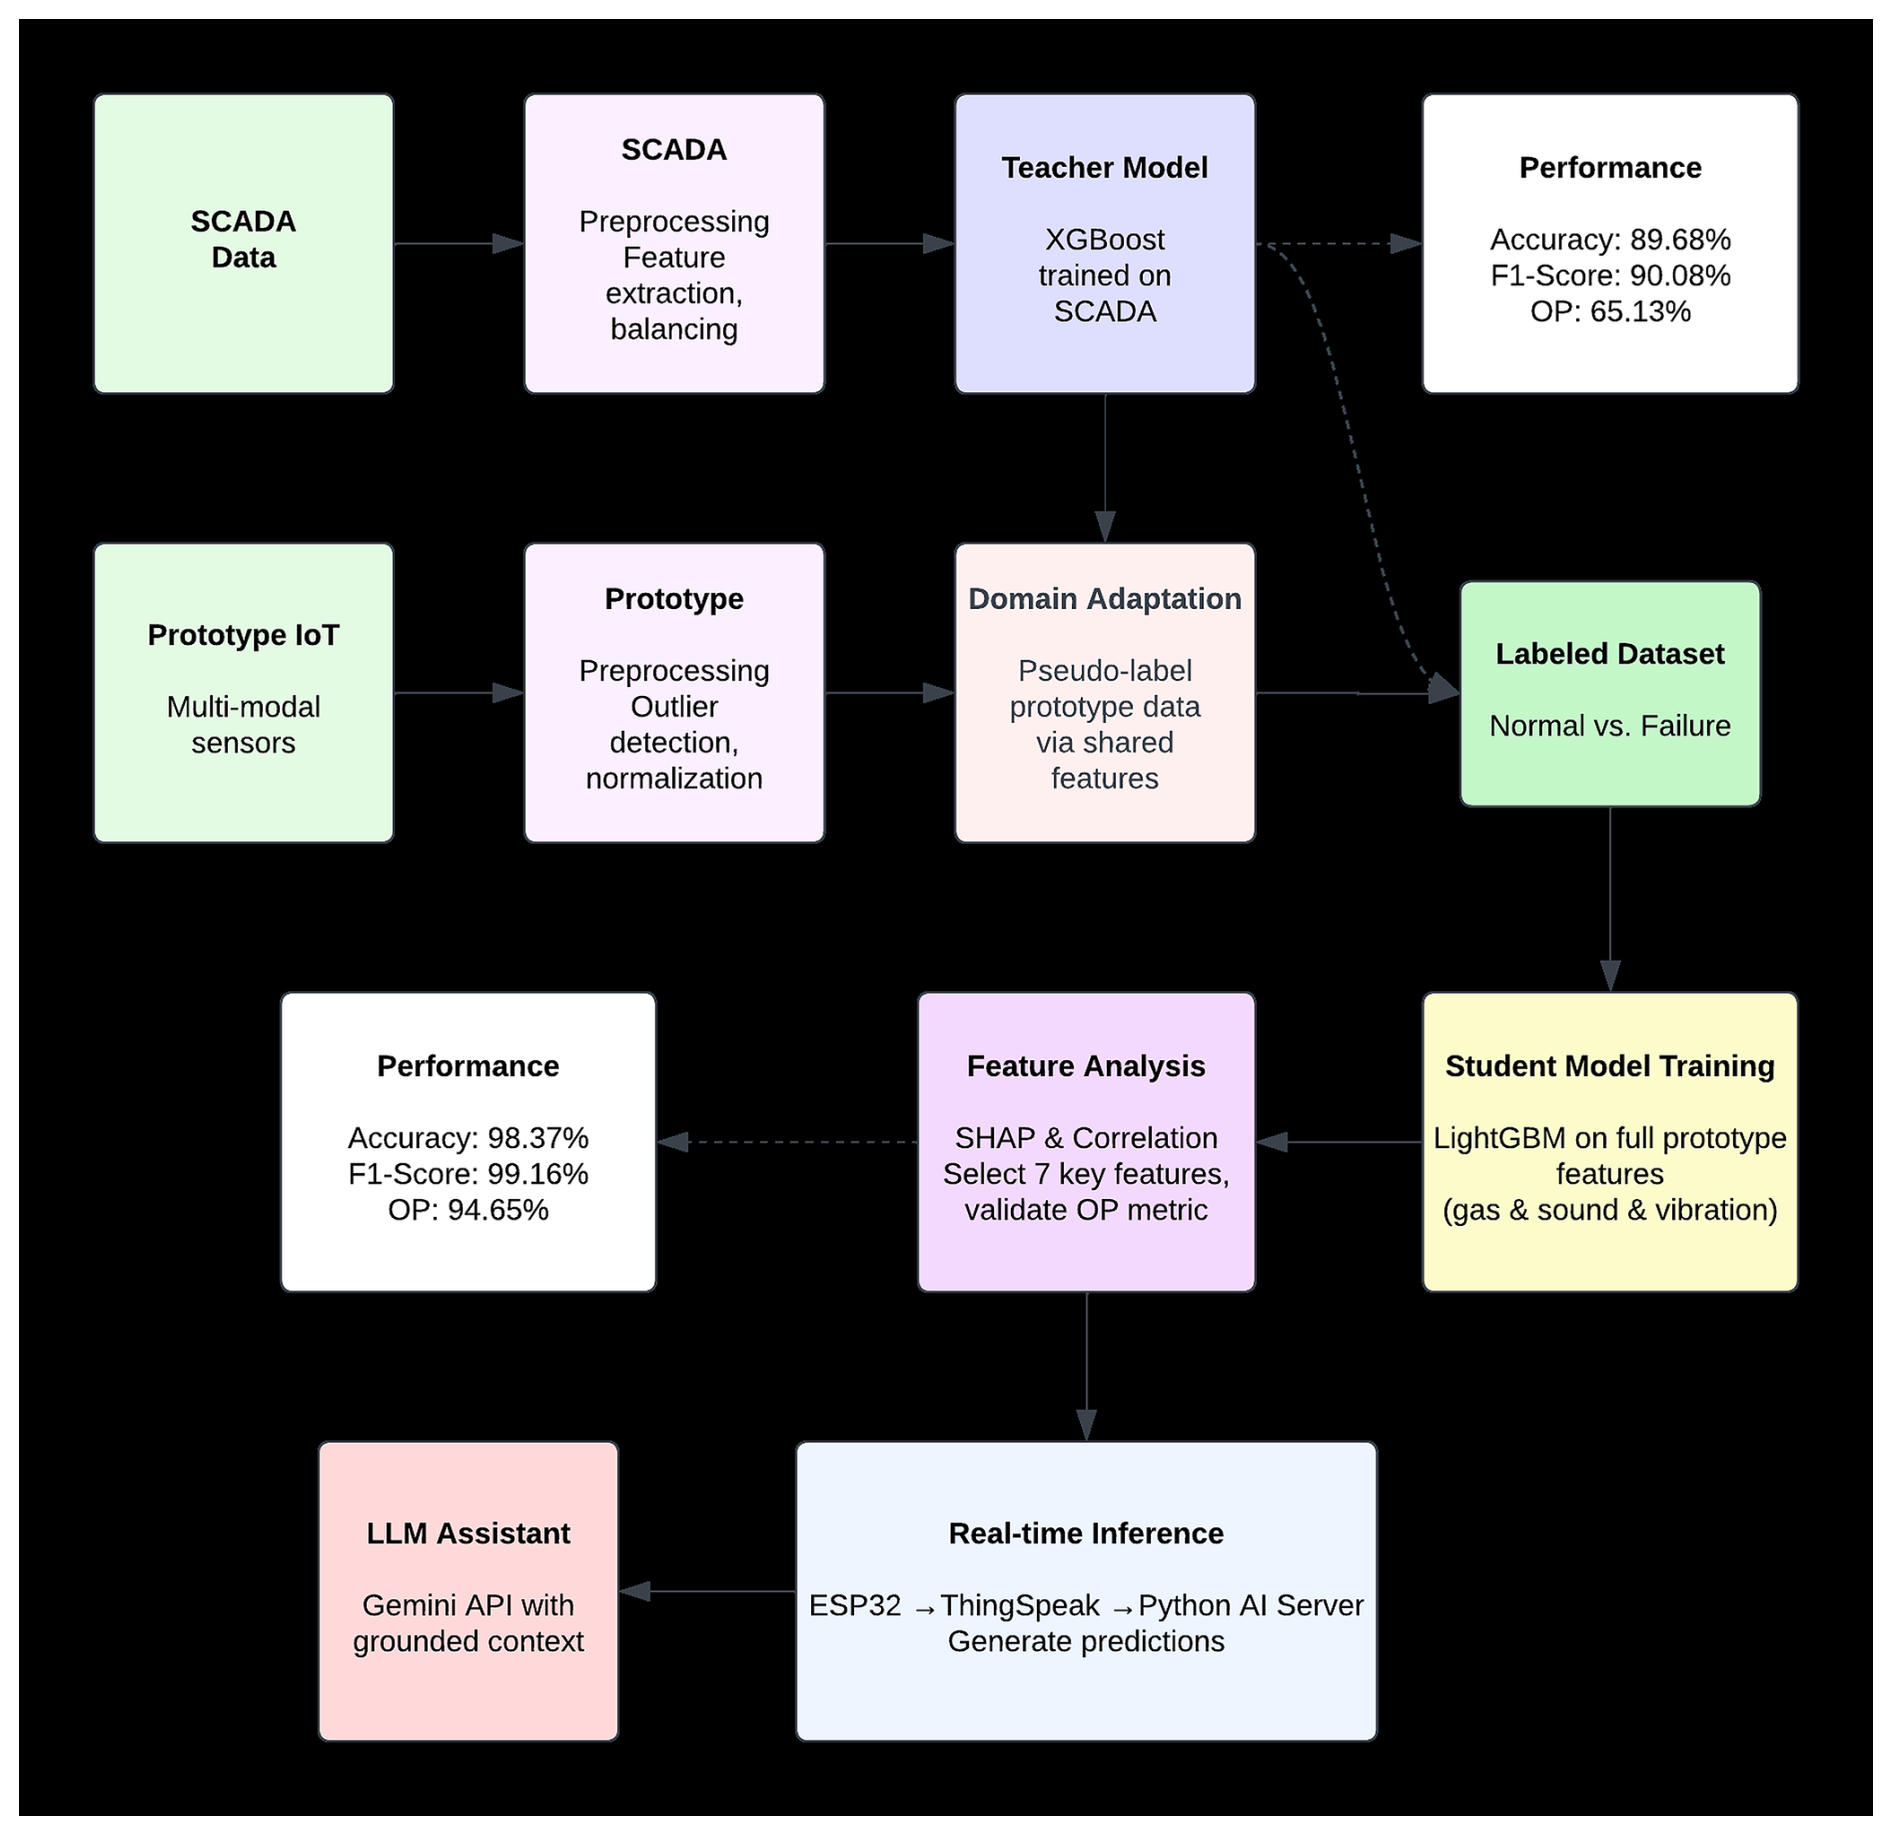
Figure 7 presents a unified, end-to-end methodology that eliminates the fragmented presentation of the workflow by connecting SCADA preprocessing, domain adaptation, student model retraining, explainability, real-time inference, and LLM-based decision support within a single integrated framework.
3.6 Performance metrics
The overall correctness and reliability of the models were evaluated using standard supervised learning metrics: accuracy, recall, precision, F1 score, and ROC-AUC. The mathematical formulations and detailed theoretical backgrounds of these standard machine learning evaluation metrics are further examined in Naidu et al. (2023). The metrics collectively provide a comprehensive assessment of the model's ability to distinguish between faulty and healthy turbine states, especially in cases of unbalanced class distributions. In wind turbine failure prediction, the F1 score is preferred because it better reflects the minority fault class in highly imbalanced datasets. The ROC-AUC is relegated to the background as they can be misleading in imbalanced data. To provide a more comprehensive and balanced assessment of classification performance under imbalanced operating conditions, an overall performance (OP) metric was additionally formulated by combining both success-based and error-based evaluation criteria. While conventional metrics such as accuracy, precision, recall, F1 score, and ROC-AUC individually describe specific aspects of model behavior, they may not fully reflect the trade-off between predictive capability and classification reliability in fault diagnosis applications. In particular, high accuracy or ROC-AUC values may still coincide with elevated false alarm rates or missed fault detections in highly imbalanced datasets. Therefore, the proposed OP formulation integrates both positive performance indicators and error penalties into a single evaluation framework. The OP metric is defined as in Eq. (1):
where accuracy, precision, recall, F1 score, and ROC-AUC represent success-oriented metrics, while LogLoss, Brier error, false positive rate (FPR), and false negative rate (FNR) represent prediction uncertainty and classification error penalties. The constant value of 1 in the denominator is included to prevent numerical instability and disproportionate inflation of the metric when error terms approach zero. By jointly considering predictive strength and error behavior, the OP metric provides a more interpretable and balanced comparison of machine learning models for real-time wind turbine fault prediction systems.
The mathematical weights assigned to the parameters in the proposed OP metric (Eq. 1) represent a key methodological novelty of this work, established through a systematic literature-consensus and expert-consultation approach to align with the operational demands of industrial wind turbine diagnostics.
The F1 score is assigned the highest weight (0.25) due to its critical role in balancing precision and recall under extreme class imbalance. The ROC-AUC is assigned 0.20 to measure threshold-independent class discrimination. Standard metrics (accuracy, precision, recall) are weighted at 0.15 each to preserve baseline performance compatibility. Finally, the error penalty is weighted at 0.10 to penalize high prediction uncertainty (LogLoss) and missed detections (FNR).
To validate the mathematical stability of this novel formulation, a sensitivity analysis was performed by varying the coefficients across alternative configurations (including equal-metric weighting and error-heavy schemes). Under all perturbations, the relative performance rankings of the 11 models remained completely stable, with XGBoost consistently emerging as the top performer on SCADA data (65.13 % OP) and LightGBM on prototype data (94.65 % OP). This demonstrates that the OP formulation is a robust, objective, and highly stable novelty for evaluating real-time diagnostic systems.
3.7 Feature importance analysis
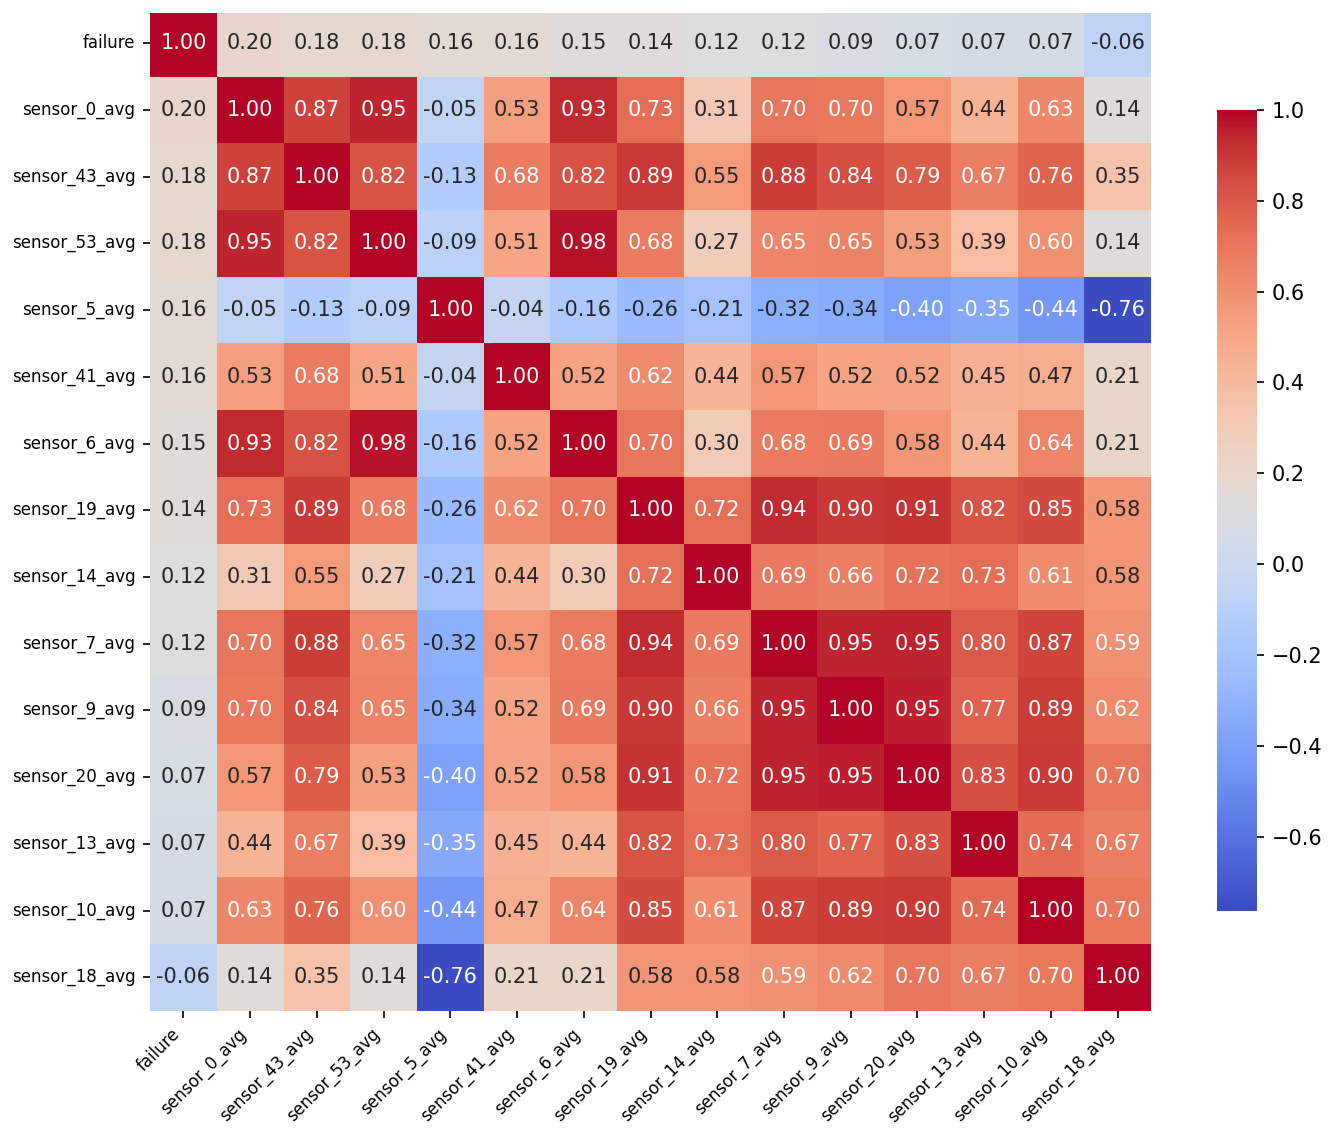
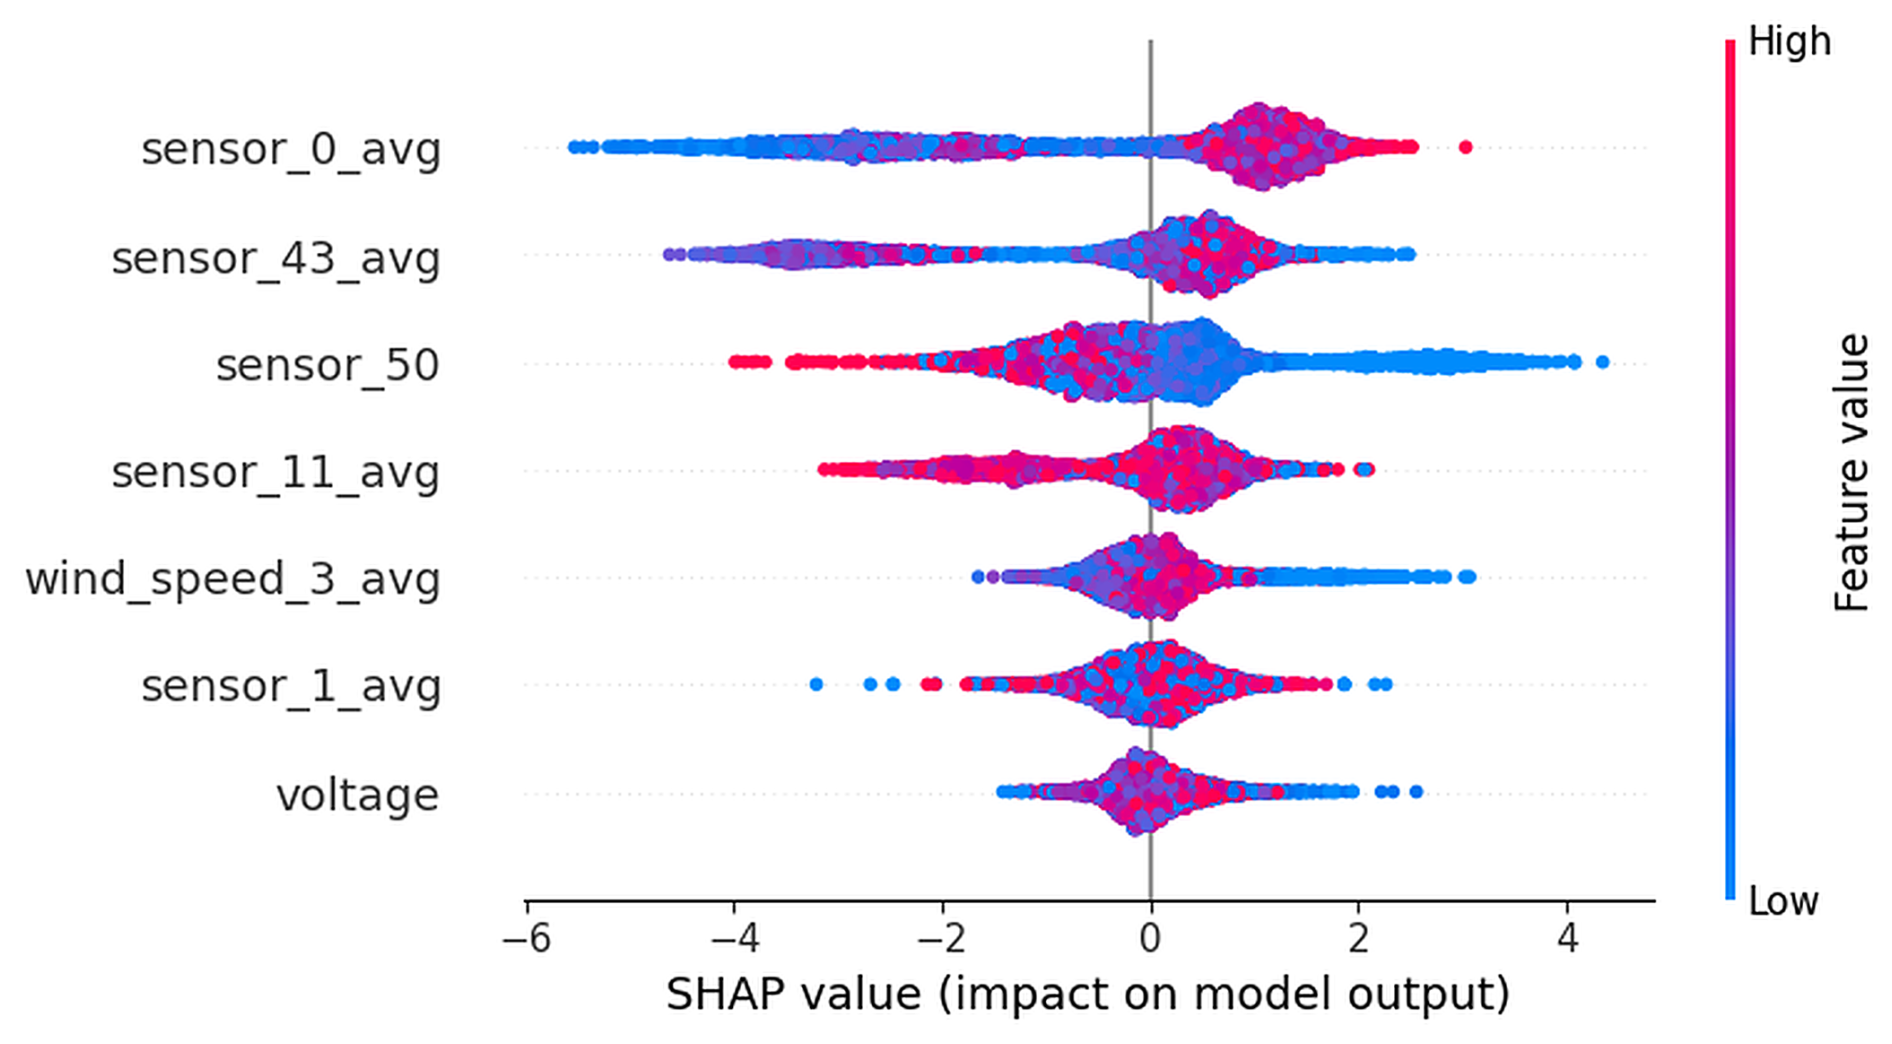
To optimize model performance, feature selection was executed via a two-stage hybrid pipeline combining collinearity filtering and cooperative game theory. In Stage 1, Pearson correlation analysis was performed on the raw SCADA dataset to identify and filter out highly collinear and redundant variables (), ensuring low multicollinearity and stable model training. In Stage 2, because wind turbine thermodynamics and sensor signals involve complex non-linear physical interactions, linear selection standards like Lasso or Ridge regression are insufficient. Therefore, SHAP (SHapley Additive exPlanations) values have been computed on the remaining variables using the baseline XGBoost model. This allowed us to measure the true non-linear marginal contribution of each feature, selecting the seven key features shown in Fig. 8 for the final training set.
The SHapley Additive exPlanations (SHAP) plot in Fig. 9 shows the model's most impactful features, from highest to lowest. These seven features form the basis of the appropriate final training phase. The features that impact real-time failure conditions most are as follows.
-
sensor_0_avg (Ambient temperature)
-
sensor_43_avg (Nacelle temperature)
-
sensor_50 (Total active power)
-
sensor_11_avg (Gearbox temperature)
-
wind_speed_3_avg (Windspeed)
-
sensor_1_avg (Wind absolute direction)
-
voltage (Mean of voltage phases)
In the final phase of the SWTFPS project, a comprehensive Oracle APEX-based web interface (Oracle Corporation, 2026) was developed to make diagnostic data from the XGBoost model actionable for end users (Fig. 10). This platform acts as a bridge between complex AI logic and the operator.
The interface's technical architecture is built on modern web technologies (hypertext markup language: HTML, cascading style sheets: CSS, JavaScript: JS) on the front end and robust data management (Structured Query Language: SQL, Procedural Language/Structured Query Language: PL/SQL) on the back end. The system consists of the following core modules.
-
Live IoT monitoring dashboard
-
Instant AI failure predictions
-
Interactive LLM maintenance assistant
-
Transparent SHAP/local interpretable model agnostic explanation (LIME) visual reports
-
Natural language system querying
-
Fast understandable AI outputs
This integration transforms the prototype into a professional predictive maintenance platform. Supported by an LLM, it delivers real-time turbine health reports and optimization suggestions on demand.
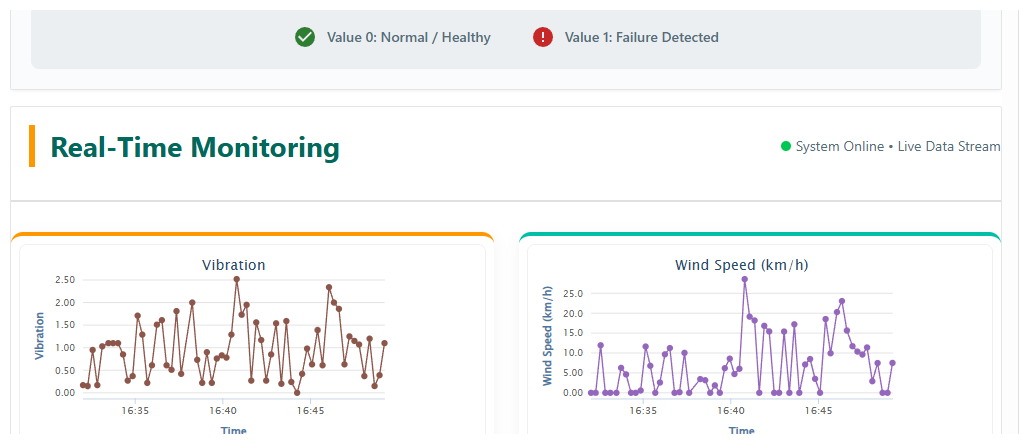
Figure 10Real-time monitoring interface developed by the authors using Oracle APEX (Oracle Corporation, 2026), incorporating embedded ThingSpeak visualizations (MathWorks, 2026).
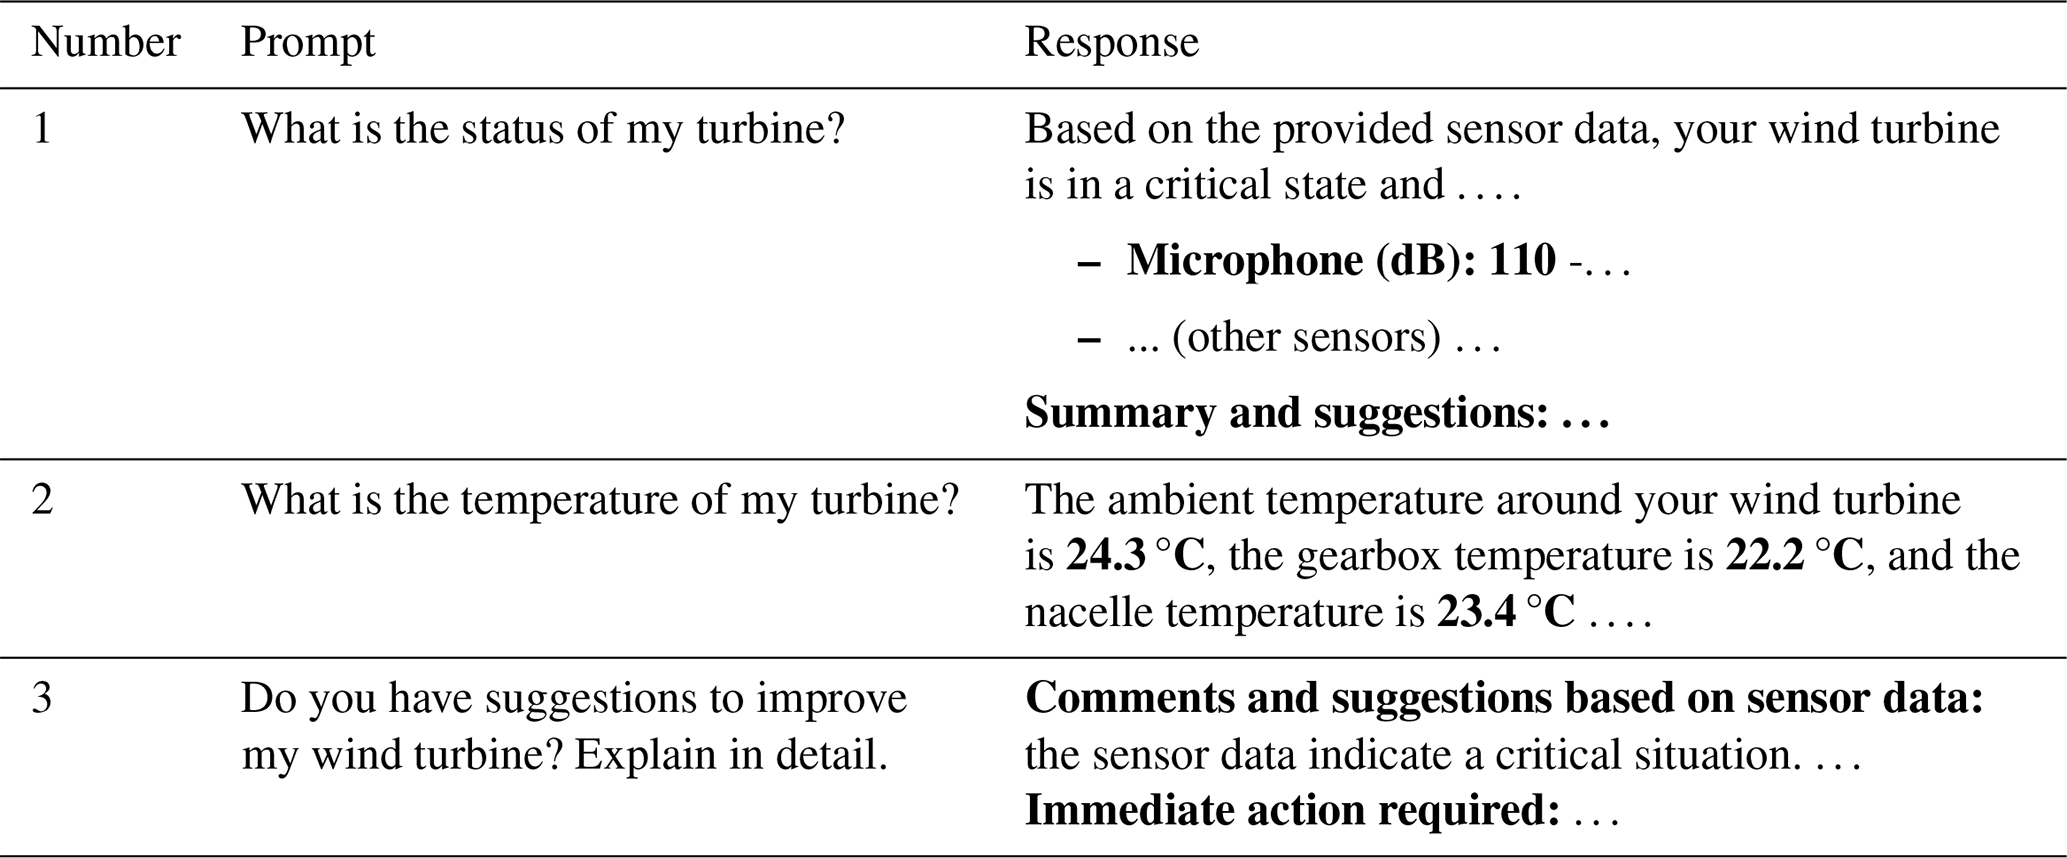
Figure 11 illustrates the typical page of a given response by the LLM interface to the user's question. The AI assistant can be updated quickly and easily by using its retrieval-augmented generation (RAG) capability. Examples of critical prompts and their AI assistant responses are given in Table 4.
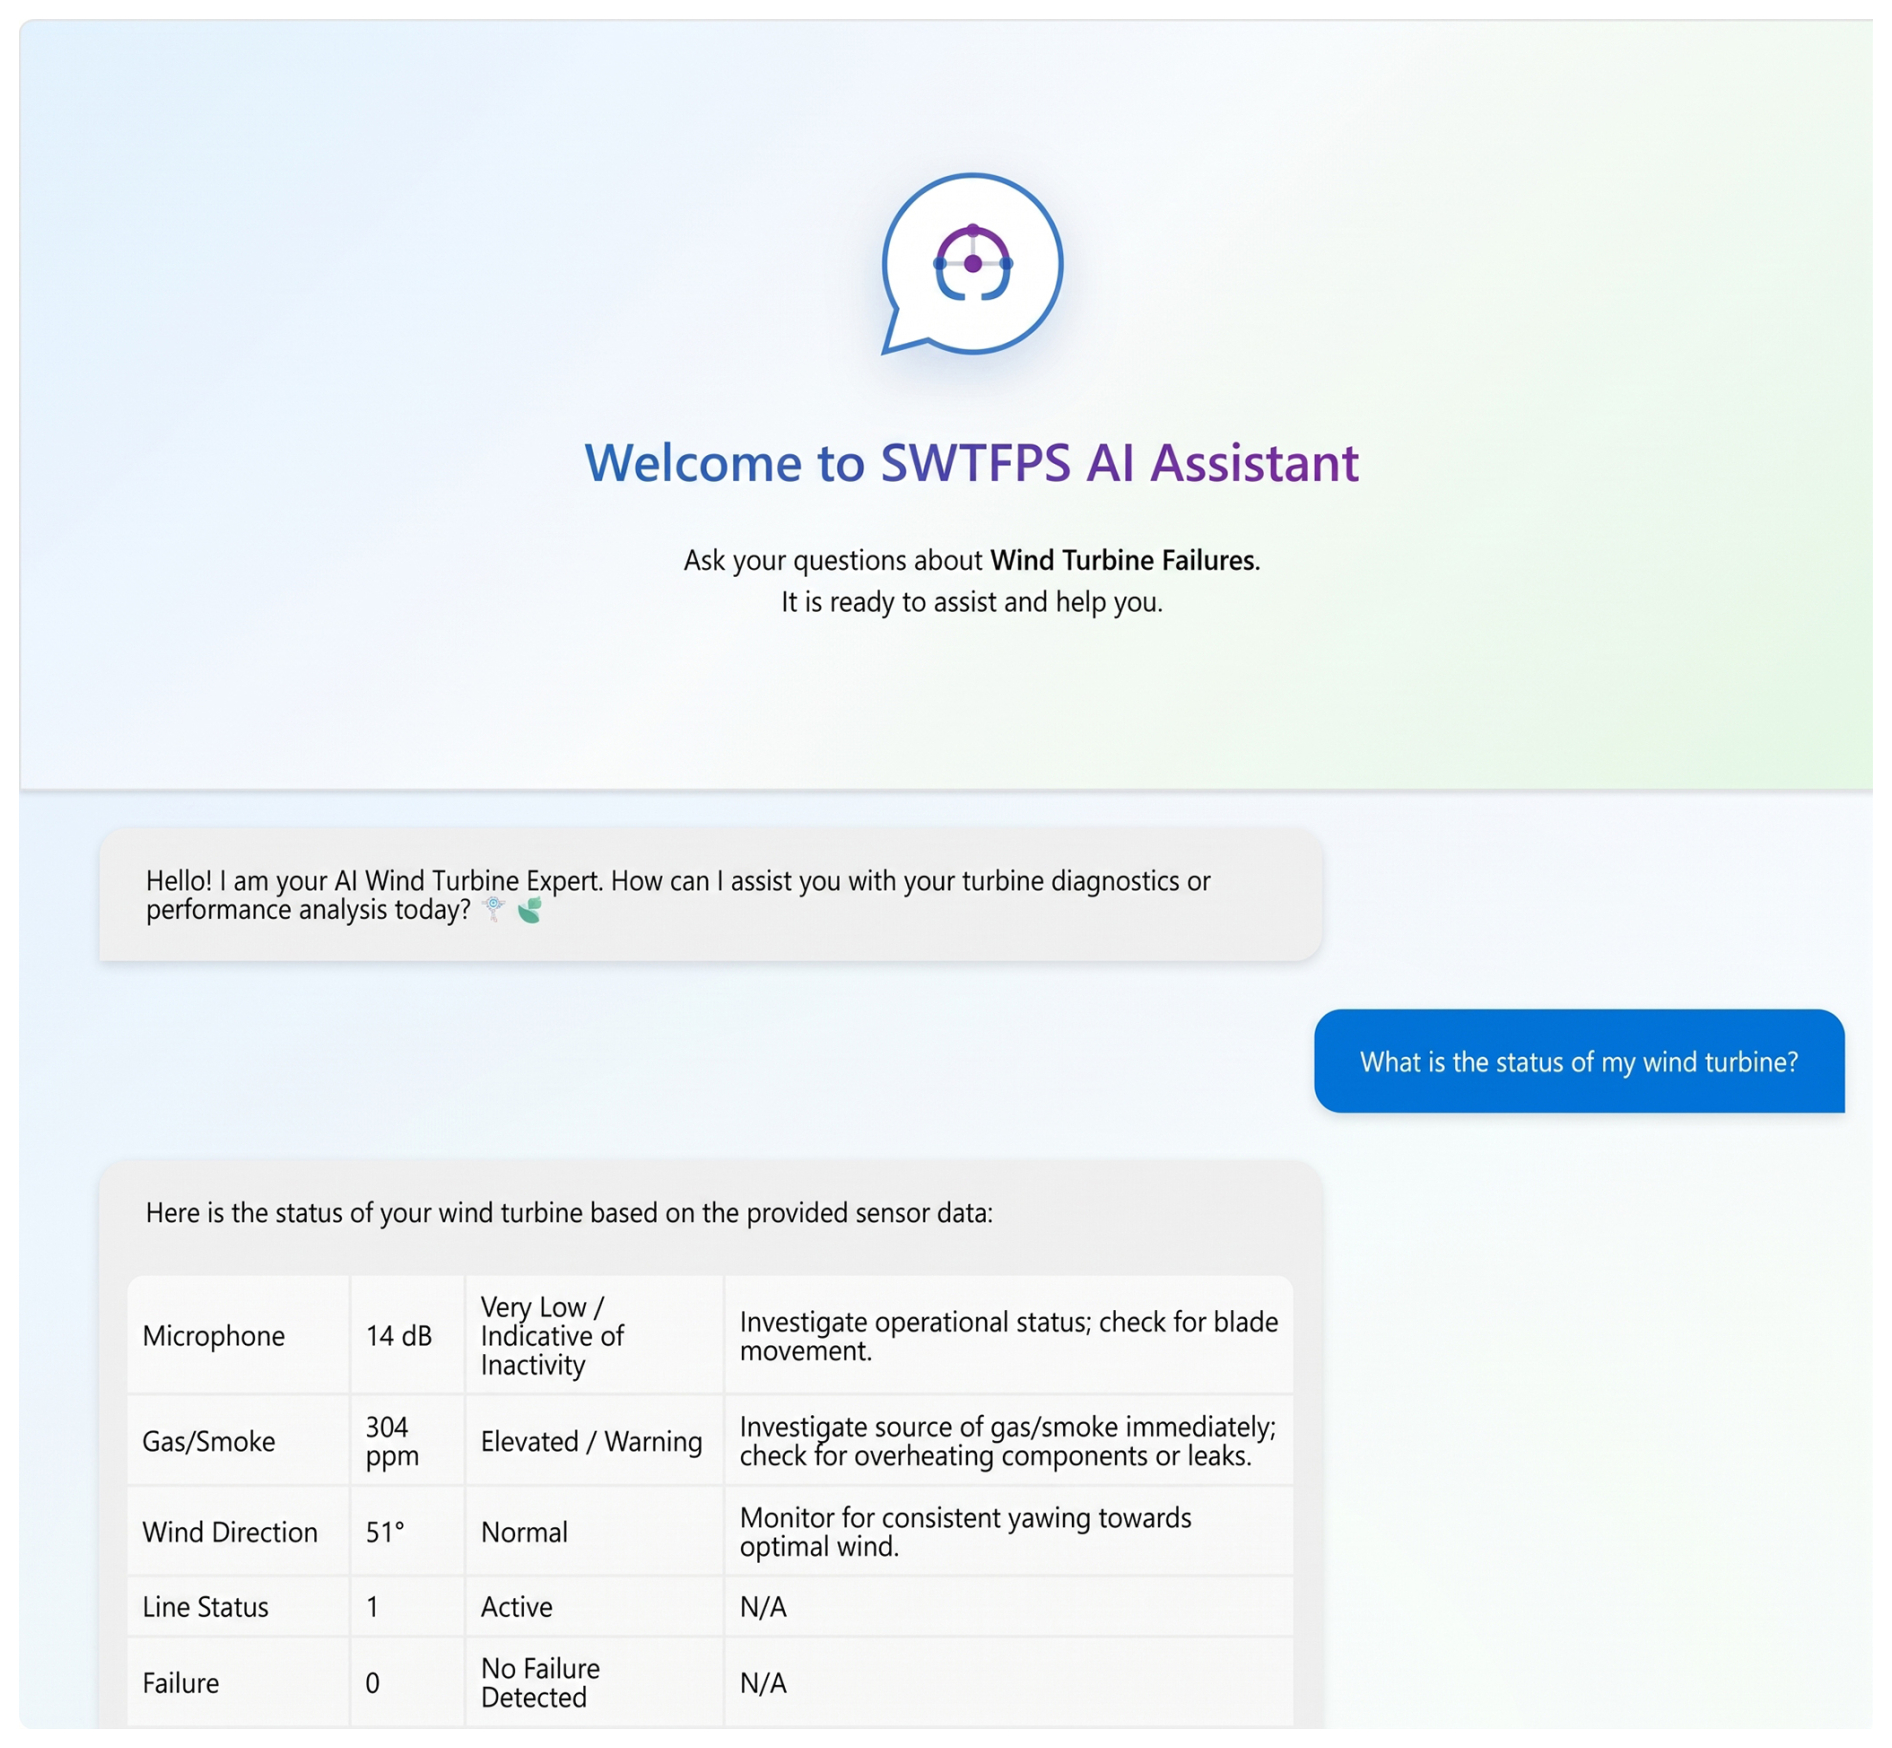
Figure 11SWTFPS AI assistant interface developed by the authors using Oracle APEX (Oracle Corporation, 2026).
Table 4 presents the most critical prompts and AI assistant responses Number 1–3, in a tabular format. When a status query is initiated, the back-end fetches real-time sensor data, which the LLM then uses to interpret the system state.
Table 4Several complicated questions. The bold font highlights the best-performing baseline model.
A critical challenge in integrating LLMs into industrial monitoring is the risk of “hallucinations”, where the model might generate plausible but physically incorrect diagnostic recommendations from raw numerical arrays. To eliminate this risk and ensure strict verifiability, the SWTFPS does not rely on the LLM to independently deduce failure mechanics from raw data. Instead, the Gemini API is explicitly grounded in deterministic domain knowledge through a RAG (retrieval-augmented generation) approach.
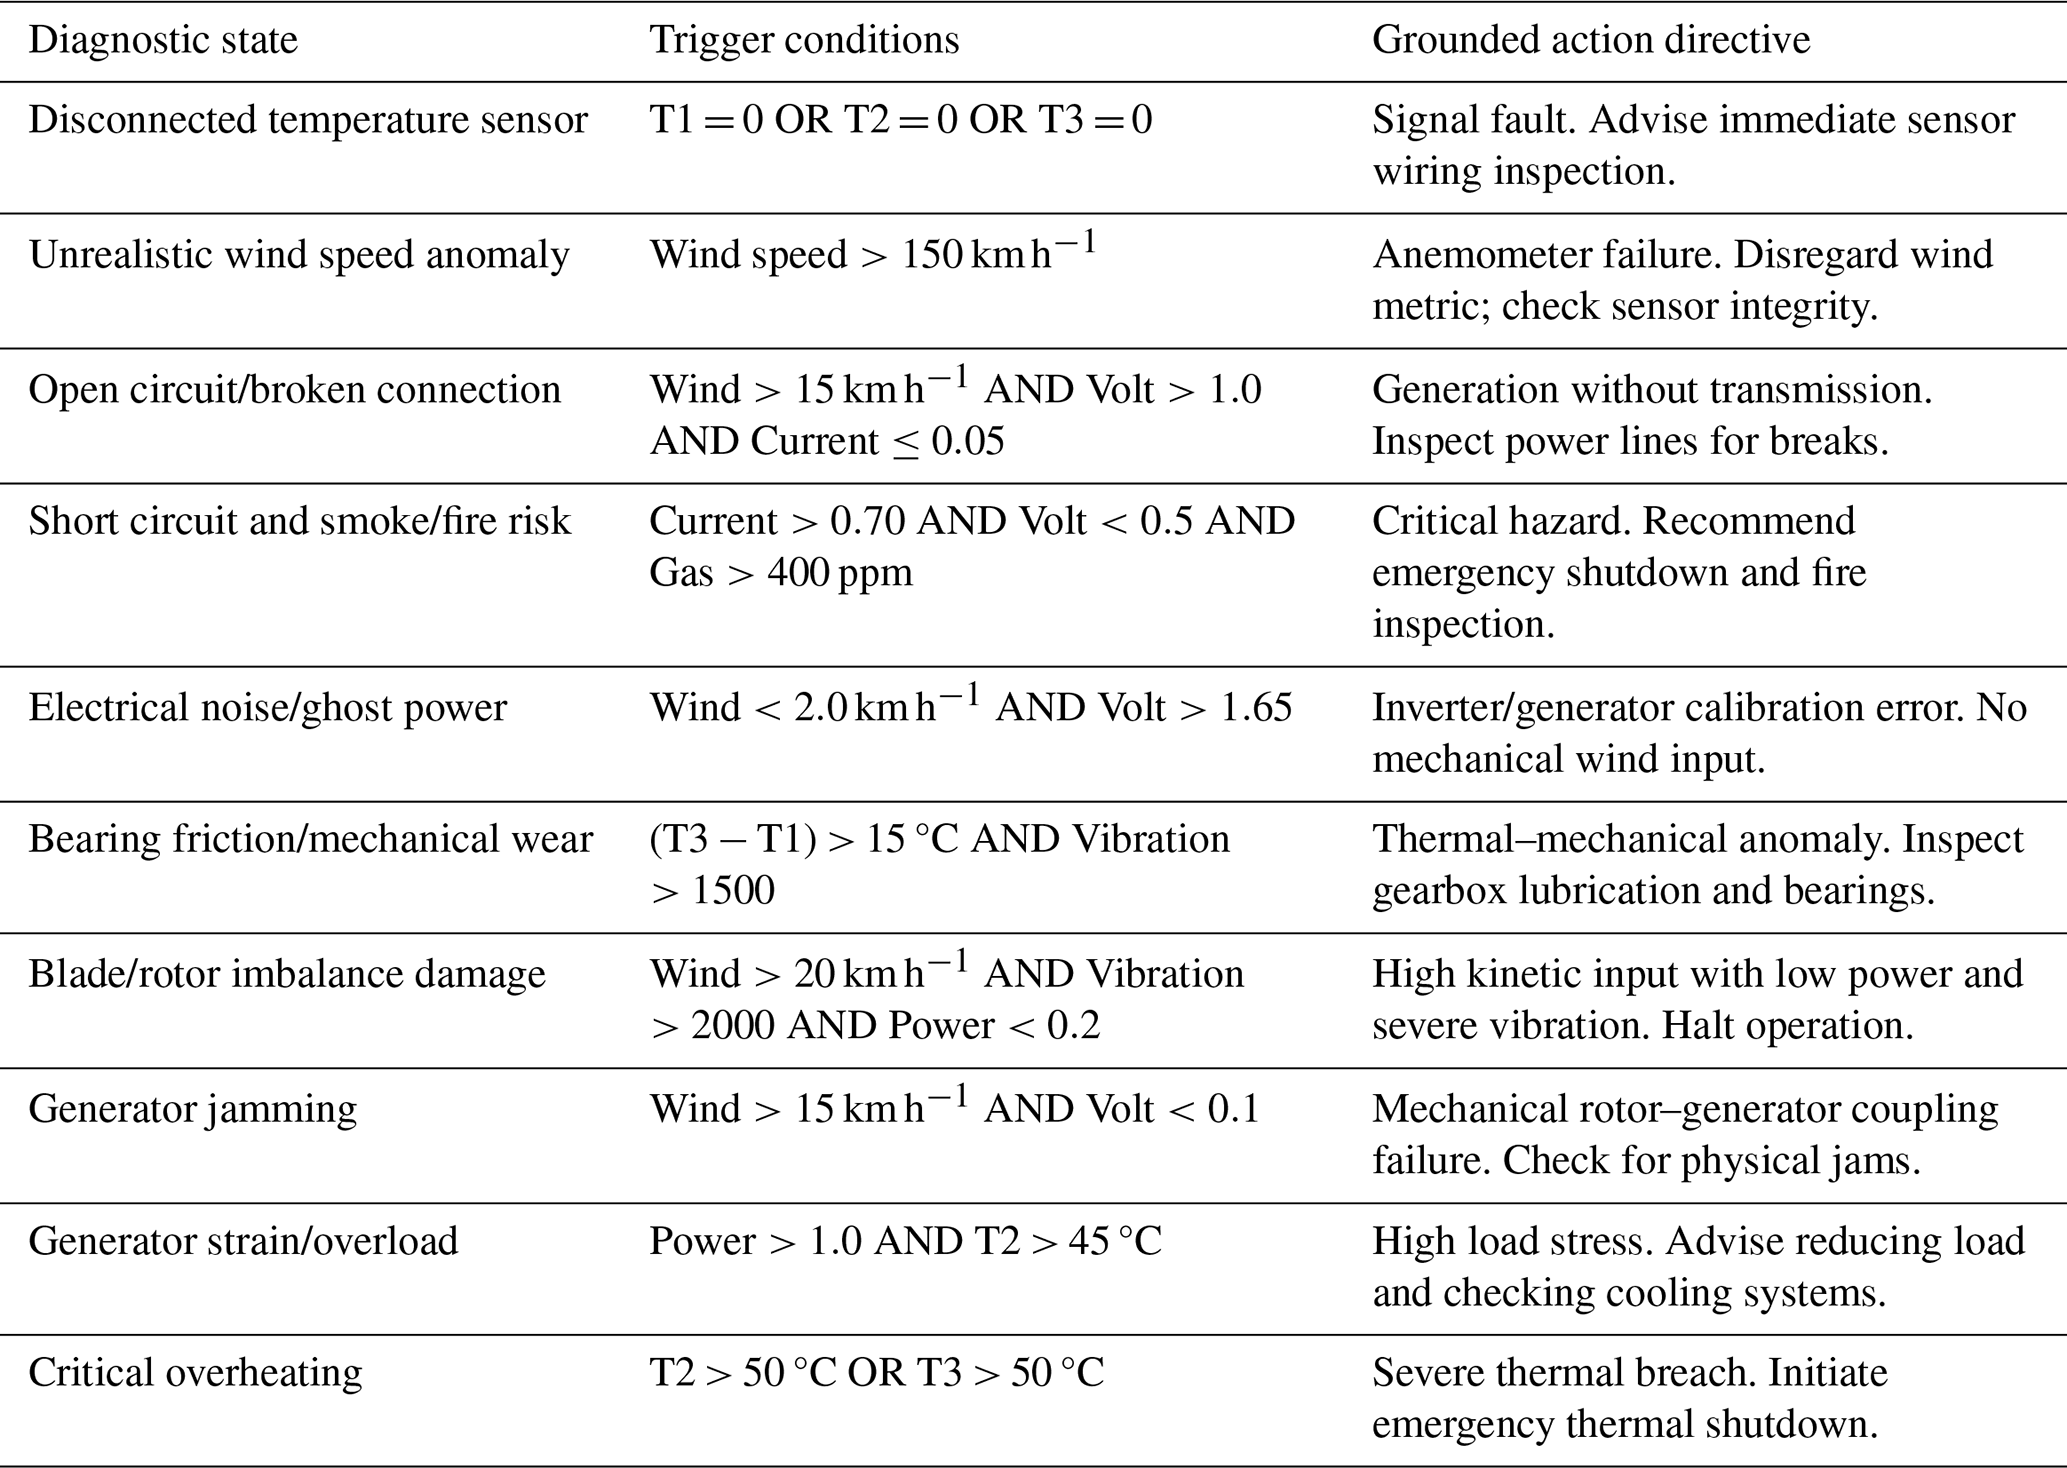
Before the raw sensor data are transmitted to the LLM, the Python back end evaluates the data streams against a hard-coded “sensor-pattern-to-action” reference matrix (Table 5). This matrix acts as a safety override mechanism, mapping specific multi-sensor operational thresholds directly to known mechanical and electrical fault typologies. When a threshold condition is met, the system injects the pre-validated domain context (e.g., “Short circuit and smoke risk detected”) into the LLM's system prompt. Consequently, the LLM functions strictly as a natural language synthesizer that contextualizes pre-validated engineering facts, rather than an unguided diagnostic engine. This guarantees that all AI recommendations (such as emergency shutdowns or inspection directives) are strictly verifiable against physical engineering rules.
Table 5Deterministic sensor-pattern-to-action reference matrix for LLM grounding.
To provide domain-specific responses, the SWTFPS integrates a retrieval-augmented generation (RAG) mechanism with an LLM-based interface. The process consists of the following stages:
-
Knowledge base preparation. User-provided technical PDF documents are processed into text chunks and stored as the RAG knowledge base.
-
Semantic retrieval. Document chunks and user queries are converted into vector representations using the Gemini embedding model, and cosine similarity is used to retrieve the most relevant content.
-
Real-time data integration. Current turbine measurements are obtained from the ThingSpeak IoT infrastructure and combined with the retrieved information.
-
Response generation. The retrieved technical context, real-time sensor data, and user query are provided to the Gemini-based LLM. When a failure or anomaly is detected, the LLM relates these inputs to provide a diagnostic recommendation based on the retrieved troubleshooting information.
5.1 Model comparison and final choice
To maximize the predictive capability of the models and prevent overfitting, systematic hyperparameter tuning was conducted using 5-fold cross-validation, following standard optimization methodologies established in the literature. Rather than relying on default parameters, optimal configurations for each algorithm (such as tree structures for ensemble methods, learning rates for boosting models, and specific distance metrics) were identified based on the highest mean F1 scores.
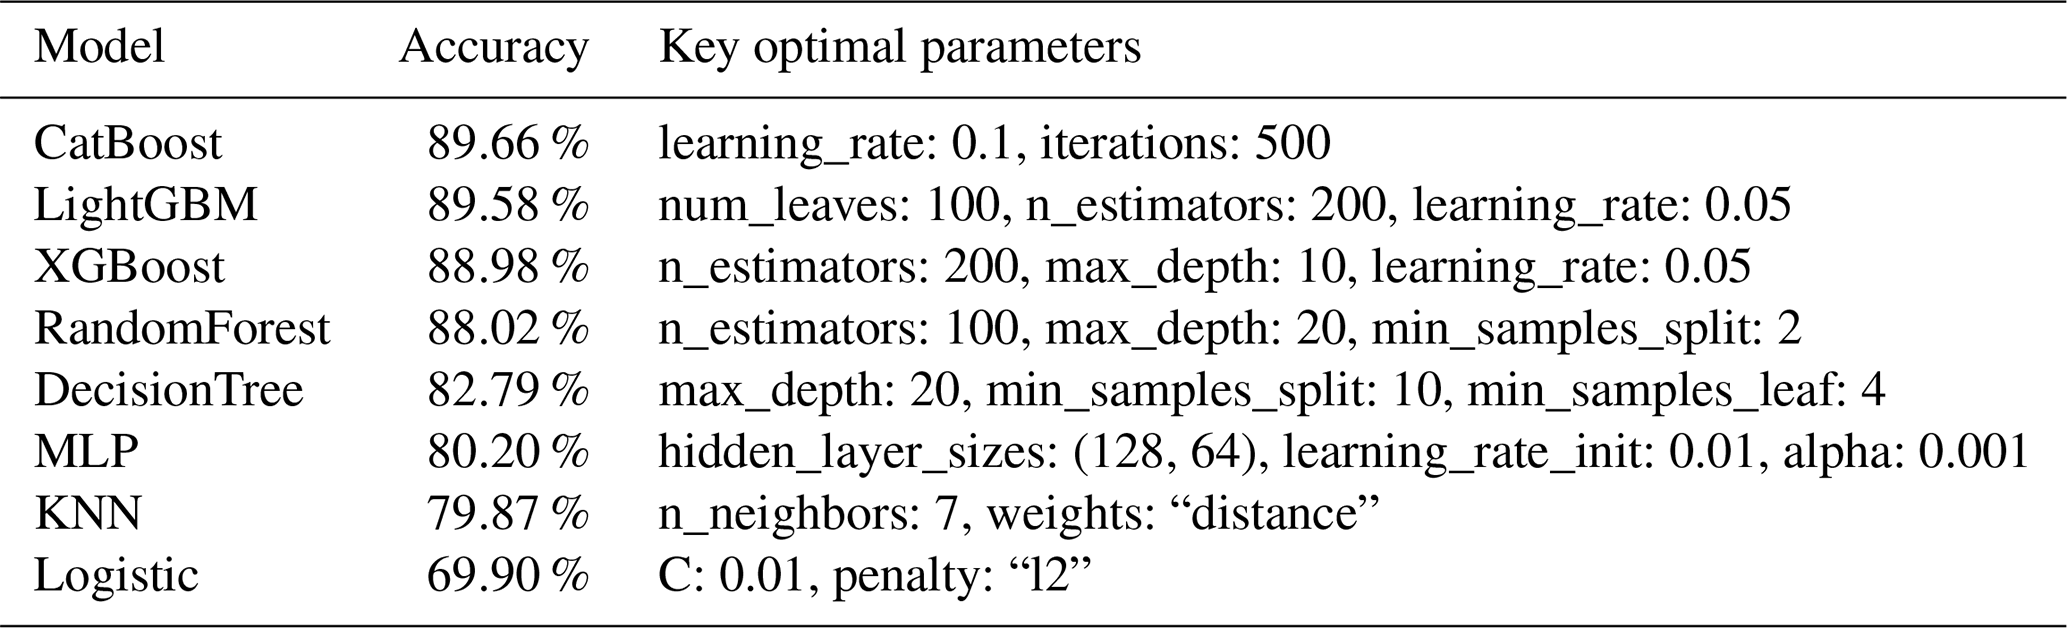
The final performance metrics of the algorithms post-tuning are summarized in Table 6. The results indicate that CatBoost and LightGBM achieved the highest accuracy levels. While XGBoost and random forest also demonstrated strong predictive capabilities, simpler models like logistic regression showed limited performance. This outcome highlights the need for tuned boosting models to capture the complex non-linear relationships inherent in industrial sensor data. The architectural structures of the specific models and the technical definitions of parameters are consistent with the literature, and Islam et al. (2025) can be considered a reference for comprehensive explanations of these parameters. The hyperparameter optimization process was carried out independently according to the characteristics of the existing dataset.
Table 6Accuracy and optimal hyperparameters for all evaluated models.
The performance of the k nearest neighbors (KNN) and XGBoost models was compared using the raw dataset. The results clearly show the limitations of using unbalanced data. Although the KNN model has a high overall accuracy (98.43 %), its recall (91.87 %) and F1 score (93.33 %) for the “Failure” class indicate a strong bias toward the majority “Normal” class. On the other hand, the XGBoost model struggles significantly with raw high-dimensional data. Its overall accuracy drops to 66.09 %, and its precision for the Failure class falls sharply to 20.65 %, indicating it generates many false alarms. While the initial baseline evaluation of the raw data showed that XGBoost performed worse than KNN, the model trained on the refined dataset emerged as the top performer.
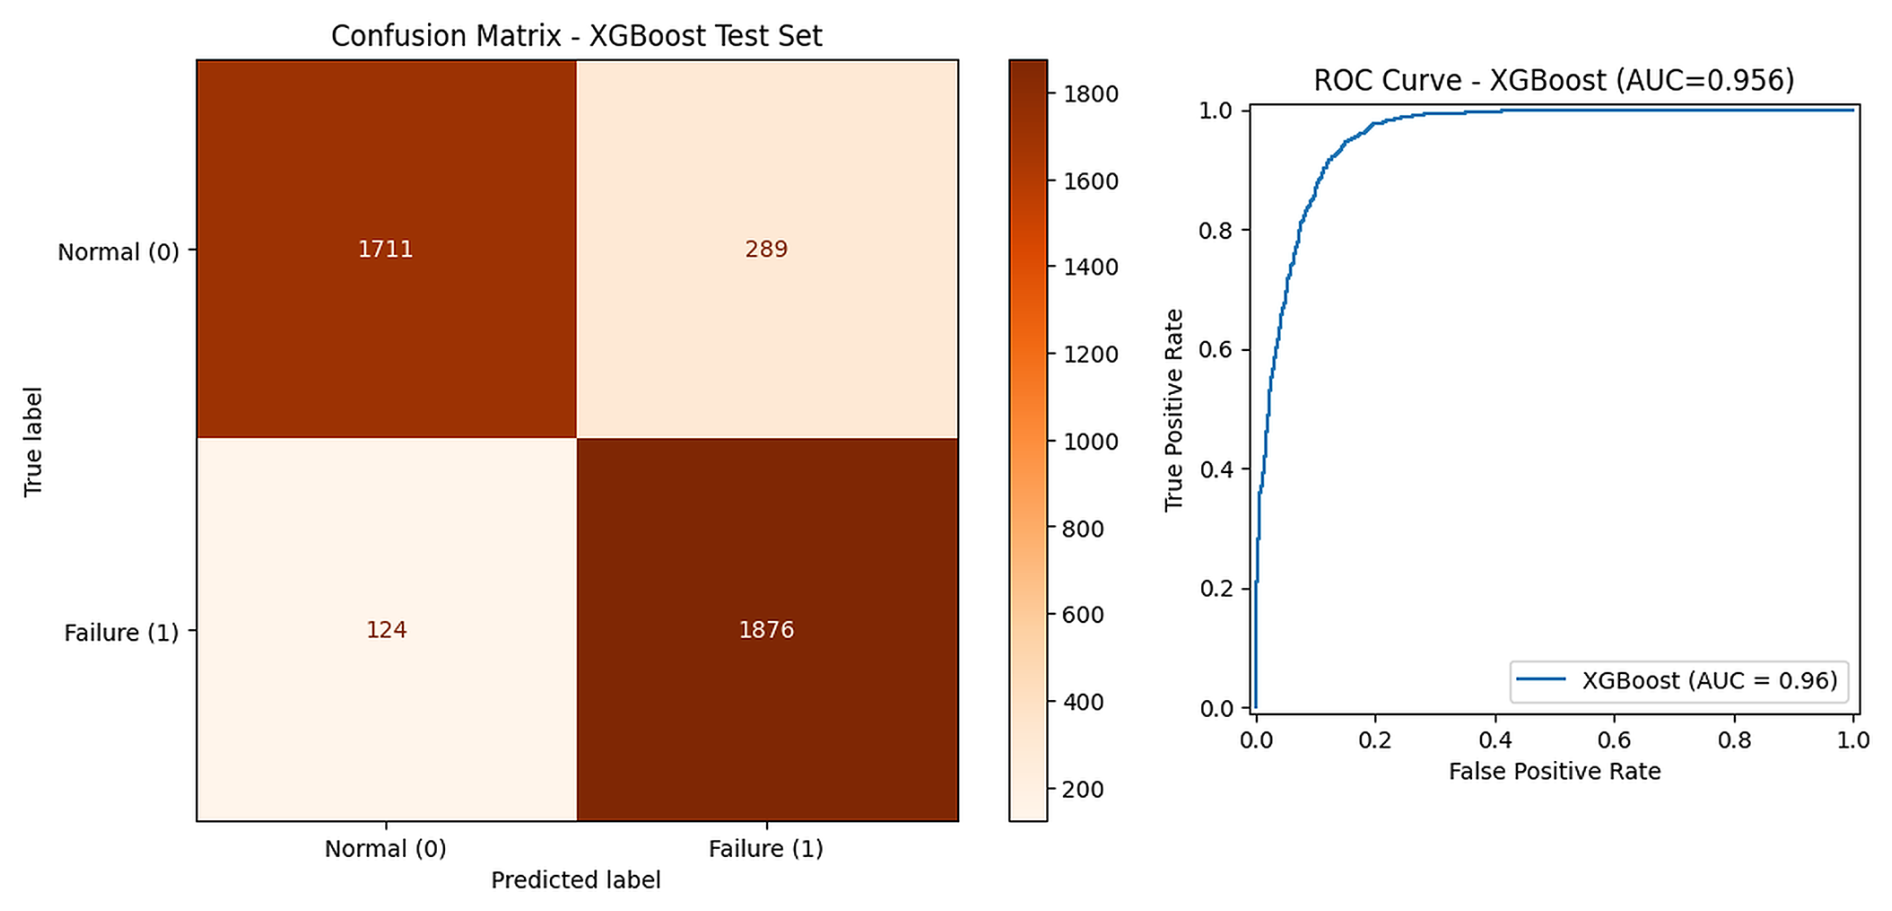
According to the confusion matrix in Fig. 12, the XGBoost model can distinguish failure cases (Class 1) with high accuracy (1876 true positives, 89.68 %) and an F1 score of 90.08 %. An area under the curve (AUC) of 95.65 % is observed in the receiver operating characteristic (ROC) curve in Fig. 12. The high predictive capability demonstrates the model's effectiveness in detecting faults and providing actionable insights.
5.2 Explainability and interpretation capability
Following the initial assessment of the large-scale dataset, the SWTFPS was tested on a small-scale refined subset of approximately 20 000 samples. The F1 score was prioritized as the primary evaluation metric over ROC-AUC as it better mitigates the imbalance in the wind turbine data. Again, the XGBoost model was selected for its superior performance. It achieved the highest F1 score among the evaluated models, demonstrating a robust balance between precision and recall in a small-scale experimental trial as well.
As detailed in Table 7, the XGBoost model provides a superior balance of high accuracy, fast inference speed, and architectural simplicity, making it the most reliable and cost-effective solution.
Table 7Model performance comparison. The bold font highlights the best-performing baseline model.
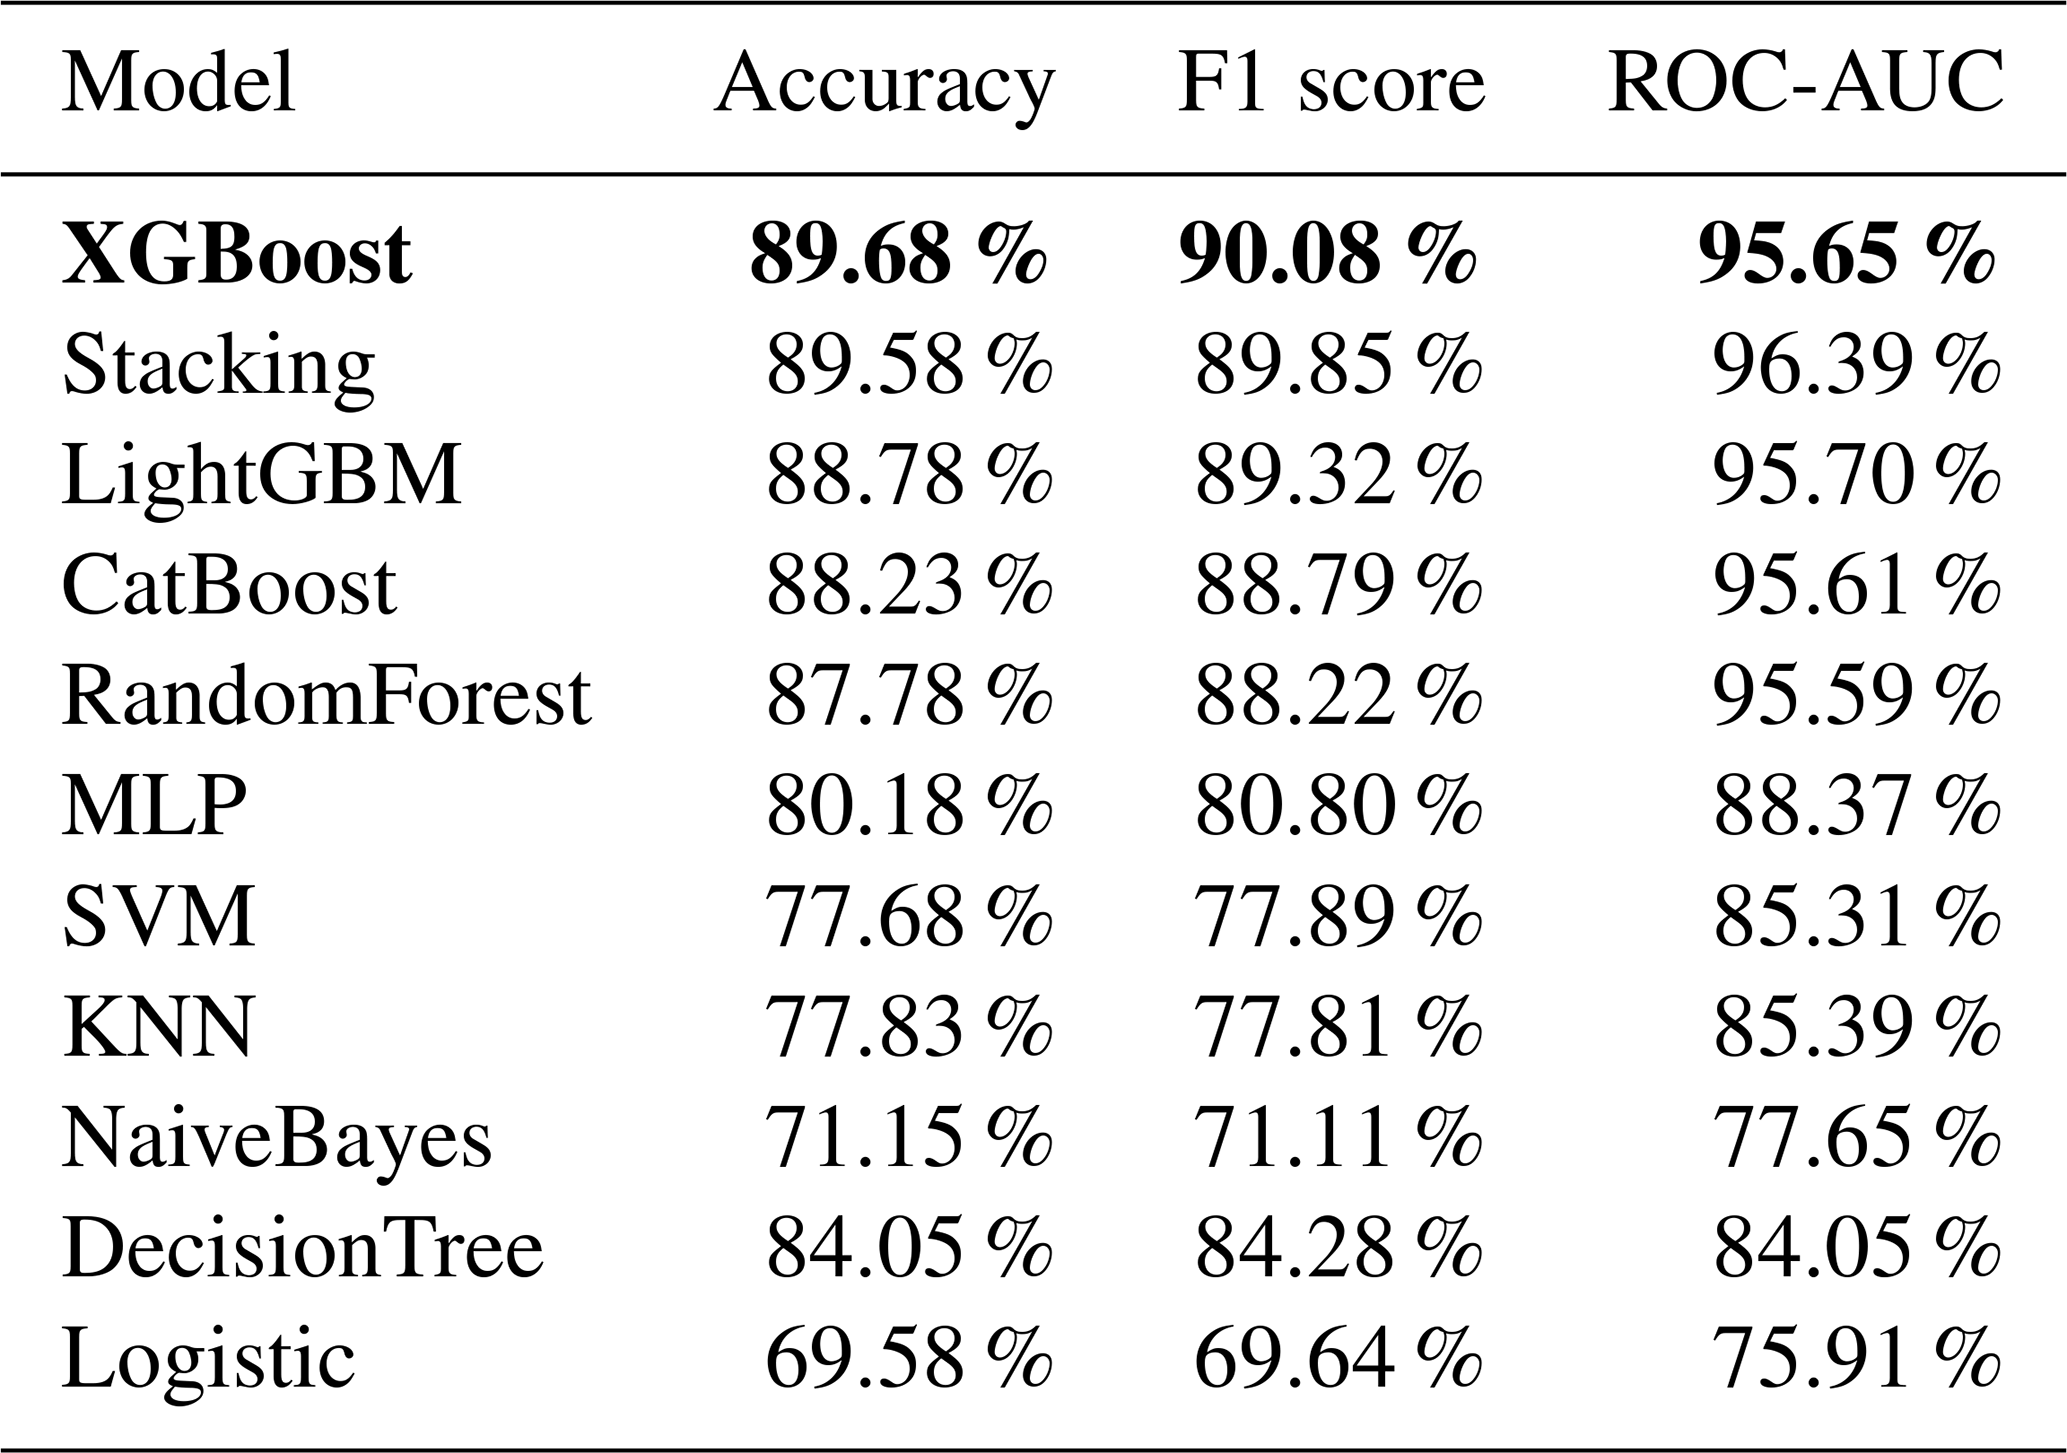
Transforming the data into a noise-free balanced dataset significantly improved the performance of all 11 evaluated models. However, the results show that all tree-based ensemble methods (stacking ensemble, random forest, LightGBM, CatBoost, and XGBoost) outperformed the simpler models (KNN, logistic regression, etc.).
5.3 Independent empirical validation and sensor ablation analysis
To systematically address potential pseudo-label bias inherent in the teacher–student procedure and to directly quantify the predictive value added by each newly introduced localized IoT sensor (sound, gas, and vibration), an independent validation study was conducted. Both the transferred SCADA-equivalent teacher model (XGBoost) and the multi-sensor student model (LightGBM) were evaluated against the same manually labeled, ground-truth-verified independent prototype dataset. The system has been systematically evaluated across eight distinct sensor configurations, starting from the SCADA-equivalent baseline and incrementally incorporating the localized sensors. The resulting performance metrics are presented in Table 8.
Table 8Ablation study evaluating the individual and joint contributions of localized IoT sensors against manually labeled, ground-truth-verified independent prototype data.
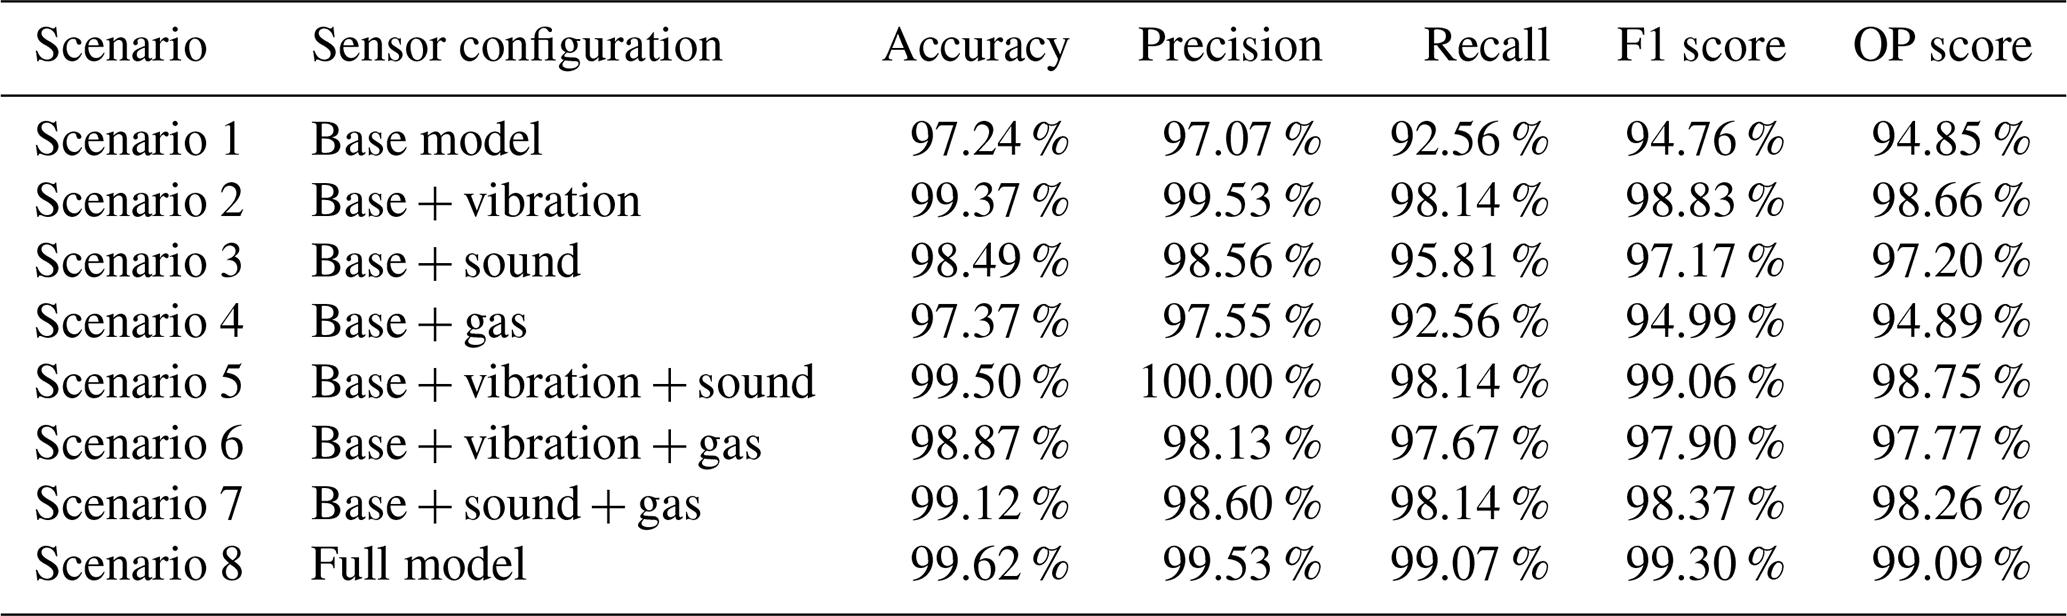
The empirical necessity of multi-modal sensor fusion and the validity of our teacher–student paradigm are illuminated by the independent validation in Sect. 5.3, which addresses the “mimicry bias” and domain-shifting challenges inherent to the framework. While global SHAP results (Fig. 14) show that gas and acoustic metrics are prioritized during model splits, Table 8 validates this synergy against physical ground-truth labels. If the student merely mimicked the SCADA-only teacher under this domain discrepancy, its performance would be capped by the teacher's error rate; however, the progression from a SCADA-only baseline recall of 92.56 % and F1 score of 94.76 % (Scenario 1) to a recall of 99.07 % (+6.51 %) and F1 score of 99.30 % (+4.54 %) in the full student model (Scenario 8) proves the student successfully resolves the domain shift, capturing anomalies invisible to SCADA. Ablation analysis reveals that while the vibration sensor (Scenario 2) yields the most dominant standalone improvement (F1 score: 98.83 %, +4.07 %; OP: 98.66 %) by capturing mechanical rotor dynamics, the acoustic and gas sensors provide vital diagnostic redundancies. The acoustic sensor (Scenario 3) detects high-frequency micro-cracking before vibrations propagate (F1 score: 97.17 %, +2.41 %), while the gas sensor (Scenario 4) captures kinetic-free electrical fire risks despite sparse standalone gains (+0.23 % F1 score). Ultimately, multi-modal integration in the full model (Scenario 8) achieves peak performance, reducing the false negative rate on true physical failures to just 0.93 % and mathematically expanding predictive maintenance limits.
6.1 Interpretation of results
The XGBoost model optimized with 50 % data balancing and the selection of seven key features demonstrated the highest performance (89.68 % accuracy, 90.08 % F1 score, 95.65 % ROC-AUC). This finding demonstrates that data quality is more critical than data quantity in fault prediction and that this compact approach is highly effective for real-time monitoring of hardware such as ESP32.
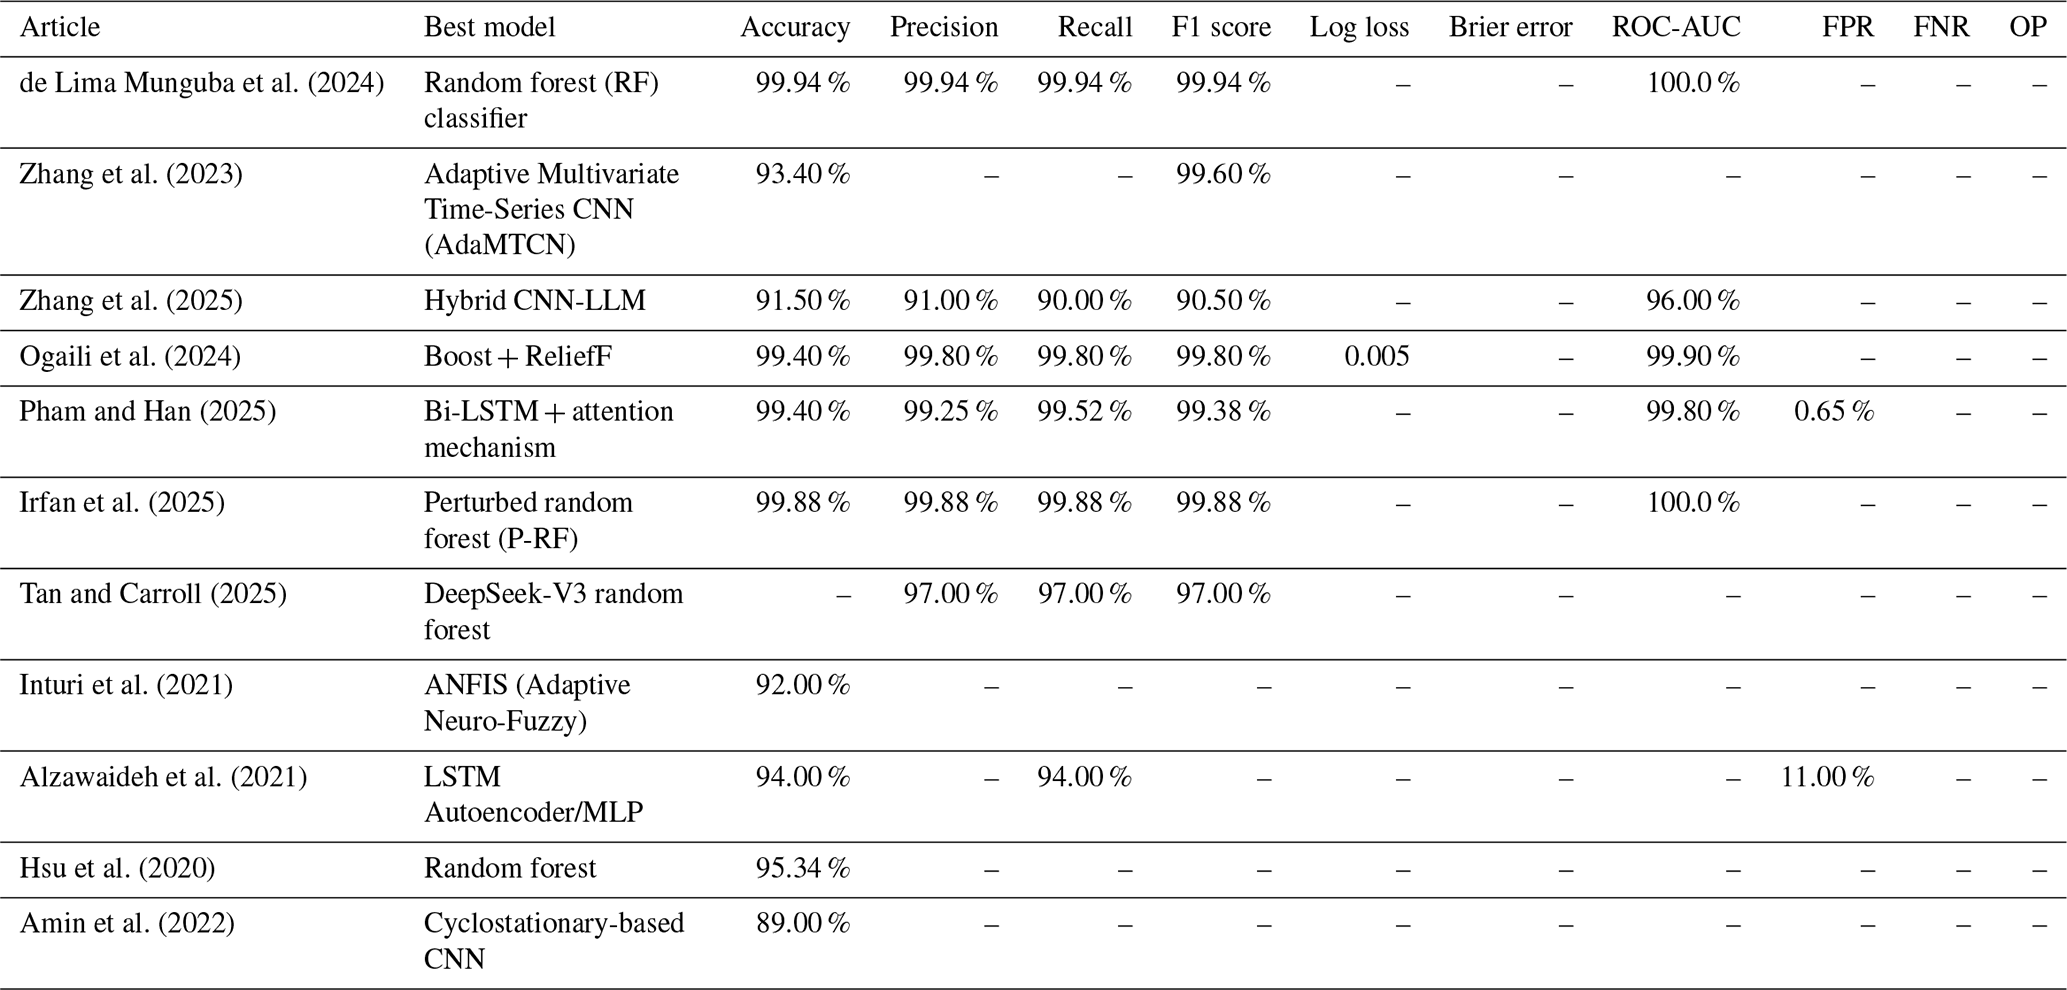
The global SHAP analysis revealed that ambient and nacelle temperatures are the primary drivers of predictions, which align well with turbine thermodynamics. To further complement the evaluation, local dynamics were examined using LIME (Fig. 13). The evaluated scenarios demonstrated the model's reliability in accurately detecting failures driven by thermal anomalies (Case 1). The model also recognizes stable conditions (Case 2) and, critically, prioritizes high-temperature warnings even when conflicting standard power metrics suggest normal operation (Case 3).
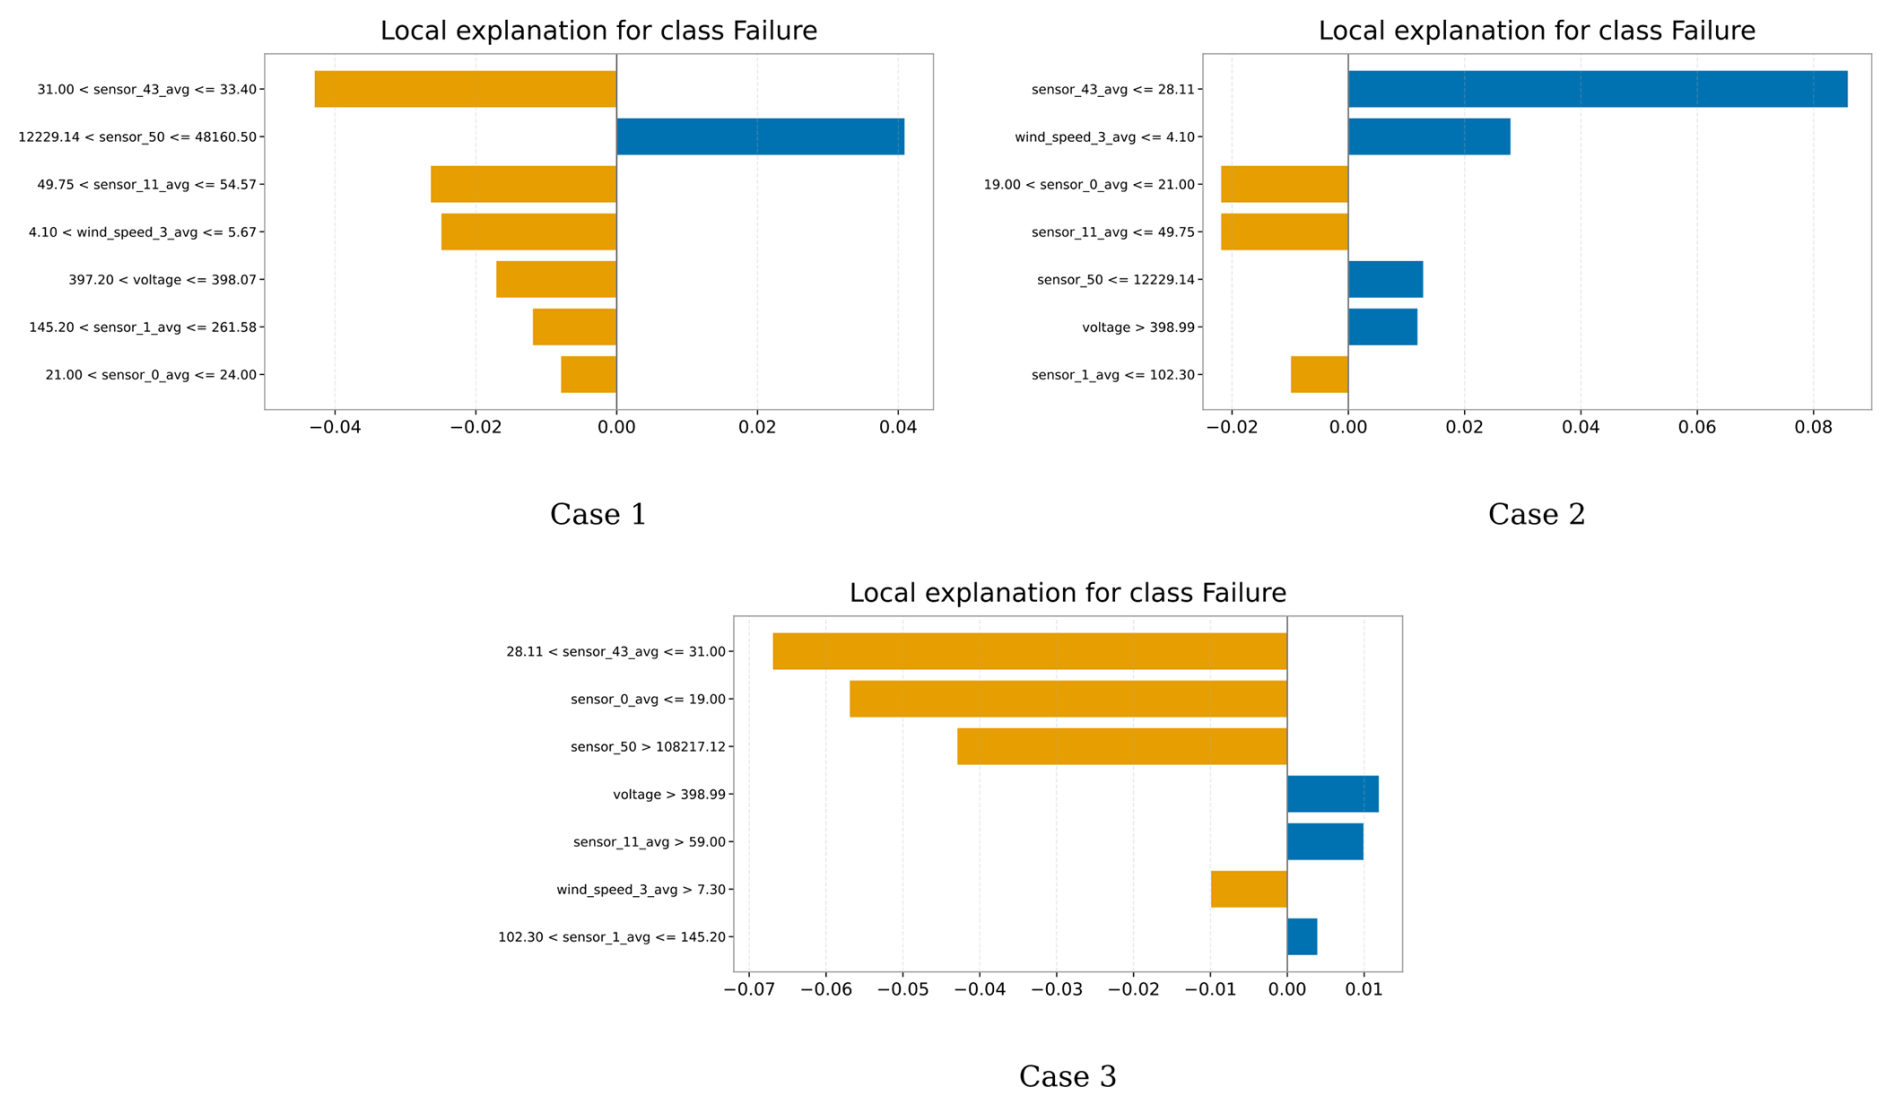
To provide a more balanced evaluation of predictive capability and classification reliability under imbalanced conditions, the proposed overall performance (OP) metric introduced in Sect. 3.6 was additionally employed, and the result in Table 9 was obtained. As a result of the evaluation based on the overall performance metric, it is seen that the XGBoost model, whose performance was previously proven by the F1 score ranking, stands out among the other models with its high overall performance of 65.13 %. The obtained result was compared with the results of similar studies in the literature.
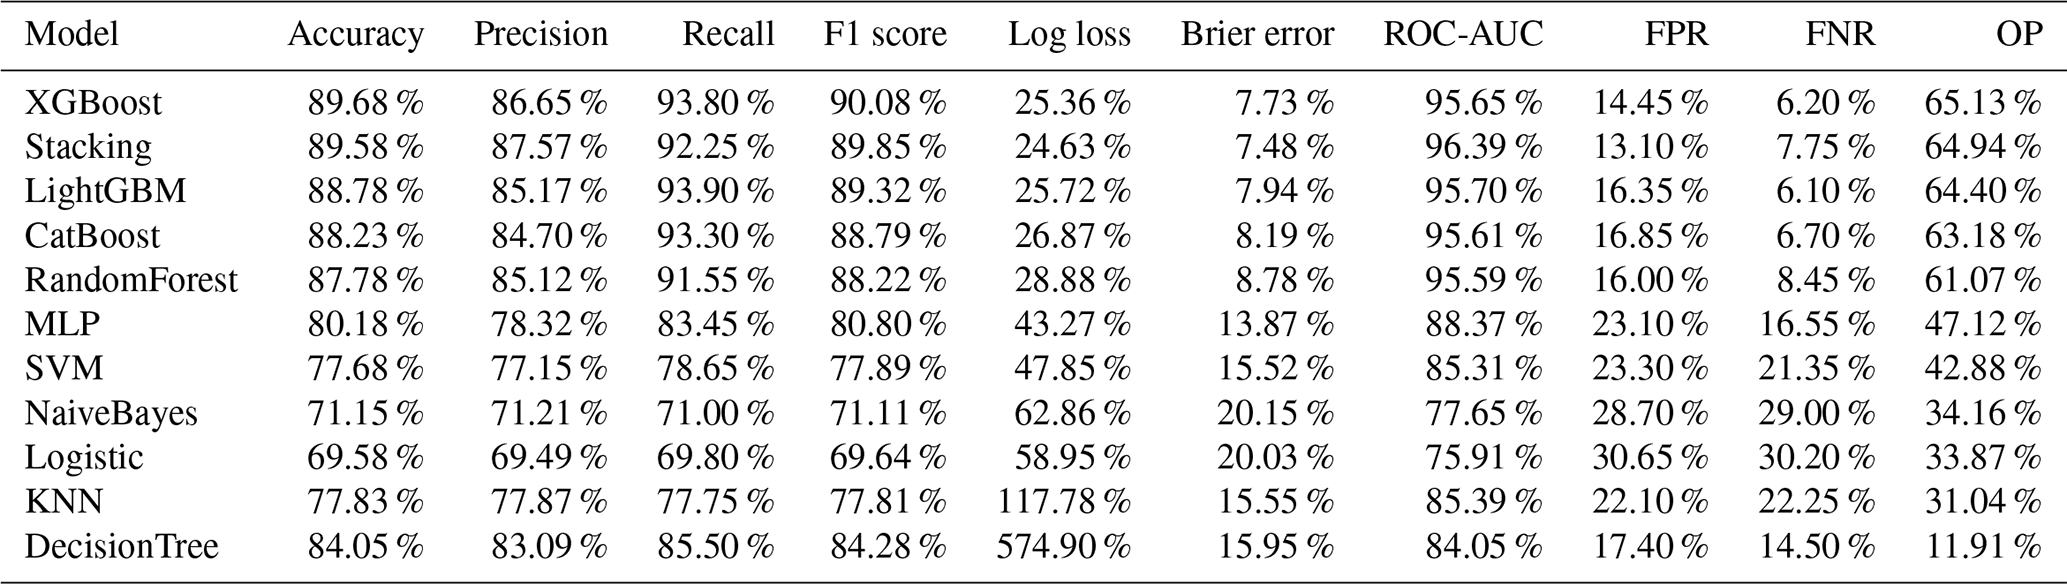
The results obtained in the articles in the literature are included in Table 10. However, the success and error metrics provided in the literature are insufficient to fill the table, and overall performance (OP) values could not be calculated. Similarly, Puruncajas et al. (2025)'s artificial neural network (ANN) model and the CPEM study's combined probability estimation model did not provide any scores and were therefore not directly included in the table.
This emphasizes that a direct quantitative comparison between the SWTFPS and the historical studies compiled in Table 10 is subject to physical and data-structural limitations. These studies employ heterogeneous datasets with different temporal resolutions (ranging from real-time streams to 10 min SCADA intervals), physical architectures of vastly different scales, and differing operational failure definitions.
However, Table 10 serves as a vital diagnostic gap analysis. The empty “OP” column for all prior studies highlights a major limitation in current wind turbine literature: researchers frequently report isolated success-oriented metrics (such as high accuracy) but fail to disclose critical indicators of model reliability, such as prediction uncertainty (LogLoss), calibration error (Brier score), or false rates. This systemic omission makes calculating their overall performance (OP) impossible. Consequently, Table 10 is presented not to claim absolute mathematical superiority over structurally different datasets but to demonstrate the critical necessity of our proposed OP metric as a comprehensive, transparent, and unified benchmarking standard for future predictive maintenance research.
The data collected by the prototype were labeled by XGBoost, which is the best model obtained from SCADA data. After the newly labeled dataset was retrained, LightGBM was selected as the best performing model with 98.37 % accuracy, 99.16 % F1 score, 98.95 % ROC-AUC, and 94.65 % OP scores. Table 11 shows the comparison between the models trained with the data collected from the prototype. Figure 14a and b show the feature importance and SHAP plots, respectively, obtained from the LightGBM model results. According to the feature importance result, the newly added sensors, gas and sound level sensors, were observed as significant predictors of failure output, while vibration was observed as a moderate predictor. The fact that the newly added sensors enabled the model to achieve a 98.86 % F1 score (and 94.65 % OP) indicates that they have a high prediction performance above failure prediction.
Table 11Data model overall performance comparison of labeled prototype.
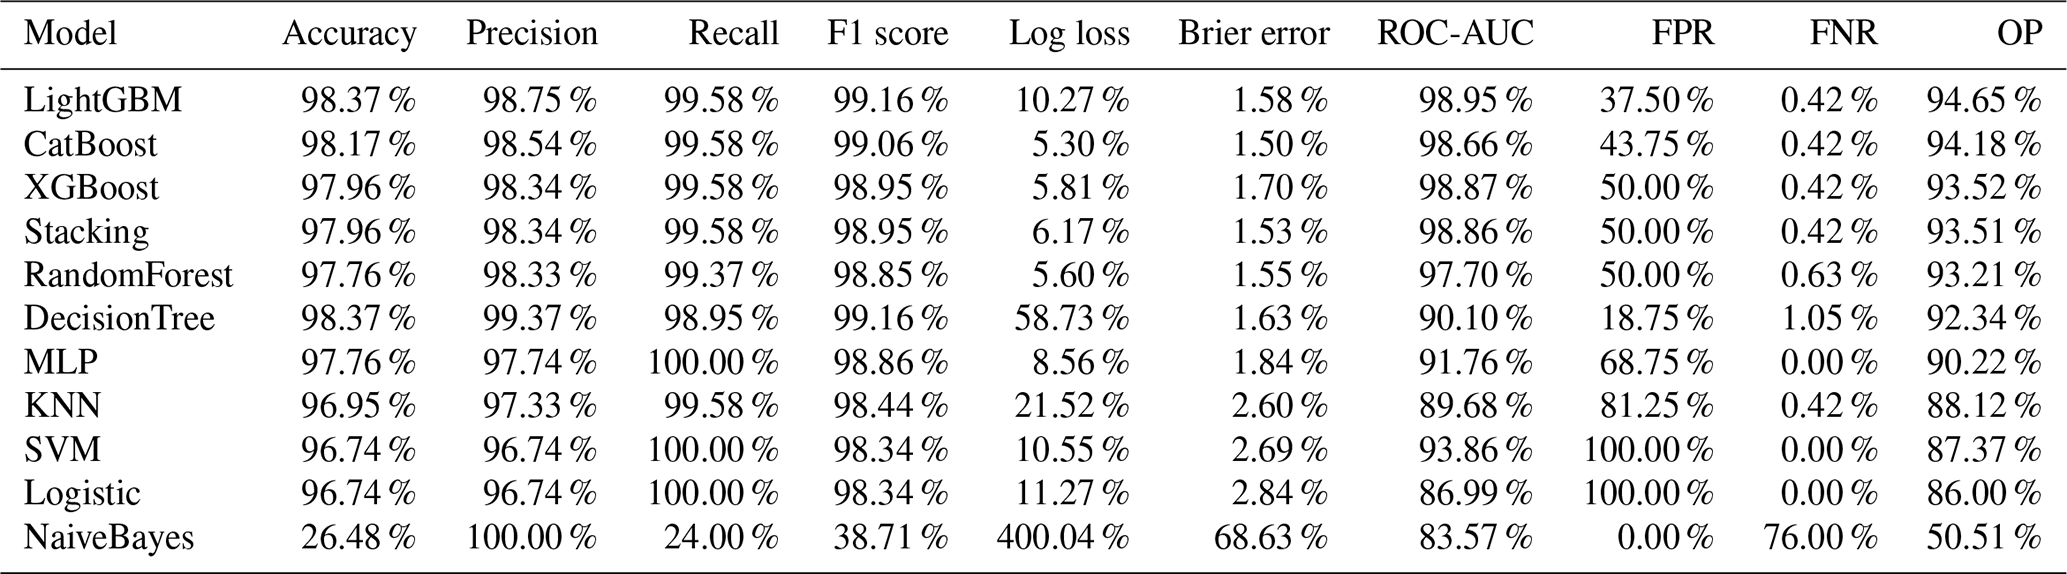
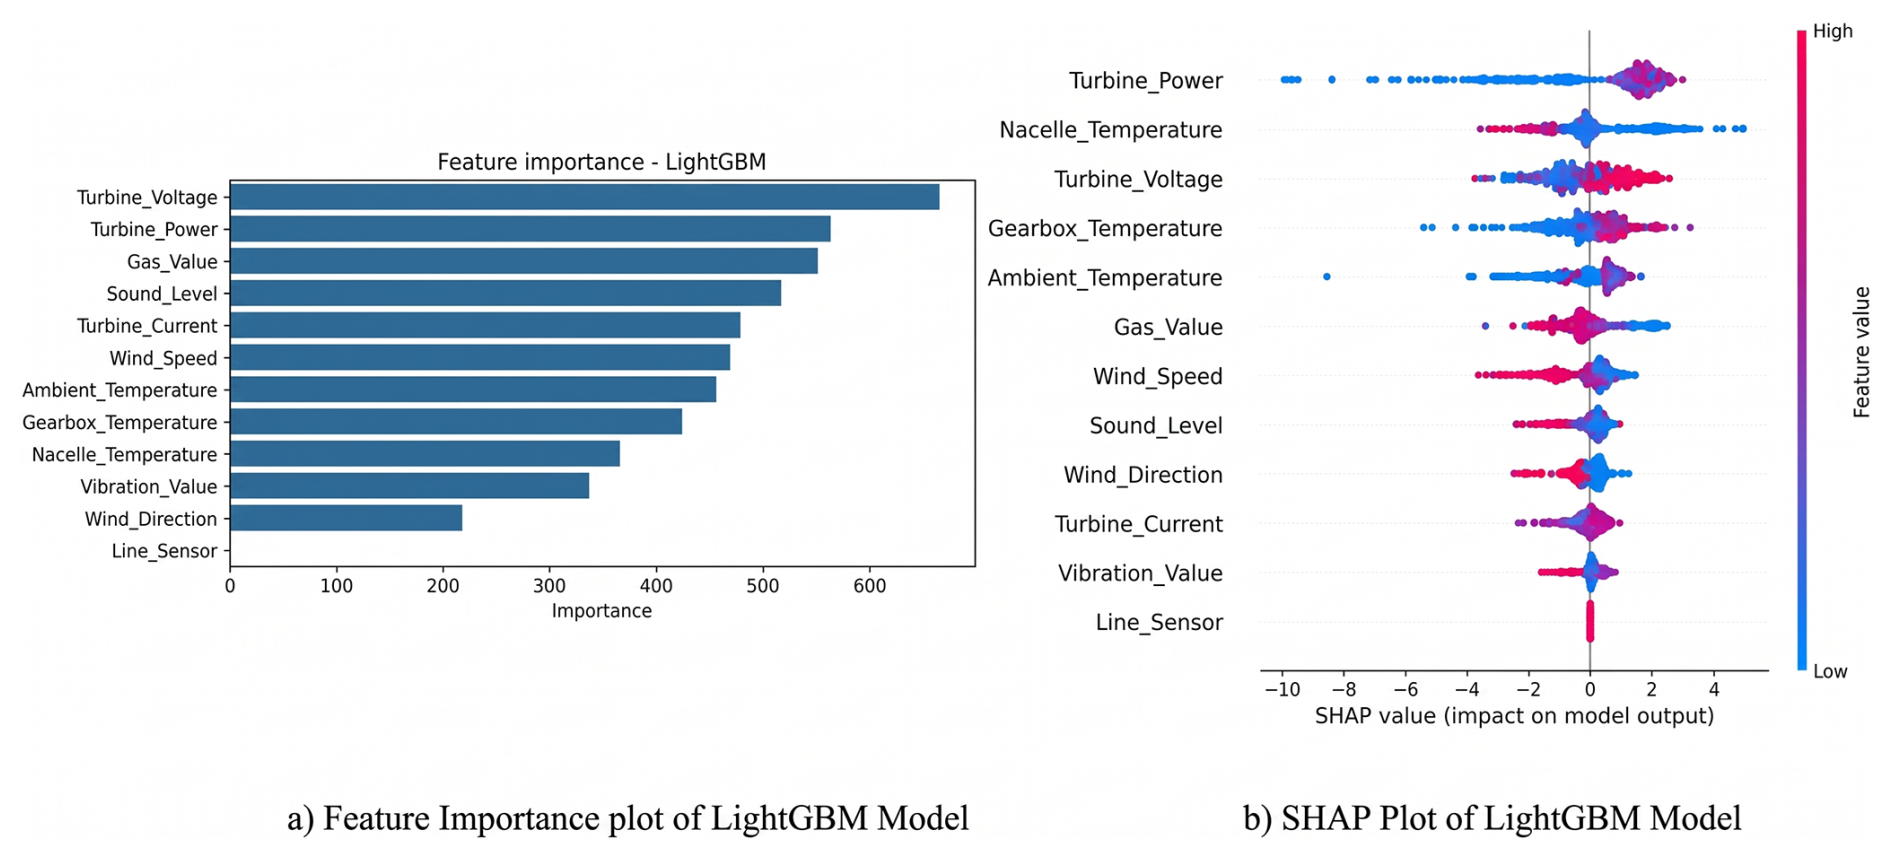
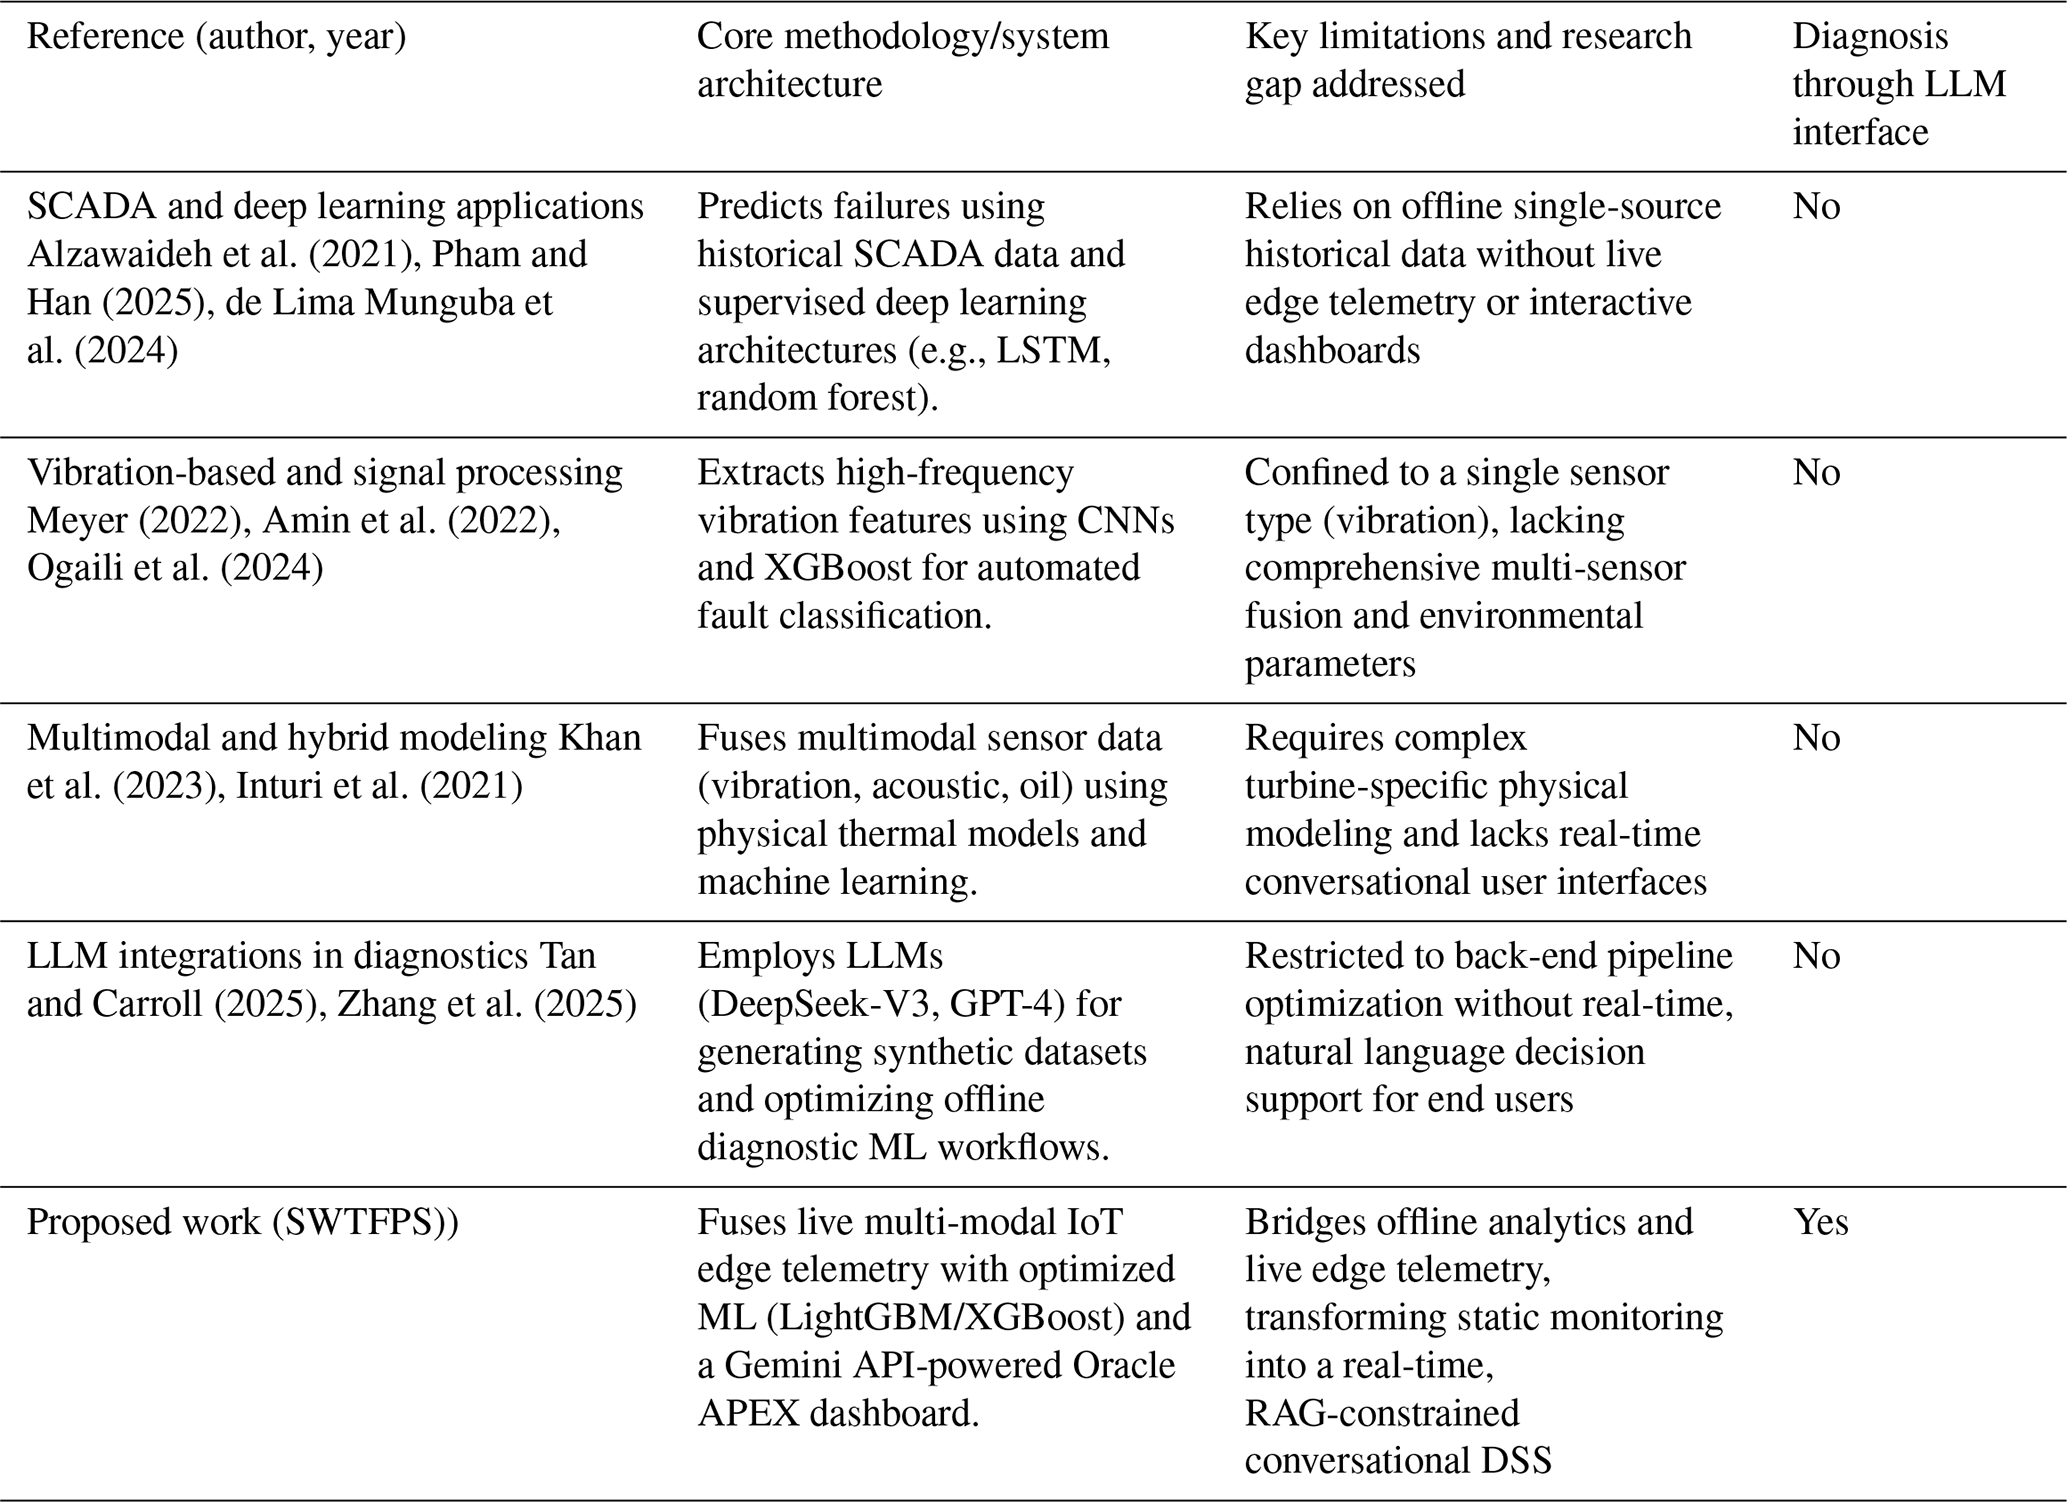
Table 12 presents a systematic comparison of the proposed SWTFPS against recent literature across four key domains: SCADA-based deep learning, vibration signal processing, multimodal fusion, and LLM diagnostics, highlighting the specific research gaps our end-to-end interactive architecture addresses.
Table 12Chronological literature review and research gap analysis.
6.2 LLM decision support case studies
To evaluate the practical correctness, verifiability, and operational usefulness of the LLM assistant, physical anomaly simulations have been conducted on the hardware prototype. By deliberately inducing specific fault conditions, the LLM's ability to translate the grounded sensor telemetry (as defined in Sect. 4.1) has been assessed into accurate and actionable maintenance directives.
Case study 1: induced mechanical obstruction (generator jamming).
-
Physical simulation. An artificial high-velocity airflow was applied directly to the anemometer using external equipment, simulating strong wind conditions. Simultaneously, a physical obstruction was intentionally placed against the turbine blades, preventing rotation and energy generation.
-
System telemetry and processing. The sensors recorded a high wind speed (>15 km h−1), while the power and voltage sensors registered near-zero outputs (Volt <0.1 V). The Python back-end successfully intercepted this physical discrepancy, matching it against the “generator jamming” rule in the deterministic matrix, and flagged a mechanical fault.
-
LLM output. The AI assistant immediately issued a critical alert: “Warning: A severe discrepancy is detected. High wind speeds are present, but turbine voltage is critically low (near 0 V). This indicates a generator jamming event or severe rotor obstruction. Immediate Action: Halt the system and visually inspect the blades and rotor–generator coupling for physical blockages.”
-
Evaluation. This case demonstrates high correctness and usefulness. Instead of merely reporting “0 V” or guessing the fault, the LLM accurately diagnosed the mechanical contradiction (wind vs. power) based on the grounded context. It provided a precise, physically verifiable recommendation that would prevent an operator from assuming the lack of power was due to low wind.
Case study 2: induced thermal anomaly (critical overheating).
-
Physical simulation. An external heat-generating device was applied directly to the nacelle temperature sensor, artificially forcing the localized temperature to rise rapidly beyond the critical safety threshold of 50 °C.
-
System telemetry and processing. As the nacelle temperature crossed 50 °C, the system recognized a thermal breach (T3 > 50 °C), bypassing the standard machine learning inference with a hard-coded safety override for “critical overheating”.
-
LLM output. The LLM responded with an emergency diagnostic message: “CRITICAL ALERT: The nacelle temperature has exceeded safe operational limits (Current: >50 °C). Risk of severe component degradation or fire. Immediate Action: Initiate an emergency thermal shutdown and activate cooling protocols. Do not restart until the nacelle environment stabilizes.”
-
Evaluation. This test verifies that the LLM reliably adheres to strict industrial safety boundaries without hallucinating secondary non-existent mechanical faults. The output is highly useful as it instantly transitions a numerical threshold breach into an explicit emergency protocol, significantly reducing operator reaction time.
6.3 Limitations
Although SWTFPS is a successful prototype, it has some limitations for real-world use. Specifically, the prominent 98.37 % classification accuracy reported for the prototype must be interpreted with academic caution. Because the prototype data were annotated using pseudo-labels generated by the SCADA-trained model rather than independent physical fault verification, this high accuracy primarily reflects the model's capacity to generalize and refine the “teacher” model's decision boundaries. Consequently, this pipeline may inherit and propagate the inherent predictive biases or limitations of the baseline classifier. Recognizing this as a key limitation, our findings should be viewed as a proof-of-concept for multi-modal sensor enrichment rather than a definitive clinical validation of absolute physical accuracy. Second, there is a significant difference between our small prototype and massive industrial turbines; therefore, sensor patterns such as vibration and temperature may not perfectly match those of industrial systems. Third, the affordable sensors and ESP32 microcontrollers used are great for research but may not be sufficiently reliable or durable for the harsh environmental conditions of real wind farms.
SWTFPS has successfully bridged the gap between industrial SCADA data and an IoT prototype. It demonstrates that strategic data enhancement and a balanced seven-feature model are highly effective in fault prediction. The key achievements are summarized as follows.
-
Integrated LLM. Developed an LLM-centered interface that allows operators to communicate with the system that provides recommendations in natural language
-
Real-rime data architecture. Successfully established a live data collection that integrates traditional SCADA data with a wide array of new-generation sensor data, proving that systems can operate in full synchronization for real-time monitoring
-
Optimized performance via hybrid AI. Conducted a comprehensive comparison of multiple machine learning algorithms; by implementing centroid-based K means balancing to eliminate data bias, the XGBoost model was optimized to achieve superior performance metrics: accuracy 89.68 %, F1 score 90.08 %, ROC-AUC 95.65 %, and overall performance 65.13 %, while the retrained model using the LightGBM algorithm achieved 98.37 % accuracy, 99.16 % F1 score, 98.95 % ROC-AUC, and 94.65 % overall performance
To further develop the system, future work will focus on advanced diagnosis and deep learning for sub-categorization of specific mechanical faults, edge computing and sensor fusion for running models directly on offline hardware, and digital twin integration for developing a 3D digital twin to provide a comprehensive visual monitoring experience.
The raw dataset analyzed in this study was originally published by Kasimov (2024) and is publicly available at https://www.kaggle.com/datasets/azizkasimov/wind-turbine-scada-data-for-early-fault-detection (last access: 29 May 2026). The source code used for data preprocessing, model training, and generating the figures presented in this article is archived on Zenodo at https://doi.org/10.5281/zenodo.23441230 (Ak et al., 2026).
MHÖ and MSÜ contributed to the conceptualization and methodology of the study, supervised the research process, managed project administration, acquired funding, and reviewed and edited the article. SM conducted the investigation, developed the software and hardware, provided resources, curated the data, and reviewed and edited the article. İGS contributed to software development, conducted the investigation, curated the data, performed visualization and formal analysis, prepared the original draft of the article, and reviewed and edited the article. BA curated the data, performed formal analysis, contributed to software development and investigation, and reviewed and edited the article.
The contact author has declared that none of the authors has any competing interests.
Publisher's note: Copernicus Publications remains neutral with regard to jurisdictional claims made in the text, published maps, institutional affiliations, or any other geographical representation in this paper. The authors bear the ultimate responsibility for providing appropriate place names. Views expressed in the text are those of the authors and do not necessarily reflect the views of the publisher.
The authors would like to express their sincere gratitude to Dokuz Eylül University, particularly the Department of Computer Engineering, for providing the necessary laboratory facilities, technical infrastructure, and academic support throughout this research. We are especially thankful to the faculty members and technical staff of the department for their valuable guidance, insightful suggestions, and continuous encouragement during the development of the prototype and experimental studies. We also extend our appreciation to Yaşar University for their academic contributions. This work would not have been possible without the collaborative research environment and resources provided by these institutions. The authors utilized VSCode Copilot (GPT-5.4 Mini architecture) to assist with code generation and adapting figures for color accessibility. Additionally, Gemini and Grammarly were used to refine the academic language and grammar of the article. The authors thoroughly reviewed and take full responsibility for the final content.
This paper was edited by Shawn Sheng and reviewed by two anonymous referees.
Ak, B., Saygı, I. G., and Mahyanbakhshayesh, S: SaraMahyan/SWTFPS_Wind-Turbine-Failure-Prediction: A real-time IoT, LLM, AI-supported wind turbine failure prediction system (Version v1.0.0), Zenodo [computer software], https://doi.org/10.5281/zenodo.23441231, 2026.
Alzawaideh, B., Baboli, P. T., Babazadeh, D., Horodyvskyy, S., Koprek, I., and Lehnhoff, S.: Wind turbine failure prediction model using SCADA-based condition monitoring system, in: 2021 IEEE Madrid PowerTech, Madrid, Spain, 28 June–2 July 2021, 1–6, IEEE, https://doi.org/10.1109/PowerTech46648.2021.9495087, 2021.
Amin, A., Bibo, A., Panyam, M., and Tallapragada, P.: Vibration based fault diagnostics in a wind turbine planetary gearbox using machine learning, Wind Eng., 47, 175–189, https://doi.org/10.1177/0309524x221123968, 2022.
Corley, B., Koukoura, S., Carroll, J., and McDonald, A.: Combination of thermal modelling and machine learning approaches for fault detection in wind turbine gearboxes, Energies, 14, 1375, https://doi.org/10.3390/en14051375, 2021.
de Lima Munguba, C. F., Ochoa, A. A. V., Leite, G. D. N. P., da Costa, A. C. A., da Costa, J. Â. P., de Menezes, F. D., and de Souza, M. G. G.: Fault detection framework in wind turbine pitch systems using machine learning: Development, validation, and results, Eng. Appl. Artif. Intell., 138, 109307, https://doi.org/10.1016/j.engappai.2024.109307, 2024.
Hsu, J. Y., Wang, Y. F., Lin, K. C., Chen, M. Y., and Hsu, J. H. Y.: Wind turbine fault diagnosis and predictive maintenance through statistical process control and machine learning, IEEE Access, 8, 23427–23439, 2020.
Inturi, V., Shreyas, N., Chetti, K., and Sabareesh, G.: Comprehensive fault diagnostics of wind turbine gearbox through adaptive condition monitoring scheme, Appl. Acoust., 174, 107738, https://doi.org/10.1016/j.apacoust.2020.107738, 2021.
Irfan, M., Khan, N. A., Abubakar, M., Mushtaq, Z., Jakubowski, T., Sokołowski, P., Nawalany, G., and Rahman, S.: Design of a novel noise resilient algorithm for fault detection in wind turbines on supervisory control and data acquisition system, Sci. Rep., 15, 13308, https://doi.org/10.1038/s41598-025-97663-3, 2025.
Islam, M. M., Rifat, H. R., Shahid, M. S. B., Akhter, A., Uddin, M. A., and Uddin, K. M. M.: Explainable machine learning for efficient diabetes prediction using hyperparameter tuning, SHAP analysis, partial dependency, and LIME, Eng. Rep., 7, e13080, https://doi.org/10.1002/eng2.13080, 2025.
Kasimov, A.: Wind turbine SCADA data for early fault detection (Version 1), Kaggle [data set], https://www.kaggle.com/datasets/azizkasimov/wind-turbine-scada-data-for-early-fault-detection (last access: 29 May 2026), 2024.
Khan, P. W., Yeun, C. Y., and Byun, Y. C.: Fault detection of wind turbines using SCADA data and genetic algorithm-based ensemble learning, Eng. Fail. Anal., 148, 107209, https://doi.org/10.1016/j.engfailanal.2023.107209, 2023.
MathWorks: ThingSpeak: An IoT analytics platform service, https://thingspeak.com, last access: 29 May 2026.
Meyer, A.: Vibration fault diagnosis in wind turbines based on automated feature learning, Energies, 15, 1514, https://doi.org/10.3390/en15041514, 2022.
Naidu, G., Zuva, T., and Sibanda, E. M.: A review of evaluation metrics in machine learning algorithms, in: Artificial Intelligence Application in Networks and Systems, CSOC 2023, Lecture Notes in Networks and Systems, vol. 724, edited by: Silhavy, R. and Silhavy, P., Springer, Cham, 15–25, https://doi.org/10.1007/978-3-031-35314-7_2, 2023.
Ogaili, A. A. F., Hamzah, M. N., and Jaber, A. A.: Enhanced fault detection of wind turbine using extreme gradient boosting technique based on nonstationary vibration analysis, J. Fail. Anal. Prev., 24, 877–895, 2024.
Oracle Corporation: Oracle APEX Documentation, Release 26.1, Oracle Corporation, https://oracleapex.com/ords/r/apex/workspace-sign-in (last access: 29 May 2026), 2026.
Pham, D. A. and Han, S. H.: Advanced Machine Learning Model Based on Bi-LSTM and Attention Mechanism for Fault Detection in Wind Turbine Systems, J. Electr. Eng. Technol., 20, 5429–5442, https://doi.org/10.1007/s42835-025-02373-5, 2025.
Puruncajas, B., Castellani, F., Vidal, Y., and Tutivén, C.: Use of artificial neural networks and SCADA data for early detection of wind turbine gearbox failures, Machines, 13, 746, https://doi.org/10.3390/machines13080746, 2025.
Santiago, R. A. D. F., Barbosa, N. B., Mergulhão, H. G., Carvalho, T. F. D., Santos, A. A. B., Medrado, R. C., and Nascimento, E. G. S.: Data-driven models applied to predictive and prescriptive maintenance of wind turbine: A systematic review of approaches based on failure detection, diagnosis, and prognosis, Energies, 17, 1010, https://doi.org/10.3390/en17051010, 2024.
Tan, Y. W. and Carroll, J.: LLMs in Wind Turbine Gearbox Failure Prediction, Energies, 18, 4659, https://doi.org/10.3390/en18174659, 2025.
Yu, X., Tang, B., and Zhang, K.: Fault diagnosis of wind turbine gearbox using a novel method of fast deep graph convolutional networks, IEEE T. Instrum. Meas., 70, 1–14, https://doi.org/10.1109/tim.2020.3048799, 2021.
Zeng, X., Yang, M., Feng, C., and Tang, Y.: A generalised wind turbine anomaly detection method based on combined probability estimation model, J. Mod. Power Syst. Clean Energy, 11, 1136–1148, https://doi.org/10.35833/MPCE.2022.000270, 2023.
Zhang, G., Li, Y., and Zhao, Y.: A novel fault diagnosis method for wind turbine based on adaptive multivariate time-series convolutional network using SCADA data, Adv. Eng. Inform., 57, 102031, https://doi.org/10.1016/j.aei.2023.102031, 2023.
Zhang, Y., Zhao, Z., Zhang, D., and Dai, J.: Optimisation of Large Language Models with Multi-modal Data Training for Fault Diagnosis in Wind Turbine Systems, in: Proceedings of the 2025 IEEE International Conference on Power Electronics and Energy (PEE), 172–176, https://doi.org/10.1109/peed63748.2025.00038, 2025.
Zhang, Z. Y. and Wang, K. S.: Wind turbine fault detection based on SCADA data analysis using ANN, Adv. Manuf., 2, 70–78, https://doi.org/10.1007/s40436-014-0061-6, 2014.
- Abstract
- Introduction
- Related works
- Materials and methods: system architecture
- SWTFPS: LLM-based interactive user interface
- Results and comparison of model performances
- Discussion and limitations
- Conclusion and future work
- Code and data availability
- Author contributions
- Competing interests
- Disclaimer
- Acknowledgements
- Review statement
- References