the Creative Commons Attribution 4.0 License.
the Creative Commons Attribution 4.0 License.
 | 09 Feb 2026
Design of fatigue-based specifications for the design of controllers in wind turbines
Irene Miquelez-Madariaga
Jesús Arellano
Daniel Lacheta-Lecumberri
Jorge Elso
Pitch controllers are critical components in wind turbines, and their design typically involves lengthy iterative processes of tuning and simulation-based validation. Using well-defined control specifications, rigorously linked to engineering requirements, can significantly reduce the effort needed to achieve optimal performance. This work presents a methodology for generating control specifications directly related to mechanical fatigue caused by driving loads in wind turbine applications. The method is tailored for frequency-domain controller design techniques, such as quantitative feedback theory (QFT) and H∞, and is based on Dirlik's method for fatigue assessment. It is tested through the design of controllers for a reference 15 MW wind turbine operating above rated conditions. The specification-driven design results in a validated reduction in fatigue, with simulation outcomes showing a mean error of 1.07 % between the fatigue value predicted by the specifications and the one obtained from simulations.
- Article
(3162 KB) - Full-text XML
- BibTeX
- EndNote


The design of wind turbines is an inherently multi-objective problem. To reduce the levelised cost of energy (LCoE; Bruck et al., 2018), wind turbines should be designed to maximise the generated power and to minimise design, production, and operation expenses. When focusing on the control strategies, these main objectives are translated into maximising generated power, regulating the generator speed, and reducing the driving mechanical loads.
However, controller design is still somewhat disconnected from the evaluation of its performance. According to the IEC 61400 standard (IEC, 2020), mechanical fatigue must be assessed using aeroelastic simulation of turbulent wind fields. The generation of the wind fields and their simulation are time-consuming steps incompatible with a swift workflow. Moreover, to get the fatigue indicator, load cycles are quantified using the nonlinear rainflow-counting algorithm and the Wöhler curve.
All in all, a gap exists between the controller design environment, which oftentimes uses linear frequency-domain models for the wind turbine and for the wind (Kaimal et al., 1972; Mann, 1998; Song et al., 2022; Singh et al., 2016), and the evaluation environment, which requires nonlinear time-domain simulations. Some work has been done to solve this problem for a general wind turbine design application (Tibaldi et al., 2016; Pao et al., 2024), but it has not targeted the design of control specifications – a key step in the design of controllers. The main contribution of this article is a method for the design of fatigue-based control specifications using linear models. The proposed solution has two main characteristics: (1) it identifies the range of frequencies in which the specification contributes more to the overall fatigue, and (2) it quantifies the expected fatigue decrease when a change in the specification or the controller is introduced.
In Sect. 2, the context on fatigue evaluation is presented, focusing on frequency-domain methods. Then, in Sect. 3, the main contribution of this work is described, namely a method for obtaining control specifications based on the sensitivity of the damage equivalent load to changes in the signal spectrum. Section 4 validates the method on the design of controllers for a 15 MW wind turbine. Lastly, Sect. 5 summarises the main results and conclusions of the work.
The IEC 61400 standard for the design of wind turbines (IEC, 2020) states that the mechanical damage caused by fatigue in a specific wind turbine configuration must be evaluated by the simulation of turbulent wind fields at different operating points using an aeroelastic model of the wind turbine. Each of the simulations produces a realistic time series of the mechanical loads. Then, the number and amplitude of the load cycles are computed using a rainflow-counting algorithm. Finally, the total accumulated damage is obtained by using the Wöhler curve (Wöhler, 1870) and a Palmgren–Miner linear damage hypothesis (Suresh, 1998).
Although this process is compulsory to ultimately certify a wind turbine configuration, the same is not true during the intermediate step of controller design. Firstly, mechanical damage does not have an explicit relation with most design parameters, which means that the effect of a change in the design is unknown until tested in simulation. Additionally, the generation of wind fields and their simulation in the aeroelastic model are time-consuming steps that prevent the design process from being agile, especially due to its iterative nature.
The literature on fatigue assessment includes a set of methods that approximate fatigue with expressions that depend on the spectral properties of the load. The most basic approximation is the narrow-band method (Wirsching and Light, 1980), an analytic method that provides an estimation of the fatigue damage in structures subjected to random stress processes. The method assumes that the stress process has a narrow band, thus simplifying the analysis by treating the stress cycles as approximately sinusoidal with a constant amplitude and frequency. The method estimates the number of stress cycles and their respective amplitudes using the properties of the narrow-band random process. Then, the damage caused by fatigue ΔDNB is
where ν0 is the zero-crossing rate, N0 is a normalisation factor related to the number of cycles, S0 is the spectral width parameter, m0 is the zeroth spectral moment, Γ() is the Gamma function, and k is a material exponent of the S–N curve.
Most of the existing methods are variations of the narrow-band method, which offer more precise results for wide-band processes (Benasciutti and Tovo, 2005; Benasciutti, 2012). They often follow an empirical approach and are precise when the analysed load is similar to the training data. Among these empirical solutions for frequency-domain fatigue assessment, Dirlik's work (Dirlik, 1985) is one of the most accurate and widely accepted ones. It is specifically designed to handle a wide range of frequency content. This method provides an efficient and accurate approach to predicting fatigue life by leveraging the statistical properties of the stress response. Dirlik uses a probabilistic approach to estimate the distribution of stress cycles, deriving an empirical formula for the probability density function (PDF) of stress ranges in a random loading process. Essentially, it uses the spectral properties of the load and the mechanical properties that define the Wöhler curve. The formula accounts for the distribution of peaks and valleys in the stress history, providing a detailed statistical description. The empirical formula for the PDF is given by
where Q is a parameter related to the peak factor, which is derived from the ratio of higher-order spectral moments and characterises the non-Gaussianity of the stress process, and R is the mean value of the stress process normalised by its standard deviation, describing the relative location of the process mean concerning the stress amplitude. G1, G2, and G3 are empirical expressions derived by Dirlik (1985) that depend on the spectral moments
where n is the order of the spectral moment, and S(ω) is the spectrum of the mechanical load.
The use of controllers in dynamic systems primarily aims to modify the behaviour of the system to achieve certain operational objectives. In this context, the design of the controller is based on a constraint known as the control specification.
In many design methodologies, this specification is expressed as a desired closed-loop frequency response, Wy(iω). In the specific case of wind turbines, closed-loop functions allow for the description of the wind's effect on relevant variables, such as the generator's rotational speed or critical mechanical loads that determine the system's lifespan. For example, the effect of wind on the generator speed (Ωg) is described by the closed-loop transfer function
and the effect of wind on the tower base load (MyT) is given by
where Py,u is the open-loop transfer function that relates input u(t) to output y(t).
However, setting specifications directly on mechanical loads is complex. This complexity arises due to the gap between the design environment – typically based on linear models in the frequency domain – and the controller performance evaluation environment, where metrics are based on cycle counting and fatigue damage estimation from time series obtained via simulation. As a result, iterative trial-and-error-based design strategies are often employed. In such cases, fatigue evaluation is conducted a posteriori for each controller version, which prolongs the design process.
Methods such as that of Dirlik (1985) (Eqs. 2 and 3) help accelerate these iterative cycles, as they provide a fatigue damage estimate from the output signal spectrum SMyT(ω). This spectrum, in turn, can be calculated using the closed-loop transfer function associated with the considered controller as follows:
where SW(ω) is the rotor effective wind spectrum.
Using the method of Dirlik (1985), along with Eqs. (5) and (6), improves the efficiency of the design process by eliminating the need to perform aeroelastic simulations for each iteration. However, it does not remove the iterative nature of the design–validation–redesign cycle. From a control engineering perspective, it is preferable to have ex ante specifications that explicitly relate the impact of a new specification to the expected fatigue damage. This way, once the control specifications are selected, the chosen design method would directly result in a satisfactory controller.
A straightforward way to represent the effect of modifying the specification on the expected fatigue is to compute the sensitivity of damage to variations in the output spectrum. Due to the complexity of Eq. (2), a numerical approximation of the derivative is used, based on an initial control configuration C0(iω), which results in an output spectrum Syy,0(ω) and fatigue damage D0. For greater generality, the initial configuration may also be the open-loop system (C0(iω)=0).
The sensitivity of fatigue damage, ΔD%(ω), is calculated as
by introducing a 1 % amplitude reduction in Syy(ω) at frequency ω0 for the whole frequency range in which the input spectrum is defined. There, is the damage associated with the modified spectrum. The function ΔD%(ω) allows us to identify the frequency range where modifying the specification will have the greatest impact.
Then, the change in fatigue damage caused by a specification modification can be calculated as
where is the spectral variation caused by a change in the specification and can be calculated as
Finally, Eq. (8) can be directly linked to the specification through the expression
In this way, the sensitivity ΔD%(ω) helps design the specification WMyT(iω) in two ways. First, it shows the range of frequencies in which a change in the specification has a greater impact on fatigue. Moreover, it allows us to quantify the impact of changing the specification on the fatigue by applying Eq. (10).
The validation of the method proposed in this work is performed by using quantitative feedback theory (QFT) for the design of linear controllers based on the fatigue specifications. The performance of the controllers is evaluated by their simulation in aeroelastic code (OpenFAST, 2024) and the post-processing of the resulting time series with a rainflow-counting algorithm. For that purpose, the 15 MW reference wind turbine with the Reference Open-Source Controller (ROSCO) (Abbas et al., 2022) is used.
4.1 System description
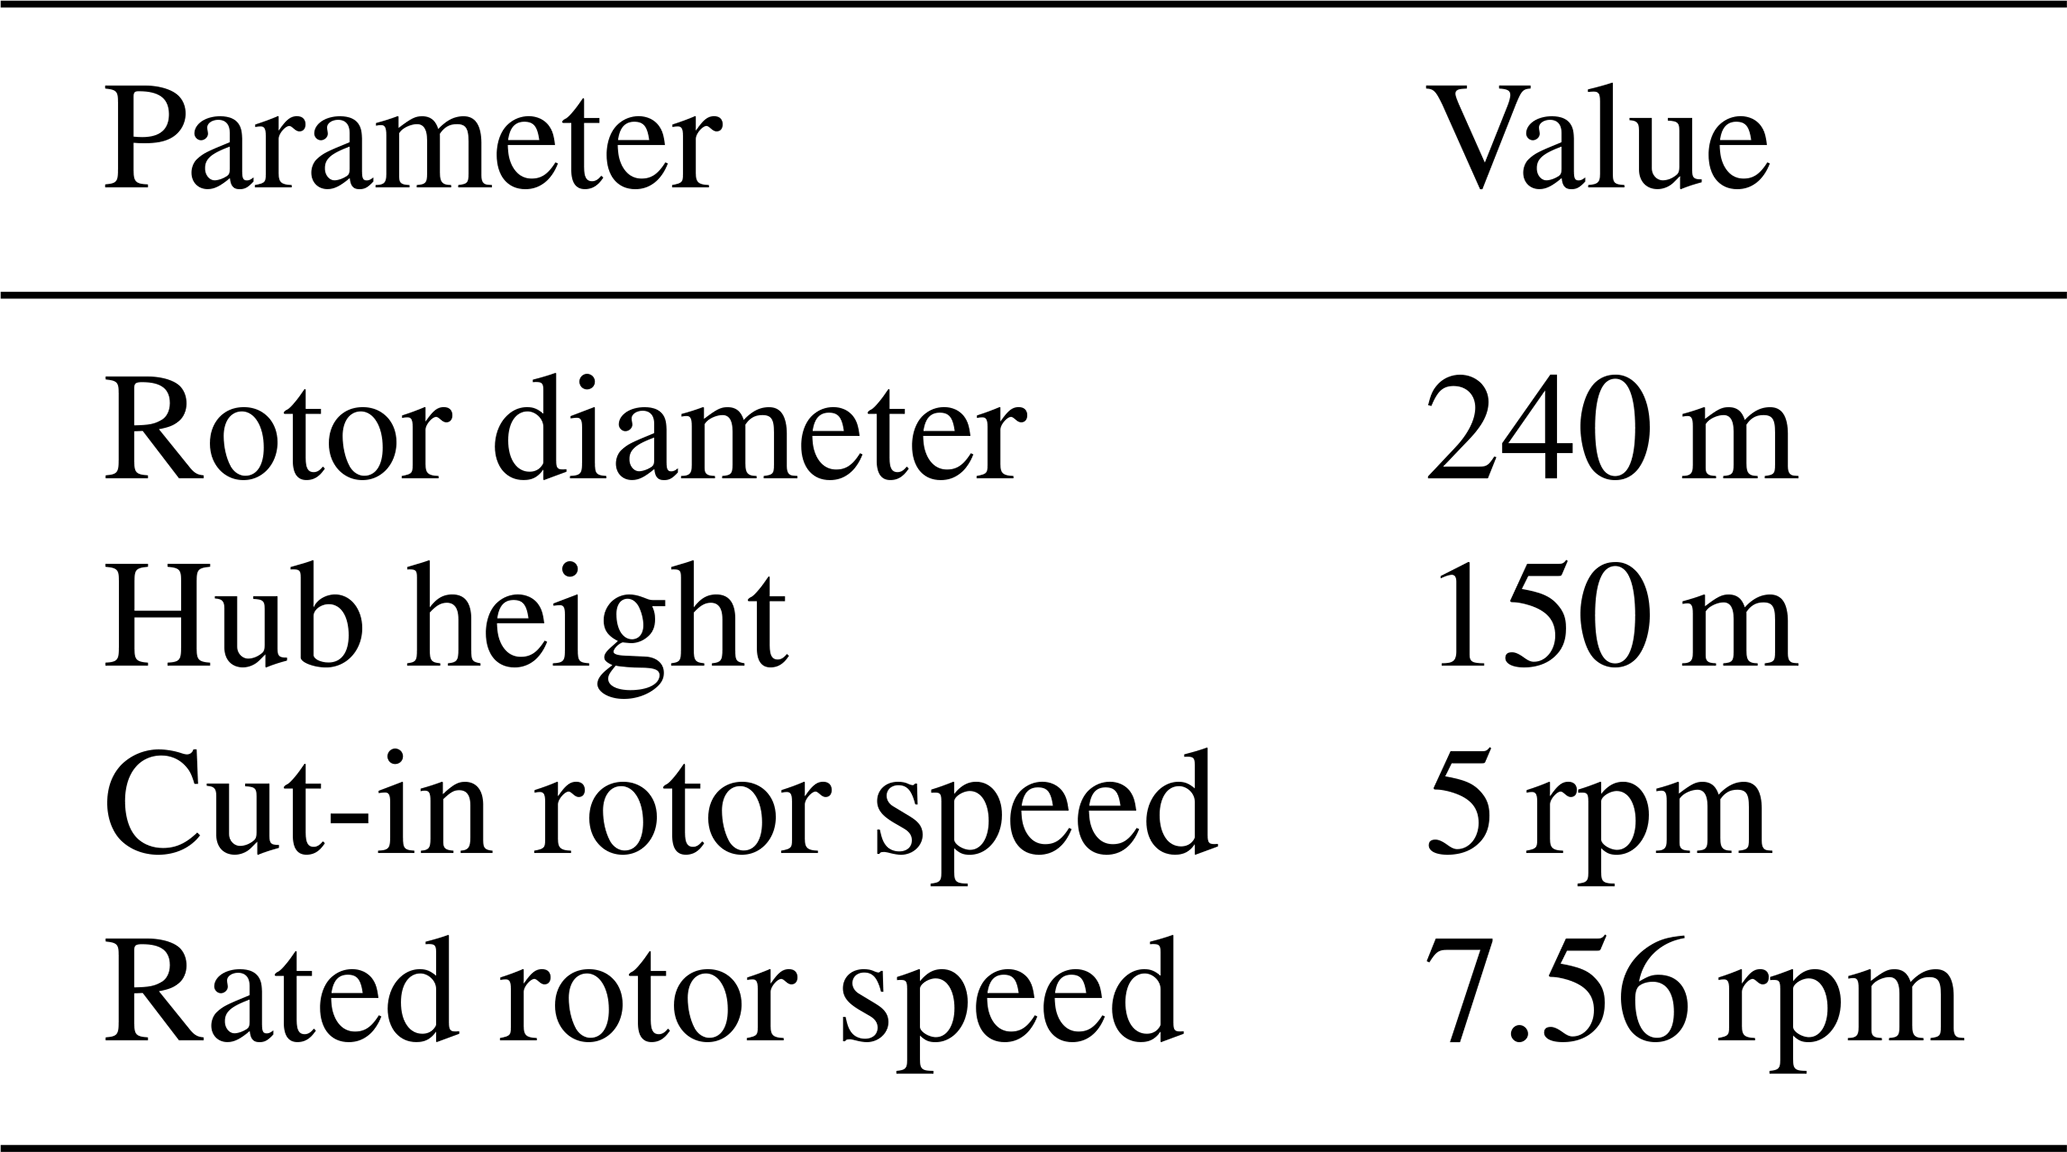
The wind turbine model used for this study is the IEA 15 MW reference wind turbine (Gaertner et al., 2020). This turbine is an offshore, monopile model with three blades and a horizontal axis. The most relevant parameters of the model are summarised in Table 1.
Table 1Value of the main parameters of the 15 MW reference wind turbine.
Initially, this wind turbine operates using the Reference Open-Source Controller (ROSCO) as a baseline control, which was developed to offer a modular control structure, with industry-level performance and compatibility with the OpenFAST design and simulation environment. ROSCO includes control strategies corresponding to the main operating regions of a wind turbine, from low-speed winds (Region 1) to above-rated wind speed (Region 3). There are two main control strategies, corresponding to pitch and torque controllers. Torque control is especially relevant at lower wind speeds, in which maximal power production is sought. ROSCO offers different strategies for below-rated operation, among which the quadratic control law has been chosen. Pitch control is used at above-rated wind speeds to ensure a constant generator speed and nominal power production.
For the purpose of this work, which is linear fatigue assessment, the analysis focuses on the above-rated operation. There, the control strategy consists of a set of linear controllers with scheduled gains to face the nonlinear dynamics of the wind turbine. Typically, these controllers follow a PI (proportional–integral) structure in which the integrator rejects the effect of wind in the lower frequencies, and the zero value increases the phase margin of the system. Figure 1 shows the magnitude plot of the PI controller (lower plot) operating at a 19 m s−1 wind speed and its effect on the generator speed and tower base load. The main effect of the controller can be appreciated in the generator speed plot. There, the red line, corresponding to ROSCO, shows the attenuation of the effect of wind on the generator speed at the lower frequencies.
Additionally, ROSCO includes switching, filtering, and load reduction strategies, such as active tower damping (ATD). The ATD strategy reduces tower base fatigue by actively damping the first fore–aft natural frequency at the tower base. The ATD has been deactivated in the baseline control version in order to test the proposed method for the design of control specifications and, more specifically, its accuracy when predicting the quantitative impact of the new specification. As a result, a significant reduction in fatigue is expected regardless of the chosen controller design methodology.
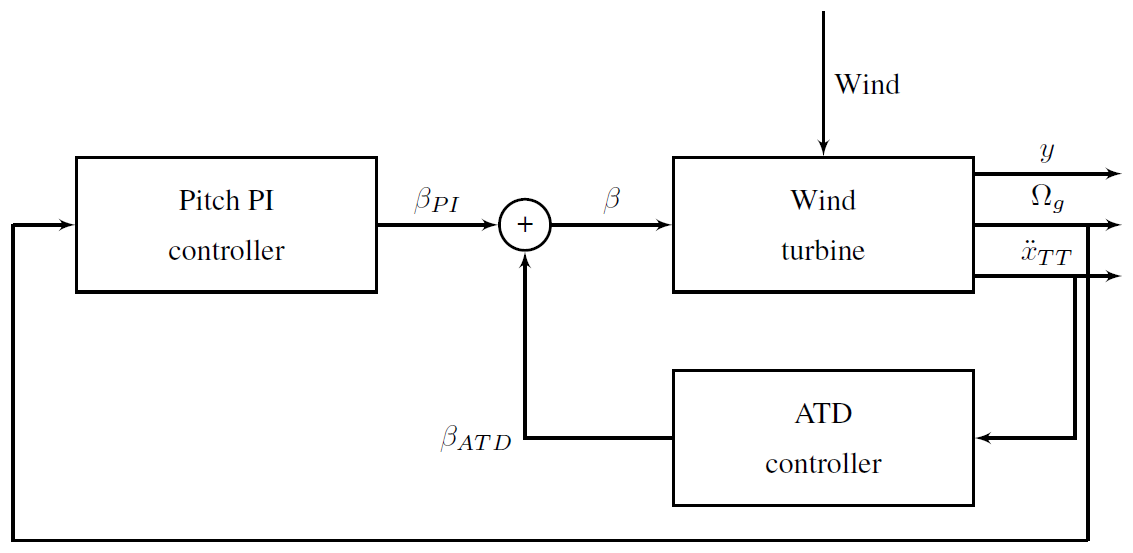
The open-loop linear models of the wind turbine were obtained with the aid of OpenFAST's linearisation tool, and the closed-loop models were calculated following the structure represented in Fig. 2.
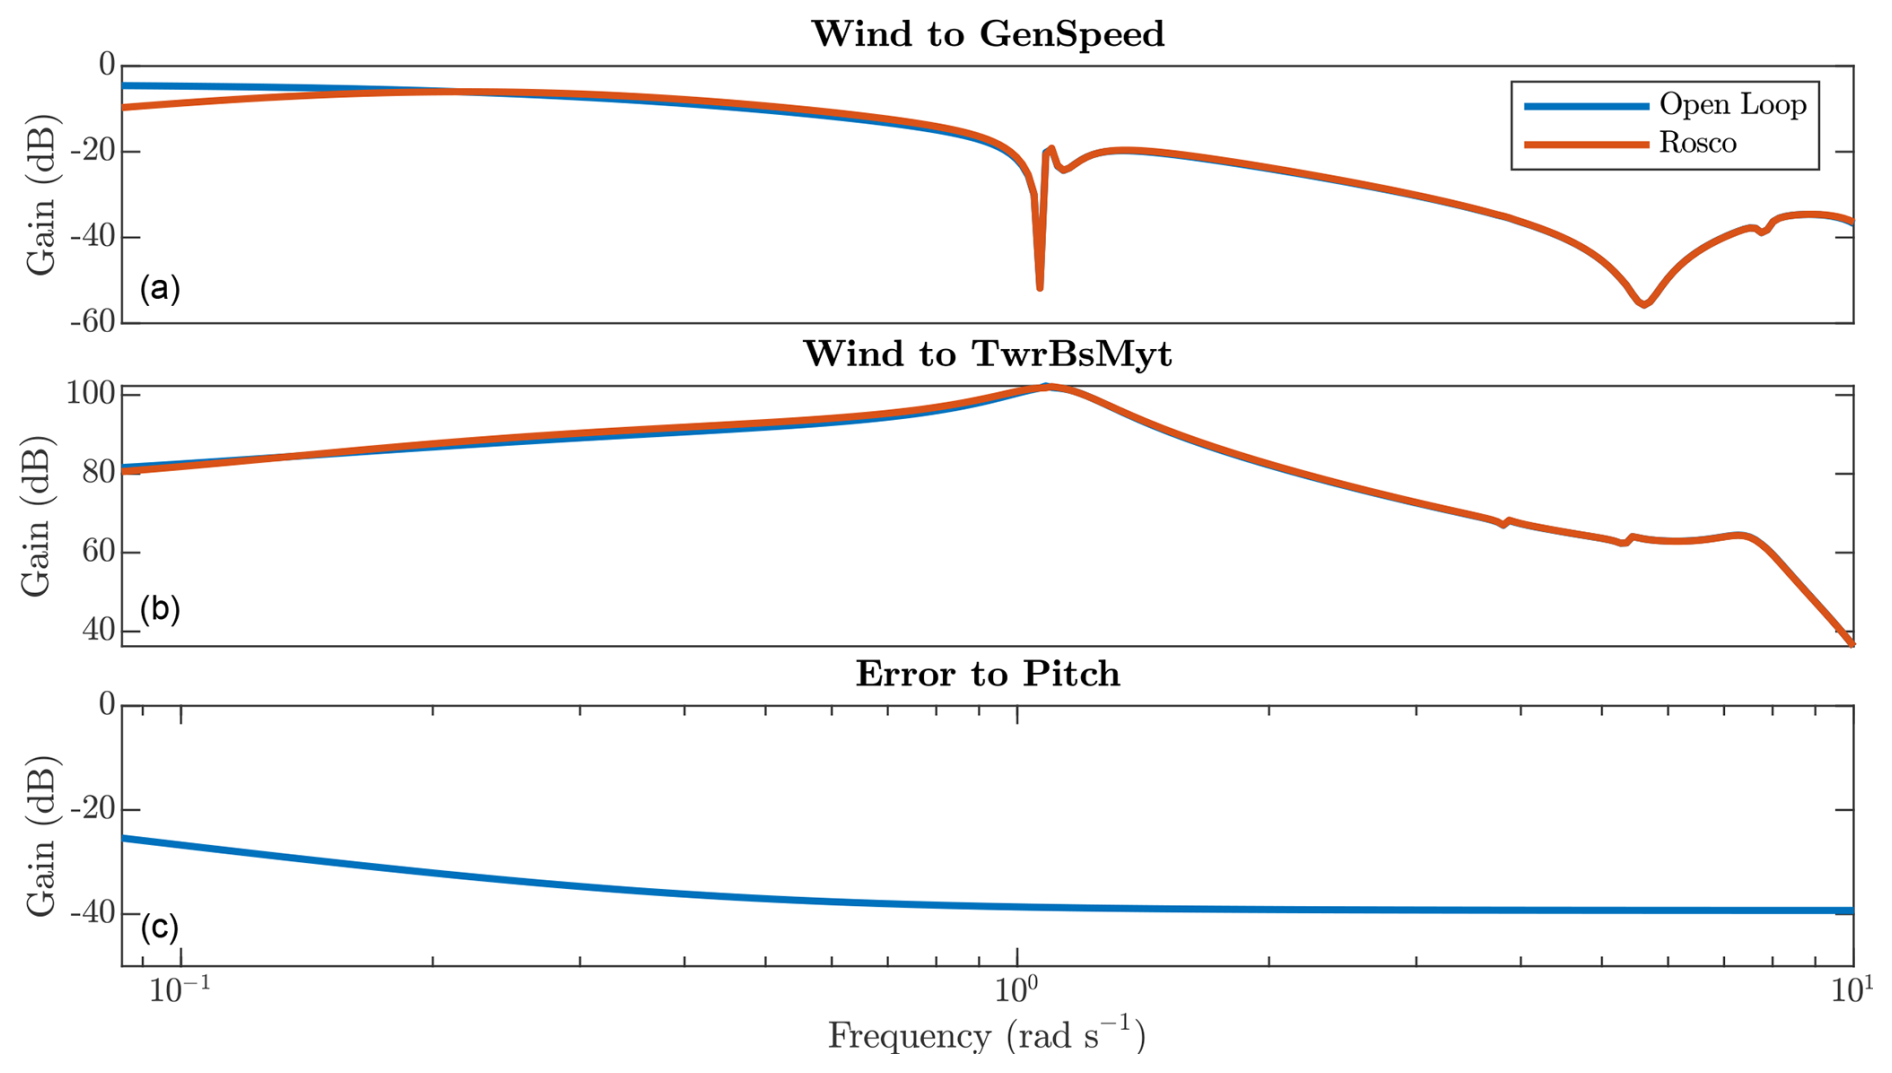
Figure 1Effect of ROSCO on the dynamics of the system. The upper plot shows the effect of the PI controller on the generator speed, which is more relevant at the lower frequencies. The middle plot shows the effect of the controller on the tower base bending moment. Lastly, the lower plot shows the magnitude of the feedback controller.
4.2 QFT fundamentals
Quantitative feedback theory is a controller design methodology that allows for the obtainment of robust, multivariable, and multi-objective solutions (Elso et al., 2017). The main steps in the design process are as follows:
-
Obtaining the model of the plant. QFT is based on the use of linear, frequency-domain models of the system. Robustness is achieved by using uncertain models during the design.
-
Selecting the design frequencies. QFT design is performed on a discrete set of frequencies as a reference. These frequencies should cover all the relevant dynamics of the system.
-
Choosing the specifications. In the context of QFT design for wind turbine controllers, control specifications are typically upper bounds on the closed-loop disturbance rejection function of the different control objectives. These upper bounds can be constant values or transfer functions and should ideally be linked to performance indicators such as the generator speed standard deviation or the mechanical fatigue of driving components. Moreover, a stability specification is imposed as an upper bound on the complementary sensitivity function.
-
Generation of bounds. At each design frequency, the regions of all controllers meeting each specification are found in the complex plane. The boundary of these regions in the complex plane, multiplied by the nominal plant, is called a bound. One bound is obtained per specification and design frequency.
-
Controller synthesis. Also known as loop shaping, controller synthesis consists of tuning the controller parameters until reaching the open-loop transfer function that lies within the bounds at every design frequency.
-
Checking the specifications. The first validation step uses the uncertain linear model of the plant to ensure that specifications are met at every frequency and not only at the design ones.
-
Simulation. If the linear uncertain model of the plane has been derived from a more complex model (i.e. a nonlinear one), as is the case for wind turbines, a second evaluation of the performance of the controllers is performed via simulation.
The whole process is carried out with the aid of the QFT Toolbox (Yaniv et al., 1997), which includes graphical tools for the design of specifications and the loop-shaping process. QFT is inherently an iterative method, especially when several controllers are being tuned at the same time, and requires some practice in the loop-shaping stage before a successful design can be obtained. On the other hand, it is a versatile and transparent methodology that grants engineers full control of the design process.
4.3 Controller design
The design of controllers starts with the design of the control specifications based on the procedure presented in Sect. 3. The first step consists of obtaining a set of simulations of the system with the baseline control. In particular, four wind seeds with a length of 600 s have been simulated at each operating point. Then, these simulations are used to calculate the output spectra and an initial fatigue evaluation. Lastly, the sensitivity of fatigue to changes in the tower base load spectrum ΔD% is calculated based on the simulation results.

Figure 3The different aspects of the relation between wind and the tower base load. The upper plot shows the magnitude of the closed-loop transfer function between wind and load . The middle plot, which represents the load power spectrum SMyT(ω), shows how the biggest amplitudes of the load appear at the lower frequencies. The lower plot represents the fatigue sensitivity ΔD%.
Figure 3 shows the relation between the magnitude Bode plot, the load spectrum, and the variation in fatigue for the simulations corresponding to a 19 m s−1 mean wind speed. While the Bode plot only holds information on the system response, the spectrum of the load includes information on the disturbance. Moreover, as the spectrum was obtained from simulation data, a peak can be observed at around 2.3 rad s−1, which corresponds to the 3P frequency. Lastly, the lower plot shows how the lower frequencies have a greater impact on fatigue, but the peaks corresponding to the first fore–aft mode of the tower and the 3P frequency are also relatively relevant.
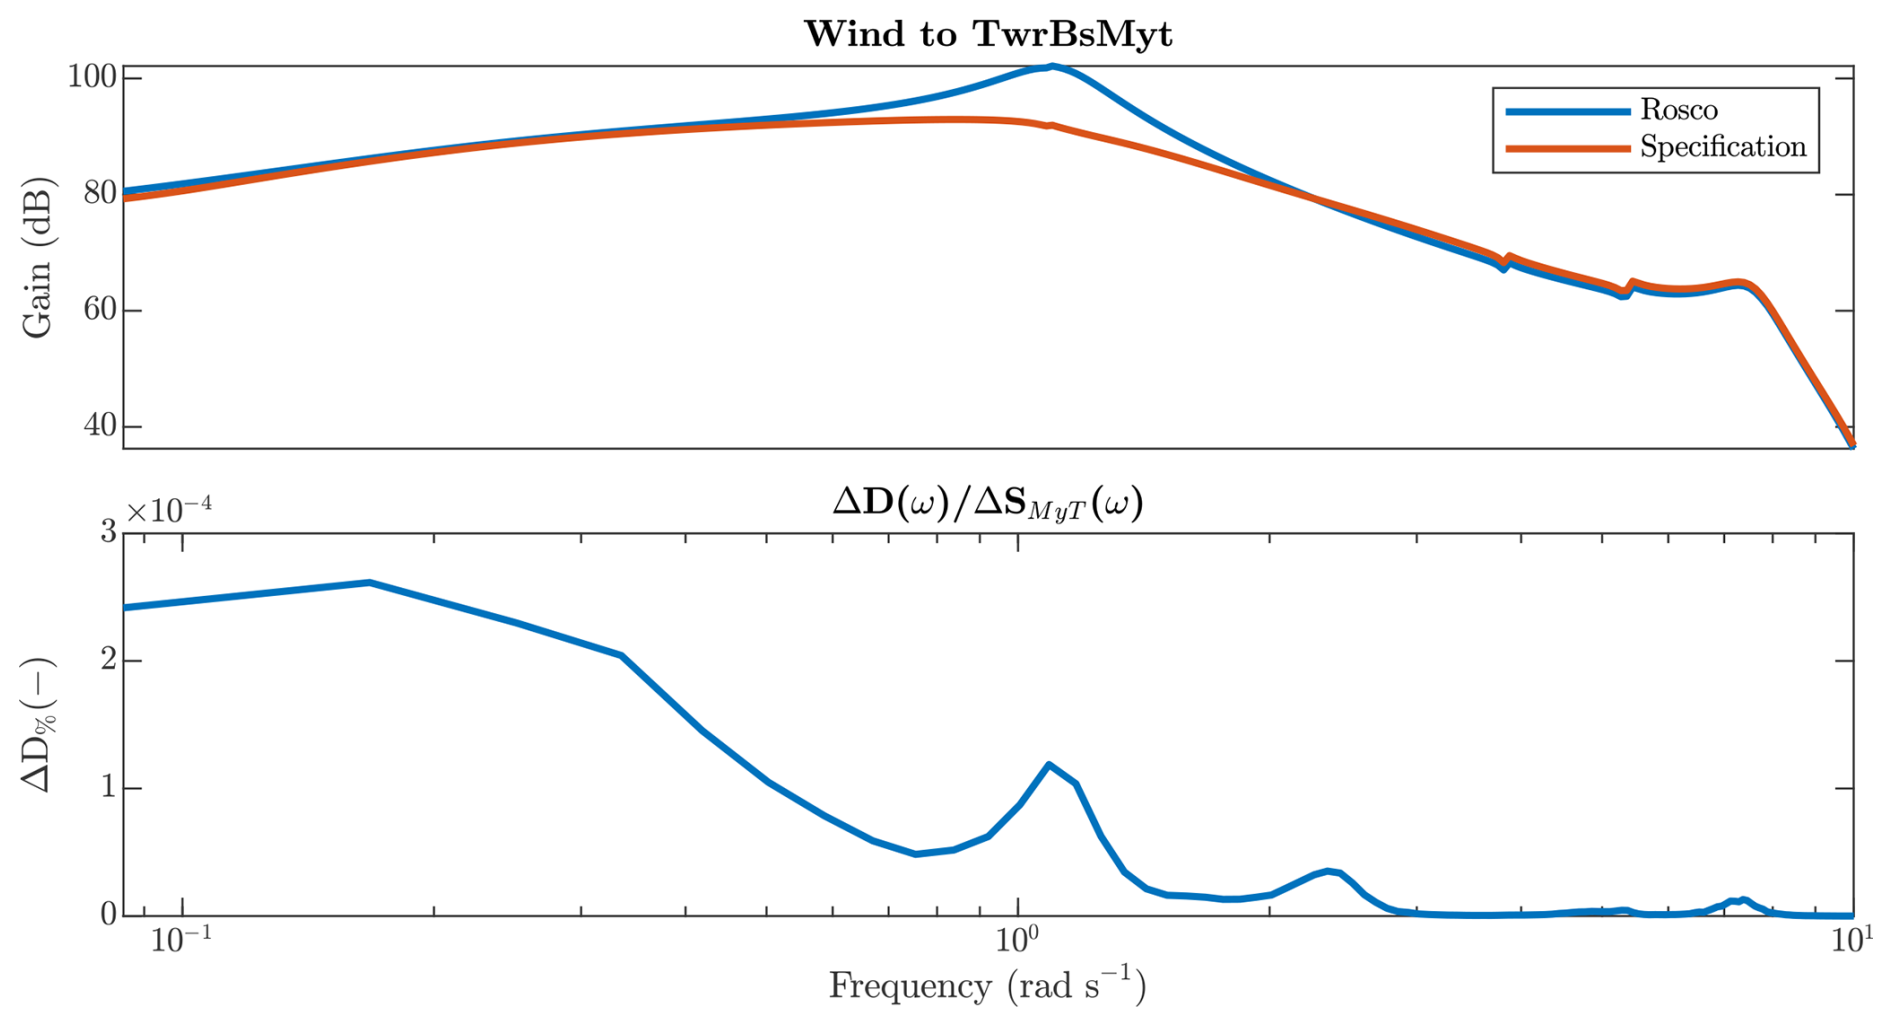
Figure 4Design of the control specification for an operating point corresponding to a 19 m s−1 wind speed. The control specification has a similar magnitude to ROSCO at all frequencies but the one surrounding the first fore–aft mode of the tower (1.1 rad s−1).
The design of the control specification Wy(s), which takes the closed-loop transfer function produced by the baseline controller as a starting point, is based on the information provided by function ΔD%(ω). Even though the lower frequencies have the greatest impact on fatigue (see the lower plot in Fig. 4), the designer must keep in mind that the main control objective is to have a constant power production, for which the lower frequencies are key. As a consequence, the control effort is located around the first fore–aft mode of the tower, which appears at approximately 1.1 rad s−1. The control specification was obtained with the aid of the lpshape function of the QFT Toolbox, targeting a fatigue reduction of 15 %. A set of notch filters was used to reduce the magnitude of the specifications at the chosen frequencies until the desired reduction in fatigue was obtained or improved. The linear fatigue estimation for the specifications at different operating points appears in Table 2.
As already mentioned, power production and, in turn, generator speed regulation are the most relevant objectives in the design of the pitch controllers. As a consequence, they must also be included in the design specifications. In this case, the closed-loop transfer function (wind to generator speed) obtained with ROSCO is used as a specification. This way, a performance similar to that of the baseline controller is expected in terms of generator speed regulation.
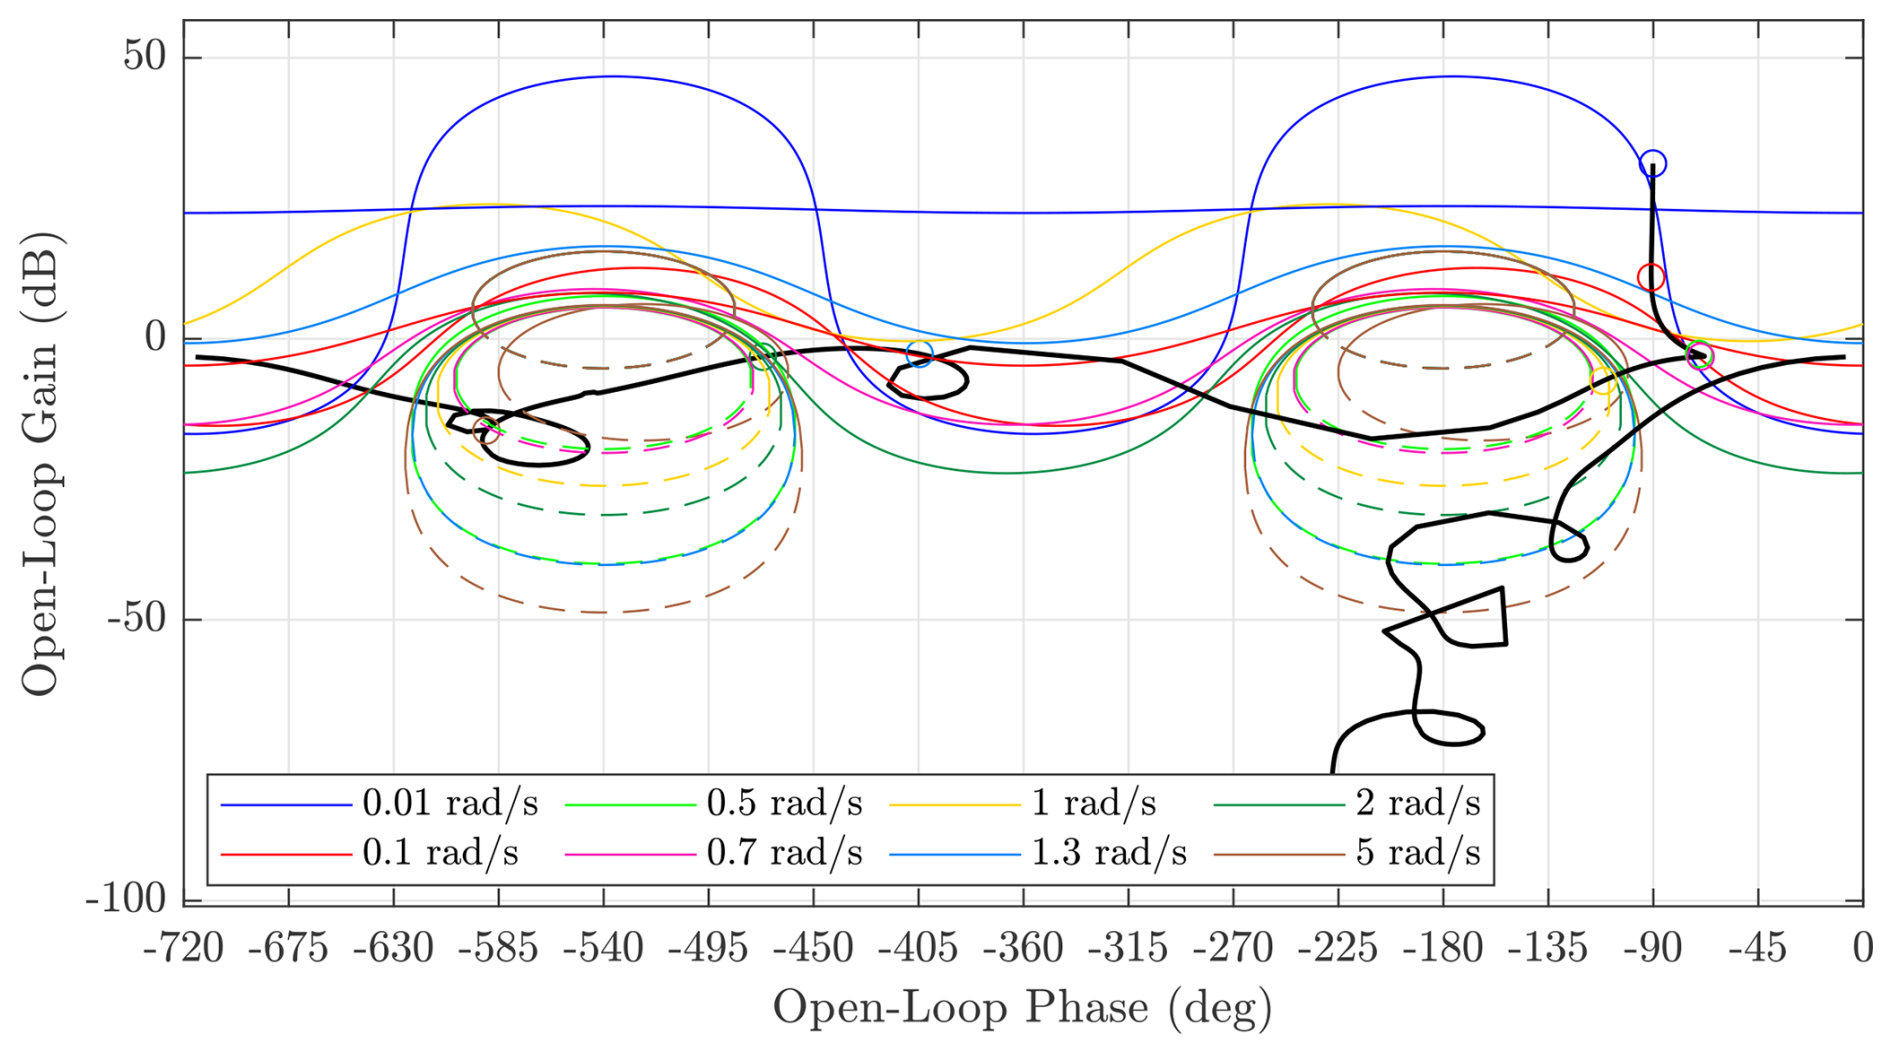
Figure 5Bounds for the loop shaping of the main feedback pitch controller. The main characteristic of this controller is the presence of an integrator to eliminate steady-state error and the use of low-frequency poles to increase magnitude and phase below 1 rad s−1. The open-loop nominal transfer function meets all bounds at all frequencies.
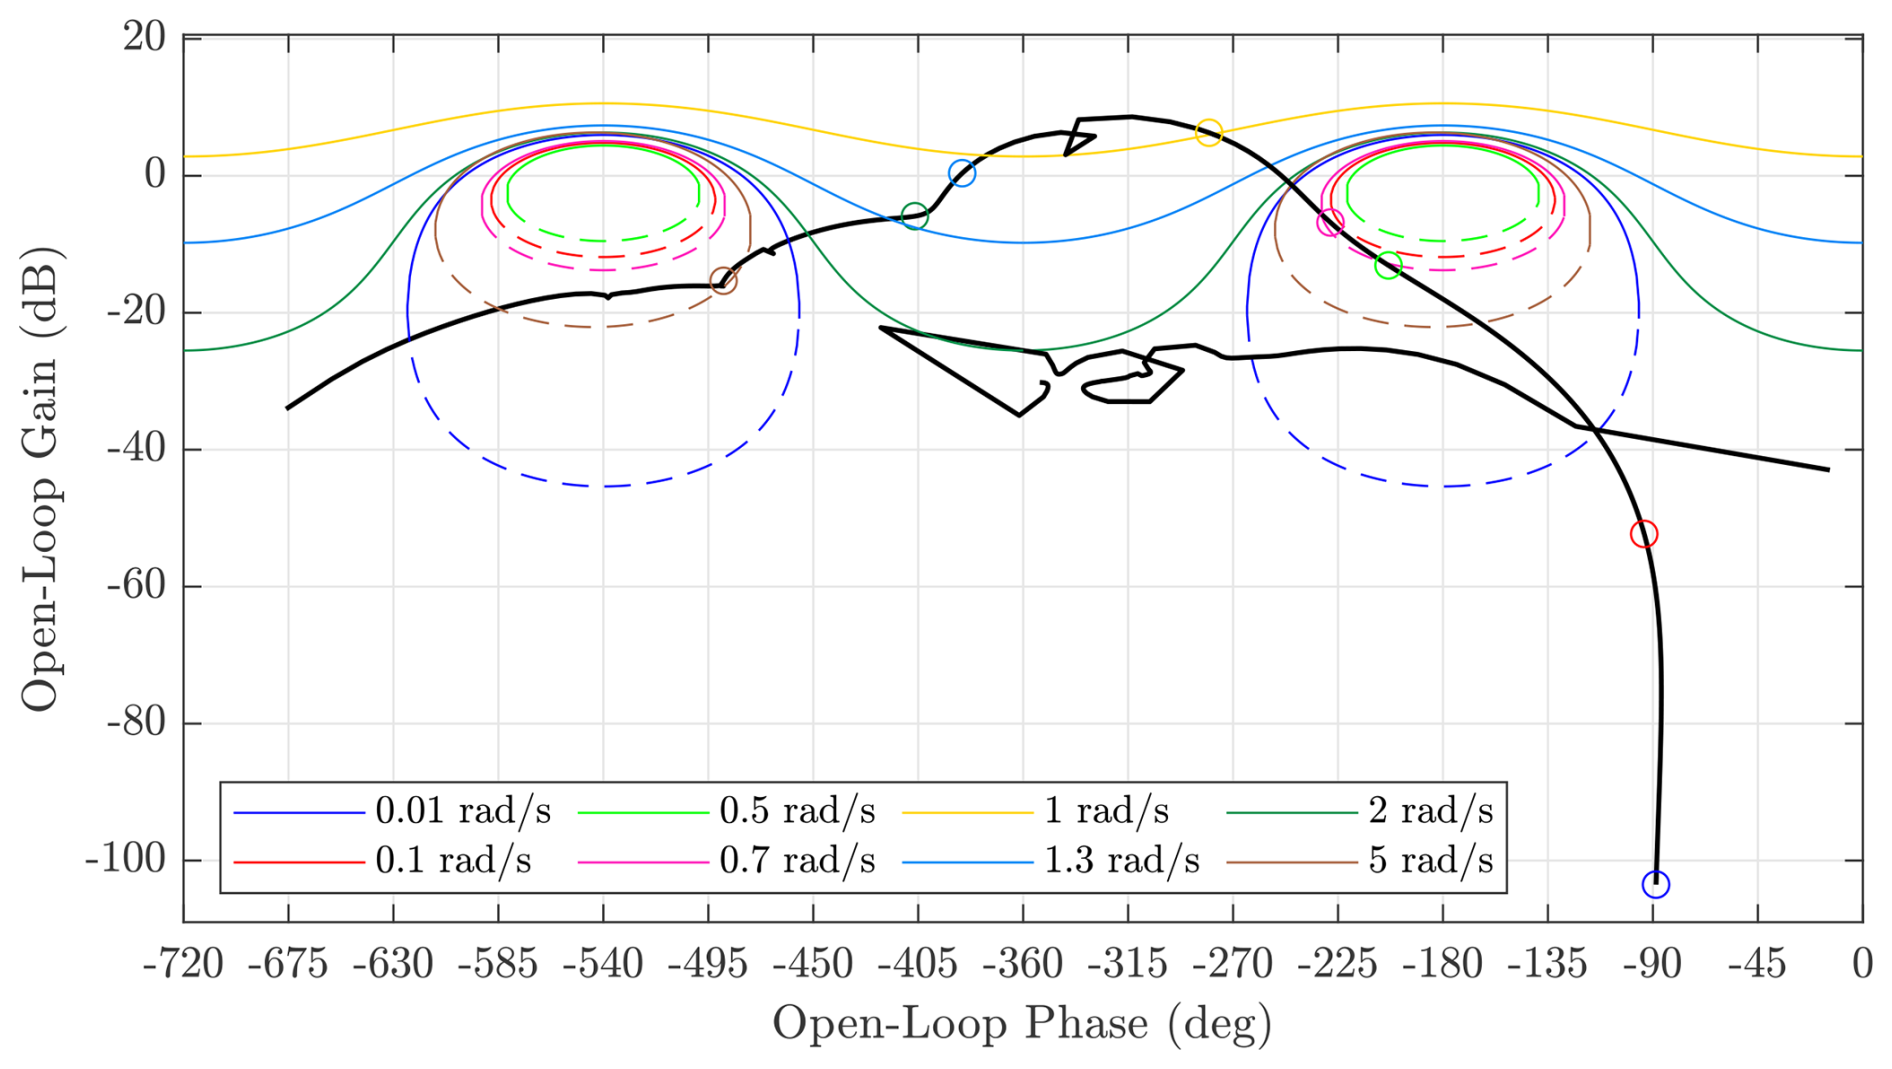
Figure 6Bounds for the loop shaping of the ATD controller. This controller has a pole of 0.3276 rad s−1 and a zero at 4.357 rad s−1. The main control effort of the ATD strategy appears close to 1 rad s−1 at the first fore–aft mode of the tower.
Once the control specifications for the two control objectives have been designed, the bounds for the controllers are obtained using the procedure described in Sect. 4.2. The bounds are obtained using function genbounds, and the design of the controllers is performed with the aid of lpshape. lpshape is a graphical design tool that represents the bounds and the open-loop nominal transfer functions in the Nichols plot (gain in decibel against phase in degrees). The bounds are the limits between the allowed and forbidden values for the open-loop nominal transfer function. They can have different colours, depending on their corresponding frequency, and solid and dashed lines, indicating lower and upper limits. The open-loop nominal transfer function is represented by the solid black line and a set of circular markers at the design frequencies, with the same colour as their corresponding bounds. The design is performed by modifying the position of the markers by adding zeros and poles to the controller.
As two different controllers have been designed for each operating point – the feedback pitch controller and the ATD – the design process is iterative. Due to the lack of the ATD controller in the baseline configuration, the design process begins with the tuning of a preliminary ATD controller. Then, several iterations are performed until specifications are met. Figures 5 and 6 show the final design of the pitch and ATD controllers for the operating point corresponding to a 19 m s−1 average wind speed. At this wind speed, the pitch controller is
The ATD controller at the same operating point is
The bounds are met tightly at frequencies surrounding 1 rad s−1 and with a greater margin for lower frequencies, as seen in Figs. 5 and 6. A similar conclusion can be inferred from the Bode plots presented in Fig. 7. There, the markers represent the design frequencies, which are used for the calculation of bounds and the loop-shaping process. As already anticipated, at frequencies below 1 rad s−1, at least one of the specifications is met with some margin. At higher frequencies, the tower base load is exactly equal to the specification. With a simple enough control structure, a good result is expected in between design frequencies. Figure 7 shows that the QFT controller provides a poorer response than the specification between 0.8 and 1 and 2 and 5 rad s−1 for the tower base load. However, the overall response is better than the specification and shows a significant improvement concerning ROSCO.
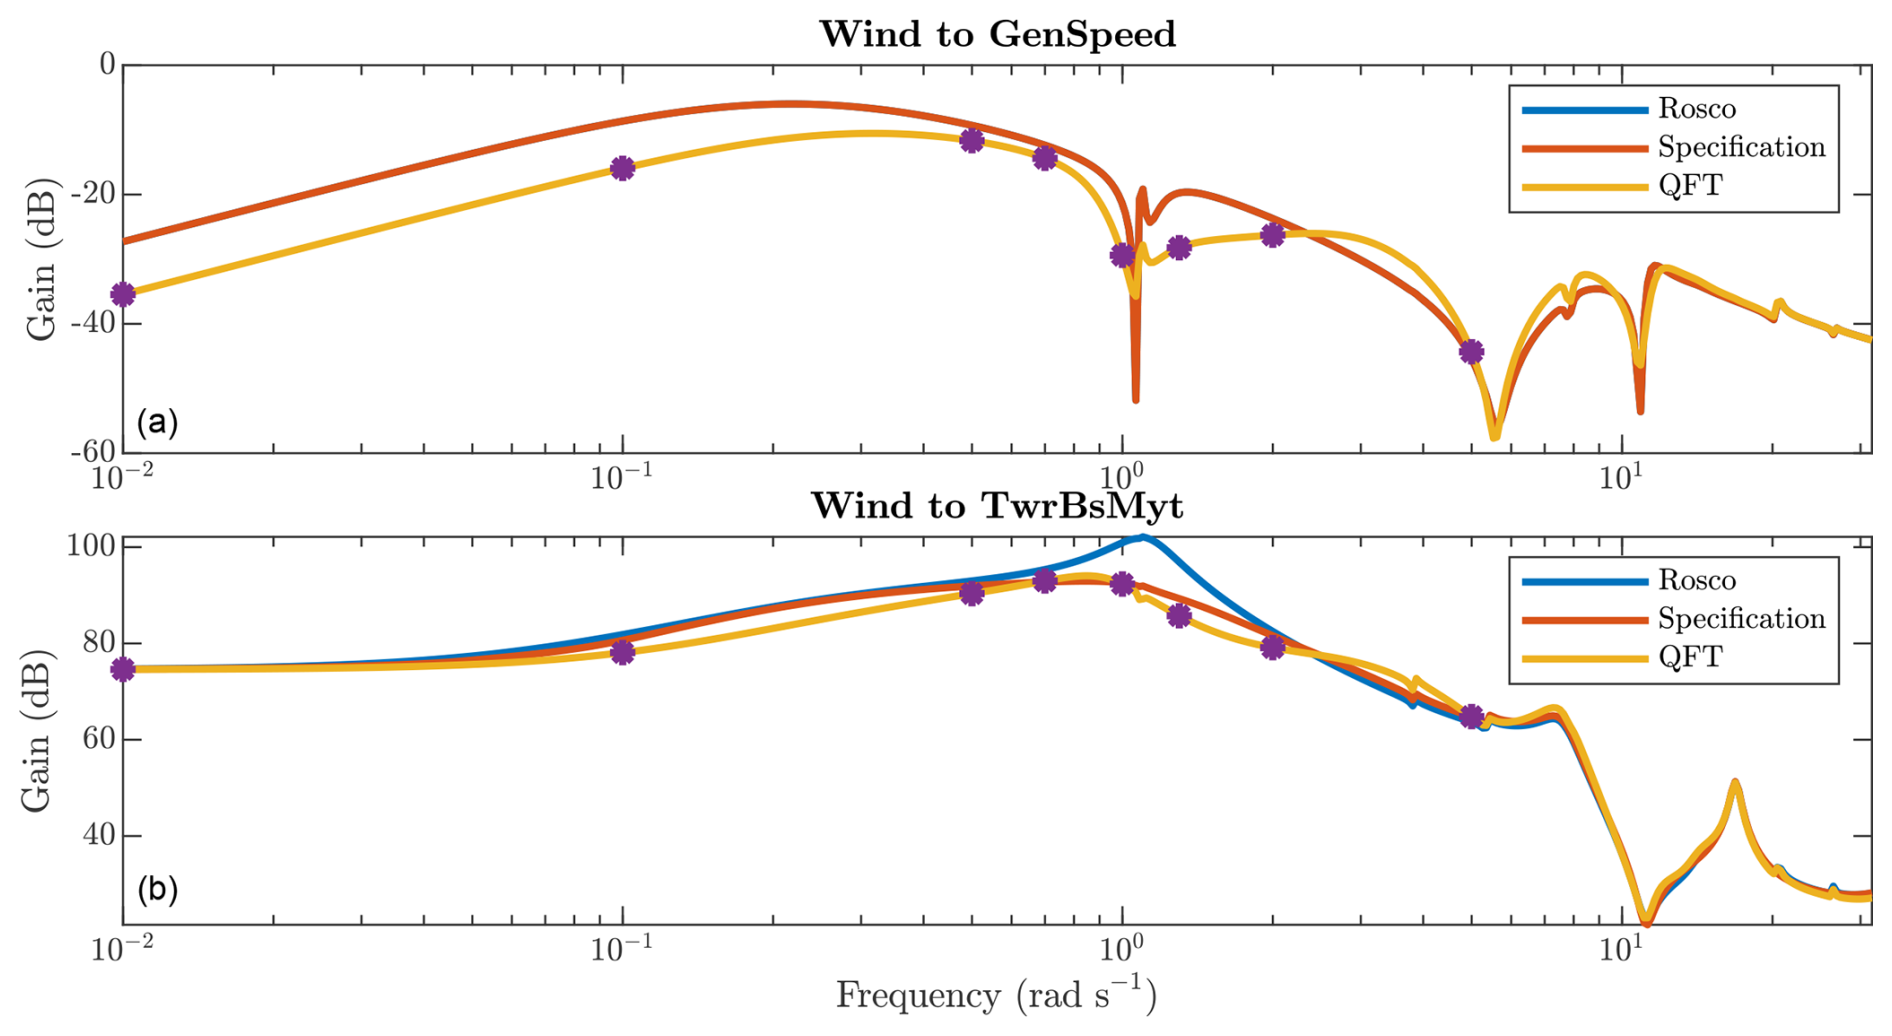
Figure 7Magnitude Bode plot for ROSCO (blue), the design specifications (red), and the QFT controller (yellow) for the generator speed (upper plot) and the tower base load (lower plot). The purple dots show the design frequencies in which the specifications are always met. A simple control structure guarantees that the response between design frequencies is smooth and that specifications are met most of the times.
4.4 Result analysis
Once a pitch controller and an ATD controller have been designed for each operating point in the above-rated region (11 to 25 m s−1), they are integrated into the aeroelastic simulator using its Simulink interface. Due to the different structures of the controllers at different operating points, an output blending strategy was used for the interpolation between controllers. A filtered pitch signal was used as an interpolation variable.
At each operating point, four different seeds were used for the generation of turbulent wind fields to ensure a reasonable trade-off between result variability due to turbulence and computation time. Each wind file has a 600 s length and a class B turbulent intensity according to the Normal Turbulence Model (NTM; Ishihara et al., 2012) and the IEC 61400:1-2019 standard. Wind fields were generated using the TurbSim tool (Jonkman, 2006).
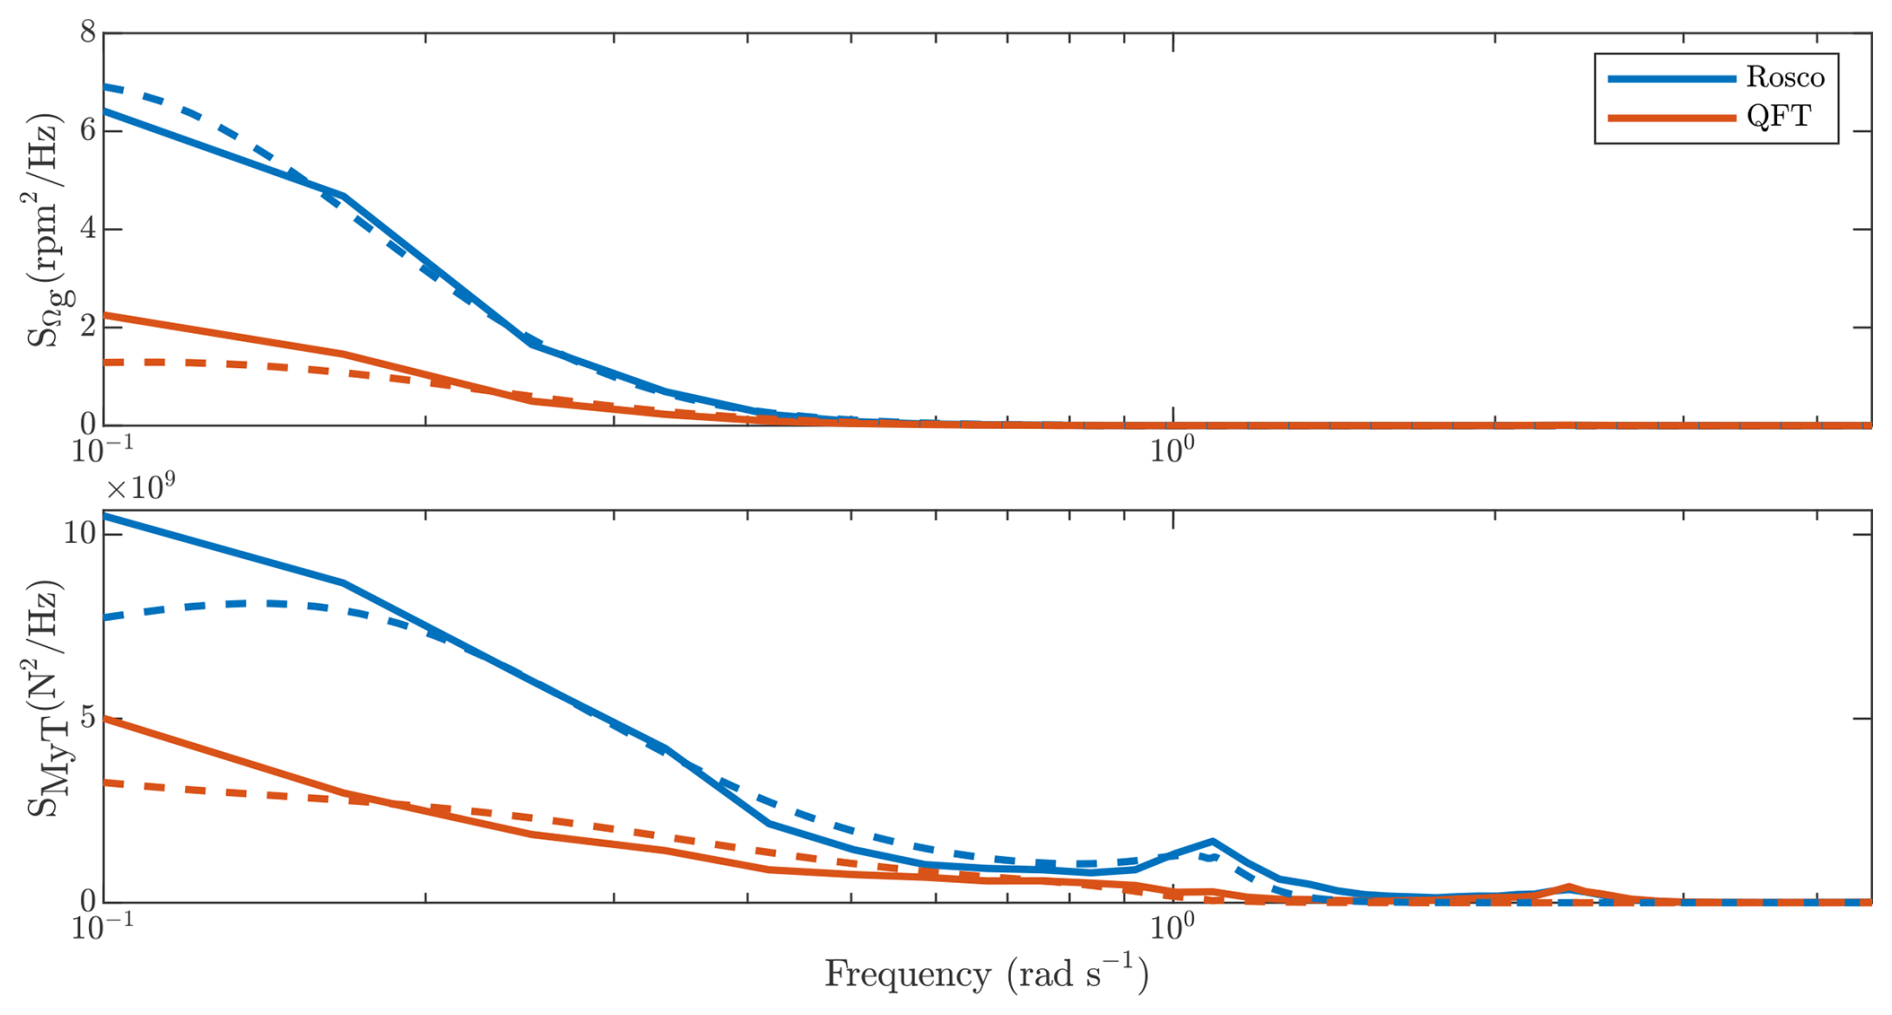
Figure 8Validation of the correspondence between linear (dashed) and nonlinear (solid) models with ROSCO (blue) and the QFT controller (red). Besides good matching between both models, the effect of the QFT controllers can be observed in the lower magnitude of the spectra, especially in frequencies below 0.5 rad s−1 and in the peak corresponding to the first fore–aft mode of the tower (close to 1 rad s−1).
The first step in the analysis of the results consists of the validation of the relation between the linear and the nonlinear models. Figure 8 shows a comparison between the theoretical and simulation spectra of the generator speed and tower base bending moment with the baseline and the QFT controllers at an operating point of 19 m s−1. The theoretical spectra were obtained using the linear model of the wind turbine and the theoretical spectrum of rotor effective wind speed. The simulation spectra were obtained by applying the Welch method to the time series obtained from OpenFAST. Two main conclusions can be drawn from this figure: (i) the QFT controller outperforms ROSCO for both outputs, and (ii) there exists good correspondence between the estimation obtained from the linear model and the results of the nonlinear simulation. This second fact is critical for the performance of the proposed fatigue estimation method.
Table 2Comparison of the main performance indicators for ROSCO and the QFT controller.
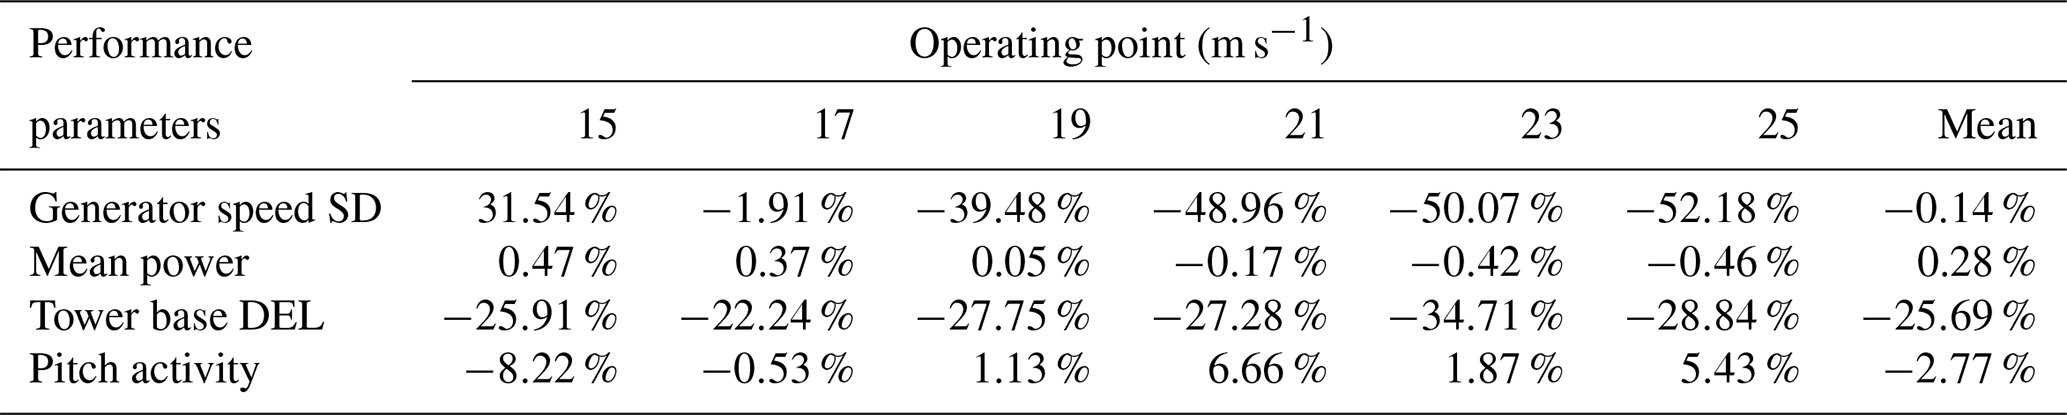
Even though improving the performance of ROSCO is not the main objective of this work, the performance of the QFT controller was studied to understand the possibilities of this design technique and the fatigue-based design of the specifications. The performance of the controllers was evaluated using four main indicators. The standard deviation of the generator speed is used as a measure of the quality of the generator speed regulation. Table 2 shows how the standard deviation is reduced for all operating points but 15 m s−1, which is closer to the transition between regions. The mean generated power shows small variations at different operating points that cancel each other out when calculating the total average. As expected from the linear fatigue prediction, the fatigue at the tower base is reduced significantly at all operating points, partly due to the absence of ATD in the baseline controller. Lastly, pitch activity is evaluated using the standard deviation of the collective pitch signal, which is significantly reduced at 15 m s−1 and then increases for wind speeds from 19 to 25 m s−1. A more thorough analysis of the cost of pitch control should be based on the actuator fatigue, where less favourable results would be expected. Mean values have been obtained assuming a Weibull distribution in mean wind with a shape factor of 2.2 and a scale factor of 11.29.
Similar information can be perceived in Fig. 9, which represents the simulation outputs for a single wind seed with a mean speed of 19 m s−1. Both the generator speed and the tower base load show smaller deviations from their mean value for the QFT controller, which accounts for a smaller standard deviation and fatigue respectively. The power mean value is close to 15 MW in both cases. The presence of the ATD controller in the QFT configuration can be observed in the ripple that appears in the pitch signal, accounting for an increased pitch standard deviation.
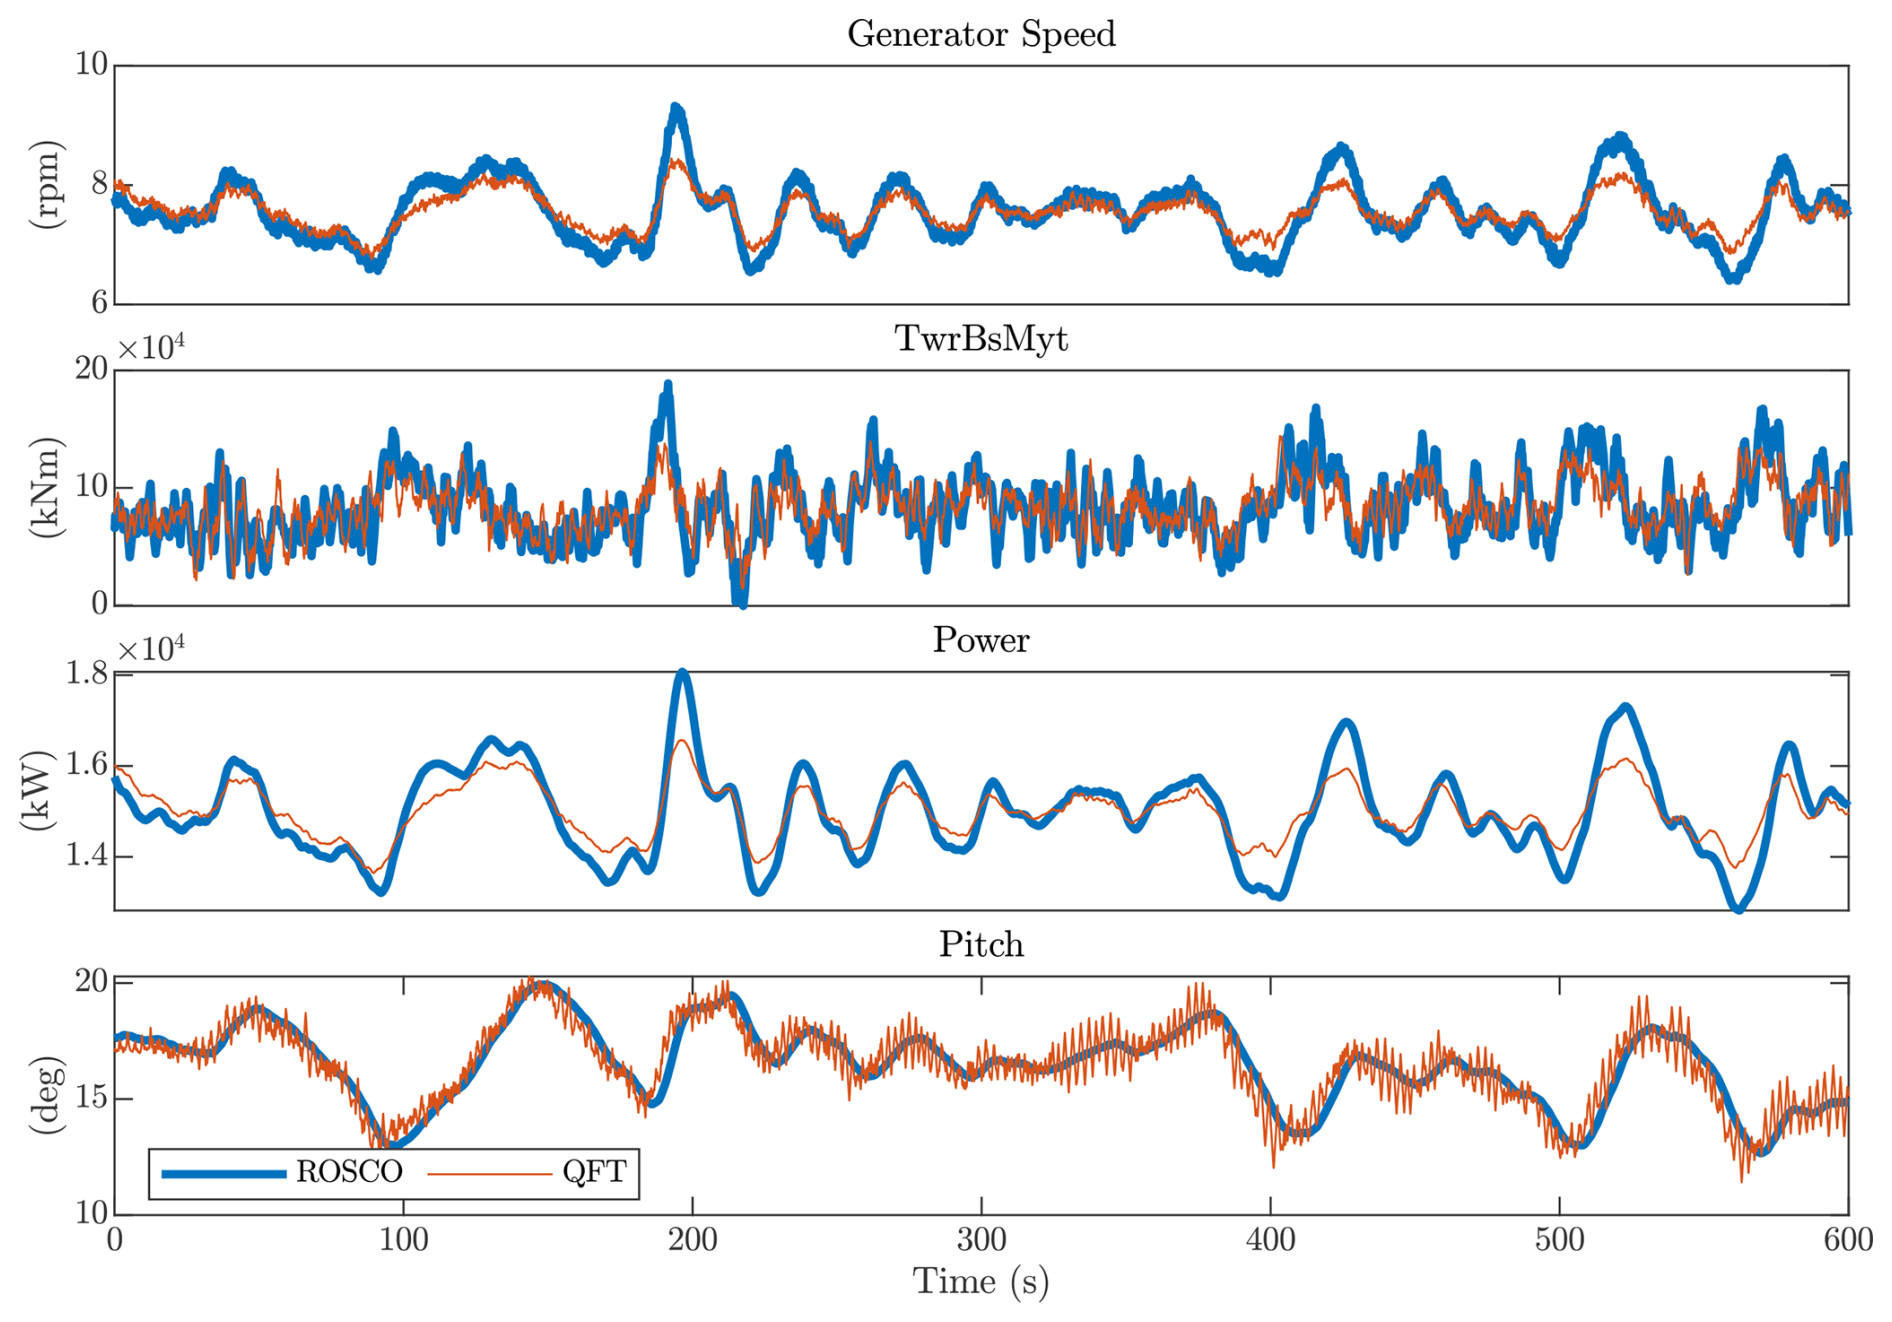
Figure 9Time series of relevant variables in an OpenFAST simulation with a mean wind speed of 19 m s−1. The standard deviation of generator speed and power is visibly smaller for the QFT controller (red) than for ROSCO (blue). Moreover, the fatigue in the tower base load should also be reduced as the ATD controller mitigates the bigger peaks in the blue line, which do not appear for the QFT controller. Lastly, the lower plot shows that the use of an ATD controller results in an increased high-frequency pitch activity.
The main result of this work is the design of the specifications on the mechanical loads based on a quantitative indicator of fatigue. Table 3 shows the fatigue reduction promised by the specifications, the linear estimation of the fatigue reduction for the new controllers, and the actual fatigue reduction calculated using a rainflow-counting algorithm. Two main conclusions can be drawn from the data: (i) the fatigue predicted by the linear model is always smaller than that promised by the specifications except from the 15 m s−1 operating point, and (ii) the deviation between the linear prediction and the rainflow-based fatigue evaluation is smaller than 2 % for all operating points, having an average value of 1.07 %.
Table 3Fatigue reduction at different operating points. The table includes information on the fatigue reduction promised by the specification, the reduction estimated with the help of linear models, and the actual fatigue reduction as evaluated with a rainflow-counting algorithm.
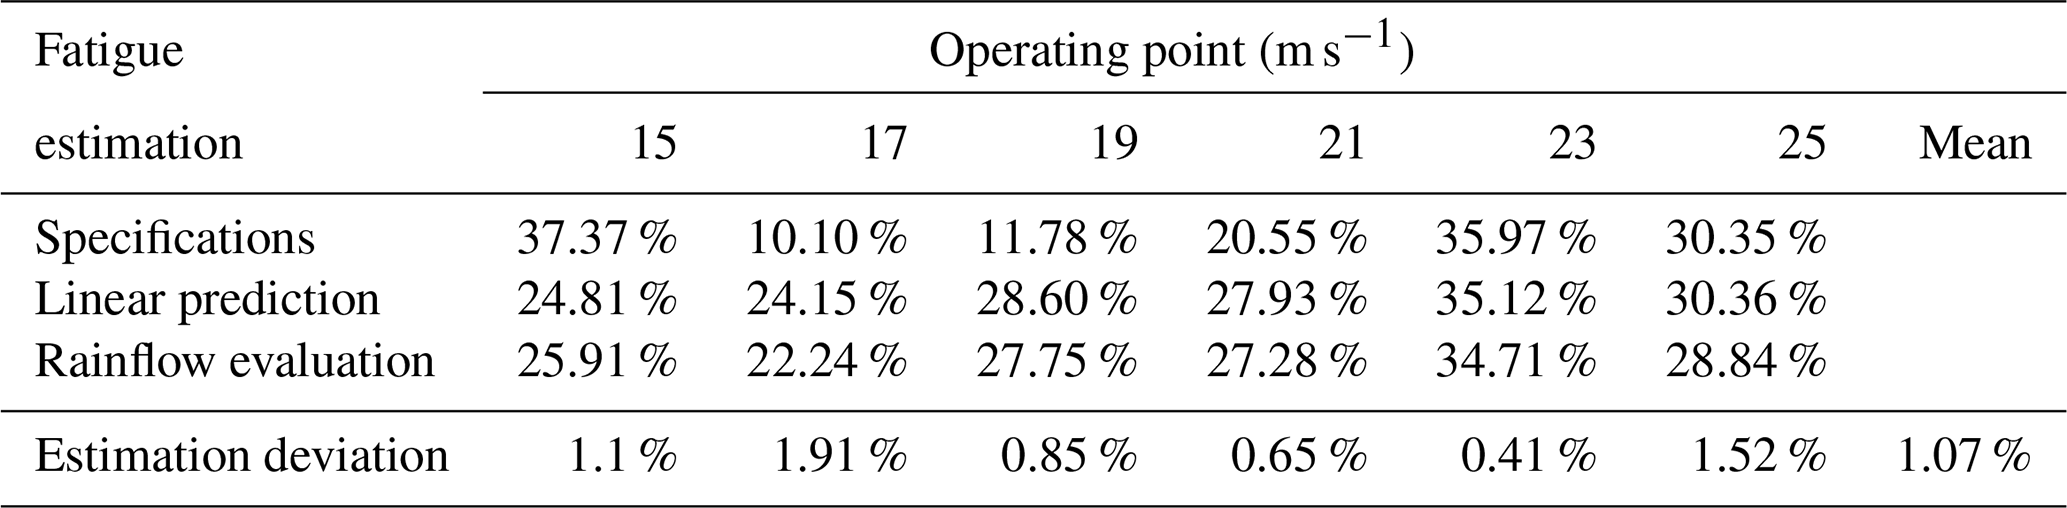
Figure 10 shows a graphical representation of the accuracy of the linear approximation of fatigue by plotting the frequency-domain estimation of fatigue and the time-domain evaluation against the mean wind speed. Even though the achieved fatigue reduction varies significantly at the different operating points, the estimation error remains much smaller than the fatigue variation.
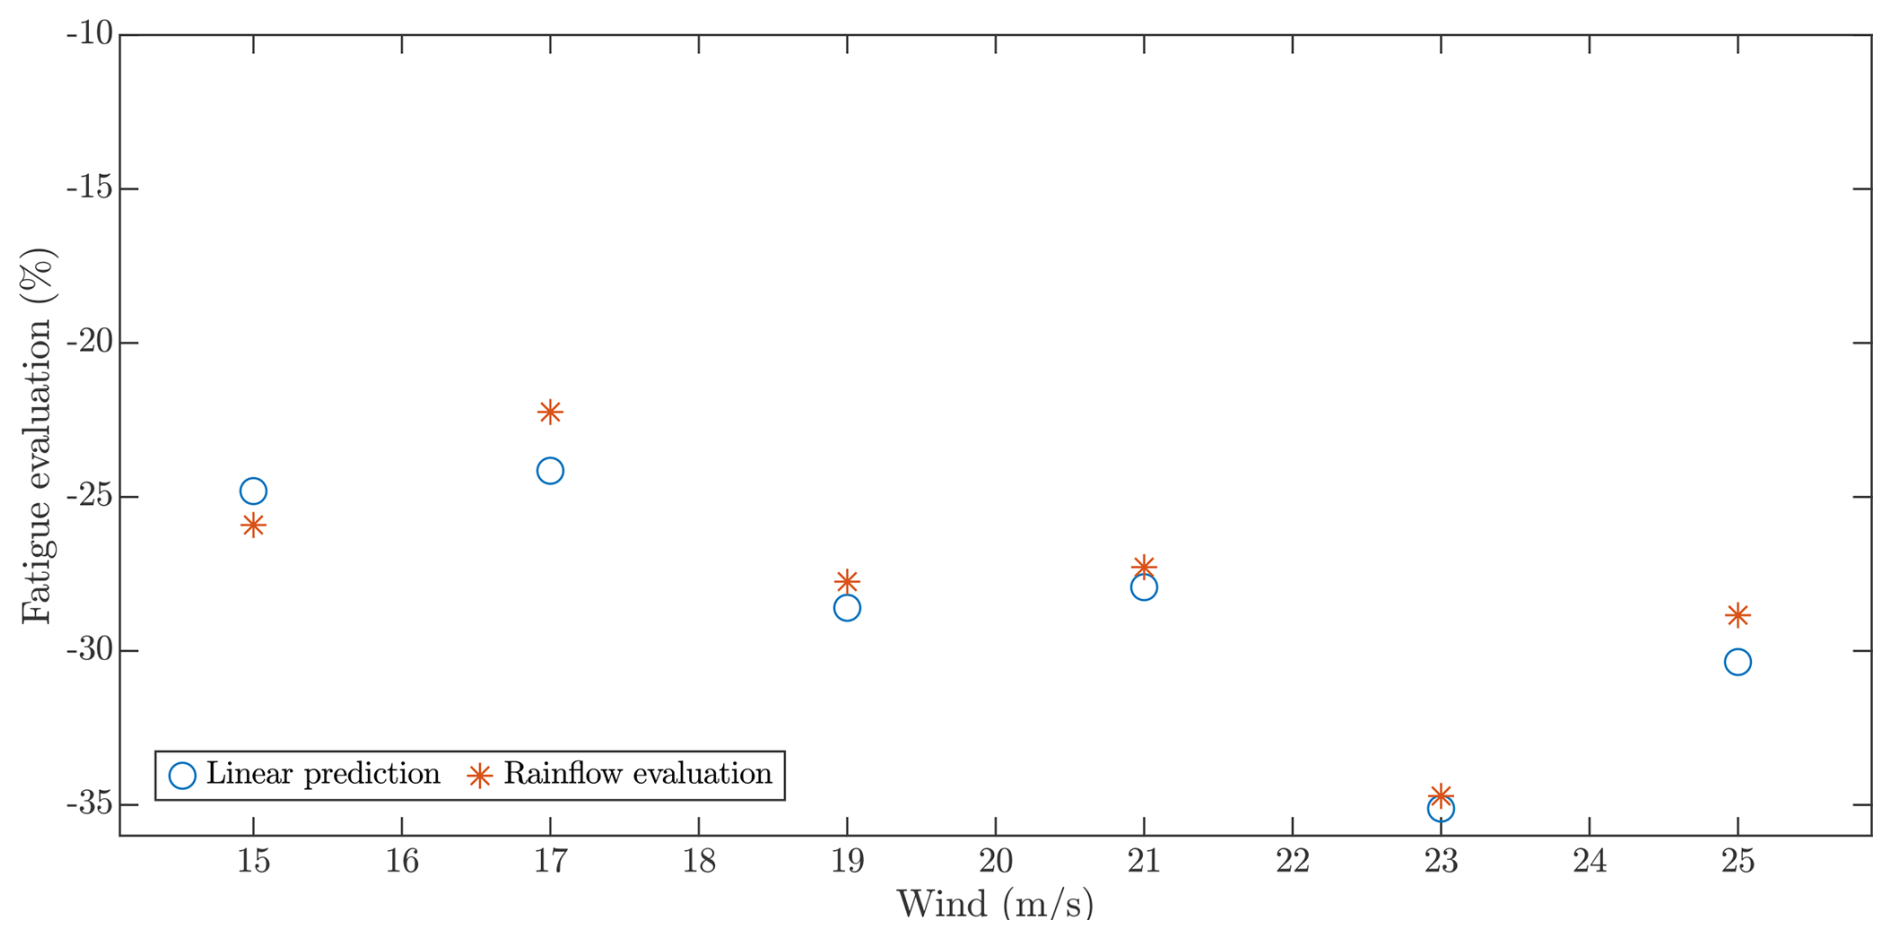
Figure 10Graphical comparison of the linear fatigue estimation (linear prediction) and the rainflow-based fatigue assessment (rainflow evaluation).
This article presents a method for designing control specifications based on mechanical fatigue. By having a priori information about the expected fatigue, the number of design iterations and the time spent on aeroelastic simulations are reduced, making the control design workflow smoother.
The method has been validated with the design of pitch controllers for the 15 MW reference wind turbine. More specifically, the feedback pitch controller has been redesigned, and active tower damping has been introduced to improve the performance of the ROSCO PI. With the aid of linear fatigue estimation and the design of specifications, fatigue has been reduced by 22 % to 36 % at operating points ranging from 15 to 25 m s−1 mean wind speed. Due to the good correspondence between the linear fatigue prediction and the fatigue evaluation obtained with a rainflow algorithm (under 2 %), a single iteration in the nonlinear simulation step is required. Consequently, the design process has been accelerated significantly by reducing the number of required simulations to two sets.
The error present in the fatigue estimation can be attributed to three different factors. The first one is that the results provided by the linear model do not exactly match the ones provided by the nonlinear simulator. In addition to the numerous nonlinearities present in the realistic model of the wind turbine and the complete control structure, other phenomena, such as the 3P frequency and the spatial variation in wind, cannot be taken into account by a linear approximation. The second factor is the difference between time-domain and frequency-domain fatigue evaluation methods. The rainflow-counting algorithm has proven to be the best approximation for fatigue estimation and is the reference in the standard. On the other hand, due to the fundamental empirical nature of frequency-domain methods, their performance varies significantly depending on the characteristics of the load and the system. While the method of Dirlik (1985) has proven to provide a good result, the search for a more accurate method remains open. Lastly, the proposed method is based on a linear approximation to fatigue estimation, which can introduce errors.
All in all, the use of linear models for specification design has proven to be useful, and their applications can be extended. On the one hand, the use of this frequency-domain estimation of fatigue could be included in the iterative design of other wind turbine components, such as structural elements. On the other hand, their use could also be studied for different controller design methodologies, the most obvious one being H∞. Lastly, the full potential of the methodology could be achieved in multi-objective design, in which the role of the control system in the fatigue of different elements could be linked to the business case of the wind turbine.
The methods and algorithms implemented in the code are described in detail in the paper to support transparency and reproducibility.
The data used in this study are simulated using open access tools. All models, parameters, and procedures required to reproduce the data are described in the manuscript.
IMM: conception, simulation data collection, writing. JA: conception, writing. DLL: simulation data collection, proofreading. JE: conception, proofreading.
The contact author has declared that none of the authors has any competing interests.
Publisher's note: Copernicus Publications remains neutral with regard to jurisdictional claims made in the text, published maps, institutional affiliations, or any other geographical representation in this paper. While Copernicus Publications makes every effort to include appropriate place names, the final responsibility lies with the authors. Views expressed in the text are those of the authors and do not necessarily reflect the views of the publisher.
This article is part of the special issue “NAWEA/WindTech 2024”. It is a result of the NAWEA/WindTech 2024, New Brunswick, United States, 30 October–1 November 2024.
This paper was edited by Jan-Willem van Wingerden and reviewed by two anonymous referees.
Abbas, N. J., Zalkind, D. S., Pao, L., and Wright, A.: A reference open-source controller for fixed and floating offshore wind turbines, Wind Energ. Sci., 7, 53–73, https://doi.org/10.5194/wes-7-53-2022, 2022. a
Benasciutti, D.: Fatigue analysis of random loadings: A frequency-domain approach, LAP Lambert Academic Publishing AG & Co KG, ISBN 9783659123702, 2012. a
Benasciutti, D. and Tovo, R.: Spectral methods for lifetime prediction under wide-band stationary random processes, Int. J. Fatigue, 27, 867–877, 2005. a
Bruck, M., Sandborn, P., and Goudarzi, N.: A Levelized Cost of Energy (LCOE) model for wind farms that include Power Purchase Agreements (PPAs), Renewable Energy, 122, 131–139, 2018. a
Dirlik, T.: Application of computers in fatigue analysis, PhD Thesis, University of Warwick, 1985. a, b, c, d, e
Elso, J., Gil-Martinez, M., and Garcia-Sanz, M.: Quantitative feedback control for multivariable model matching and disturbance rejection, Int. J. Robust Nonlin., 27, 121–134, 2017. a
Gaertner, E., Rinker, J., Sethuraman, L., Zahle, F., Anderson, B., Barter, G., Abbas, N., Meng, F., Bortolotti, P., Skrzypinski, W., Scott, G., Feil, R., Bredmose, H., Dykes, K., Shields, M., Allen, C., and Viselli, A.: Definition of the IEA 15 Megawatt Offshore Reference Wind, Golden, CO, National Renewable Energy Laboratory, NREL/TP 5000 75698, https://www.nrel.gov/docs/fy20osti/75698.pdf (last access: 3 February 2026), 2020. a
International Electrotechnical Commission (IEC): IEC 61400: Wind energy generation systems, IEC, 2020. a, b
Ishihara, T., Yamaguchi, A., and Sarwar, M. W.: A study of the normal turbulence model in IEC 61400-1, Wind Engineering, 36, 759–765, 2012. a
Jonkman, B. J.: TurbSim user's guide, NREL/TP-500-39797, National Renewable Energy Laboratory, Golden, CO, USA, https://docs.nrel.gov/docs/fy06osti/39797.pdf (last access: 3 February 2026), 2006. a
Kaimal, J. C., Wyngaard, J. C. J., Izumi, Y., and Coté, O. R.: Spectral characteristics of surface-layer turbulence, Q. J. Roy. Meteor. Soc., 98, 563–589, 1972. a
Mann, J.: Wind field simulation, Probabilist. Eng. Mech., 13, 269–282, 1998. a
Suresh, S.: Fatigue of Materials, 2nd Edn., Cambridge, Cambridge University Press, with ISBN 9780511806575, 1998. a
OpenFAST: OpenFAST/openfast , GitHub [code], https://github.com/openfast/openfast/ (last access: 2 February 2024), 2024. a
Pao, L. Y., Pusch, M., and Zalkind, D. S.: Control co-design of wind turbines, Annual Review of Control, Robotics, and Autonomous Systems, 7, 201–226, https://doi.org/10.1146/annurev-control-061423-101708, 2024. a
Singh, N., Pratap, B., and Swarup, A.: Design of robust control for wind turbine using quantitative feedback theory, IFAC-PapersOnLine, 49, 718–723, 2016. a
Song, Y., Jeon, T., Paek, I., and Dugarjav, B.: Design and validation of pitch H-infinity controller for a large wind turbine, Energies, 15, 8763, 2022. a
Tibaldi, C., Henriksen, L. C., Hansen, M. H., and Bak, C.: Wind turbine fatigue damage evaluation based on a linear model and a spectral method, Wind Energy, 19, 1289–1306, 2016. a
Wirsching, P. H. and Light, M. C.: Fatigue under wide band random stresses, J. Struct. Div.-ASCE, 106, 1593–1607, 1980. a
Wöhler, A.: Über die Festigkeitsversuche mit Eisen und Stahl, Ernst & Korn, http://catalog.hathitrust.org/Record/011617584 (last access: 3 February 2026), 1870. a
Yaniv, O., Chait, Y., and Borghesani, C.: The QFT control design toolbox for MATLAB, IFAC Proceedings Volumes, 30, 103–108, https://doi.org/10.1016/S1474-6670(17)42589-4, 1997. a
- Abstract
- Introduction
- Frequency-domain assessment of mechanical fatigue
- Generation of fatigue-based specifications for the design of controllers
- Validation for the 15 MW reference wind turbine
- Conclusions
- Code availability
- Data availability
- Author contributions
- Competing interests
- Disclaimer
- Special issue statement
- Review statement
- References