
the Creative Commons Attribution 4.0 License.
the Creative Commons Attribution 4.0 License.
 | 16 Nov 2026
Experimental evidence of wake–rotor synchronization and its effects on the aerodynamic response of tandem floating wind turbines
Alessandro Fontanella

Alberto Fusetti
Sara Muggiasca
Vincenzo Dossena
Marco Belloli
Platform motions of floating wind turbines generate periodic velocity fluctuations in the wake, but how these fluctuations synchronize with the motion of downstream rotors in floating wind farms and modify their aerodynamic response remains poorly understood. In particular, experimental evidence of this wake–rotor coupling between multiple moving floating turbines is still lacking. A controlled wind tunnel experiment was designed to isolate this mechanism using two 1:150-scale DTU 10 MW turbines arranged in tandem and subjected to prescribed harmonic surge motions. Motion-reduced frequency (0.12–0.48) and the relative phase between the upstream and downstream turbine motions were systematically varied, while configurations with only one turbine moving were used to separate wake-induced and motion-induced contributions. Aerodynamic loads, equivalent aerodynamic damping, wake velocity fields, and farm-level power were analyzed. The upstream turbine generates coherent wake velocity oscillations synchronized with the imposed surge motion, and the amplitude of velocity oscillations depends strongly on motion-reduced frequency. When this periodically modulated wake interacts with the moving downstream rotor, its aerodynamic response becomes strongly dependent on the relative phase between the two turbine motions. In-phase motion produces the largest oscillations of downstream turbine thrust and the largest equivalent aerodynamic damping, whereas anti-phase motion reduces the amplitude of thrust oscillations and the damping to approximately half that of the upstream turbine. Across the investigated conditions, wake interaction systematically reduces the aerodynamic damping of the downstream turbine relative to the upstream turbine. In parallel, at the higher reduced frequency of 0.48, coherent wake pulsations also enhance wake recovery and increase power of the downstream turbine, whereas these effects are weaker at the lower reduced frequency of 0.12. These results provide experimental evidence that wake coupling between moving floating turbines is a phase-dependent interaction that affects aerodynamic loads, energy capture downstream in the farm and also the effective aerodynamic damping governing floating-turbine response.
- Article
(8101 KB) - Full-text XML
- BibTeX
- EndNote


Since floating wind turbines have been proposed as a technical solution to harvest energy in deep waters, researchers have recognized that the rotors of these machines experience motions that are significantly larger than those of bottom-fixed turbines, due to the high compliance of their floating foundations. This awareness motivated early investigations into the aerodynamic consequences of such motions. Recently, Bergua et al. (2023) assessed the ability of several aerodynamic models to predict the rotor response to low-frequency platform motion. Building on this modeling challenge, Schulz et al. (2024, 2026) investigated whether the dynamically varying wind speed perceived by the rotor, together with the back-and-forth platform motion that can cause the rotor to re-encounter its own wake, gives rise to unsteady aerodynamic effects that are difficult to model and predict using conventional aerodynamic modeling tools.
Over the last decade, the wind energy research community has dedicated significant efforts to wind-farm optimization, with the goal of minimizing energy losses caused by wakes (Meyers et al., 2022). A wake is a region of the flow field downstream of a wind turbine rotor where, due to energy extraction by the rotor, the flow contains less energy than the free stream and exhibits increased turbulence. Recently, the floating-wind research community has turned its attention to wakes as well. In particular, researchers have investigated whether the dynamic operating conditions induced by platform motions could affect wake development, potentially leading to differences compared to the bottom-fixed case. Full-scale measurements of floating-wind-turbine wakes remain scarce, due to the limited number of operational floating wind farms. Consequently, this problem has been addressed primarily through two approaches: wind tunnel experiments and computational fluid dynamics (CFD) simulations of varying complexity and fidelity.
The very few full-scale measurements available have focused on the wakes of isolated wind turbines, with the aim of understanding whether the time-averaged energy content of these wakes, directly translating into the energy available for downstream turbines, is affected by turbine motion. Angelou et al. (2023) used lidar measurements to examine the far wake of a 6 MW floating wind turbine at the Hywind Scotland offshore wind farm – the world's first floating wind farm. The results indicate that, for small-amplitude platform motions, the time-averaged characteristics of floating turbine wakes are similar to those of bottom-fixed turbines. Under these conditions, atmospheric turbulence was identified as the dominant mechanism for wake recovery, with platform motion having a negligible effect. Similarly, Özinan et al. (2024) investigated the near wake of a 2 MW floating wind turbine and found no evident impact of wave-induced motions on the average wake velocity.
As with full-scale measurements, wind tunnel experiments have primarily focused on the development of the wake of a single wind turbine. Bayati et al. (2017) and Fontanella et al. (2022) measured the near wake of a 1:75-scale model of the DTU 10 MW turbine (Bak et al., 2012) undergoing sinusoidal surge motion in a uniform, low-turbulence inflow. The results show that the wake velocity exhibited oscillations at the same frequency as the imposed rotor motion.
Schliffke et al. (2020, 2024) studied the wake of a porous disk subjected to sinusoidal surge motion in a wind field representative of the atmospheric boundary layer and found that, at 4.6 rotor diameters (D) downstream, the mean wake velocity remained unchanged compared to the fixed case. However, large low-frequency sinusoidal motions introduced harmonic content in the velocity signal that persisted up to 8 D. In contrast, broadband platform motions, including surge, pitch, and heave, representative of a floating-wind-turbine response to irregular waves, did not leave similarly clear harmonic signatures in the wake.
Building on the observation that large low-frequency platform motions generate additional harmonic content in the turbine wake, further wind tunnel studies have aimed to characterize the wake flow structures responsible for these velocity oscillations. Messmer et al. (2024a, b, 2025) measured the wake of a wind-turbine-scale model at downstream distances from 1.5 to 10 D in uniform inflows ranging from laminar to low-turbulence, with the turbine undergoing low-frequency harmonic surge and sway motions. The results show the presence of large flow structures coherent with the platform motion. In laminar flow, the wake exhibited a pulsing and meandering behavior that promoted faster recovery to free-stream conditions, an effect that diminished as the inflow turbulence increased.
Fontanella et al. (2025) investigated the wake of a 1:75-scale model of the DTU 10 MW turbine at distances from 3 to 5 D, with the turbine subjected to various harmonic motions in surge, sway, roll, pitch, and yaw directions under a low-turbulence inflow. The results show the presence of flow structures coherent with the platform motion and link their development to the rotor aerodynamic response. In particular, along-wind motions such as surge and pitch, which produce a pulsing apparent wind speed and thrust, were associated with periodic oscillations in wake velocity, while crosswind and yaw motions induced increased lateral meandering of the wake.
Hubert et al. (2025) conducted experiments on the wake of a porous disk immersed in a marine atmospheric boundary layer. The results show that heave motion caused the wake to translate vertically while maintaining the same mean velocity as the bottom-fixed case. Surge induced a contraction and expansion of the wake with a pulsing behavior, while pitch resulted in wake dynamics characterized by both pulsing and vertical meandering.
Duan et al. (2026) further investigated surge-induced wake dynamics under atmospheric boundary layer inflow conditions, showing that platform motion has a limited influence on the mean wake velocity, while motion-induced fluctuations can still be detected downstream.
Overall, wind tunnel experiments on isolated floating wind turbines have consistently shown that large, low-frequency platform motions induce a wake response characterized by periodic velocity oscillations and large-scale, periodic movements of the wake. These wake responses are most pronounced when the motion has a reduced frequency (defined as the product of the motion frequency and rotor diameter divided by the undisturbed wind speed) in the range of 0.2 to 0.9. Under very low or near-laminar inflow turbulence, the additional wake dynamics promote increased wake mixing and faster recovery towards free-stream conditions. However, this beneficial effect diminishes as the inflow turbulence increases to levels more representative of realistic atmospheric conditions.
In parallel with wind tunnel experiments, CFD simulations have increasingly been used to investigate the wake of individual floating wind turbines undergoing prescribed platform motions. These studies are typically conducted in close connection with experiments, first to validate the numerical approach and then to exploit the full three-dimensional, time-resolved flow field provided by CFD to gain further physical insight into wake dynamics.
Using large-eddy simulations (LESs) and actuator-line or blade-resolved unsteady Reynolds-averaged Navier–Stokes (URANS) approaches, recent works have shown that harmonic surge, pitch, and roll motions generate coherent flow structures in the wake synchronized with platform motion (Taruffi et al., 2024; Mian et al., 2025; Pagamonci et al., 2025; Cioni et al., 2026, 2025; Firpo et al., 2026). At reduced frequencies between 0.3 and 0.8, these structures are associated with wake pulsation, interaction between blade vortices, and enhanced wake mixing, leading to faster wake recovery under low-turbulence inflow. However, when realistic inflow turbulence is introduced, the motion-induced velocity fluctuations become less prominent relative to other turbulent wake fluctuations, and differences in the time-averaged wake deficit with respect to bottom-fixed cases become less pronounced (Pagamonci et al., 2025). Multi-fidelity comparisons further indicate that actuator-line URANS models generally reproduce mean wake deficits with reasonable accuracy but may underpredict the amplitude of motion-induced velocity oscillations, whereas LES better captures coherent structures and turbulence distribution in the wake.
CFD simulations have also been employed to assess whether wake-induced aerodynamic interactions in floating wind farms differ from those in bottom-fixed configurations, as platform motions can alter wake structure and dynamics. Large-eddy simulations using the actuator line method have been conducted to study the wakes and wake interactions of two NREL 5 MW floating wind turbines arranged in tandem, with the turbines subjected to harmonic surge motion and exposed to both laminar and turbulent inflows (Li et al., 2024, 2025). Consistent with the results of wind tunnel experiments on individual turbines, the simulations showed periodic coherent structures in the wake of the upstream turbine, induced by surge motion. These structures enhanced the advection of energy within the wake, promoting faster wake recovery. The downstream turbine, positioned 3–5 D downstream, was simulated while undergoing motions with varying phase differences relative to the upstream turbine. It was found that the enhanced wake recovery resulting from surge motion increased the downstream turbine power output by up to 2 %. Interestingly, the coherent flow structures linked to platform motion observed in the upstream wake were absent in the wake of the downstream turbine.
Hu et al. (2026) used LES with an elastic actuator-line model to investigate two tandem floating wind turbines undergoing synchronized surge motion under atmospheric boundary layer inflow conditions. Their results showed that surge motion can enhance wake recovery and downstream turbine power production, with the largest power gains occurring at a reduced frequency of approximately 0.4. They also found that surge motion increases blade fatigue loads, highlighting the trade-off between power enhancement and structural loading.
These numerical studies demonstrate that platform motion can significantly influence wake interactions, power production, and aerodynamic loading in floating wind farms. However, experimental evidence of how a wake modulated by motion interacts with a simultaneously moving downstream rotor, and how this interaction affects its aerodynamic response depending on the relative motion phase, is still lacking.
Measurements of wake interactions in floating wind farms remain very limited. A 1:400-scale floating wind farm comprising 12 turbines has been investigated in a wind–water tunnel under a sheared inflow with 10 % turbulence intensity (Bossuyt et al., 2023). Despite the intrinsic challenges of simultaneously scaling aerodynamic and hydrodynamic effects, the study revealed differences in wake recovery associated with the periodic rotor motions induced by waves. Specifically, wave-induced yaw and pitch motions led to synchronized vertical oscillations of the wake, which enhanced wake recovery but also increased turbulence levels. The loads on a fixed downstream turbine subjected to the wake of an upstream turbine undergoing different platform motions have been measured using 1:75-scale models of the DTU 10 MW turbine, with separation distances of 3–5 D, in a uniform low-turbulence inflow (Fontanella et al., 2026a). The results demonstrate that large-amplitude, low-frequency sinusoidal motions of the upstream turbine, particularly in crosswind and yaw directions, can enhance the power output of the downstream turbine. Similar gains were observed under realistic, broadband wave-driven motions when wind and waves were aligned, but not when wind–wave misalignment introduced significant crosswind movements. In parallel, motion of the upstream turbine increased the dynamic loading on the waked turbine. A similar wind tunnel experiment by Miroux et al. (2026), using two 1:148-scale models of the DTU 10 MW at 2–5 D separation distances, likewise found that harmonic platform motions of the upstream turbine affect the loading of the fixed downstream turbine, with low-frequency surge and pitch producing periodic thrust oscillations and yaw increasing the mean thrust.
These experiments demonstrate that platform motion can modify wake recovery, power production, and downstream turbine loading. However, they do not isolate the additional coupling that arises when the downstream turbine itself moves within a wake characterized by periodic velocity oscillations. In this case, the aerodynamic response depends not only on the wake velocity fluctuations generated by the upstream turbine motion, but also on their phase relationship with the motion of the downstream rotor. Because aerodynamic damping is determined by the amplitude and phase of the aerodynamic thrust response relative to turbine motion, such phase-dependent wake–rotor interactions are expected to directly modify the effective aerodynamic damping of a downstream floating turbine.
The objective of this work is to experimentally identify and quantify the aerodynamic coupling that arises in floating wind farms when the periodically modulated wake of an upstream floating wind turbine interacts with a moving downstream rotor. While previous experiments have characterized the wake velocity fluctuations induced by floating turbine motions, the present work investigates how their interaction with a moving downstream rotor can reinforce or counteract their effects on aerodynamic loads and power production. The experiment is designed to isolate this coupling mechanism rather than reproduce the full complexity of realistic floating-wind-farm operating conditions. Configurations in which either turbine moves independently allow the effects of rotor motion and wake velocity oscillations to be characterized separately. Configurations in which both turbines move, with systematically varied reduced frequency and relative phase, are then used to investigate how wake-induced velocity fluctuations and the velocity contribution associated with downstream rotor motion combine to amplify or attenuate oscillations in the apparent wind speed experienced by the downstream rotor and to quantify the resulting effects on aerodynamic loads, damping, and power production.
The resulting measurements provide experimental evidence of wake–rotor synchronization in a two-turbine floating wind farm and quantify its aerodynamic consequences under controlled conditions. The measurements are published as an open-access dataset and provide a basis for assessing the relevance of this coupling mechanism to floating-wind-farm dynamics and for validating numerical simulation tools.
The remainder of the article is organized as follows. Section 2 describes the experimental setup, including the wind turbine model, the robotic system used to simulate platform dynamics, the turbine operating and motion conditions, and the measurement techniques employed. Section 3 outlines the post-processing procedures applied to the experimental data. Section 4 presents the results, progressing from the loads of the upstream turbine to its wake development and subsequently to the loads and wake behavior of the downstream turbine. Section 5 discusses the findings in a broader context, highlighting their implications for floating-wind-farm aerodynamics. Finally, Sect. 6 summarizes the main conclusions of the study and identifies priorities for future research.
The experimental campaign was conducted in the atmospheric boundary layer test section of the Politecnico di Milano wind tunnel, which measures 13.84 m in width, 3.84 m in height, and 35 m in length.
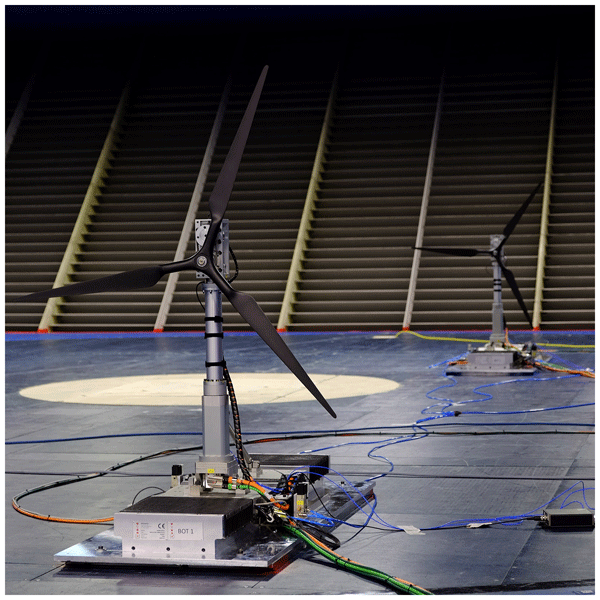
The tests employed two wind turbines (WTs), which are 1:150-scale models of the DTU 10 MW reference wind turbine (Bak et al., 2012), which were mounted on robotic platforms designed to replicate the movement of floating wind turbines. The wind-farm setup inside the wind tunnel is shown in Fig. 1. In the experiment, the two wind turbines were aligned with the mean wind direction, with the downstream turbine (WT2) positioned 5.75 D behind the upstream turbine (WT1).
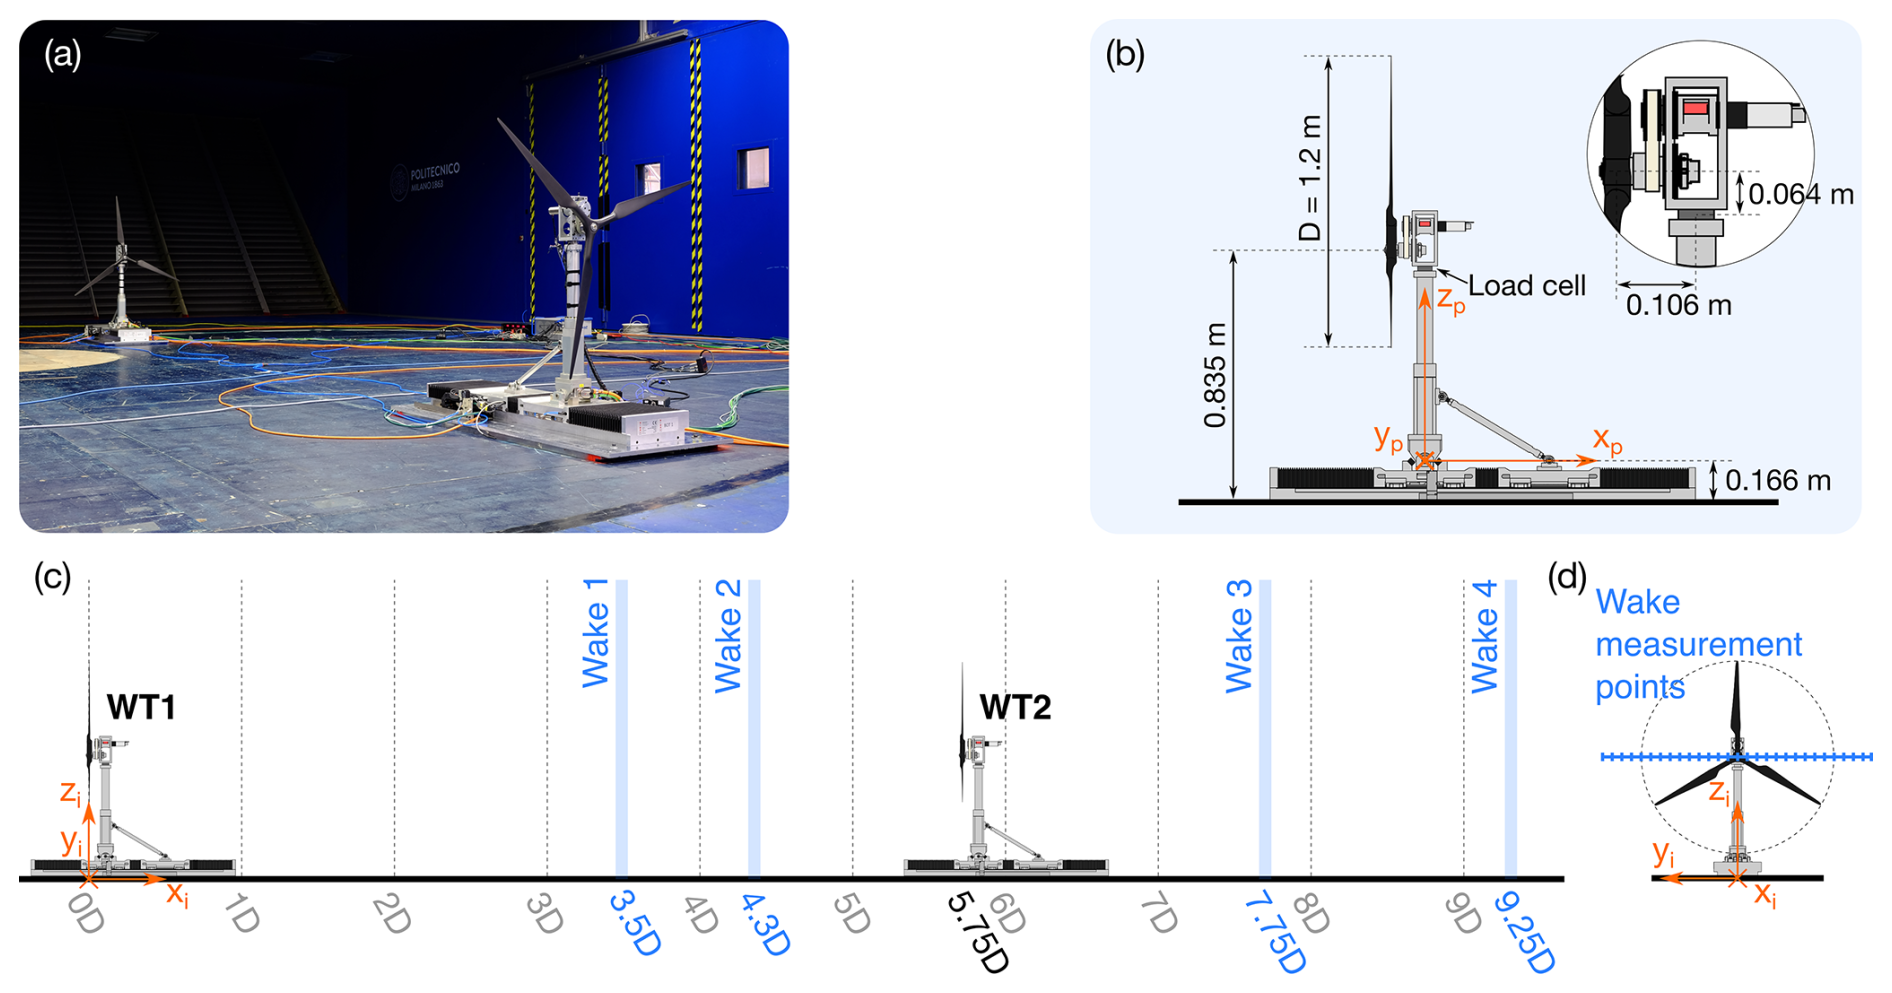
Figure 1(a) View of the floating-wind-farm setup inside the wind tunnel. (b) Schematic of one of the floating-wind-turbine-scale models, showing the reference frame (xp–yp–zp) attached to the moving platform and used to define motions. (c) Schematic of the floating wind farm with the locations where wake measurements were taken, defined in the inertial reference frame (xi–yi–zi). (d) Locations of wake measurement points along the hub-height line.
The flow velocity was scaled by a factor of 1:2.5 relative to full-scale conditions. Consequently, the time scaling in the experiment, determined by the combination of geometric and velocity scales, was 1:60. This means that the dynamic response of the wind farm in the experiment evolves 60 times faster than it would at full scale.
2.1 Wind turbine model
Each turbine has a 1.2 m diameter rotor, with blades designed to replicate the full-scale blade normal load distribution and match the thrust characteristics of the DTU 10 MW reference turbine, following the methodology described in detail by Fontanella et al. (2023). The blade design employs the SD7032 airfoil, selected for its good aerodynamic performance at the low chord-based Reynolds numbers characteristic of the wind tunnel environment (approximately 5 × 10⁴–1 × 10⁵). With the airfoil fixed, the blade chord and twist distributions were modified relative to a simple geometric scaling of the full-scale blade. This adjustment ensured that, at a design tip-speed ratio of 7.5, both the sectional force normal to the rotor plane and its derivative with respect to the inflow velocity were accurately reproduced. This scaling approach allowed the scaled rotors to match the mean thrust of the full-scale turbine, which sets the wake deficit and the sensitivity of thrust to inflow variations, which is key to capturing the aerodynamic load oscillations induced by rotor motion and the resulting wake perturbations.
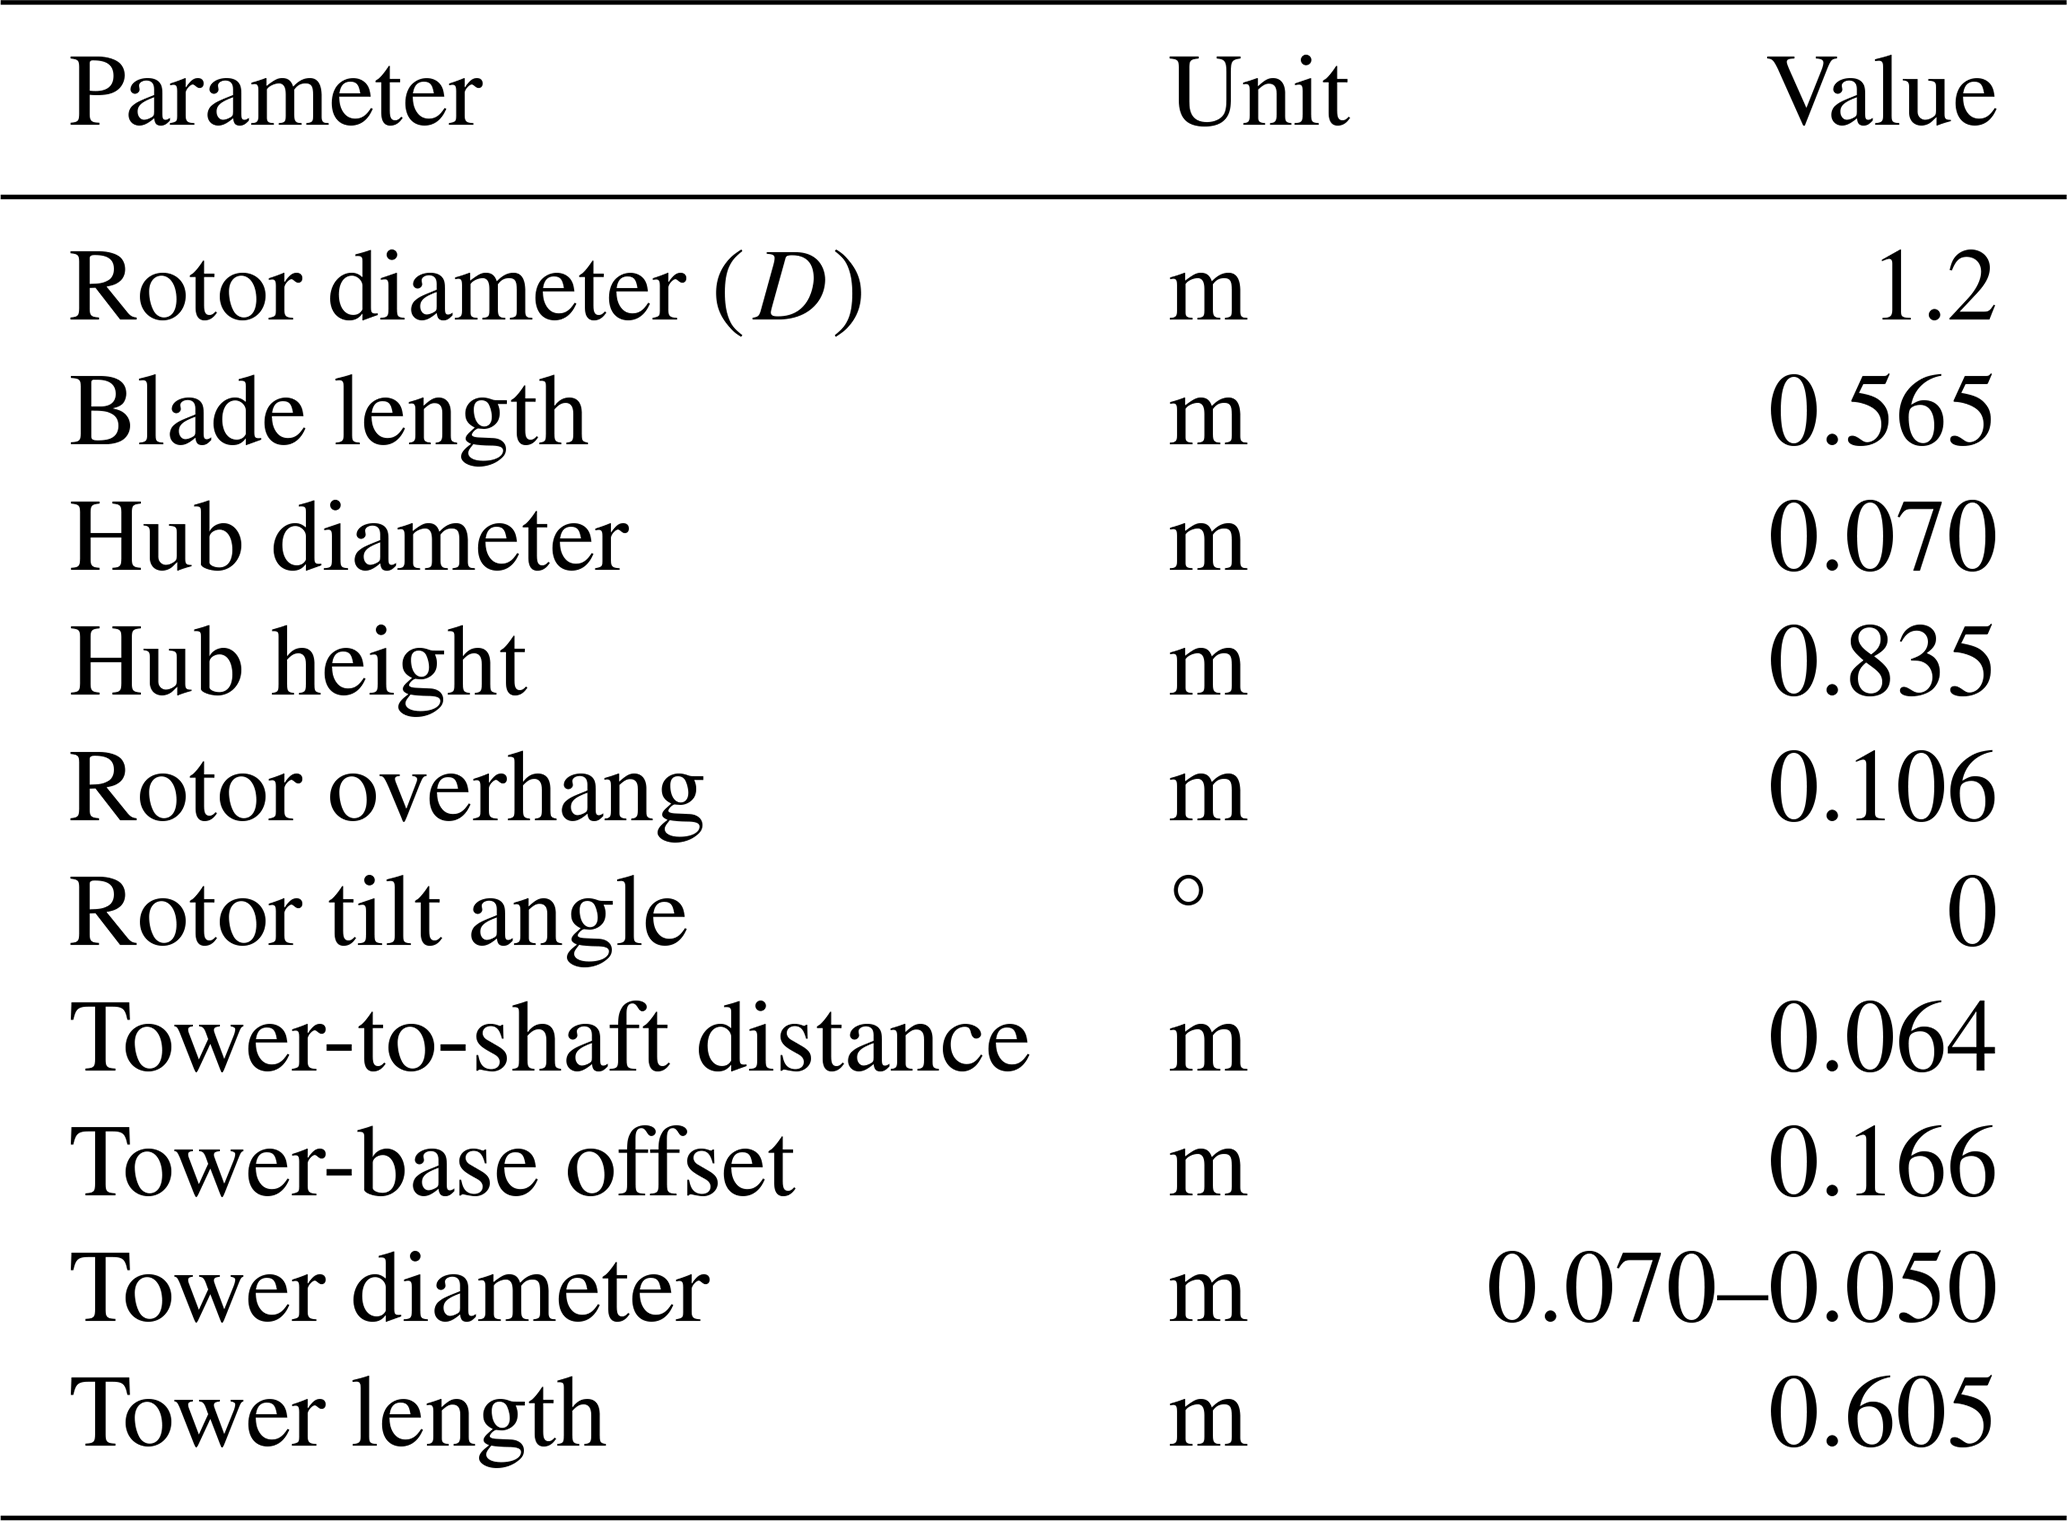
Each rotor was mounted on a robotic platform with a parallel kinematic structure capable of replicating platform surge, pitch, and yaw motions, whose design is described in detail by Fontanella et al. (2024). The geometry of the combined wind turbine–robot assemblies used in the wind tunnel experiment is presented in Table 1. The robot architecture was designed to provide high control accuracy for high-frequency, small-amplitude motions while ensuring sufficient stiffness. Its modular design enabled the deployment of two units within the wind tunnel to simulate a floating wind farm. The turbine tower was integrated with the robotic platform. Its total length is 0.605 m, beginning at 0.166 m above the floor, aligned with the platform's pitch rotation point. The lower 0.305 m of the tower features a square cross-section with sides measuring 0.07 m and houses the nacelle yaw mechanism. The upper 0.3 m section has a circular cross-section with a diameter of 0.05 m.
Table 1Geometry of the wind turbines used for the wind tunnel experiment.
The robotic platforms were designed to position the turbine hubs at a height representative of full-scale wind turbines while maintaining large clearances from the wind tunnel ceiling and lateral walls. This arrangement is important even under uniform inflow conditions, as it allows the wake to develop with asymmetric entrainment of high-momentum flow, predominantly from above and the sides, while entrainment from below is constrained by the ground (Fontanella et al., 2026a).
2.2 Test scenarios
2.2.1 Wind conditions
The experiments were conducted under approximately uniform, low-turbulence inflow conditions, which were selected to minimize the influence of wind shear and free-stream turbulence on turbine wakes and aerodynamic response, thereby facilitating the identification of motion-induced effects.
The inflow was characterized at both turbine locations prior to the experiments, with the turbines removed. As detailed in Appendix A, the mean streamwise velocity had limited variations across the rotor area, with a slight decrease towards the wind tunnel floor. The turbulence intensity was approximately 2 % in most of the rotor area, increasing to approximately 3.5 % near its lower edge. The wind profiles measured at the two turbine locations were very similar, confirming comparable inflow conditions along the test section. The streamwise integral length scale within the rotor region was 0.15 m (model scale). This low-turbulence inflow provides a suitable environment for isolating the effects of platform motion on floating-wind-turbine wakes, as supported by previous studies conducted under similar conditions (Fontanella et al., 2022, 2025, 2026a; Miroux et al., 2026).
During the experiment, the free-stream wind speed was measured using a pitot tube positioned at hub height along the rotor centerline, 3 D upstream of WT1, yielding a reference wind speed of U0 = 4.9 m s−1. The air density was 1.17 kg m−3, calculated from measured temperature, atmospheric pressure, and relative humidity.
2.2.2 Turbine operating conditions
The turbines were operated at fixed rotor speed and blade pitch to eliminate the influence of control actions on the aerodynamic load response. The rotor speeds were selected to reproduce the steady-state operating conditions of full-scale turbines, which regulate rotor speed to maintain the tip-speed ratio (TSR) close to its optimal value. Dynamic rotor-speed variations in response to wind fluctuations were not reproduced, as full-scale control strategies cannot be directly transferred to model-scale turbines (Fontanella et al., 2018), and introducing rotor-speed variations alongside platform motion would increase the complexity and uncertainty in the aerodynamic response (Bergua et al., 2023).
WT1 operated in approximately uniform inflow at a wind speed close to the rated condition. The blade pitch was fixed at 0°, corresponding to the design-optimal setting, and the rotor speed was set to 570 rpm (model scale), resulting in a TSR of 7.3, close to the experimentally determined optimal value (i.e., the one yielding the maximum power coefficient) for the rotor.
The inflow conditions at WT2 were not directly known, as the turbine operated within the wake of WT1, where the mean wind speed was reduced, and the velocity distribution was spatially non-uniform. As for WT1, the blade pitch of WT2 was fixed at 0°. The prescribed rotor speed was determined from an estimate of the rotor-effective wind speed, derived from thrust measurements obtained in the fixed-tower-base configuration. Specifically, the rotor-effective wind speed was computed by inverting a calibrated thrust–wind-speed–rotor-speed relationship obtained from a blade-element momentum (BEM) model of the rotor operating in free-stream conditions (Fontanella et al., 2026a). This effective wind speed represents the uniform inflow velocity that would produce the same mean thrust as measured under wake conditions. The estimated value was 3.1 m s−1, leading to a prescribed rotor speed of 360 rpm to maintain a TSR of 7.3, matching that of WT1.
In principle, the motion of WT1 could modify the mean wake velocity, for example by promoting faster wake recovery, thereby altering the operating TSR of WT2. However, no significant changes in mean wake velocity were observed between the fixed and moving WT1 configurations, as shown in Sect. 4.2.2. Consequently, the rotor speed of WT2 was maintained at 360 rpm across all experimental configurations, resulting in only minor deviations of the mean TSR from its nominal value. This approach is consistent with the steady-state rotor-speed regulation of full-scale turbines, for which similar mean inflow velocities would lead to similar rotor-speed set points.
2.2.3 Definition of platform motions
Platform motions were defined with respect to two reference frames: the inertial frame (xi–yi–zi) and a platform-fixed reference frame (xp–yp–zp) attached to each platform, both illustrated in Fig. 1. The inertial reference frame has its origin Oi on the wind tunnel floor, positioned on the rotor plane of WT1 when the platform is at rest. The zi axis points upward, xi points in the downwind direction, and yi completes a right-handed coordinate system with xi and zi. The platform reference frame is fixed to the robotic platform and moves with the turbine. Its origin Op is located at the tower base, coinciding with the pitch rotation point along the tower centerline. The zp axis is aligned with the tower axis, xp points in the downwind direction when the platform is at rest, and yp completes the right-handed coordinate system with xp and zp.
The floating wind turbines were investigated under sinusoidal surge motion. Surge was selected because it represents a translation of the rotor along the wind direction, directly modifying the relative inflow velocity experienced by the blades. As a result, surge induces significant variations in apparent wind speed, leading to pronounced oscillations in rotor loads. Previous studies have shown that such longitudinal motions dominate the aerodynamic load response of floating wind turbines, whereas lateral or vertical motions have a weaker impact (Schulz et al., 2026; Fontanella et al., 2025). Consequently, surge provides a representative and physically relevant motion to study the coupling between platform dynamics and rotor aerodynamics. The fore–aft rotor motion reproduced through surge in the experiment is representative of floating-wind-turbine operation under wind and wave conditions aligned with the rotor axis, a common operating scenario in offshore environments.
In the experiment, surge was implemented as a translation of the platform reference point Op along the xi direction. The displacement of platform k (where k = 1 for WT1 and k = 2 for WT2) is defined as
where am is the motion amplitude and fm the motion frequency, and ϕk is the phase. The phase ϕ1 is arbitrarily set to 0 so that ϕ2 := ϕ defines the phase shift of WT2 motion relative to WT1. The phase shift between the motions of the upstream and downstream turbines represents the effect of asynchronous excitation, such as that caused by the propagation of ocean waves from one turbine to the other. To investigate this, the experiment considered four phase shift values between the motions of the two turbines: ϕ = . These values were selected to span a full motion cycle and to capture how different relative motions affect wake dynamics and changes in downstream turbine loads.
The sinusoidal motion defined in Eq. (1) is fully characterized by its amplitude and frequency. In this experiment, two motion frequencies were investigated, selected to lie within the range of the natural frequencies of floating platforms. In floating wind turbines, the dominant low-frequency fore–aft motion of the hub may originate from both platform surge and platform pitch eigenmodes. These two modes are hydrodynamically coupled and both produce a longitudinal displacement of the rotor, resulting in significant variations in apparent wind speed under resonant conditions (Mahfouz et al., 2021).
The specific frequency values were chosen based on four floating-wind-turbine concepts designed for the DTU 10 MW reference turbine: the SWE TripleSpar (Lemmer et al., 2020), the LIFES50+ Nautilus (Wise and Bachynski, 2020), the NTNU 10 MW spar (Wise and Bachynski, 2020), and the Softwind spar (Arnal, 2020). At full scale, the surge natural frequencies of these platforms lie between 0.005 and 0.01 Hz (corresponding to 0.3–0.6 Hz at model scale), while the pitch natural frequencies range between 0.028 and 0.04 Hz (1.68–2.4 Hz at model scale). To capture the coupled fore–aft response associated with the surge and pitch eigenmodes, the surge motion frequencies in the experiment were set to 0.5 Hz, representative of the surge mode, and 2 Hz, representative of the pitch mode.
In studies of wind turbine aerodynamics under periodic excitations, whether due to harmonic platform motions or periodic control inputs, it is common to express the excitation frequency in terms of the rotor reduced frequency, a non-dimensional parameter analogous to the Strouhal number, defined as
The two motion frequencies selected for the experiment correspond to reduced frequencies of 0.12 and 0.48.
Beyond the frequencies associated with platform natural modes, floating wind turbines are also excited by waves in the range where wave energy is most concentrated. Ocean waves typically have full-scale periods of 6–10 s, which correspond to 6–10 Hz at model scale. However, performing load measurements at these higher frequencies is challenging. At such frequencies, the flexibility of turbine components can no longer be neglected, and the assumption of a rigid system becomes invalid (Schulz et al., 2024). Furthermore, load cells like those used in this experiment measure the combined effect of aerodynamic and inertial forces, and isolating the aerodynamic contribution from the total measured force becomes increasingly difficult as frequency increases. While inertial forces scale with the square of the motion frequency, aerodynamic load oscillations scale approximately linearly with frequency (for a constant motion amplitude) at reduced frequencies up to approximately 1.1, as supported by experimental and numerical investigations (Bergua et al., 2023). This behavior arises because, at relatively low reduced frequencies, the aerodynamic response is primarily governed by the apparent-wind-speed variations induced by rotor motion. Additionally, motions in the wave frequency range of 6–10 Hz correspond to reduced frequencies of approximately 1.44–2.4. Recent wind tunnel experiments by Fontanella et al. (2025) and Messmer et al. (2024a) have shown that, at these reduced frequencies, the wake response to platform motion is negligible beyond the near-rotor region. Therefore, platform motions at such frequencies are not expected to induce significant dynamic wake interactions in floating wind farms and were not studied.
The platform velocity resulting from the harmonic motion of Eq. (1) is
Platform surge motion induces an apparent-wind-speed variation at the rotor, with an amplitude of ΔU = = am⋅(2πfm).
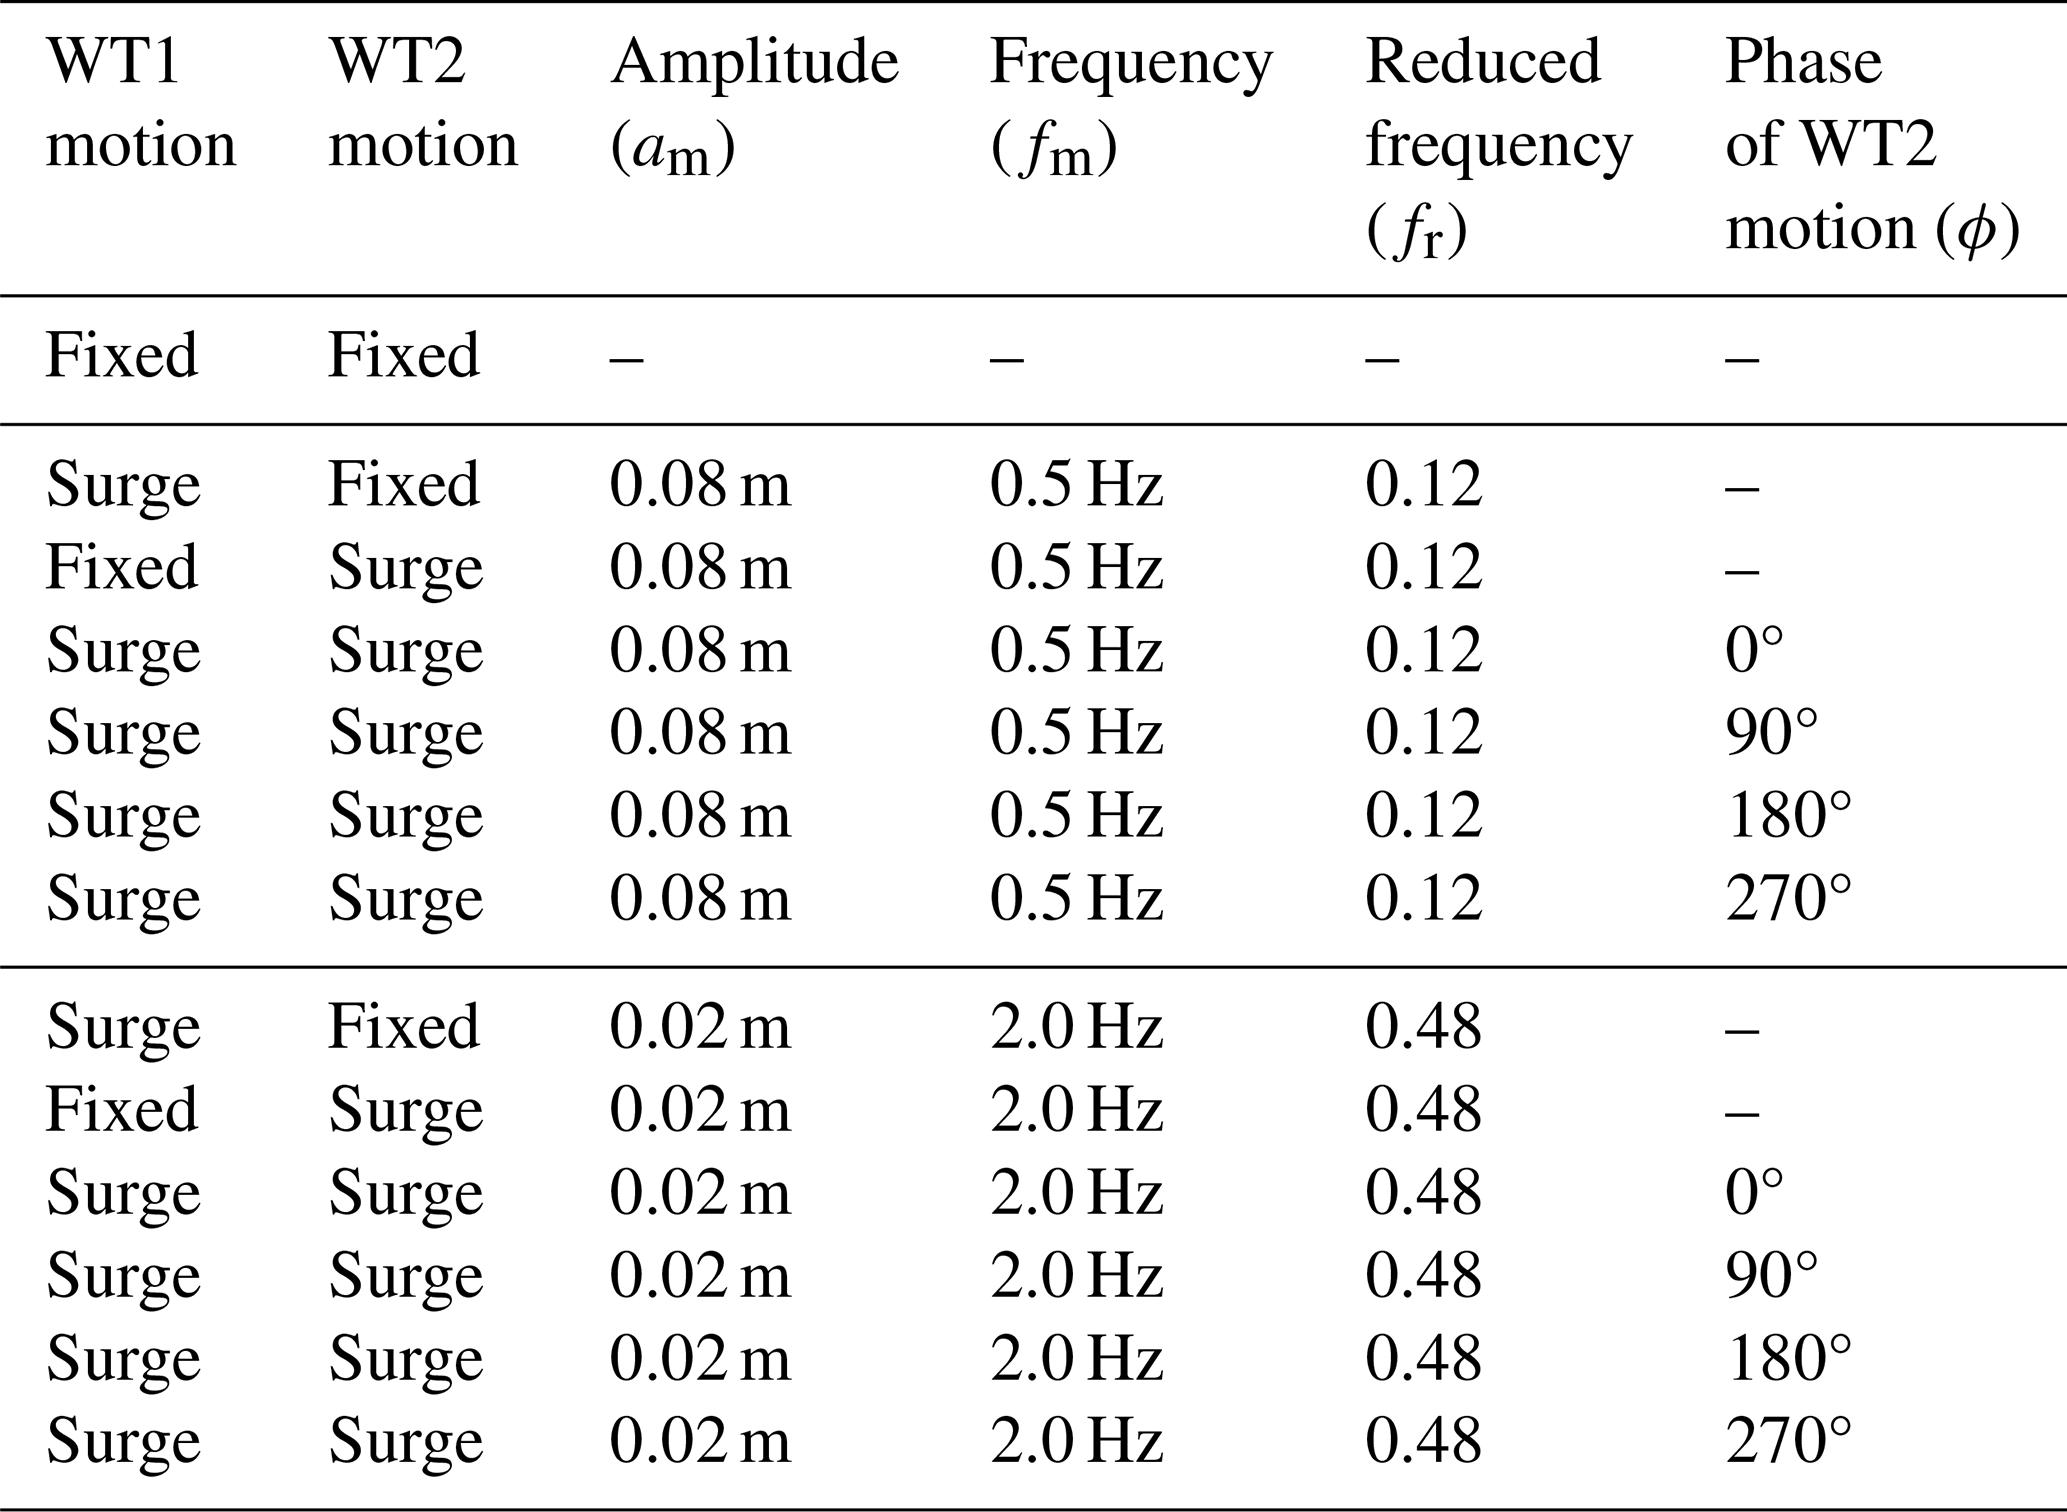
The amplitude of surge motion directly affects variations in the apparent wind speed, which in turn drive oscillations in rotor thrust (Bergua et al., 2023) and influence the wake response. These variations are typically quantified using the ratio . In this experiment, the motion amplitudes were selected to achieve a target of 5 % for the upstream wind turbine at both tested frequencies, corresponding to a variation in the apparent wind speed of 0.25 m s−1 at model scale. This value is consistent with those used in previous wind tunnel studies on wind turbine aerodynamics (Schulz et al., 2024) and on the wake behavior of single turbines (Fontanella et al., 2025; Messmer et al., 2024a). To achieve this target, the surge motion amplitudes were set to 0.08 m (0.067 D) and 0.02 m (0.017 D) for reduced frequencies of fr = 0.12 and fr = 0.48, respectively.
In addition to the configurations in which both turbines underwent harmonic surge motion with a prescribed phase offset, two configurations in which either turbine moved independently were investigated to isolate the contributions of downstream rotor motion and motion-induced wake velocity fluctuations to the aerodynamic response of the downstream turbine. These configurations are as follows.
- -
WT1 fixed: WT1 remains fixed while WT2 undergoes harmonic surge motion within its wake. Unlike WT1, which operates in approximately uniform free-stream conditions, WT2 experiences a spatially non-uniform inflow with a reduced mean velocity. This configuration allows the aerodynamic response of a moving turbine operating within a wake to be compared with that of a turbine undergoing the same motion in the free stream, thereby assessing the influence of wake conditions on motion-induced aerodynamic loads.
- -
WT2 fixed: WT1 undergoes harmonic surge motion, while WT2 remains fixed, experiencing the periodic wake velocity fluctuations generated by the upstream turbine motion. In this configuration, WT2 acts as an inflow sensor, allowing the effects of motion-induced wake velocity fluctuations on downstream turbine loads to be quantified independently of downstream rotor motion.
Table 2 summarizes the prescribed motion conditions for WT1 and WT2.
Table 2Overview of the prescribed harmonic motions of WT1 and WT2. Motion amplitudes of 0.08 and 0.02 m correspond to 0.067 D and 0.017 D, respectively, where D denotes the rotor diameter.
2.3 Measurements
The test campaign provided measurements of the aerodynamic loads on the two wind turbines, their platform motions, and the flow field within the wind farm.
Platform motions were recorded via the linear encoders integrated into the robotic platforms, while the rotational speeds of the wind turbine generators were measured using magnetic encoders. The aerodynamic loads were captured by ATI Mini45 SI-580-20 load cells, which measured the three force components and three moment components at the interface between the tower top and nacelle of each turbine.
The streamwise velocity component in the turbine wake was measured using two hot-wire anemometers (DANTEC 55P11 single-sensor probes with a 5 µm wire diameter). Platform motions can introduce oscillations in the crosswind velocity components. However, their magnitudes are typically an order of magnitude lower than the streamwise velocity within the analyzed wake region (Fontanella et al., 2025; Messmer et al., 2024a). Therefore, streamwise velocity measurements were prioritized. The hot-wire probes were connected to a DISA55M system operating in constant-temperature mode and sampled at 10 kHz.
Prior to testing, the hot-wire probes were calibrated using a reference nozzle reproducing wind speeds over the velocity range expected in the experiments with the turbines. After calibration, the measurement uncertainty in the hot-wire system was determined using a Monte Carlo simulation, accounting for uncertainties arising throughout the entire measurement process, including calibration. Factors contributing to the uncertainty included the accuracy of the data acquisition board; the pressure transducer, which influences the reference flow velocity during calibration and wind tunnel tests; and the uncertainty in the thermocouple, which is used to adjust the hot-wire voltage for ambient temperature variations. The resulting average expanded uncertainties, at a 95 % confidence level, are 0.17 m s−1 for flow speed and 0.4 % for turbulence intensity.
The two hot-wire probes were mounted on an automated traversing system equipped with two motorized axes, allowing controlled positioning within the crosswind plane. Velocity profiles were acquired along horizontal lines aligned with the yi axis at hub height, as illustrated in Fig. 1d. Each profile comprised 29 evenly spaced measurement stations, separated by 0.06 m (0.05 D), covering the range yi = −0.7 D to yi = 0.7 D. The probes were traversed sequentially across these stations, and therefore velocity measurements at different lateral positions were not acquired simultaneously. This measurement approach relies on the predominantly periodic nature of the wake response to platform motion. The spatial distribution of the motion-synchronized velocity fluctuations was reconstructed by phase-aligning the measurements at each station with the platform motion signal, as described in Sect. 3.2 and Appendix B.
The traversing system was positioned at four streamwise locations within the wind farm to capture the flow evolution. These positions, shown in Fig. 1c, correspond to 3.5, 4.3, 7.75, and 9.25 D downstream of WT1. The last two positions are at 2 and 3.5 D downstream of the WT2 rotor, respectively.
3.1 Loads
The tower-top loads were post-processed to isolate the aerodynamic rotor loads. The raw measurements include contributions from rotor aerodynamics as well as inertial forces associated with the imposed surge motion of the rotor–nacelle assembly. The inertial contribution at the motion frequency was removed using the post-processing method described in Fontanella et al. (2021) and exemplified in Appendix B. This approach consists of repeating the same prescribed motion under no-wind conditions with the rotor at rest, measuring the resulting loads (which contain inertial effects only), and subtracting them from the corresponding measurements obtained with wind and a rotating rotor.
The aerodynamic rotor loads were analyzed in both the frequency and time domains. In the frequency domain, the zero-to-peak amplitude of the loads was obtained as the magnitude of the fast Fourier transform (FFT) at the platform motion frequency. The phase shift between the aerodynamic rotor load and the platform motion was determined from the real and imaginary components of the FFT at the frequency of interest.
In the time domain, the load signals contain components at the blade-passing frequency due to mass imbalance, additional harmonics arising from aerodynamic asymmetries, and residual contributions related to tower flexibility that are not fully removed by the subtraction procedure. To isolate the aerodynamic load response associated with platform motion, the signals were low-pass-filtered using a 3 Hz cut-off frequency. Filtering was performed in the frequency domain by applying the FFT, retaining frequency components up to 3 Hz, and reconstructing the signal via inverse FFT. This procedure removes the rotor rotational frequency (9.5 Hz for WT1 and 6 Hz for WT2) and its harmonics and the tower fore–aft frequency (23 Hz) while preserving the load response at 2 Hz, the highest platform motion frequency investigated. The filtered time series included approximately 80 periods of platform motion. These data were subsequently binned according to platform motion and phase-averaged.
3.1.1 Load coefficients and power
The analysis focuses on the aerodynamic thrust force (Fx) and torque (Mx). Thrust is a key contributor to the coupled dynamics of floating wind turbines, as it drives platform motion, affects structural loading, and governs wake formation; torque determines power production and influences drivetrain dynamics.
To facilitate comparison with other studies, rotor loads are reported in non-dimensional form. The thrust coefficient is defined as
and the torque coefficient as
The aerodynamic power (P) was computed as the product of the aerodynamic torque obtained from the load cell and the rotor angular velocity. Although the turbines operated at nominally fixed rotational speed, the actual rotor speed was measured using an encoder and used in the power calculation. The corresponding power coefficient is defined as
3.1.2 Equivalent aerodynamic damping
Platform motions of floating wind turbines that involve displacement of the rotor in the wind direction are strongly influenced by aerodynamic damping. This effect arises because platform oscillations modulate the apparent wind speed, inducing periodic variations in aerodynamic loads, particularly in thrust. These thrust variations can either oppose or reinforce the motion depending on their phase relationship with the platform velocity, thereby providing positive or negative aerodynamic damping (Jonkman, 2008). Quantifying this contribution is therefore essential to characterize the dynamic response of the turbine.
The harmonic platform motion at frequency fm induces a thrust response with a dominant component at the same frequency. This fundamental harmonic component is represented by a sinusoidal function of the form
where af is the amplitude of the thrust oscillation, and ϕf is its phase relative to the motion of the same turbine generating the thrust. Using trigonometric identities, the force can be decomposed as
The first term is in phase with the platform displacement, while the second term is in phase with the platform velocity, which is proportional to cos (2πfmt) (see Eq. 3). The latter therefore represents the damping component of the aerodynamic thrust force:
The aerodynamic damping force is commonly expressed as , where ceq is the equivalent aerodynamic damping coefficient, and is the platform velocity defined in Eq. (3). By equating the velocity-proportional term of the thrust force to , the equivalent aerodynamic damping coefficient associated with the thrust oscillation becomes
This expression shows that the sign and magnitude of aerodynamic damping are governed by the phase ϕf: a phase close to −90° yields positive damping, whereas deviations from this value reduce the stabilizing contribution of the thrust force.
3.2 Wake
Velocity measurements from the hot-wire anemometry were sampled at 10 kHz to provide sufficient temporal resolution and limit aliasing of high-frequency fluctuations. The acquired signals were subsequently low-pass-filtered at 100 Hz during post-processing to remove high-frequency electrical noise while preserving the turbulent fluctuations relevant to the analysis. The cut-off frequency was selected based on an autocorrelation analysis of the velocity measurements to ensure that the energy-containing turbulent scales and part of the inertial range were retained. As further validation, the 100 Hz filtering in free-stream, low-turbulence regions yielded a turbulence intensity of approximately 2 %, consistent with typical values for the wind tunnel that hosted the experiment. Although filtering was less critical in the wake (high-turbulence regions), it was applied uniformly for consistency.
The acquisition time at each measurement point was 20 s, corresponding to 10 motion cycles for the 0.5 Hz excitation and 40 cycles for the 2 Hz case. The acquisition duration corresponds to approximately 20 min at full scale, based on the geometric and velocity scaling adopted in the experiment. To assess whether this duration was sufficient to obtain stable wake statistics, a convergence study was conducted by progressively increasing the number of motion cycles used to compute the main velocity metrics. The results, presented in Appendix B, indicate that these quantities exhibit limited sensitivity to the length of the acquisition window.
The velocity time series were binned and phase-averaged following the same procedure used for the load data, with an example provided in Appendix B. The spatially correlated velocity response at the platform motion frequency was reconstructed by phase-aligning the data with the platform motion signal of WT1.
Velocity metrics
The instantaneous spatially averaged streamwise velocity over the rotor region (for D) is defined as
where uj(t) is the instantaneous velocity at the jth measurement point, located at radial distance rj from the xi axis, and Np is the number of measurement points within the rotor region. This operation represents a spatial averaging over the rotor disk at each time instant, yielding a time-resolved signal Uavg(t).
The overall mean streamwise velocity is then obtained as the time average of this signal:
The turbulence intensity is computed at the jth measurement station as
where σu,j is the standard deviation of the streamwise velocity.
The available power index over the rotor region is defined as
where is the time-averaged streamwise velocity at the jth measurement point, and Ar is the rotor area. This quantity provides an estimate of the spatially averaged cubic velocity over the rotor region and is proportional to the kinetic energy flux available to a turbine.
The analysis focuses on the aerodynamic thrust force, torque, power, and wake velocity metrics defined in Sect. 3.
4.1 Loads of the upstream turbine
In the fixed-tower-base configuration, the upstream turbine (WT1) was tested in nine repeated runs distributed over the course of the experimental campaign, for example at the start of each testing day, to verify the consistency of the measurements. The average thrust force was 13.1 N, corresponding to Ct = 0.82, while the average torque was 0.37 Nm, yielding Cq = 0.04. Under these conditions, WT1 produced 22.14 W of aerodynamic power, corresponding to a Cp of 0.28.
When the turbine undergoes platform motion, rotor loads oscillate. Figure 2 shows the rotor thrust and torque of WT1 over one period of surge motion, for the two motion frequencies investigated. Each condition was tested five times on separate days during the experimental campaign to ensure consistency of the measurements. The time average values of Fx and Mx remain close to those measured in the fixed-tower-base scenario.
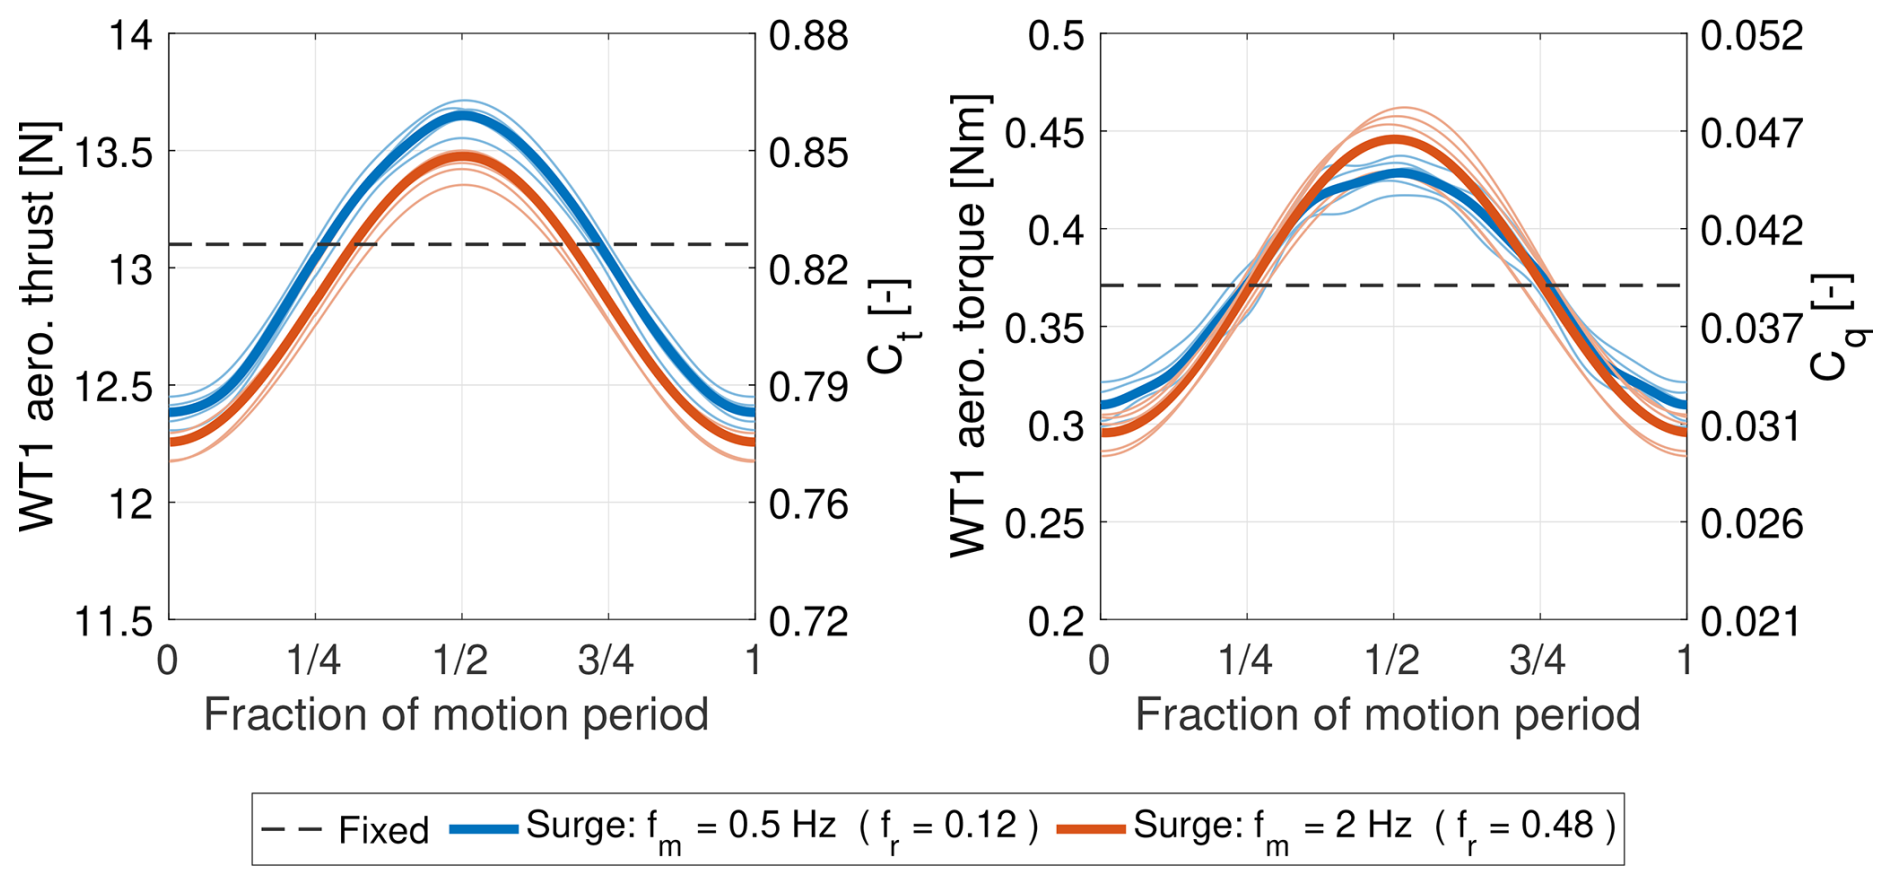
Figure 2Aerodynamic rotor thrust and torque of the upstream wind turbine (WT1) over one period of surge motion at two different motion frequencies (fm). Thin lines represent the five repeated tests performed for each condition, while thick lines indicate their average.
Both thrust and torque exhibit an approximately sinusoidal response dominated by the platform motion frequency. The maximum occurs at half a motion period, when the rotor moves upwind and experiences the highest apparent wind speed; the minimum occurs at the start of the motion cycle, when the rotor moves downwind, and the apparent wind speed is lowest. The amplitude of load oscillations is similar for the two motion frequencies, indicating that the response is proportional to the apparent wind speed. This behavior is consistent with the quasi-steady aerodynamic response observed in previous studies under comparable operating conditions (Schulz et al., 2024; Bergua et al., 2023).
4.2 Wake of the upstream turbine
4.2.1 Fixed tower base
Figure 3 illustrates the characteristics of the wake produced by the upstream wind turbine at hub height, in the configuration where the tower base is fixed.
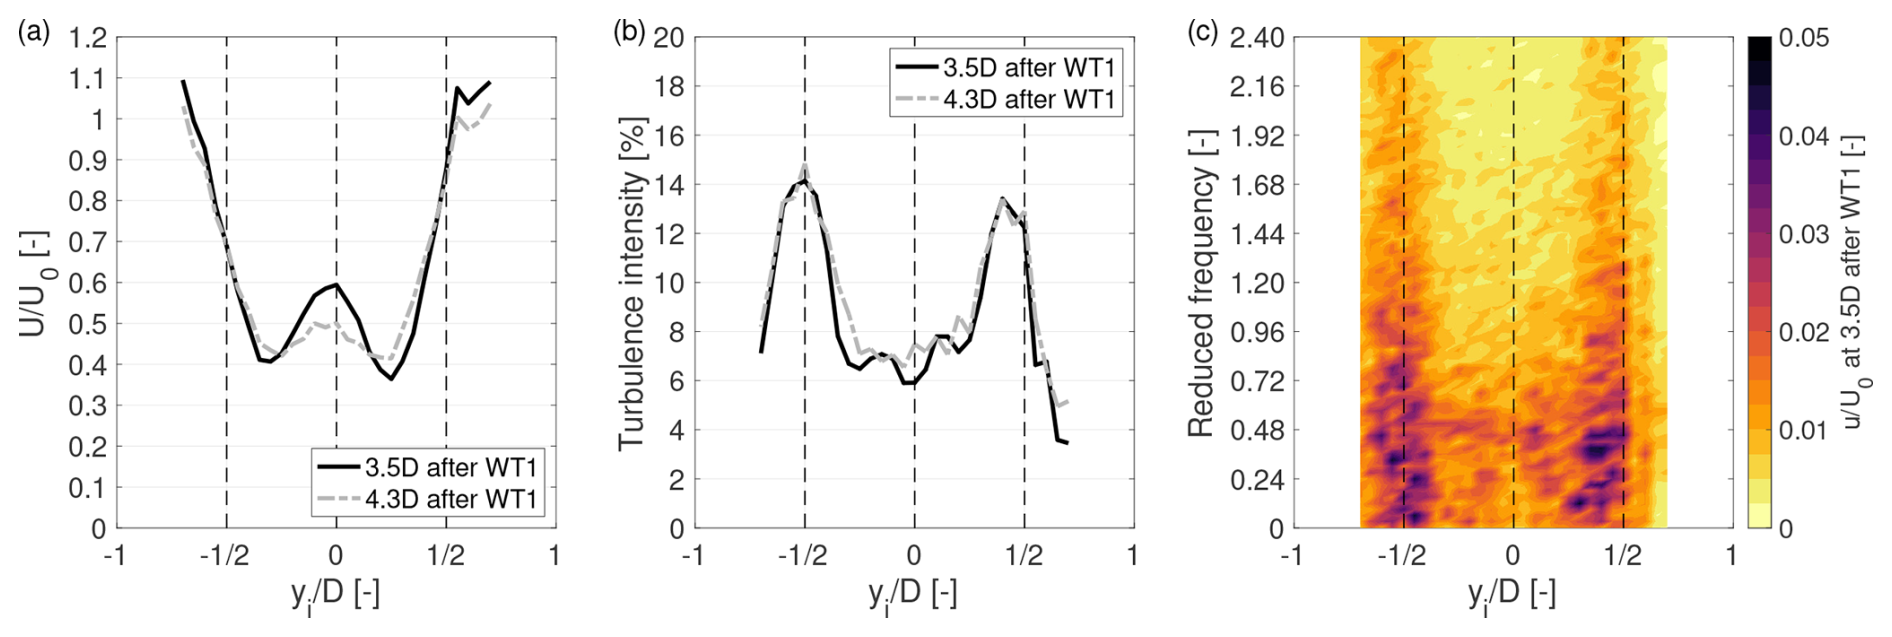
Figure 3Wake characteristics of the upstream wind turbine (WT1) at hub height, with a fixed tower base. (a) Time-averaged streamwise velocity normalized by the free-stream velocity (). (b) Turbulence intensity. (c) Spectrum of the streamwise velocity component (u), normalized by the free-stream wind speed (U0), measured at hub height at a downstream distance of 3.5 D from the WT1 rotor.
Figure 3a shows the time-averaged streamwise velocity profiles at 3.5 and 4.3 D downstream of the rotor. At both locations, the profiles display a clear double-Gaussian shape, with local minima on either side of the rotor axis. This structure reflects the non-uniform radial distribution of momentum extraction across the rotor disk, which is stronger near the blade mid-span and weaker near the center and tips. In the fixed-tower-base case, the average streamwise velocity () is 0.55 U0 (2.71 m s−1) at 3.5 D, increasing to 0.57 U0 (2.79 m s−1) at 4.3 D, indicating a slight wake recovery over this downstream distance. Figure 3b presents the horizontal profiles of turbulence intensity. The profiles exhibit a characteristic saddle-shaped distribution, with local maxima located near the rotor edges. These peaks are associated with the shear layers developing at the interface between the wake and the free stream, as well as with the tip vortices shed by the rotor blades.
Between 3.5 and 4.3 D, the wake structure evolves only slightly. The streamwise velocity profile begins to homogenize modestly, while the turbulence intensity increases slightly in the central region of the wake. However, the persistence of the double-Gaussian velocity profile and the concentration of turbulence near the rotor edges at 4.3 D indicate that the wake remains coherent and has not yet broken down. This persistence is attributed to the low turbulence levels in the free stream, which reduce mixing and delay wake recovery.
Figure 3c presents the spectrum of the streamwise velocity component at hub height, measured 3.5 D downstream of the WT1 rotor. The maximum amplitude of velocity fluctuations is found in correspondence of the rotor edges; the amplitude is almost constant for reduced frequencies below 0.72 and gradually decreases for increasing reduced frequency. The turbulence in the center of the wake has a lower amplitude that is almost constant for reduced frequencies below 0.72 and decreases more rapidly for increasing reduced frequency.
4.2.2 Effect of surge motion
When the wind turbine undergoes platform motion, its aerodynamic thrust force oscillates due to variations in the apparent wind speed, as shown in Fig. 2. This pulsating thrust results in a periodically varying momentum deficit in the wake. Moreover, the dynamic blade loads associated with the changing apparent wind speed lead to time-varying strength of the vorticity shed at the blade tips and roots. Additionally, as the rotor moves in space during the platform motion cycle, the shed vorticity and wake structures are generated from different spatial positions. The combination of dynamic rotor loads and rotor movement modify both the strength and structure of the flow behind the WT1 rotor, resulting in a dynamic wake with characteristics that differ from those of the wake produced by a bottom-fixed turbine.
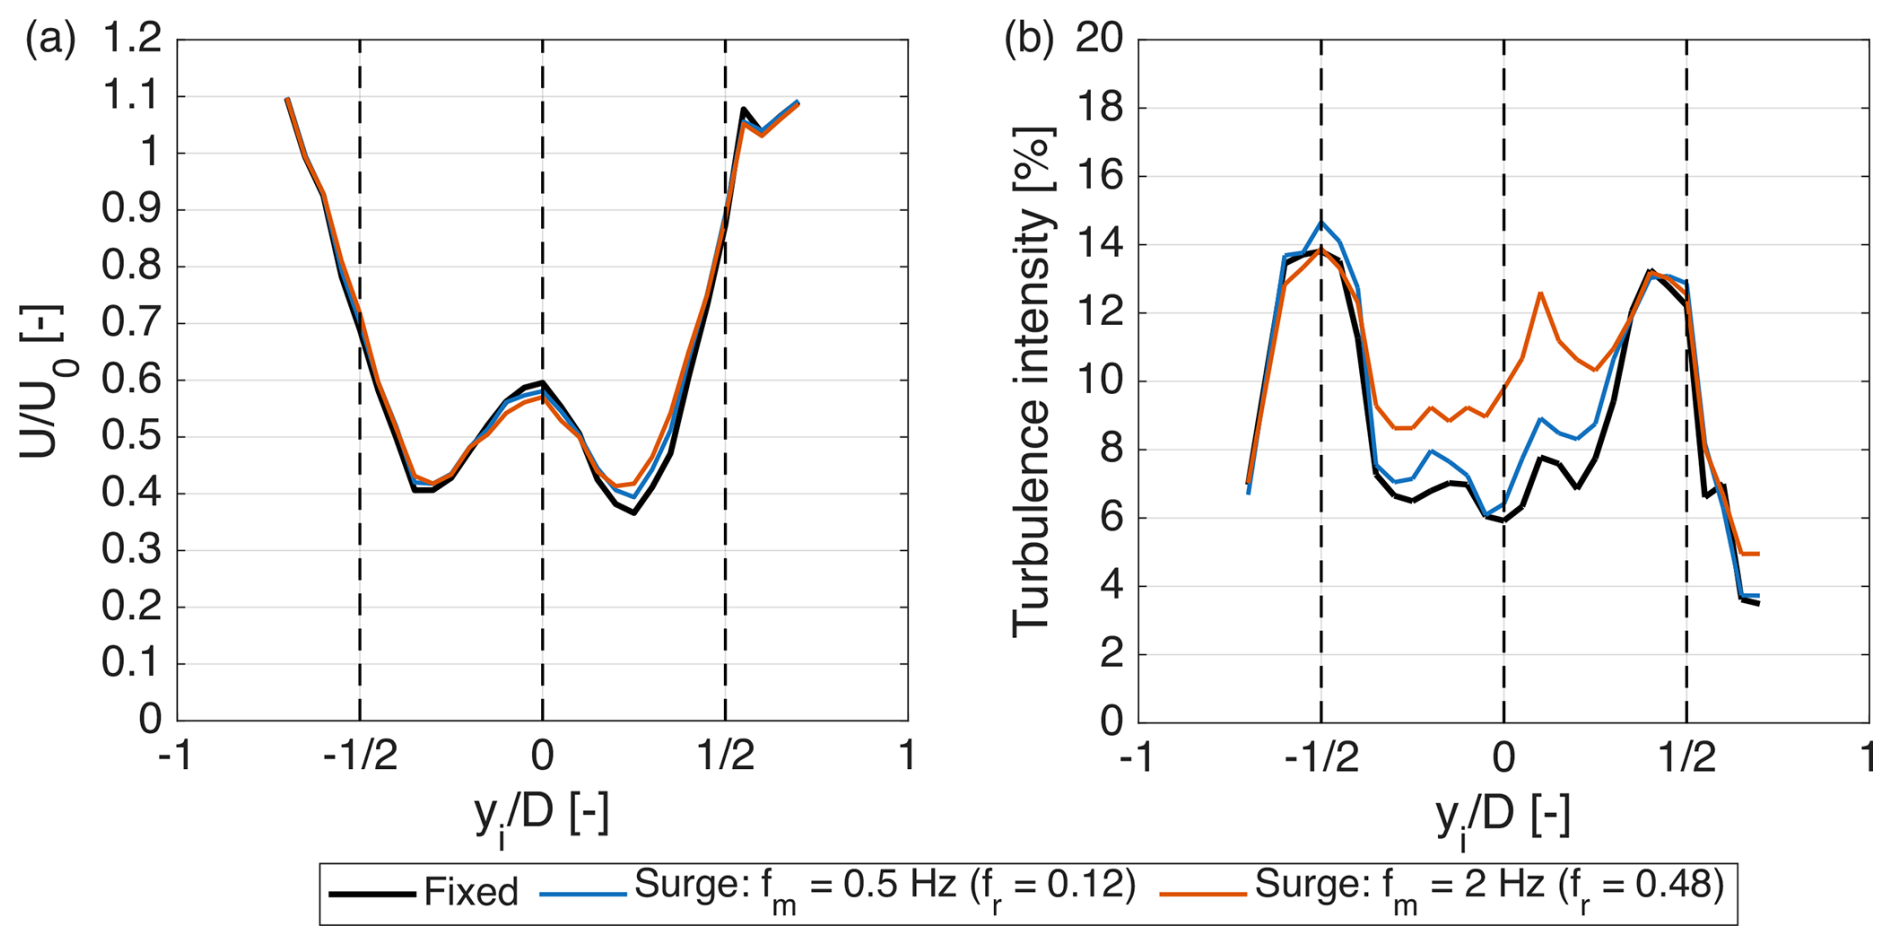
Figure 4Time-averaged wake characteristics of the upstream wind turbine (WT1) at hub height and 3.5 D downstream of the rotor under fixed-tower-base and surge motion conditions (fr = 0.12 and fr = 0.48). (a) Time-averaged streamwise velocity normalized by the free-stream velocity (). (b) Turbulence intensity.
To assess whether these modifications affect the time-averaged characteristics of WT1 wake, Fig. 4 compares the mean streamwise velocity and turbulence intensity profiles at hub height for the fixed case and for the two surge motion conditions investigated (fr = 0.12 and fr = 0.48), at a downstream distance of 3.5 D. Surge motion has a limited impact on the time-averaged velocity profiles, with a slight increase in velocity near the local minima of the profiles, particularly at the higher reduced frequency (fr = 0.48). These relatively small differences between fixed and surge conditions are consistent with previous wind tunnel experiments on isolated floating wind turbines, which reported limited modifications to the mean wake velocity at similar downstream distances (3–4 D), despite the presence of motion-induced velocity fluctuations (Messmer et al., 2024b; Fontanella et al., 2025). Although the convergence analysis presented in Appendix B indicates that the mean velocity estimates are relatively insensitive to the acquisition duration, repeated measurements were not available to quantify the uncertainty associated with the observed differences. Therefore, these differences should be interpreted as indicative trends rather than statistically established changes in wake recovery.
In contrast, the turbulence intensity profiles show a clearer influence of surge motion. Compared to the fixed case, turbulence levels increase, particularly in the central region of the wake, with a more pronounced rise at fr = 0.48.
While the impact of surge motion on the time-averaged wake is limited, its effect on the unsteady wake behavior is more pronounced. Figure 5 therefore examines the dynamics of the WT1 wake at hub height and at a downstream distance of 3.5 D from the rotor for the two surge motion frequencies. In both cases, the platform motion induces thrust oscillations of equal amplitude, allowing the influence of motion frequency on wake dynamics to be isolated.
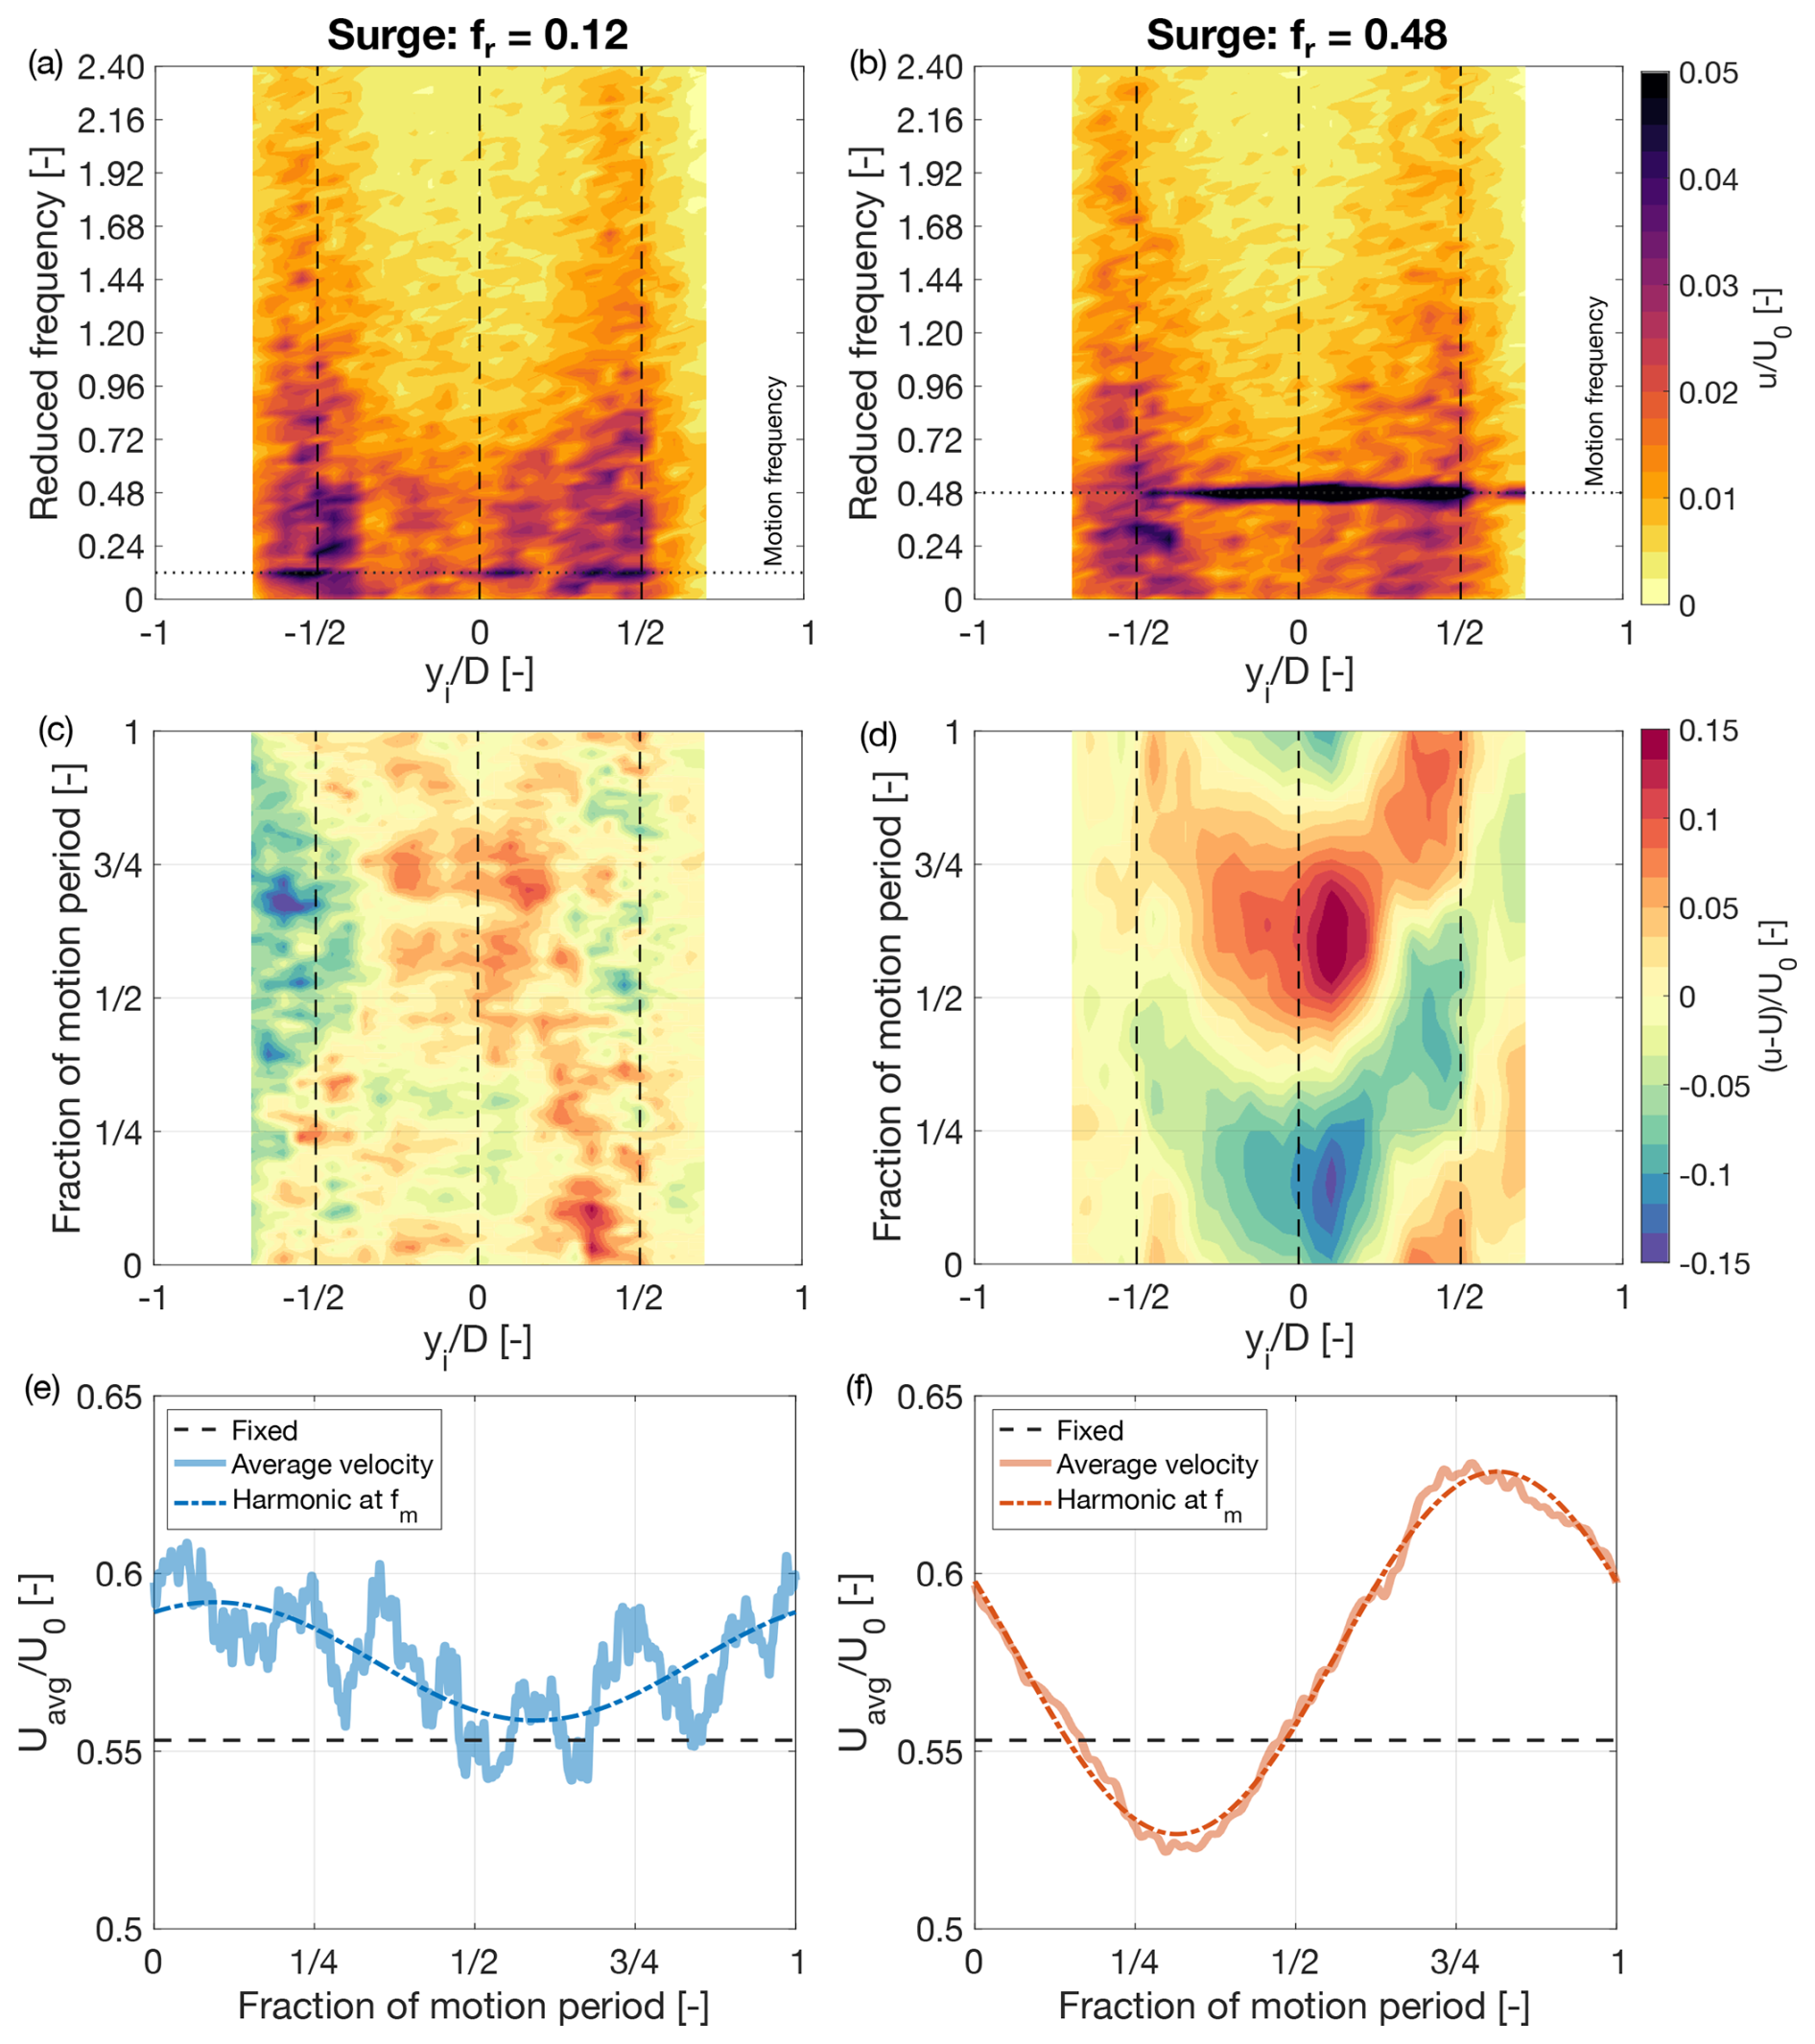
Figure 5Dynamics of the wake of the upstream wind turbine (WT1) at hub height and 3.5 D downstream of the rotor during surge motion at two reduced frequencies (fr). (a, b) Spectrum of the streamwise velocity component (u), normalized by the free-stream wind speed (U0). (c, d) Variation in velocity from the time-averaged value over one period of platform motion. (e, f) Response of the spatially averaged wake velocity Uavg, normalized by U0, within one motion cycle; “fixed” refers to the case where the turbine tower base is fixed (no platform motion).
The frequency content of the wake velocity is shown in the spectra in Fig. 5a and b. For both motion frequencies, the wake exhibits a distinct spectral peak – often referred to in the literature as a “signature” – at the frequency of the imposed platform motion, confirming that the wake responds at the same frequency. At the lower reduced frequency (fr = 0.12), the spectral peak is localized in the wake shear layers and in the central region of the wake. In contrast, at fr = 0.48, the peak extends across the full rotor width, indicating a more widespread wake modulation. The spectral content at frequencies other than the motion frequency remains largely unchanged compared to the fixed case (see Fig. 3), indicating that platform motion primarily introduces a coherent perturbation at the motion frequency without significantly affecting the broader turbulent content of the wake. The increase in turbulence intensity observed in Fig. 4b is primarily due to the additional energy introduced at the motion frequency, rather than to a broadband modification of turbulence.
Figure 5c and d show the variation in wake velocity over one motion cycle relative to its time-averaged value. This visualization highlights the presence and spatial distribution of any periodic response in the wake. The time-varying velocity is color-coded: red tones indicate regions of flow acceleration relative to the mean velocity, while blue tones indicate deceleration. When such acceleration–deceleration cycles occur once per platform motion period, they reflect a wake response synchronized with the surge motion. In both motion scenarios, the wake exhibits a periodic acceleration and deceleration pattern, commonly referred to as “pulsing”. For fr = 0.12, this pulsing is evident in the wake core and the edges, with a maximum amplitude of approximately 5 % of the free-stream velocity (0.05 U0). At fr = 0.48, the pulsing is stronger and primarily concentrated in the central region of the wake, reaching amplitudes of up to 0.15 U0. This behavior of the wake is consistent with the observations reported by Messmer et al. (2025) under comparable motion conditions (similar amplitude and reduced frequency), downstream distance, and free-stream turbulence intensity.
Interestingly, at both reduced frequencies, the wake core and edges oscillate in near-counter-phase: when the velocity in the core increases, the wake edges decelerate, and vice versa. This behavior can be explained by considering that the periodic perturbations generated at the rotor are advected downstream with a velocity that varies across the wake. In particular, the advection velocity is lower in the wake core, where the flow is slower, and higher near the wake boundaries. As a result, perturbations originating at the rotor reach a given downstream location with different time delays depending on their radial position. This differential advection leads to a phase shift across the wake, giving rise to the observed counter-phase behavior between the core and edges.
The overall wake dynamics are further characterized by the spatially averaged velocity, Uavg, over one motion cycle, as shown in Fig. 5e and f. This quantity represents the average axial velocity over the wake cross-section and reflects the large-scale influence of the turbine motion on the stream tube. The Uavg data points obtained from phase-averaging were fitted with a sine function with a frequency equal to the motion frequency to emphasize the velocity oscillations that match the platform motion. At fr = 0.12, the wake velocity fluctuations at the platform motion frequency are less prominent relative to the residual turbulent fluctuations than at fr = 0.48. Nevertheless, the spectral peaks at the motion frequency in Fig. 5a, b confirm the presence of a motion-synchronized wake response in both cases. At the lower reduced frequency, however, this response is less uniformly distributed across the wake, with stronger oscillations concentrated at specific lateral positions. Consequently, spatial averaging reduces the prominence of the motion-synchronized component relative to the residual turbulent fluctuations, which are not synchronized with platform motion but are not entirely eliminated by phase averaging. As shown in Fig. B2, the response at fr = 0.48 remained smoother than at fr = 0.12 when phase averaging was performed using 10 cycles for both conditions, indicating that the observed difference is not due to the different numbers of averaging cycles. At fr = 0.12, the motion-synchronized velocity component has a peak-to-peak amplitude of 0.03 U0, while the time-averaged velocity () is 2.79 m s−1, representing an increase of 0.08 m s−1 (+2.9 %) relative to the fixed-base case. At fr = 0.48, the motion-synchronized velocity component becomes more pronounced, with a peak-to-peak amplitude of 0.10 U0. The time-averaged velocity increases to 2.83 m s−1, corresponding to a gain of 0.12 m s−1 (+4.4 %) relative to the fixed-base case.
Although the amplitude of the apparent-wind-speed variations experienced by the WT1 rotor, and consequently the resulting thrust oscillations, is the same at both reduced frequencies, the wake response differs markedly. At fr = 0.48, the motion-synchronized wake velocity fluctuations are substantially larger than at fr = 0.12, highlighting the dominant role of motion frequency in shaping wake pulsing. The two cases also exhibit different phase relationships between the motion-synchronized wake velocity fluctuations and the platform motion of WT1. At 3.5 D downstream of the rotor, the peak wake velocity occurs at approximately 0.1 of the motion cycle for fr = 0.12, compared with approximately 0.8 of the cycle for fr = 0.48. Since the mean wake velocity, and thus the characteristic advection velocity of the flow structures, is similar in both cases (see Fig. 4a), this difference can be primarily attributed to the motion frequency.
Overall, the results show that surge motion induces a coherent periodic modulation of the wake of WT1, with the wake responding at the frequency of the imposed motion. While both surge motion conditions generate wake pulsing, the one with higher reduced frequency (fr = 0.48) produces stronger, more spatially coherent velocity oscillations. This condition is also associated with a small increase in mean wake velocity compared to the fixed case, suggesting slightly enhanced wake recovery. At higher frequencies, the shorter oscillation period means that wake perturbations undergo a larger phase shift during advection to the downstream turbine. Consequently, the motion frequency determines the amplitude of the wake velocity oscillations and also their timing relative to the motion of WT2. These periodic velocity fluctuations in the wake of WT1 constitute the unsteady inflow experienced by WT2 and provide the basis for investigating how wake-induced velocity oscillations interact with downstream rotor motion and influence its aerodynamic response.
4.3 Load response of the downstream turbine
In the fixed-tower-base configuration, the aerodynamic loads on WT2 were measured over seven repeated runs. The average thrust force was 4.5 N, corresponding to a thrust coefficient of Ct = 0.28, while the average torque was 0.06 Nm, yielding a torque coefficient of Cq = 0.01. Under these conditions, WT2 generated 2.14 W of aerodynamic power, corresponding to a power coefficient of Cp = 0.03. All non-dimensional coefficients were computed using the free-stream wind speed U0 as a reference. The load coefficients can also be referenced to the rotor-effective wind speed of 3.1 m s−1 instead of U0 to better account for the actual inflow conditions at the rotor. When this reference is used, WT2 has Ct = 0.70 and Cp = 0.11. When referenced to the rotor-effective wind speed, the reduction in Cp relative to WT1 is substantially greater than that in Ct (0.11 versus 0.28 for Cp and 0.70 versus 0.82 for Ct). This difference may be partly attributed to the lower blade Reynolds numbers experienced by WT2 due to its reduced inflow velocity and rotational speed, which can affect aerodynamic torque more strongly than thrust. The spatial non-uniformity of the wake velocity may also contribute to the lower Cp and Ct of WT2 by altering the local blade operating conditions, even when the nominal TSR is maintained. Furthermore, the rotor-effective wind speed used for normalization does not fully account for the non-uniform wake inflow, potentially contributing to the observed differences in the aerodynamic coefficients.
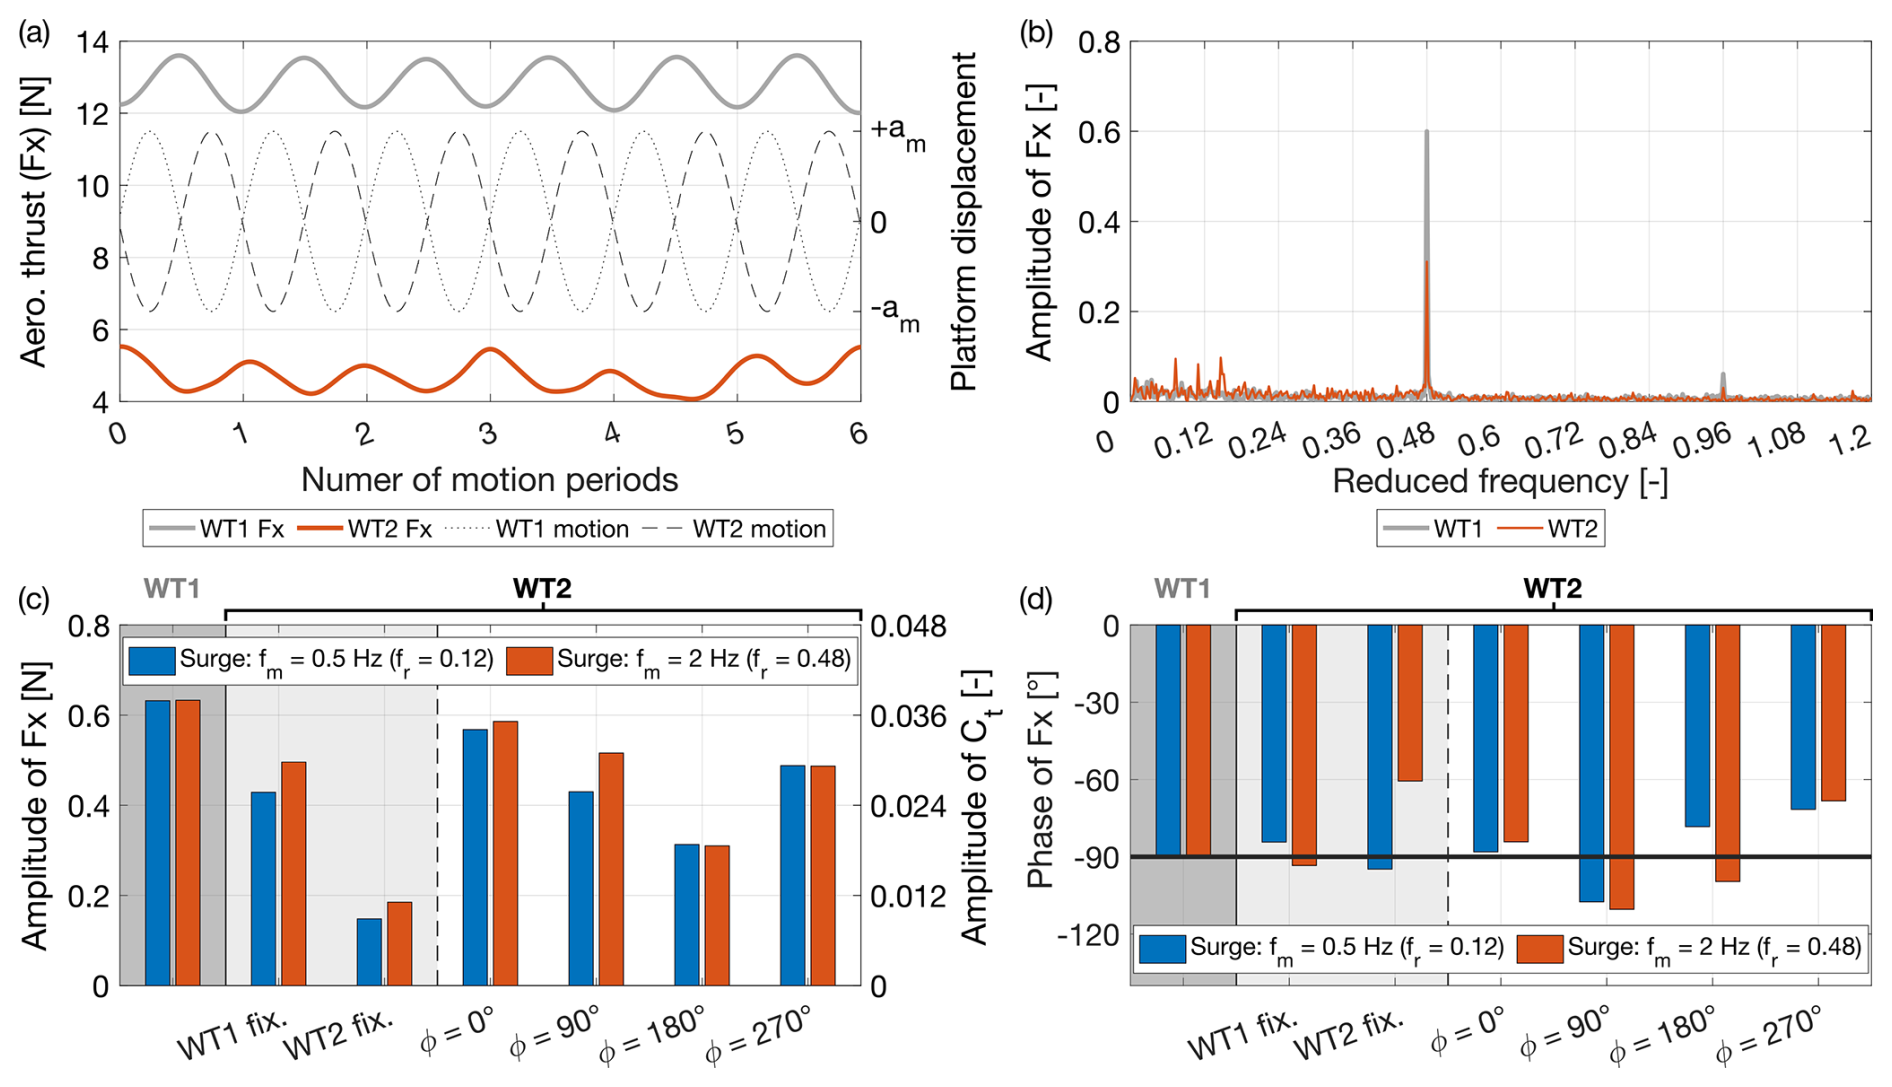
Figure 6Response of the aerodynamic rotor thrust of the downstream wind turbine (WT2). (a) Time series of the thrust on the upstream turbine (WT1) and downstream turbine (WT2) during surge motion at a reduced frequency (fr) of 0.48, with WT2 motion phase-shifted by 180° relative to WT1. (b) Amplitude spectrum of WT1 and WT2 thrust under surge motion with fr = 0.48 and a 180° phase offset between the turbines. (c, d) Amplitude and phase of the thrust response of WT1 and WT2 for various surge motion conditions, including different phase offsets of WT2 relative to WT1 and configurations where either turbine is fixed or moving.
Figure 6 presents the aerodynamic thrust response of the downstream turbine under various surge motion conditions defined by the motion frequency and the phase shift between the upstream and downstream turbines (ϕ). Two additional intermediate configurations, introduced in Sect. 2.2.3, are also included for comparison: one where only WT2 undergoes motion while WT1 remains fixed (“WT1 fixed”), and another where WT1 moves while WT2 remains fixed (“WT2 fixed”). These intermediate configurations provide the reference responses needed to separate the effects of rotor motion of the downstream turbine and wake modulation of the upstream turbine from the coupled response obtained when both mechanisms act simultaneously.
Figures 6a and b compare the thrust time series and spectra of both turbines for the case of counterphase surge motion at 2 Hz (fr = 0.48). The thrust of WT2 varies predominantly at the platform motion frequency, as indicated by a distinct spectral peak at this frequency (Fig. 6b). Consistently, Fig. 6a shows that WT2 exhibits a periodic thrust response synchronized with the platform motion, similar to WT1. The phase relationship between thrust and platform motion is also comparable for the two turbines: the thrust of WT2 is approximately in counterphase with that of WT1, consistent with the phase offset between their motions. Despite both turbines undergoing surge motions of equal amplitude – and therefore experiencing the same rotor fore–aft velocity induced by platform motion – the amplitude of thrust oscillations at the motion frequency is smaller for WT2 than for WT1.
Given that the thrust response of WT2 is primarily concentrated at the motion frequency, the amplitude and phase of the oscillations were evaluated at that specific frequency. The thrust signals were processed using a Fourier transform: the amplitude shown in Fig. 6c corresponds to the magnitude of the complex FFT at the motion frequency, while the phase shown in Fig. 6d is defined as the phase difference between the thrust force of a given turbine and the motion of that same turbine. For the “WT2 fixed” cases, where WT2 does not move, the reference phase is taken with respect to the motion of WT1; in all other cases, the WT2 thrust phase is referenced to its own platform motion.
The amplitude and phase of WT1 thrust are reported as a reference. As discussed earlier in relation to Fig. 2, WT1 thrust variations are proportional to the apparent wind speed perceived by the rotor, leading to a phase shift of approximately −90° with respect to the platform motion and to similar thrust amplitudes for both motion frequencies. In the “WT1 fixed” case, WT2 moves inside the wake of a stationary WT1. The thrust response of WT2 in this configuration also exhibits a phase shift of around −90°, consistent with a quasi-steady behavior, and similar amplitudes for both motion frequencies. The thrust oscillations induced by surge motion depend on the mean inflow velocity and on the variation in the rotor thrust coefficient associated with changes in tip-speed ratio caused by the varying apparent wind speed (Appendix C). Although WT1 and WT2 experience the same absolute variation in apparent wind speed (0.25 m s−1), the reduction in mean inflow velocity imposed by the upstream wake leads to smaller thrust oscillations at WT2.
In the “WT2 fixed” case, WT2 remains fixed while WT1 undergoes platform motion. Here, WT2 is exposed to the unsteady inflow generated by WT1 wake. The observed thrust oscillations at WT2 are caused by the wake flow structures, which have the same periodicity as WT1 motion. The resulting thrust fluctuations in WT2 have an amplitude of approximately one-third of those experienced by WT1. Moreover, the amplitude of these fluctuations is larger at fr = 0.12 than at fr = 0.48 and the associated phase differs between the two motion frequencies. This is consistent with the wake behavior shown in Fig. 5, which demonstrates that motion at fr = 0.48 induces a stronger and more coherent periodic wake response and that the phase of the wake velocity fluctuations depends on the motion frequency of the wake-generating turbine. Similar periodic thrust fluctuations induced by wake pulsations have been observed in previous wind tunnel experiments involving a moving upstream turbine and a fixed downstream turbine under uniform, low-turbulence inflow conditions (Fontanella et al., 2026a; Miroux et al., 2026).
The thrust response of WT2 when both turbines undergo surge motion is governed by the phase relationship between its motion and the periodic wake velocity fluctuations generated by WT1. As these fluctuations are advected downstream, their arrival at WT2 has a specific phase relative to the motion of the downstream rotor. This phase relationship is referred to here as wake–rotor synchronization. Since both turbines undergo prescribed motions at the same frequency, the relative phase between their motions, together with wake advection from WT1 to WT2, determines how the wake-induced velocity fluctuations combine with the velocity contribution associated with WT2 motion to produce variations in the apparent wind speed at the downstream rotor. This interaction can be constructive, when an increase in incoming wake velocity coincides with upwind motion of the WT2 rotor, reinforcing the apparent-wind-speed oscillations, or destructive, when it coincides with downwind motion of the WT2 rotor, resulting in partial cancellation of the two contributions. This synchronization produces a clear phase-dependent trend in the thrust response of WT2. The oscillation amplitude is maximal when the turbines move in phase (ϕ = 0°), decreases at ϕ = 90°, reaches a minimum in anti-phase (ϕ = 180°), and increases again at ϕ = 270°.
When ϕ = 0°, the results are consistent with a constructive interaction between WT2 motion and the wake-induced velocity fluctuations generated by WT1. In this configuration, WT2 appears to encounter accelerating wake regions while moving upwind, increasing the apparent-wind-speed variation at the rotor. This interpretation is supported by the observed thrust oscillations, which exhibit an amplitude larger than in the “WT1 fixed” case, where WT2 moves within a steady, non-pulsating wake. Conversely, at ϕ = 180°, the measured thrust oscillations are smaller than in the “WT1 fixed” configuration, consistent with partial cancellation between the contributions of wake velocity fluctuations and WT2 surge velocity to the apparent-wind-speed oscillation. At intermediate phase offsets (ϕ = 90° and ϕ = 270°), the measured thrust amplitudes take intermediate values.
These force measurements quantify the aerodynamic interaction between the upstream turbine wake and downstream rotor motion, with the proposed reinforcement and cancellation mechanisms providing a physical interpretation of the observed trends. Since wake-induced velocity fluctuations are spatially non-uniform across the WT2 rotor disk, the measured thrust represents the integrated aerodynamic response to their interaction with the moving rotor. The local phase relationship between wake velocity fluctuations and rotor motion may also vary across the rotor area due to differences in the advection of wake perturbations (discussed in Sect. 4.2.2) and the influence of the time-varying induction field generated by WT2. A more detailed characterization of this interaction would therefore require non-intrusive velocity measurements at the WT2 rotor plane, phase-resolved with respect to turbine motion.
The phase of WT2 thrust relative to its own platform motion also exhibits a systematic trend with the phase shift between turbines' motion. When ϕ = 0°, the Fx phase is approximately −90°, decreasing to around −110° at ϕ = 90° and increasing to about −70° at ϕ = 270°. With only minor differences, this behavior is consistent across both motion frequencies investigated, indicating that the relative phasing between the upstream and downstream wind turbine motions plays a dominant role in shaping the load dynamics of the downstream turbine.
Equivalent aerodynamic damping
The equivalent aerodynamic damping coefficient of WT2 is computed for all cases with prescribed WT2 motion using Eq. (10). To facilitate comparison, the values are normalized by the aerodynamic damping coefficient of WT1 under the same motion conditions. The thrust amplitude and phase at the motion frequency used in the calculation are provided in Appendix D for all motion cases and are also presented in Fig. 6. The resulting normalized damping coefficients at the two reduced frequencies are shown in Fig. 7, with numerical values reported in Appendix D (Table D3).
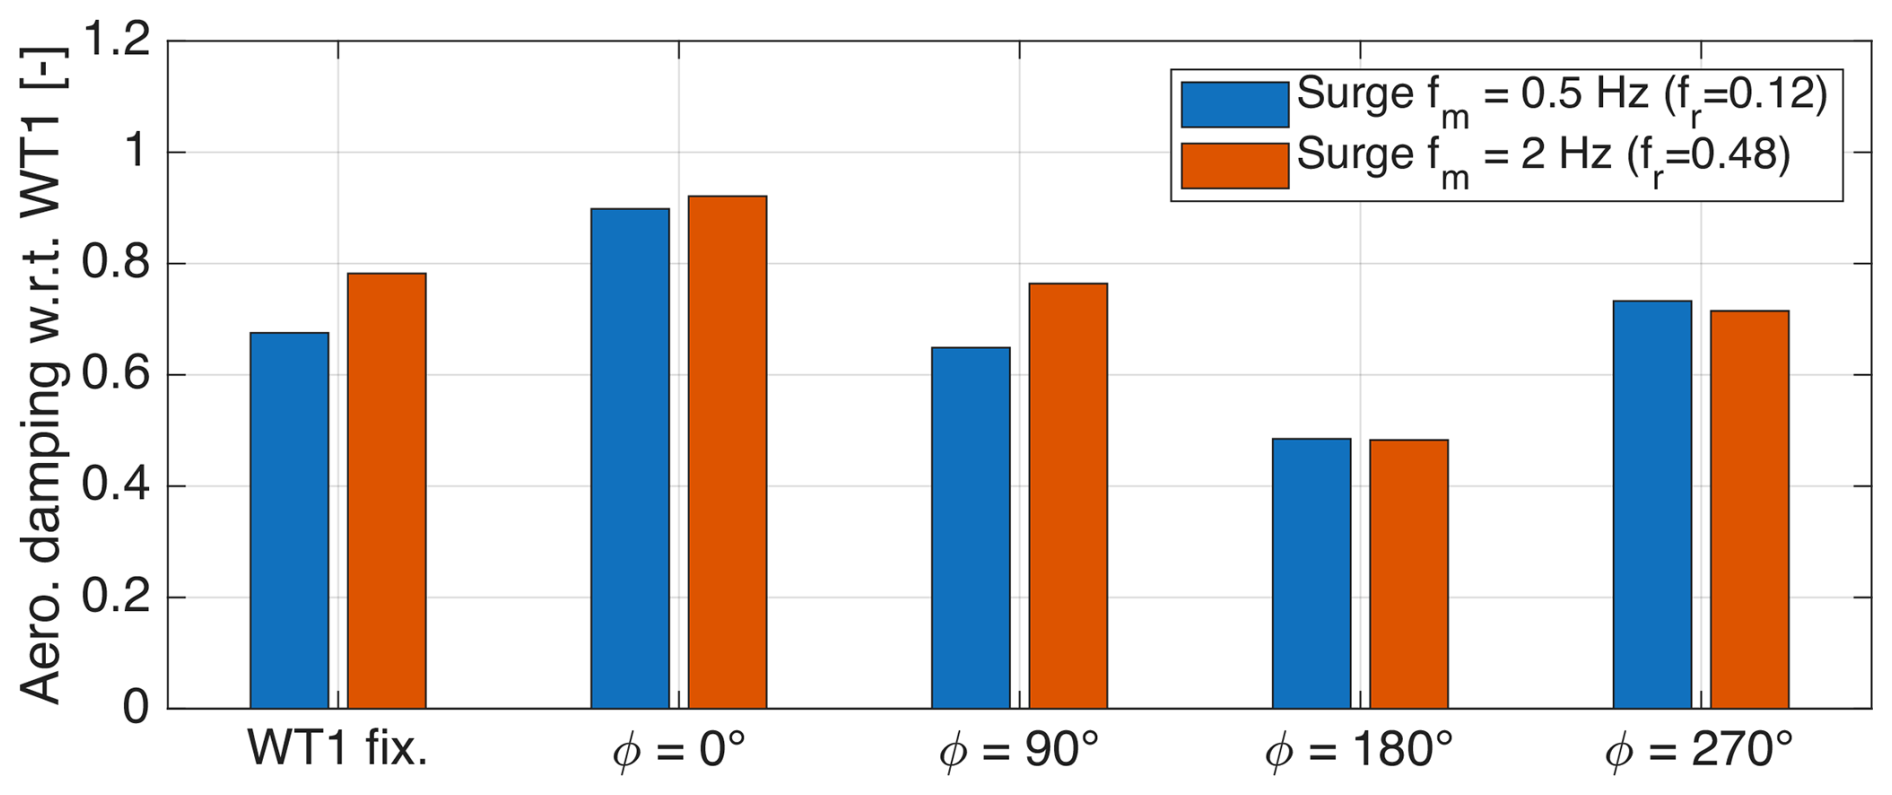
Figure 7Normalized equivalent aerodynamic damping coefficient of WT2 (relative to WT1) versus phase offset (ϕ) between WT1 and WT2 motions, shown for the two reduced motion frequencies (fr).
Figure 7 shows that the equivalent aerodynamic damping of WT2 remains lower than that of WT1 for all configurations, indicating that wake interaction systematically reduces the damping of the downstream turbine. Moreover, the damping level is strongly modulated by the relative phase offset between the motions of the two turbines. For both reduced motion frequencies, the maximum damping occurs when the turbines move in phase (ϕ = 0°), reaching approximately 90 %–92 % of the WT1 reference value. In contrast, the minimum damping is observed for anti-phase motion (ϕ = 180°), where the normalized coefficient drops to about 0.48–0.49. Intermediate phase offsets (ϕ = 90 and 270°) yield damping levels between these two extremes.
The consistency of this trend across the two reduced frequencies indicates that the relative motion phase plays a more dominant role than motion frequency in determining the aerodynamic damping of the downstream turbine. Physically, when the turbines move in phase, the wake velocity fluctuations experienced by WT2 reinforce the apparent-wind-speed variations induced by its motion, producing the largest thrust oscillations while maintaining a force–motion phase relationship close to the ideal −90° condition for aerodynamic damping. The combination of a large thrust amplitude and a favorable phase results in stronger aerodynamic damping. In the other motion configurations, a reduction in thrust oscillation amplitude and/or a less favorable force–motion phase relationship decreases the velocity-proportional component of the aerodynamic force and, consequently, the effective damping.
These results highlight that, in floating wind farms, aerodynamic damping depends on the dynamic coupling between turbines through the wake.
4.4 Wake of the downstream turbine
Following the analysis of the upstream turbine wake, the wake of the downstream turbine is examined. It is influenced by WT2 platform motion and by its interaction with the unsteady wake generated by WT1.
4.4.1 Fixed tower base
Figure 8 presents the characteristics of the wake generated by the downstream wind turbine at hub height in the fixed configuration, where both turbines are operating with fixed tower bases.

Figure 8Wake characteristics of the downstream wind turbine (WT2) at hub height, with a fixed tower base. (a) Time-averaged streamwise velocity. (b) Turbulence intensity. (c) Spectrum of the streamwise velocity component (u), normalized by the free-stream wind speed (U0), evaluated at a distance of 3.5 D from the WT2 rotor.
Figure 8a shows the streamwise velocity profiles at distances of 2 and 3.5 D downstream of the rotor. In both cases, the profiles exhibit a single Gaussian shape centered along the rotor axis. WT2 operates at a lower thrust coefficient than WT1, resulting in a smaller momentum deficit in its wake. Furthermore, the inflow to WT2, which consists of the turbulent wake of WT1 rather than free-stream flow, has increased turbulence levels. This promotes enhanced turbulent mixing between the WT2 wake and the surrounding flow, leading to a more rapid transition toward a radially homogeneous velocity distribution than observed in the wake of WT1. The average streamwise velocity at 2 D is 0.46 U0 (2.27 m s−1), increasing to 0.56 U0 (2.75 m s−1) at 3.5 D.
Figure 8b shows the turbulence intensity profiles, while Fig. 8c presents the velocity spectrum at 3.5 D from the WT2 rotor. Compared to the corresponding results for WT1 in Fig. 3, both indicate higher turbulence levels in the wake of WT2, demonstrating the cumulative buildup of turbulence within the wind farm. The turbulence intensity profiles are relatively uniform across the wake and show moderate peaks near the rotor tips, which are attributed to the wake shear layers. These peaks are less pronounced than those in WT1 wake. As the wake progresses from 2 to 3.5 D, turbulence intensity becomes more evenly distributed: it increases at the wake center due to internal mixing processes and decreases in the outer regions as the wake diffuses into the ambient flow.
4.4.2 Effect of surge motion
To assess whether platform motion affects the time-averaged wake characteristics of the downstream turbine, Fig. 9 compares the mean streamwise velocity and turbulence intensity profiles at hub height for the fixed case and for the two surge motion conditions investigated (fr = 0.12 and fr = 0.48), at a downstream distance of 3.5 D from the WT2 rotor. In both motion cases, WT2 undergoes surge motion with a phase offset of ϕ = 270° relative to WT1. This phase configuration is selected because, as shown in Fig. 11, it corresponds to the largest velocity oscillation amplitudes in the wake and therefore to the strongest wake perturbation induced by rotor motion.
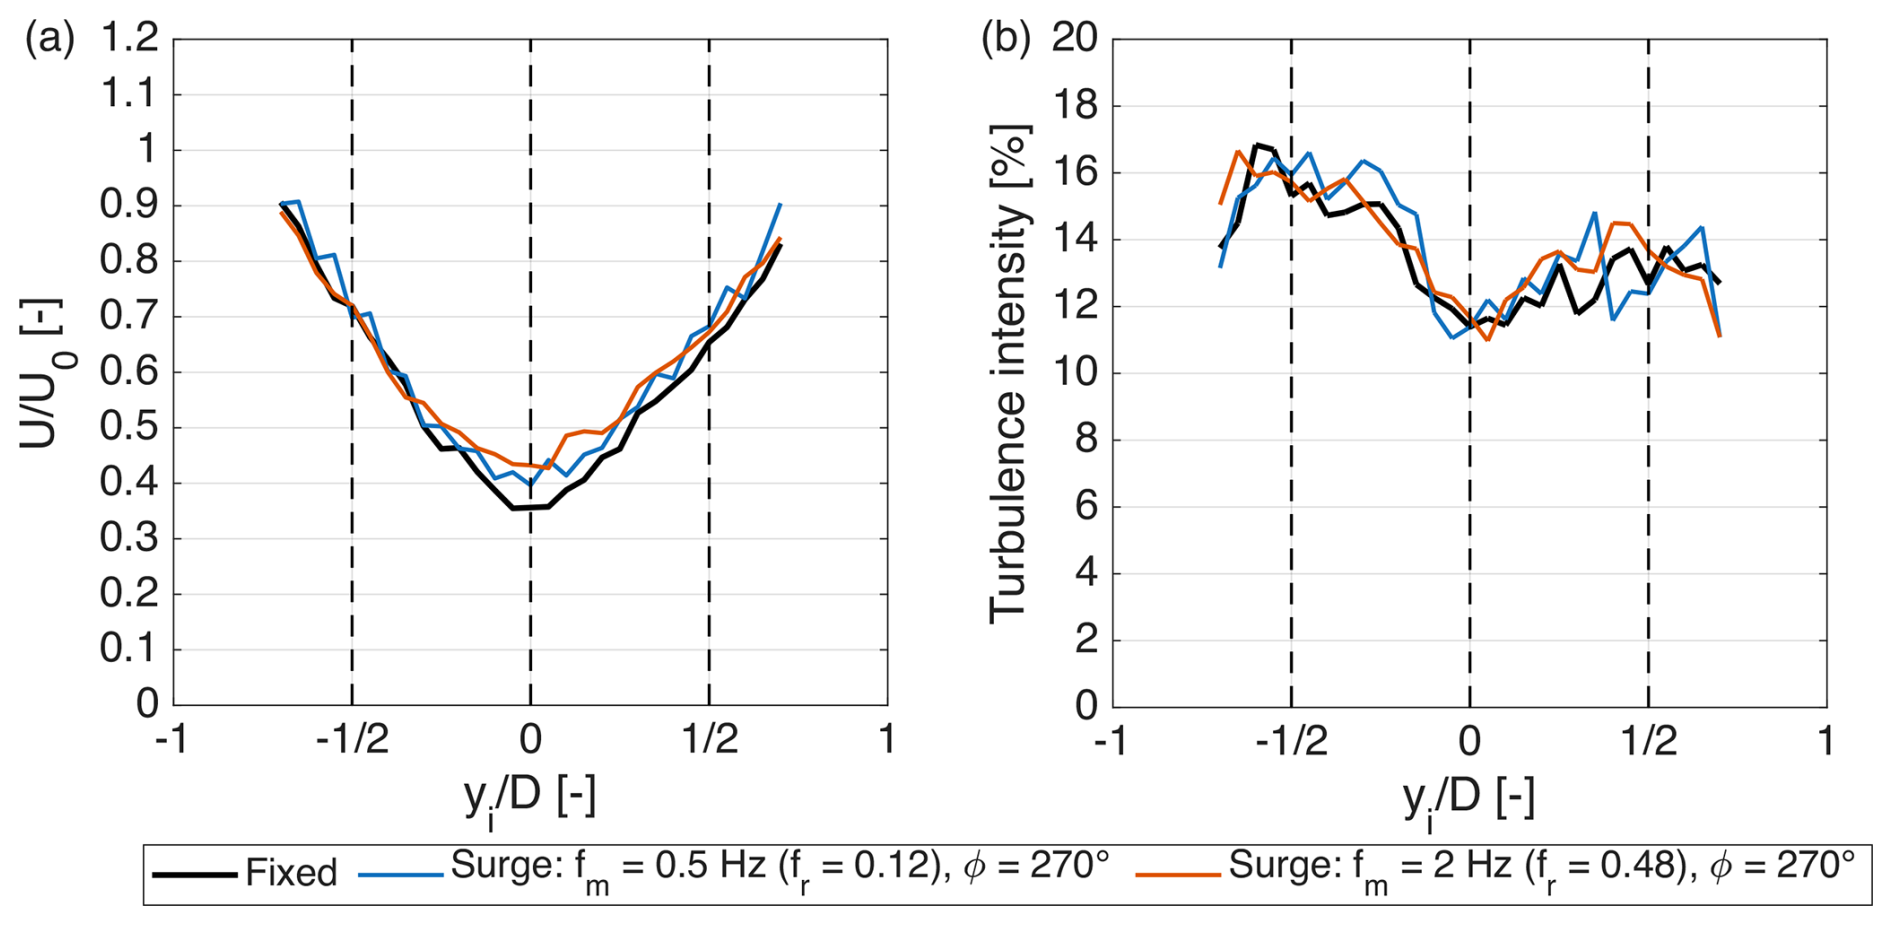
Figure 9Time-averaged wake characteristics of the downstream wind turbine (WT2) at hub height and 3.5 D downstream of the rotor under fixed-tower-base and surge motion conditions (fr = 0.12 and fr = 0.48). In both motion cases, WT2 undergoes surge motion with a phase offset of 270° relative to WT1. (a) Time-averaged streamwise velocity normalized by the free-stream velocity (). (b) Turbulence intensity.
The mean velocity profiles show that surge motion increases the wake velocity of WT2 compared to the fixed case. This increase is more pronounced in the central region of the wake and is stronger at the higher reduced frequency (fr = 0.48). In contrast, the turbulence intensity exhibits limited sensitivity to platform motion, with similar levels observed for both surge cases and the fixed-tower-base configuration.
Having established that surge motion leads to an increase in the time-averaged wake velocity of WT2, the dynamic wake response is examined.
Figure 10 analyzes the wake of WT2 at hub height and a downstream distance of 3.5 D from its rotor under surge motion at two frequencies and a phase offset of ϕ = 270° relative to the motion of the upstream turbine. Figure 10a and b show that the wake velocity spectra are broadly similar to the fixed-tower-base case, and it is difficult to identify a distinct spectral peak at the platform motion frequency. This is consistent with the turbulence intensity profiles reported in Fig. 9, which show no significant increase in turbulence levels. For fr = 0.12, this is because the motion frequency is within a region of the spectrum where turbulence and the coherent flow structures resulting from platform motion exhibit comparable energy levels. For fr = 0.48, although the turbulence intensity at this frequency is generally lower, the absence of a distinct spectral peak indicates that the unsteady flow structures induced by platform motion are weaker in the wake of WT2 than those observed in the wake of WT1 at comparable distance from the rotor.
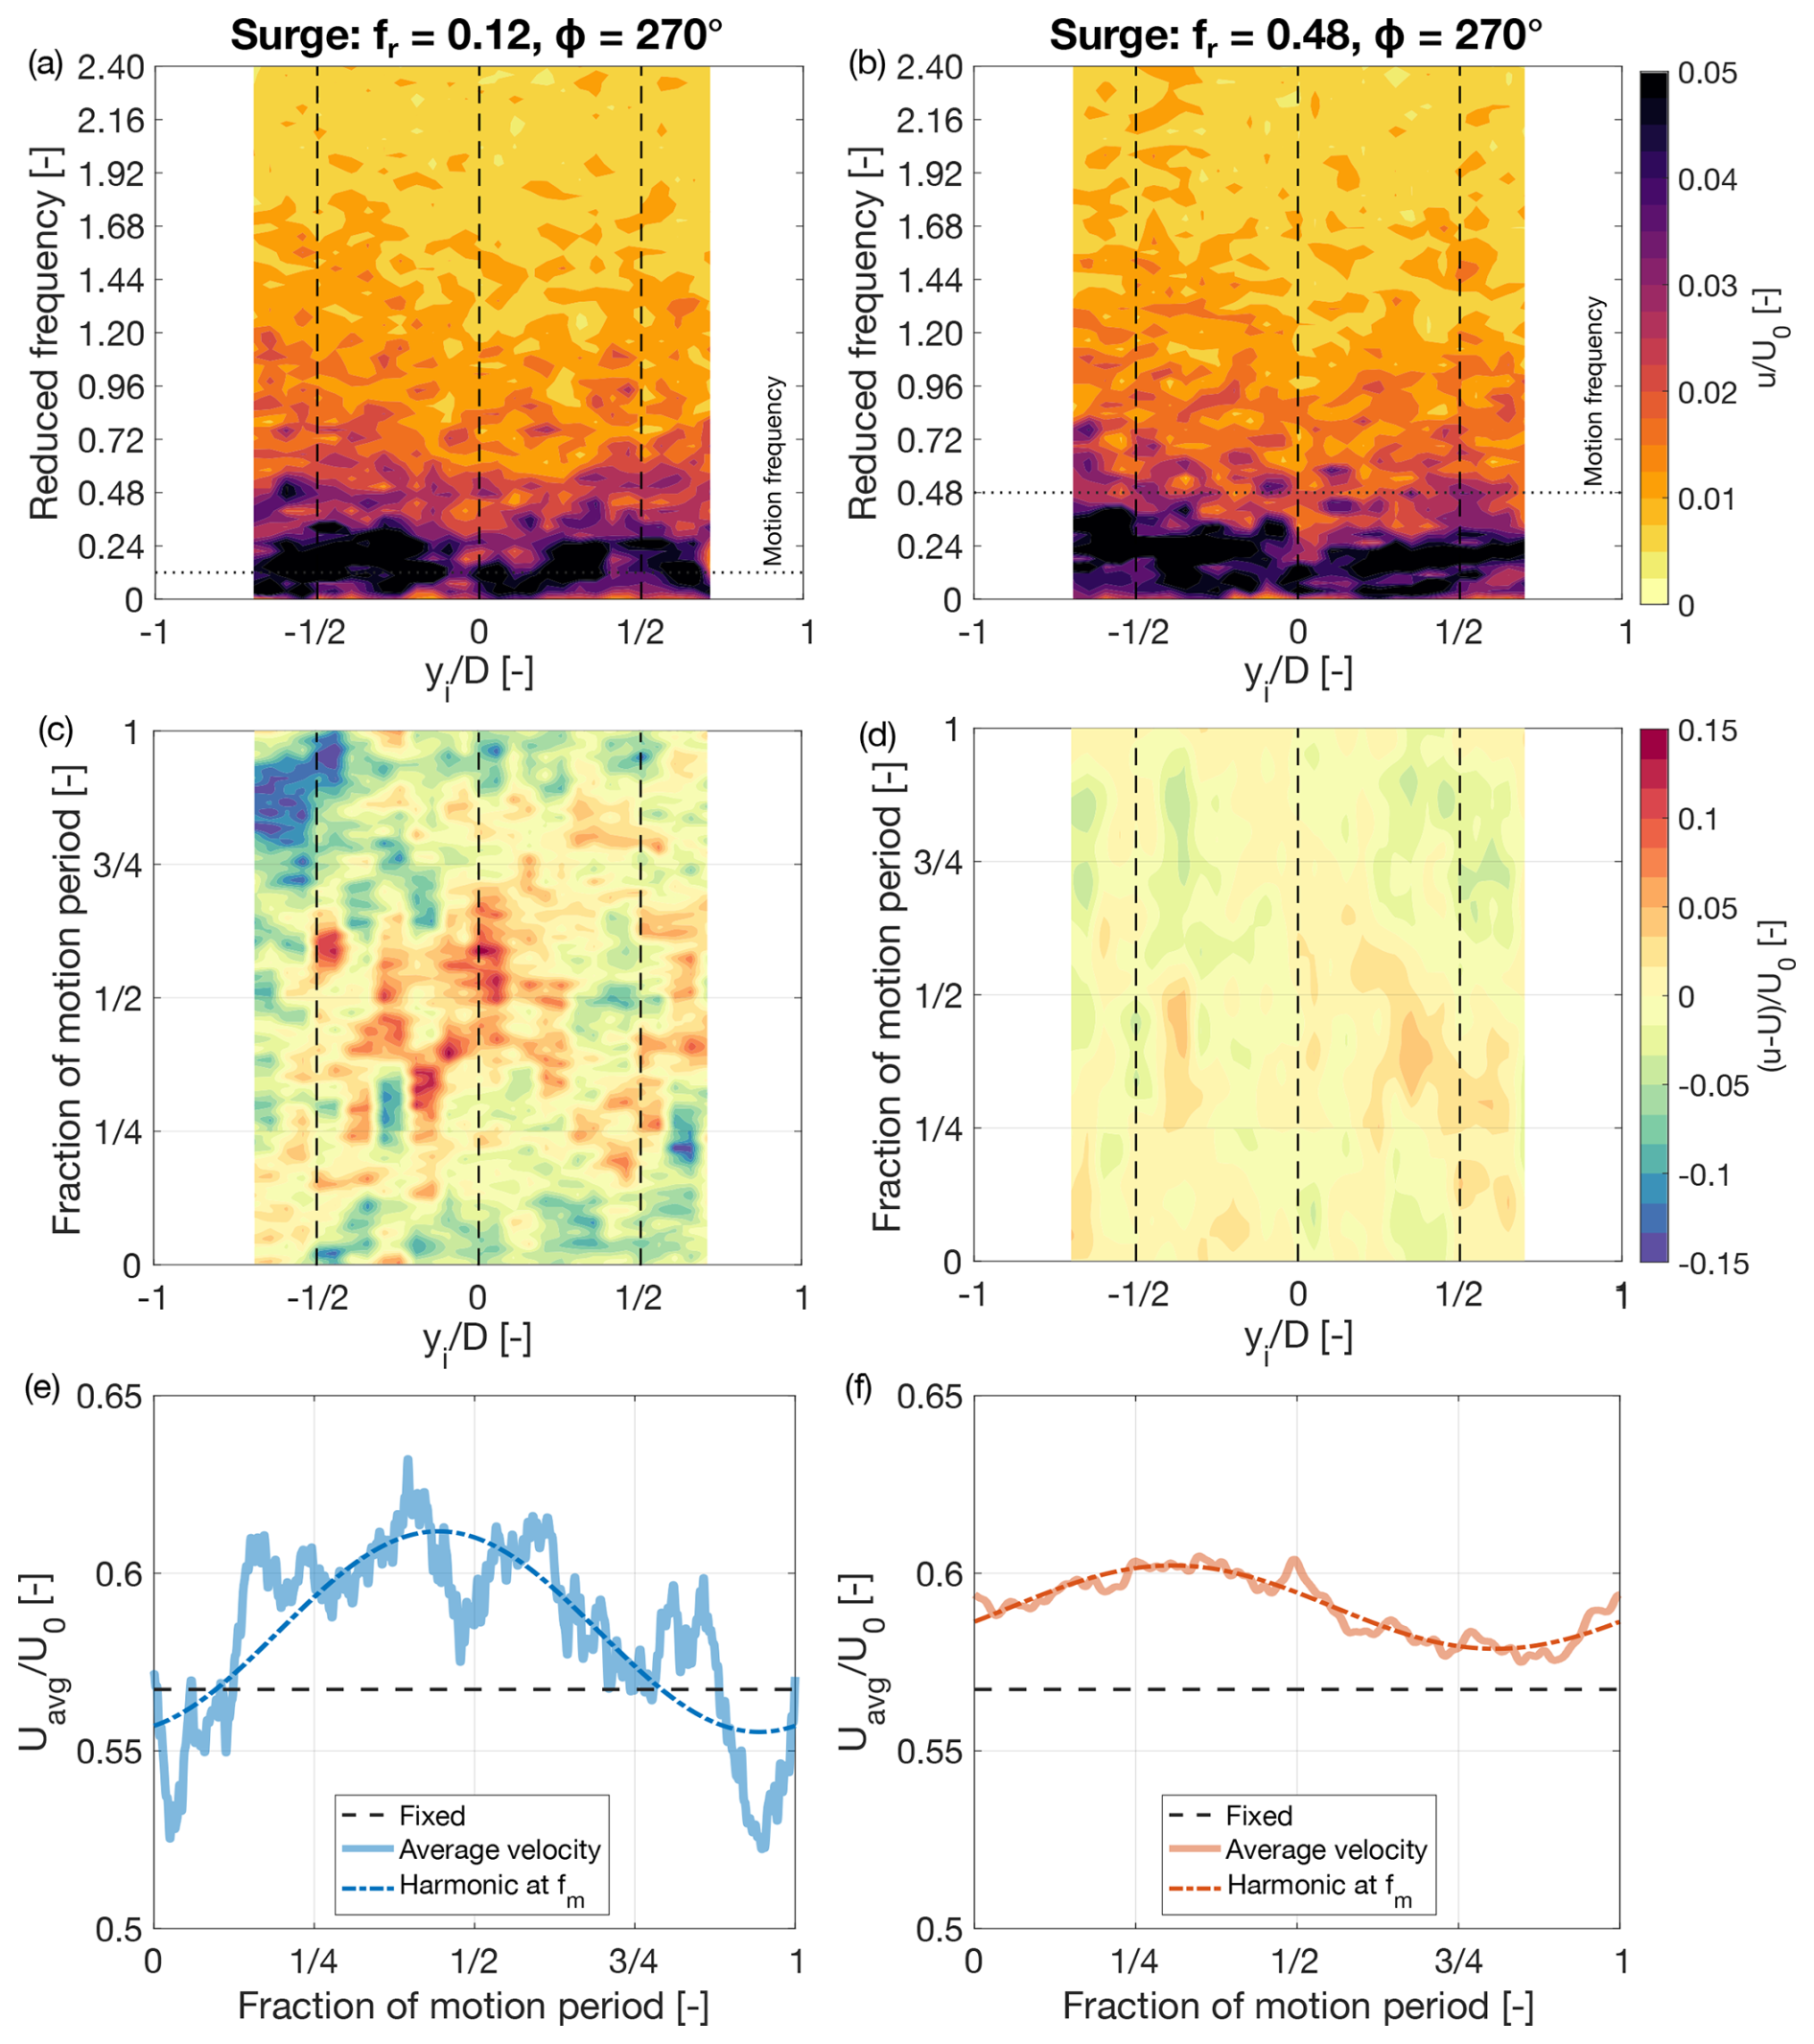
Figure 10Dynamics of the wake of the downstream wind turbine (WT2) at hub height and 3.5 D downstream of the rotor during surge motion at two reduced frequencies (fr). (a, b) Spectrum of the streamwise velocity component (u), normalized by the free-stream wind speed (U0). (c, d) Variation in velocity from the time-averaged value over one period of platform motion. (e, f) Response of the spatially averaged wake velocity Uavg, normalized by U0, within one motion cycle; “fixed” refers to the case where the turbine base is fixed (no platform motion).
Figure 10c and d show the temporal variation in the axial velocity over one motion cycle relative to its time-averaged value for the two motion frequencies, in the case where WT2 motion has a phase shift with respect to WT1 motion of ϕ = 270°. Compared to the corresponding analysis of WT1 wake in Fig. 5, the case with fr = 0.12 shows velocity oscillations at the platform motion frequency, predominantly concentrated in the central part of the wake. In contrast, for fr = 0.48, the wake pulsations are significantly weaker than those observed behind WT1 (see Fig. 5d) and are nearly absent, with only minor fluctuations visible at yi = D.
As in Fig. 5, the cross-sectional average axial velocity, Uavg, over one motion cycle, is used in Fig. 10e and f to assess the integral effect of turbine motion on the stream tube. For fr = 0.12, the amplitude of oscillations in Uavg is larger in the wake of WT2 than in that of WT1 (see Fig. 5e). However, the time-averaged velocity remains comparable to that of the fixed-tower-base case, indicating that this motion condition has a limited impact on wake recovery. Conversely, for fr = 0.48, the oscillations are weaker than those observed both in the lower-frequency case and in the wake of WT1 at the same frequency (see Fig. 5f). Nevertheless, the time-averaged velocity exceeds that of the fixed case, indicating enhanced wake recovery, consistent with the mean velocity profiles shown in Fig. 9.
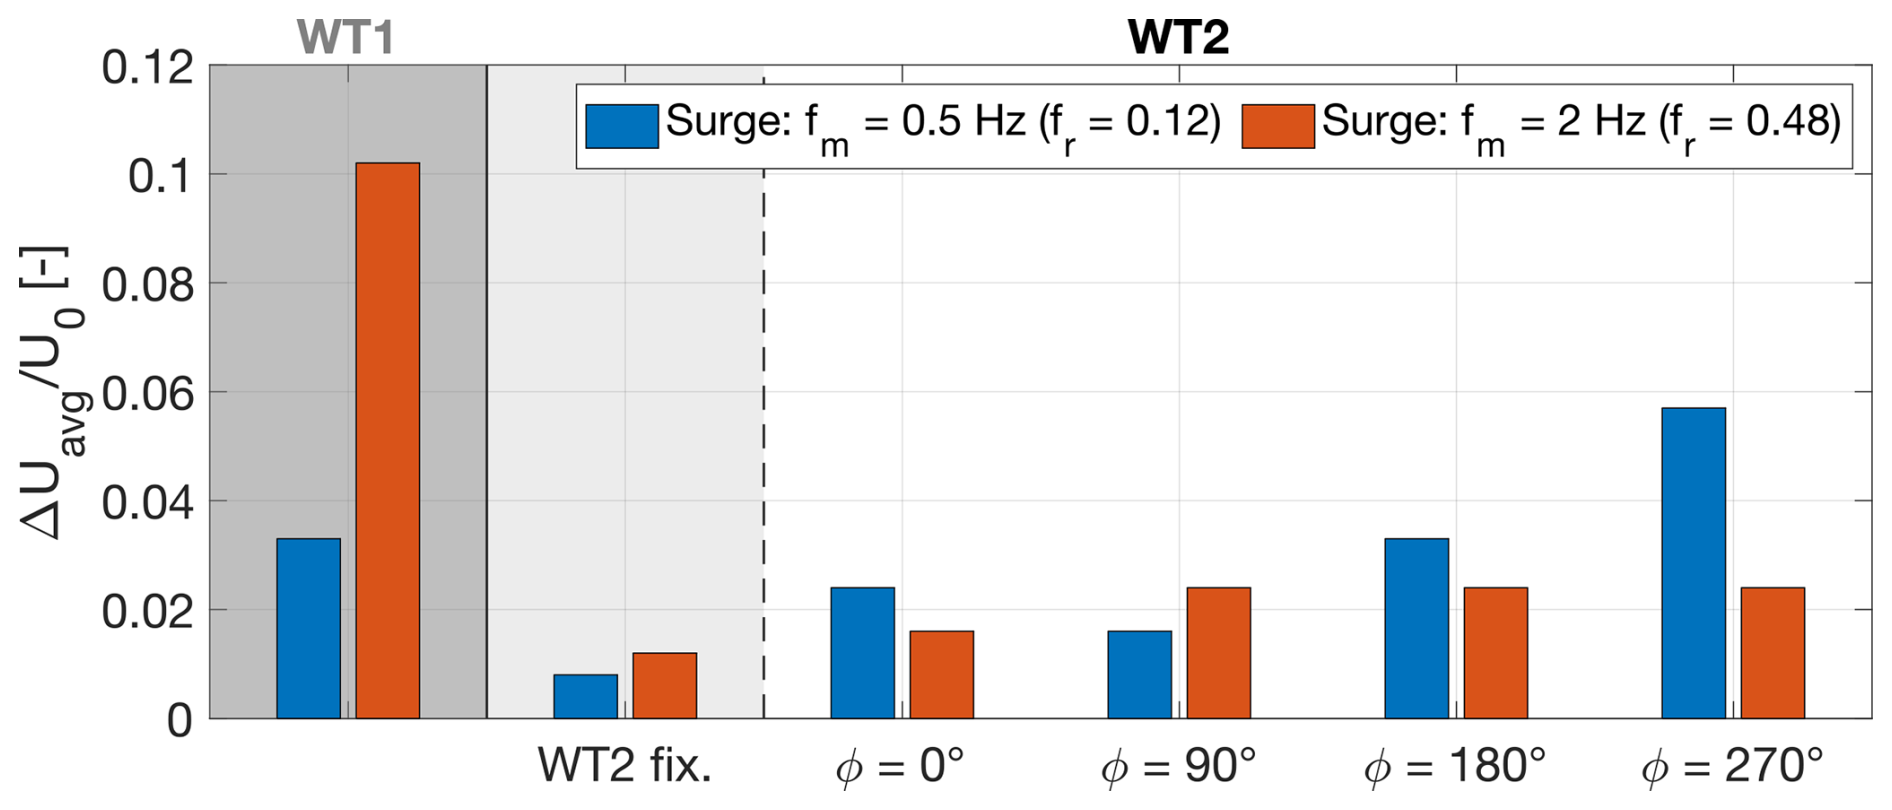
Figure 11Peak-to-peak amplitude of the oscillations of the average axial velocity over the wake cross-section; “WT1” refers to the wake of WT1 at 3.5 D downstream of the rotor.
Figure 11 summarizes the peak-to-peak amplitude of the sinusoidal functions fitted to the phase-averaged Uavg data at the platform motion frequency, characterizing the motion-synchronized velocity oscillations at 3.5 D downstream of the WT2 rotor for all tested phase offsets between WT1 and WT2 motions. In the “WT2 fixed” case, the downstream turbine is fixed while WT1 undergoes platform motion. For both motion frequencies, the wake of WT2 exhibits stronger velocity oscillations when the turbine is in motion compared to when it is fixed, and only WT1 is moving. At fr = 0.12, the wake response depends strongly on the relative phase between the turbine motions: oscillations are minimized at a phase offset of 90° and maximized at 270°, where they even exceed those observed in the wake of WT1. At fr = 0.48, the variation in oscillation amplitude with phase offset is less pronounced, and the response is more uniform across different phases.
These observations suggest that the interaction between the motion of WT2 and the incoming unsteady wake shapes the downstream flow field, particularly at the low surge motion frequencies investigated in this experiment.
4.5 Farm power
Platform motions in a floating wind farm generate dynamic aerodynamic loads and oscillations in wake velocity but also modify the power distribution within the array. This section examines the time-averaged aerodynamic power at WT1 and WT2, as well as the available power in the wake of WT2, which provides an indication of the power that could be extracted by a third downstream turbine. The analysis focuses on the variation in these quantities in the motion cases relative to the fixed-tower-base configuration.
The time-averaged power of WT1 was unaffected by platform motion and remained equal to 22.14 W at model scale for all tested conditions. This result is consistent with previous wind tunnel experiments at comparable reduced frequencies and apparent-wind oscillation amplitudes (Fontanella et al., 2025).
Under fixed-tower-base conditions, WT2 generated 2.14 W (model scale), yielding a total farm power of 24.28 W. The available power (Φav) at 3.5 D downstream of WT2, computed according to Eq. (14), was 11.15 W.
Figure 12 shows the percentage variation in turbine and farm power relative to the fixed-tower-base case under different surge motion conditions.
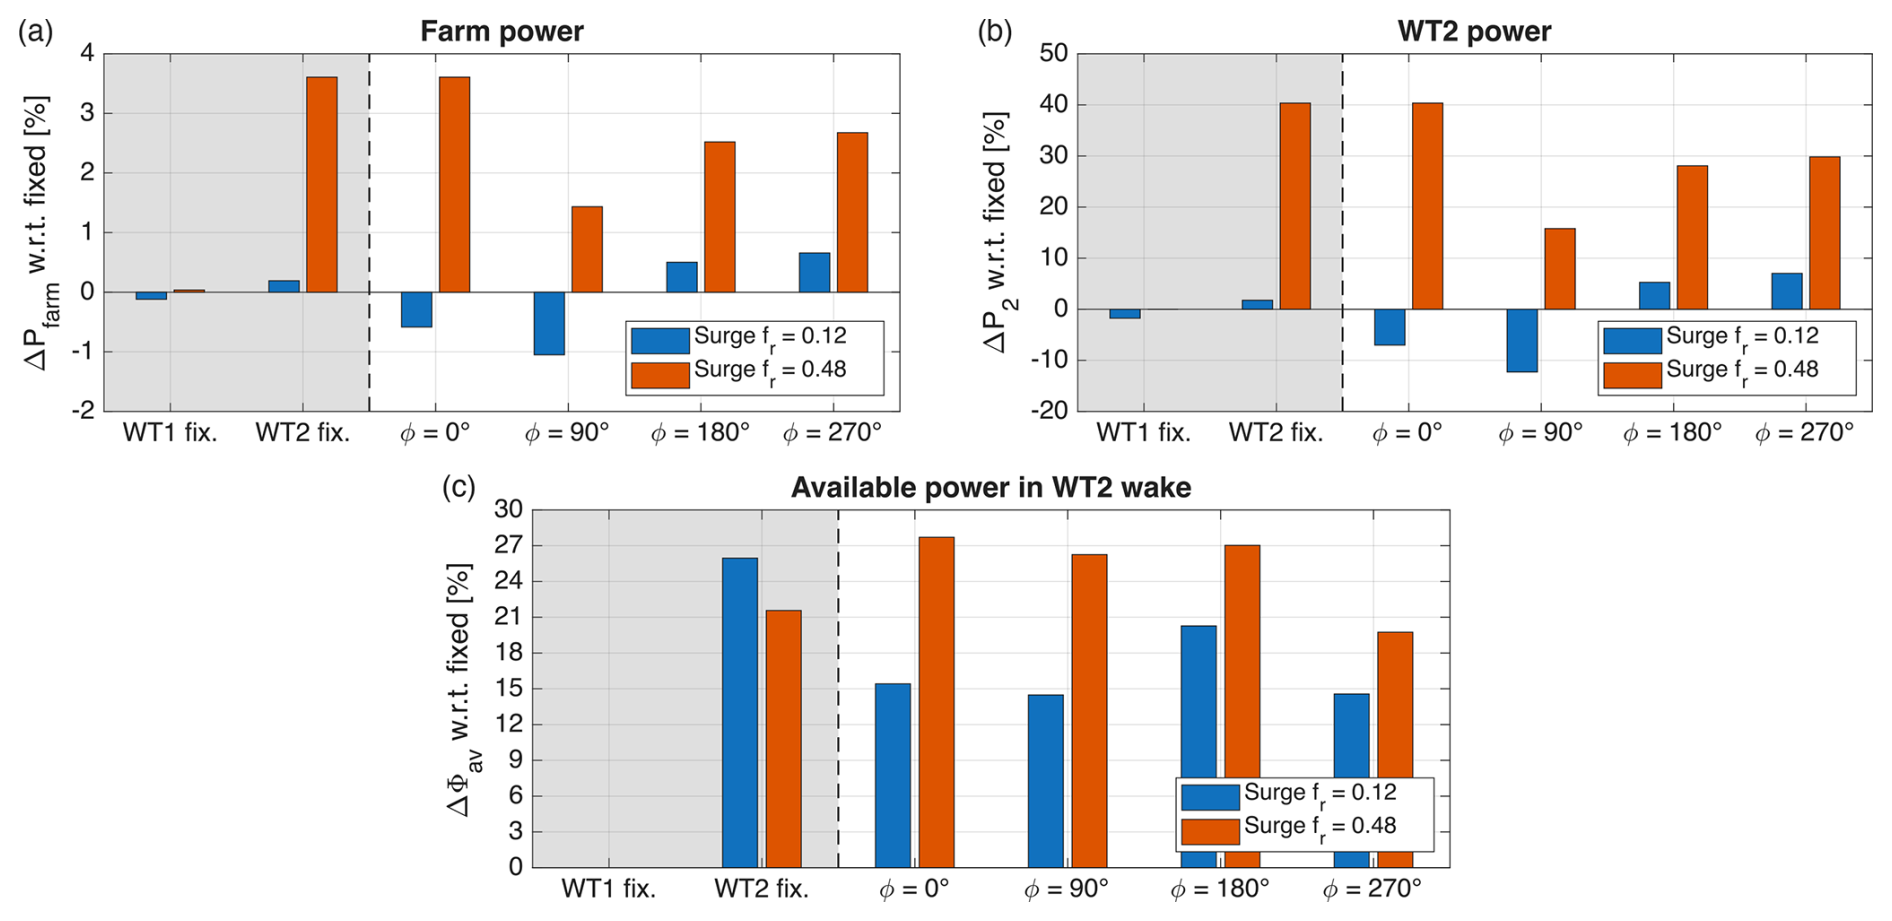
Figure 12Relative variation with respect to the fixed configuration of (a) total farm power, (b) WT2 power, and (c) available power in the wake of WT2. Results are shown for different combinations of platform motion phase (ϕ) and for two surge-reduced frequencies, fr = 0.12 and fr = 0.48. The farm power variation in panel (a) reflects exclusively changes in WT2 power, as WT1 power remains unaffected by its motion. The wake available power index in panel (c) is computed as the spatial average of the cube of the time-averaged streamwise velocity over the rotor region and normalized with the fixed reference case and serves as a proxy for the kinetic energy flux available to a downstream turbine.
At the higher reduced frequency (fr = 0.48), a gain in farm power is observed (Fig. 12a). Since WT1 power remains unchanged, this increase originates from a rise in WT2 power (Fig. 12b). As discussed in Fig. 5, motion at fr = 0.48 induces stronger velocity oscillations in the wake of WT1 and is associated with an increase in the time-averaged velocity within the wake stream tube compared to the fixed case. This enhanced wake recovery results in a higher-velocity inflow at WT2 and, consequently, increased power production. Although the relative increase in WT2 power is significant, its impact on total farm power remains modest. This is because WT2 contributes only a small fraction of the overall output, as it operates within a persistent wake deficit at its location. WT1 runs at a relatively high thrust coefficient, generating a strong wake, and the low free-stream turbulence intensity prevents wake destabilization and mixing.
In contrast, no significant increase in WT2 power is observed at the lower reduced frequency (fr = 0.12). In this case, WT2 power remains comparable to, or slightly below, the fixed-tower-base condition.
Figure 12a and b also show a clear dependence of WT2 and total farm power on the phase difference between the motions of WT1 and WT2. For surge motion at a reduced frequency of fr = 0.48, the maximum power increase occurs when the turbines move in phase (ϕ = 0°). Notably, a comparable increase is observed in the configuration where WT1 undergoes motion while WT2 remains fixed. This indicates that the enhancement in WT2 and farm power is primarily driven by the motion of WT1 and its modulation of wake dynamics. Phase shifts other than ϕ = 0° result in smaller power increments.
Figure 12c shows the variation in available power in the wake of WT2 relative to the fixed case. An increase in available power is observed for both motion frequencies whenever WT1 is subjected to surge motion, including configurations in which WT2 remains fixed. This indicates that platform motion of WT1 enhances wake recovery downstream, not only at the location of WT2 but also further downstream of the second turbine. The magnitude of this increase depends on the phase shift between WT1 and WT2 motions and differs between the two motion frequencies. At fr = 0.12, the maximum increase occurs at ϕ = 180°, whereas at fr = 0.48, the largest increase is observed for ϕ = 0°.
The results presented in Sect. 4 are discussed here with respect to three main aspects: (i) the influence of surge-reduced frequency on wake dynamics and farm-level power production, (ii) the phase-dependent interaction between the advection of the upstream turbine wake and the platform motion of the downstream turbine as well as its implications for the aerodynamic damping of the latter, and (iii) the combined effect of platform motion of both turbines on the evolution of wake characteristics downstream of the second turbine. Particular emphasis is placed on the coupling between periodic wake modulation, the load response of the downstream turbine, and energy recovery within the tandem-turbine configuration investigated in this study.
5.1 Role of reduced frequency in wake response and farm power
The results demonstrate that the reduced frequency of platform motion plays a central role in shaping wake dynamics and consequently affects wake energy recovery and farm-level power production. Although the apparent-wind-speed variation amplitude ( = 5 %) was identical for the two motion frequencies investigated, the wake response and its effects differed substantially between fr = 0.12, representative of motion at the natural frequency of the platform surge rigid-body mode, and fr = 0.48, representative of motion at the natural frequency of the platform pitch rigid-body mode.
At the lower reduced frequency (fr = 0.12), surge motion induced periodic velocity oscillations in the wake of WT1, but these oscillations resulted in only marginal changes in the time-averaged wake velocity. Consequently, no significant increase in WT2 power was observed. In this regime, the results suggest that the motion produces only limited enhancement of turbulent mixing and momentum entrainment within the wake.
At fr = 0.48, the wake of WT1 exhibited stronger and more spatially coherent pulsations, accompanied by a small increase in the measured mean streamwise velocity within the wake stream tube. This enhanced wake recovery led to a higher inflow velocity at WT2 and, consequently, an increase in its mean power production. As a result, the total farm power increased. Although the absolute gain was modest, it is significant relative to the limited baseline power production of WT2, which operated within a persistent wake deficit due to the low free-stream turbulence intensity and the resulting limited wake mixing. Under these conditions, even a small improvement in wake recovery produced a meaningful increase in downstream turbine power.
These findings are consistent with previous single-turbine experimental studies showing that motion-induced wake dynamics are most pronounced within a reduced frequency range of 0.3–0.9. In this regime, platform motion can promote faster wake recovery, particularly under low-turbulence inflow conditions (Messmer et al., 2024a; Fontanella et al., 2026a). Importantly, the present results extend these findings to a tandem-turbine configuration in which both turbines undergo platform motion, demonstrating that such wake dynamics can also lead to meaningful farm-level power gains.
5.2 Effect of relative motion phase on turbine–wake interaction and aerodynamic damping
A key outcome of this study is the systematic characterization of the dependence of downstream turbine loads and aerodynamic damping on the phase offset between the motions of WT1 and WT2.
When both turbines undergo surge motion, WT2 operates within a periodically modulated inflow generated by the motion of WT1. Depending on the relative phase ϕ between the surge motions of the two turbines and the advection of wake perturbations, the wake-induced velocity fluctuations and the velocity contribution associated with WT2 motion can reinforce or partially compensate each other in determining the apparent wind speed at the downstream rotor, resulting in constructive or destructive interactions.
For the considered free-stream wind conditions, turbine operating settings, and inter-turbine spacing, in-phase motion (ϕ = 0°) leads to the largest thrust oscillations at WT2, and the equivalent aerodynamic damping approaches that of WT1. In this configuration, the results are consistent with WT2 encountering accelerating wake regions while moving upwind, thereby reinforcing the apparent-wind-speed variation induced by its own motion. Notably, the condition associated with the largest aerodynamic damping is the same configuration in which the maximum farm power increase is observed at fr = 0.48.
Conversely, for anti-phase motion (ϕ = 180°), the thrust oscillations and aerodynamic damping of WT2 are minimized. The results suggest that, in this configuration, WT2 motion tends to counteract the wake-induced velocity fluctuations, thereby weakening the velocity–force phase alignment associated with higher aerodynamic damping. The equivalent damping coefficient is reduced to approximately half of the upstream turbine value, representing the most unfavorable condition from a stability perspective.
Intermediate phase offsets result in intermediate load responses, indicating that the dynamics of the downstream turbine are governed by the synchronization between its motion and the periodic wake fluctuations advected from the upstream turbine rotor. Notably, for the parameter space investigated here (inter-turbine spacing of 5.75 D, low-turbulence uniform inflow, and high turbine thrust coefficient Ct), the qualitative phase-dependent trends are consistent across both reduced frequencies tested. This suggests that, within these conditions, relative motion phasing exerts a stronger influence on the load dynamics and aerodynamic damping of the downstream turbine than the reduced frequency itself.
Importantly, the equivalent aerodynamic damping of WT2 is consistently lower than that of WT1 across all motion cases. When only the downstream turbine moves, the lower mean inflow velocity imposed by the upstream wake leads to smaller thrust oscillations and, consequently, reduced aerodynamic damping. When both turbines undergo motion, the interaction between WT2 motion and the periodic wake velocity fluctuations further modifies the amplitude and phase of the thrust response, affecting the equivalent aerodynamic damping.
From a system-level perspective, the results of this study indicate that stability analyses of floating wind farms should explicitly account for phase-dependent wake interactions. Unfavorable phase relationships may significantly reduce aerodynamic damping and, consequently, affect platform response.
5.3 Wake dynamics of the downstream turbine
The wake of WT2 exhibits markedly different behavior compared to that of WT1. Due to the combined effects of reduced thrust coefficient and higher inflow turbulence within the wake of WT1, the wake of WT2 is more rapidly homogenized and shows weaker structures coherent with platform motion than WT1 wake.
At fr = 0.12, the amplitude of the wake oscillations behind WT2 depends strongly on the phase difference between the surge motions of the two turbines and, for certain phase offsets, can exceed the oscillations observed in the wake of WT1. However, these enhanced oscillations are associated with only minor changes in mean wake velocity, indicating a limited effect on wake recovery downstream of WT2.
At fr = 0.48, oscillations in WT2 wake are weaker than those behind WT1, yet a measurable increase in mean velocity behind WT2 is observed. This indicates that in this condition enhanced recovery downstream of WT2 is primarily inherited from the motion-induced modulation of the upstream turbine wake rather than generated by WT2 motion.
These observations suggest that, under the low-turbulence conditions investigated, the motion of the upstream turbine plays a more important role in enhancing mean wake velocity downstream of WT2, whereas the motion of WT2 primarily affects the amplitude of the periodic velocity fluctuations in its wake.
5.4 Limitations of this experiment and outlook
The use of scaled wind turbine models introduces limitations to the quantitative extrapolation of the results to full-scale conditions. As discussed in Sect. 2.1, the scaled blades were designed primarily to reproduce the thrust characteristics of a full-scale wind turbine and their sensitivity to inflow variations, rather than to ensure similarity in power coefficients. Although comparisons of results with the fixed-tower-base configuration reduce the influence of scaling effects common to the different operating conditions, they do not eliminate these limitations completely. The experiment demonstrates the influence of wake–rotor synchronization on aerodynamic loads and power of downstream turbines; the magnitude of the observed power gains and aerodynamic damping should not be directly extrapolated to full-scale turbines.
The present study was conducted under uniform inflow with low turbulence intensity (2 %), which promotes coherent wake structures and delays natural wake breakdown. Under higher turbulence levels representative of offshore atmospheric conditions, motion-induced wake dynamics may be partially masked, potentially reducing their influence on the loads and power of downstream turbines.
Furthermore, only harmonic surge motion was considered. Real floating platforms experience coupled 6-degree-of-freedom motions under wind–wave excitation. While surge captures the dominant aerodynamic coupling between the rotor response and the fore–aft motion of the nacelle, additional degrees of freedom may introduce further complexity in wake interactions. Moreover, the experiments considered only two reduced frequencies and a single amplitude of the normalized apparent-wind-speed variation. These conditions were selected to investigate the wake–rotor interaction at frequencies representative of rigid-body modes of floating wind turbines, but a broader parameter study would be required to characterize the dependence of this interaction on motion frequency and amplitude and identify the conditions under which its effects are most pronounced.
Finally, the analysis was limited to a two-turbine configuration operated at fixed rotor speed and blade pitch. In real wind farms, active control strategies that dynamically vary rotor speed and blade pitch, as well as interactions between multiple turbine rows, may alter the observed trends.
Future work should extend the present approach to more realistic inflow conditions characterized by higher free-stream turbulence intensity and wind shear, platform motions driven by broadband irregular waves, and larger turbine arrays. In addition, coordinated control strategies could be investigated to exploit constructive phase relationships between turbine platform motions, with the aim of enhancing power capture while mitigating reductions in aerodynamic damping.
This study experimentally investigated the aerodynamic response arising from the interaction between periodic velocity oscillations induced by the motion of an upstream floating wind turbine and a moving downstream rotor. The controlled experimental conditions were designed to isolate this interaction by systematically varying the reduced frequency and relative phase of prescribed turbine surge motions and by considering configurations in which either turbine moved independently. The analysis focused on aerodynamic loads, equivalent aerodynamic damping, wake dynamics, and farm-level power production.
The experiment provides evidence of synchronization between the motion-modulated wake of the upstream turbine and the aerodynamic response of the downstream rotor, with the synchronization governed by the relative phase between the motions of the two turbines. When both turbines undergo surge motion, the downstream turbine operates within an inflow that is periodically modulated. The relative phase between the turbine motions, together with the advection of wake perturbations toward the downstream rotor, determines whether the wake-induced velocity fluctuations reinforce or partially compensate the velocity contribution associated with WT2 motion, thereby amplifying or attenuating the apparent-wind-speed oscillations. In-phase motion (ϕ = 0°) produces the largest thrust oscillations and maximum aerodynamic damping of the downstream turbine, whereas anti-phase motion (ϕ = 180°) minimizes both, reducing the equivalent aerodynamic damping coefficient to approximately half that of the upstream turbine. These phase-dependent trends were consistent across both reduced frequencies tested, indicating that, within the investigated range, relative motion phasing exerts a stronger influence on the downstream turbine response than the reduced frequency itself.
Importantly, the equivalent aerodynamic damping of the downstream turbine was systematically lower than that of the upstream turbine in all motion cases. The non-uniform and dynamically modulated inflow imposed by the wake alters the velocity–thrust phase relationship that governs damping. This demonstrates that the effective aerodynamic damping of a floating turbine within a wind farm can be substantially modified by the wake of upstream turbines.
In addition to the phase-dependent aerodynamic response, reduced frequency governs the strength and spatial coherence of the motion-induced wake modulation and its effect on turbines' energy capture. Although both motion frequencies were associated with identical apparent-wind-speed variation amplitudes, only the higher reduced frequency (fr = 0.48) produced strong, spatially coherent wake pulsations and a measurable increase in the mean wake velocity behind the upstream turbine. This enhanced wake recovery translated into higher inflow velocity at the downstream turbine and a corresponding increase in its mean power production. In contrast, the lower reduced frequency (fr = 0.12) generated periodic wake oscillations but did not significantly modify the time-averaged wake deficit or downstream turbine power.
The wake of the downstream turbine exhibited lower-amplitude and less spatially coherent velocity oscillations than that of the upstream turbine, particularly at the higher reduced frequency. From a farm-level perspective, measurable power gains were observed only at the higher reduced frequency of fr = 0.48, and primarily when the upstream turbine was in motion. Although the absolute increase in total farm power was modest due to the strong wake deficit at the location of the downstream turbine, the results demonstrate that motion-induced wake modulation can positively influence energy yield under specific platform motion conditions. Enhanced recovery of inflow velocity downstream of the second turbine was largely inherited from motion-induced modulation of the upstream turbine wake, an effect that was especially pronounced at the higher reduced frequency. This suggests that motion-induced wake modulation generated by upstream turbines may persist through successive turbine interactions and contribute to wake recovery deeper within floating wind farms.
Overall, these results provide experimental evidence of wake–rotor synchronization, where the phase relationship between motion-induced wake velocity fluctuations and downstream rotor motion determines how their contributions to the apparent wind speed reinforce or partially compensate each other, thereby influencing the aerodynamic response of the downstream turbine. The controlled harmonic motions and low-turbulence inflow were selected to isolate this mechanism; establishing its relevance under realistic atmospheric inflow, irregular wave-induced platform motions, and active turbine control represents the next step. Nonetheless, the present experiment demonstrates that wake–rotor synchronization can significantly affect aerodynamic loading, the effective aerodynamic damping of the downstream turbine, and energy capture, proving an additional dynamic coupling mechanism specific to floating wind farms and absent in their bottom-fixed counterparts.
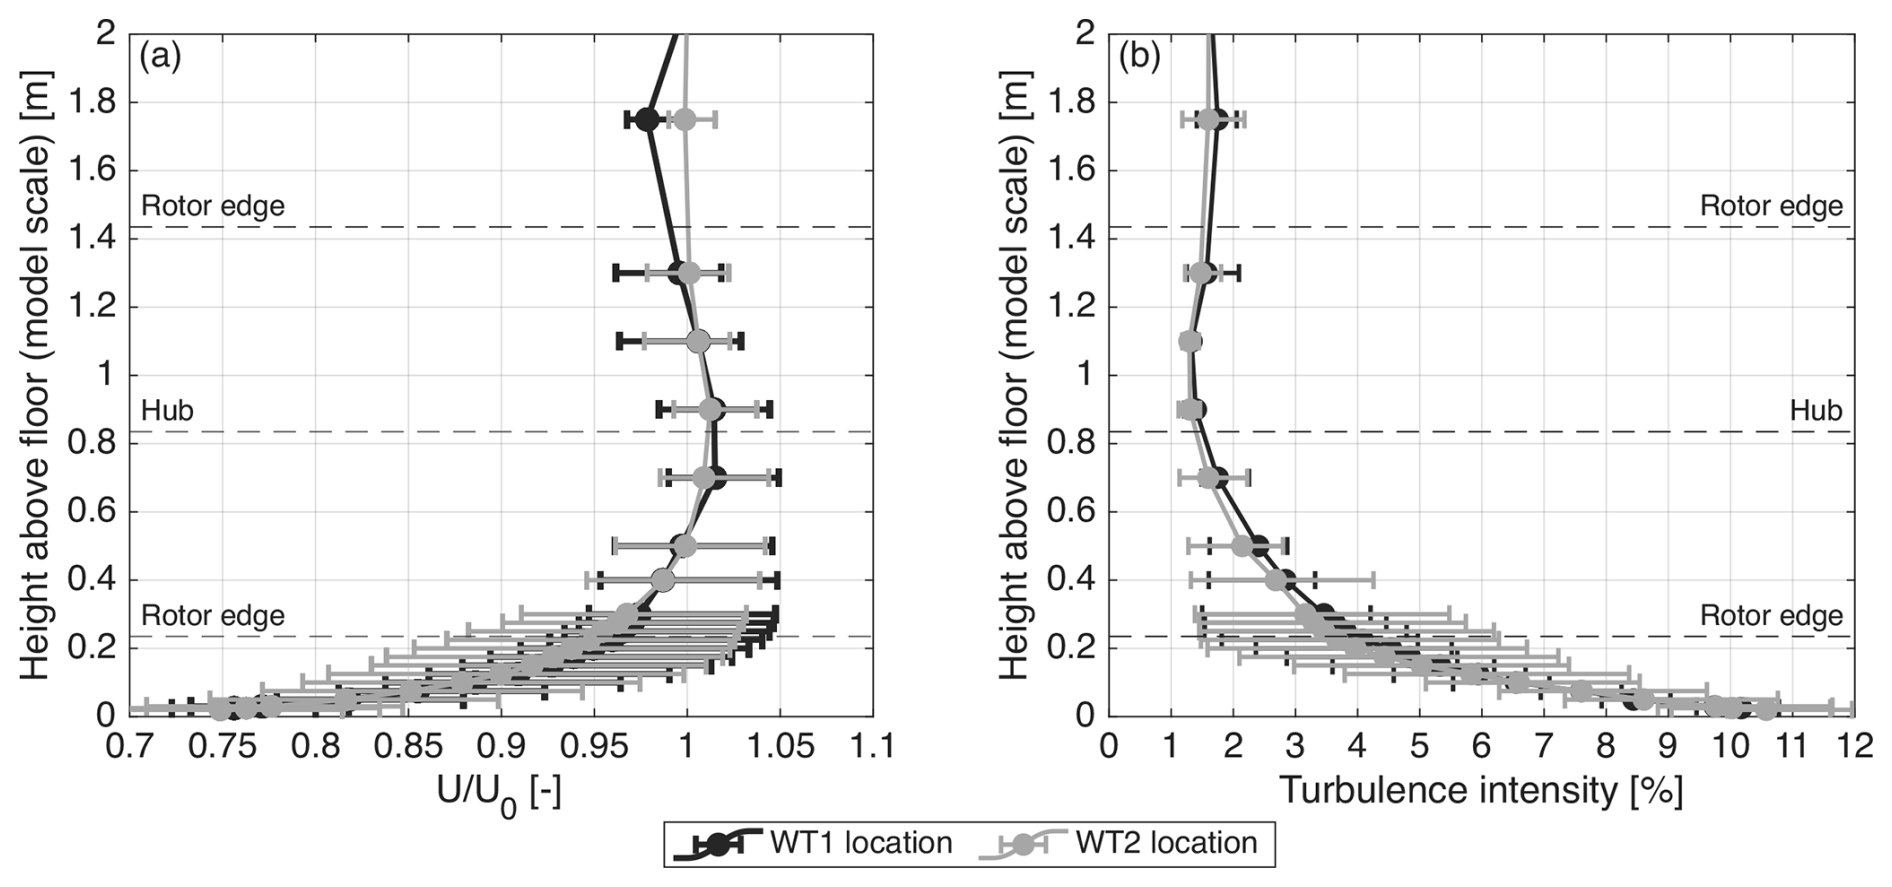
Figure A1Vertical profiles of (a) mean streamwise velocity normalized by the reference wind speed U0 and (b) turbulence intensity at the locations of WT1 and WT2, measured without the turbines installed. Measurements were performed at four lateral positions, yi = m. The profiles show the mean and the corresponding minimum and maximum values at each height.
The inflow conditions in the wind tunnel test section were characterized prior to the experiments, with both turbines removed. Measurements of streamwise velocity were performed along vertical lines at four lateral positions, yi = m, at the locations of both turbines. Figure A1 presents the resulting vertical profiles of mean streamwise velocity and turbulence intensity. The profiles measured at the two turbine locations are very similar, particularly within the rotor area, indicating comparable inflow conditions for the two wind turbines.
The mean streamwise velocity decreases slightly towards the wind tunnel floor. Within the vertical extent of the rotor, the laterally averaged velocity deviates from the reference wind speed U0 by approximately −3 % to +1 %. At a given height, lateral variations are approximately ±5 % relative to the mean value. Overall, variations in mean streamwise velocity across the rotor area are relatively small, with comparable magnitudes in the vertical and lateral directions.
The turbulence intensity ranges between approximately 1 % and 2 % in the upper half of the rotor area. Closer to the wind tunnel floor, it increases, reaching an average of approximately 3.5 % in the lower half of the rotor. The lateral variability in turbulence intensity also increases towards the floor.
Figure B1 illustrates the post-processing procedure applied to loads and wake measurements for a representative test case, with WT1 undergoing a prescribed surge motion at 2 Hz (reduced frequency fr = 0.48) and an amplitude of 0.02 m.
Figure B1a and b show the processing of thrust measurements. The raw signal acquired under wind-on conditions contains both aerodynamic and inertial contributions, while the no-wind signal (obtained with the rotor at rest under the same imposed motion) contains inertial effects only. In both signals, a low-frequency component at the platform motion frequency is clearly visible, together with a higher-frequency contribution at approximately 23 Hz, associated with the tower fore–aft mode. This higher-frequency component exhibits a larger amplitude in the no-wind case, as the structural response of the tower is not damped by the aerodynamic thrust of the operating rotor. In the wind-on condition, additional less-defined high-frequency contributions are observed, which are absent in the no-wind case and are attributed to rotor rotation. The aerodynamic thrust is obtained by subtracting the no-wind signal from the wind-on measurements. The resulting signal is then low-pass-filtered to remove higher-frequency components associated with rotor rotation and tower dynamics. Phase averaging is finally applied to extract the periodic load variation associated with platform motion.
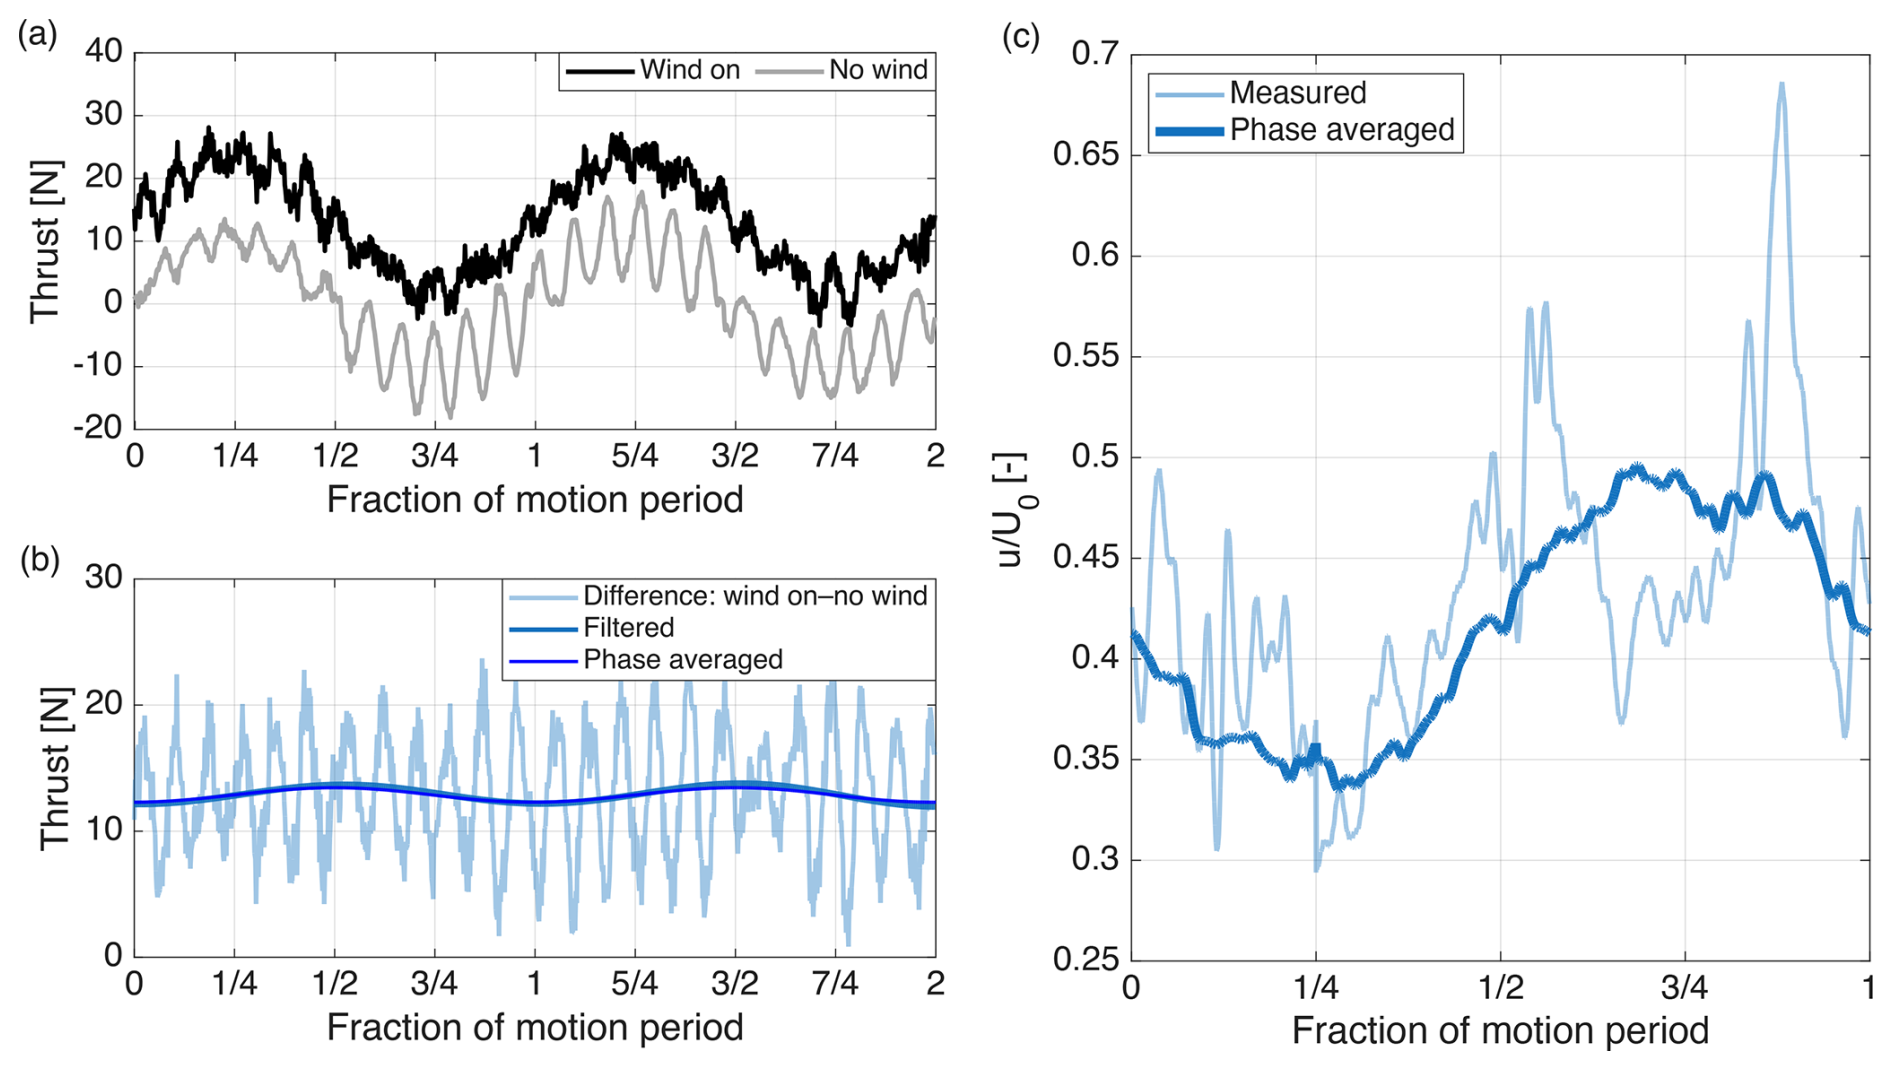
Figure B1Example of load and wake data processing for WT1 undergoing prescribed surge motion (fm = 2 Hz, fr = 0.48, am = 0.02 m). (a) Tower-top thrust measurements under wind-on and no-wind conditions. (b) Aerodynamic thrust obtained by subtraction, with low-pass filtering and phase-averaged signal. (c) Wake streamwise velocity (u) at x = 3.5 D, yi = 0.5 D normalized by the free-stream wind speed (U0): measured signal and corresponding phase-averaged velocity.
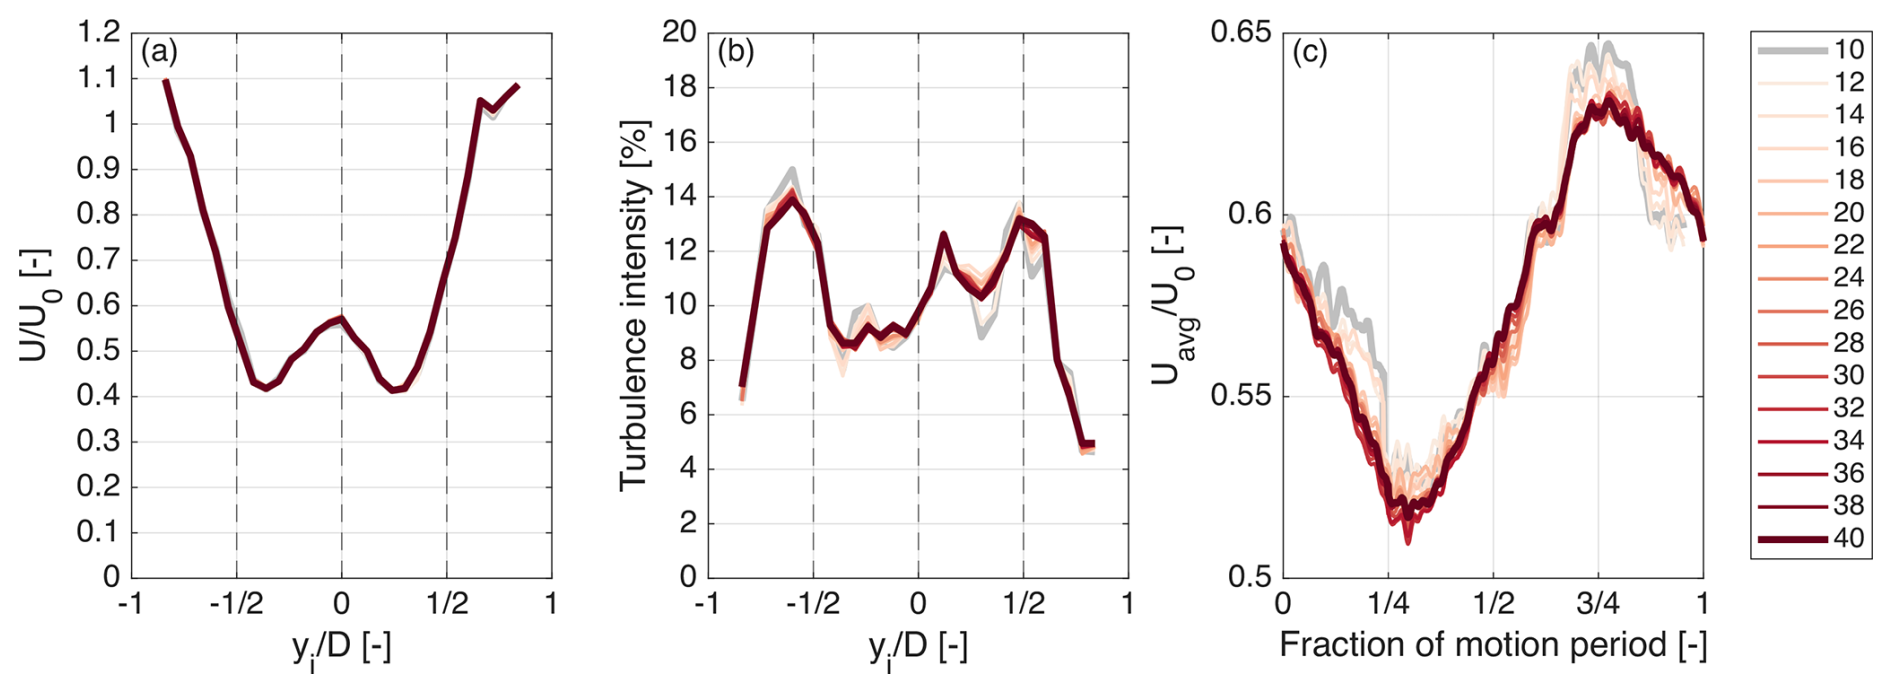
Figure B2Sensitivity of the wake velocity metrics to the number of motion cycles included in the analysis, for WT1 undergoing surge motion at fm = 2 Hz (fr = 0.48), at a downstream distance of 3.5 D. (a) Time-averaged streamwise velocity normalized by the free-stream velocity (). (b) Turbulence intensity. (c) Phase-averaged, spatially averaged wake velocity Uavg, normalized by U0. Results are shown for acquisition windows containing between 10 and 40 motion cycles, corresponding to durations of 5–20 s.
Figure B1c presents an example of wake velocity processing at 3.5 D downstream of WT1 and at yi = 0.5 D. The measured velocity signal exhibits significant fluctuations due to turbulence and wake unsteadiness. To isolate the coherent response to platform motion, the signal is binned according to the phase of the imposed motion and phase-averaged using the same procedure as for the load data.
The sensitivity of the wake velocity metrics to the acquisition duration was assessed by progressively increasing the number of motion cycles included in the analysis. The convergence assessment was performed for the configuration in which WT1 undergoes harmonic surge motion at fm = 2 Hz (fr = 0.48), considering velocity measurements at a downstream distance of 3.5 D. This condition was selected because it produces the strongest motion-synchronized velocity fluctuations in the wake of WT1.
Figure B2 shows the mean streamwise velocity, turbulence intensity, and phase- and spatially averaged streamwise velocity over the rotor region, computed using acquisition windows containing between 10 and 40 motion cycles. These correspond to measurement durations ranging from 5 to 20 s at model scale. The mean velocity and turbulence intensity profiles have only minor variations as the number of cycles increases, indicating that these statistics are relatively insensitive to the acquisition duration.
The phase- and spatially averaged velocity exhibits slightly greater variability. Nevertheless, the periodic response remains clearly identifiable, and its amplitude is nearly unchanged. In particular, increasing the number of cycles from 10 to 40 changes the maximum normalized velocity from 0.641 to 0.628 U0 and the minimum from 0.529 to 0.517 U0. The corresponding peak-to-peak amplitude remains approximately constant, decreasing only from 0.112 to 0.111 U0.
The amplitude of aerodynamic thrust oscillations induced by harmonic surge motion can be estimated under a quasi-steady approximation. Following Schulz et al. (2026), the thrust oscillation amplitude of a rotor operating at constant rotational speed can be expressed as half the difference between the maximum and minimum thrust forces experienced during one motion cycle:
where A = πR2 is the rotor area, is the mean inflow velocity, ΔU* = is the normalized amplitude of the apparent-wind-speed variation, and ΔU = am⋅(2πfm) is the amplitude of the rotor fore–aft velocity induced by surge motion.
The minimum and maximum tip-speed ratios are
where ωr is the rotor rotational speed.
Equation (C1) accounts for both the variation in dynamic pressure associated with the apparent wind speed and the variation in thrust coefficient resulting from changes in tip-speed ratio.
For small apparent-wind-speed variations, this expression can be linearized around the mean operating condition. Starting from the quasi-steady thrust relation
the derivative of thrust with respect to wind speed at constant rotor speed is
The amplitude of the thrust oscillations can therefore be approximated as
Equation (C5) shows that, for a given amplitude of apparent-wind-speed variation, the thrust oscillation amplitude depends on the mean inflow velocity and on the aerodynamic sensitivity of the rotor, represented by the term in brackets. For identical rotors operating at similar tip-speed ratios and assuming comparable variations in Ct with λ, the thrust oscillation amplitude is approximately proportional to the mean inflow velocity.
This approximation is applied to the configurations tested in the experiment in which thrust oscillations are induced exclusively by rotor motion: WT1 moving in the free stream and WT2 moving in the wake of a fixed WT1 (“WT1 fixed”). In both cases, the amplitude of the apparent-wind-speed variation is ΔU = 0.25 m s−1. For WT1, the mean inflow velocity is = U0 = 4.9 m s−1 and the mean thrust coefficient is Ct = 0.82. For WT2, the mean inflow velocity is approximated by the rotor-effective wind speed = 3.1 m s−1, obtained from the measured mean thrust, with a corresponding thrust coefficient of Ct = 0.70. Since both turbines have identical rotors and operate at nearly identical tip-speed ratios, the derivative is assumed to be the same for both turbines and is estimated from the experimentally characterized Ct(λ) curve of WT1. This approximation neglects possible modifications of the aerodynamic sensitivity associated with the spatially non-uniform wake inflow.
Table C1 compares the thrust oscillation amplitudes predicted by the analytical model with the experimental measurements.
Table C1Analytical estimates and measured amplitudes of thrust oscillations induced by surge motion for WT1 operating in the free stream and WT2 operating in the wake of a fixed WT1.
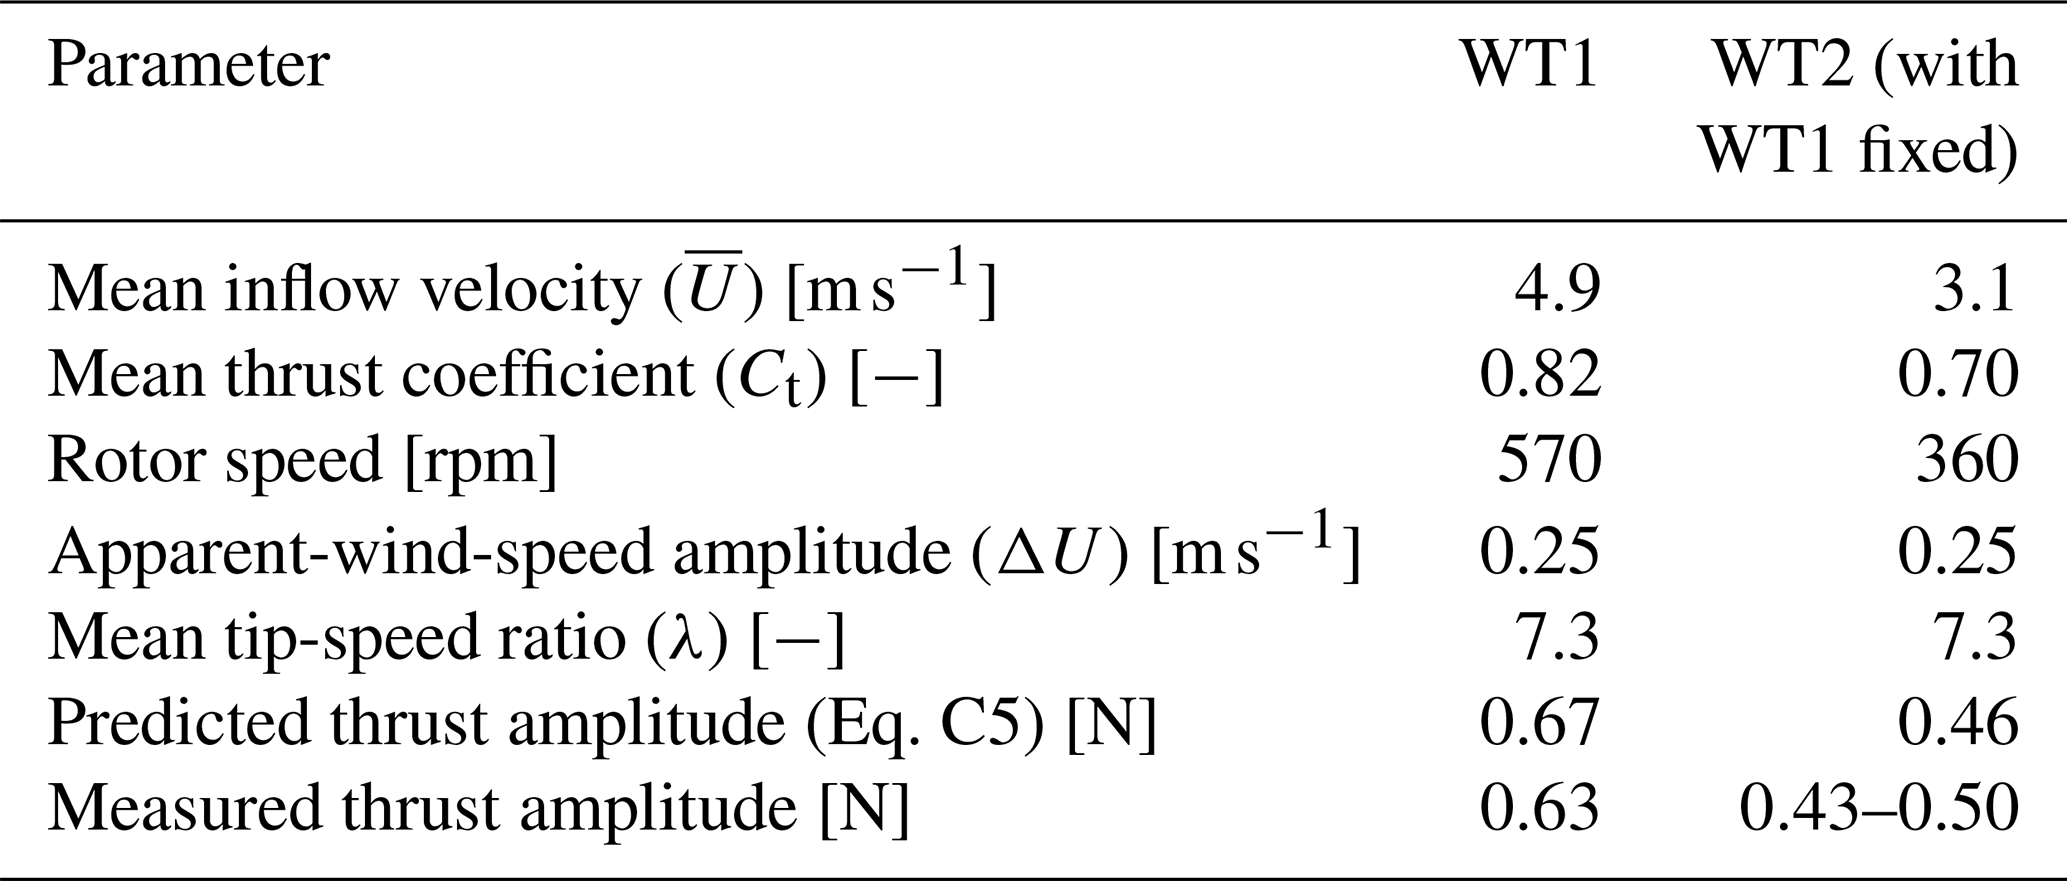
The analytical estimates of thrust oscillation amplitudes of WT1 and WT2 are in good agreement with the experimental measurements. Although both turbines experience the same absolute apparent-wind-speed variation, the lower mean inflow velocity at WT2 results in lower-amplitude thrust variations. The agreement between measurements and the analytical model indicates that the reduction in mean inflow velocity imposed by the upstream wake is sufficient to explain most of the observed difference in thrust oscillation amplitude.
The thrust oscillations of WT1 at reduced frequency fr = 0.12 have an amplitude of 0.63 N and a phase shift of −90.3°; at fr = 0.48, the amplitude remains 0.63 N, with a phase shift of −89.7°. The thrust oscillation amplitudes of WT2 under the different motion conditions are reported in Table D1, while the corresponding phase shifts relative to its motion are given in Table D2.
Table D1Amplitude of the WT2 aerodynamic thrust at the motion frequency for the two reduced motion frequencies and for different phase offsets (ϕ) between the motions of WT1 and WT2.

Table D2Phase of the WT2 aerodynamic thrust relative to its platform motion at the motion frequency, for the two reduced motion frequencies and different phase offsets (ϕ) between the motions of WT1 and WT2.

Table D3Normalized equivalent aerodynamic damping coefficient of WT2 (normalized by the corresponding coefficient of WT1) for the two reduced motion frequencies and for different phase offsets (ϕ) between the motions of WT1 and WT2.

A comprehensive description of the model-scale wind turbine rotor is available at https://doi.org/10.5281/zenodo.19094186 (Fontanella and Belloli, 2026). The experimental dataset, including load and wake measurements for both turbines, is available at https://doi.org/10.5281/zenodo.19492347 (Fontanella et al., 2026b).
All authors prepared and conducted the experiment and analyzed the measurement data. AFo wrote the first draft of the paper, while all authors contributed to its review and editing. MB and VD procured the funding. MB, SM, and VD supervised the work.
The contact author has declared that none of the authors has any competing interests.
Publisher's note: Copernicus Publications remains neutral with regard to jurisdictional claims made in the text, published maps, institutional affiliations, or any other geographical representation in this paper. The authors bear the ultimate responsibility for providing appropriate place names. Views expressed in the text are those of the authors and do not necessarily reflect the views of the publisher.
The authors used ChatGPT to assist with language and text revision during manuscript preparation. All AI-generated suggestions were critically reviewed and edited by the authors, who take full responsibility for the final content of the article.
This study was carried out within the NEST – Network 4 Energy Sustainable Transition (D.D. 1243 02/08/2022, PE00000021) and received funding under the National Recovery and Resilience Plan (NRRP), Mission 4, Component 2, Investment 1.3, funded by the European Union – NextGenerationEU. This article reflects only the authors' views and opinions; neither the European Union nor the European Commission can be considered responsible for them.
This paper was edited by Jason Hearst and reviewed by two anonymous referees.
Angelou, N., Mann, J., and Dubreuil-Boisclair, C.: Revealing inflow and wake conditions of a 6 MW floating turbine, Wind Energ. Sci., 8, 1511–1531, https://doi.org/10.5194/wes-8-1511-2023, 2023. a
Arnal, V.: Experimental modelling of a floating wind turbine using a “software-in-the-loop” approach, theses, École centrale de Nantes, https://theses.hal.science/tel-03237441 (last access: 31 January 2025), 2020. a
Bak, C., Bitsche, R., Yde, A., Kim, T., Hansen, M. H., Zahle, F., Gaunaa, M., Blasques, J. P. A. A., Døssing, M., Wedel Heinen, J.-J., and Behrens, T.: Light Rotor: The 10-MW reference wind turbine, in: Proceedings of EWEA 2012 – European Wind Energy Conference & Exhibition, European Wind Energy Association (EWEA), https://backend.orbit.dtu.dk/ws/files/7946741/Light_Rotor.pdf (last access: 31 October 2026), 2012. a, b
Bayati, I., Belloli, M., Bernini, L., and Zasso, A.: Wind Tunnel Wake Measurements of Floating Offshore Wind Turbines, Energy Procedia, 137, 214–222, https://doi.org/10.1016/j.egypro.2017.10.375, 2017. a
Bergua, R., Robertson, A., Jonkman, J., Branlard, E., Fontanella, A., Belloli, M., Schito, P., Zasso, A., Persico, G., Sanvito, A., Amet, E., Brun, C., Campaña-Alonso, G., Martín-San-Román, R., Cai, R., Cai, J., Qian, Q., Maoshi, W., Beardsell, A., Pirrung, G., Ramos-García, N., Shi, W., Fu, J., Corniglion, R., Lovera, A., Galván, J., Nygaard, T. A., dos Santos, C. R., Gilbert, P., Joulin, P.-A., Blondel, F., Frickel, E., Chen, P., Hu, Z., Boisard, R., Yilmazlar, K., Croce, A., Harnois, V., Zhang, L., Li, Y., Aristondo, A., Mendikoa Alonso, I., Mancini, S., Boorsma, K., Savenije, F., Marten, D., Soto-Valle, R., Schulz, C. W., Netzband, S., Bianchini, A., Papi, F., Cioni, S., Trubat, P., Alarcon, D., Molins, C., Cormier, M., Brüker, K., Lutz, T., Xiao, Q., Deng, Z., Haudin, F., and Goveas, A.: OC6 project Phase III: validation of the aerodynamic loading on a wind turbine rotor undergoing large motion caused by a floating support structure, Wind Energ. Sci., 8, 465–485, https://doi.org/10.5194/wes-8-465-2023, 2023. a, b, c, d, e
Bossuyt, J., Ferčák, O., Sadek, Z., Meneveau, C., Gayme, D. F., and Cal, R. B.: Floating wind farm experiments through scaling for wake characterization, power extraction, and turbine dynamics, Phys. Rev. Fluids, 8, 120501, https://doi.org/10.1103/PhysRevFluids.8.120501, 2023. a
Cioni, S., Papi, F., Balduzzi, F., Fontanella, A., and Bianchini, A.: Blade-resolved CFD analysis of a floating wind turbine: new insights on unsteady aerodynamics, loads, and wake, Ocean Eng., 341, 122746, https://doi.org/10.1016/j.oceaneng.2025.122746, 2025. a
Cioni, S., Papi, F., Melani, P. F., Fontanella, A., Firpo, A., Sanvito, A. G., Persico, G., Dossena, V., Muggiasca, S., Belloli, M., and Bianchini, A.: How accurately do engineering methods capture floating wind turbine performance and wake? A critical perspective using multi-fidelity simulations, Wind Energ. Sci., 11, 795–824, https://doi.org/10.5194/wes-11-795-2026, 2026. a
Duan, G., Huang, J., Hu, X., and Porté-Agel, F.: Power and wake of a floating wind turbine in surge motion: Theoretical and experimental investigations, Energ. Convers. Manage., 369, 122028, https://doi.org/10.1016/j.enconman.2026.122028, 2026. a
Firpo, A., Sanvito, A. G., Persico, G., and Dossena, V.: Actuator line URANS-to-LES comparison of single and tandem floating offshore wind turbines, Wind Energ. Sci., 11, 557–584, https://doi.org/10.5194/wes-11-557-2026, 2026. a
Fontanella, A. and Belloli, M.: Model-Scale Wind Turbine Rotor, Zenodo [data set], https://doi.org/10.5281/zenodo.19094186, 2026. a
Fontanella, A., Bayati, I., and Belloli, M.: Control of Floating Offshore Wind Turbines: Reduced-Order Modeling and Real-Time Implementation for Wind Tunnel Tests, in: International Conference on Offshore Mechanics and Arctic Engineering, Madrid, Spain, 17–22 June 2018, ASME, Vol. 10: Ocean Renewable Energy, V010T09A081, https://doi.org/10.1115/OMAE2018-77840, 2018. a
Fontanella, A., Bayati, I., Mikkelsen, R., Belloli, M., and Zasso, A.: UNAFLOW: a holistic wind tunnel experiment about the aerodynamic response of floating wind turbines under imposed surge motion, Wind Energ. Sci., 6, 1169–1190, https://doi.org/10.5194/wes-6-1169-2021, 2021. a
Fontanella, A., Zasso, A., and Belloli, M.: Wind tunnel investigation of the wake-flow response for a floating turbine subjected to surge motion, J. Phys. Conf. Ser., 2265, 042023, https://doi.org/10.1088/1742-6596/2265/4/042023, 2022. a, b
Fontanella, A., Da Pra, G., and Belloli, M.: Integrated Design and Experimental Validation of a Fixed-Pitch Rotor for Wind Tunnel Testing, Energies, 16, https://doi.org/10.3390/en16052205, 2023. a
Fontanella, A., Palombini, G., Piffer, A., Giberti, H., and Belloli, M.: Design of a robotic platform for hybrid wind tunnel experiments of floating wind farms, J. Phys. Conf. Ser., 2767, 042008, https://doi.org/10.1088/1742-6596/2767/4/042008, 2024. a
Fontanella, A., Fusetti, A., Cioni, S., Papi, F., Muggiasca, S., Persico, G., Dossena, V., Bianchini, A., and Belloli, M.: Wake development in floating wind turbines: new insights and an open dataset from wind tunnel experiments, Wind Energ. Sci., 10, 1369–1387, https://doi.org/10.5194/wes-10-1369-2025, 2025. a, b, c, d, e, f, g, h
Fontanella, A., Cioni, S., Papi, F., Muggiasca, S., Bianchini, A., and Belloli, M.: Experimental investigation of the effects of floating wind turbine motion on a downstream turbine performance and loads, Wind Energ. Sci., 11, 1821–1851, https://doi.org/10.5194/wes-11-1821-2026, 2026a. a, b, c, d, e, f
Fontanella, A., Fusetti, A., Muggiasca, S., Dossena, V., and Belloli, M.: Wind tunnel measurements of loads and wakes in tandem floating wind turbines under harmonic surge motion, Zenodo [data set], https://doi.org/10.5281/zenodo.19492347, 2026b. a
Hu, X., Duan, G., and Porté-Agel, F.: Impact of surge motion on wake characteristics, power performance and fatigue loads of two tandem floating wind turbines, Appl. Energ., 416, 127999, https://doi.org/10.1016/j.apenergy.2026.127999, 2026. a
Hubert, A., Conan, B., and Aubrun, S.: Spatiotemporal behavior of the far wake of a wind turbine model subjected to harmonic motions: phase averaging applied to stereo particle image velocimetry measurements, Wind Energ. Sci., 10, 1351–1368, https://doi.org/10.5194/wes-10-1351-2025, 2025. a
Jonkman, J.: Influence of Control on the Pitch Damping of a Floating Wind Turbine, in: 46th AIAA Aerospace Sciences Meeting and Exhibit, Reno, Nevada, 7–10 January 2008, AIAA 2008-1306, https://doi.org/10.2514/6.2008-1306. a
Lemmer, F., Raach, S., Schlipf, D., Faerron-Guzmán, R., and Cheng, P. W.: FAST model of the SWE-TripleSpar floating wind turbine platform for the DTU 10MW reference wind turbine, V1, DaRUS [data set], V1, https://doi.org/10.18419/DARUS-514, 2020. a
Li, Y., Yu, W., and Sarlak, H.: Wake Structures and Performance of Wind Turbine Rotor With Harmonic Surging Motions Under Laminar and Turbulent Inflows, Wind Energy, 27, 1499–1525, https://doi.org/10.1002/we.2949, 2024. a
Li, Y., Yu, W., and Sarlak, H.: Wake interaction of dual surging FOWT rotors in tandem, Renewable Energy, 239, 122062, https://doi.org/10.1016/j.renene.2024.122062, 2025. a
Mahfouz, M. Y., Molins, C., Trubat, P., Hernández, S., Vigara, F., Pegalajar-Jurado, A., Bredmose, H., and Salari, M.: Response of the International Energy Agency (IEA) Wind 15 MW WindCrete and Activefloat floating wind turbines to wind and second-order waves, Wind Energ. Sci., 6, 867–883, https://doi.org/10.5194/wes-6-867-2021, 2021. a
Messmer, T., Hölling, M., and Peinke, J.: Enhanced recovery caused by nonlinear dynamics in the wake of a floating offshore wind turbine, J. Fluid Mech., 984, A66, https://doi.org/10.1017/jfm.2024.175, 2024a. a, b, c, d, e
Messmer, T., Peinke, J., and Hölling, M.: Wind tunnel investigation on the recovery and dynamics of the wake of a floating offshore wind turbine subjected to low inflow turbulence, J. Phys. Conf. Ser., 2767, 092083, https://doi.org/10.1088/1742-6596/2767/9/092083, 2024b. a, b
Messmer, T., Peinke, J., Croce, A., and Hölling, M.: The role of motion-excited coherent structures in improved wake recovery of a floating wind turbine, J. Fluid Mech., 1018, A23, https://doi.org/10.1017/jfm.2025.10509, 2025. a, b
Meyers, J., Bottasso, C., Dykes, K., Fleming, P., Gebraad, P., Giebel, G., Göçmen, T., and van Wingerden, J.-W.: Wind farm flow control: prospects and challenges, Wind Energ. Sci., 7, 2271–2306, https://doi.org/10.5194/wes-7-2271-2022, 2022. a
Mian, H., Messmer, T., Stoevesandt, B., and Siddiqui, M.: Coherent flow structures in the wake of a model floating wind turbine under pitch and roll motions, Energy, 335, 138212, https://doi.org/10.1016/j.energy.2025.138212, 2025. a
Miroux, M., Taruffi, F., and Viré, A.: Effect of floating wind turbine wakes on the thrust dynamics of a downstream turbine, J. Phys. Conf. Ser., 3224, 082004, https://doi.org/10.1088/1742-6596/3224/8/082004, 2026. a, b, c
Özinan, U., Gräfe, M., Schulz, C. W., and Cheng, P. W.: Near-wake measurements and simulations of a floating wind turbine using a four-beam nacelle-based lidar, J. Phys. Conf. Ser., 2767, 092100, https://doi.org/10.1088/1742-6596/2767/9/092100, 2024. a
Pagamonci, L., Papi, F., Cojocaru, G., Belloli, M., and Bianchini, A.: How does turbulence affect wake development in floating wind turbines? Some insights from comparative large-eddy simulations and wind tunnel experiments, Wind Energ. Sci., 10, 1707–1736, https://doi.org/10.5194/wes-10-1707-2025, 2025. a, b
Schliffke, B., Aubrun, S., and Conan, B.: Wind Tunnel Study of a “Floating” Wind Turbine's Wake in an Atmospheric Boundary Layer with Imposed Characteristic Surge Motion, J. Phys. Conf. Ser., 1618, 062015, https://doi.org/10.1088/1742-6596/1618/6/062015, 2020. a
Schliffke, B., Conan, B., and Aubrun, S.: Floating wind turbine motion signature in the far-wake spectral content – a wind tunnel experiment, Wind Energ. Sci., 9, 519–532, https://doi.org/10.5194/wes-9-519-2024, 2024. a
Schulz, C. W., Netzband, S., Özinan, U., Cheng, P. W., and Abdel-Maksoud, M.: Wind turbine rotors in surge motion: new insights into unsteady aerodynamics of floating offshore wind turbines (FOWTs) from experiments and simulations, Wind Energ. Sci., 9, 665–695, https://doi.org/10.5194/wes-9-665-2024, 2024. a, b, c, d
Schulz, C. W., Bergua, R., Branlard, E., Netzband, S., Jonkman, J., and Roberston, A.: Unsteady aerodynamics of large-scale floating offshore wind turbines in surge motion, Renewable Energy, 260, 124977, https://doi.org/10.1016/j.renene.2025.124977, 2026. a, b, c
Taruffi, F., Combette, R., and Viré, A.: Experimental and CFD analysis of a floating offshore wind turbine under imposed motions, J. Phys. Conf. Ser., 2767, 062010, https://doi.org/10.1088/1742-6596/2767/6/062010, 2024. a
Wise, A. S. and Bachynski, E. E.: Wake meandering effects on floating wind turbines, Wind Energy, 23, 1266–1285, https://doi.org/10.1002/we.2485, 2020. a, b
- Abstract
- Introduction
- Experiment setup
- Data processing
- Results
- Discussion of results
- Conclusions
- Appendix A: Wind tunnel inflow characterization
- Appendix B: Example of load and wake data processing
- Appendix C: Analytical estimate of thrust oscillations induced by surge motion
- Appendix D: Thrust oscillation and aerodynamic damping of the downstream turbine
- Data availability
- Author contributions
- Competing interests
- Disclaimer
- Acknowledgements
- Financial support
- Review statement
- References
- Abstract
- Introduction
- Experiment setup
- Data processing
- Results
- Discussion of results
- Conclusions
- Appendix A: Wind tunnel inflow characterization
- Appendix B: Example of load and wake data processing
- Appendix C: Analytical estimate of thrust oscillations induced by surge motion
- Appendix D: Thrust oscillation and aerodynamic damping of the downstream turbine
- Data availability
- Author contributions
- Competing interests
- Disclaimer
- Acknowledgements
- Financial support
- Review statement
- References