the Creative Commons Attribution 3.0 License.
the Creative Commons Attribution 3.0 License.
Effects of defects in composite wind turbine blades – Part 3: A framework for treating defects as uncertainty variables for blade analysis
Trey W. Riddle
Douglas S. Cairns
Given that wind turbine blades are large structures, the use of low-cost composite manufacturing processes and materials has been necessary for the industry to be cost competitive. Since these manufacturing methods can lead to the inclusion of unwanted defects, potentially reducing blade life, the Blade Reliability Collaborative tasked the Montana State University Composites Group with assessing the effects of these defects. Utilizing the results of characterization and mechanical testing studies, probabilistic models were developed to assess the reliability of a wind blade with known defects. As such, defects were found to be best assessed as design parameters in a parametric probabilistic analysis allowing for establishment of a consistent framework to validate categorization and analysis. Monte Carlo simulations were found to adequately describe the probability of failure of composite blades with included defects. By treating defects as random variables, the approaches utilized indicate the level of conservation used in blade design may be reduced when considering fatigue. In turn, safety factors may be reduced as some of the uncertainty surrounding blade failure is reduced when analyzed with application specific data. Overall, the results indicate that characterization of defects and reduction of design uncertainty is possible for wind turbine blades.


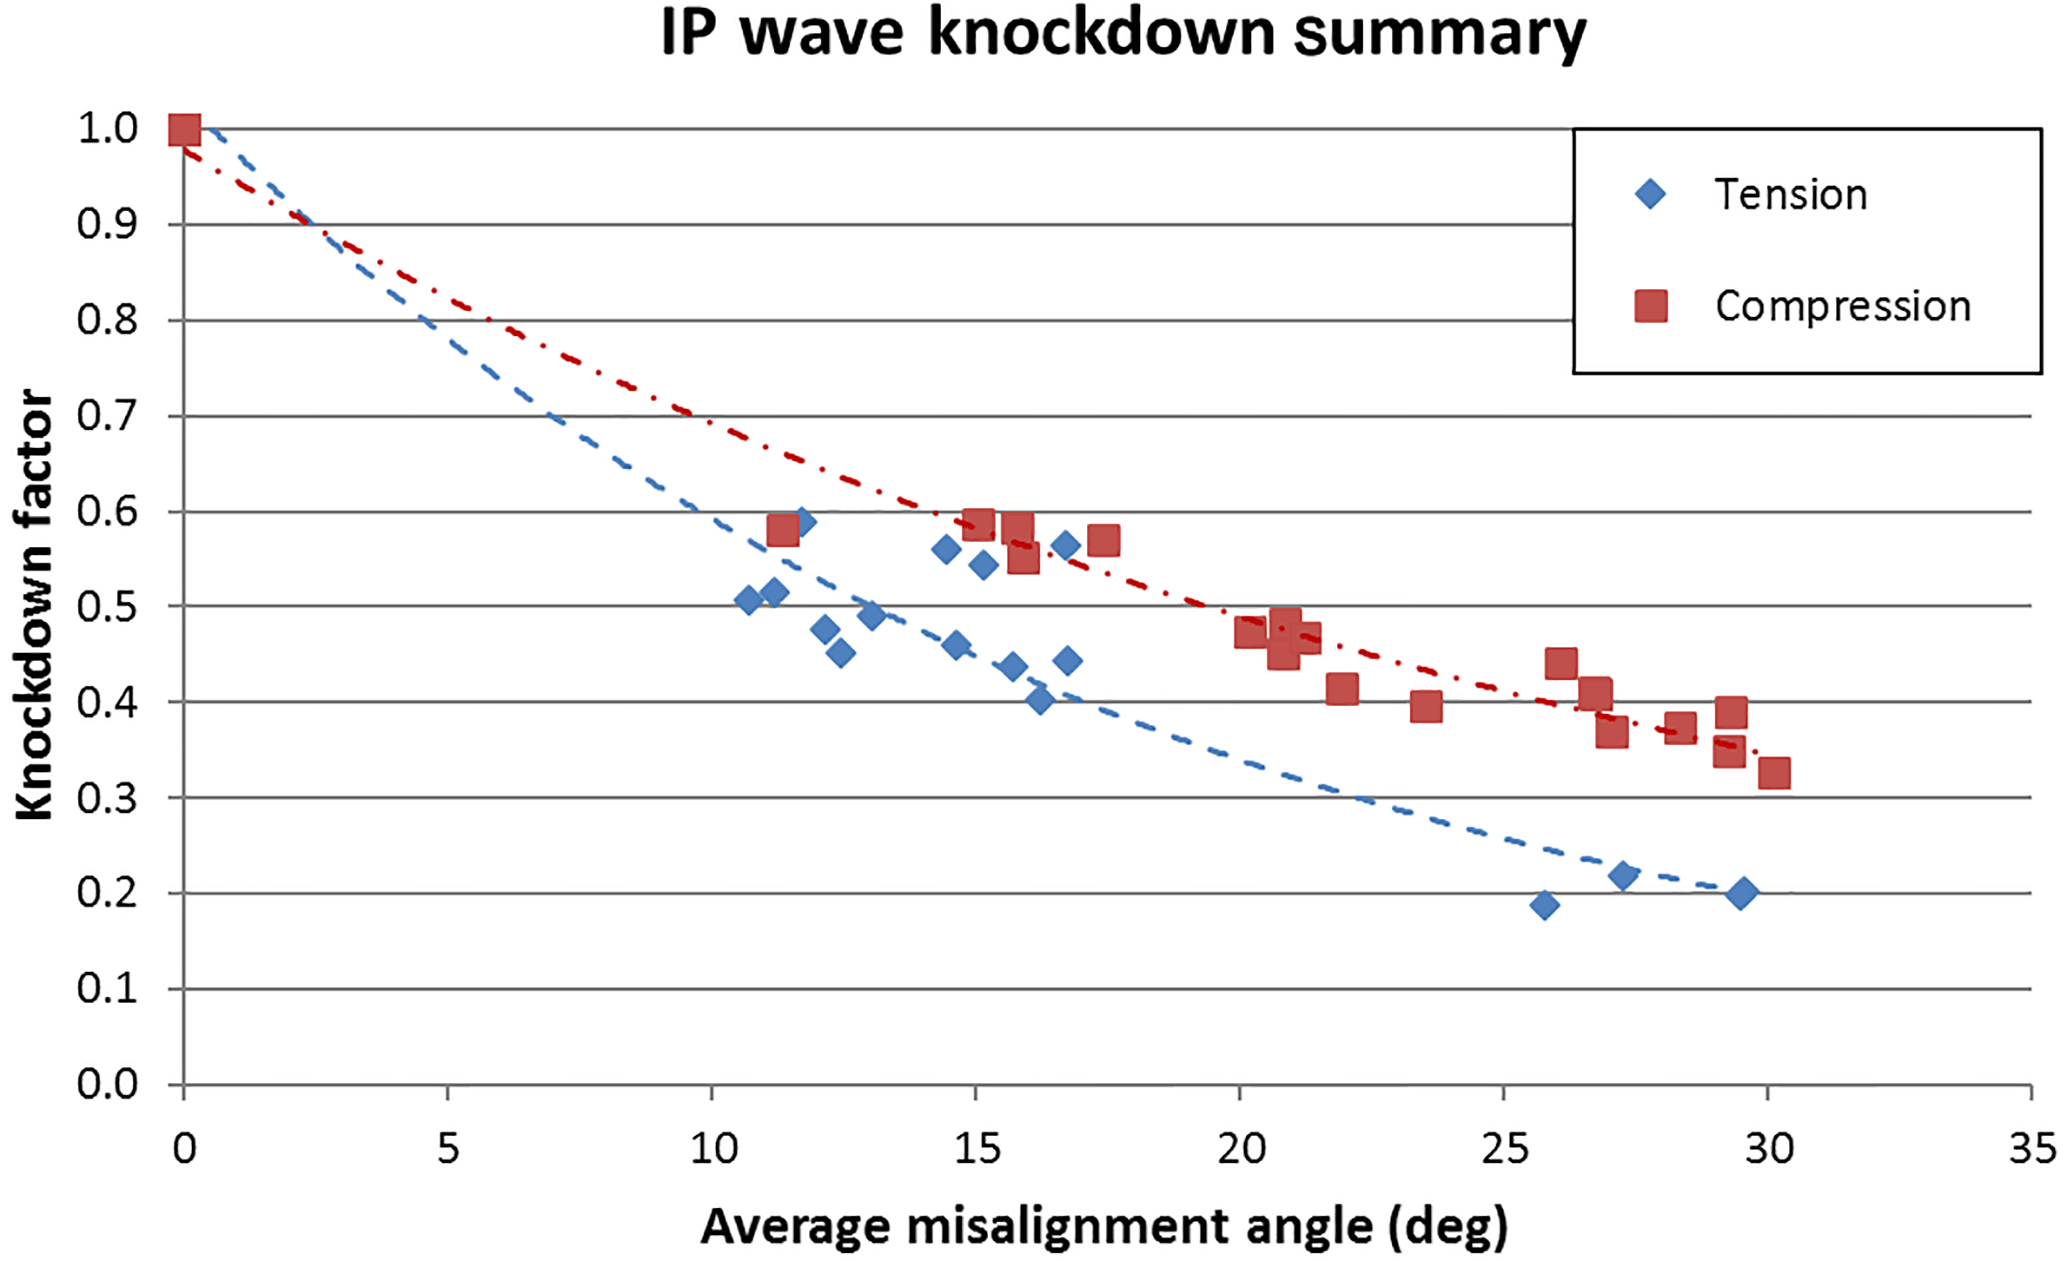
As part of the Department of Energy sponsored, Sandia National Laboratory led, Blade Reliability Collaborative (BRC), a metric has been developed to precisely address the geometric nature of flaws based on statistical commonality in blades (Nelson et al., 2017). The function of the flaw characterization portion of this program has been to provide quantitative analysis for two major directives: acquisition and generation of quantitative flaw data describing common defects in composite wind turbine blades and development of a flaw severity designation system and probabilistic risk management protocol for as-built flawed structures. To meet these directives, the effects of porosity, in-plane (IP) waves, and out-of-plane (OP) waves were investigated, based on priorities provided by the wind turbine industry (Riddle et al., 2011). In all cases, mechanical testing of flawed laminates was performed and failure strengths or strains were correlated to the characteristic flaw parameter. An example of the correlation between a defect parameter and the composite mechanical response for IP waves is shown in Fig. 1 (Riddle et al., 2012).
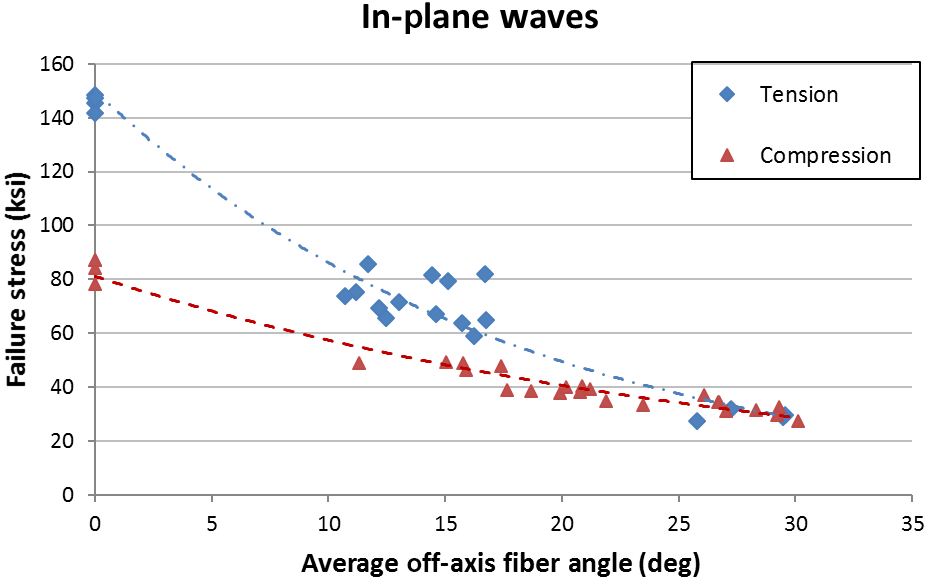
Figure 1Individual and trending failure stress for each average off-axis fiber angle tested.
The typical procedure for certification of wind turbine blades is to use deterministic safety factors (SFs) and apply them to uncertainty variables such as loads, material properties, manufacturing scale-up, and manufacturing defects. This is sometimes blended with statistical treatment for variables, such as materials allowable, but it does not provide any quantifiable reliability. The SF will generally have some basis in testing, analysis, and/or experience. The goal of this is to capture “unknown-unknowns” in a conservative manner to minimize failures. However, the amount of conservatism is unknown. Furthermore, if a variable is not correctly considered, the approach may not even be conservative. With a statistical treatment, probabilistic data outside of the database can be accommodated. While the probability of failure for such data may be low, it still exists, as seen by premature failures associated with manufacturing defects. Some similar prior work on wind turbine blade probabilistic analysis has been performed by Bacharoudis and Philippidis (2013). However, defects were not included. With a probabilistic approach, overly conservative SF may be decreased, resulting in more reliable blades, at a lower cost (more optimal designs). This would be a new paradigm in the development of certification of wind turbine blades.
This approach has the additional advantage that the reliability can be quantified, as opposed to simply assuming the safety factor will accommodate all unknowns. While it is difficult to make a one-to-one comparison between this standard analysis technique and the proposed probabilistic approach, important comparisons illustrate the advantage of this method of analysis. As intended by the BRC, probabilistic models were developed and analyzed to help ensure adequate wind blade design life.
2.1 Background theory
Currently, the standard wind blade design and certification process generically define only one reliability target: a 20-year lifetime based on deterministic estimations of fatigue-life. However, variations in the structural behavior of composites cannot adequately be characterized by traditional deterministic methods that utilize safety factors to account for uncertain structural responses. Moreover, lightweight composite materials are known to be sensitive to fatigue, defects, and damage. Therefore, a methodology focused on reliability targets, which incorporates probabilistic modeling, is essential to accurately determine the structural reliability of a composite structure. Typically, these methods are used with limit state equations in the design process to describe the reliability or probability of failure in a wide variety of a systems (Rackwitz and Flessler, 1978; Ditlevsen and Madsen, 1996; Mahadevan and Haldar, 2000; Kim et al., 2012) such as offshore structures (Kolios and Brennan, 2009). Since a wind turbine blade is a complicated composite structure where uncertainty exists at many levels, each uncertainty variable (e.g., E, G, ν, flaw magnitude, and location) can be prescribed a distribution that describes the frequency of occurrence for values of that parameter. These distributions may then be used in the limit state equation to address the total uncertainty or probably of failure in the system. Reliability targets can then be developed to better address the design of a wind blade in the context of acceptable numerical outputs. While these procedures generally derive from civil or aerospace engineering, wind turbine blades are generally not considered to be a risk to human lives. Therefore, reliability targets such as probability of failure and mean time between repairs and failures may have acceptably higher values and consider economic attributes such as primary manufacturing costs, uptime, cost of downtime and cost of repair. In doing so, a manufacturer may set acceptable levels which reduces the overall cost of the bade construction in light of the cost to repair or replace and design for failure allowable failure rates which have an overall impact of reducing the cost of energy.
2.2 Model overview
Previous research has shown the utility of quantifying the influence of defects in composite laminates (Riddle et al., 2013; Dowling, 2012; Samborsky et al., 2012; Nijssen, 2011; Lin and Styart, 2007). Furthermore, a probabilistic design approach may be implemented, but has not been adopted as the common approach for wind turbine certification (FAA AC 25.571-1D, 2011). The present work builds upon the work by Nelson et al. (2017), where defect types are classified by known types. The influence of those defects in terms of durability and damage tolerance are determined on a probabilistic basis. This is the basis of the high reliability of manned aircraft structures. Clearly, the wind turbine industry cannot afford to implement the rigor of FAA FAR 25.571, but elements can be captured to develop quality guidelines, to reduce scrap rate, and to better enable a successful life cycle for composite wind turbine blades. Bacharoudis and Philippidis (2013) presented a similar framework concerning the probabilistic reliability assessment wind turbine rotor blades in ultimate loading. However, the presence of defects was not considered, nor was the failure criterion developed based on the fatigue-life of composite material subjected to variable loads. Alternatively, other work has focused on treating the wind loading as variable in the assessment of fatigue-life (Hu et al., 2016) and the effect uncertainties in constituent properties have on the stiffness properties of a wind blade (Mustafa et al., 2015).
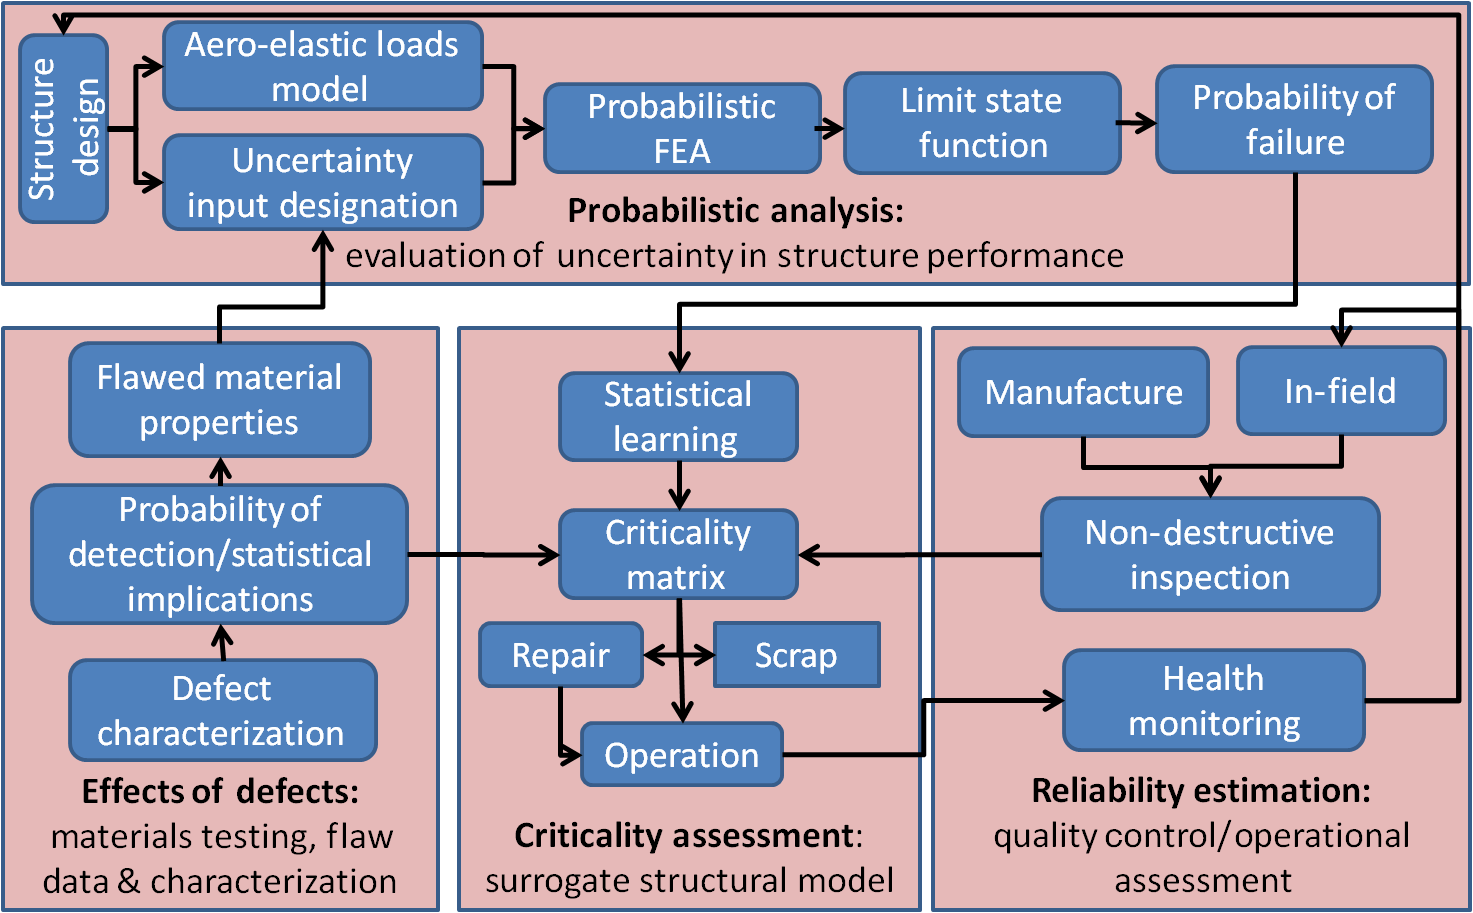
As noted above, the overall effort can be divided into two major directives: (1) acquisition of relevant defect statistics and defect-laden lamina response, (2) development of a probabilistic model to assess the global structural response, probability of failure, and estimation of time to failure for wind blades with flaws. Both directives are addressed within the context of the framework proposed called the probabilistic reliability protocol (PReP). A conceptual flow diagram showing the interconnectedness of each element of PReP is shown in Fig. 2. The PReP algorithm combines defect characterization and probabilistic structural reliability analysis with field and manufacturing data in an iterative feedback loop. A comprehensive reliability program aimed at assessing as-built structures can be divided into four interrelated components:
- a.
effects of defects: this involves the identification, characterization and analysis of defects. Develops characteristic parameters, material properties, and damage models.
- b.
probabilistic analysis: this involves a stochastic approach that considers multi-scale mechanical property variability, damage/defect detection, residual strength analysis, global, and macro-structural response.
- c.
criticality assessment (CA): this has been developed as a surrogate model for the stochastic analysis. It is a time-efficient metric for use by operators, manufactures and repair technicians to evaluate the risk of operating a structure with known flaws and/or damage.
- d.
reliability estimation and evaluation: this is the use of the CA to assess structures on the manufactures floor and in the field. Results from inspections as to the accuracy of the models and the implications to blade reliability are then fed back into the design and evaluation procedures.
Each one of the components are complicated and require independent steps which coalesce into the larger framework. However, they may also be utilized independently. The effects of defects component was the target topic of the companion paper (Nelson et al., 2017). This paper will focus on describing the elements of the probabilistic analysis component as an independent formulation.
The general approach, which incorporates a finite element simulation into a probabilistic reliability evaluation, adheres to the following steps:
-
build a parametrically defined blade model
-
define random variables (RV) and their distributions
-
define outputs variables of interest
-
define the load scheme
-
perform simulations
-
extract relevant probabilistic output response data
-
input data into reliability analysis.
This methodology may be utilized for any application. However, the specifics may vary according to the structure and objectives of the analysis. Table 1 lists the steps necessary to perform the analysis outlined in PReP for a wind blade application. In this table, a title for each step and task are given, as well as a short description of the task. Figure 3 illustrates the flow of information and interconnections of the various analysis components. Several of the steps identified in the previous table are notated by the corresponding step number on the figure (Riddle et al., 2013).
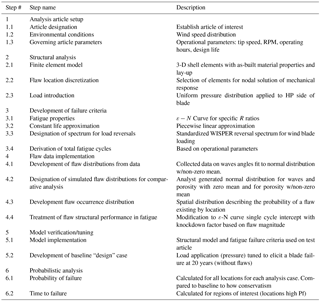
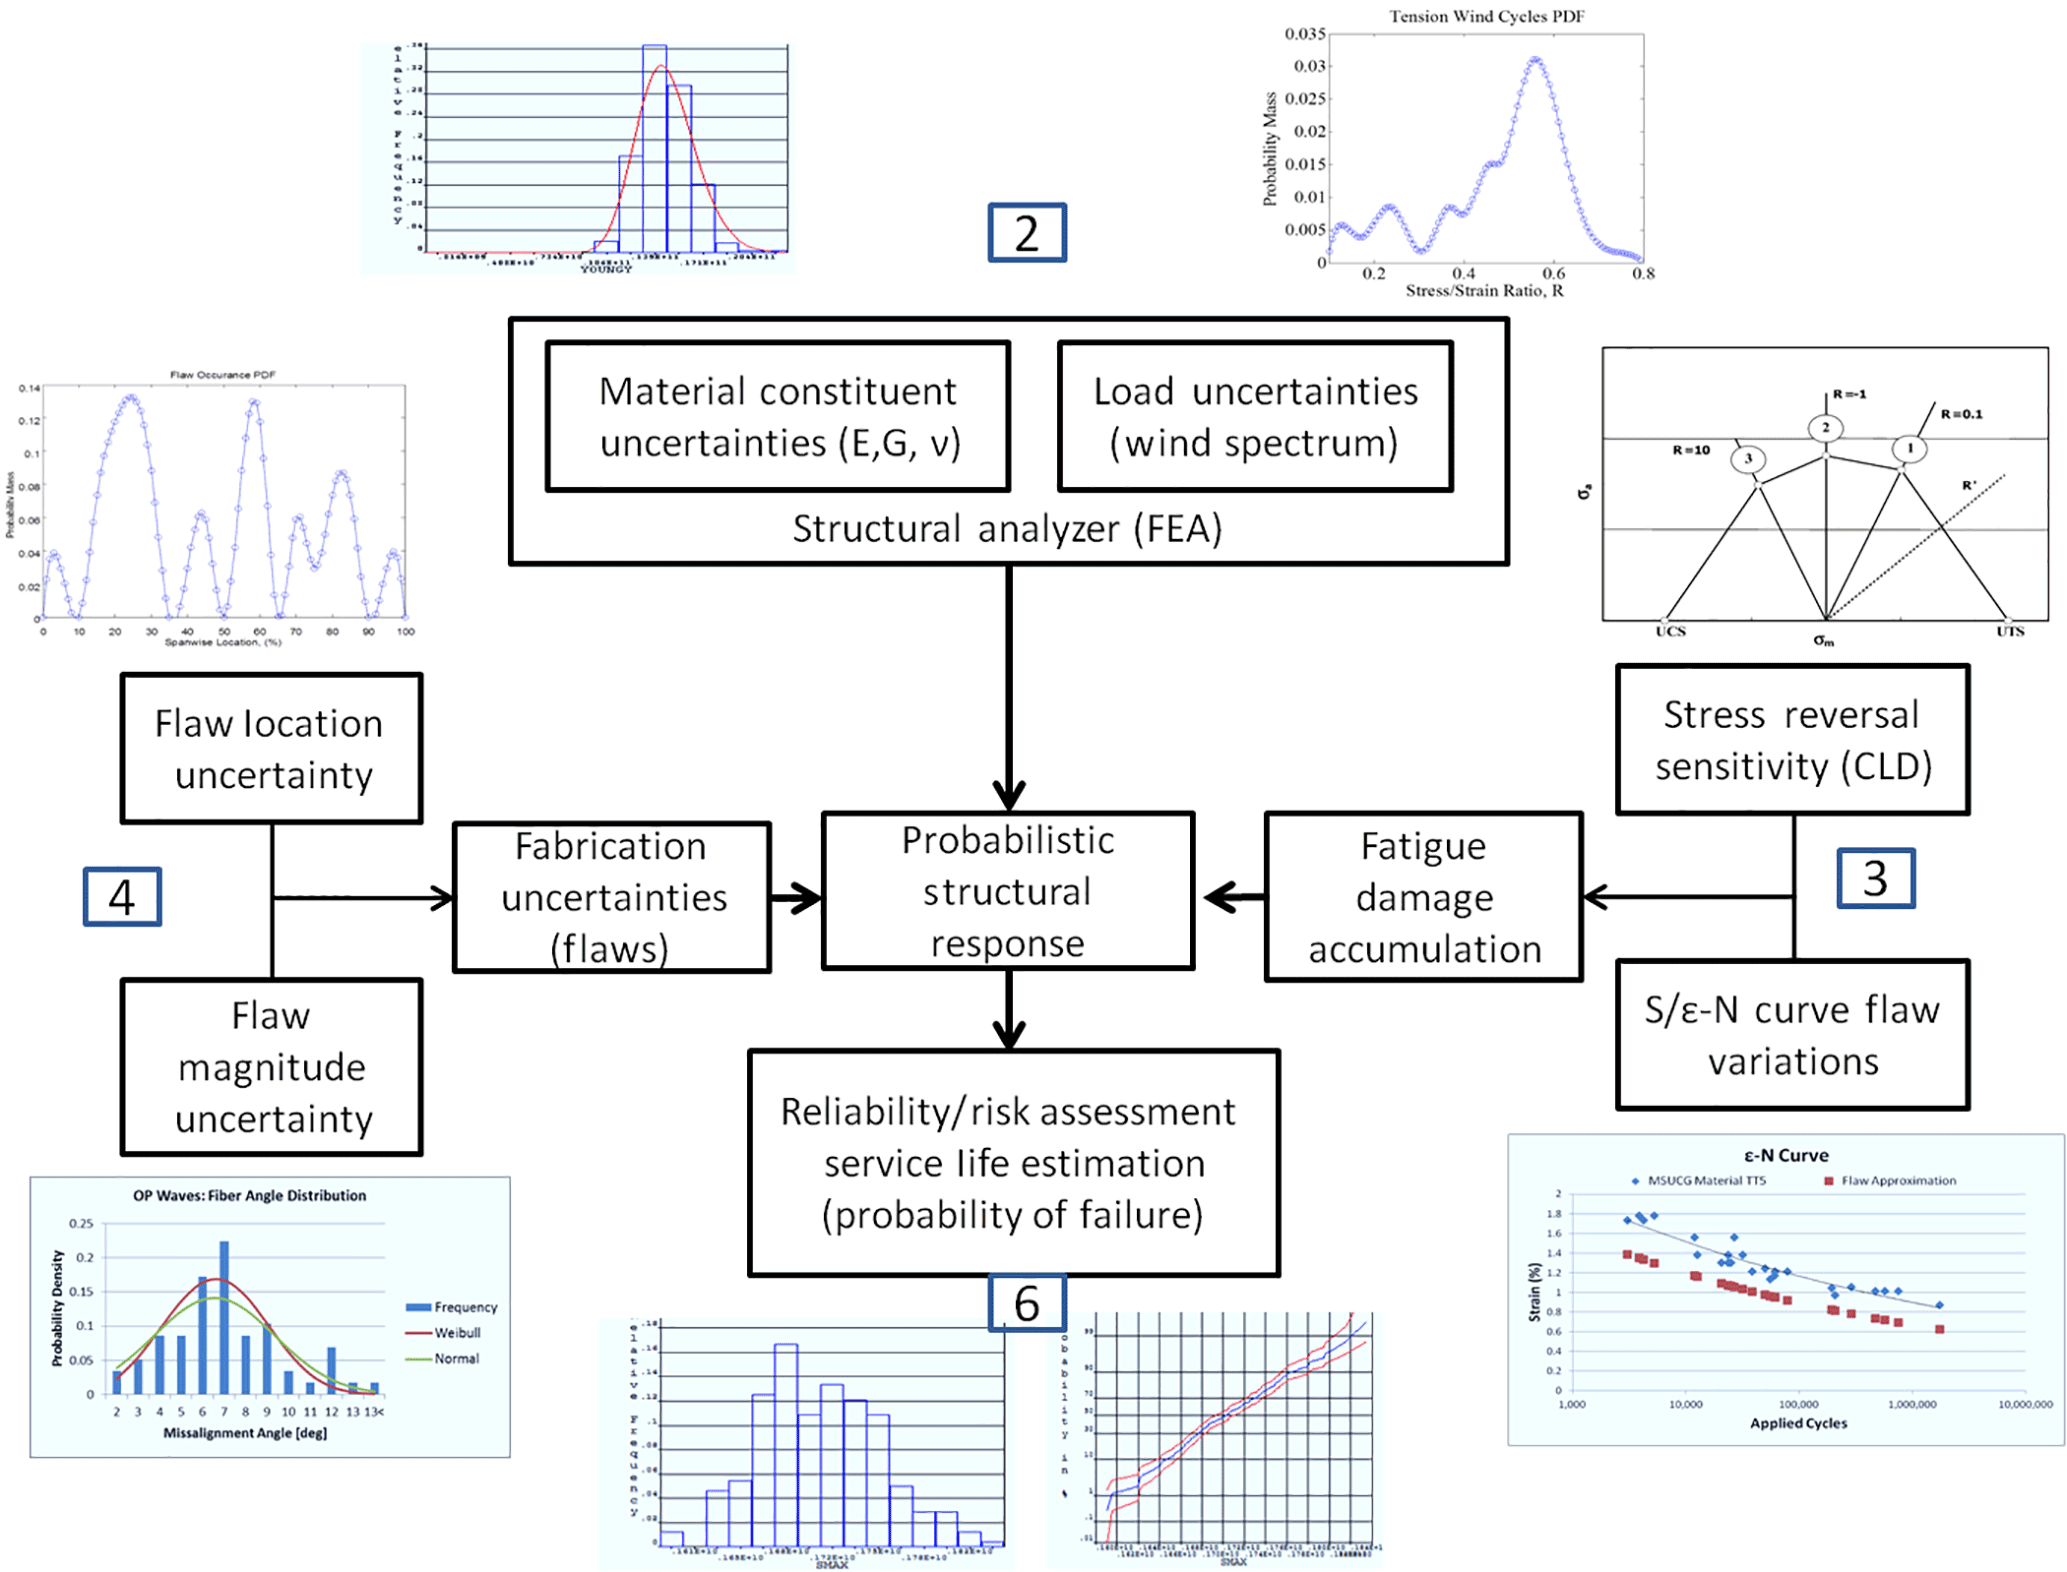
Figure 3FEA and risk analysis overview with steps 2, 3, 4, and 6 corresponding to Table 1 identified.
2.3 Definition of a performance function
The overall structural system is a function of a combined cumulative distribution function (CDF), F. For this case, a multivariate probability density function (PDF) is formed as generalized by Eq. (1):
The PDF describes how the overall system reacts to the combination of relevant variables. The system reaction to any one variable can be found by taking the partial derivative of the joint CDF with respect to each of the variables as shown in Eq. (2):
The focus of reliability estimation is typically to describe probability of failure. However, the context of failure varies for each application. In a damage-tolerant design, one might be interested in the probability of failure between the current evaluation and the next inspection interval. This type of analysis has worked well for the aviation industry where an aircraft can be pulled into a hanger and inspected relatively easily. A wind turbine blade on the other hand will remain at 100 m where inspection procedures (and results) are limited. Therefore, the typical design approach is based on a safe life criterion. While an extreme event plays a role in the sudden onset of damage, failure modes are typically considered to be fatigue driven.
Wind is variable and thus the resulting bending moment and shear of a blade is variable. Application of an infinitely variable loading scenario to design and test is unreasonable. Therefore, rain-flow counting is typically used to convert a spectrum of wind speeds (realized structurally as moments) into a set of cycles. The fatigue-life can then be used in conjunction with the Palmgren-Miner rule for linear damage accumulation (Dowling, 2012):
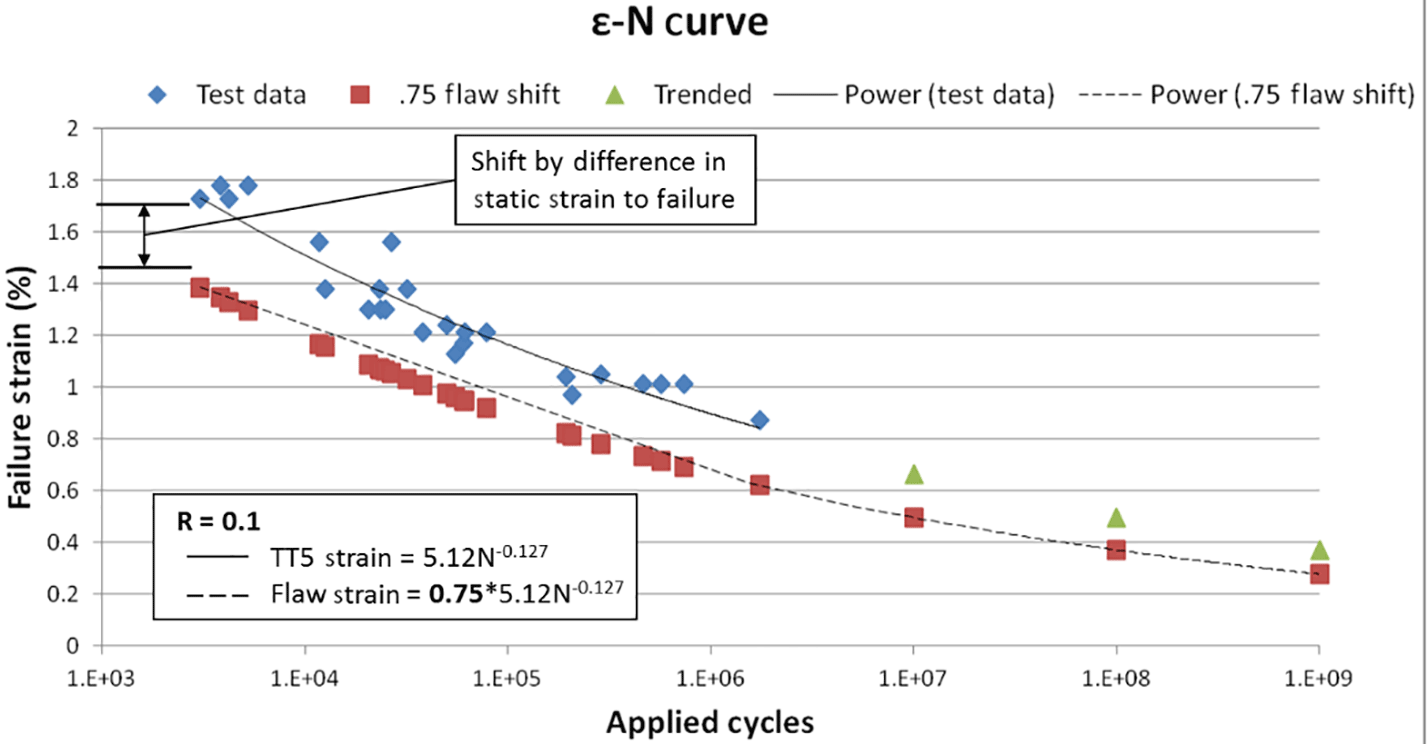
where D is the cumulative damage, n is the number of load cycles at the applied stress Si, and N is the number of cycles to failure at Si. Fatigue failure is typically defined as occurring when D exceeds a value of 1. A commonly used model for the fatigue-life of composites is the power law as described in Eq. (4) and modified equation for flaw fatigue-life is presented in Eq. (5) (Samborsky, 2012; Nijssen, 2011):
where S is the maximum applied stress (or strain), N is the number of fatigue cycles, A is the power lower fit coefficient (often referred to as the single cycle intercept), b is the fit parameter for the power law slope, and K is the newly appointed flaw knockdown factor.
Fatigue data of composites containing flaws found in wind turbine blades are not readily available. However, previous studies on damaged composites have shown that the fatigue-life slope remains largely unchanged with damage (Lin and Styuart, 2007). Therefore, an idealized approach has been taken to adjust existing material data S−N (or ε−N) curves by a shift in the static failure values (knockdown factor) applied to the single cycle intercept A in Eq. (5). Flaw knockdown factors, derived from empirical testing (Nelson et al., 2017), were utilized for this analysis is a scalar quantity used to reduce a material property as a function of the defect characteristic parameter. Presented in Fig. 4 is an example of the correlation between knockdown factor and composite mechanical response. An illustration of Eq. (5) for a flaw that resulted in a 25 % reduced static strain to failure is shown in Fig. 5.
The natural extension to this discussion is then to translate a design life of years into cycles. In doing so, one can construct the compact limit state function shown in Eq. (6):
wherein the resulting strain (εi) is a function of the uncertainty parameter vector X. This formulation is capable of modeling any fatigue loading spectrum and it has the flexibility to predict failure as a function of applied cycles. Traditional wind turbine design assumes standardized wind loading circannual distribution. Based on this estimation, the performance function can be evaluated two ways: assessing the probability of failure for a specific design life (e.g., 20 years), or assessing the time to failure based on an acceptable probability of failure value. Variations in the analysis to accommodate both predictions are minor and both approaches will be presented.
2.4 Construction of simulation
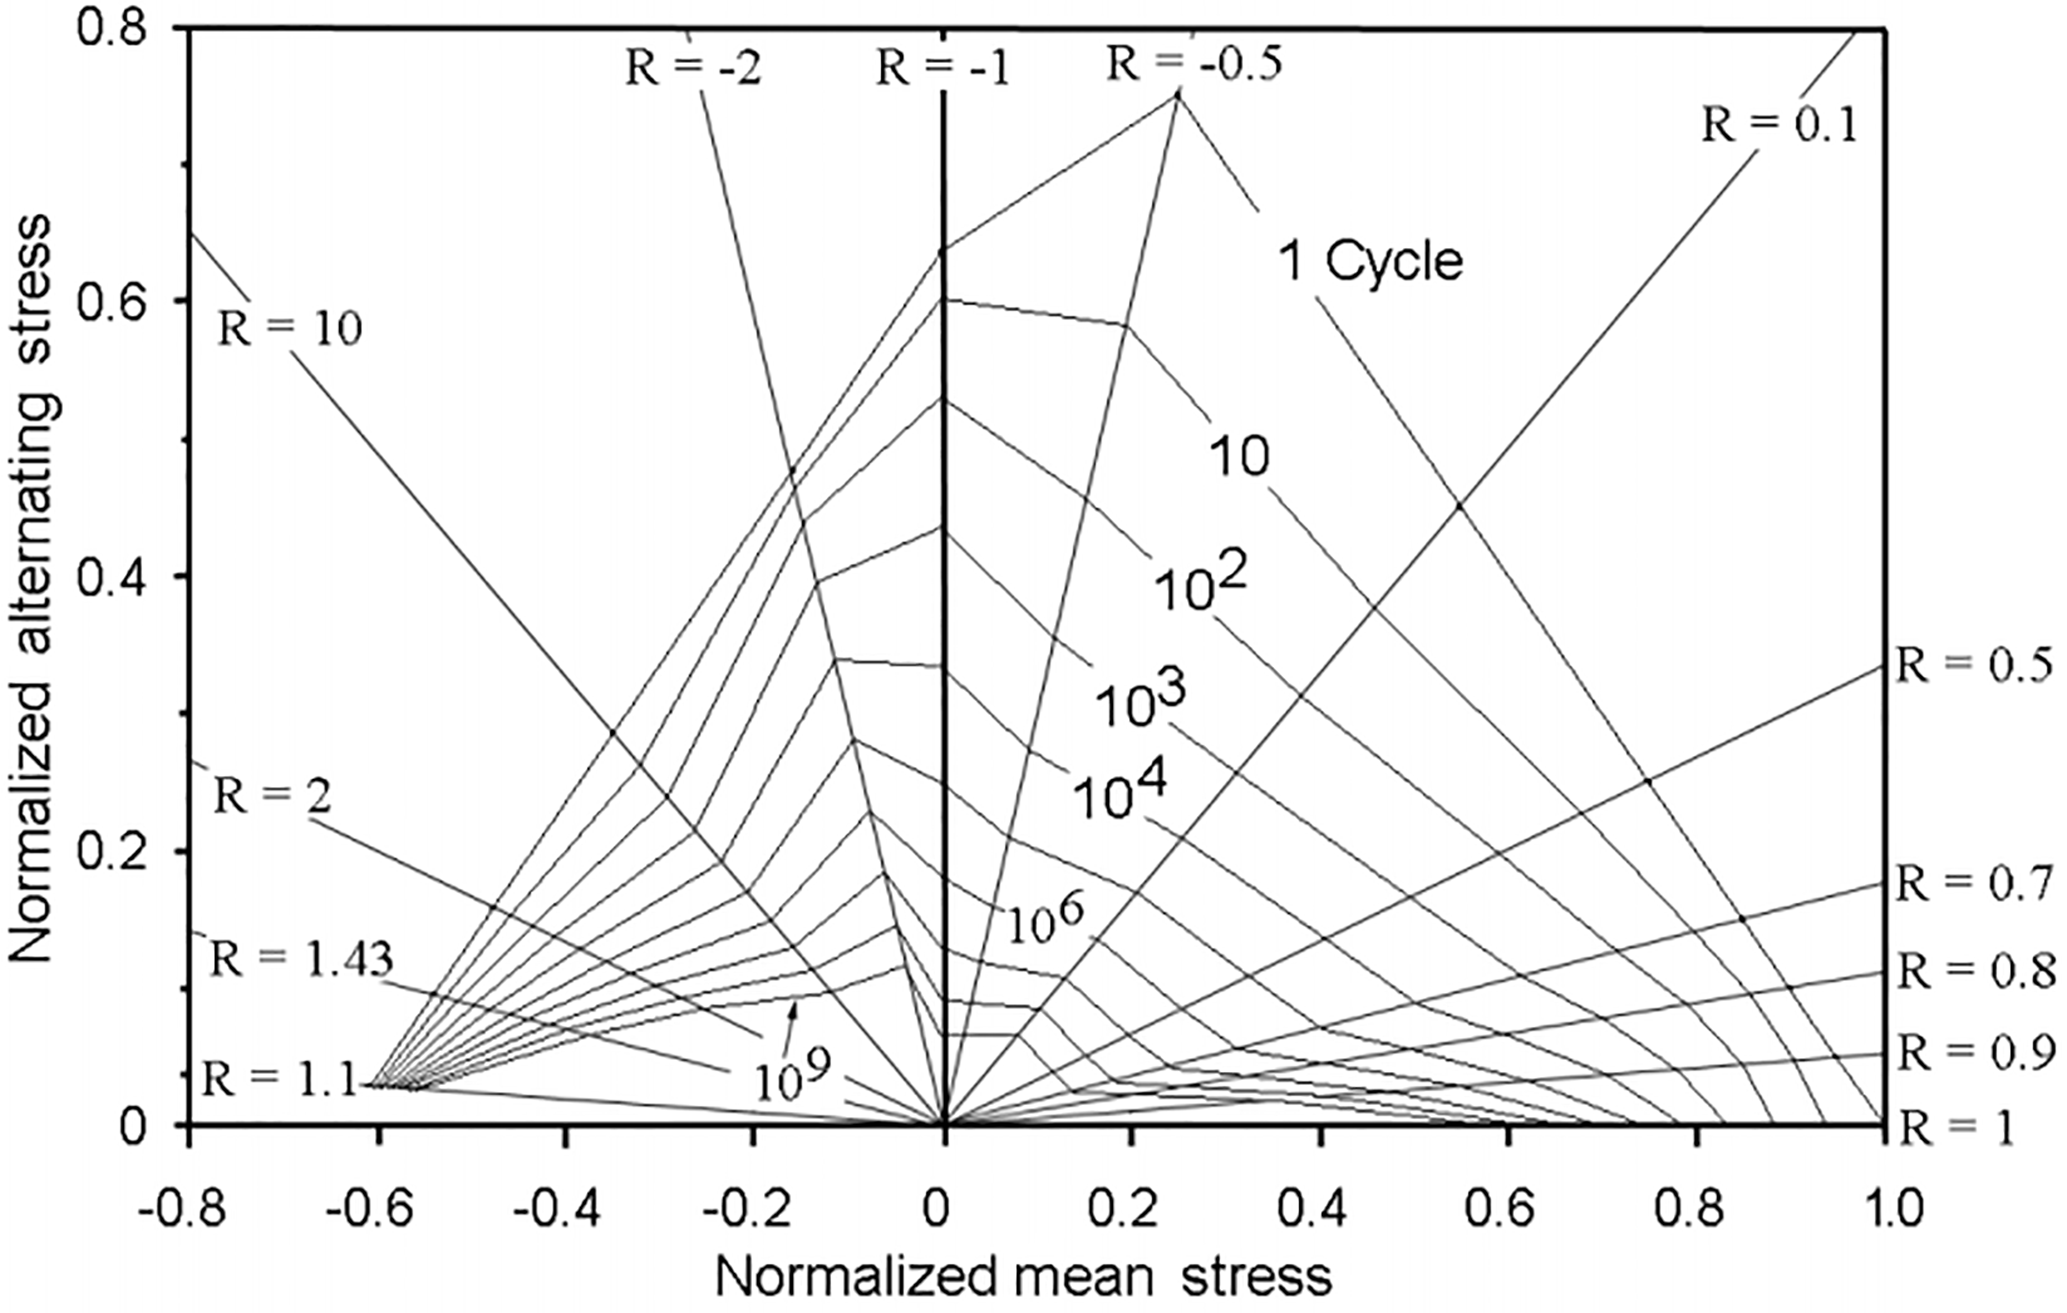
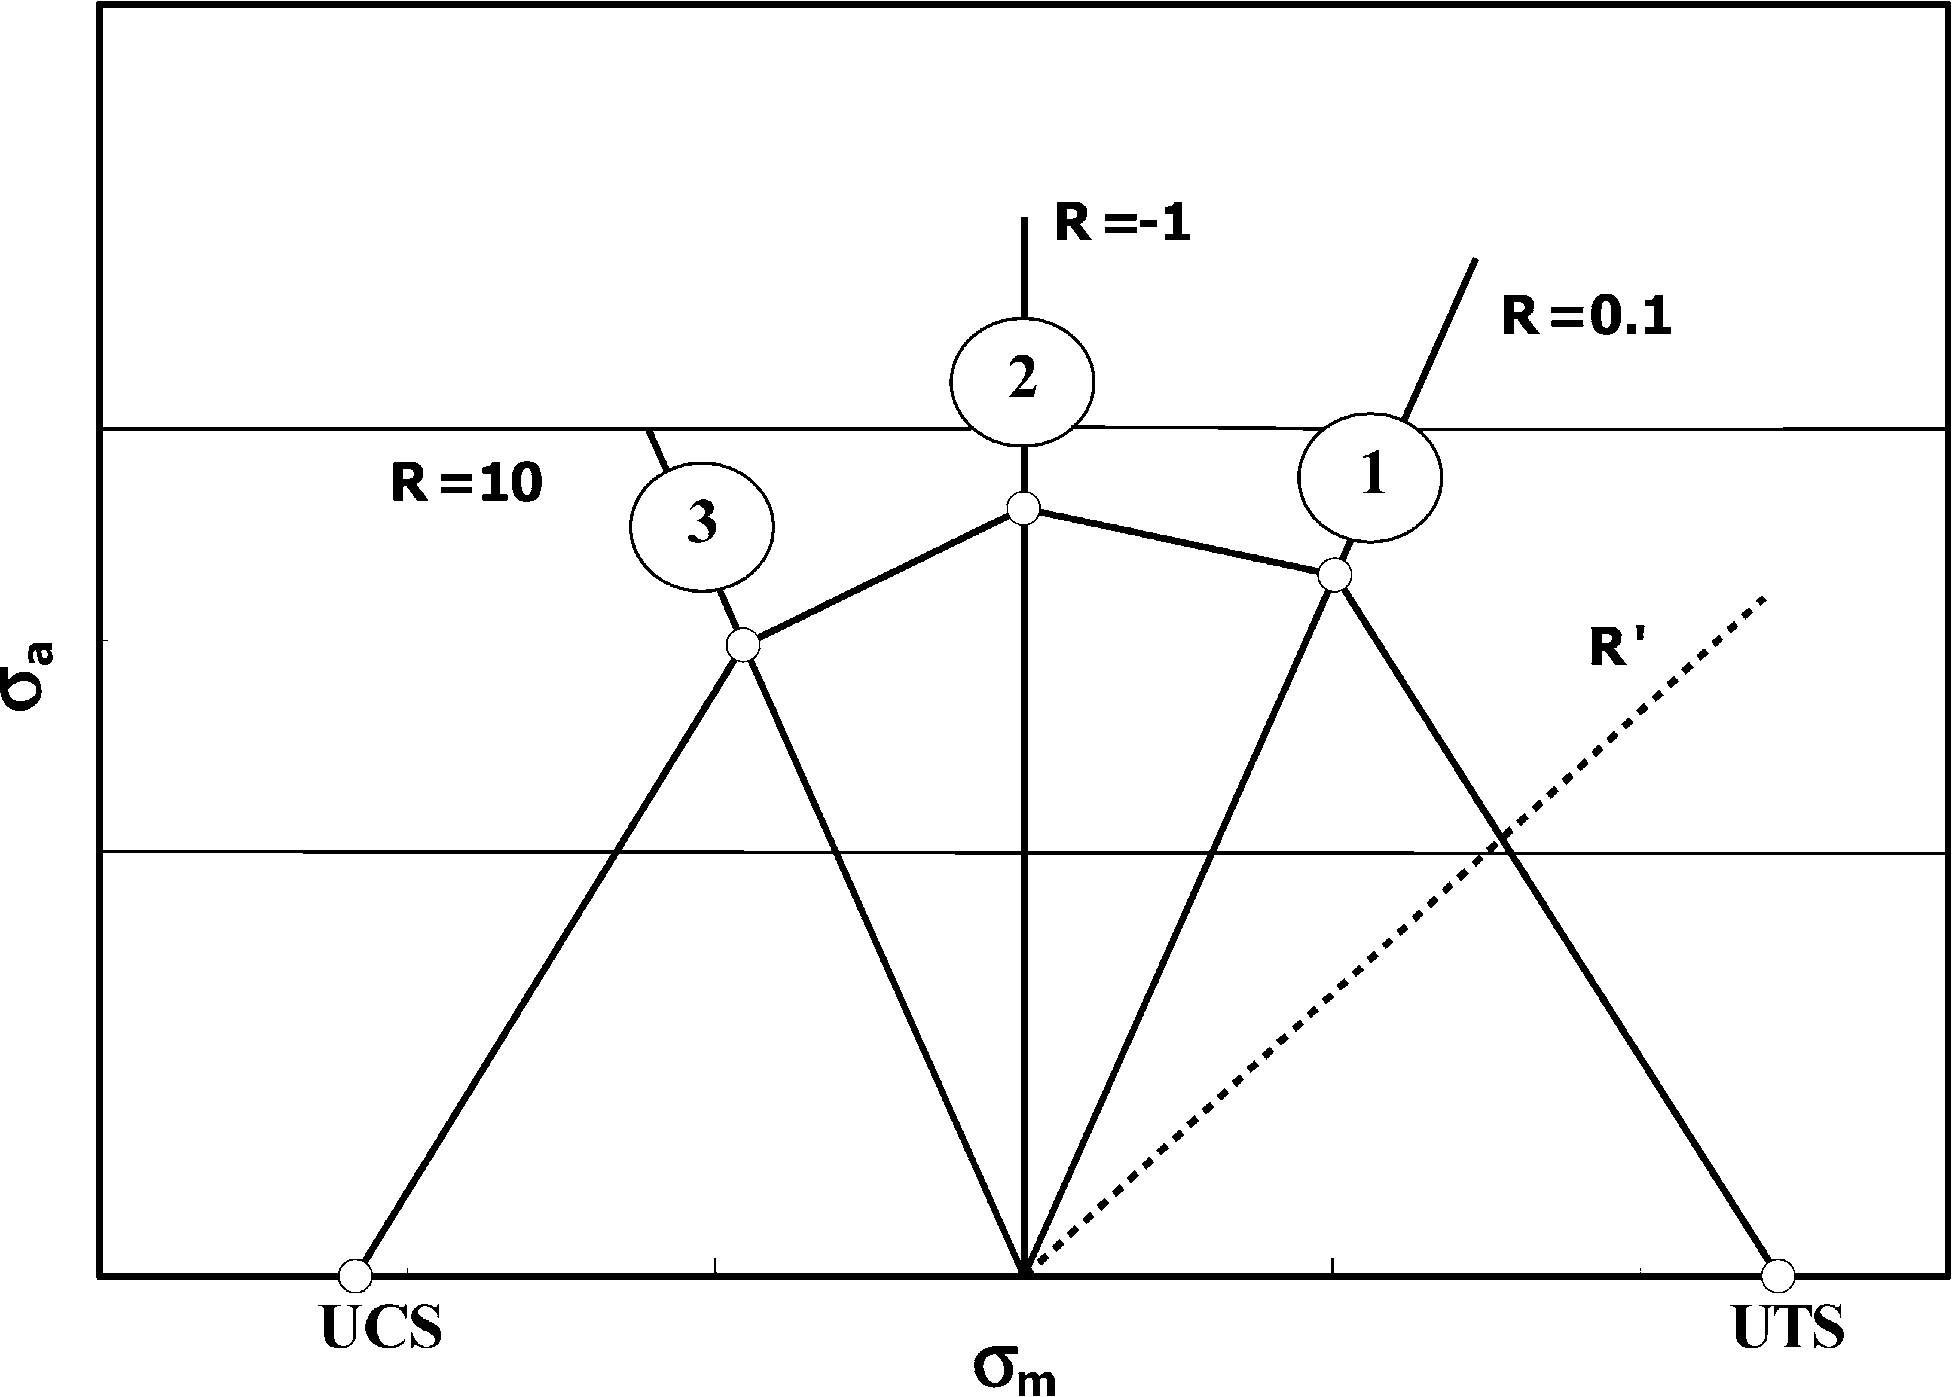
Previous work has shown that composites are sensitive to the variations in loading rehearsals (cyclic loading) and therefore, accurate modeling of fatigue damage accumulation requires usage of fatigue-life estimations for specific R ratios. Constant life diagrams (CLDs) are used for this purpose, such as the example shown in Fig. 6 (Mandell et al., 2010). The amount of data necessary to generate a CLD is often prohibited by cost and time constraints. Therefore, several predictive algorithms have been developed in lieu of copious amounts of testing. Fatigue data for the material systems used in the analysis presented were only available for R=10, R=0.1: ultimate tension strain (UTS) and ultimate compression strain (UCS). The piecewise linear methodology (Fig. 7) has shown good accuracy in predicting fatigue-life with limited amount of test data. Therefore, it was used (Philippidis and Vassilopoulos, 2004). This method requires a limited amount of test data and performs linear interpolation between the known data points.
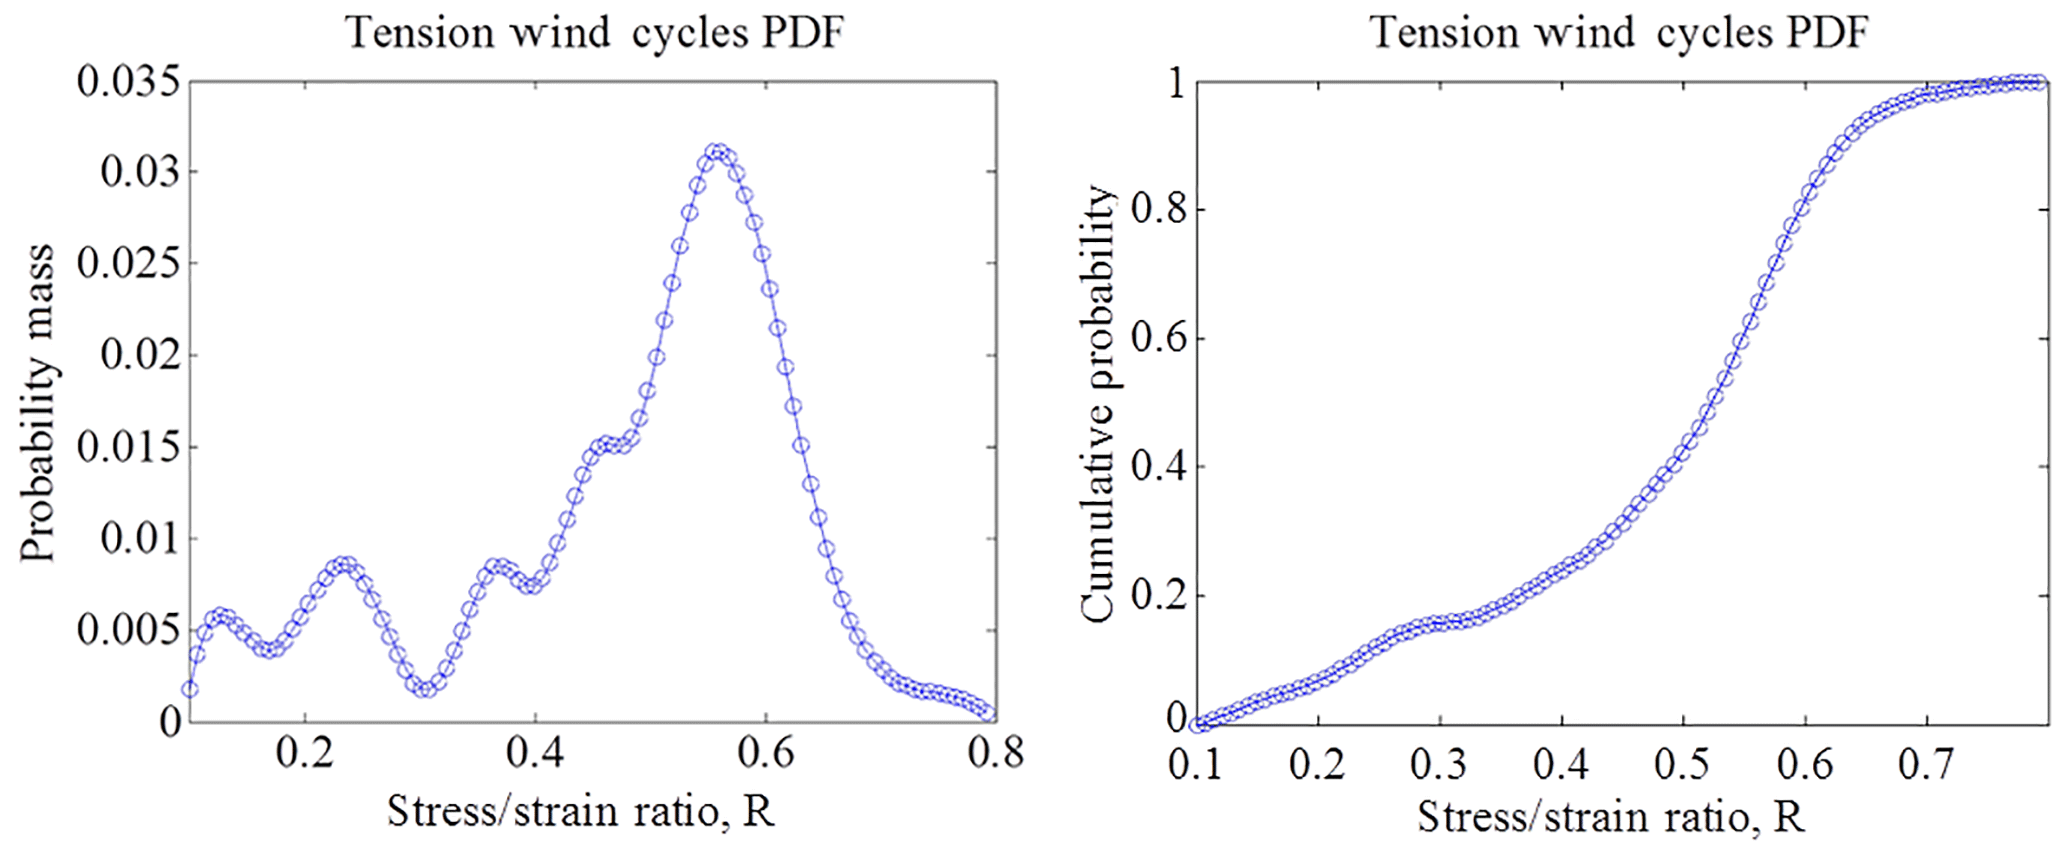
The wind loading spectrum utilized for this analysis was derived from the well-known WISPER load reversal probability distributions (Tenhave, 1992). Two probability mass functions (PMFs) were developed from the WISPER data to assess the high and low-pressure sides of the blades independently. The high-pressure side was assumed to always be in tension; thus, the PMF R-values varied from 0.1 to 0.8. Conversely, the low-pressure side was assumed to always be in compression; thus, R values varied from 1.25 to 10. Based on the WISPER data and these modifications, probability values were generated for 100 discrete load reversal bins. The probability mass distribution and complementary cumulative distribution for the high-pressure side are displayed in Fig. 8. Typical computational fluid dynamics and aeroelastic simulations are used to transform these wind speeds into corresponding pressure distributions on the blade surface for use in the structural analysis.
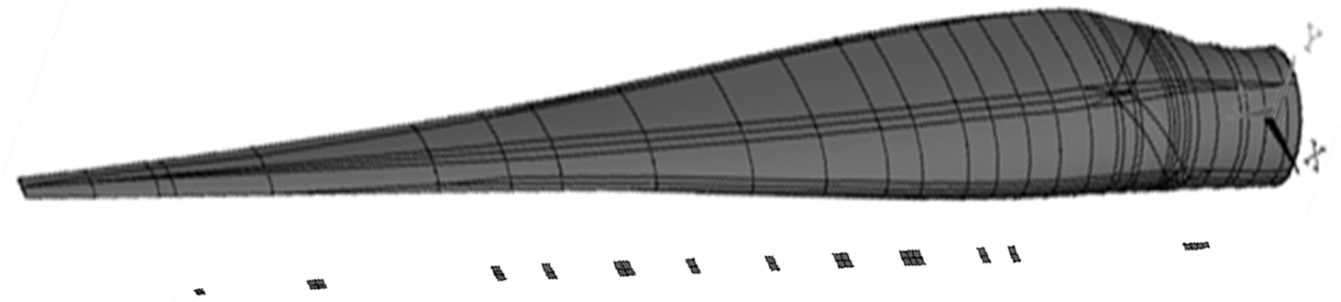
Wind turbine blades are complex composite structures and one cannot properly assess the integrity of any portion without considering the global response and load share tendencies. It is well known that 2-D shell elements used in 3-D finite element models are required to capture information such as three-dimension distortions, stress concentrations, and buckling strengths. Other methods such as beam property extraction and one-dimensional classical beam section analysis are widely used for preliminary calculations (Veers et al., 1993). These techniques have been used by other investigators for probabilistic analysis of wind turbines (Veers et al., 2003; Lekou and Philippidis, 2009). A full-scale blade model (Fig. 9) was used in this analysis. Prior work (Resor and Paquette, 2012) validated the model (or mesh) generating engine NuMAD by for use in ANSYS. Moreover, on-scale testing was performed on a wind blade as part of this work, wherein strain field data were collected unload which verified the FEA model output. Most of the uncertainty parameter (E, G, ν) variations have been implemented as system wide global properties. The occurrence of flaws has been captured by analyzing and modifying the material properties for a local region of the mesh.
Flaw locations and magnitude parameters were treated as stochastic variables. First, the probability of a flaw occurring in a specific location was described by a novel spline fit (Fig. 10), designating a probability mass function as a function of blade location. One novelty of this approach is the capacity for updating procedures that do not rely on the use of traditional, complicated inference techniques. A user performing inspections on the composite structure, such as a quality control technician, may record the frequency and location of observed flaws. These points can then be treated as delta functions in the subsequent piecewise polynomial fitting procedure. Frequencies can easily be updated as more events are recorded, enabling the regeneration of distributions used in a statistical analysis. These data are hard to come by; therefore, a fictitious set of frequencies was selected. The chosen frequencies and corresponding PMF are displayed Fig. 11 and were used in the stochastic analysis to ascertain the probability of a flaw occurring in a specific location. When the sampling algorithm identifies the existence of a flaw, a second distribution describes the probability of the flaw's characteristic parameter magnitude. Figure 12 displays the treatment of an example flaw magnitude as an uncertainty parameter used in this analysis. As noted below, it was found that off-axis fiber angles of waves collected in a survey of wind turbine blades follow typical distributions such as normal and Weibull.
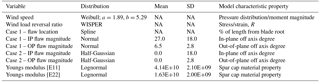
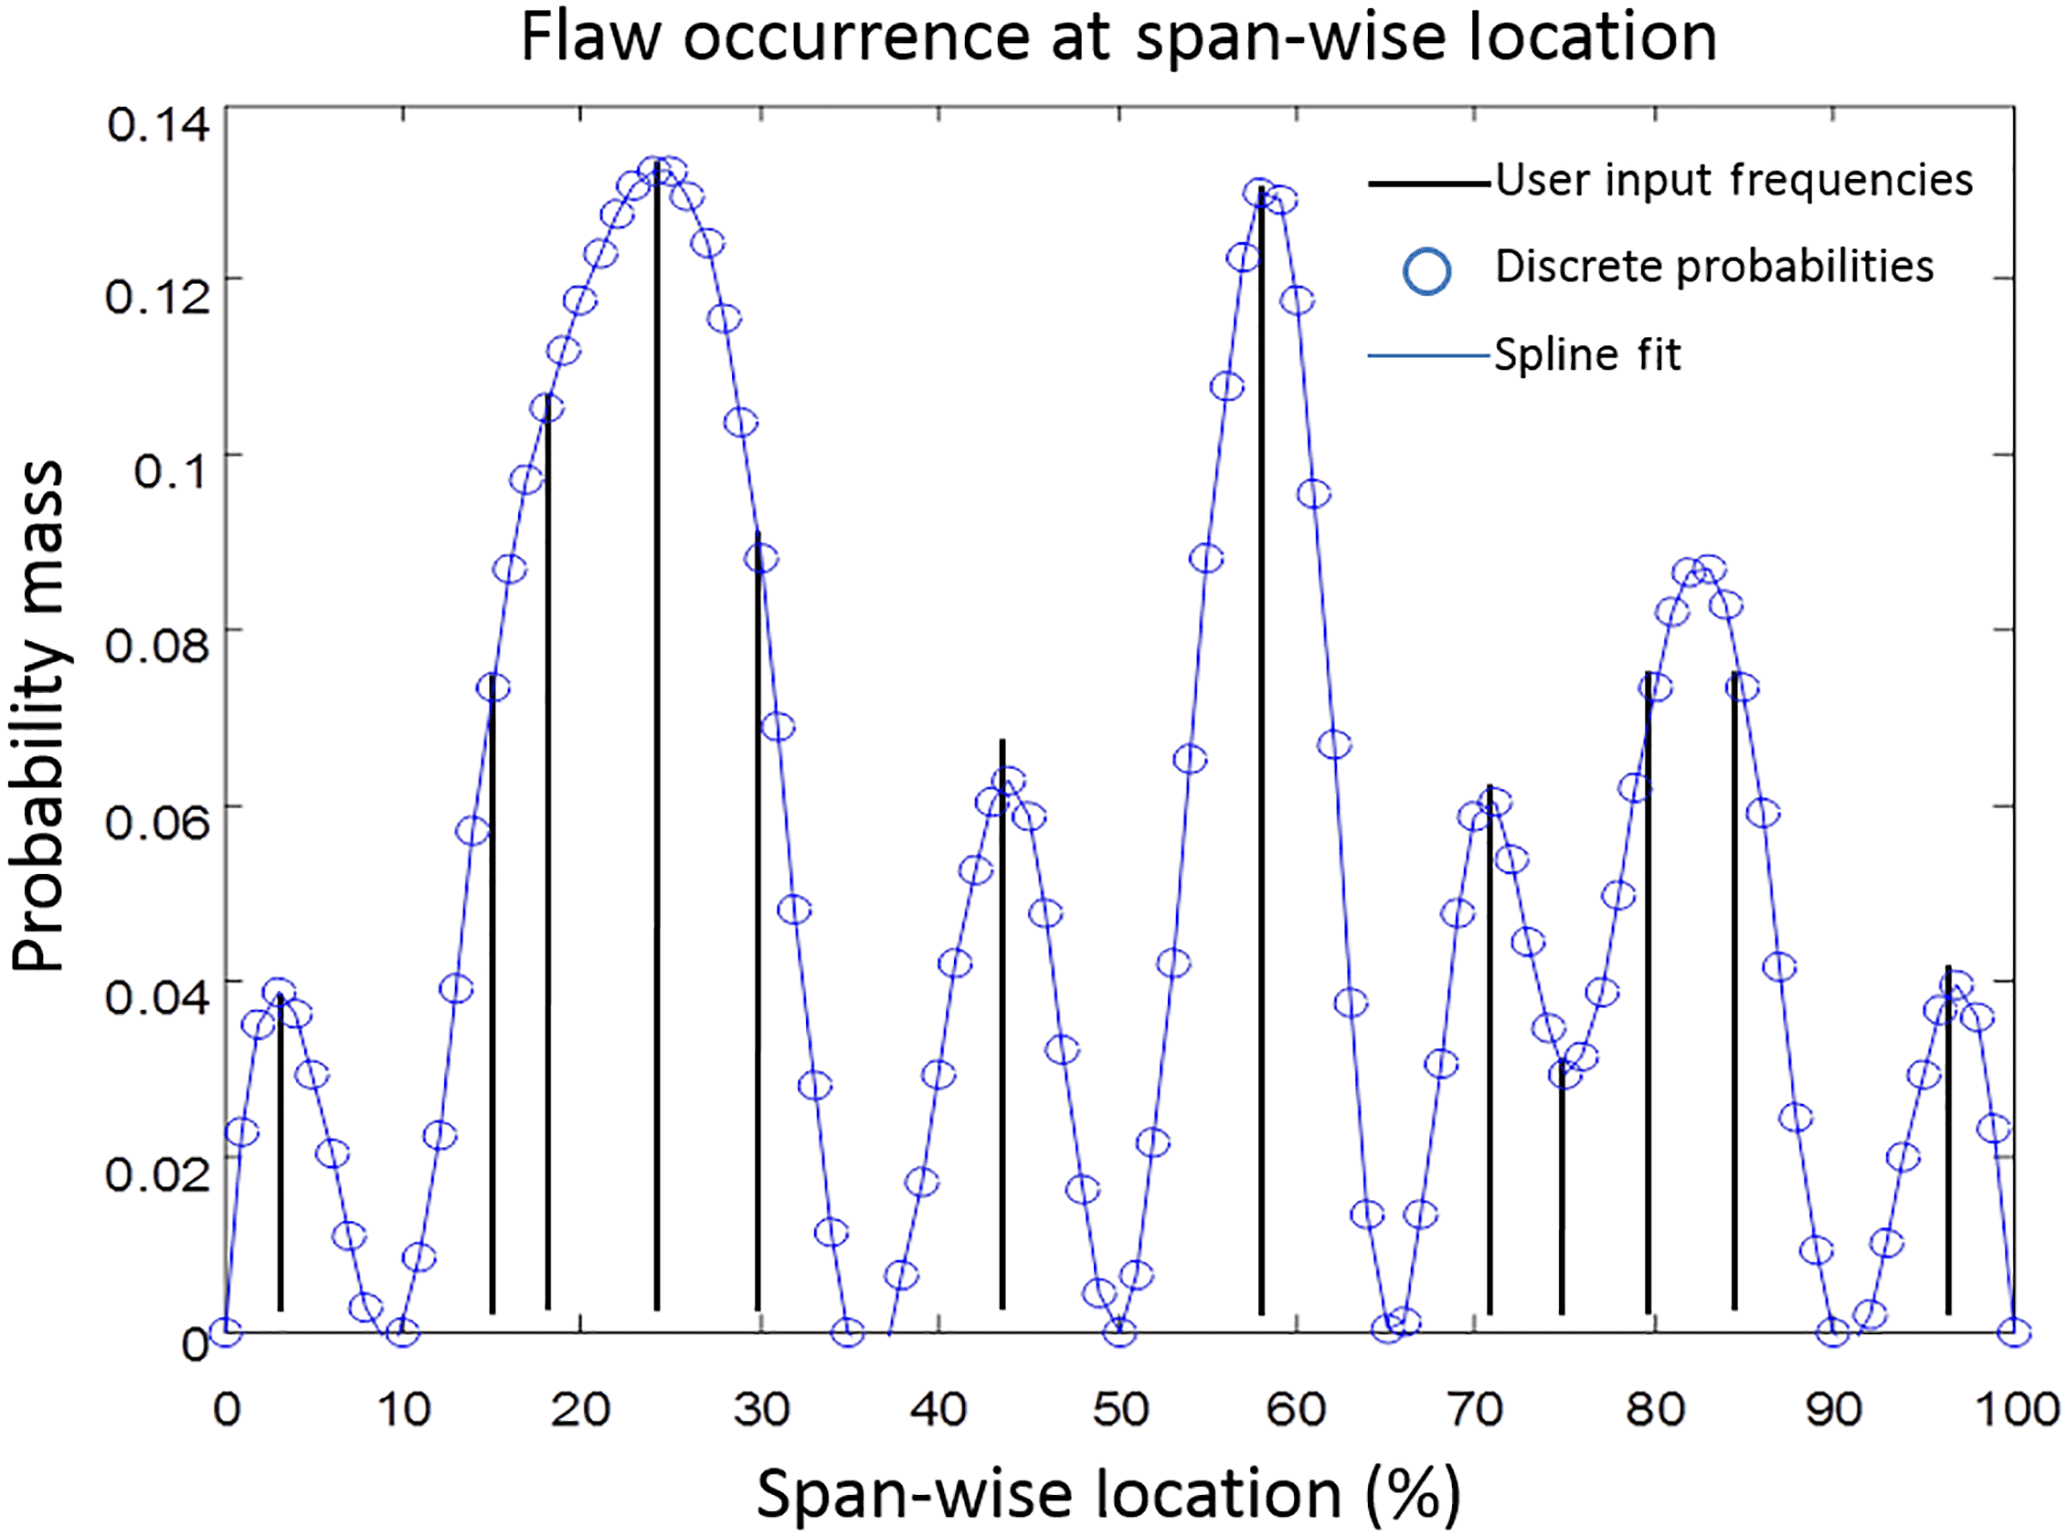
Figure 10Probability of flaw mass, or occurrence, spatially distributed along span-wise length.
A 9 m wind blade designed by Sandia National Laboratory was used as the article of investigation in this analysis. A 3-D finite element analysis (FEA) model using shell elements was generated to match the actual blade laminate and planform schedule. A benchmark standard International Electrotechnical Commission (IEC) approach to fatigue evaluation was used to develop the baseline analysis, Case 0, to which two probabilistic analyses using the stochastic variables presented in Table 2 were then compared. For all analyses the blade spar was discretized into 100 locations. The maximum nodal strain response in the spar laminate 1 direction (span wise – material tension and/or compression) was output from the FEA model for use in the post-processing script. A combined fatigue and probabilistic analysis was then performed on each location using Monte Carlo simulation. The methodology for each case is described below with discussion of the results following.
3.1 Case 0: baseline (design)
Information on the design of the blade article was not readily available. Therefore, the blade was reverse engineered to develop a load scenario which would cause a fatigue failure in 20 years. The designation of an applied pressure load was considered arbitrary in that it need only provide a referencing point to objectively evaluate analysis techniques. For this baseline case, the IEC safety factor fatigue formulation was used. IEC recommends the usage of traditional linear damage accumulation employing the Palmgren–Miner rule. The IEC fatigue analysis process can be paraphrased as follows: “Fatigue damage shall consider effects of both cyclic range and mean strain, and all partial safety factors (load, material and consequences of failure) shall be applied to the cyclic strain (or stress) range for assessing the increment of damage associated with each fatigue cycle” (IEC 61400-1, 2005). Given the relevance to the entire study, the IEC's material safety factor (γm=1.3) was used with the available material properties test data; therefore it was the target of the probabilistic analysis.
3.2 Case 1: probability of occurrence
This analysis case utilized two probability distributions to describe defect uncertainty. The first distribution used in the analysis was probability of occurrence. This distribution describes the probability mass of a flaw existing in a blade using a spatial distribution. For this analysis, a 1-D cubic spline distribution was used to allow for flaws down the length of the spar cap. The spline formulation allows for high fidelity, continuous interpolation of probabilities between specific locations of known flaw frequencies. When the simulation predicted a flaw's existence, then a second distribution was used to describe the magnitude of the flaw based on the actual field data collected from utility-scale wind blades. An example of the distribution and sample set used in the analysis for IP waves is displayed in Fig. 12.

3.3 Case 2: half-Gaussian fiber wave magnitude
This analysis case utilizes only one probability distribution to describe defect uncertainty. The analysis assumes that there is a 100 % chance of a flaw occurring at every location in the blade (Fig. 13). The flaw occurrence magnitude is described by a one-sided probability distribution (Fig. 14). For this case, a flaw magnitude of zero would indicate that there is no flaw at that specific location.
Figure 13Probability mass of 100 % that a flaw is located at each blade location used in Case 2.
Figure 14Half-Gaussian distribution of sample set for IP fiber misalignment magnitudes used in Case 2.
Figure 15Probability of failure by location (a) and as a function of time for location 22 (b).
The assumption of a low probability of failure during a typical 20-year blade lifetime was used for this analysis since the probability of failure used for the IEC safety factors was not known. To validate the model, this assumption was used for the baseline Case 0 scenario, whereas Case 1 and 2 assumes failure within the blade lifetime due to manufacturing flaws not inherent in the certification process. For each case, the likelihood of reaching failure for a given safety factor is presented as failure probabilities which allows for easy comparison. In short, the absolute probability of failure could be tracked through the 20-year life cycle, if the design failure probability is known. As such, both the prescribed IEC and reduced material safety factors were used in the evaluation of both Case 1 and 2 allowing for direct comparison of the level of conservatism. Using Monte Carlo simulations and experimental strain responses, analysis samples and failure probabilities were generated.

For each location of the blade, the FEA simulation calculated strain. Considering the defects as random variables, the probability of failure (Pf) was then determined for each blade location along the length (Fig. 15a). It can be seen that the blade has a 100 % probability of failure at the point of 22 % along the length of the span. These results were then used to determine the critical point along the blade length by relating Pf to time in service, using a linear fatigue damage accumulation model at each location. Based on the number of cycles at the 22 % mark, it is indicated that failure will occur approximately 7 years into the life cycle, as seen in Fig. 15b,. It is important to note that is a combination of the worst scenarios with the inclusion of a typical material SF. Therefore, the probability of failure is artificially high as the load case in this analysis was chosen intentionally to yield a fatigue failure of the blade (using a safety factor of 1.3) in 20 years. Using this as the starting point, a stochastic analysis incorporating the effects of defects is performed in addition to using the safety factor and the results compared.
While this case indicates a significant chance of failure, the blade will likely be overdesigned if a SF is used in conjunction with a probabilistic simulation of defects to ensure a reasonable Pf. To quantify this implication, the same model was run with the safety factor reduced to 1.15 from 1.3. As seen in Fig. 16, while the locations of the critical points remain the same, none of these points have a 100 % Pf. As such, these results imply that additional structural reinforcements are not necessary, meaning weight and cost can be reduced. This approach has the added benefit of introducing some level of quantifiable reliability, as opposed to the “assumed to be small probability of failure” of the SF approach.
5.1 Case 2: half-Gaussian fiber wave magnitude results
As noted, the inputs were then modified using a half-Gaussian distribution (Fig. 14) with a 100 % probability of a flaw at every location. The case was run for both safety factors and the results are shown in Fig. 17. While it is evident in both cases that the Pf approaches 100 % failure probability, the reduction of the safety factor results in a reduced estimation that failure will occur which is consistent with the results of Case 1.
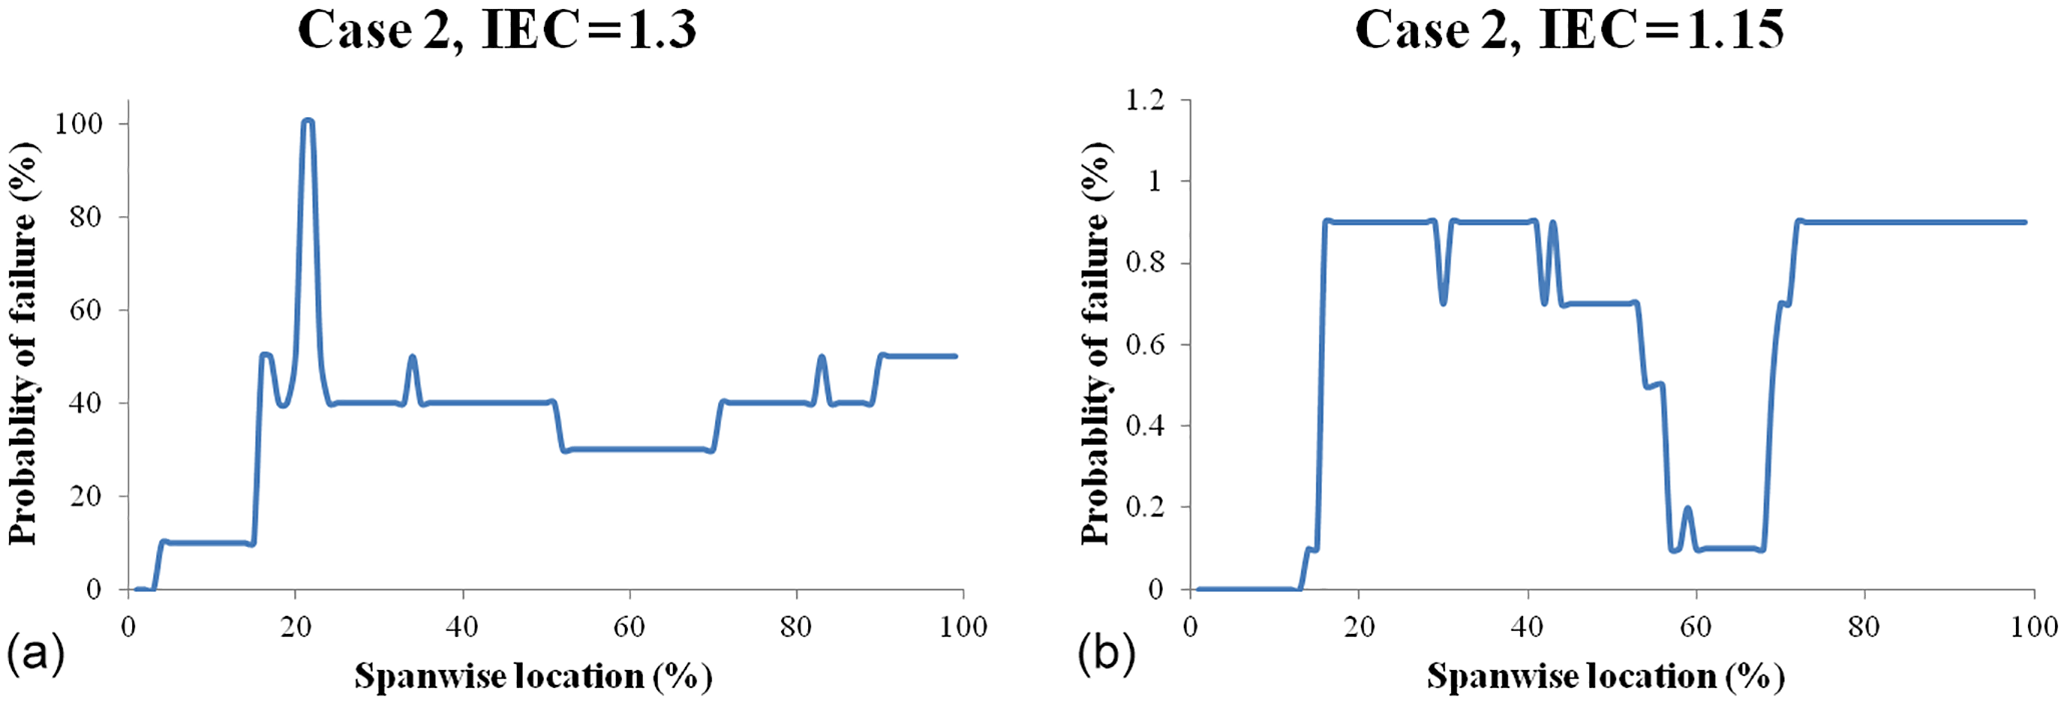
Figure 17Probability of failure by location for standard IEC safety factor (a) and reduced IEC safety factor (b).
5.2 Implications of probabilistic approach to reliability
As with any analytical method, detailed and accurate inputs are necessary to use this probabilistic analysis to address uncertainty of blades with manufacturing defects. When the two cases are compared, it is evident that distributions of flaw magnitude affect the results significantly, as seen when Figs. 15, 16, and 17 are compared. The differences are amplified further when the strength reduction is considered where a dramatic shift in laminate strength is noted, as seen in all four portions of Fig. 18. The variation between the two cases is significant and the impacts on the laminate are clear, when flaws are assumed to be occur at all locations as in Case 2 (Fig. 18c, d). While the likelihood of instances with strength reduction decreases in this case, the reduction of strength is likely to be greater, which aligns with previous testing of wavy laminates that indicated an exponential decrease in laminate strength (Riddle et al., 2012). While this trend is meaningful, it is imperative to recall that these distributions were generated during this investigation and may not be indicative of the industry at large or of any one particular manufacturer's process or products. Therefore, it is also imperative that test data representative of the materials used in the design system be established.

Figure 18Strength reduction sample sets as a function of flaw magnitude distributions for the following: Case 1 in compression (a), Case 1 in tension (b), Case 2 in compression (c), and Case 2 in tension (d).
5.3 Model validation via experiments
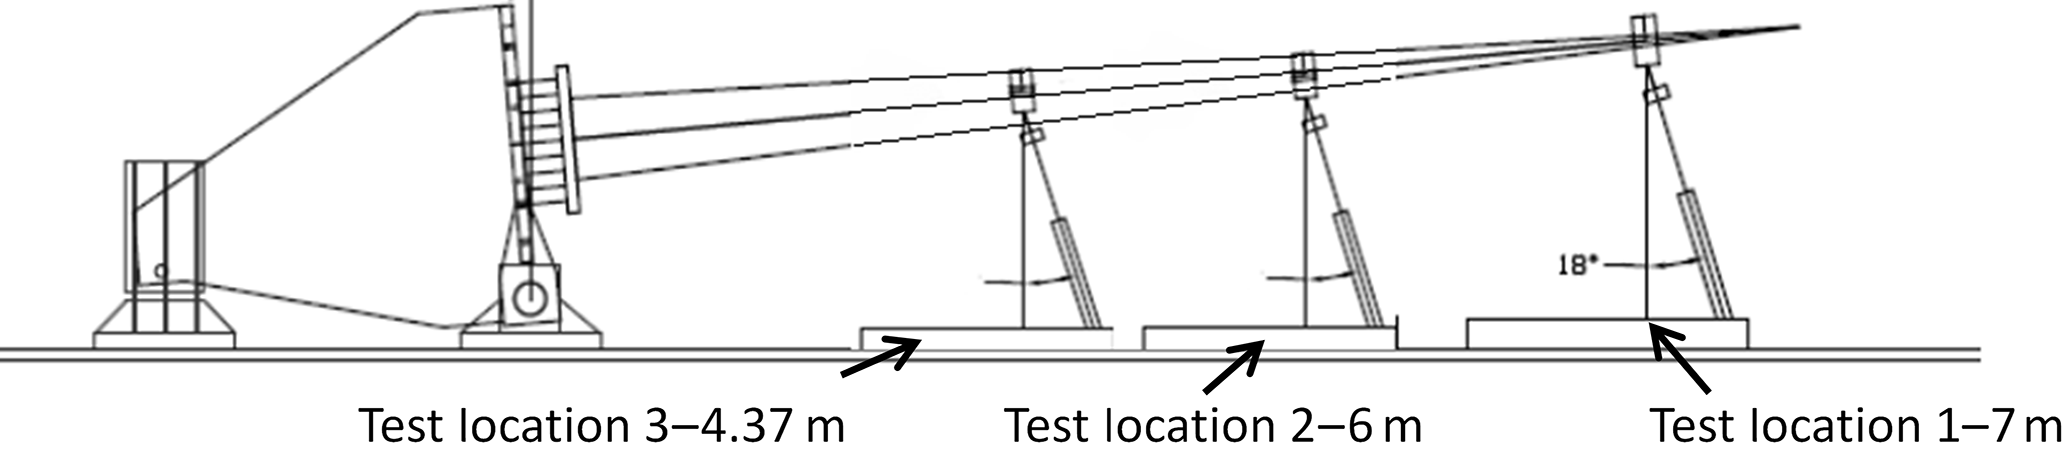
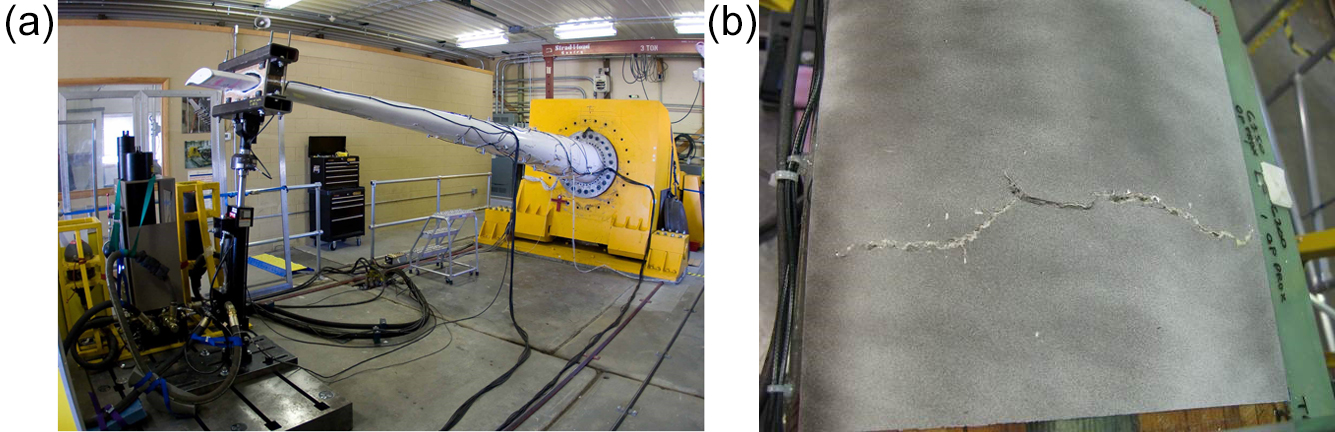
To validate these methods, the BRC supported testing of a two subscale version of a multi-megawatt wind turbine blade that was manufactured with intentional defects (Desmond et al., 2015). Both 8.325 m wind turbine blades, one with fiberglass spar and one with a carbon fiber spar, were manufactured according on the Sandia Blade System Design Study (BSDS). The blade was originally designed as mechanism to study large-scale commercial blade construction at a smaller and more manageable subscale size (Berry, 2008). Strain data during static loading were collected from all defects through the use of a digital image correlation system. The National Wind Technology Center facilities were used to actuate the blade in fatigue loading at three locations, allowing for multiple flaws to be assessed individually and with geometric considerations (Figs. 19, 20a). In parallel, known uncertainty values were used to run three Monte Carlo simulations allowing for direct comparison of the results. As seen in Fig. 20b, the failure occurred at an out-of-plane flaw, as was also predicted by the numerical simulation. Not only did this validate the methods described herein, but this blade scale testing provided insight into the scaling factors and indicated that a local failure constituted a global structural failure.
A hierarchical treatment for the probabilistic reliability of composite wind turbine blades has been developed and presented. The emphasis here is on composite materials variability and the effect of defects. However, the framework is applicable to any variability and is meant to reduce or eliminate safety factors if one knows probability distributions. This work postulates that one should quantify and assess manufacturing defects by their magnitude and criticality for durability and damage tolerance. The same can be said of other important probabilistic distributions affecting reliability, where SF is used in lieu of probabilistic calculations.
Two cases were developed to show the utility of the technique. The first case included a probability of occurrence plus a probability for amplitude. The probability of occurrence is a hypothetical distribution based on one manufacturer's anecdotal manufacturing data. (It is noted that each blade design will have a unique probability of flaw distribution based on the design details and manufacturing technique.) The defect size probability was from the work developed herein. This case indicates that the probability of failure is 1.0 if both a safety factor and probabilistic flaw data are used to predict reliability. However, it provides the basis for reducing a scalar safety factor for determining blade reliability and possibly, certification.
The second case was one where flaws are assumed to be everywhere in a structure, but with a probability distribution associated with the size of the defect. This probability distribution for size was based on studies of dissected blades from a variety of manufacturers. With this analysis, it was shown that the scalar material safety factor can also be reduced in this case with acceptable reliability. Case 2 may also be applicable to a damage tolerant design philosophy where periodic inspections are conducted and flaws above a certain size can be detected.
The two approaches detailed in this analysis, known defect distributions and blades assumed to have defects, but without any spatial statistical information (e.g., existing fleet) the impact of probabilistic analysis with respect to reducing conservative safety factors. Understanding these is critical in terms of reliability and is important if one wants to justify reducing SF. Both magnitude and distribution are important for a comprehensive probabilistic reliability analysis.
For demonstration of the framework for treating defects as uncertainty variables for blade analysis, 9 m blades were manufactured and tested with known defects at known locations. The ultimate failure occurred as predicted at a known defect location and the reliability predictions were conservative. That is, the structure went to higher cycles than predicted in the reliability framework.
The probability analysis needs to be incorporated into a comprehensive program, not just the assessment of a specific defect or probabilistic parameter. A holistic approach to reliability results in a stochastic reliability infrastructure. This aids in the design process as well, with the ability for continuous improvement throughout the product life cycle. As improvements are made, SF can be reduced with the associated impacts on cost. While a full damage tolerant design process is not practical from a cost basis, the approach presented herein has important elements. This includes an inspection program, damage growth laws, and residual strength with defects.
Finally, this work has implications for the certification of wind turbine blades. It provides a rational basis for reducing assumed scalar safety factors with quantifiable and acceptability reliability. This has the net result of mitigating conservative designs and ultimately the cost of energy from a given wind turbine.
Data may be found as reported to Sandia National Laboratories in Nelson et al. (2012a, b). In addition, data have also been added into the Blade Materials & Structures Testing Database compiled by the Composite Technologies Research Group at Montana State University; this database is updated and hosted by Sandia National, http://energy.sandia.gov/energy/renewable-energy/water-power/technology-development/advanced-materials/mhk-materials-database/.
The authors declare that they have no conflict of interest.
The authors wish to acknowledge the help from Sandia contract monitors Joshua
Paquette and Daniel Laird. The authors also wish to acknowledge technical
help from Tom Ashwill and Mark Rumsey. In addition, the work and research
presented herein could not have been performed without the assistance of the
entire Montana State University Composites Group.
Edited by: Athanasios
Kolios
Reviewed by: two anonymous referees
Bacharoudis, K. C. and Philippidis, T. P.: A probabilistic approach for strength and stability evaluation of wind turbine rotor blades in ultimate loading, Struct. Saf., 40, 31–38, https://doi.org/10.1016/j.strusafe.2012.09.006, 2013.
Berry, D.: Blade System Design Studies Phase II: Final Project Report, Report No. SAND2008-4648, Sandia National Laboratories, Albuquerque, NM, 2008.
Desmond, M., Hughes, S., and Paquette, J.: Structural Testing of the Blade Reliability Collaborative Effect of Defect Wind Turbine Blades Report No. NREL/TP-5000-63512, National Renewable Energy Laboratory, Boulder, CO, 2015
Ditlevsen, O. and Madsen, H. O.: Structural reliability methods, 178, New York, Wiley, https://doi.org/10.1002/9780470611708, 1996.
Dowling, N. E.: Mechanical behavior of materials, Pearson, https://doi.org/10.1080/10426910008913020, 2012.
FAA AC 25.571-1D: Damage Tolerance and Fatigue Evaluation of Structure, Federal Aviation Administration, Washington, DC, 13 January, 2011.
Hu, W., Choi, K. K., and Cho, H.: Reliability-based design optimization of wind turbine blades for fatigue life under dynamic wind load uncertainty, Struct. Multidiscip. O., 54, 953–970, 2016.
Kim, W. B., Hong, J. H., Kim, K. W., Choi, J., Kim, J. K., and Sung, H. G.: Reliability Analysis of Solid Rocket Motor under Bayesian Framework, 53rd AIAA/ASME/ASCE/AHS/ASC Structures, Structural Dynamics and Materials Conference 20th AIAA/ASME/AHS Adaptive Structures Conference, https://doi.org/10.2514/6.2012-1764, 2012.
Kolios, A. and Brennan, F.: RELIABILITY BASED DESIGN OF NOVEL OFFSHORE STRUCTURES, 3rd International Conference on Integrity, Chengdu, China, 2009.
Lekou, D. J. and Philippidis, T. P.: PRE-and POST-THIN: a tool for the probabilistic design and analysis of composite rotor blade strength, Wind Energ., 12.7, 676–691, 2009.
Lin, K. Y. and Styuart, A. V.: Probabilistic approach to damage tolerance design of aircraft composite structures, J. Aircraft, 44, 1309–1317, 2007.
Mahadevan, S. and Haldar, A.: Probability, Reliability, and Statistical Methods in Engineering Design, Wiley, https://doi.org/10.1002/bate.200002930, 2000.
Mandell, J., Samborsky, D., Pancasatya, A., and Sears, A.: Analysis of SNL/MSU/DOE fatigue database trends for wind turbine blade materials, SAND2010-7052, Sandia National Laboratories, Albuquerque, NM, 2010.
Mustafa, G., Suleman, A., and Crawford, C.: Probabilistic micromechanical analysis of composite material stiffness properties for a wind turbine blade, Compos. Struct., 131, 905–916, https://doi.org/10.1016/j.compstruct.2015.06.070, 2015.
Nelson, J., Riddle, T., and Cairns, D.: Effects of defects in composite wind turbine blades: Round 1, available at: http://prod.sandia.gov/techlib/access-control.cgi/2012/128110.pdf (last access: 2 December 2017), 2012a.
Nelson, J., Riddle, T., and Cairns, D.: Effects of defects in composite wind turbine blades: Round 2, available at: http://prod.sandia.gov/techlib/access-control.cgi/2012/128111.pdf (last access: 2 December 2017), 2012b.
Nelson, J. W., Riddle, T. W., and Cairns, D. S.: Effects of defects in composite wind turbine blades – Part 1: Characterization and mechanical testing, Wind Energ. Sci., 2, 641–652, https://doi.org/10.5194/wes-2-641-2017, 2017.
Nijssen, R. P. L: Fatigue life prediction and strength degradation of wind turbine rotor blade composites, Diss., Knowledge Centre WMC and DPCS group of Aerospace Engineering, 2011.
Philippidis, T. P. and Vassilopoulos, A. P.: Life prediction methodology for GFRP laminates under spectrum loading, Compos. Part A-Appl. S, 35, 657–666, 2004.
Rackwitz, R. and Flessler, B.: Structural reliability under combined random load sequences, Comput. Struct., 9, 489–494, 1978.
Resor, B. and Paquette, J.: A NuMAD Model of the Sandia TX-100 Blade, Report No. SAND2012-9274, Sandia National Laboratories, Albuquerque, NM, 2012.
Riddle, T. W., Cairns, D. S., and Nelson, J. W.: Characterization of manufacturing defects common to composite wind turbine blades: Flaw characterization, 52nd AIAA/ASME/ASCE/AHS/ASC Structures, Structural Dynamics and Materials Conference 19th AIAA/ASME/AHS Adaptive Structures Conference, 1758, https://doi.org/10.2514/6.2011-1758, 2011.
Riddle, T. W., Cairns, D. S, Nelson, J. W., and Workman, J.: Effects of Defects: Part A-Development of a Protocol for Defect Risk Management & Improved Reliability of Composite Structures. 53rd AIAA/ASME/ASCE/AHS/ASC Structures, Structural Dynamics and Materials Conference 20th AIAA/ASME/AHS Adaptive Structures Conference, 1420, https://doi.org/10.2514/6.2012-1420, 2012.
Riddle, T. W., Cairns, D. S., and Nelson, J. W.: Effects of Defects Part A: Stochastic Finite Element Modeling of Wind Turbine Blades with Manufacturing Defects for Reliability Estimation, 54th AIAA/ASME/ASCE/AHS/ASC Structures, Structural Dynamics, and Materials Conference, 1627, https://doi.org/10.2514/6.2013-1627, 2013.
Samborsky, D., Mandell, J., and Miller, D.: The SNL/MSU/DOE fatigue of composite materials database: recent trends, 53rd AIAA/ASME/ASCE/AHS/ASC Structures, Structural Dynamics and Materials Conference 20th AIAA/ASME/AHS Adaptive Structures Conference, 1573, https://doi.org/10.2514/6.2012-1573, 2012.
Tenhave, A. A.: WISPER and WISPERX: Final definition of two standardised fatigue loading sequences for wind turbine blades, NASA STI/Recon Technical Report 94, 30872, 1992.
International Electrotechnical Commission (IEC 61400-1): Wind turbines part 1: Design requirements, 3rd Edn., International Electrotechnical Commission, Geneva, Switzerland, 2005.
Veers, P. S., Lange, C. H., and Winterstein, S. R.: FAROW: A Tool for Fatique and Reliability of Wind Turbines, Sandia National Laboratories, Albuquerque, NM, 1993.
Veers, P. S., Ashwill, T. D., Sutherland, H. J., Laird, D. L., Lobitz, D. W., Griffin, D. A., Mandell, J. F., Musial, W. D., Jackson, K., Zuteck, M., Miravete, A., Tsai, S. W., and Richmond, J. L.: Trends in the design, manufacture and evaluation of wind turbine blades, Wind Energ., 6.3, 245–259, 2003.