the Creative Commons Attribution 4.0 License.
the Creative Commons Attribution 4.0 License.
 | 28 May 2018
Establishing a robust testing approach for displacement measurement on a rotating horizontal-axis wind turbine
Nadia Najafi
Allan Vesth
Health monitoring by conventional sensors like accelerometers or strain gauges becomes challenging for large rotating structures due to the issues with feasibility, sensing and data transmission. In addition, acceleration measurements have low capability of presenting very small frequencies, which happen very often for large structures (for instance, frequencies between 0.2 and 0.5 Hz in horizontal-axis wind turbines). By contrast, displacement measurement using stereo vision is rapid, non-contacting and distributed over the structure. The sensors are cheaper and more easily applied to many places on the object to be measured. Horizontal-axis wind turbines are one of the most important large rotating structures and need to be measured and monitored in time to prevent damage and failure, and the blade tip position is one of the key parameters to measure in order to prevent the blade hitting the turbine tower.
This paper presents a clearly described and easily applicable procedure for measuring the displacement on the components of a rotating horizontal-axis wind turbine with stereophotogrammetry. Paper markers have been applied on the rotor and tower of a scaled-down horizontal-axis wind turbine model in the workshop and the displacement measurement method has been demonstrated by measuring displacement during operation. The method is mainly developed in two parts: (1) camera calibration and (2) tracking algorithm. We introduce an efficient camera calibration method for measurement in large fields of view, which has always been a challenge. This method is easy and practical and offers better accuracy compared with 2-D traditional camera calibration. The tracking algorithm also works successfully and is able to track the points during rotation within the measurement time. Finally, the accuracy analysis has been conducted and has shown better accuracy of the new calibration method compared with 2-D traditional camera calibration.
- Article
(1897 KB) - Full-text XML
- BibTeX
- EndNote


Regarding the increasing industrial advances and the world's population growth, fossil fuel sources will not meet the human need for energy in the near future. In such a situation wind energy is an environmentally friendly alternative that can decrease the dependency on declining fossil fuels (Herbert et al., 2007). Growth of wind turbine technology has led to important concerns about the reliability of energy production and wind turbine efficiency, and reliable turbine operation also requires proper experimental tools and high-quality testing methods to monitor the turbine behavior.
Traditional contact transducers such as strain gauges and accelerometers have been used for vibration analysis, health monitoring, damage detection and structural displacement of wind turbines (Weijtjens et al., 2017; Yang et al., 2014; Osgood et al., 2010; Lorenzo et al., 2016; and Manzato et al., 2014) and other large structures like bridges (Hoffmann, 1989; Fukuda et al., 2013; Park et al., 2005; Ye et al., 2012; Xia et al., 2014, and Siriwardane, 2015), but they have difficulties measuring on a large scale; the installation process, which often includes wiring, is costly and time consuming. The measured signal from conventional sensors such as accelerometers is not very accurate in measuring low frequencies of the structure (for instance frequencies between 0.2 and 0.5 Hz in horizontal-axis wind turbines) and includes the centrifugal components (Najafi and Paulsen, 2017). In addition, contact transducers can only measure the structure at a few points and increasing the measurement points creates additional cost and complication (Hunt, 1998). As an alternative, non-contact optical measurement techniques provide faster and cheaper ways to measure displacement on large and rotating structures such as wind turbines. Stereophotogrammetry is a common optical technique for motion tracking of the objects and enables 3-D displacement measurements. Stereophotogrammetry or stereo vision estimates the 3-D coordinate of the points using two or more 2-D images taken from different angles. The preparation time is short and it could measure at many points on large structures.
Displacement of the turbine components (blades and tower) is an important parameter when analyzing the rotor performance and structural behavior of the turbine during operation. Stereophotogrammetry has been previously employed to estimate the strain and full displacement field of the turbine blades with digital image correlation (DIC) for investigation of the relative out-of-plane blade deflections (Winstroth et al., 2014), rotor vibration measurement (Warren et al., 2010a, and Poozesh et al., 2016) and blade damage detection (Leblanc et al., 2013, and Zarouchas and Hemelrijck, 2014). DIC gives the continuous displacement distribution and is computationally expensive in monitoring large-scale structures, but 3-D point tracking (3DPT), which measures displacement in discrete points, is the preferable approach for outdoor and large-scale experiments. In 3DPT, the optical targets, which can be simple paper markers (reflective or not reflective), are mounted at different places on the structure, as many as desired, and their 3-D coordinates are tracked over time. 3DPT has been used for displacement measurements of the turbines in recent years. The displacement measurement via 3DPT has been used to predict the full field dynamic strain of a model-scale wind turbine blade (Baqersad et al., 2015). However, stereo vision is new in measuring vibration; it shows good agreement with conventional transducers like accelerometers and strain gauges in this field (Warren et al., 2010b, and Najafi et al., 2015). In Najafi and Paulsen (2017), 3DPT has been used to study structural vibrations of a model-scale vertical-axis wind turbine. Najafi and Paulsen (2017) investigated the challenges of using stereo vision for vibration analysis of complex geometries with sharp curvatures and out-of-plane components. In Prowell et al. (2011, 2012) and Paulsen et al. (2012) the displacement measurements by point-tracking stereophotogrammetry are used for determining structural response and modal properties of utility-scale horizontal-axis wind turbines.

The current study is focused on establishing a clearly described and easily applicable procedure to measure displacement on the components of a rotating horizontal-axis wind turbine using stereo vision technique. A scaled-down horizontal-axis wind turbine model is used to demonstrate the displacement measurement method. Camera calibration is one of the main challenges of measurement in large fields of view; it links the 3-D coordinate of the points in the real world to their corresponding 2-D coordinate in the image plane. A traditional way of calibration uses a calibration object with known and precise coordinates to calibrate the camera. This method is accurate and efficient, but it is unpractical for large field-of-view applications because of the calibration object size. There is also another calibration technique with no need for a calibration object, which is called self-calibration. Self-calibration uses epipolar geometry of stereo pairs to reconstruct the 3-D coordinates. These methods are flexible but the final results are not always precise and reliable because there are many parameters that need to be estimated (Medioni and Kang, 2005). In this study we updated the traditional calibration method for large fields of view to be easier, faster and more practical. We also compared the results of the updated 3-D calibration method with the traditional calibration that is conducted with a large grid in the background and the comparison shows better accuracy of the new 3-D calibration procedure.
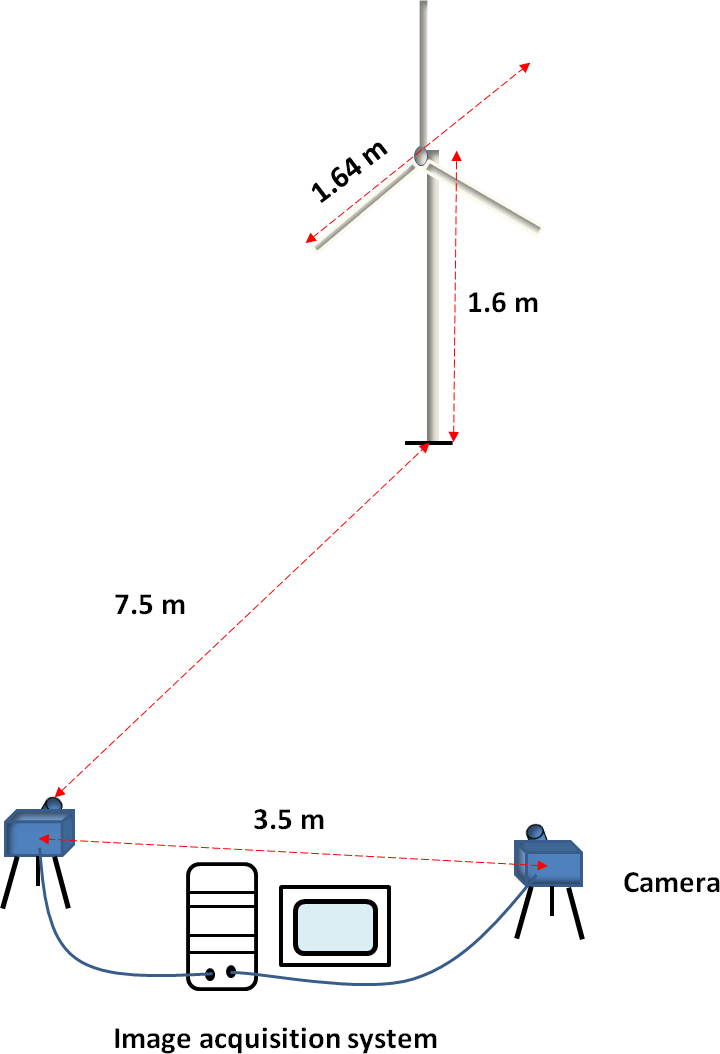
The case study is a scaled-down model of 3.6 MW turbine (see Fig. 1). The rotor diameter is 1640 mm and the blades are made of aluminium, with a rectangular cross section of 5 mm × 8 mm. The tower is also an aluminium rod with the height of 1600 mm and a cross section of 16 mm in diameter. The rotational speed of rotor is between 0 and 150 rpm. A wire is twisted around the individual blades to prevent vibrations induced by a vortex that forms behind the rectangular shape of the blade.
Stereo vision measurement system contains two Basler acA2040-180km cameras equipped with 40 mm (focal length) Nikon lenses. The maximum frame rate of the cameras is 187 frames per second (fps) for full size images. The image acquisition system has limited capacity; therefore the longest acquisition time of stereo system with maximum frame rate (187 fps) is about 16 s. However, by decreasing the frame rate the acquisition time increases; for instance the motion of the turbine can be tracked for about 150 s with 20 fps. Nevertheless, by upgrading the acquisition system the measurement time can be modified.
In this experiment the cameras are placed about 7.5 m away from the turbine while they are apart by about 3.5 m. According to the turbine dimensions the imaging area is chosen to be about 2 m × 2 m. Based on the focal length and camera sensor size, and assuming that the cameras follow the pinhole camera model, the distance between the cameras and turbine is calculated to be 7.5 m.
This setup satisfies the rule of thumb which says that the distance between the cameras should be at least one-third of the distance between the cameras and the test object; it can be up to 3 times the distance as long as all the targets on the object can be seen in the stereo image pairs.
The simplest marker used in stereo vision is circular with a good contrast with the background and the center of the marker is considered to be tracked. According to Ozbek and Rixen (2013), curvatures of the structure where the markers are applied lead to perspective errors that need to be corrected. In other words, in horizontal-axis wind turbines, some parts of the blades are curved or deformed due to the loading during rotation; this deformation as well as the relative angles between camera and turbine cause the changes in the shapes of the marker in the image from circular to elliptical. Therefor the real center of the circular marker should be calculated by knowing the exact relative angles and blade deformation at the marker position, which is quite challenging due to the unknown instant blade deformation. To avoid these difficulties, we have changed the marker shape to the following shape, shown in Fig. 3, with a diameter of 4 cm. In this case there is no need to calculate the center of the marker and it can be found using robust corner detection image processing algorithms independent of the marker shape in the image and blade curvatures.
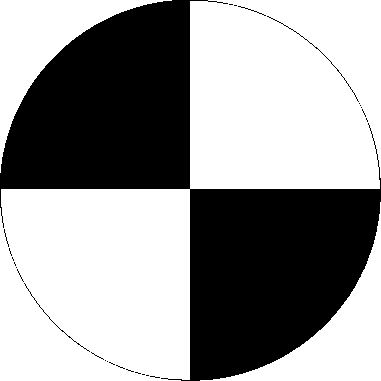
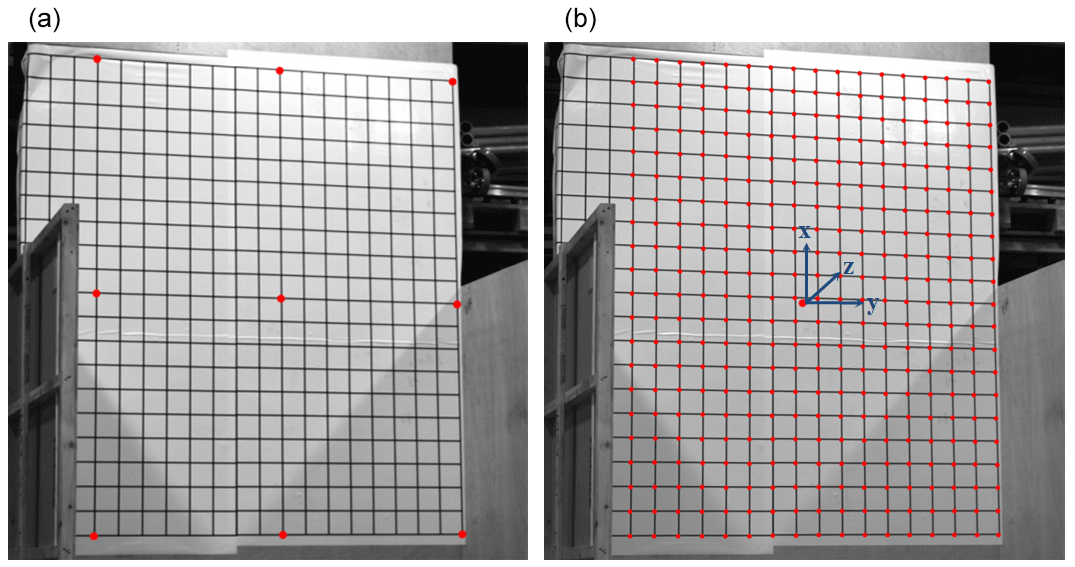
Figure 4(a) Eight points on the borders of the common between the fields of view of both cameras on the calibration grid; (b) identifying the calibration points in calibration grid.
Camera calibration is the estimation of intrinsic and extrinsic parameters of the cameras in order to relate the 3-D coordinates of the real word to 2-D coordinates of the image. Extrinsic parameters define the location and orientation of the camera that contain the translation vector and the rotation matrix. Intrinsic parameters describe the optical, geometrical and digital characteristics of the camera such as focal length, image center in pixel coordinates, the effective pixel size in horizontal and vertical directions, and the radial distortion coefficient. Traditional camera calibration is the most common way of calibrating cameras and has been studied and improved over the years by different researchers (Tsai, 1987; Weng et al., 1992, and Zhang, 2000). This method uses a calibration object, including a number of points with known coordinates, to estimate the camera parameters. The traditional calibration is divided to three methods based on the calibration object dimensions: 3-D, 2-D (planar) and 1-D (linear) calibration (Medioni and Kang, 2005). The 3-D calibration can be conducted very efficiently with very high precision but it requires expensive equipment and elaborate setup in the traditional calibration procedure (Faugeras, 1993). However, 2-D traditional calibration is easier and less expensive (Sun and Cooperstock, 2005).
In this section two calibration methods are applied: at first the cameras are calibrated using a 2-D calibration board with known coordinates; in the second part a new 3-D calibration approach is introduced.
3.1 2-D traditional camera calibration
The 2-D traditional calibration has been conducted with a 2-D printed grid applied on a wooden board. The dimensions of the grid are 2 m × 1.9 m and it contains 21 horizontal and 20 vertical lines that intersect at 420 points with known coordinates that are 10 cm apart in horizontal or vertical direction.
The exact positions of the grid point in each image are determined using image processing algorithms.
Firstly a part of the grid that is common between the fields of view of both cameras is chosen, and then eight points on the borders of that area are picked (see Fig. 4a). A fraction of the image around each of the border points is taken (image window) and the exact position of the points is given by intensity median of the image window.
The coordinates of windows around all the grid point are estimated using interpolation between the border points and finally the exact positions of the grid points in each image are determined as the intensity median of the windows (Fig. 4b).
After getting the exact pixel positions of the grid points in the image and also having the coordinates of the points in the real world, the traditional calibration builds the equations that relate the coordinates of the real world to the coordinates of the images taken by the camera. Finally, intrinsic parameters of the camera (focal length, chip size, image center, etc.) and extrinsic parameters (translation and rotation matrix) are defined.
3.2 3-D updated camera calibration by a surveillance device with a laser range finder
The traditional 3-D calibration method can be conducted very accurately, as it has been discussed in the beginning of this section, but it needs expensive and elaborate setup and expensive equipment such as two or three orthogonal planes. Setting up the traditional 3-D calibration in large fields of view, like full-scale wind turbine experiments, is not feasible due to the difficulties in providing a precise calibration object. In our new calibration method, instead of using a huge 3-D calibration object, we used the markers that are applied on the turbine for the sake of measurement, as the calibration points. A Leica surveillance device (Leica Nova MS50) determines the exact position of the points quite accurately and then the coordinates are used for 3-D calibration of each camera. Leica Nova MS50 is a surveillance device with a laser range finder that uses advanced technologies for 3-D laser scanning, imaging and GNSS (Global Navigation Satellite System) positioning. The accuracy in x and y directions is dependent on the distance between the Leica Nova MS50 and the object, and hence the accuracy in x and y directions in the current case is about 0.0349 mm. In addition the Leica Nova MS50 accuracy in depth (z direction) is 1 mm for measuring on reflective surfaces.
During the calibration the rotor was rotated (manually) by a specific angle step by step, in order to cover the whole rotor area by the calibration points and establish the collection of known coordinates for camera calibration.
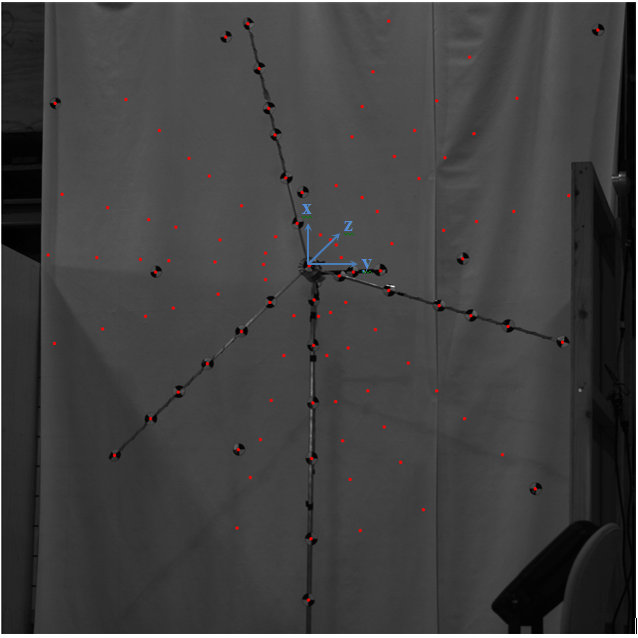
Figure 5Calibration points in the new method. The blue axes show the real-world coordinate system.
To measure the displacement of the markers during the rotation, a tracking algorithm has been developed. The main steps of the algorithm are as follows.
Picking the coordinates of the markers in a number of image sequences during a cycle of rotation with equal intervals between the sequences. For example if the camera takes 40 pictures during one rotor revolution, we picked the coordinate of the markers in every four pictures to estimate the path of each marker. In this step an ellipse equation is fitted to the markers path during one rotation.
For the initial guess for angular deflection between image sequences, the angle between the lines that connect the ellipse center to the first and second picked marker coordinates on the ellipse in step 1 (black dots in Fig. 6) is calculated, and by knowing the number of image sequences between the first and second positions of the marker (N1) on the ellipse, the first guess for the angular deflection between image sequences is obtained. As the turbine rotational speed is not fully constant during rotation, we need to update the angular deflection in each sequence.
With the initial estimation of the angular deflection between the image sequences (Δθ0) and also the elliptical path of each marker, the approximate position of the marker in the next sequence (time of t0+Δt) is estimated.
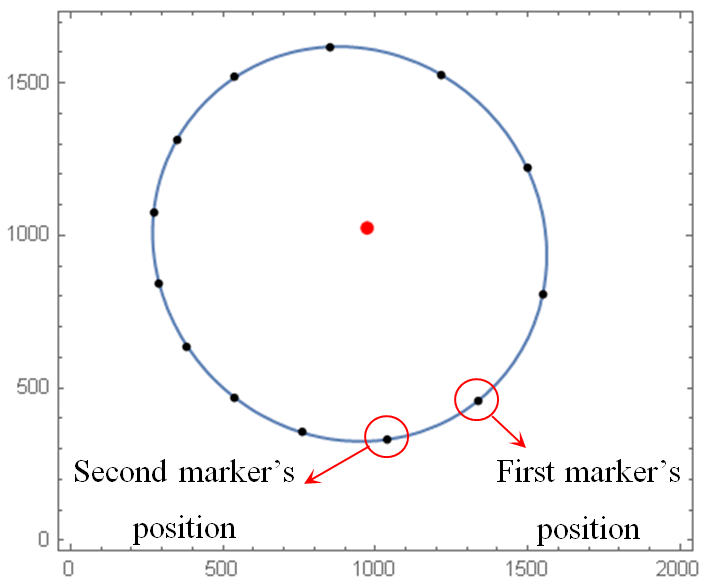
Figure 6Elliptical path of a marker in the image coordinates during rotation. Black dots are the coordinates of the marker that has been picked with equal intervals – there are N1 coordinates of the marker between every two black dots. Blue line is the fitted ellipse. Red dot is the center of the ellipse.
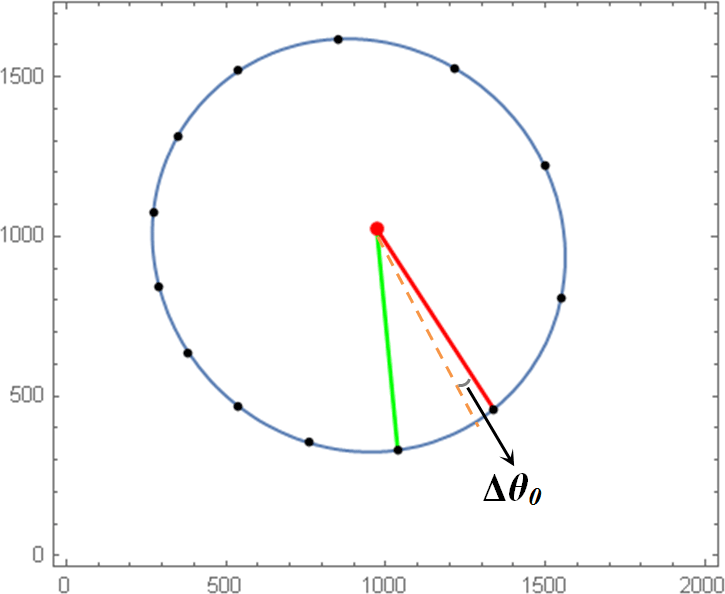
Figure 7The red line connects the elliptical path center and the first position of the marker at time t=t0. The green line connects the center of the elliptical path and the position of the marker after a number of sequences.
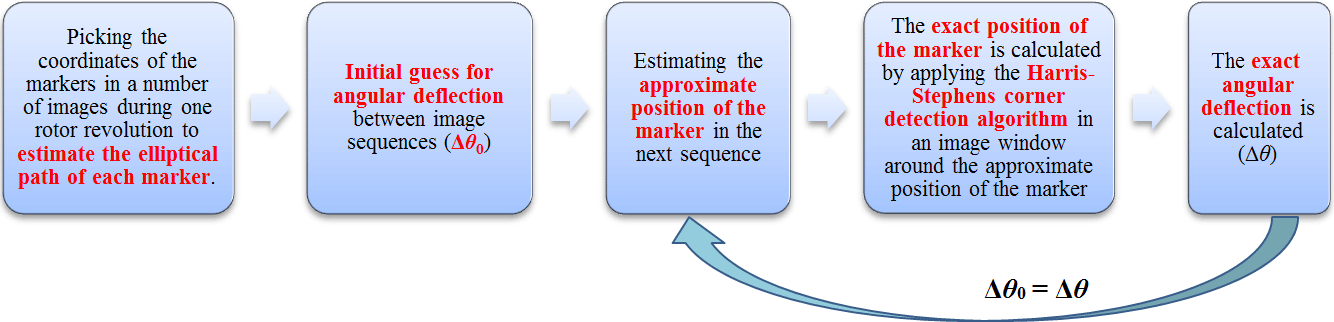
An image window is established around the approximate position of the marker and the exact position of the marker is calculated using the Harris–Stephens corner detection algorithm in the window. This algorithm is described in Harris and Stephens (1988).
By knowing the exact position of the marker, the exact angular deflection is calculated (Δθ).
The approximate marker position in the next sequence is estimated using the angular deflection in the previous sequence. However, the initial guess for the angular deflection in each time step is the angular deflection of the previous sequence (Δθ0=Δθ).
The exact position of the marker is estimated by repeating the algorithm from steps 3 to 5.
The flowchart in Fig. 8 briefly explains the tracking algorithm.
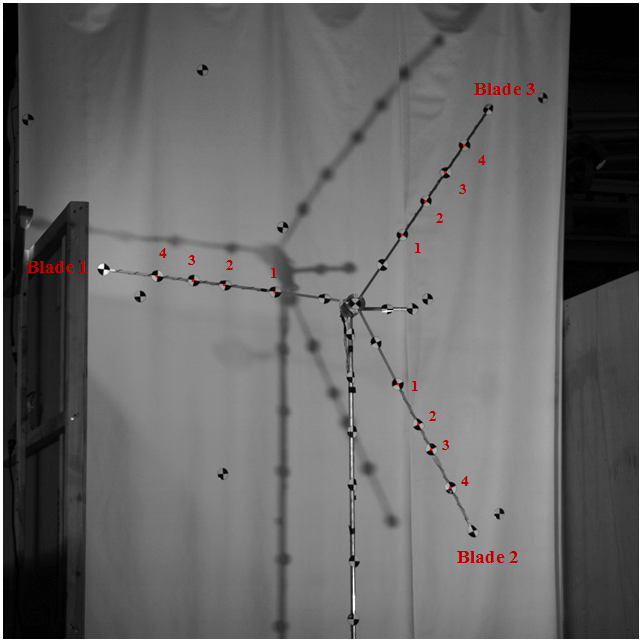
After calibrating the cameras by traditional and updated calibration methods, the 2-D positions of the markers in the image are found during the rotation using the tracking algorithm. The markers that are followed in time are shown in Fig. 9.
The line of sight from each marker to each of the cameras is calculated by both calibration methods and the intersection of the two lines of sight is found as the 3-D position of the marker (stereo triangulation). The 3-D updated calibration has been done with different numbers of calibration points to compare the results: (1) all of the 111 points including the points on the turbine rotor, tower and background; (2) 103 points including the points on the turbine rotor and tower; and (3) 35 points of the points on the turbine rotor and tower.
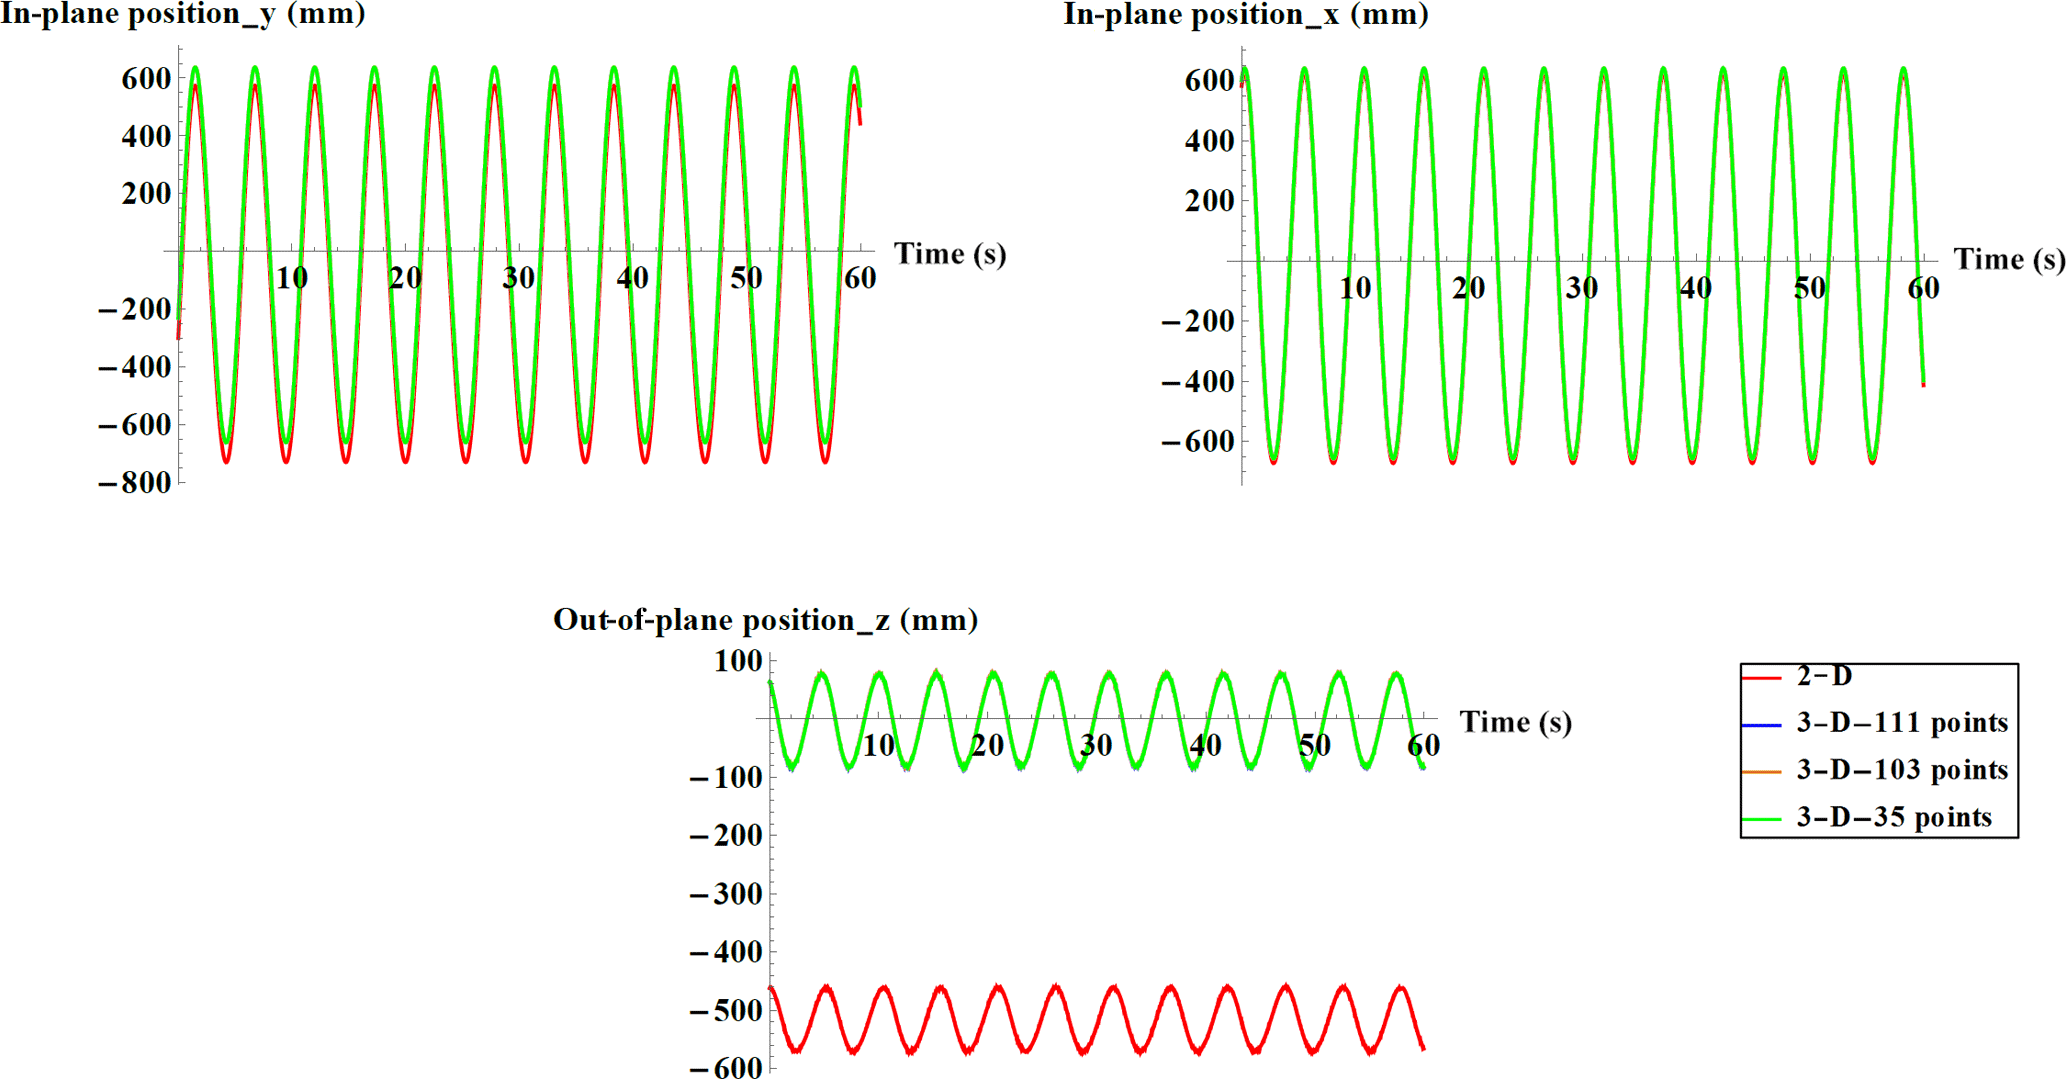
Figure 10Displacement time series for point number 4 with different calibrations (plots corresponding to 3-D calibration are almost on top of each other).
It can be seen in Fig. 10 that there is an offset, especially in depth direction, between the displacement obtained by the traditional and updated calibration methods; this offset is due to having different origins of the coordinate systems in 2-D and 3-D calibrations. There are also other minor differences between traditional 2-D and new 3-D calibrations (is more obvious in in-plane positions) that a part of it can be due to the slightly different directions of the coordinate axes.
For comparing calibration methods two different indicators are investigated: (1) the distance between the lines of sight at the intersection position and (2) the distance between two markers during rotation.
The lines of sight from the marker to the cameras do not exactly intersect in the space due to the inaccuracies, and the 3-D position is regarded as the point with minimum distance from two lines of sight (Trucco and Verri, 1998). Therefore the distance between the lines of sight is considered to be indication of measurement inaccuracy that is mainly caused by calibration uncertainties, light reflections and other environmental and physical factors.
The distance between the markers will barely change during the turbine operation due to the centrifugal forces and gravity; thus the change of the distance between the markers when the turbine is rotating can be used as another indication of the measurement inaccuracy.
In Table 1 the averaged and the maximum value of the distance between the lines of sight during rotation for point number 2 on blade 2 are listed for different calibrations and in different rotational speeds. Light and the other environmental factors are almost the same in all the measurements; therefore the different values of lines of sight distances are mostly due to different calibrations. The photography sampling frequency is 50 fps and the recording time is 1 min.
Table 1The distance between the lines of sight during rotation for point number 2 on blade 2 and for different calibrations.
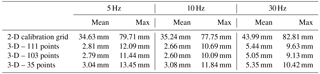
It is obvious in Table 1 that the distance between the lines of sight is much larger in the measurement with traditional 2-D calibration compared to the measurement with the new 3-D calibration. This comparison proves that the new calibration with Leica Nova MS50 is more accurate than the traditional 2-D calibration, even with much fewer calibration points. The distances between the lines of sight in measurements with different numbers of the 3-D points are relatively close, but the measurement of the 3-D calibration with 103 points on the turbine shows slightly better results. It can be seen in Table 1 that by adding the background calibration points the distance between the lines of sight does not change significantly. This is a good and practically relevant point for full-scale turbine measurement which shows that having other calibration points than the points on the turbine is not necessary and does not improve the displacement measurement quality. It is expected to see better results with more calibration points; however, 3-D calibration with one-third of the turbine calibration points still looks acceptable. This effect of the number of the calibration points on the calibration quality is an important parameter that also needs to be checked in the full-scale experiment.
According to Ozbek and Rixen (2013), the distance between the target points for a real turbine remains constant during rotation. Therefore the blade elongation is studied for a rotational speed of 5 rpm as an indicator of calibration precision. In Fig. 11 the change of the distance between markers 1 and 2 on blade 1 (shown in Fig. 9), which are about 146 mm apart, and markers 1 and 2 on blade 3, which are about 145 mm apart, is plotted for the different calibration approaches: the larger change of distance between the markers with the 2-D calibration can be correlated to the less accuracy in this calibration compared to the 3-D calibrations with Leica surveillance device.
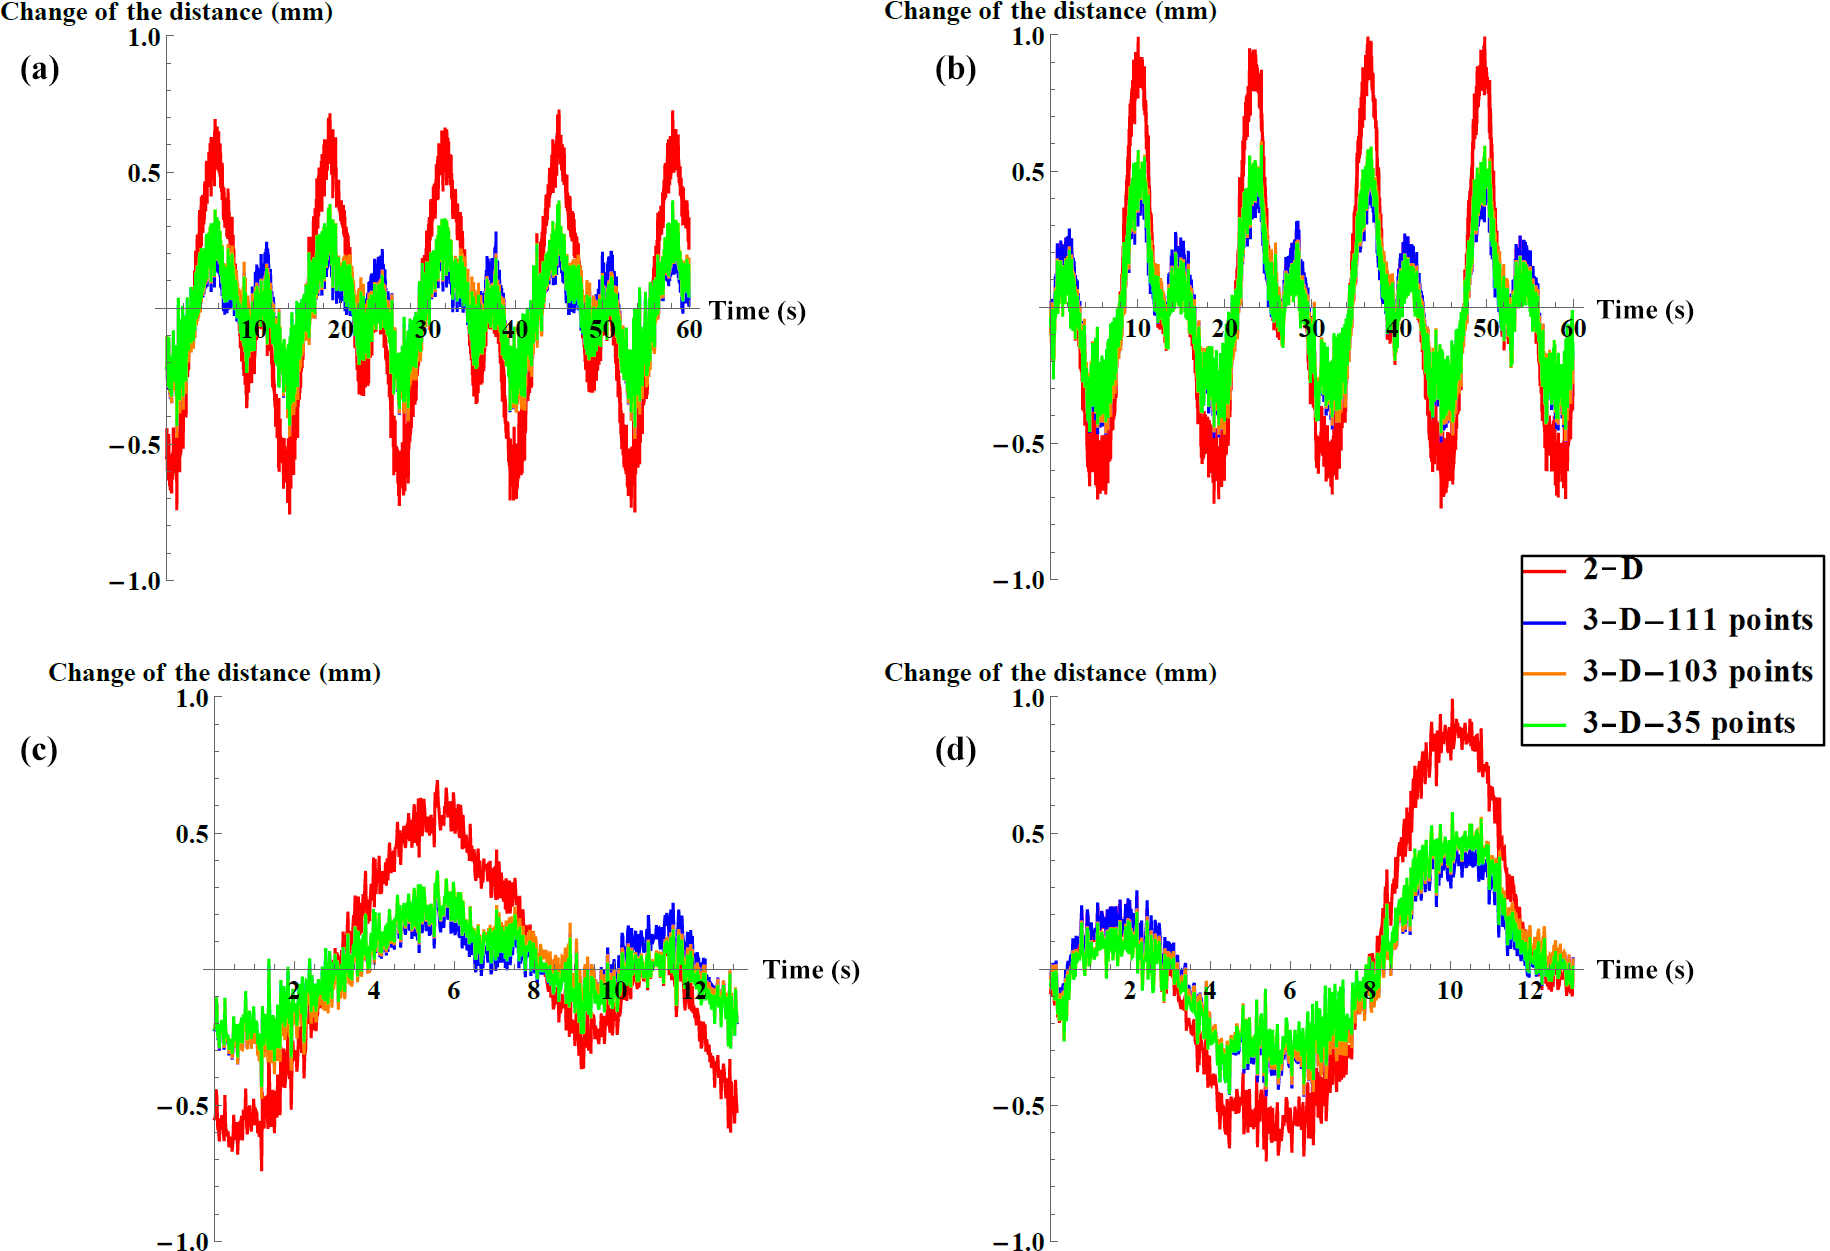
Figure 11Elongation between markers 1 and 2 on blade 1 (a, c) and blade 3 (b, d) in 1 min (a, b) and during one cycle of rotation (c, d) with different calibrations.
The distance between two markers changes periodically in Fig. 11, no matter which calibration method is used to obtain the displacement. The distance between the other two markers at almost the same area of the blade (markers 1 and 2) is also checked for the sake of reliability and repeatability and this revealed the periodic behavior of the elongation between markers that is due to the repeating errors during operation. To investigate this behavior, the spectrum of the distance measured with 3-D calibration has been plotted in Fig. 12.
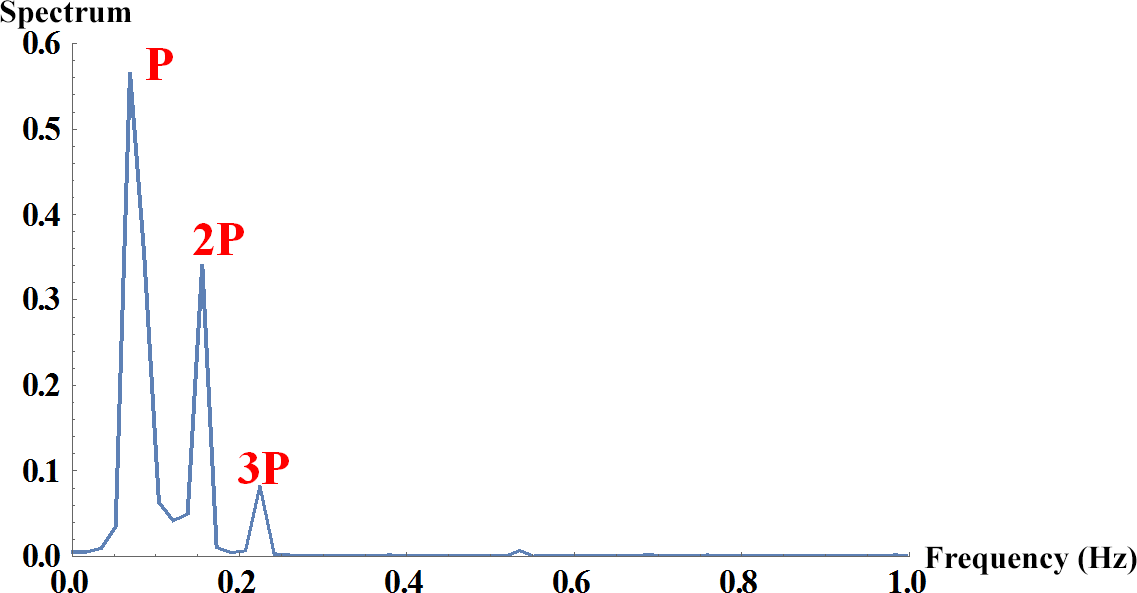
Figure 12Power spectrum of the distance changes between points 1 and 2 on blade 3, calculated by 3-D calibration using turbine points.
Figure 12 shows that the periodic behavior of the elongation between markers is dominant by P and 2P, where P is the rotor rotational frequency (5 rpm ≈ 0.083 Hz). This could be because of the physical problems such as the light reflection, calibration inaccuracies, geometry miscalculations and camera nonsynchronization.
By looking at the images that are taken and processed for the displacement measurements, it can be seen that each marker in Fig. 11 is exposed to strong reflection once during one cycle, which will be two times for a pair of markers; this could explain the 2P peak in the spectrum. For decreasing the unwanted reflections during displacement measurement, the markers can be printed with matte coating.
The geometry miscalculation, which mainly happens for circular markers, is less likely to happen in the current study. However, the projected image of circular markers changes to an ellipse due to the blade loading and deformation during rotation and relative angle between the camera and the turbine. To calculate the center of the circular marker from its elliptical image, knowledge about the exact angle of the rotor plane is required, but in the current case no center calculation is needed due to the specific shape of that marker (Fig. 3).
In the current study there is no external trigger or switch to start the cameras, and they are triggered at the same time using a software trigger (LabVIEW code) that could disturb the perfect synchronization between the cameras. This also could be one of the sources that make the P peak occur in the spectrum. The effect of the camera nonsynchronization would be obviously more pronounced in full-scale experiments with very larger dimensions and higher rotational speeds; therefore the image acquisition system should be equipped with the external trigger during full-scale turbine testing.
There are also other challenges that should be considered during the full-scale operational turbine displacement measurement via the technique that is developed in this study. One of the main challenges is turbine vibrations due to the wind during the camera calibration that will not happen in the workshop. It is suggested that the calibration be done in calm weather conditions to minimize the inaccuracies of the coordinate measurement by Leica surveillance device due to the wind-induced vibrations of the targets. Furthermore, the wind-induced vibrations should be considered in uncertainty analysis; however, the Leica Nova MS50 coordinate measurement is based on wave form digitizing technology that is able to send out the short pulses with a frequency of up to 2 MHz toward the target Maar and Zogg (2014), which enables the Leica Nova MS50 to capture even very fast vibrations, while the most dominant natural frequencies of the large wind turbines barely exceed 10 Hz. In addition, the camera and Leica surveillance device should be synchronized during the calibration process to capture the changes of the turbine vibrations.
Another complexity about the field measurements is the changes of the wind speed and direction that lead to changes in turbine yaw and blade pitch angles. The calibration method that is proposed in this paper is a 3-D calibration due to the 3-D distribution of the points on the rotor, nacelle and turbine tower. Therefore if the turbine yaws, or the blades pitch within a reasonable range, the calibration is expected to be still valid for the measurement. However, a comprehensive study should be done on the yaw and pitch angle range where camera calibration is valid in the field measurement.
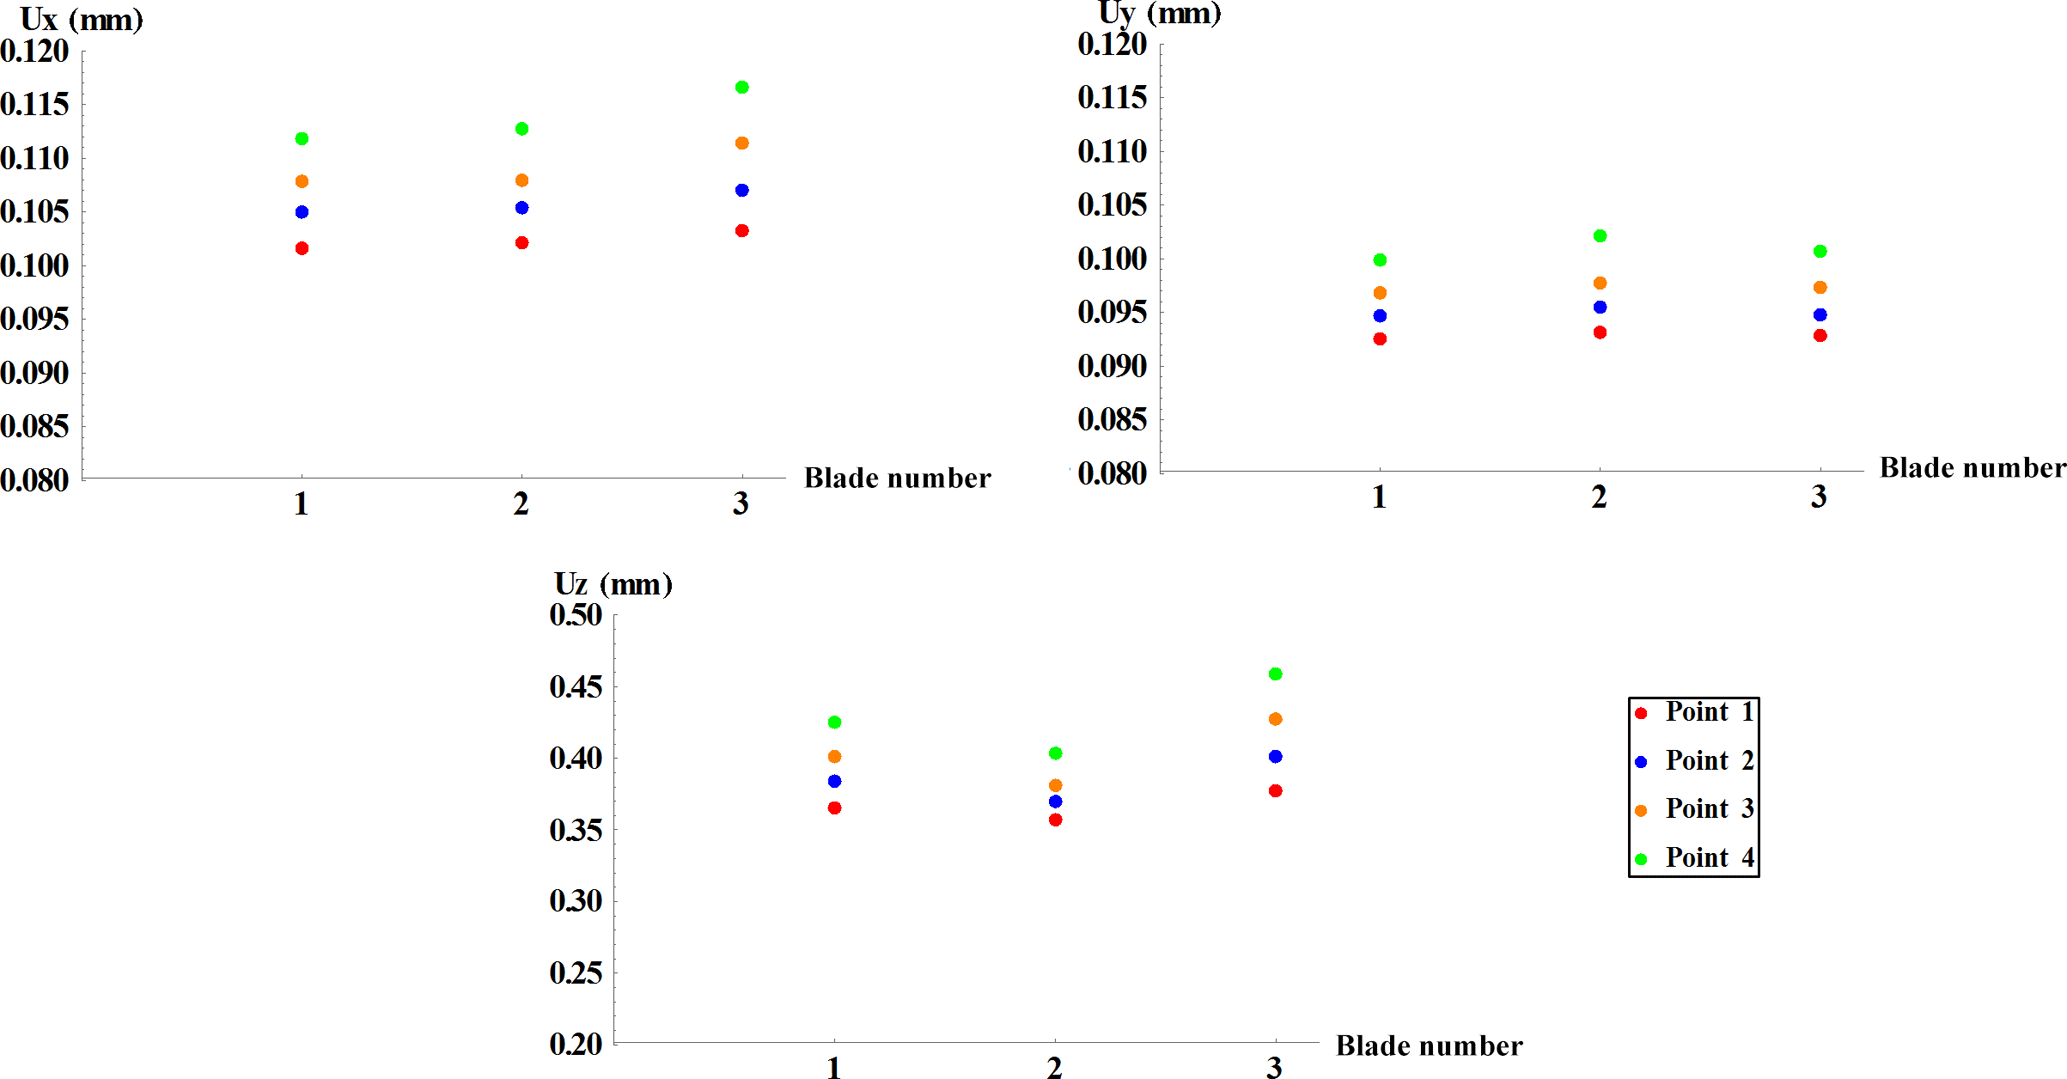
The uncertainty of the measured displacement signal obtained with 103 points calibration is calculated using the generalized method based on the law of error propagation in a linear camera model of a stereo vision system. In this method, which is very well described in Chen et al. (2008), the uncertainty propagation in stereo reconstruction is explained in two main stages: camera calibrations and 3-D triangulation to obtain the 3-D coordinates from 2-D projections in the images. In Fig. 13 the mean value of the position determination uncertainty in x(Ux), y(Uy) and z(Uz) directions is presented for markers shown in Fig. 9.
It can be seen in Fig. 13 that the uncertainty values do not change significantly from the root to the tip of the blade, which shows that the lens distortion is negligible.
In this paper, a clearly described and easily applicable stereophotogrammetry approach is introduced to measure the displacement of a rotating horizontal-axis wind turbine. The camera calibration and marker tracking algorithm are studied in this work.
Camera calibration for large fields of view normally involves a lot of challenges. The traditional way of calibration that uses a calibration grid with known points is impractical for large-scale uses. For example, with a modern-size wind turbine the calibration grid would at least need to be 120 × 120 m2, and other calibration techniques such as self-calibration are not always precise or reliable.
In this study a new 3-D calibration method has been developed that is especially suitable for large fields of view – in the current case an operating horizontal-axis wind turbine. The new 3-D calibration method is easier, faster, and has the big advantage of avoiding the use of a calibration grid. Instead of the calibration grid the measurement points themselves are used as the calibration points by determining their coordinates. A Leica surveillance device with a laser range finder is used in the calibration process to determine the exact position (x, y, z) of the calibration points. The markers are then used as 3-D sensors of stereophotogrammetry after the calibration and the cameras record their motion to achieve the displacements by post-processing of the images.
A comparison between the results from the new 3-D calibration method and the traditional 2-D calibration that is using a calibration grid shows a higher accuracy for the new 3-D calibration procedure.
The new 3-D calibration procedure was then conducted using different numbers of the calibration points on the turbine components and also on the background. It is concluded that the background points are not necessary and do not improve the calibration quality. This is very important in the full-scale experiment as is would be problematic to install background points on a modern-size wind turbine. The investigations also showed that decreasing the calibration points down to 35 points on the turbine for an imaging area of 2 m × 2 m, still gives acceptable quality on the 3-D calibration. To measure the displacement of the markers during the rotation, a tracking algorithm has been developed based on the circular motion of the rotor markers and the robust corner detection image processing algorithms for determination of the makers' positions. This algorithm, which keeps tracking the markers robustly during operation, updates its parameters based on the angular deflection of the marker in the last time step and the elliptical path of the markers in the images during the rotation.
Light reflection and camera nonsynchronization are discussed as the main sources of error during measurement that can be addressed using matte markers as well as external trigger for the cameras in full-scale experiments.
The data can be shared upon request by contacting the authors.
The authors declare that they have no conflict of interest.
The author would like to thank Per Hansen for his kind support in the
experiments and also Rozenn Wagner for reviewing the paper and her valuable
comments.
Edited by: Luciano Castillo
Reviewed by: Dmitri Tcherniak and two anonymous referees
Baqersad, J., Niezrecki, C., and Avitabile, P.: Full-field dynamic strain prediction on a wind turbine using displacements of optical targets measured by stereophotogrammetry, Mech. Syst. Signal Pr., 62–63, 284–295, https://doi.org/10.1016/j.ymssp.2015.03.021, 2015.
Chen, J., Ding, Z., and Yuan, F.: Theoretical Uncertainty Evaluation of Stereo Reconstruction, 2387–2381, The 2nd International Conference on Bioinformatics and Biomedical Engineering, 16–18 May 2008, https://doi.org/10.1109/ICBBE.2008.927, Shanghai, China, 2008.
Faugeras, O.: Three-Dimensional Computer Vision: a Geometric Viewpoint, MIT Press, London, UK, 1993.
Fukuda, Y., Feng, M. Q., Narita, Y., Kaneko, S., and Tanaka, T.: Vision-Based Displacement Sensor for Monitoring Dynamic Response Using Robust Object Search Algorithm, 4725–4732, IEEE Sens. J., 13, https://doi.org/10.1109/ICSENS.2010.5689997, 2013.
Harris, C. and Stephens, M.: A combined corner and edge detector, Alvey vision conference, 15, 31 August–2 September 1988, Manchester, UK, 1988.
Herbert, G. M., Iniyan, S., Sreevalsan, E., and Rajapandian, S.: A review of wind energy technologies, Renewable and Sustainable Energy Reviews, 11, 1117–1145, https://doi.org/10.1016/j.rser.2005.08.004, 2007.
Hoffmann, K.: An introduction to measurements using strain gauges, Hottinger Baldwin Messtechnik GmbH, Darmstadt, 1989.
Hunt, A.: A guide to the Measurement of Force, The Institute of Measurement and Control, London, 1998.
Leblanc, B., Niezrecki, C., Avitabile, P., Chen, J., and Sherwood, J.: Damage detection and full surface characterization of a wind turbine blade using three-dimensional digital image correlation, Structural Health Monitoring, 12, 430–439, https://doi.org/10.1177/1475921713506766, 2013.
Lorenzo, E. D., Petrone, G., Manzato, S., Peeters, B., Desmet, W., and Marulo, F.: Damage detection in wind turbine blades by using operational modal analysis, Structural Health Monitoring, 15, 289–301, https://doi.org/10.1177/1475921716642748, 2016.
Maar, H. and Zogg, H. M.: WFD – Wave Form Digitizer Technology Leica Geosystems AG Heerbrugg, Switzerland, available at: http://w3.leica-geosystems.com/downloads123/zz/tps/nova_ms50/white-tech-paper/Leica_Nova_MS50_WFD-Wave_Form_Digitizer_Technology_TPA_en.pdf (last access: 22 May 2018), 2014.
Manzato, S., Santos, F., Peeters, B., LeBlanc, B., and White, J. R.: Combined accelerometers-strain gauges Operational Modal Analysis and application to wind turbine data, Proceedings of the 9th International Conference on Structural Dynamics, 30 June–2 July 2014, Porto, Portugal, available at: https://paginas.fe.up.pt/~eurodyn2014//CD/author.html?q=_leblancb_&a=B. Leblanc (last access: 22 May 2018), 2014.
Medioni, G. and Kang, S. B.: Emerging Topics in Computer Version, Prentice Hall PTR Upper Saddle River, NJ, USA, 2005.
Najafi, N. and Paulsen, U. S.: Operational modal analysis on a VAWT in a large wind tunnel using stereo vision technique, Energy, 125, 405–416, https://doi.org/10.1016/j.energy.2017.02.133, 2017.
Najafi, N., Paulsen, U. S., and Aryaee Panah, M. E.: Averaged cov-driven subspace identification for modal analysis of a modified troposkien blade with displacement measurement, Proceedings of IOMAC'15, Gijón, Spain, 12–14 May, 645–656, 2015.
Osgood, R., Bir, G., Mutha, H., Peeters, B., Lucza, M., and Sablon, G.: Full-scale modal wind turbine tests: comparing shaker excitation with wind excitation, Proceedings of the IMAC-XXVIII, Jacksonville, Florida USA, https://doi.org/10.1007/978-1-4419-9716-6_11, 2010.
Ozbek, M. and Rixen, D. J.: Operational modal analysis of a 2.5 MW wind turbine using optical measurement techniques and strain gauges, Journal of Wind Energy, 16, 367–381, https://doi.org/10.1002/we.1493, 2013.
Park, K. T., Kim, S. H., Park, H. S., and Lee, K. W.: The determination of bridge displacement using measured acceleration, Journal of Engineering Structures, 27, 371–378, https://doi.org/10.1016/j.engstruct.2004.10.013, 2005.
Paulsen, U. S., Erne, O., and Klein, M.: Modal Analysis on a 500 kW Wind Turbine with Stereo Camera Technique, IOMAC'09 – 3rd International Operational Modal Analysis Conference, available at: http://orbit.dtu.dk/en/publications/modal-analysis-on-a-500-kw-wind-turbine-with-stereo-camera-technique(10b819e0-2d85-45db-8c18-4dfac60523a1).html (last access: 22 May 2018), 2012.
Poozesh, P., Baqersad, J., Niezrecki, C., and Avitabile, P.: A Multi-camera Stereo DIC System for Extracting Operating Mode Shapes of Large Scale Structures, C. Proc. Soc. Exp. Mech., 3, 225–238, https://doi.org/10.1007/978-3-319-22446-6_29, 2016.
Prowell, I., Schmidt, T., Elgamal, A. W., Uang, C. M., Romanowitz, H., and Edward, D. J.: Measuring Global Response Of A Wind Turbine To Simulated Earthquake Shaking Assisted By Point Tracking Videogrammetry, 52nd AIAA/ASME/ASCE/AHS/ASC Structures, Structural Dynamics and Materials Conference, 19th, 4–7 April 2011, Denver, Colorado, https://doi.org/10.2514/6.2011-1946, 2011.
Prowell, I., Uang, C. M., Elgamal, A. W., Luco, J., and Guo, L.: Shake Table Testing of a Utility-Scale Wind Turbine, J. Eng. Mech., 138, 900–909, https://doi.org/10.1061/(ASCE)EM.1943-7889.0000391, 2012.
Siriwardane, S. C.: Vibration measurement-based simple technique for damage detection of truss bridges: A case study, Case Studies in Engineering Failure Analysis, 4, 50–58, https://doi.org/10.1016/j.csefa.2015.08.001, 2015.
Sun, W. and Cooperstock, G. R.: Requirements for Camera Calibration: Must Accuracy Come with a High Price?, Proceedings of the Seventh IEEE Workshop on Applications of Computer Vision (WACV/MOTION'05), https://doi.org/10.1109/ACVMOT.2005.102, 2005.
Trucco, E. and Verri, A.: Introductory Techniques for 3-D Computer Vision, Prentice Hall, New Jersey, USA, 1998.
Tsai, R. Y.: A versatile camera calibration technique for high-accuracy 3d machine vision metrology using off-the-shelf TV cameras and lenses, IEEE Journal Robotics and Automation, 3, 232–344, https://doi.org/10.1109/JRA.1987.1087109, 1987.
Warren, C., Pawan, P., Niezrecki, C., and Avitabile, P.: Comparison of Image Based, Laser, and Accelerometer Measurements, C. Proc. Soc. Exp. Mech., 3, 15–21, https://doi.org/10.1007/978-1-4419-9834-7_2, 2010a.
Warren, C., Niezrecki, C., and Avitabile, P.: Optical Non-contacting Vibration Measurement of Rotating Turbine Blades II, Proceedings of the IMAC-XXVIII, Jacksonville, Florida, USA, https://doi.org/10.1007/978-1-4419-9716-6_4, 2010b.
Weijtjens, W., Verbelen, T., Capello, E., and Devriendt, C.: Vibration based structural health monitoring of the substructures of five offshore wind turbines, Procedia Engineer., 199, 2294–2299, https://doi.org/10.1016/j.proeng.2017.09.187, 2017.
Weng, J., Cohen, P., and Herniou, M.: Camera calibration with distortion models and accuracy evaluation, IEEE T. Pattern Anal., 14, 965–980, https://doi.org/10.1109/34.159901, 1992.
Winstroth, J., Schoen, L., Ernst, B., and Seume, J. R.: Wind turbine rotor blade monitoring using digital image correlation: a comparison to aeroelastic simulations of a multi-megawatt wind turbine, Journal of Physics: Conference Series, 524, https://doi.org/10.2514/6.2014-1396, 2014.
Xia, Z., Zhang, P., Ni, Y., and Zhu, H.: Deformation monitoring of a super-tall structure using real-time strain data, Eng. Struct., 67, 29–38, https://doi.org/10.1016/j.engstruct.2014.02.009, 2014.
Yang, S., Tcherniak, D., and Allen, M. S.: Modal Analysis of Rotating Wind Turbine Using Multiblade Coordinate Transformation and Harmonic Power Spectrum, Conference Proceedings of the Society for Experimental Mechanics Series, Springer, Cham., 7, 77–92, https://doi.org/10.1007/978-3-319-04753-9_8, 2014.
Ye, X. W., Ni, Y. Q., Wong, K. Y., and Ko, J. M.: Statistical analysis of stress spectra for fatigue life assessment of steel bridges with structural health monitoring data, Eng. Struct., 45, 166–176, https://doi.org/10.1016/j.engstruct.2012.06.016, 2012.
Zarouchas, D. and Hemelrijck, D. V.: Mechanical characterization and damage assessment of thick adhesives for wind turbine blades using acoustic emission and digital image correlation techniques, J. Adhes. Sci. Technol., 28, 1500–1516, https://doi.org/10.1080/01694243.2012.698122, 2014.
Zhang, Z.: A flexible new technique for camera calibration, IEEE Transactions on Pattern Analalysis and Machine Intelligence, 22, 1330–1334, https://doi.org/10.1109/34.888718, 2000.