the Creative Commons Attribution 4.0 License.
the Creative Commons Attribution 4.0 License.
 | 22 Aug 2018
Dynamic inflow effects in measurements and high-fidelity computations
Helge Aagaard Madsen
A wind turbine experiences an overshoot in loading after, for example, a collective step change in pitch angle. This overshoot occurs because the wind turbine wake does not immediately reach its new equilibrium, an effect usually referred to as dynamic inflow. Vortex cylinder models and actuator disc simulations predict that the time constants of this dynamic inflow effect should decrease significantly towards the blade tip. As part of the NASA Ames Phase VI experiment, pitch steps have been performed on a turbine in controlled conditions in the wind tunnel. The measured aerodynamic forces from these experiments seemed to show much less radial dependency of the dynamic inflow time constants than expected when pitching towards low loading. Moreover the dynamic inflow effect seemed fundamentally different when pitching from low to high loading, and the reason for this behavior remained unclear in previous analyses of the experiment. High-fidelity computational fluid dynamics and free-wake vortex code computations yielded the same behavior as the experiments. In the present work these observations from the experiments and high-fidelity computations are explained based on a simple vortex cylinder wake model.
- Article
(1309 KB) - Full-text XML
- BibTeX
- EndNote


Models based on blade element momentum (BEM) theory are commonly used in aeroelastic wind turbine codes. Blade element momentum theory describes how the forces acting on the wind slow down its velocity at the rotor disc by superimposing a so-called induced velocity on the free wind speed. The induced velocity depends on the loading of the wind turbine rotor. When the rotor loading changes, for example due to a change in pitch angle, the induced velocity does not immediately reach a new equilibrium value but instead slowly approaches it. Because BEM theory only predicts the steady-state induction, dynamic inflow submodels are added to account for the delays in the induction response. The time constants of these models can be based on analytic derivations, results of higher-fidelity models or measurements. Schepers (2007) compared analytically derived time constants for dynamic inflow with time constants derived from experimental data from the NASA Ames Phase VI measurements (Hand et al., 2001) and numerical results from the free-wake vortex code AWSM (van Garrel, 2003). This comparison showed that the free-wake code could predict the dynamic variations in the turbine loading measured in the wind tunnel with high accuracy. The analytical vortex cylinder model, on the other hand, predicted a strong dependency of the time constants on the radial position on the blade. Neither the experiment nor the free-wake code results confirmed this predicted radial dependency. Investigating this disagreement was suggested as future research by Schepers (2012).
Sørensen and Madsen (2006) also investigated the dynamic inflow runs from the Phase VI experiment. They performed computational fluid dynamics (CFD) simulations using the EllipSys code (Sørensen, 1995). Similar to Schepers, they found that the observed dynamic inflow effects could be predicted by high-fidelity codes, but the radial dependency of the time constants seemed much less pronounced than expected when deloading the rotor. Moreover the effect changed drastically when pitching from low to high loading, which is also in agreement with observations by Schepers. Sørensen and Madsen (2006) suggested using a dynamic inflow model with two time constants and scaling the time constants with the wake velocity. The time constants have been obtained from actuator disc simulations.
More recently, Boorsma et al. (2016) compared results from the AWSM code with dynamic inflow measurements from the New Mexico experiment (Boorsma and Schepers, 2018). While the comparison is promising, the force overshoots are not as pronounced as in the Phase VI experiments due to the lower pitching rate relative to the rotor speed. A recent PhD thesis by Yu (2018) contains both experimental and numerical investigations of dynamic inflow effects. The experimental investigations use discs with varying porosity (Yu et al., 2017), and the numerical model consists of unsteady vortex rings for the near wake and a vortex cylinder model for the far wake (Yu et al., 2016).
In the following section, the NASA Ames experiment and the previous analyses by Schepers and Sørensen and Madsen are presented in more detail. Then, a simple vortex cylinder model is introduced in Sect. 3. In Sect. 4 results from that model are used to explain the seemingly conflicting findings in previous work.
In the NREL/NASA Ames Phase VI Experiments by Hand et al. (2001), a two-bladed wind turbine with 10 m diameter was placed in the NASA Ames open-loop wind tunnel. One of the turbine blades was instrumented at 30 %, 47 %, 63 %, 80 % and 95 % (corresponding to radii of 1.510, 2.343, 3.185, 4.023 and 4.780 m) with 22 pressure taps at each location. A large number of experiments in both parked and rotating conditions have been performed. The basis for the dynamic inflow investigations in Schepers (2007) are pitch step experiments at 5 m s−1 wind tunnel speed and at a rotor speed of 72 rpm. In the relevant run, denoted as Q0500000 in Hand et al. (2001), 20 pitch steps between −5.9∘ pitch (heavily loaded rotor, induction factor a≈0.5) and 10.02∘ pitch (unloaded rotor, a≈0) have been performed. The maximum pitch rate was roughly 66∘ s−1. This pitch rate corresponds to 6.6∘ s−1 for a turbine with 100 m diameter because the dynamic inflow time constants are inversely proportional to the rotor radius (Sørensen and Madsen, 2006). After each pitch step, a 15 s waiting time ensured that the flow conditions can reach an equilibrium. The previous analyses, as well as the present work, are based on the force response obtained by averaging the responses to the 20 pitch steps.
The measurement at 5 m s−1 exhibits prominent aerodynamic force overshoots that are characteristic for dynamic inflow. The dynamic response of the axial force after the upward and downward pitch steps is shown in Fig. 1a and b, respectively. Note that upward pitching refers to the deloading of the rotor and downward pitching to the loading of the rotor. This is based on the convention that the pitch angle is positive towards lower angles of attack. The force is scaled such that the overshoot after the pitch step is 1 and that the steady-state force some time after the pitch step is 0:
where F is the axial force, F2 the equilibrium value of the force some time after the pitch step, and Fm the maximum or minimum force overshoot reached during the pitch step, depending on the pitching direction.
Some dynamics in the downward pitching step at the 80 % radial station and to a much smaller extent at the 63 % radial station appeared before the pitching was finished at roughly 0.35 s. The maximum value at the 80 % section has been increased to 1.2; see Fig. 1b. This was not necessary for the 63 % station because the maximum force overshoot at that station coincided with the remaining stations on the blade. The force response has been previously analyzed by Schepers (2007) and Sørensen and Madsen (2006). This previous work will be introduced in the following.
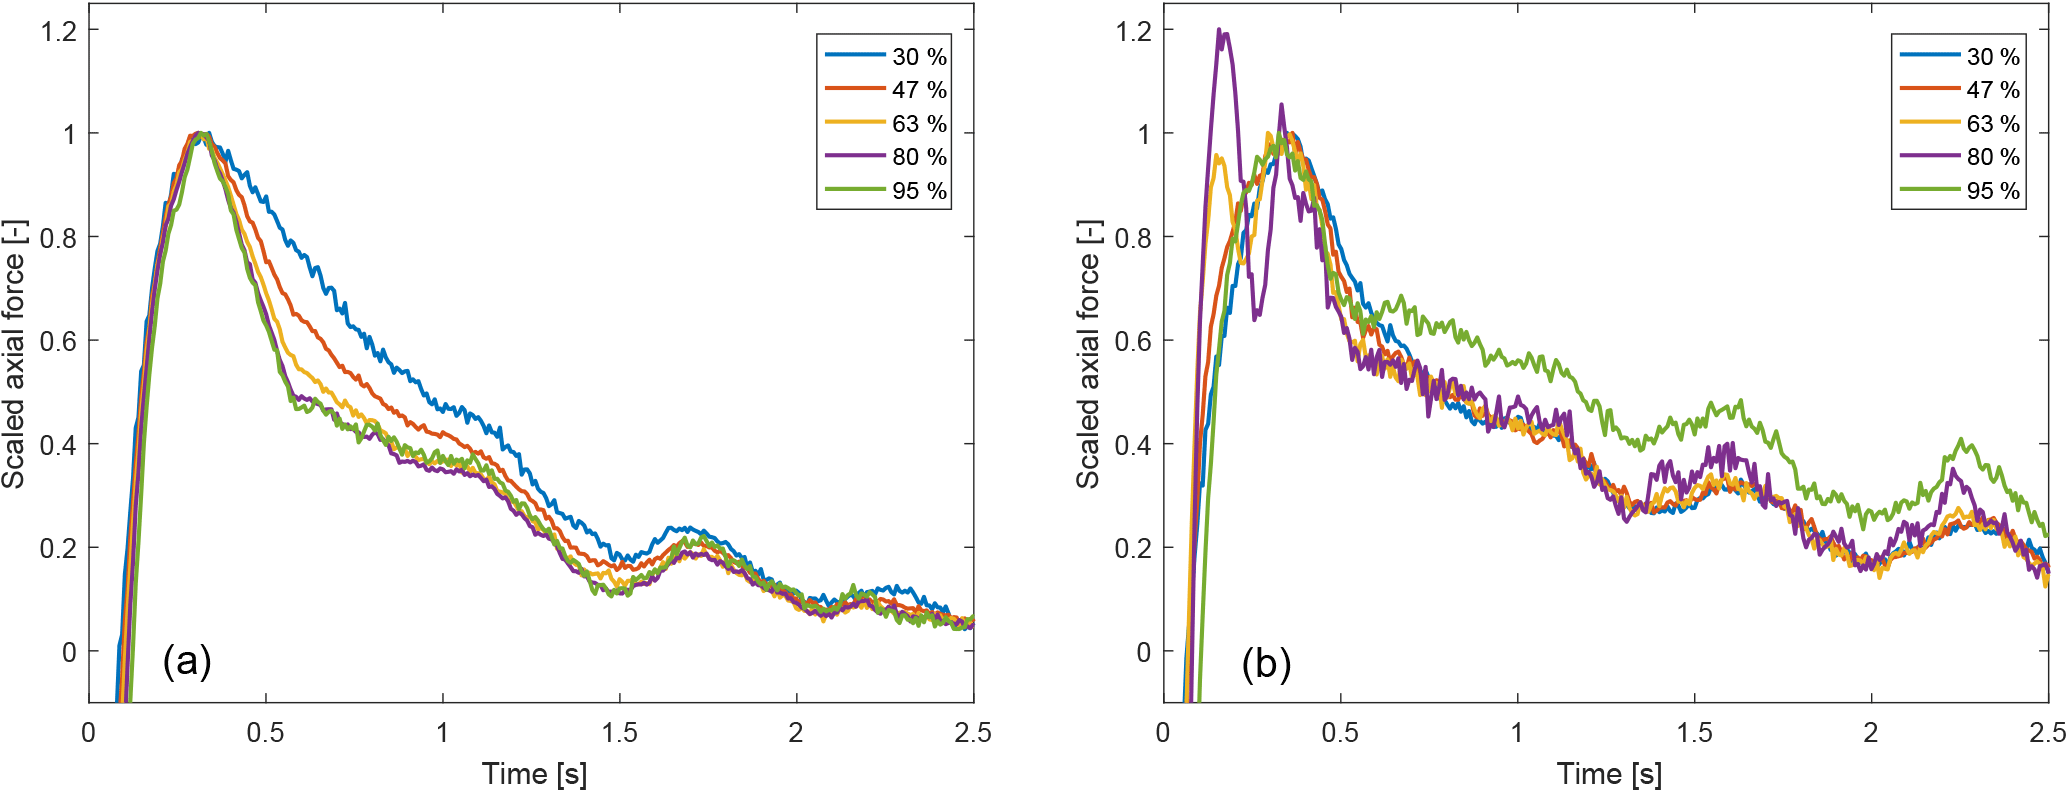
Figure 1Scaled axial force measurements from the Phase VI experiment at 5 m s−1. The pitch steps are deloading the rotor (induction factor from a=0.5 to a=0.0, a) and loading the rotor (a=0.0 to a=0.5, b).
2.1 Single time constant analysis by Schepers
In the work by Schepers (2007) it was assumed that the behavior of the induction factor a in time can be modeled using one first-order low-pass filter. For a step change in pitch, the induction factor as a function of time is assumed to be:
where a1 is the induction factor at t1, before the pitch step, and a2 is the equilibrium value of the induction some time after the pitch step. The time constant is defined as τ. It is then assumed that the forces are driven only by the change in axial induction factor, neglecting the faster 2-D unsteady airfoil aerodynamics effects. This leads to an expression for the blade loads F:
where F1 and F2 are the forces corresponding to the induction factors a1 and a2 defined above. The time constant τ can be determined as
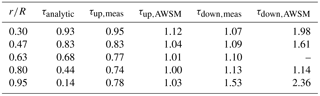
To avoid the initial overshoot and structural transients, this time constant was averaged between 0.7 and 3.7 s after the pitch step in Schepers (2007) for measurements (see Fig. 1) and free-wake code computations using the code AWSM (van Garrel, 2003). The computed time constants were then compared to the time constants obtained from a cylindrical wake model; see Sect. 3. This comparison is shown in Table 1. Comparing the time constants in the table leads to several observations:
-
For both the upward and downward pitching case, the time constants based on measurements and on free-wake code computations vary much less with radial position than the analytically derived time constants predicted by the cylindrical wake model.
-
While the analytically derived time constants predict that the induction develops the fastest at the 95 % section, this cannot be seen in the measurements or AWSM computations. In the downward pitching case, the tip time constants are even found to be largest at the blade tip.
-
The analytic time constants, which are based on the undisturbed inflow speed, are independent of the pitching direction, but there is considerable influence of the pitching direction on the dynamics seen in the measurements (Fig. 1) and free-wake computations.
Table 1Time constants (in seconds) from measurements, AWSM calculations and a cylindrical wake model from Schepers (2007). The forces predicted by AWSM at the 63 % radial station for the downward pitching step did not exhibit clear exponential behavior, and therefore no time constant could be estimated.
2.2 Analysis of two time constants by Sørensen and Madsen
The NASA Ames Phase VI dynamic inflow measurements were also analyzed by Sørensen and Madsen (2006). In their work the results were compared to full rotor CFD computations obtained from the EllipSys code (Sørensen, 1995) and BEM computations with a dynamic inflow model. The dynamic inflow model consists of two time constants, where the fast time constant is radially varying and the slow time constant has much slower radial variation. These time constants were obtained from actuator disc simulations, and they are scaled with the wake velocity vw:
In the above equation, v∞ is the undisturbed inflow speed and R is the wind turbine radius. The same scaling is applied to both the fast and the slow time constant.
The CFD computations agree well with the measurements showing a small radial variation in the time constants in general. In the CFD computations of the downward pitch step, loading the rotor, it was found that the tip forces seem to develop the slowest.
In a range of additional pitch step cases with a much smaller pitch angle variation computed by the CFD code, the radial variation in the dynamic inflow time constants also appeared to be much less pronounced than in the actuator disc simulations.
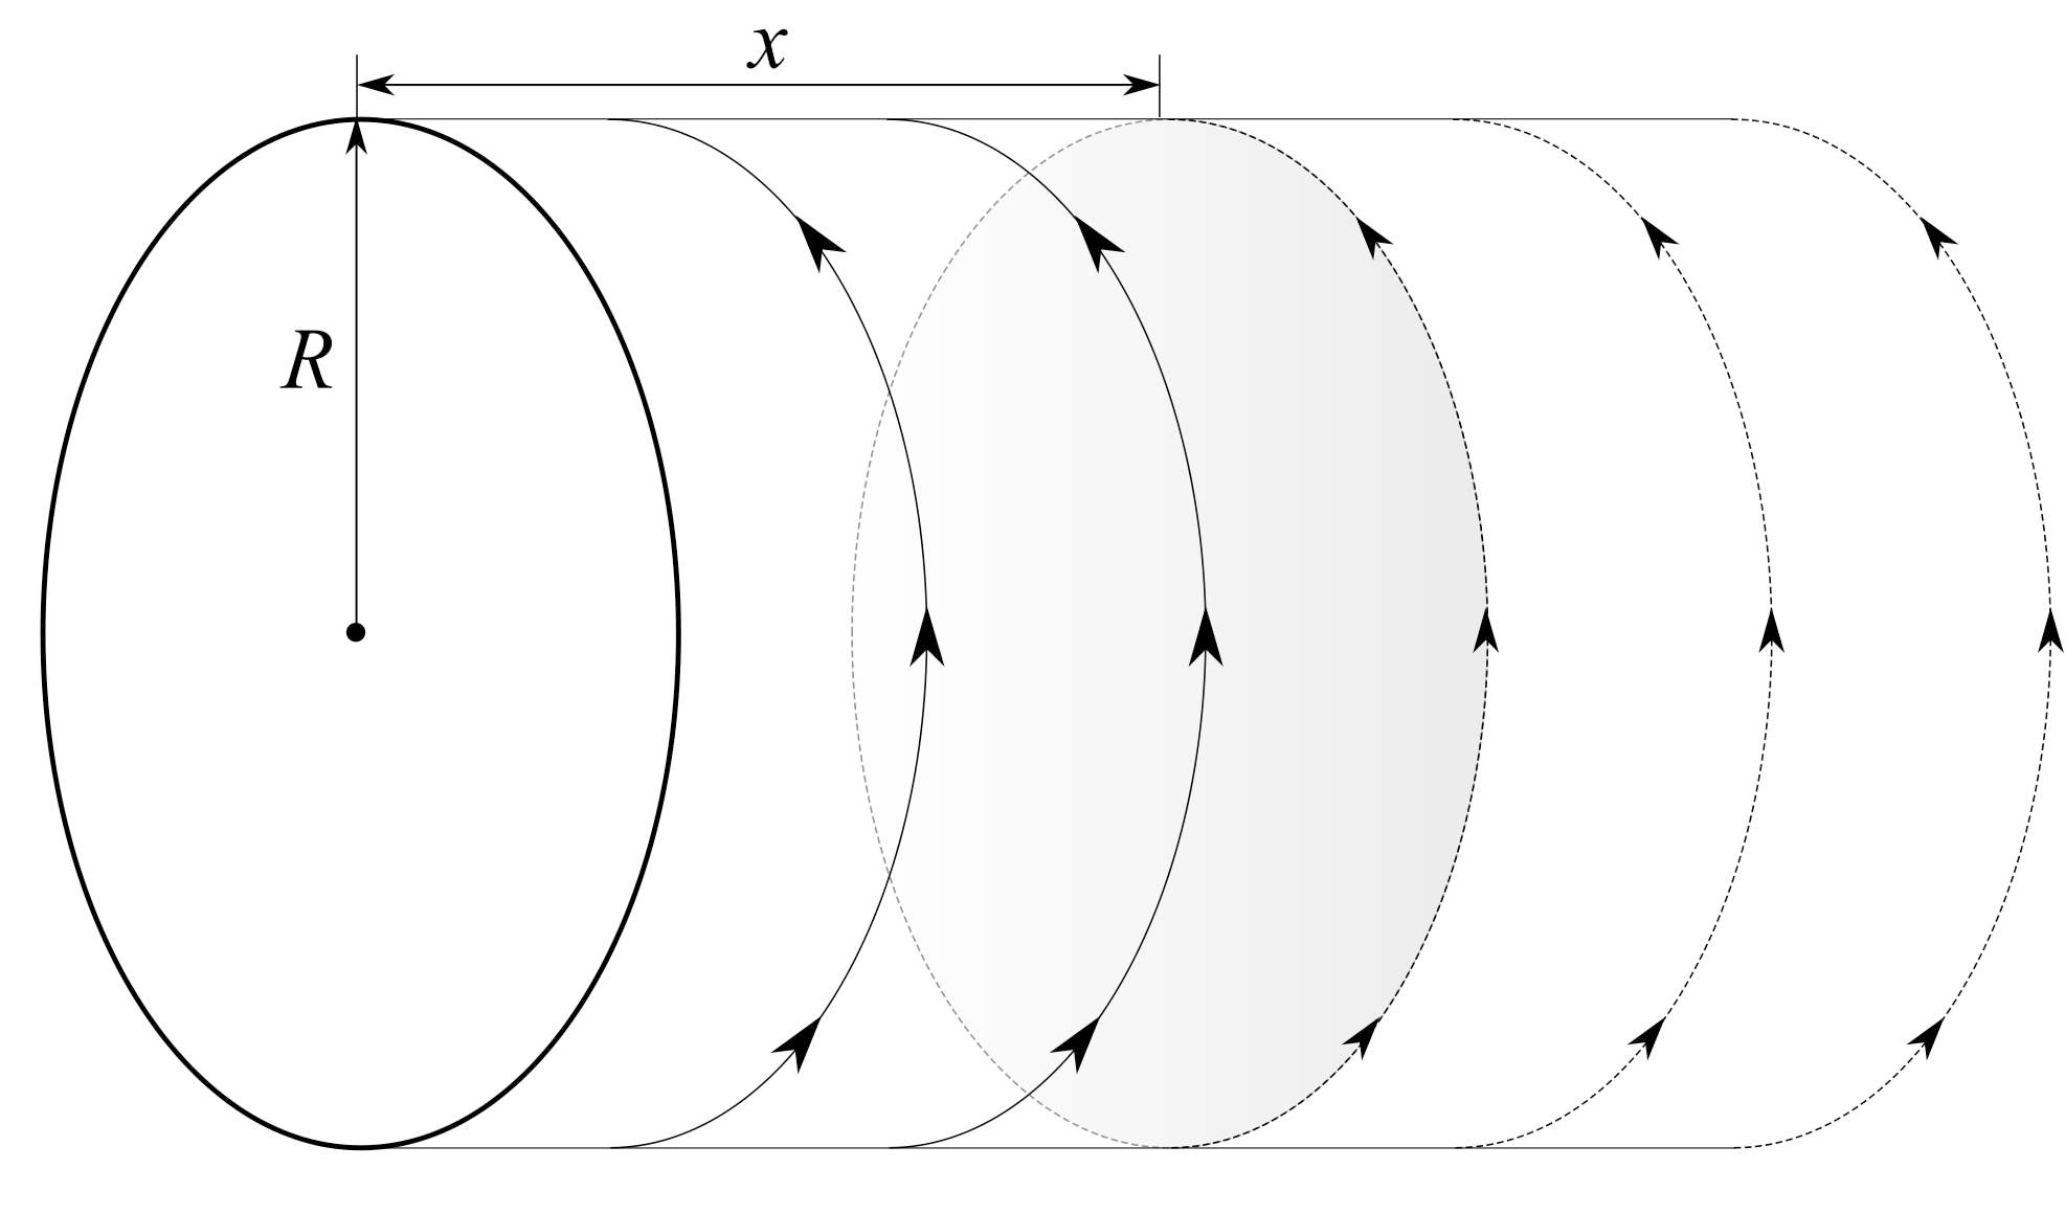
Figure 2Sketch of cylindrical wake with radius R and a step change in vortex strength at a distance x from the rotor.
The engineering model that predicts the strong radial dependency of the time constants in Schepers (2007) is based on an analytical cylindrical vortex wake model. In this model, which has been presented by Snel and Schepers (1995), a semi-infinite cylindrical vortex is trailed from the tip radius at the rotor disc. Thus it is assumed that the rotor has an infinite number of blades with a radially constant bound circulation, and the root vortex is neglected. The induction from the trailed vortex cylinder is azimuth independent in the rotor plane but can vary radially. A sketch of the cylindrical wake is shown in Fig. 2.
The axial induced velocity ui at a radius r on the disc due to such a cylindrical wake is (Snel and Schepers, 1995)
where x is the stream-wise coordinate, with xend denoting the length of the wake behind the rotor plane, and ϕ is the azimuthal coordinate. The rotor radius is denoted as R and γt is the tangential component of the wake vorticity, which induces an axial velocity in the rotor plane.
Previously this model was used to analytically derive the time constant for a step change in circulation at the rotor disc, which is transported downstream with the free-stream velocity. In the present work, the position of the step change is varied and the wake velocity vw (see Eq. 5), is chosen as the downstream convection velocity. Equation (6) is integrated numerically.
3.1 Assumptions
The aim of the vortex cylinder computations presented here is to demonstrate that some of the fundamental questions from the NASA Ames Phase VI experiment and regarding dynamic inflow in general can be answered based on a very simple model. Therefore the following assumptions are made, neglecting some aerodynamic effects:
-
The vortex strength of the cylindrical vortex wake changes from zero to a constant value at t=0.
-
Two-dimensional unsteady airfoil aerodynamics and dynamic stall are neglected. To justify this, the force response to a step change in angle of attack has been computed using Jones' equations for a flat plate and the relative speeds at the disc. After 0.35 s (corresponding roughly to the pitch step duration), the force response reaches between 90 % (most-inboard section) and 99 % (tip section) of its quasi-steady value, showing that this effect is much faster than the dynamic inflow effect.
-
Pitching speed is neglected.
-
-
The downwind convection velocity of the trailed vortices is constant and equal to the wake velocity before the pitch step as given in Eq. (5). Therefore, the results at a time soon after the pitch step will be accurate, but the error grows over time.
-
Wake expansion is neglected, which introduces an error in the heavily loaded case.
Further, in all plots the induced velocities ui at each radial station are scaled by the value ui,∞ they reach if the wake is 10 diameters long.
Figure 3 shows the induction as function of the dimensionless length of the cylindrical vortex wake behind the rotor. As written above, a constant downwind convection velocity is assumed in the computations. In the unloaded case (a=0), this velocity is vw=5 m s−1 . Therefore the dimensionless length of the wake in the unloaded case corresponds directly to the time, since the wake length after 1 s is 1 radius (). In the loaded case (a=0.5) the wake velocity is 4 times smaller (see Eq. 5); thus, the nondimensional wake length has to be multiplied by a factor of 4 to obtain the time.

Figure 3Normalized induced velocity at different radial stations depending on the length of the vortex wake behind the rotor plane. The dashed lines correspond to a time instant t=0.35 s when the wake velocity is 1.25 m s−1 (left vertical line, corresponding to a=0.5) and 5 m s−1 (right vertical line, corresponding to a=0.0).
The induced velocity buildup clearly shows a large radial dependency at the beginning, but for a larger distance of the vorticity step change from the rotor disc, the radial dependency disappears. Then the dynamic induction buildup is similar on the whole disc.
4.1 Single time constant estimation
Based on Eqs. (2)–(4), the estimated time constant of a one-term exponential function can be found as
Because the predicted time histories are not equal to one-term exponential functions, the predicted time constants vary with time.
Applying Eq. (7) to the induced velocities shown in Fig. 3 leads to the estimated time constants as a function of the dimensionless length of the vortex wakes, which are shown in Fig. 4. At , the time constants predicted by the cylindrical wake model are equal to the analytically derived time constants provided by Schepers (2007); cf. Table 1. As the values of x0∕R increase, the estimated time constants become less radially dependent because the parts of the wake that are further away from the rotor have a more even influence on the whole rotor plane than the parts close to the rotor. In agreement with the actuator disc computations presented by Sørensen and Madsen (2006), these findings indicate that a dynamic inflow model should employ two exponential terms. Then a small time constant can capture the radial dependency, and a larger time constant captures the radially independent behavior on a longer timescale.
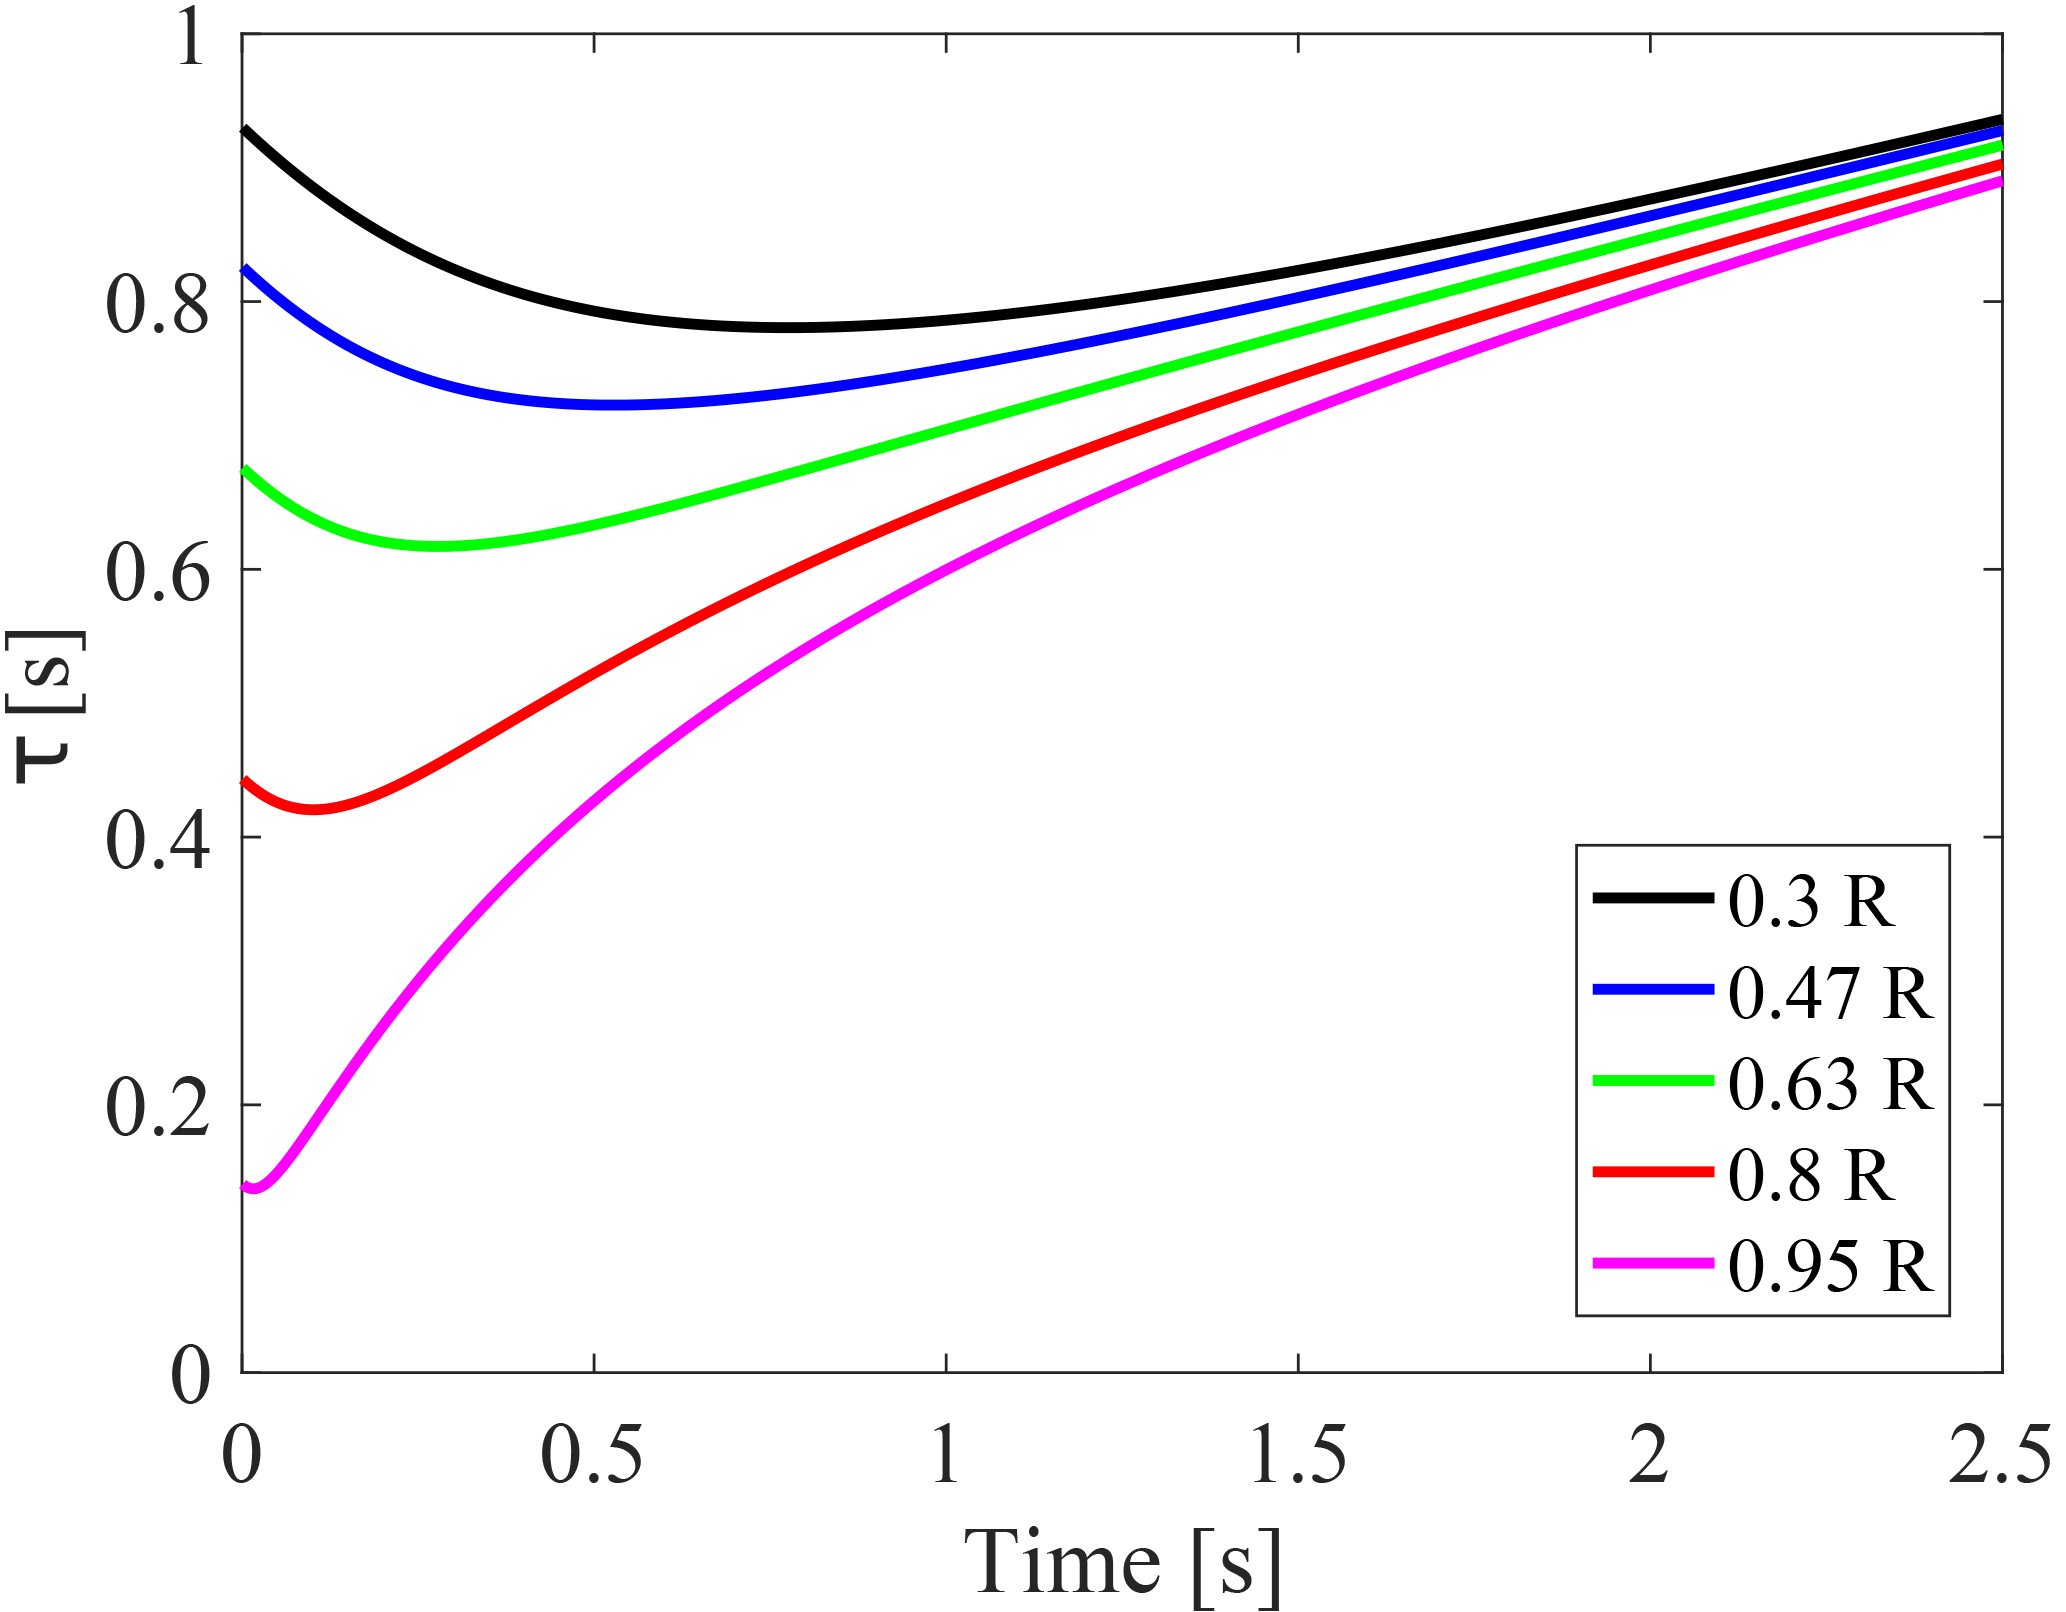
Figure 4Estimated dynamic inflow time constants at different radial stations depending on the length of the vortex wake behind the rotor plane.
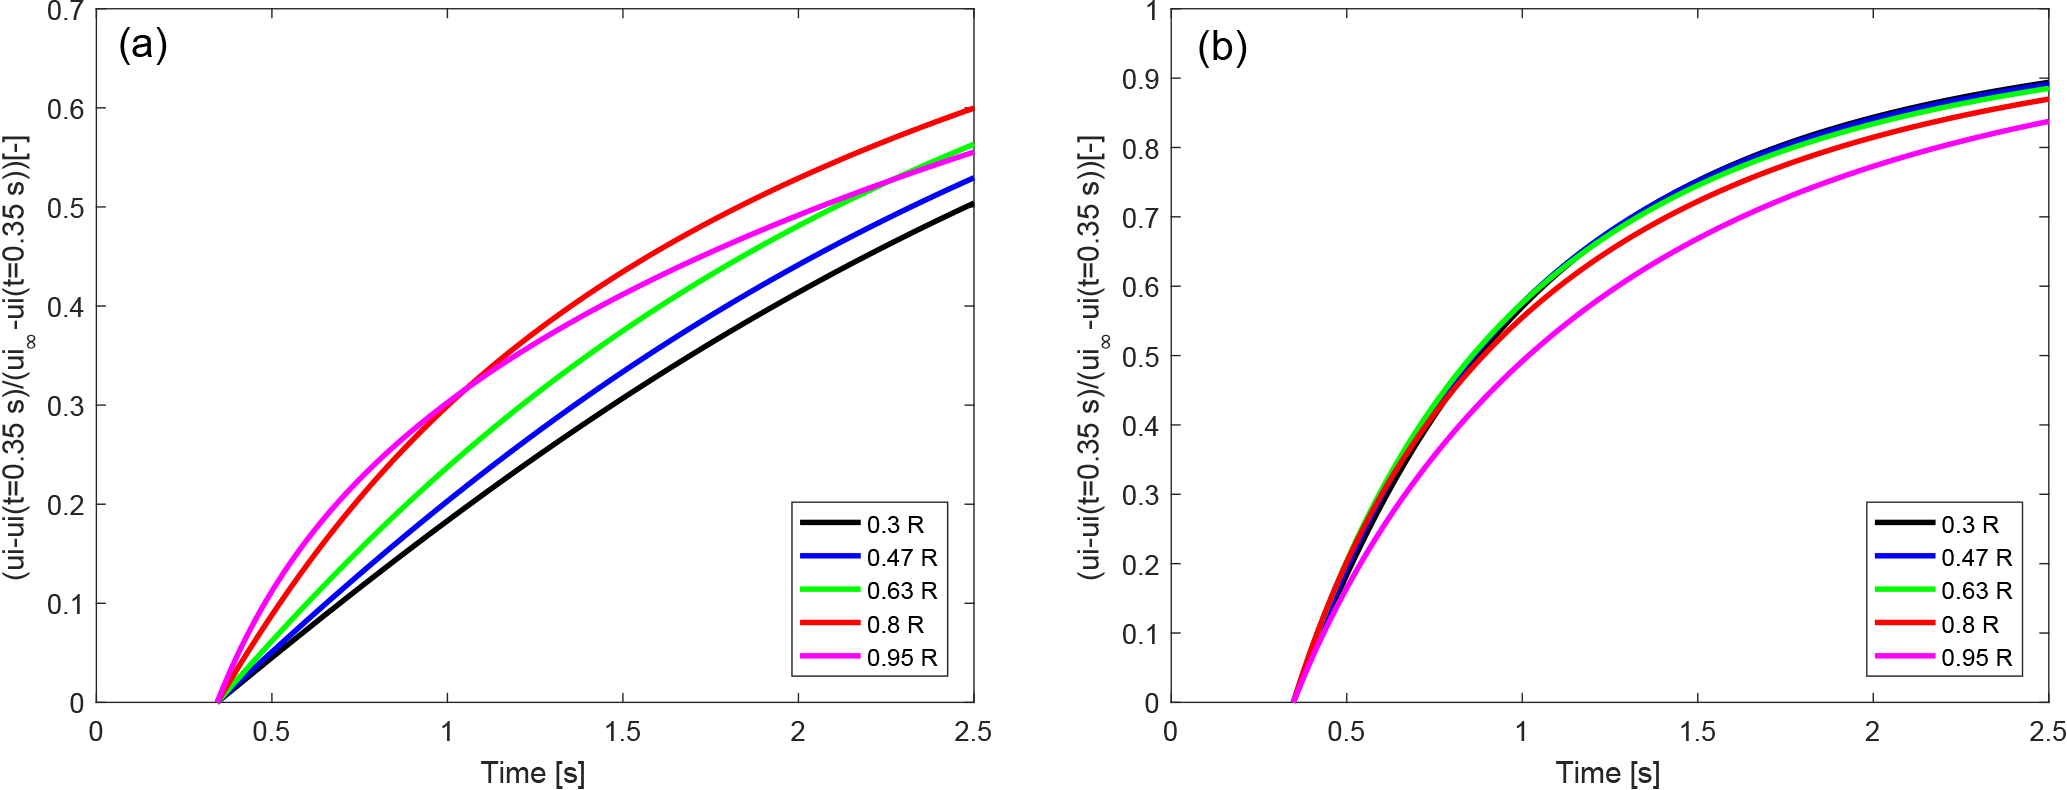
Figure 5Scaled induced velocities predicted by the cylindrical wake model for the deloading (a) and loading (b) of the rotor. The scaling is such that the velocities range from 0 at the time instant just after the maximum force overshoot (indicated by dashed vertical lines in Fig. 3) to 1. The scaled induced velocities show the same qualitative trends as observed in the force measurements; see Fig. 1.
In Schepers (2007), the time constants obtained from the aerodynamic forces from measurements and free-wake code results had to be averaged between t=0.7 and t=3.7 s after the pitching step to avoid the initial force overshoot. The time constant estimation in Fig. 4 shows how this method leads to moderate radial dependency, which explains some of the disagreements between analytical time constants and time constants estimated from measurements in Table 1.
4.2 Influence of pitching direction
Due to the assumption of a constant wake velocity and trailed vortex strength, the different pitching directions only differ in how the wake length translates to the time after the pitch step, as explained at the beginning of Sect. 4. The force response decay in the Phase VI measurements can only be evaluated after the maximum of the force overshoot is reached, which is at roughly 0.35 s; see Fig. 1. This 0.35 s corresponds to a nondimensional wake length x∕R of either 0.35 (pitching from unloaded to loaded conditions) or 0.0875 (pitching from loaded to unloaded conditions), as indicated by the dashed lines in Fig. 3. To see what influence this delayed evaluation has, the induced velocity has been rescaled such that the value at 0.35 s corresponds to 0 and the value at steady state to 1. These rescaled induced velocities are shown in Fig. 5. For the pitch step starting in loaded conditions (panel a) a clear radial dependency of the induced velocities is seen, which develops slowly inboard and faster outboard. In panel b, where the rotor is not loaded before the pitch step, the induced velocity seems to develop similarly fast for all sections except the tip sections, where the development is slowest. A comparison with the scaled measured force response in Fig. 1 shows the same influence of the pitching direction. This indicates that the dynamic inflow effect is mainly governed by the downstream convection speed of the tip vortices. Further, the decreased or reversed radial dependency in the force measurements from the NASA Ames Phase VI experiment does not contradict the radial dependency in the induced velocity time constants that is expected from previous investigations using vortex cylinder models and actuator discs. Instead, the apparent reversal of the radial time constant dependency with pitching direction is observed because the decay of the dynamic forces can only be analyzed some time after the pitch step is completed. At this time, the induced velocity has already developed considerably, which has a large influence on the size of the overshoot. This initial induced velocity development is missed when estimating time constants on the scaled time history of the forces.
This conclusion holds also if the force time series are obtained from CFD simulations. Another option is to use dynamic inductions from the CFD solution to estimate the time constants. However, a recent comparison has shown that there is still considerable uncertainty in induced velocities from CFD towards the root and tip of the blade (Rahimi et al., 2018). This uncertainty complicates the estimation of the radially varying dynamic inflow time constants. Jost et al. (2018) state the following on the comparison between BEM based models and CFD:
While the approach for loads with respect to the rotor-plane coordinate system such as distributed driving force or thrust is straightforward, a comparison of aerodynamic characteristics is more challenging.
They present a promising methodology for extracting the unsteady induced velocities that can capture the increasing induction towards the blade tip.
The induced velocities at the blades or at an actuator disc are directly available in vortex codes. Yu (2018) has developed an engineering dynamic inflow model based on results from a combined unsteady vortex ring and vortex cylinder model. The behavior of the unsteady cases investigated in Yu's thesis was such that the increasing load case reacted slower than the decreasing load case. This appears to contradict the results from the Phase VI measurements at first glance, but the cases were fundamentally different: the increasing load case is defined as moving from middle to high loading and the decreasing load case from middle to low loading. Thus, the average wake velocity is lower in the increasing load case, leading to a slower dynamic inflow response. In the Phase VI experiments, the pitch steps change the load from low to high and high to low. Then the wake velocity before the pitching step governs the immediate dynamic inflow response and the case with increasing load responds faster. Also, Yu was able to study the effects of a rollup of the vortex rings, which would not be possible with the simple model used in the present work. This shows the importance of using higher-fidelity models for more detailed investigations.
A simple vortex wake model has been used to investigate the question why neither the unsteady NASA Ames Phase VI experiments nor the corresponding high-fidelity simulations showed the expected radial dependency of the dynamic inflow time constants. Results from the model show that the dynamic inflow response initially exhibits a strong radial dependency, but a short time after the step change in loading, the time constants for the different stations become similar, suggesting that two time constants are necessary for accurate modeling of dynamic inflow effects. When using the force response as a basis for time constant investigations, time constants can only be analyzed shortly after the pitch step when the forces start decaying from the maximum overshoot. This delayed analysis obscures some of the fast induction development and can lead to an apparent decreased or even reversed radial dependency.
This indicates that it is difficult to obtain time constants for dynamic inflow models based only on the force time series from measurements, CFD or free-wake vortex code simulations of a wind turbine. These force measurements and computations, though, have a large value in validating the aerodynamic force predictions from engineering models. Computing unsteady induced velocities from CFD simulations is an active field of research, and there is still some uncertainty, especially towards the blade root and tip. Free-wake vortex codes, on the other hand, could be used more easily to investigate dynamic inflow effects and to tune engineering models because the induced velocity is directly available from the computations.
GP wrote the numerical code. GP and HM interpreted the results. GP wrote the manuscript with support from HM. GP and HM collaborated on the revisions.
The authors declare that they have no conflict of interest.
The work has been carried out within the project “Dansk deltagelse i IEA
Wind Task 29 Mexnext III” granted by the Danish funding agency EUDP, grant
journal no. 64014-0543.
Edited by: Raúl Bayoán Cal
Reviewed by: two anonymous referees
Boorsma, K. and Schepers, J. G.: New Mexico Experiment, Description of experimental setup, Tech. Rep. ECN-X–15-093 (v3), ECN, 2018. a
Boorsma, K., Hartvelt, M., and Orsi, L.: Application of the lifting line vortex wake method to dynamic load case simulations, J. Phys. Conf. Ser., 753, 2, https://doi.org/10.1088/1742-6596/753/2/022030, 2016. a
Hand, M., Simms, D., Fingersh, L., Jager, D., Cotrell, J., Schreck, S., and Larwood, S.: Unsteady aerodynamics experiment phase VI: wind tunnel test configurations and available data campaigns, NREL/TP-500-29955, National Renewable Energy Laboratory Golden, Colorado, USA, 2001. a, b, c
Jost, E., Klein, L., Leipprand, H., Lutz, T., and Krämer, E.: Extracting the angle of attack on rotor blades from CFD simulations, Wind Energy, https://doi.org/10.1002/we.2196, online first, 2018. a
Pirrung, G. R.: Aerodynamics code used in Wind Energy Science paper “Dynamic inflow effects in measurements and high-fidelity computations”, https://doi.org/10.5281/zenodo.1346717, 2018. a
Rahimi, H., Schepers, J. G., Shen, W. Z., Ramos García, N., Schneider, M., Micallef, D., Ferreira, C., Jost, E., Klein, L., and Herréz, I.: Evaluation of different methods for determining the angle of attack on wind turbine blades with CFD results under axial inflow conditions, Renew. Energ., 125, 866–876, https://doi.org/10.1016/j.renene.2018.03.018, 2018. a
Schepers, J. G.: IEA Wind Task XX: Dynamic Inflow effects at fast pitching steps on a wind turbine placed in the NASA-Ames wind tunnel, ECN-E-07-085, 2007. a, b, c, d, e, f, g, h, i
Schepers, J. G.: Engineering models in wind energy aerodynamics: Development, implementation and analysis using dedicated aerodynamic measurements, TU Delft, Delft University of Technology, PhD thesis ISBN 9789461915078, 2012. a
Snel, H. and Schepers, J. G.: Joint investigation of dynamic inflow effects and implementation of an engineering method, Tech. Rep. ECN-C–94-107, ECN, 1995. a, b
Sørensen, N.: General purpose flow solver applied to flow over hills, PhD thesis, published 2003, 1995. a, b
Sørensen, N. N. and Madsen, H. A.: Modelling of transient wind turbine loads during pitch motion, European Wind Energy Association (EWEA), 2006 European Wind Energy Conference and Exhibition, Athens, Greece, 2006. a, b, c, d, e, f
van Garrel, A.: Development of a wind turbine aerodynamics simulation module, Tech. Rep. ECN report ECN-C–03-079, ECN, 2003. a, b
Yu, W.: The wake of an unsteady actuator disc, PhD thesis, Delft University of Technology, https://doi.org/10.4233/uuid:0e3a2402-585c-41b1-81cf-a35753076dfc, 2018. a, b
Yu, W., Ferreira, C. S., Kuik, G., and Baldacchino, D.: Verifying the Blade Element Momentum Method in unsteady, radially varied, axisymmetric loading using a vortex ring model, Wind Energy, 20, 269–288, https://doi.org/10.1002/we.2005, 2016. a
Yu, W., Hong, V. W., Ferreira, C., and van Kuik, G. A. M.: Experimental analysis on the dynamic wake of an actuator disc undergoing transient loads, Exp. Fluids, 58, 149, https://doi.org/10.1007/s00348-017-2432-9, 2017. a