the Creative Commons Attribution 4.0 License.
the Creative Commons Attribution 4.0 License.
 | 28 Aug 2019
Multi-element ducts for ducted wind turbines: a numerical study
Francesco Avallone
Ozer Igra
Gerard van Bussel
Multi-element ducts are used to improve the aerodynamic performance of ducted wind turbines (DWTs). Steady-state, two-dimensional computational fluid dynamics (CFD) simulations are performed for a multi-element duct geometry consisting of a duct and a flap; the goal is to evaluate the effects on the aerodynamic performance of the radial gap length and the deflection angle of the flap. Solutions from inviscid and viscous flow calculations are compared. It is found that increasing the radial gap length results in an augmentation of the total thrust generated by the DWT, whereas a larger deflection angle has an opposite effect. Reasonable to good agreement is seen between the inviscid and viscous flow calculations, except for multi-element duct configurations characterized by large flap deflection angles. The viscous effects become stronger at large flap deflection angles, and the inviscid calculations are incapable of taking this phenomenon into account.
- Article
(6166 KB) - Full-text XML
-
Supplement
(147528 KB) - BibTeX
- EndNote


Ducted wind turbines (DWTs) represent an interesting technological solution for increasing energy extraction with respect to conventional horizontal-axis wind turbines (HAWTs) for a given rotor radius and free-stream velocity (de Vries, 1979). DWTs consist of a rotor and a duct; the role of the latter is to increase the mass flow rate through the rotor relative to a similar rotor operating in the open atmosphere, thereby increasing the generated power. There is more than one explanation for how this occurs. One explanation, as stated by van Bussel (2007), is that the duct forces an expansion of flow downstream of the turbine beyond what is attainable for a bare wind turbine. This provides reduced pressure on the downstream of the turbine, thereby increasing the total mass flow through the turbine. A second explanation, as argued by de Vries (1979), is that if the sectional lift force of the duct is directed towards the turbine plane, then the associated circulation of the duct induces an increased mass flow through the turbine. This solution is particularly suited for urban areas where the radius of the rotor is a constraint and the free-stream velocity is low due to the presence of buildings. van Bussel (2007), using a one-dimensional momentum theory approach, found that the maximum power coefficient obtained by a DWT can exceed the Betz limit by a factor of 2.5. The best aerodynamic performance for a DWT can be achieved by increasing the duct expansion ratio (Liley and Rainbird, 1956; Foreman et al., 1978; Loeffler and Vanderbilt, 1978; Foreman and Gilbert, 1984; Samson and Katebi, 2014). As a drawback, for a duct with a large ratio of duct outlet to rotor area, flow separation along the duct inner walls might be present (Aranake et al., 2015; Dighe et al., 2018a). Tang et al. (2018) experimentally investigated the effects of variable duct expansion ratios on the aerodynamic performance of DWTs. They found that increasing the expansion ratio over a certain limit results in a power reduction. This was linked to the appearance of flow separation within the inner walls of the duct. An alternative approach to improve the aerodynamic performance is to increase the camber of the airfoil, used as a cross section of the duct, until separation occurs behind the rotor plane (Dighe et al., 2019). Since, as expected, flow separation has an undesired effect, solutions to prevent flow separation via active boundary layer control techniques have been proposed (Igra, 1977; Foreman et al., 1978; Abe and Ohya, 2004). However, the performance benefits were limited by the cost of the active system and its installation.
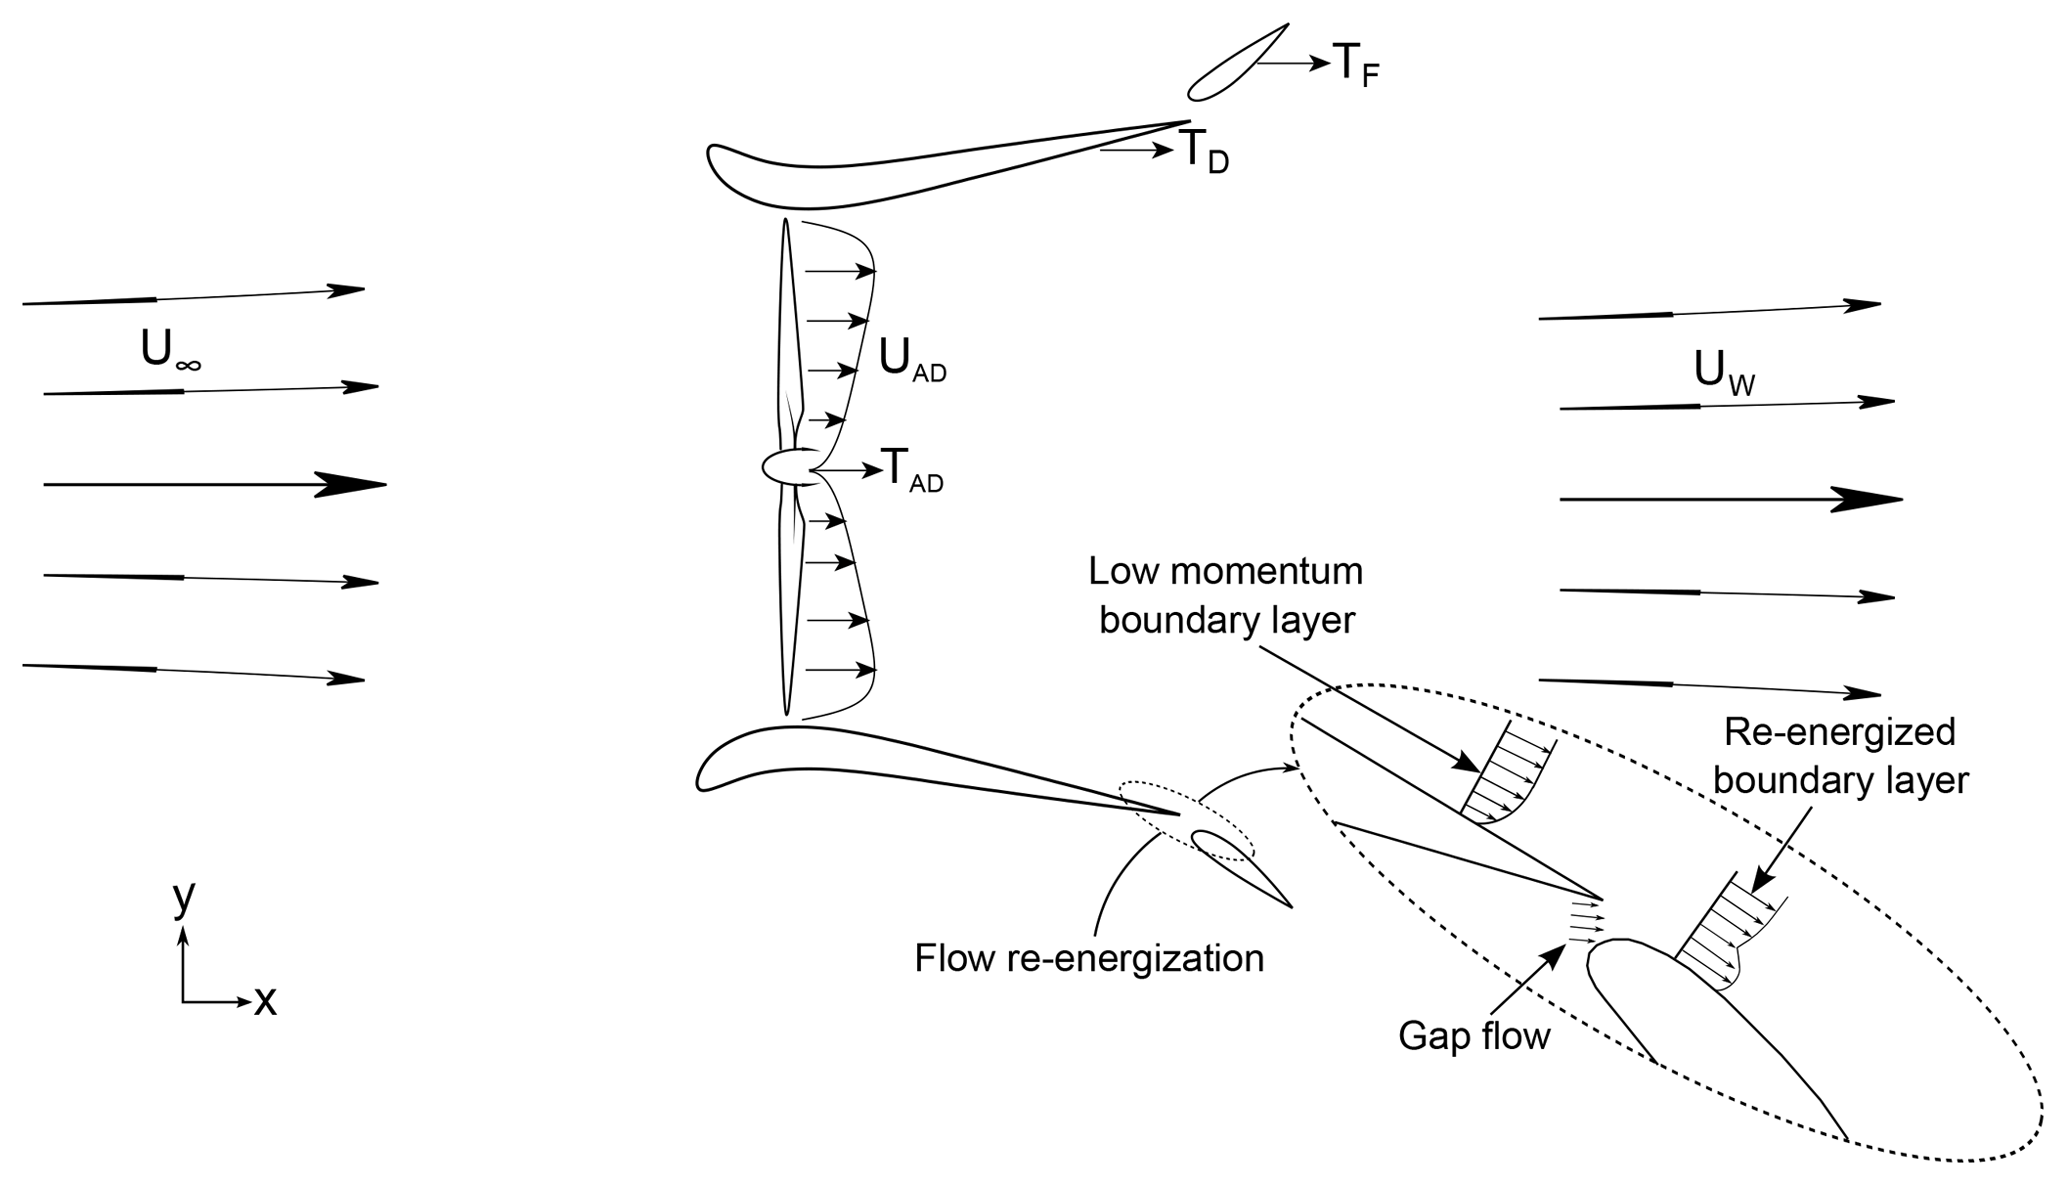
Another possible solution to improve the aerodynamic performances of DWTs, which has only been explored to a very limited extent, consists of using a duct with a flap (i.e., a multi-element duct). The flap is realized as a secondary duct with a small chord airfoil cross section mimicking high-lift devices for aircraft wing (see Fig. 1). A first theoretical and experimental analysis of DWTs with a flap was carried out by Foreman et al. (1978) and Igra (1981). The latter found that the addition of a flap improves the DWT aerodynamic performance by 25 % with respect to a single duct. The flap inhibits flow separation along the inner duct wall and increases the camber of the equivalent airfoil, thus being beneficial for the aerodynamic performances of the DWT (Dighe et al., 2019). The literature, however, is missing a detailed parametric study that investigates the effect of flap installation setting, i.e., the radial location and its angle of attack, on the total power generated by a DWT.
The goal of this paper is to conduct a parametric study to investigate the effect of the installation settings of the flap on the aerodynamic performance of a multi-element DWT. This is performed using computational fluid dynamics (CFD). To this aim, a reference multi-element duct is selected and the rotor is simulated by a uniformly loaded actuator disk (AD) model. The rest of the paper is organized as follows. Section 2 reports the most relevant nondimensional coefficients adopted for characterizing the multi-element duct–AD model. Section 3 details the verification and validation of the numerical methods against experimental findings. Section 4 describes the computational settings and parameters with a brief description of the numerical methodology. The dependence of the nondimensional coefficient on the flap installation settings is discussed in Sect. 5. Finally, the most relevant results are summarized in the conclusions.
The incompressible flow past a wind turbine is computed by substituting the rotor with an AD of infinitesimal width. The AD exerts a uniform thrust force TAD per unit area. Then, the nondimensional thrust force coefficient is
where ρ is the fluid density, U∞ is the free-stream velocity and SAD is the AD area.
TAD is obtained by forcing a uniform pressure drop across the AD, . The pressure drop Δp is taken from experiments and is given as an input parameter to the numerical simulations. The mean velocity across the AD, UAD, is obtained by integrating the difference of the streamwise velocity component across the AD surface Ux:
Then, the power coefficient is
For a multi-element duct–AD configuration, additional thrust forces are exerted by the duct and the flap. Then, the total thrust force T is the vectorial sum of the AD thrust force TAD and the axial thrust force exerted by the duct TD and the flap TF. It can be written as
The total thrust coefficient is then defined as
where CT,M is the multi-element duct thrust coefficient.
To highlight the relative contribution of the multi-element duct thrust TM and the AD thrust TAD to the total thrust T, a dimensionless thrust factor τ is introduced (Bontempo and Manna, 2016):
so that the total thrust coefficient can be written as
Following Bontempo and Manna (2016), the normalized axial velocity at the AD for a ducted configuration can be also expressed as a function of the thrust coefficient:
Using Eqs. (3) and (8), the power coefficient of the multi-element duct–AD model considering SAD as the reference area can be written as
In Eq. (9), CP indicates the power coefficient of the multi-element duct–AD model. The above relation is also valid for a simple AD model setting τ=0:
Equations (9) and (10) can be used to evaluate the contribution of the multi-element duct through a power augmentation parameter r:
Equation (11) states that r for a multi-element duct–AD model is proportional to the ratio between the multi-element duct thrust coefficient CT,M and the AD thrust coefficient CT,AD. Thus, if τ>0, then a higher power coefficient can be obtained for a multi-element DWT in comparison to a HAWT with the same rotor. The performance coefficients described above were evaluated by means of axial momentum theory (AMT) for DWTs by van Bussel (2007). However, the AMT cannot be used to estimate the performance of the duct–AD model for a prescribed CT,AD and a given duct geometry. This problem can be solved using numerical solutions based on panel and RANS (Reynolds-averaged Navier–Stokes) methods (Bontempo and Manna, 2016; Dighe et al., 2019).
For validating the numerical methods, experimental data reported by Igra (1977) were simulated. Igra's experiments were conducted in the subsonic wind tunnel of Israel Aerospace Industries (formerly Israel Aircraft Industry); this tunnel has a large test section that measures 3.6 m × 2.6 m.
Eight different geometries were investigated experimentally, but only two geometries are used for the validation study. The two geometries are a duct–AD model with (Model B) and a multi-element duct–AD model with (Model C (ii) + flap). A schematic of the cross sections of the two geometries is shown in Fig. 2. The longitudinal cross section of the duct and of the flap is a NACA 4412 airfoil. The leading edges of both duct geometries are identical. For Model C (ii) + flap, the trailing edge of the duct is radially stretched, resulting in a duct expansion ratio ; this ratio is 1.71 for Model B. The flap chord measures 35 % of the duct chord length, c, and the deflection angle θ=30∘ with respect to the free-stream direction. The experimental dataset consists of static pressure distribution at different axial and radial positions, as well as forces generated by the duct and the flap surfaces. During the experiments, the inflow velocity was set at U∞=32 m s−1, corresponding to . Following Igra (1977), the wall interference and blockage correction can be ignored.
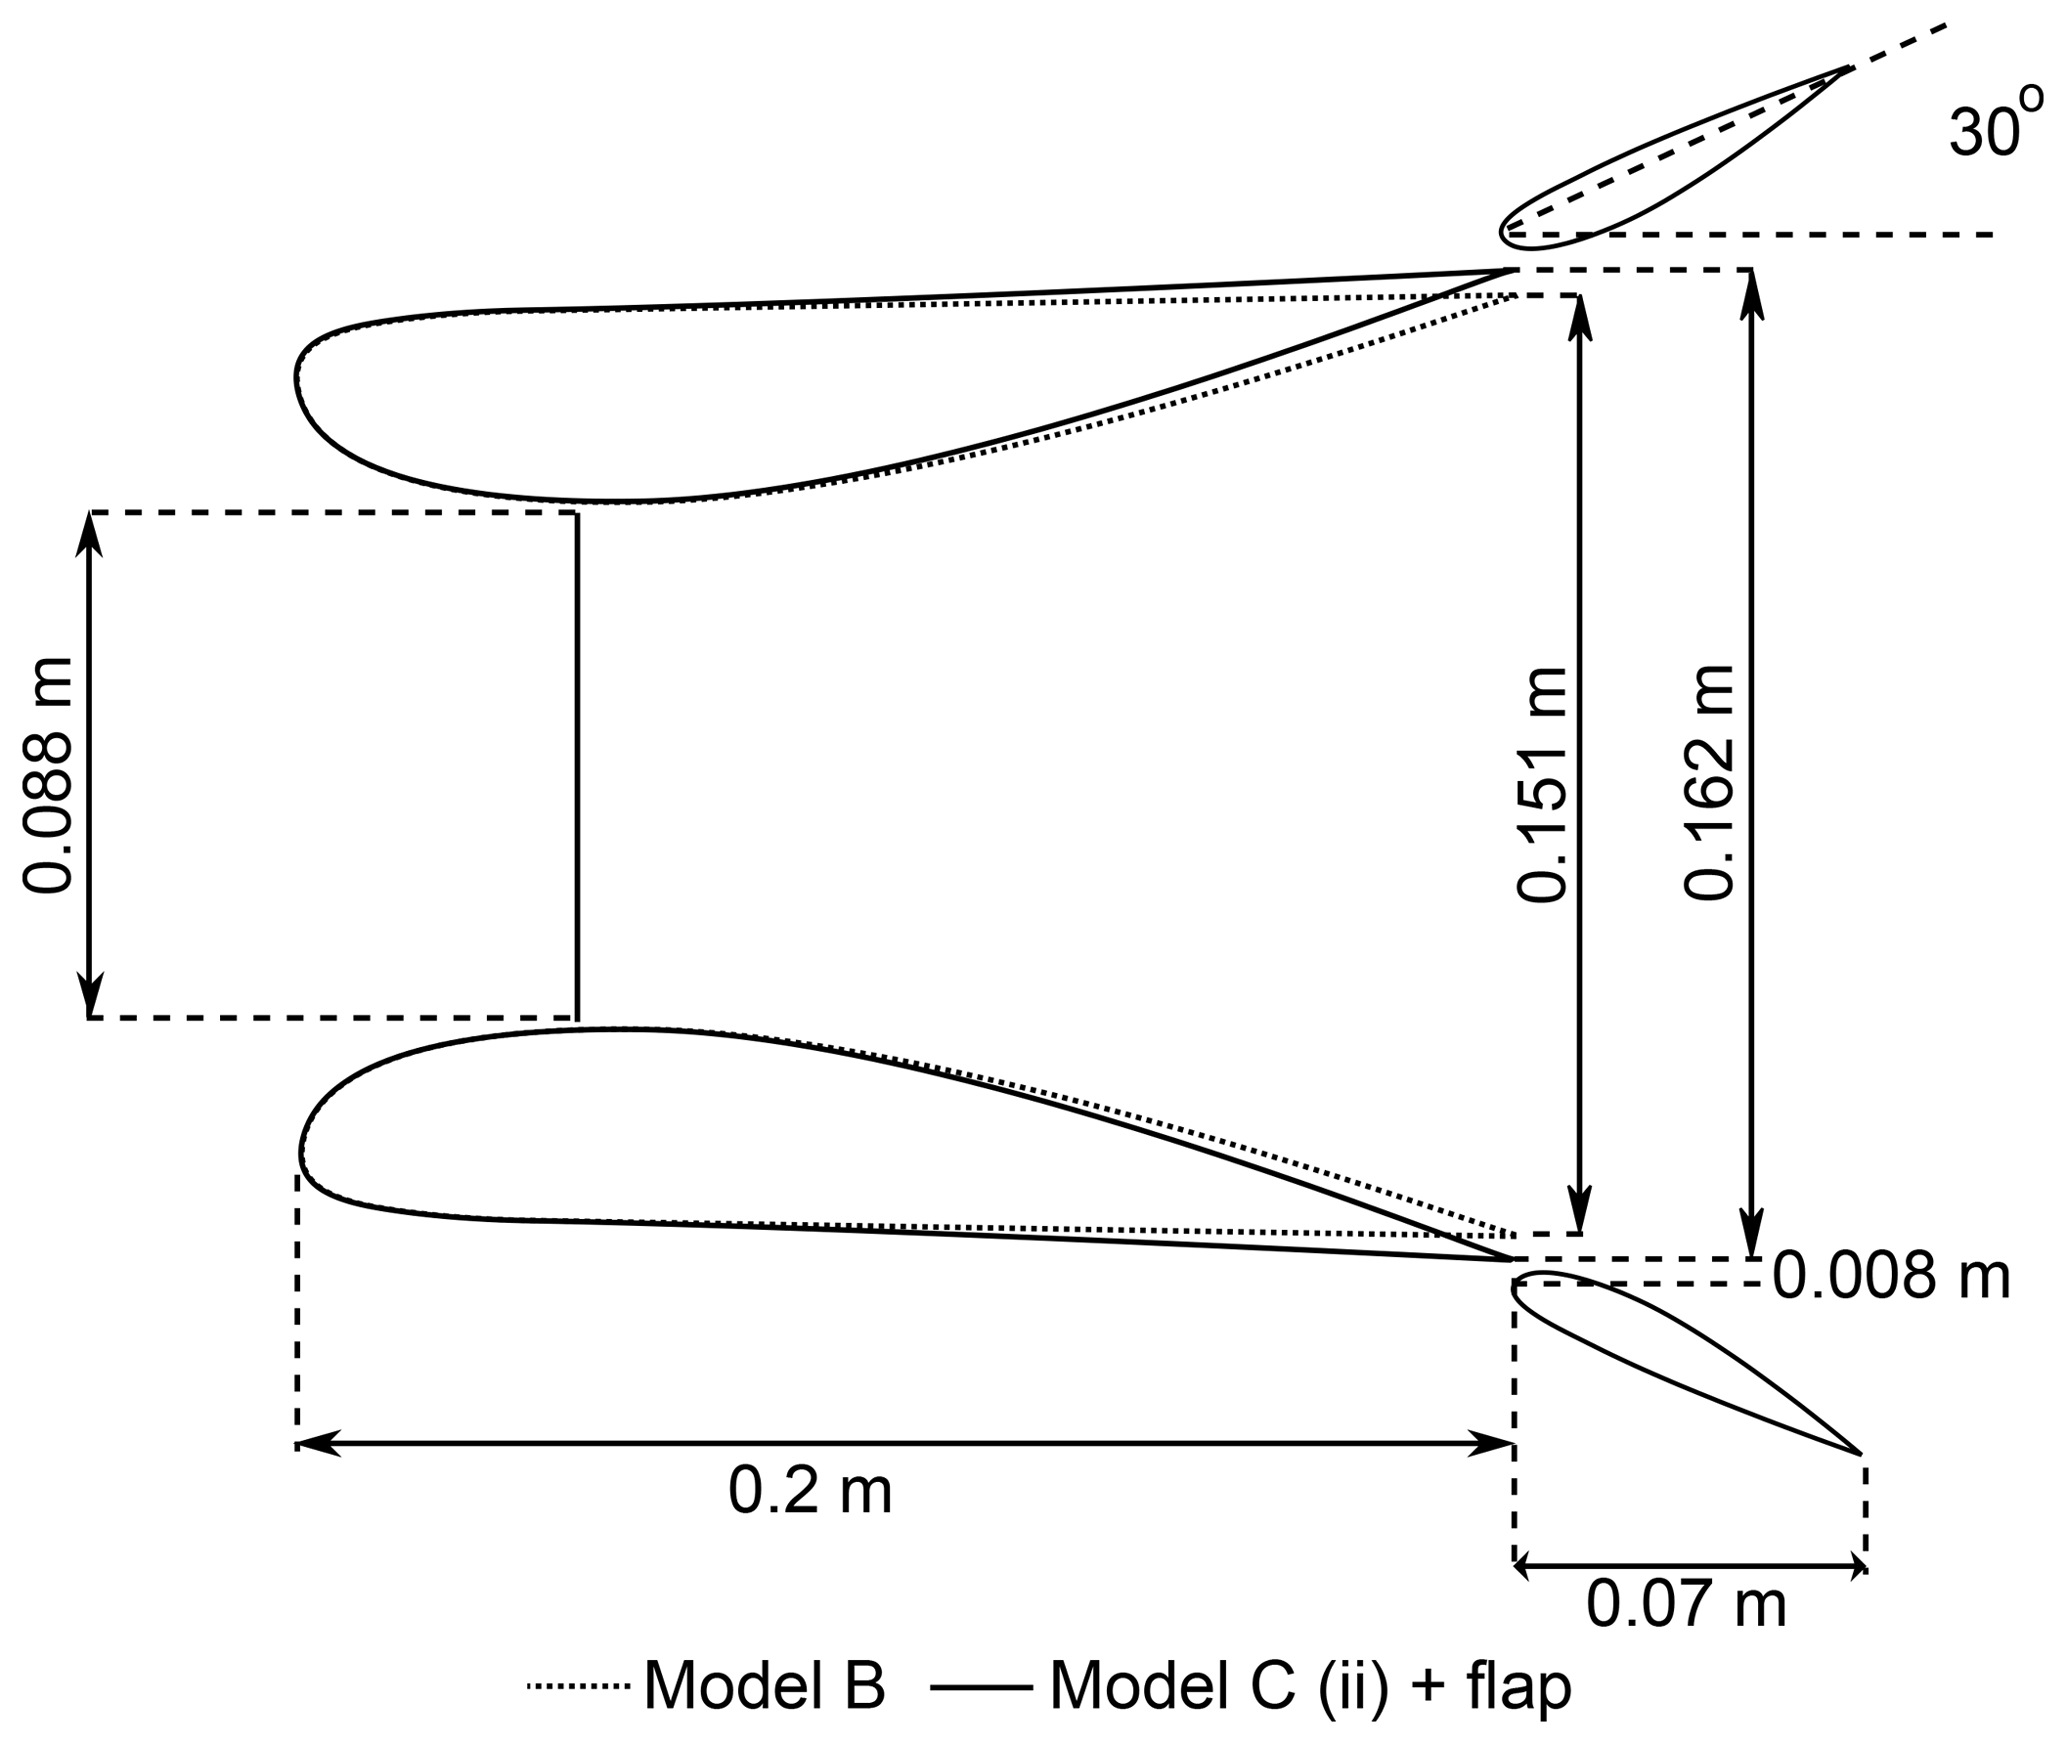
Figure 2A schematic cross-sectional layout of the three-dimensional experimental model used for the numerical validation study.
For numerical validation, three numerical methods are considered: a two-dimensional panel method based on Euler equations, a two-dimensional steady RANS method based on time-averaged RANS equations and a two-dimensional unsteady RANS method based on time-filtered URANS equations. A detailed description of the differences in the governing equations is beyond the scope of the current discussion. The reader may refer to Versteeg and Malalasekera (2007). For both steady and unsteady RANS methods, the k−ω SST (shear stress transport) model is used as a turbulence model. Preliminary investigations showed good agreement with the experiments (Dighe et al., 2018a, 2019). A numerical stability analysis is performed in the context of time-filtered URANS simulations. The physical time step corresponding to a Courant–Friedrichs–Lewy (CFL) number of 1 in the finest mesh resolution level is 1.67×10⁻⁵ s. More details on the grid settings and the boundary conditions will be presented in Sect. 4
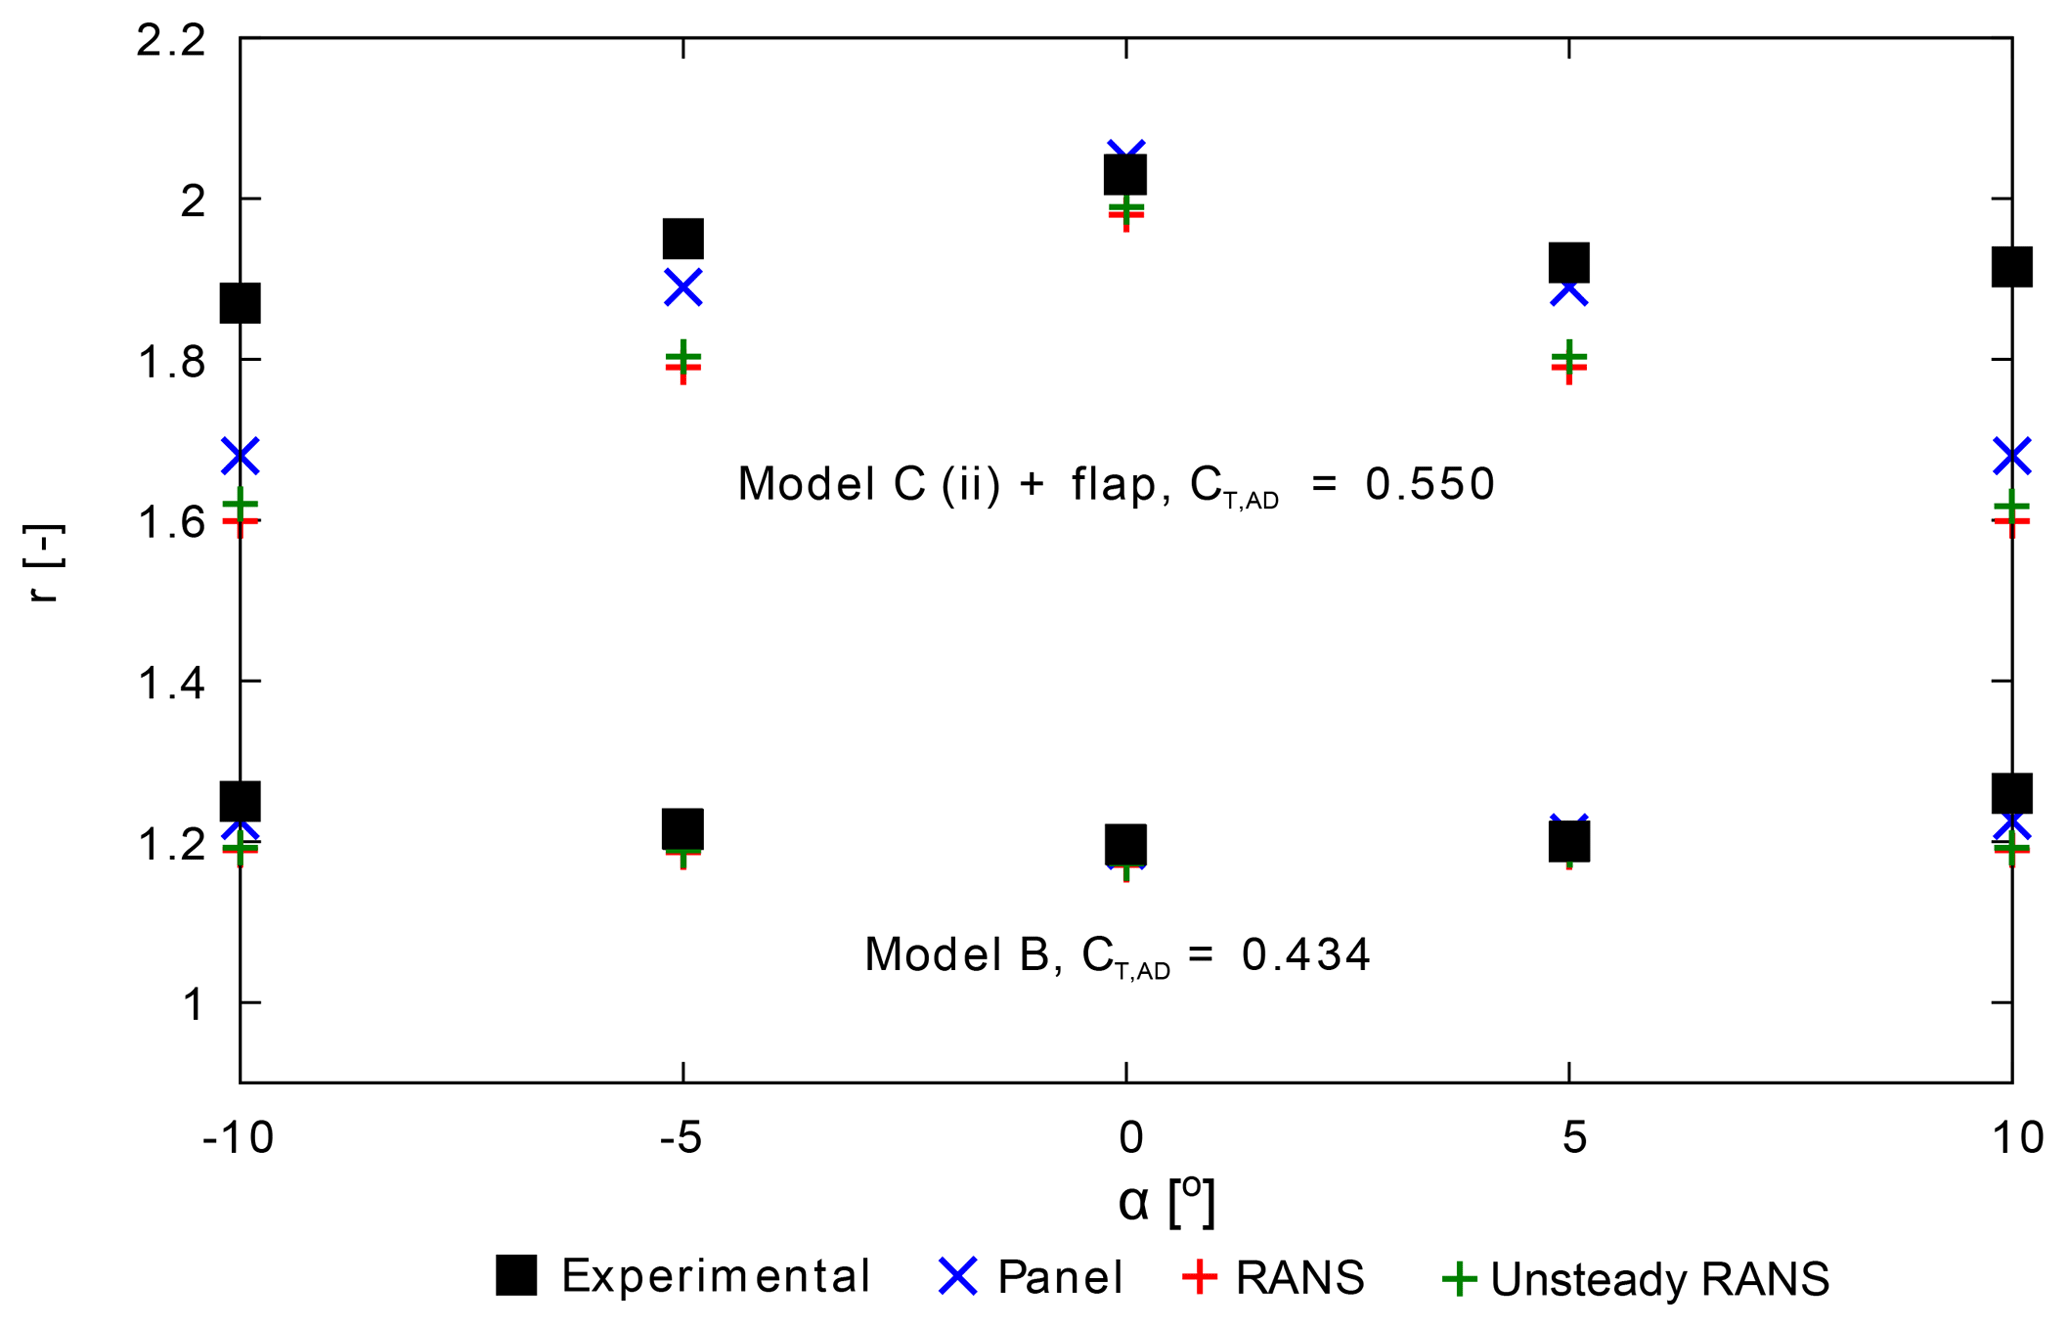
In Fig. 3, the power augmentation factor r is plotted as a function of the inflow yaw angle α. CFD results, obtained using panel, steady RANS and unsteady RANS methods, are compared with the experimental data. A very good agreement between the CFD simulations and the experimental findings is found for Model B. On the other hand, the deviation between the CFD and the experimental findings is larger for Model C (ii) + flap, in particular for α≠0∘. The discrepancies might be due to three-dimensional effects not accounted for in the two-dimensional simulations. At non-yawed conditions (α=0∘), however, the CFD results agree well with the experimental findings, wherein the maximum deviation of the CFD results from the experimental data is 1.2 % and 4.3 % for Model B and Model C (ii) + flap, respectively.
The differences in the CFD results can be explained by looking at the flow field. Figure 4 shows the contours of nondimensional axial velocity computed with the three numerical methods for Model C (ii) + flap. The velocity contour from the panel method is plotted on the left; steady RANS is in the center, and unsteady RANS is on the right. A clear difference in the flow field between the panel and the RANS (steady and unsteady) methods could be identified from the contour plots. Neglecting viscosity, as in the panel method solution, the flow remains attached over the suction side of the duct. As a result, the magnitude of velocity on the suction side, and ultimately the value of r (Fig. 3), is larger for the panel method solution in comparison to the RANS (steady and unsteady) method solutions. On the other hand, the flow fields obtained using steady and unsteady RANS methods are almost identical. Both the steady and unsteady RANS solutions show flow separation along the inner walls of the flap. Subtle differences appear in the flow separation region, where the velocity contour patterns differ slightly in their spatial organization. In the URANS solution, the turbulent flow structures, which evolve in time and space, are explicitly computed. These flow structures are temporally averaged in the RANS solution. The net result of such different formulations explains the difference in the value of r in Fig. 3 calculated using steady and unsteady RANS methods.
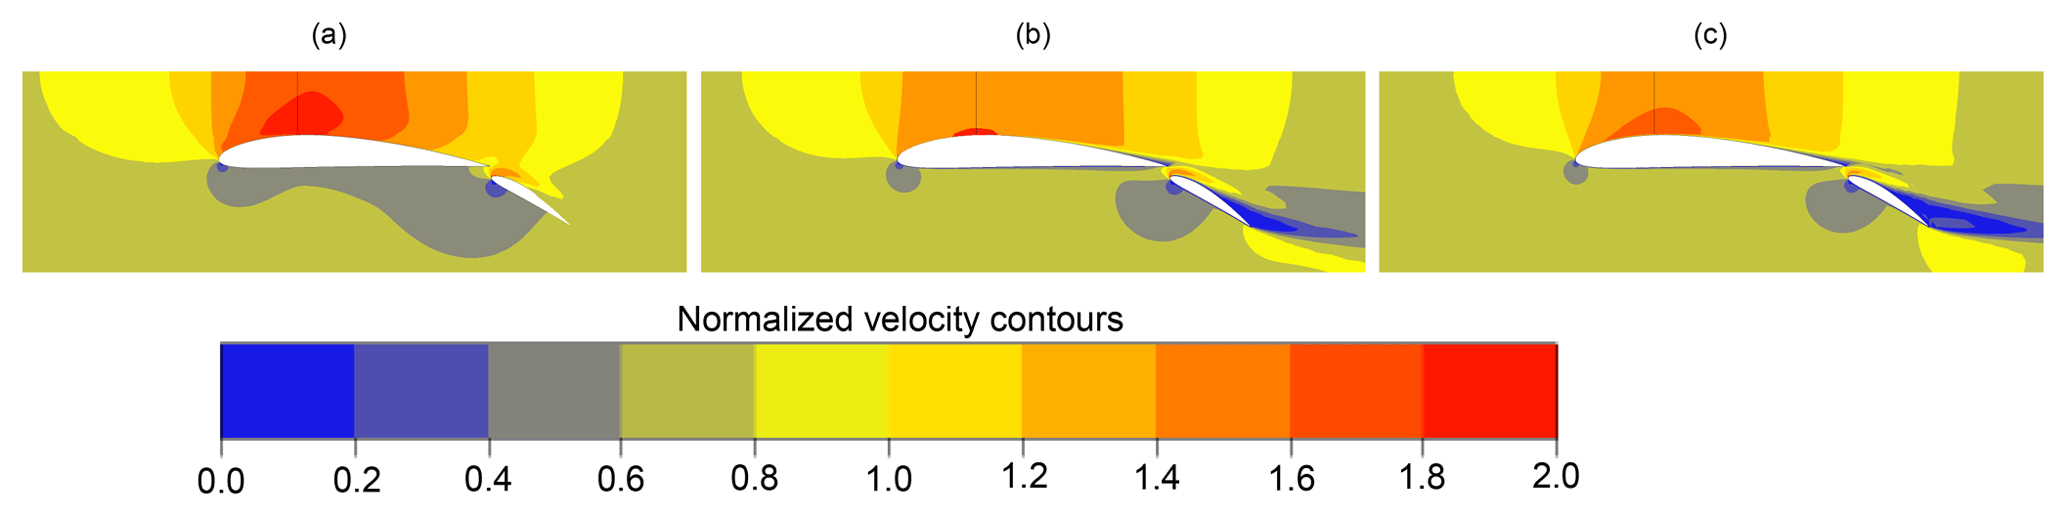
Figure 4Velocity contours colored with normalized free-stream velocity obtained using the (a) panel method, (b) RANS method and (c) URANS method for Model C (ii) + flap.
Although URANS simulations increase the level of description of the unsteady flow due to the multi-element duct–AD interaction, the computing cost incurred by going from RANS to URANS does not justify the scope of the current study, in which the effects of distributed AD loading, wake rotation, divergence and inflow yaw angle are totally ignored.
In this section, the numerical methods employed will be briefly described. For an in-depth description, the reader can refer to Dighe et al. (2019).
4.1 Panel method
A two-dimensional potential flow panel method has been used to compute the steady iso-entropic incompressible flow field around the multi-element duct–AD model following the work of de Oliveira et al. (2016). The governing flow equations are a simple form of the Euler equations. The AD is represented by a pair of symmetric counter-rotating vortices. The duct and the flap geometries are defined using a distribution of vortices located on the panels to reproduce the desired cross-sectional shape. A uniform distribution of vorticity on the panels is assigned by assuming the Kutta condition. The assumption of uniform vorticity distribution over the panels represents a simplification of real physics and prevents flow separation on the multi-element duct surface, even for larger pressure gradients. The duct and the flap surface discretization is based on the constant spacing approach. The streamwise discretization in the near and far wake is nonuniform, with initial panel length equal to 1.0 % of duct chord length c, just behind the AD, and increasing gradually in length as the wake expansion settles further downstream (see Fig. 5).
The panel method is particularly appealing for routine design analysis due to its short execution time. A typical converged panel method solution is obtained in roughly 0.05 h on a multicore workstation desktop computer.
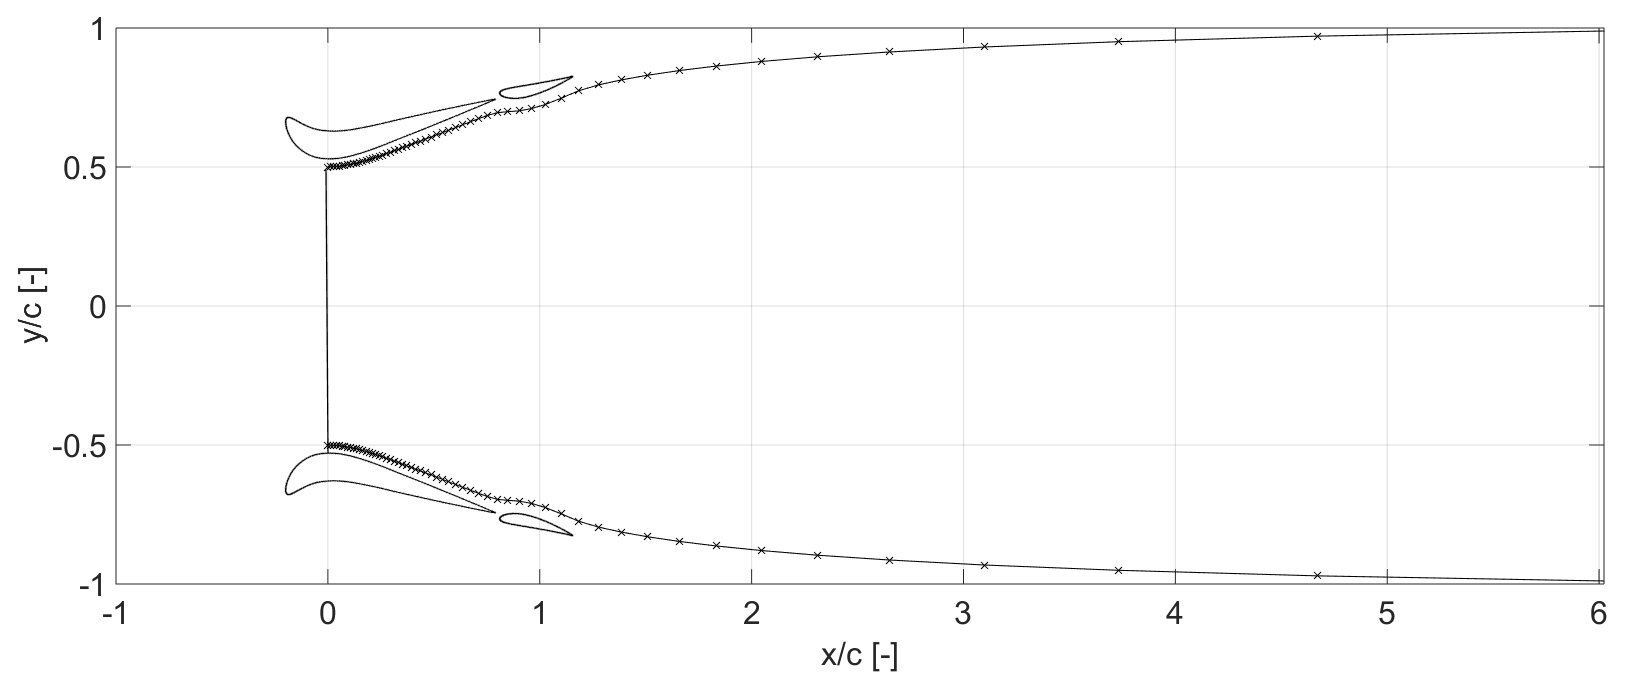
Figure 5Panel distribution along the duct surface and the wake region used for the inviscid panel method calculations.
4.2 RANS method
A commercial CFD solver, ANSYS Workbench®, has been used for a complete viscous solution of steady incompressible flow around the multi-element duct–AD model. The governing flow equations are the Reynolds-averaged Navier–Stokes (RANS) equations. The 2-D computational domain is shown in Fig. 6, where the distances from the AD location to the domain inlet and outlet are 12c and 24c, respectively. The computational grid consists of quadrilateral cells with a minimum y+ value of 1 on the duct walls. Boundary conditions are a uniform velocity at the inlet, zero gauge static pressure at the outlet, and no-slip walls for duct and flap surfaces. A symmetric boundary condition is applied along the center-line axis, while a fan boundary condition is used for the AD. Experimental data from the wind tunnel (Dighe et al., 2018b) in the form of pressure drop against velocity normal to the AD plane were extrapolated to determine the input parameter for the fan boundary condition. RANS solutions are considerably more reliable and accurate than the panel method solution but at the expense of computational cost. A typical converged RANS solution with approximately 0.1 million mesh elements is obtained in roughly 0.5 h on a multicore workstation desktop computer.
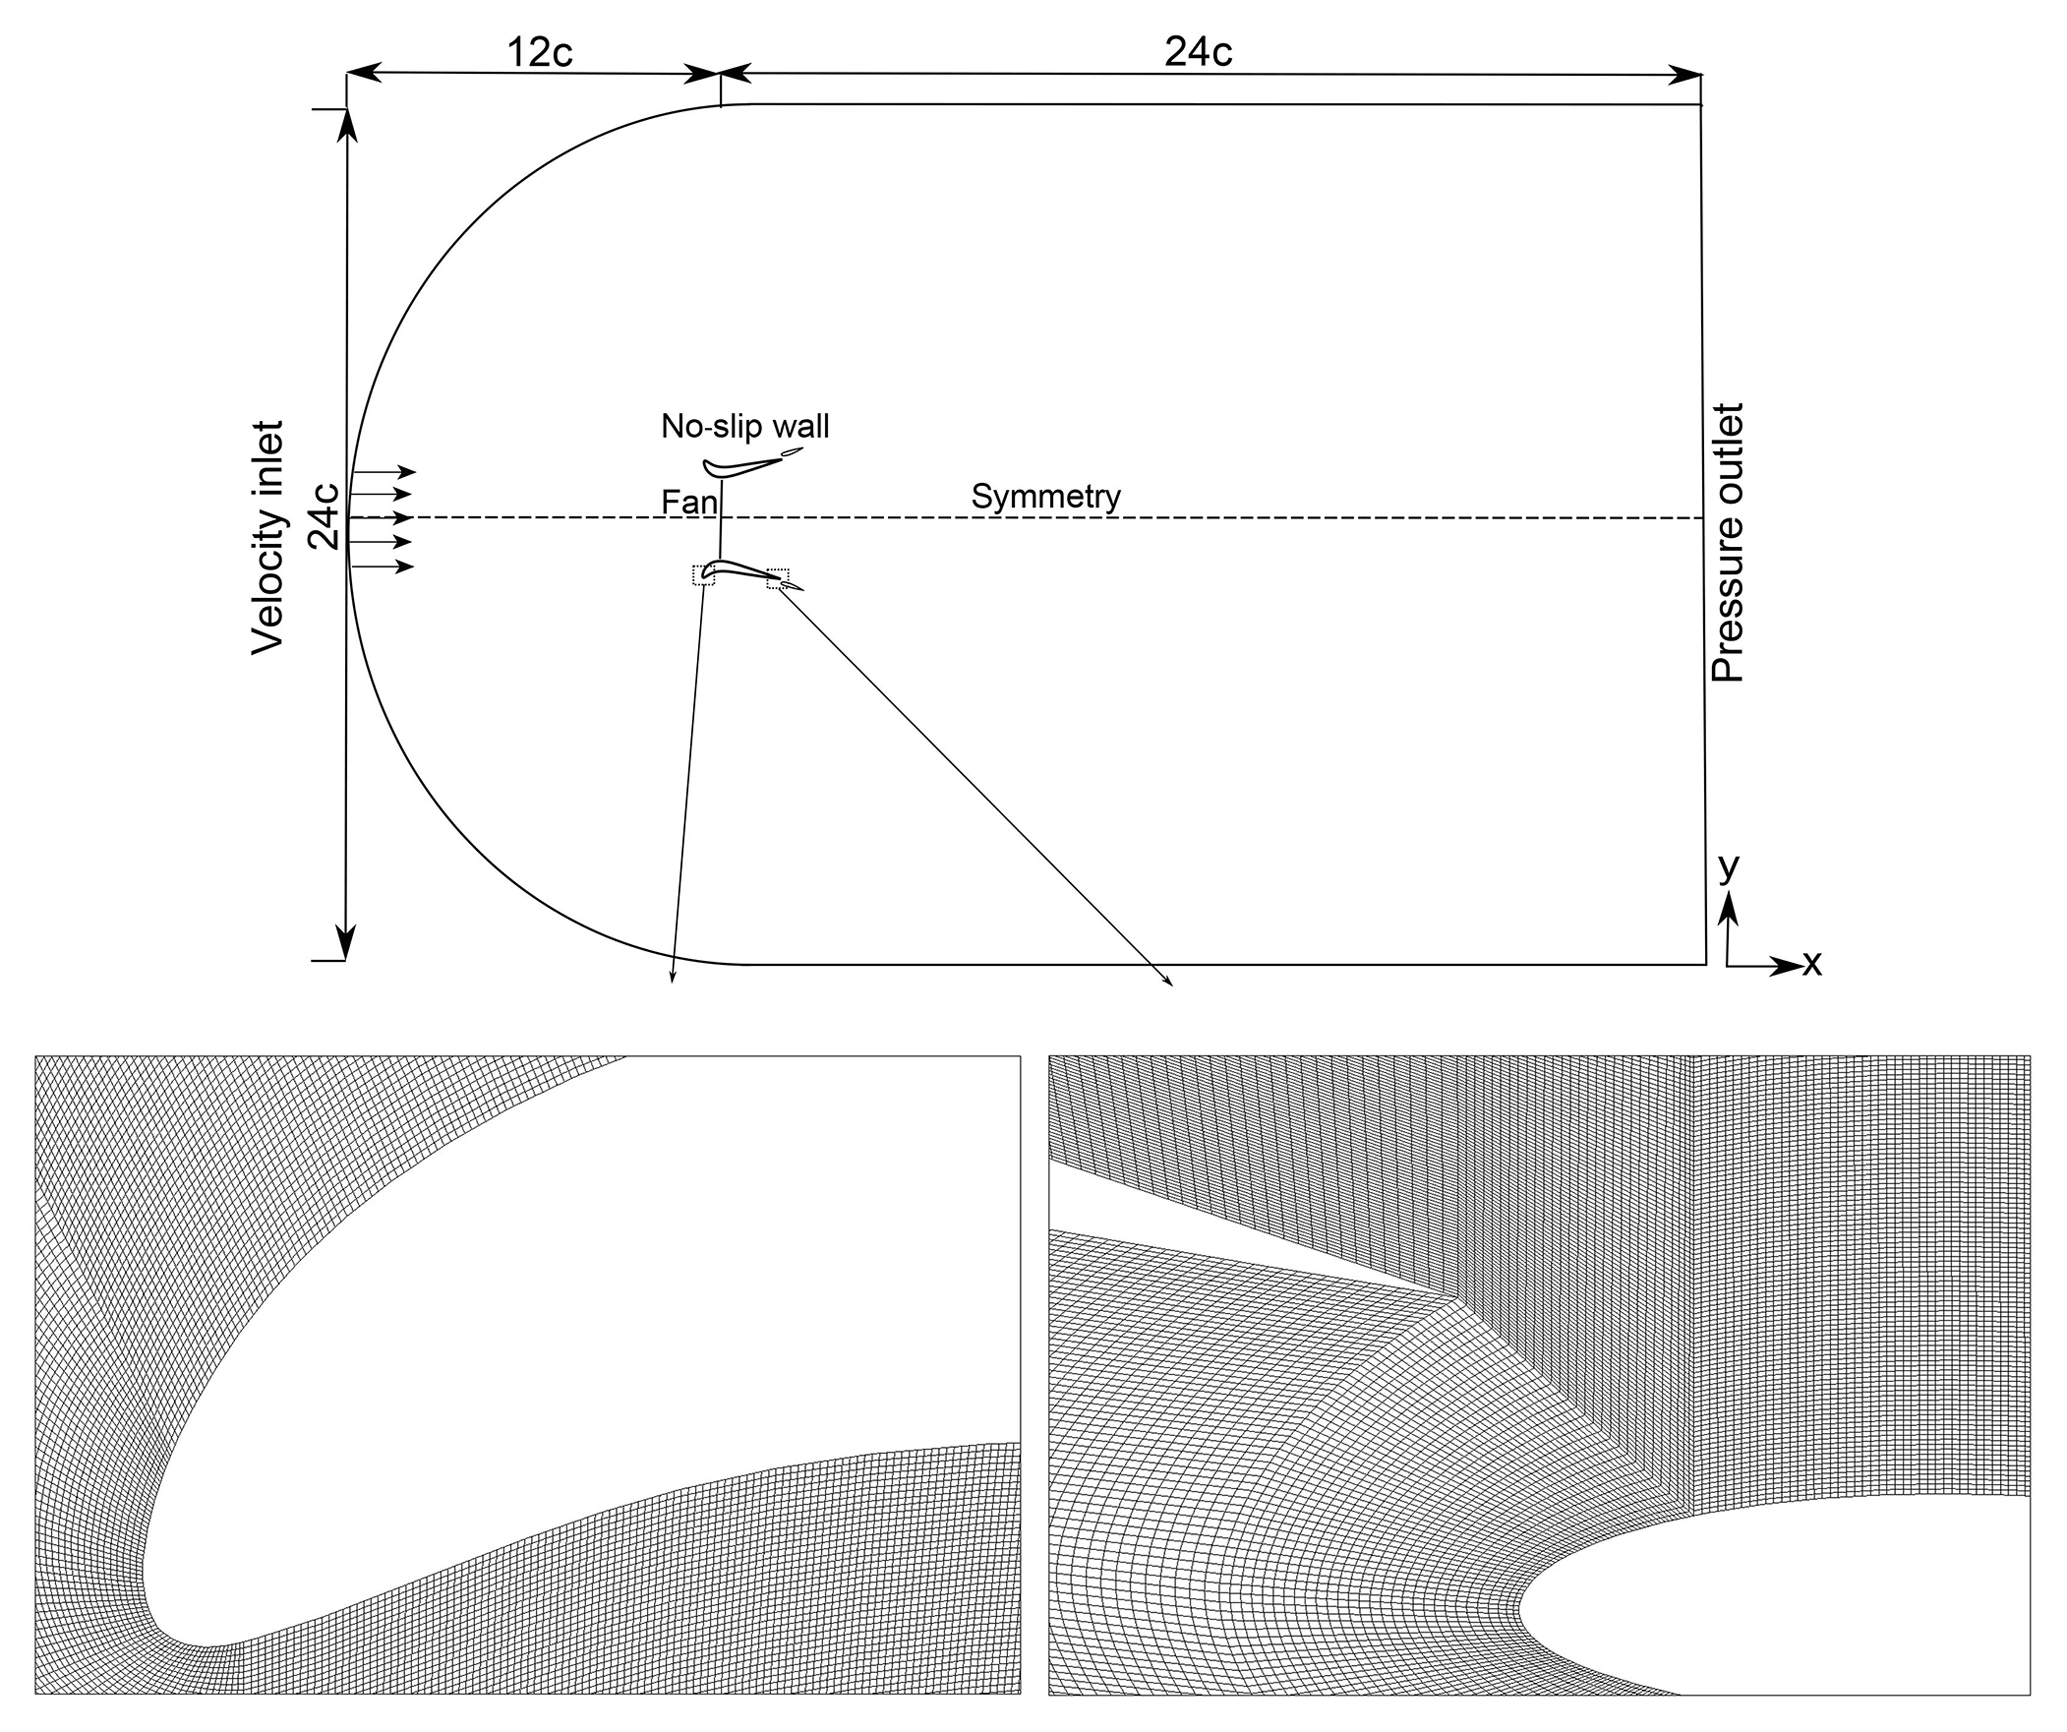
Figure 6Computational domain showing the boundary conditions employed. The length is indicated in terms of duct chord length c (representative, not to scale). The computational grid along the duct and flap leading edge is zoomed in to show the C-grid and boundary layer refinement.
RANS solutions are sensitive to the discretization of the computational domain. For the present computations, a C-grid structured zonal approach is chosen (Fig. 6), which proved advantageous in the case of a curved boundary (duct and flap leading edge). The C-shaped loop terminates in the wake region. Grid independence analysis has been carried out using three grid sizes; the refinement factor in each direction is approximately 1.5. The refinement factor is defined as the rate at which the grid size increases far from the object.
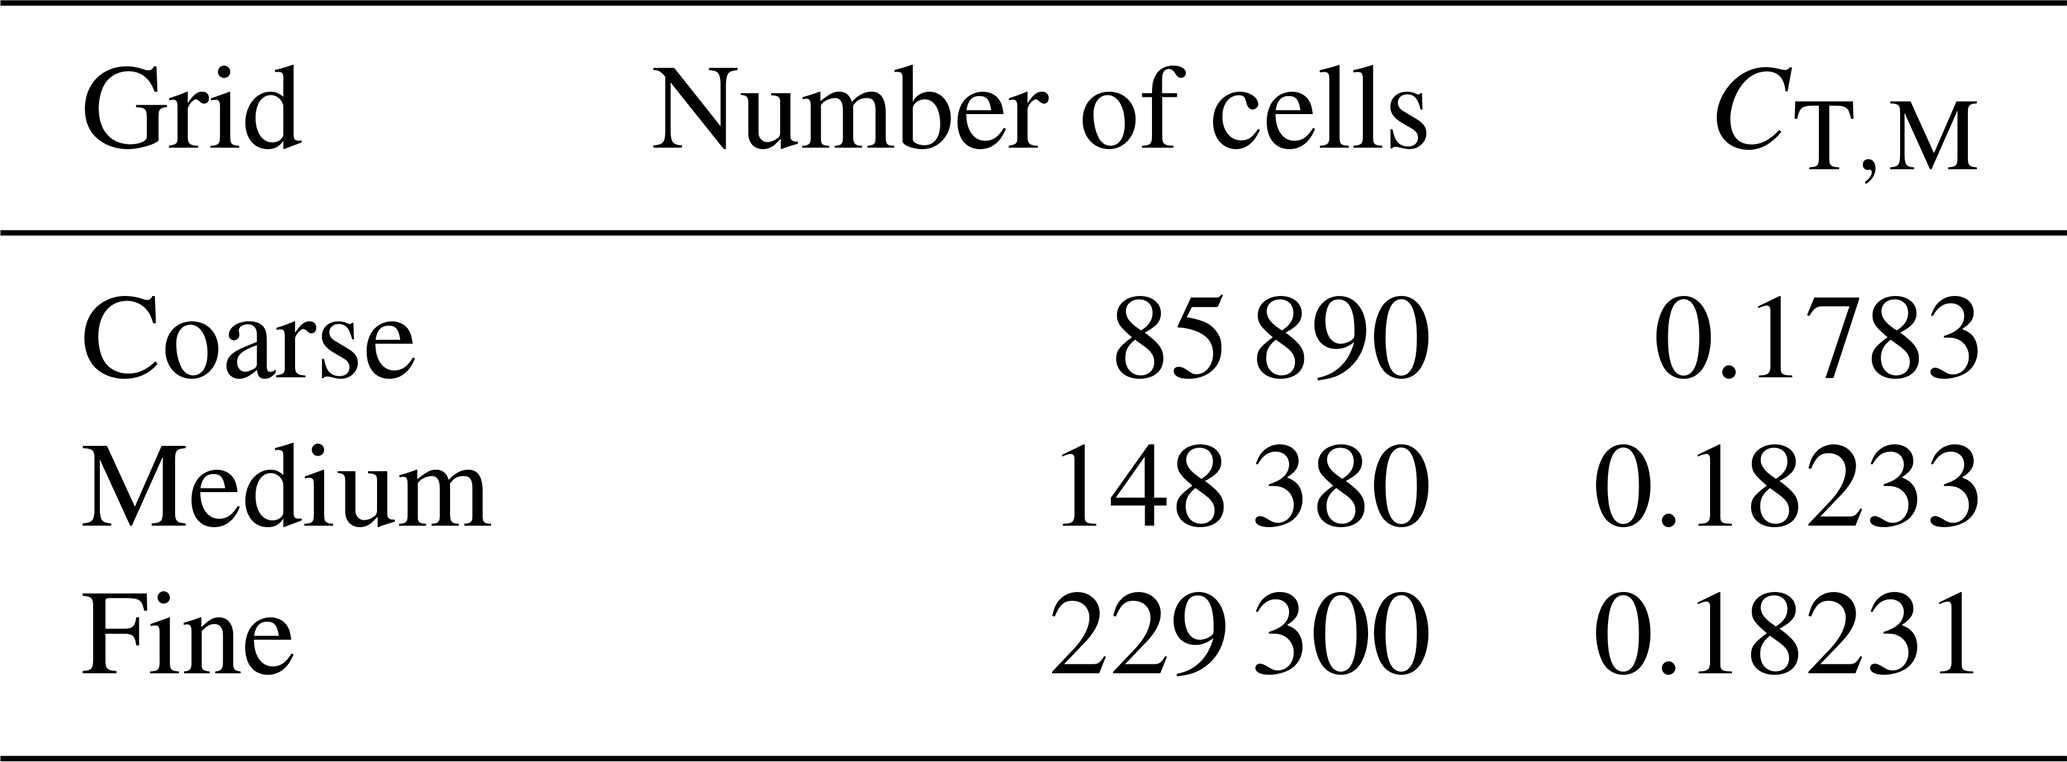
The multi-element duct thrust force coefficient, CT,M, is taken as a reference for the convergence analysis. The results of the grid independence study are shown in Table 1. Convergence is reached for the medium grid, which is then used in the rest of the paper.
Table 1Grid statistics for the grid independence study of the reference case.
5.1 Multi-element duct geometry
In the following sections, the effects of flap installation settings on the aerodynamic performance of the multi-element duct–AD model are described. The multi-element duct–AD configuration investigated in the present work is shown in Fig. 7. The longitudinal cross section of the duct is a DonQi D5 airfoil; the profile is chosen based on the duct shape parametrization study conducted by the authors (Dighe et al., 2019). For the DonQi D5 duct an optimal was obtained. This value is employed throughout the present discussion. A NACA 4412 longitudinal cross section, measuring 0.35c, is chosen for the flap following Igra (1977). The flap installation settings are the radial gap ζ and the deflection angle θ. The radial gap ζ, indicated as a percentage of duct chord length c, is defined as the distance from the trailing edge of the duct to the leading edge of the flap. A positive value of radial gap (ζ>0) indicates that the leading edge of the flap is positioned below the trailing edge of the duct. A positive deflection angle (θ>0) corresponds to a downward flap deflection, whereby the angle is defined relative to the free-stream direction. The axial gap between the trailing edge of the duct to the leading edge of the flap is zero based on the findings of Igra (1981). The numerical study is performed at a fixed Re of 4.5×10⁵ as in the experiments. In Sect. 5.2 and 5.3, the changes in the aerodynamic performance coefficients with respect to the flap's geometric orientation are quantified.
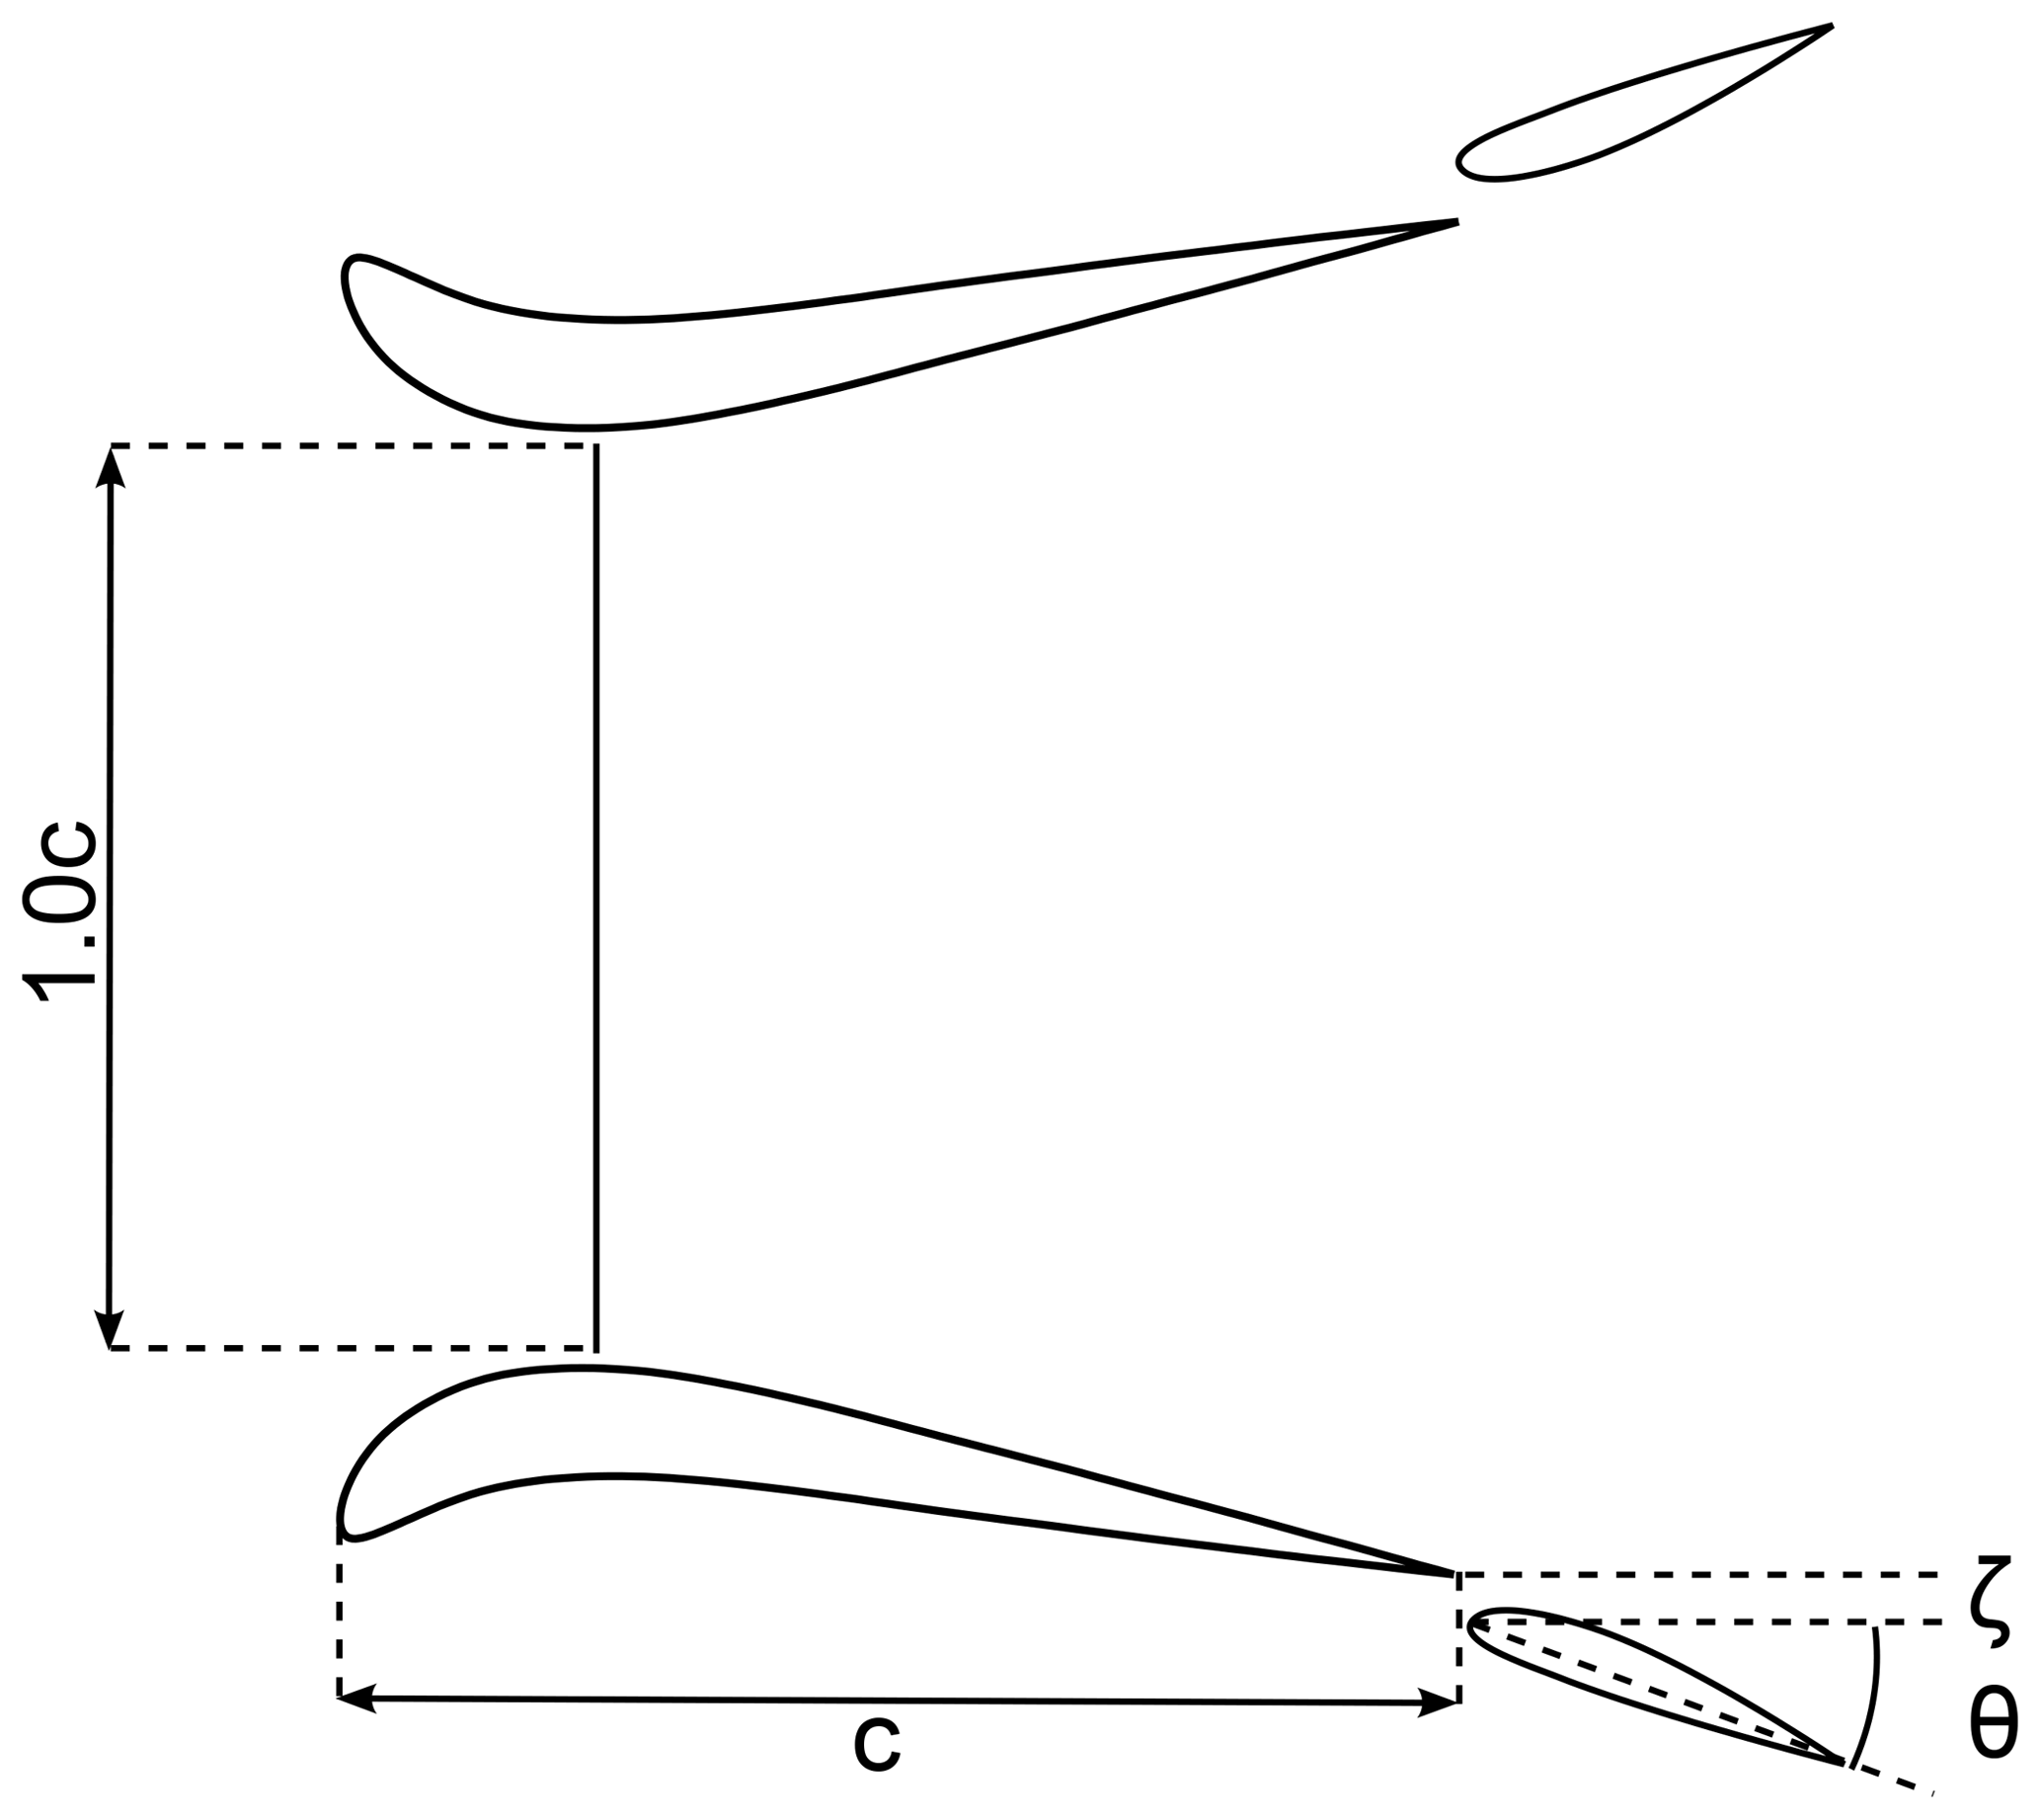
Figure 7A schematic cross section of the multi-element duct–AD model with the variable flap parameters used for the flap installation study.
5.2 Duct force coefficient
Contours of the multi-element duct force coefficient CT,M, obtained from panel and RANS methods, are shown in Figs. 8 and 9, where CT,M as a function of the radial gap ζ and the deflection angle θ are reported. The figures show that CT,M increases for larger ζ. Conversely, CT,M decreases with increasing θ. The maximum CT,M obtained from both the numerical methods lies in the same region, i.e., ζ≈5 % and θ≈10∘. The differences between results obtained using the panel and RANS methods are highly contrasting for θ≥60∘.
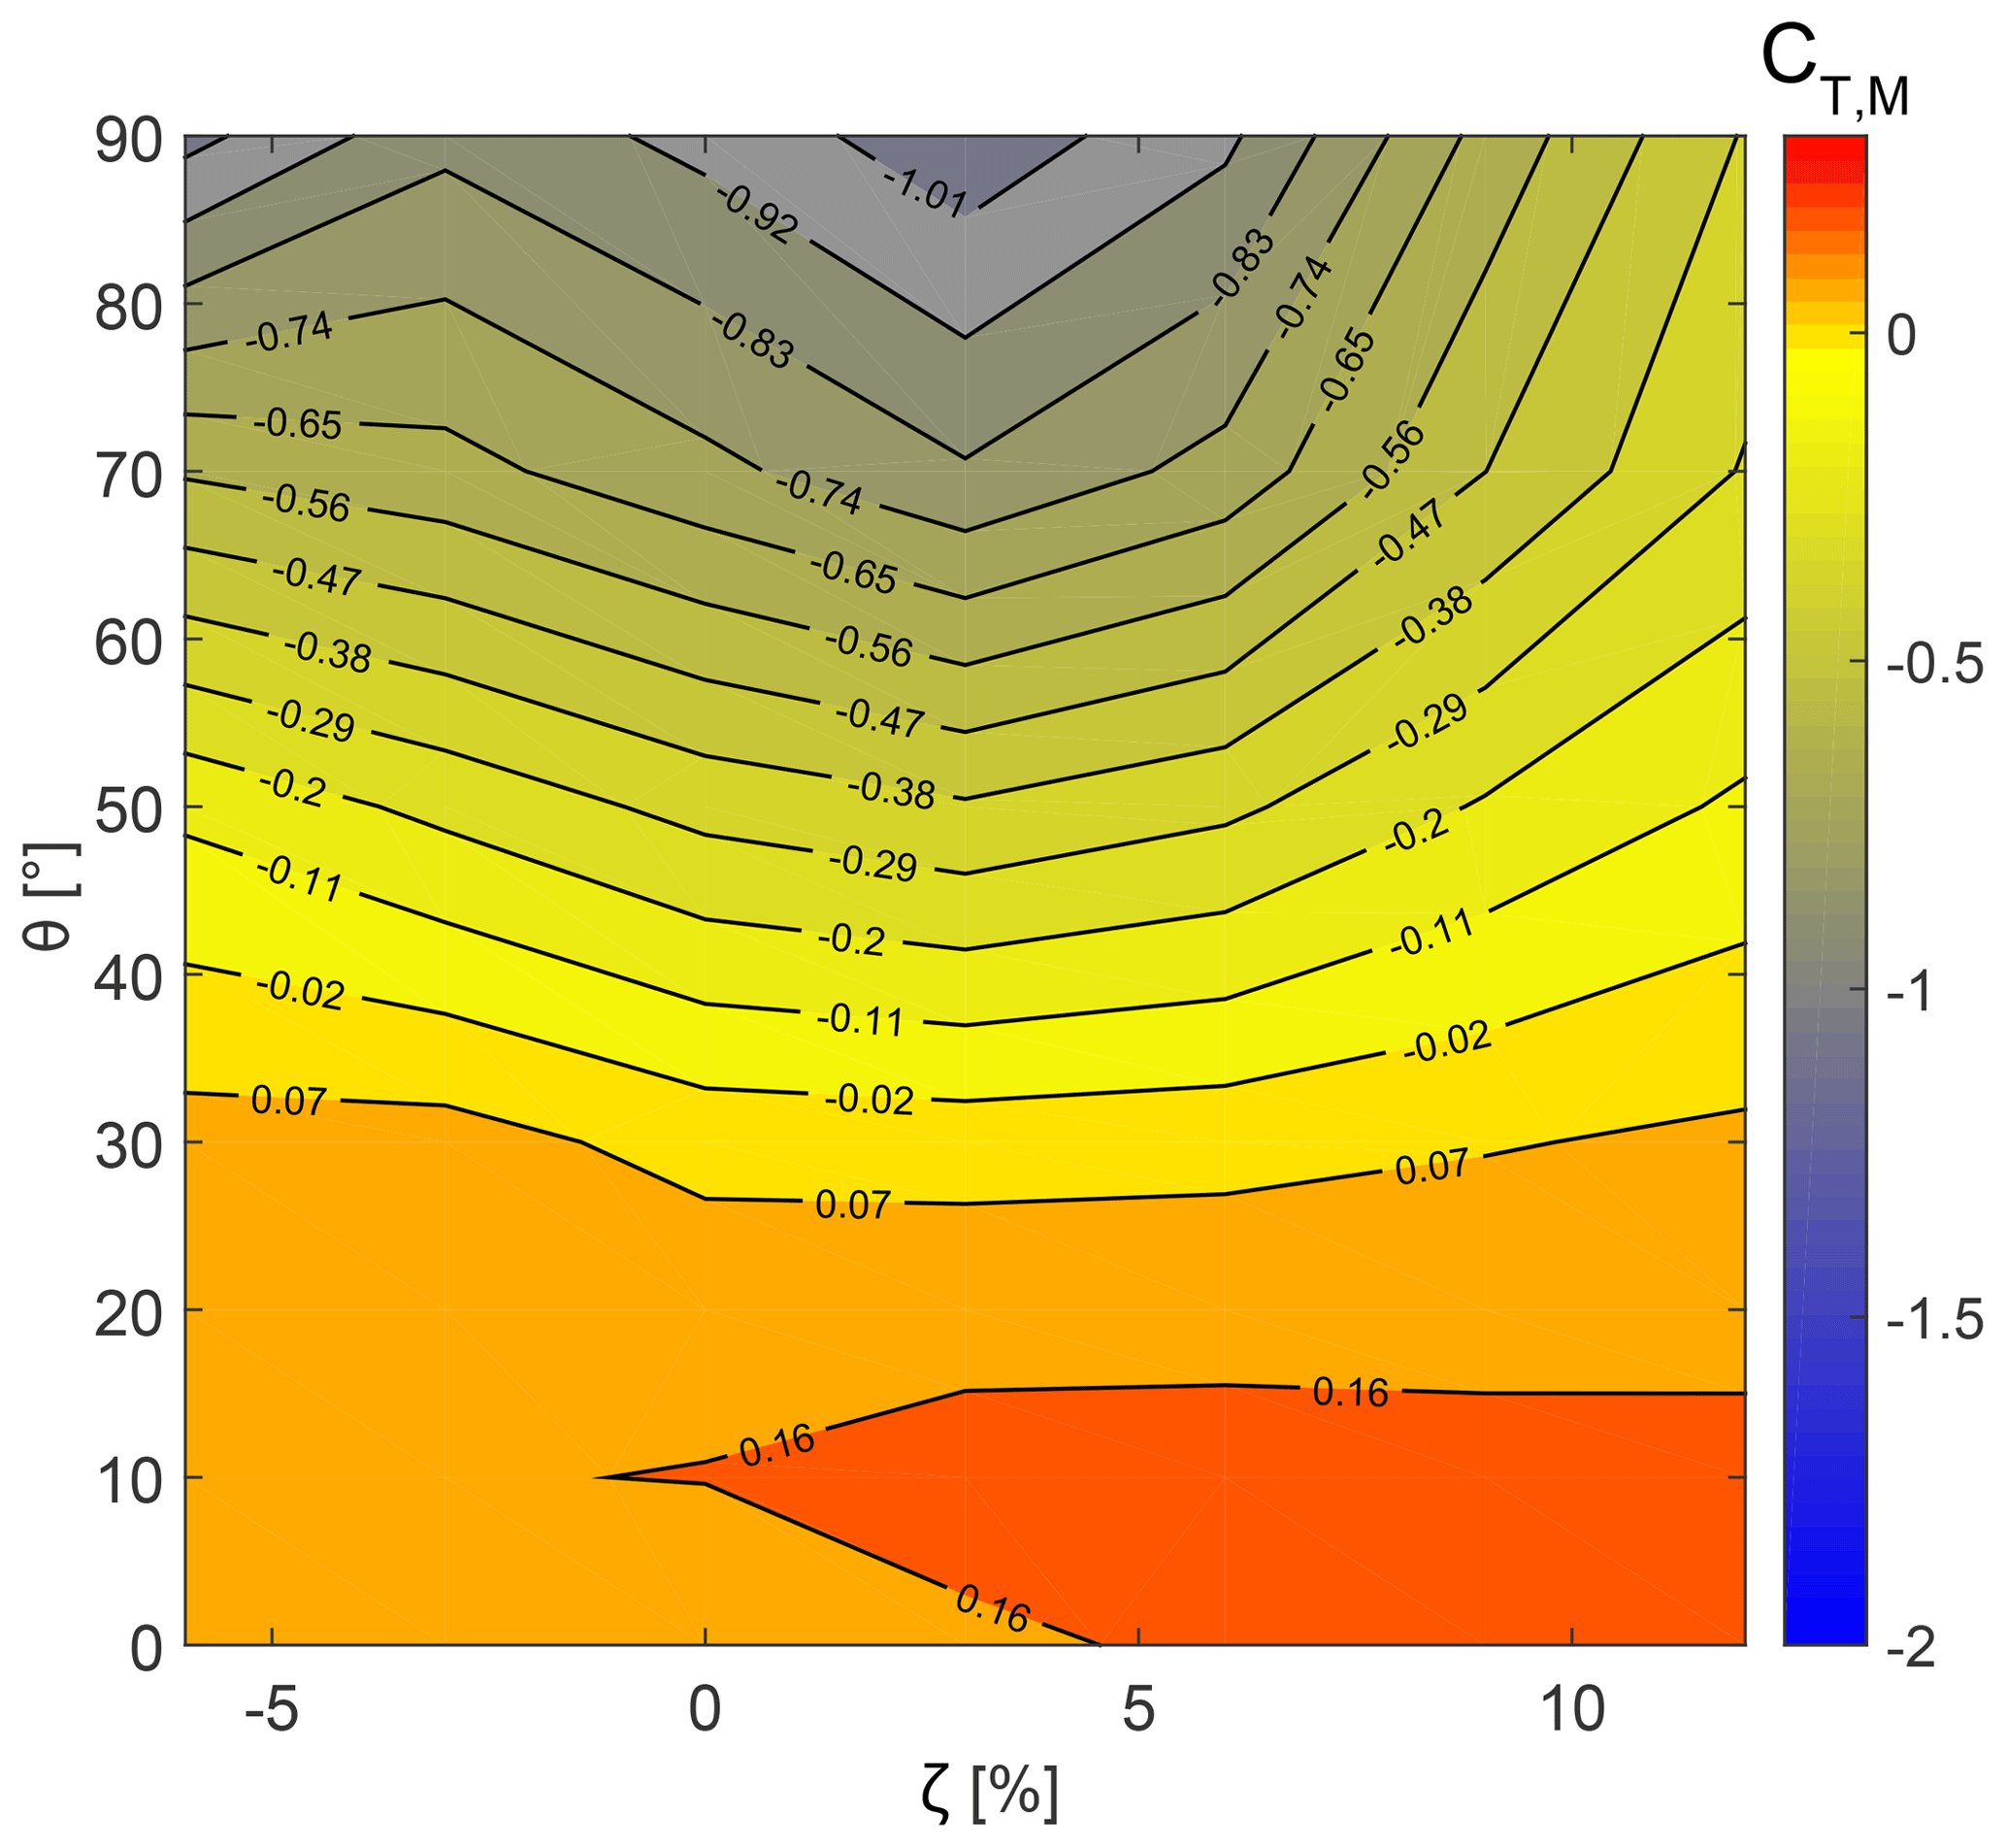
Figure 8Effect of the variable radial gap and deflection angle of the flap on the duct thrust force coefficient using the panel method.
The differences can be explained by looking at the flow field. Contours of nondimensional axial velocity from both methods are reported in Fig. 10a–f. Results from the panel method are plotted on the left, while the ones from RANS are on the right. Contours for the no-flap configuration are shown in Fig. 10a and b. Two flap settings, in order to explain the aerodynamics behind Figs. 8 and 9, are shown: ζ=5 % and θ=10∘ in Fig. 10c and d as well as ζ=5 % and θ=70∘ in Fig. 10e and f.
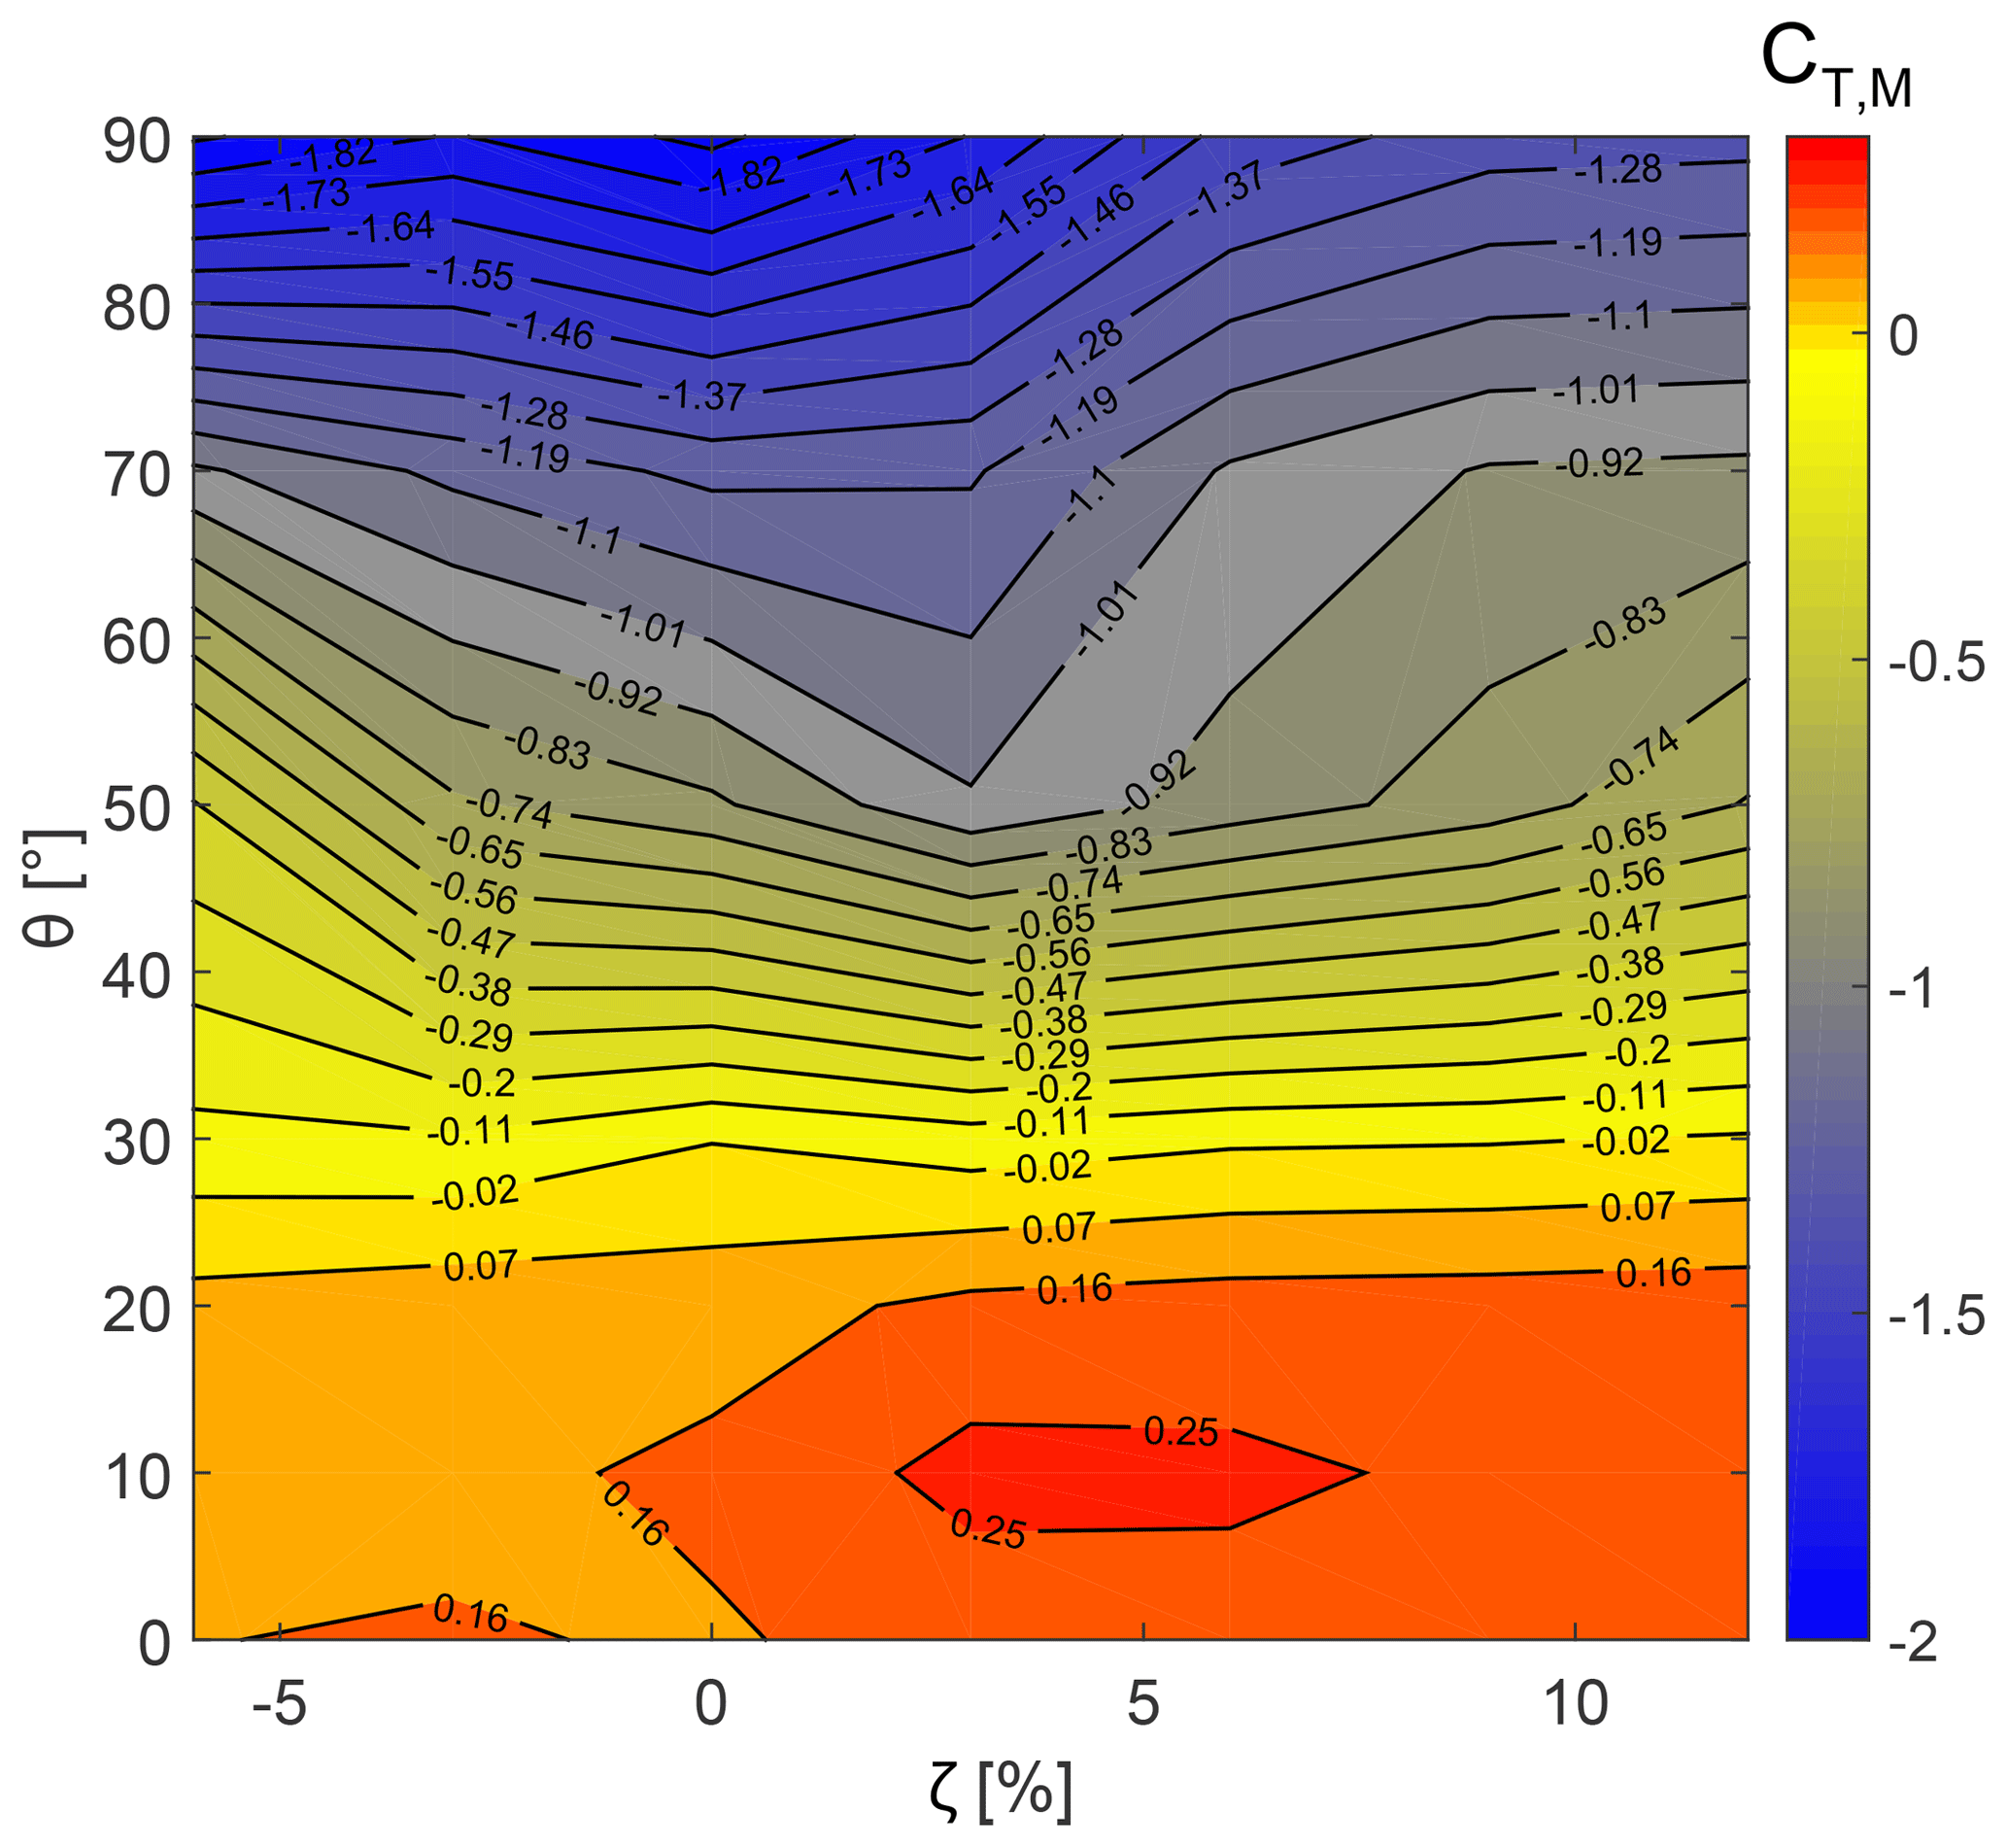
Figure 9Effect of the variable radial gap and deflection angle of the flap on the duct thrust force coefficient using the RANS method.
Contour plots show a higher velocity at the rotor plane for the configuration with flap in comparison with the no-flap configuration. This is due to the additional aerodynamic thrust force generated by the flap. The presence of a radial gap between the duct and the flap accelerates the flow over the flap. This reduces the pressure recovery demands on the multi-element duct, thereby reducing flow separation. Obviously, flow separation is seen for RANS contours only. The overall integral contribution of the viscous forces increases the CT,M magnitude in the RANS solutions relative to the panel solutions, a trend that can be clearly observed by comparing Figs. 8 and 9. For the flap configuration with ζ=5 % and θ=70∘ (Fig. 10f), the flow over the flap's inner walls separates completely. The separation along the inner walls of the multi-element duct reduces the CT,M, which rapidly becomes large and negative at higher flap deflection angles as seen in Fig. 9. For panel solutions, however, the drop in the CT,M magnitude for higher flap deflection angles is gradual (see Fig. 8) because viscous effects are neglected (see Fig. 10e).
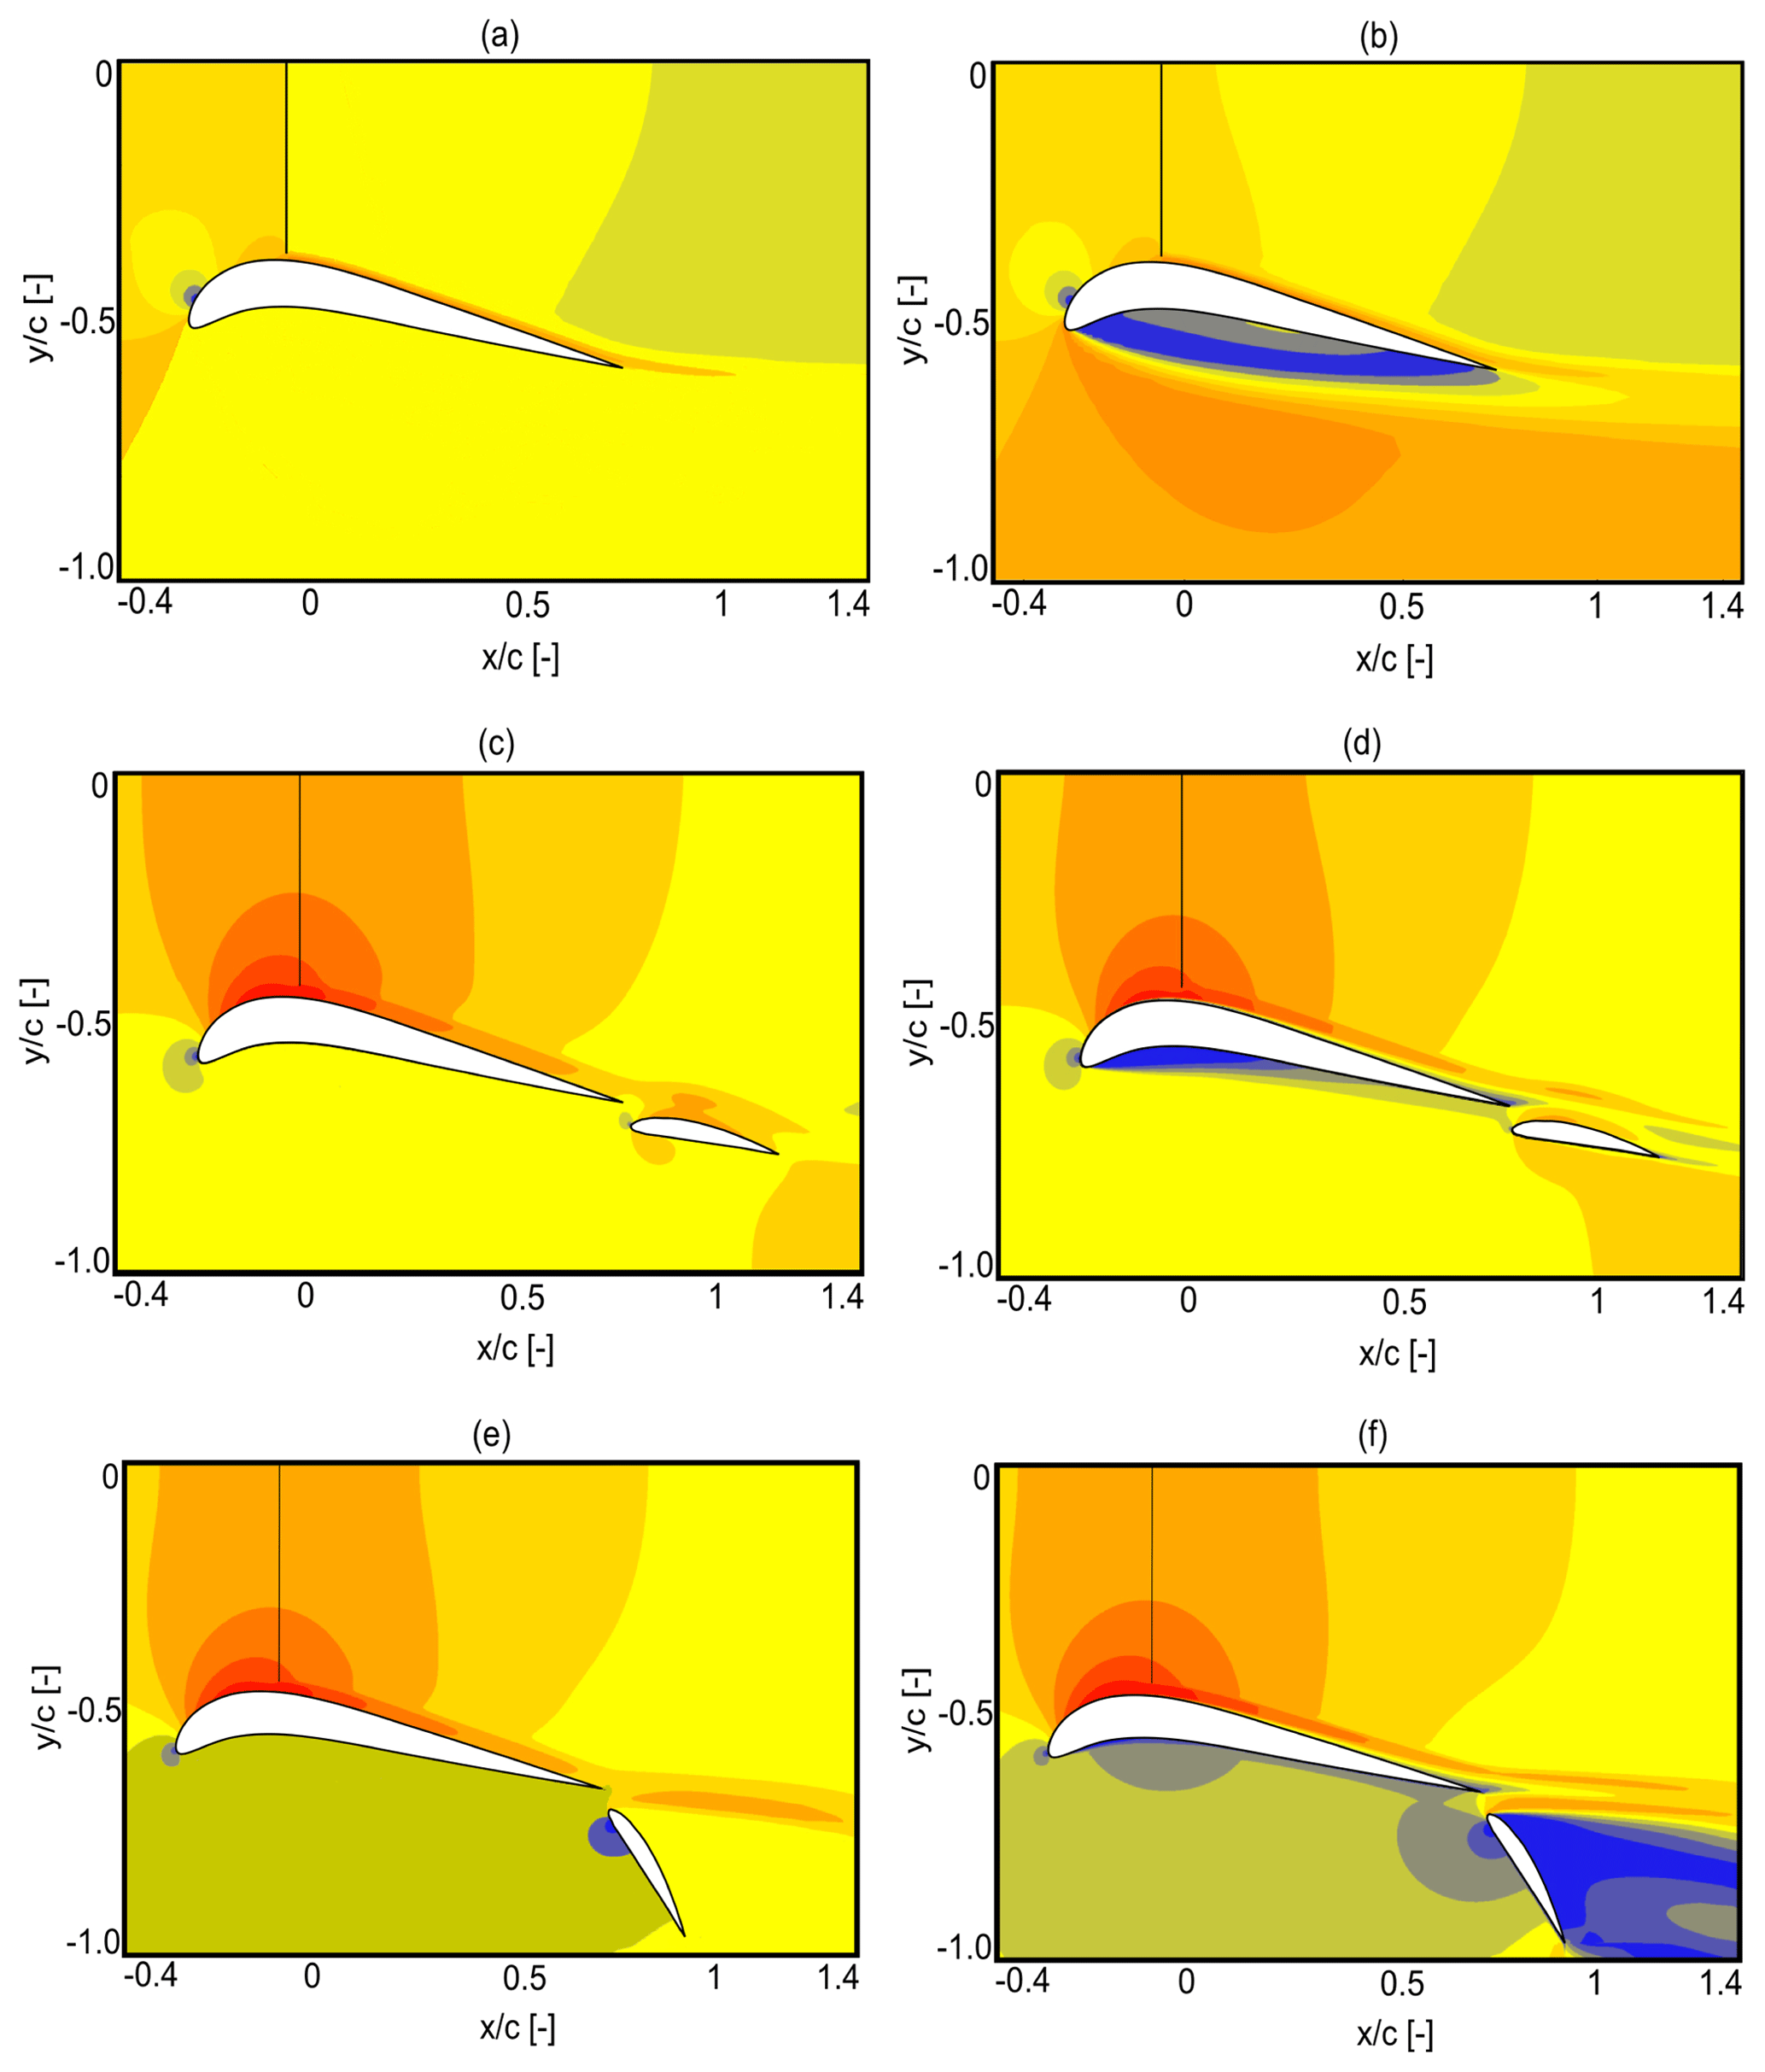
Figure 10Velocity contours colored with normalized free-stream velocity obtained using the (a) panel method with no flap, (b) RANS method with no flap, (c) panel method with ζ=5 % and θ=10∘, (d) RANS method with ζ=5 % and θ=10∘, (e) panel method with ζ=5 % and θ=70∘, and (f) RANS method with ζ=5 % and θ=70∘.
5.3 Power augmentation
Figures 11 and 12 represent contours of power augmentation factor r using the panel and RANS solutions, respectively, as a function of radial gap ζ and deflection angle θ. Recall from Eq. (11) that an r gain for a multi-element duct–AD model can be attained by increasing the CT,M magnitude for a constant CT,AD. Evidence of this is provided in Figs. 11 and 12, which exhibit the r maximum in the same region of CT,M maximum, as in Figs. 8 and 9. Then, the maximum power augmentation factor rmax=1.25 and 1.38, obtained for panel and RANS calculations, respectively, corresponds to ζ≈5 % and θ≈10∘.
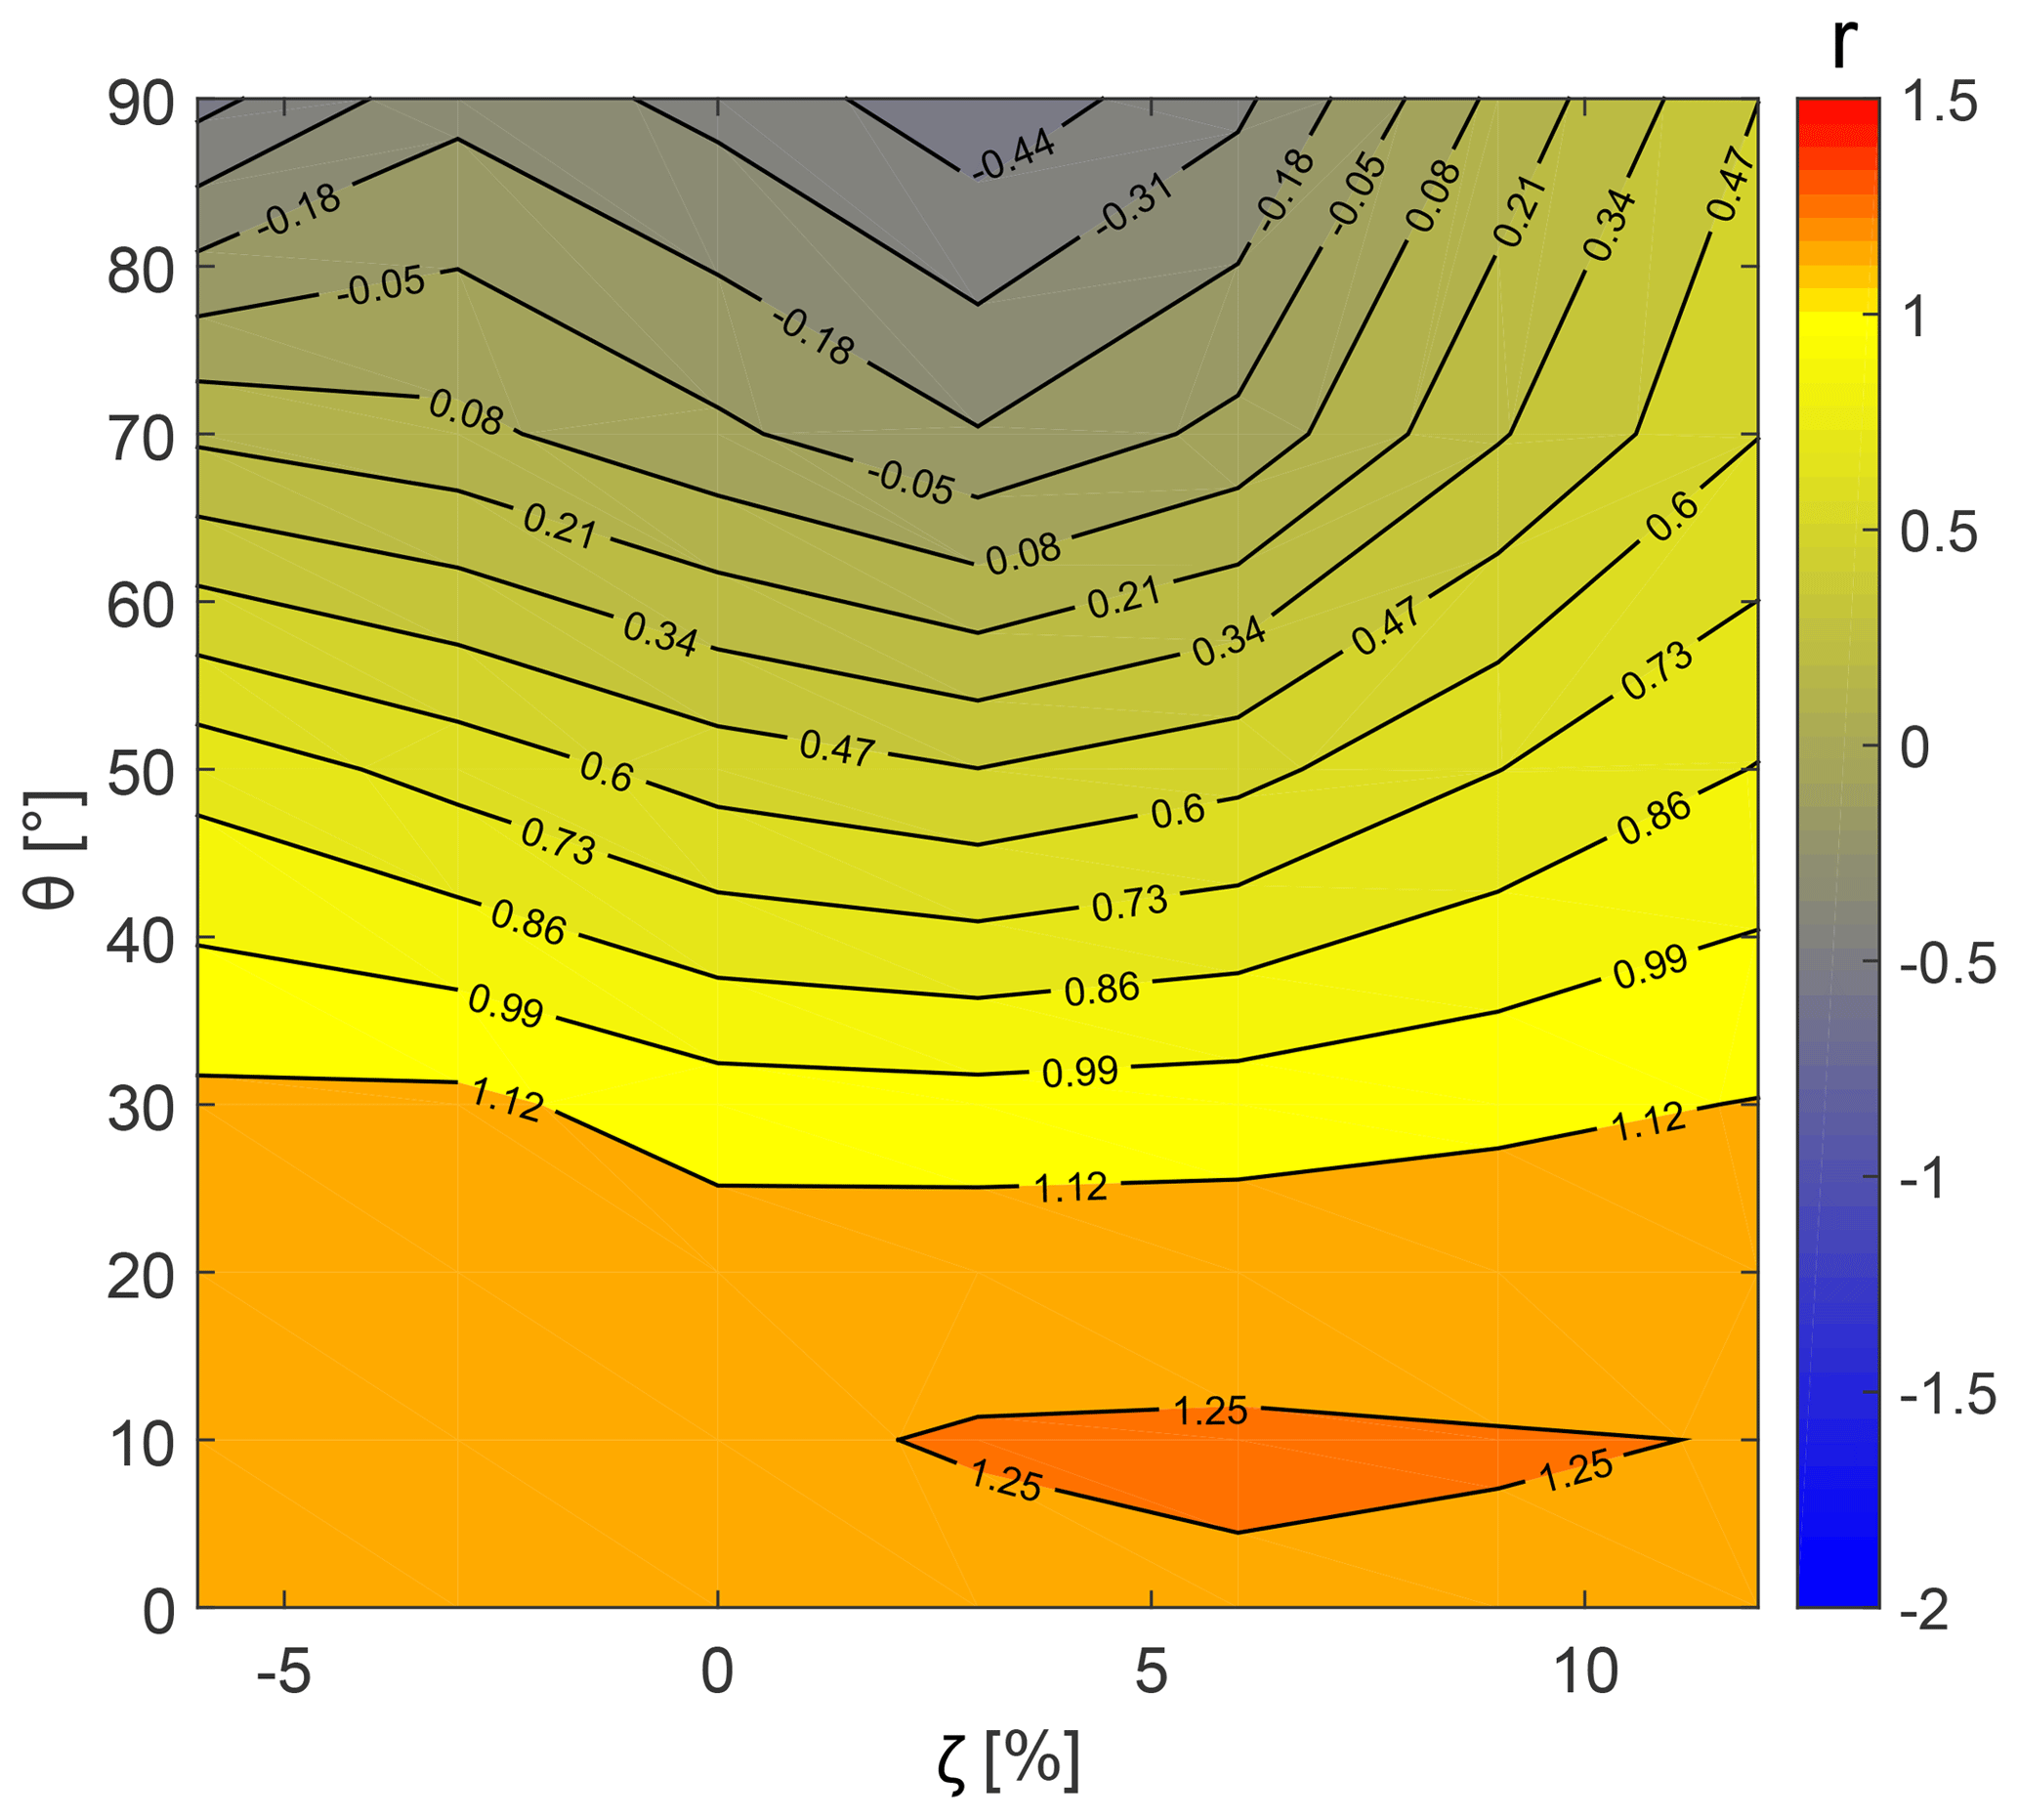
Figure 11Effect of variable radial gap and the flap deflection angle on the power augmentation factor using the panel method.
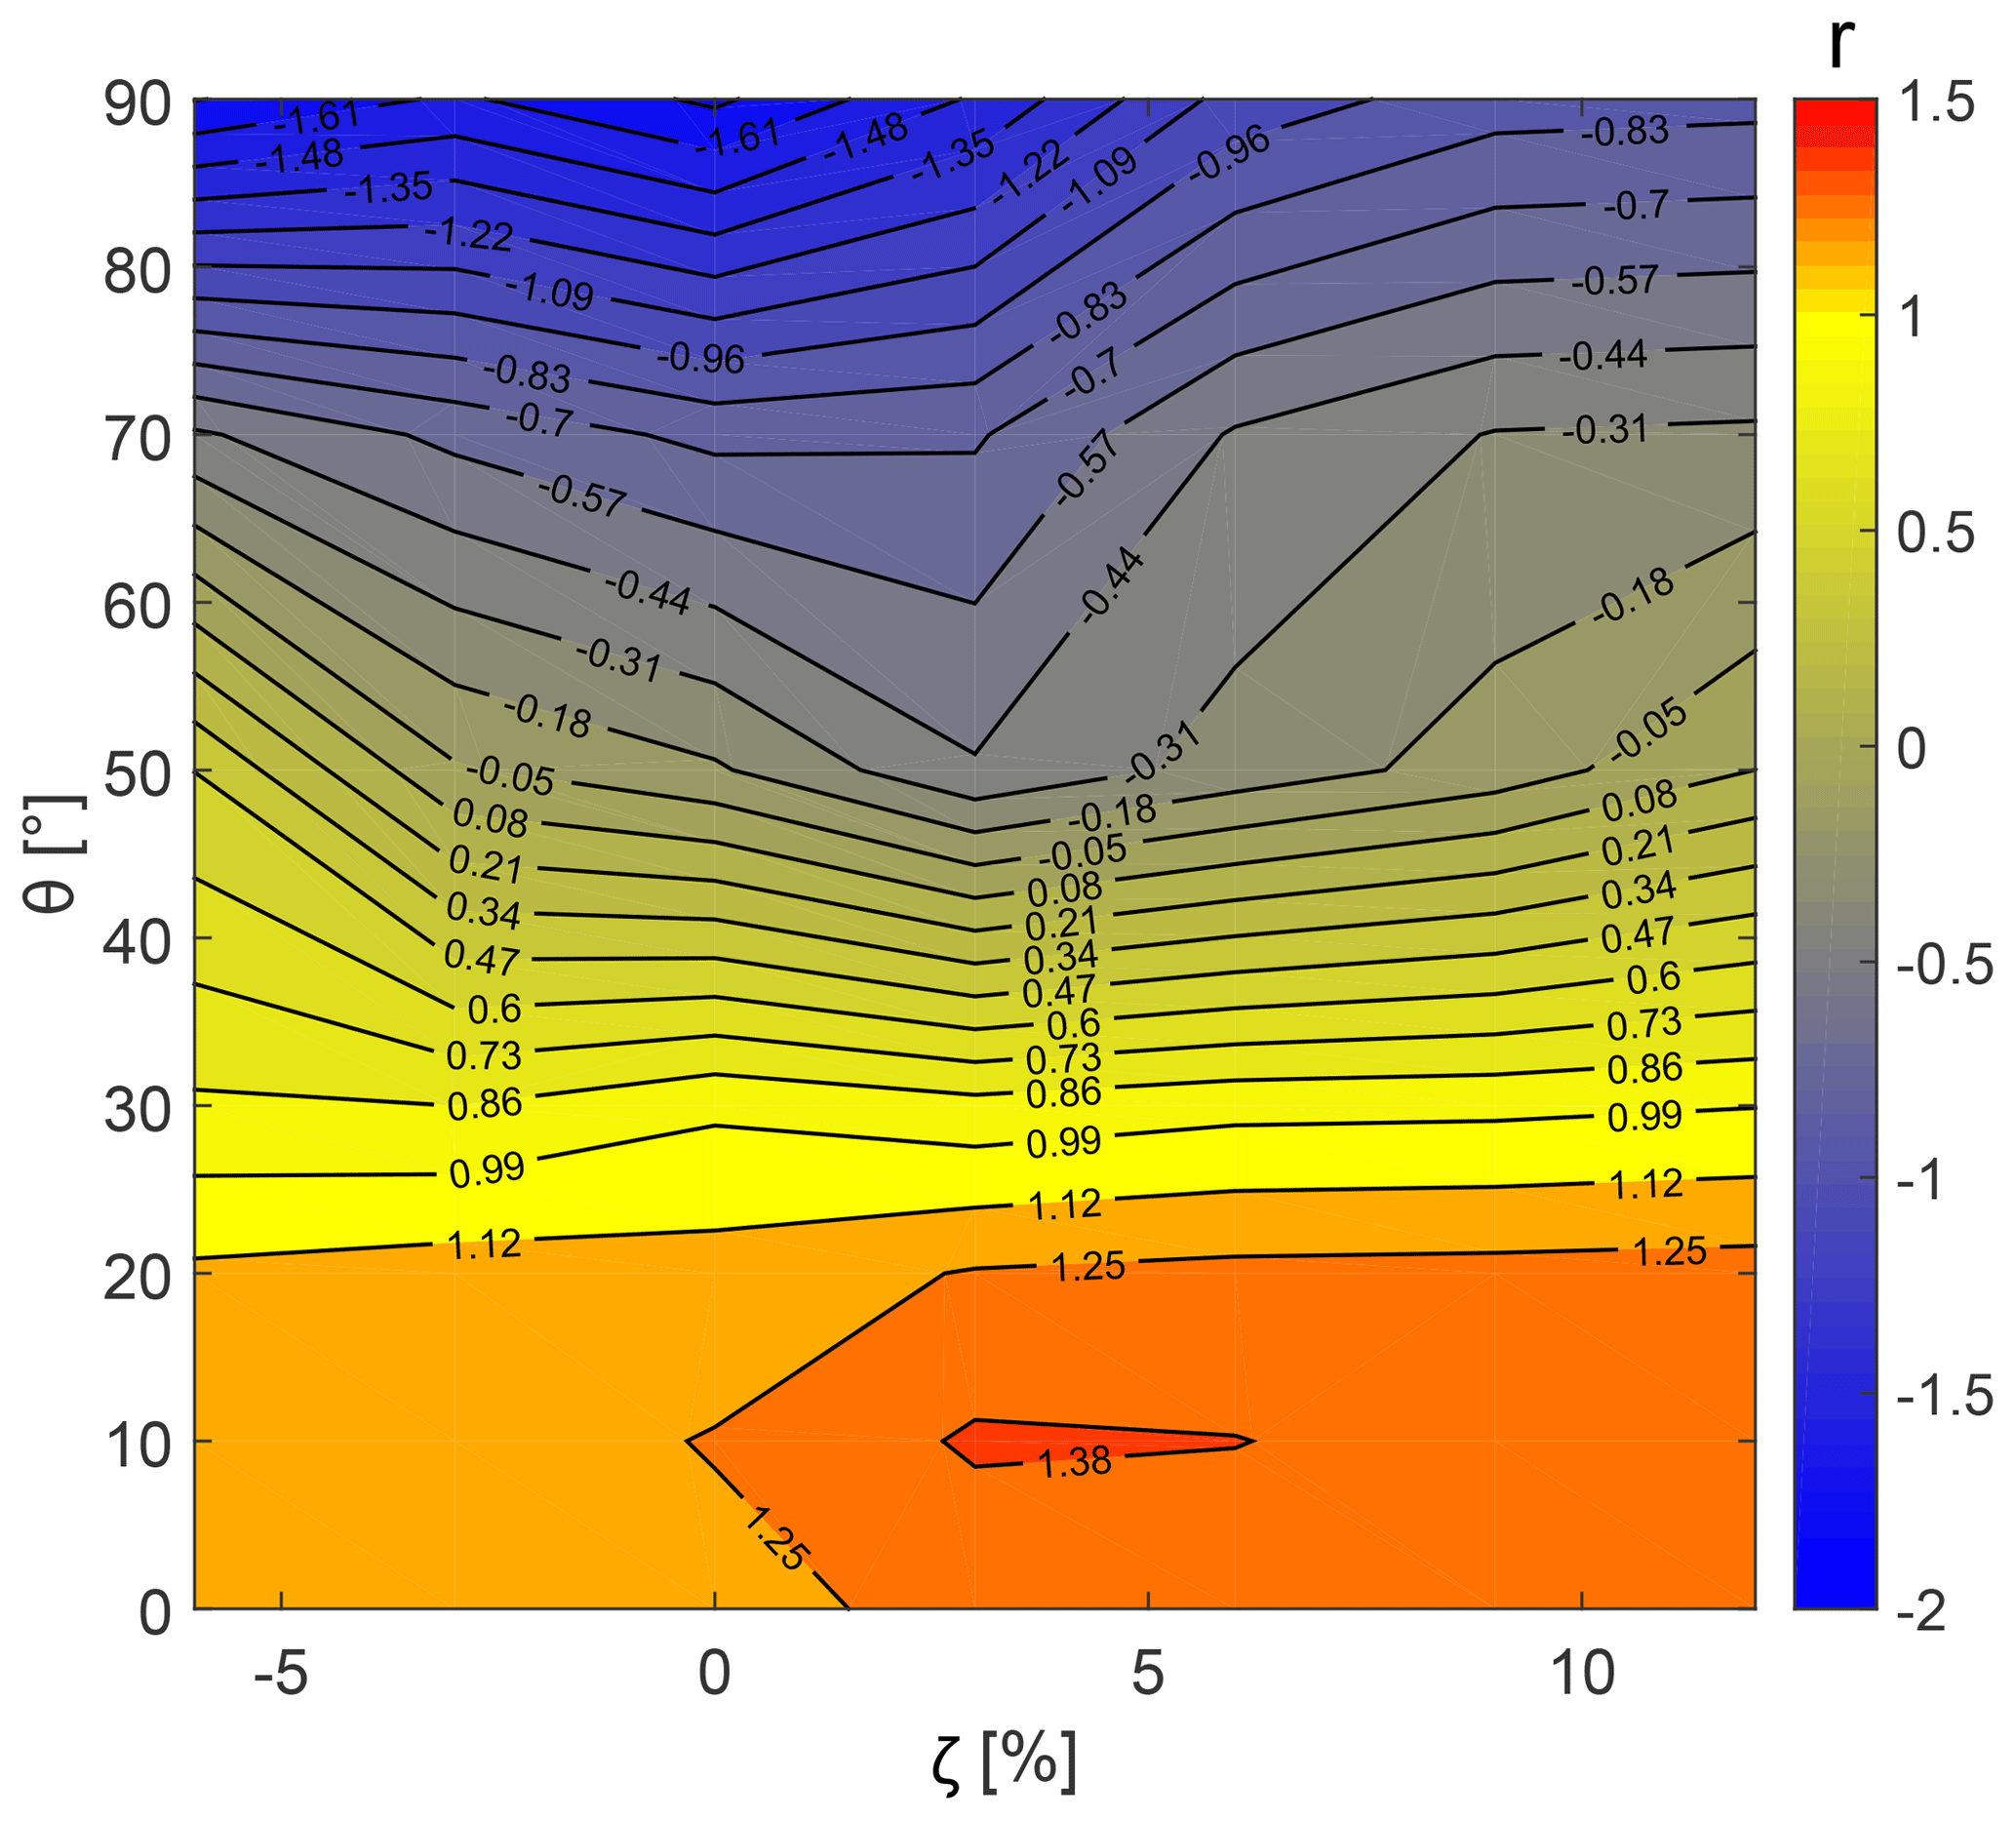
Figure 12Effect of variable radial gap and the flap deflection angle on the power augmentation factor using the RANS method.
A comparison of rmax obtained from CFD simulations with the one-dimensional axial momentum theory (van Bussel, 2007) is carried out. The analysis of AMT is not reported herein for the sake of brevity; a description of the AMT theory applied is reported in Appendix . The velocity and pressure values within a DWT, using the AMT approach, are determined by applying the relations of duct expansion ratio β and back-pressure velocity ratio γ. With the AMT approach, the maximum power augmentation factor of rmax=1.50 for ζ≈5 % and θ≈10∘ is obtained. In comparison to the CFD methods, the AMT approach does not take into account the effects of multi-element duct geometry and the nonlinear mutual interaction between the multi-element duct and the AD. As a result, the values of CP and the power augmentation factor r, determined using the AMT approach, are overestimated in comparison to the CFD methods shown in the above discussion.
In this work, the aerodynamic performance of a multi-element DWT is studied using a numerical approach. To this aim, two-dimensional numerical calculations using the panel method and the RANS method are employed. A simplified AD model is used for simulating the rotor. Based on the existing studies conducted by the authors, the multi-element duct geometry consists of a DonQi D5 airfoil and a NACA 4415 airfoil for the duct and the flap cross sections, respectively. To validate the numerical methods, the present simulations are compared with similar experimental data. In order to deepen the design principles of multi-element ducts, the effects of radial gap ζ and the flap deflection angle θ on the global performance of DWTs are investigated. Clear trends of the multi-element duct thrust force coefficients CT,M and the power augmentation factor r are observed across a range of multi-element duct configurations. An increase in the flap deflection angle θ results in a decrease in CT,M, whereas an increase in the radial gap ζ shows an increase in CT,M. The analysis of flow field shows that flow separation in the multi-element duct inner walls increases for higher values of θ. This phenomenon determines the reduction in CT,M and ultimately the augmentation factor r. As expected, the RANS method is more suitable for representing solutions for highly deflected flap configurations. The viscous effects become stronger at higher flap deflection angles, and the panel method is inherently incapable of taking this into account. Regarding prediction of the near-optimal multi-element duct configuration, both the numerical methods show good agreement. Moreover, in comparison to the AMT approach, the CFD method fully takes into account the mutual interactions between the multi-element duct and the AD.
Datasets are available in the Supplement.
The velocity and pressure relations within a DWT are obtained using the AMT approach (see Fig. A1). Based on the geometry under consideration, the duct expansion ratio β=2.25 is established and the AD inside the duct operates at . V0=6 m s−1, corresponding to the numerical study reported above. Having said that, the velocity at the duct exit equals
Using the diffuser area ratio β, the velocity at the AD location equals
and the value of the back-pressure velocity ratio γ yields
Finally, the power coefficient considering AD surface area returns
where is the theoretical limit for maximum achievable performance for a bare wind turbine, most commonly addressed as the Betz limit. Then, the maximum power augmentation factor rmax equals

The supplement related to this article is available online at: https://doi.org/10.5194/wes-4-439-2019-supplement.
VVD compiled the literature review, performed the CFD simulations, post-processed the cases and wrote the bulk of the paper. FA contributed in almost all aspects of this study. OI provided the experimental data and participated in structuring the paper. GVB helped formulate the ideas in regular group discussions.
The authors declare that they have no conflict of interest.
The authors would like to acknowledge Gael de Oliveira, who served as a developer of the panel method used in this paper.
This research has been supported by the STW (grant no. 12728).
This paper was edited by Alessandro Bianchini and reviewed by two anonymous referees.
Abe, K. and Ohya, Y.: An investigation of flow fields around flanged diffusers using CFD, J. Wind Eng. Indust. Aerodynam., 92.3, 315–330, 2004. a
Aranake, A. C., Lakshminarayan, V. K., and Duraisamy, K.: Computational analysis of shrouded wind turbine configurations using a 3-dimensional RANS solver, Renew. Energy, 75, 818–832, 2015. a
Bontempo, R. and Manna, M.: Effects of the duct thrust on the performance of ducted wind turbines, Energy, 99, 274–287, 2016. a, b, c
de Oliveira, G., Pereira, R. B., Ragni, D., Avallone, F., and van Bussel, G. J. W.: How does the presence of a body affect the performance of an actuator disk?, in: Journal of Physics: Conference Series, Vol. 753, IOP Publishing, 2016. a
de Vries, O.: Fluid dynamic aspects of wind energy conversion, No. AGARD-AG-243, Advisory Group for Aerospace Research and Development NEUILLY-SUR-SEINE, France, 1979. a, b
Dighe, V. V., de Oliveira, G., Avallone, F., and van Bussel, G. J. W.: Towards improving the aerodynamic performance of a ducted wind turbine: A numerical study, in: Journal of Physics: Conference Series, vol. 1037, p. 022016, IOP Publishing, 2018a. a, b
Dighe, V. V., de Oliveira, G., Avallone, F., and van Bussel, G. J. W.: On the effects of the shape of the duct for ducted wind turbines, in: 2018 Wind energy symposium, 8–12 January 2018, Kissimmee, Florida, USA, 2018b. a
Dighe, V. V., de Oliveira, G., Avallone, F., and van Bussel, G. J. W.: Characterization of aerodynamic performance of ducted wind turbines: A numerical study, Wind Energy, https://doi.org/10.1002/we.2388, in press, 2019. a, b, c, d, e, f
Foreman, K. M. and Gilbert, B.: Diffuser for augmenting a wind turbine, US Patent No. 4,482,290, 1984. a
Foreman, K. M., Gilbert, B., and Oma, R. A.: Diffuser augmentation of wind turbines, Solar Energy, 20.4, 305–311, 1978. a, b, c
Igra, O.: The shrouded aerogenerator, Energy, 2.4, 429–439, 1977. a, b, c, d, e
Igra, O.: Research and development for shrouded wind turbines, Energy Convers. Manage., 21.1, 13–48, 1981. a, b
Lilley, G. M. and Rainbird, W. J.: Preliminary report on the design and performance of ducted windmills, College of Aeronautics, Cranfield, 1956. a
Loeffler, A. L. and Vanderbilt, D.: Inviscid flow through wide-angle diffuser with actuator disk, AIAA J., 16.10, 1111–1112, 1978. a
Samson, J. and Katebi, R.: Shroud design criteria for a lighter than air Wind Energy System, in: Journal of Physics: Conference Series, Vol. 524, p. 012079, IOP Publishing, 2014. a
Tang, J., Avallone, F., Bontempo, R., van Bussel, G. J., and Manna, M.: Experimental investigation on the effect of the duct geometrical parameters on the performance of a ducted wind turbine, in: Journal of Physics: Conference Series, Vol. 1037, p. 022034, IOP Publishing, 2018. a
van Bussel, G. J. W.: The science of making more torque from wind: Diffuser experiments and theory revisited, in: Journal of Physics: Conference Series, Vol. 75, p. 012010, IOP Publishing, 2007. a, b, c, d
Versteeg, H. K. and Malalasekera, W.: An introduction to computational fluid dynamics: the finite volume method. Pearson education, 2007. a
- Abstract
- Introduction
- Multi-element duct–AD flow model
- Numerical validation
- Numerical approach
- Results and discussion
- Conclusions
- Data availability
- Appendix A: rmax calculation using AMT
- Author contributions
- Competing interests
- Acknowledgements
- Financial support
- Review statement
- References
- Supplement