the Creative Commons Attribution 4.0 License.
the Creative Commons Attribution 4.0 License.
First identification and quantification of detached-tip vortices behind a wind energy converter using fixed-wing unmanned aircraft system
Alexander Rautenberg
Andreas Platis
Marion Cormier
Jens Bange
In the present study, blade-tip vortices have been experimentally identified in the wake of a commercial wind turbine using the Multi-purpose Airborne Sensor Carrier Mark 3 (MASC Mk 3) unmanned aircraft system (UAS) of the University of Tübingen. By evaluation of the wind components, detached blade-tip vortices were identified in the time series. From these measurements, the circulation and core radius of a pair of detached blade-tip vortices is calculated using the Burnham–Hallock (BH) wake vortex model. The presented data were captured under a dominating marine stratification about 2km from the North Sea coastline with northern wind direction. The measured vortices are also compared to the analytical solution of the BH model for two vortices spinning in opposite directions. The model has its origin in aviation, where it describes two aircraft wake vortices spinning in opposite directions.
An evaluation method is presented to measure detached-tip vortices with a fixed-wing UAS. The BH model will be used to describe wake vortex properties behind a wind energy converter (WEC). The circulation and core radius of detached blade-tip vortices will be calculated. Also a proposition of the model for WEC wake evaluations will be made to describe two independent co-rotating vortices. Quantifying blade-tip vortices helps to understand the process of vortices detaching from a rotor blade of a wind turbine, their development in the wake until finally dissipating in the far wake and contributing to overall atmospheric turbulence. This is especially interesting for set-ups of numerical simulations when setting the spatial resolution of the simulation grid.
- Article
(8920 KB) - Full-text XML
- BibTeX
- EndNote
The wind energy sector has been growing worldwide for decades and the produced power from wind energy is still growing. Not only the amount of installed wind energy converters (WECs) is increasing but also the capacity of a single turbine. Also the field of application has widely increased with WEC. There are systems available for homogeneous terrain, off or near the shore, or even complex terrain with a high amount of additional turbulence stress that is induced onto the wind turbine's blades.
A modern off-shore WEC delivers up to 12 MW of power in ideal conditions. In wind energy research, numerical simulations of the wind velocity field of a WEC and its produced turbulence are important tools that give valuable information. Pressure and velocity distributions around a turbine blade and nacelle as well as in the wake can be studied. A numerical model increases its validity when it is backed by real-world in situ data. Once measured data have revealed some possible tweaks and enhancements to a model, improvements can be made and flow back into the (e.g. numerical) model. Numerical simulation might underestimate peak vorticity and radii of wake vortices, especially when the grid size of the simulation is not sufficient (Kim et al., 2016). Another way of studying WEC wakes are wind tunnel experiments that try to recreate wake patterns in a smaller scale (e.g. Bartl et al., 2012, or Vermeer, 1992). While in the early days of wind tunnel experiments the wake was visualised by smoke trails, PIV (particle image velocimetry) measurements have increased the resolution and accuracy of wind tunnel experiments drastically (e.g. resolving Reynolds shear stress and turbulent kinetic energy; Zhang et al., 2012). But a common issue with wind tunnel measurements is that they usually suffer from scaling problems (Wang et al., 1996). Remote sensing techniques like lidar have also found their way into WEC wake evaluations. Various measurement strategies were developed to visualise WEC wakes, e.g. in complex terrain (Barthelmie et al., 2018). Typical lidar scans provide a long-term measurement of a probed volume or plane. The spatial resolution (25–50 m), however, is comparably coarse. Lidars can provide a continuous monitoring of WEC wake structures (e.g. wake centre, direction and wind velocity deficit) (Bodini et al., 2017) in homogeneous or even in complex terrain (Wildmann et al., 2018). Short-range continuous-wave lidars provide even higher spatial resolution for short focal distances and have been applied in WEC wake measurements (Menke et al., 2018), yet these measurements can still not resolve blade-tip vortices. UAS (unmanned aircraft system) measurements can provide in situ line measurements, covering a small volume but with a high temporal and spatial resolution in (deca-) centimetre range. The coverage of these scales is important to measure detached-tip vortices in the near wake of a WEC.
A WEC, especially in a stable marine ABL (atmospheric boundary layer), acts as a turbulence generator. The added turbulence has two main sources. On the one hand, there is the increased wind shear in the wake that results from the wind deficit in the near wake and the low-pressure bulb that develops behind the WEC nacelle. On the other hand, turbulence is created by expansion and dissipation of detached blade-tip vortices that transfer their kinetic energy to the surrounding flow. A proper understanding of these vortices and their induced load onto the converter blade is of great importance for future enhancement of life span and working loads of wind energy converters in wind farms. Blade-tip vortices follow a helical pattern into the wake, detaching from each converter blade. These detached eddies can be measured with the mounted five-hole-probe on the MASC UAS. Subramanian et al. (2015) detected tip vortices via pressure fluctuations qualitatively in a flight pattern along the wake, also using a small UAS. In this study, an evaluation method is presented to measure the core radius rc, circulation Γ and maximum tangential velocity Vt,max of a tip vortex using in situ wind measurements from UAS flights perpendicular to the mean wind velocity.
2.1 Research aircraft
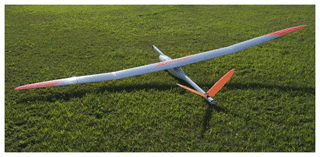
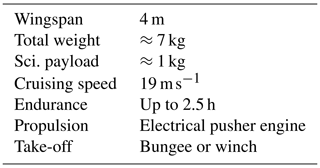
The research UAS MASC Mk 3 (see Fig. 1 and Table 1) is a fixed-wing airborne measurement system of the University of Tübingen that has been used in several measurement campaigns and has been described by Wildmann et al. (2014a, b). The third iteration of this platform features some changes to the fuselage. The electrical pusher motor has been moved from a centre position behind the wings to the tail, accelerating the aircraft along the centre axis and increasing flight stability. The MASC Mk 3 system allows in situ high-frequency measurements of the atmospheric flow and its transported properties. A detailed description of the improved UAS and its instruments can be found in Rautenberg et al. (2019b). The latest iteration MASC Mk 3 is using an improved IMU (inertial measurement unit) and positioning system.
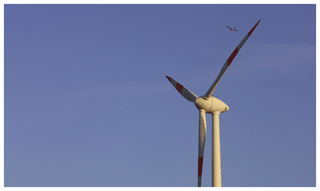
Figure 2Research UAS MASC Mk 3 in front of an Enercon wind energy converter at the Jade Wind Park in July 2018. (Photo taken by the author.)
Aside the changes in fuselage design, the former Research Onboard Computer System (ROCS) autopilot operating on the MASC Mk 2 system has been changed to the Pixhawk 2.1 autopilot. This is an independent open-hardware and open-source autopilot project (Pixhawk-Organisation, 2019).
2.2 Measurement site
Figure 3 shows the location of the measurement site in the north-west of Germany and the flight tracks of the MASC Mk 3 unmanned aerial vehicle (UAV) around the Enercon E-112 converter. Both tracks are part of a rectangular flight pattern around the WEC in an anti-clockwise direction. For the wake data evaluation, only the data captured along the southern flight tracks (orange path in Fig. 3) are used. The E-112 WEC is the most powerful converter in the Jade Wind Park north of Wilhelmshaven, Germany. The particular converter is a former near-shore prototype with a rotor diameter D of 114 m delivering up to 4.5 MW of electrical power and thus comparable to an actual off-shore WEC. The Jade Wind Park is located about 2 km from the North Sea coastline and a maritime influence in the wind profile can be expected.
Apart from surrounding WECs (to the south of the E-112 WEC) power lines to the east and north and industrial buildings to the north and north-east (not in the picture) restricted the flight path to the ones depicted in Fig. 3.
For this study of the near wake of a WEC, the wind turbine described above has been chosen. This specific converter and its location near the coast is comparable with off-shore converters in marine flow which was a requirement when choosing the WEC. The measurements are part of the HeliOW project, in which the atmospheric turbulence in front of and in the wake of a WEC is the foundation of a chain of numerical simulations. The goal of the project is also to determine safe helicopter flight paths in off-shore wind energy parks. The numerical simulation chain also includes CFD simulations of the wind turbine (University of Stuttgart) which are injected in flight-mechanical simulations of a helicopter (provided by Technical University of Munich and DLR Braunschweig). Thus, the tip vortex measurements are an important contribution to the validation of later numerical simulations of the flow.
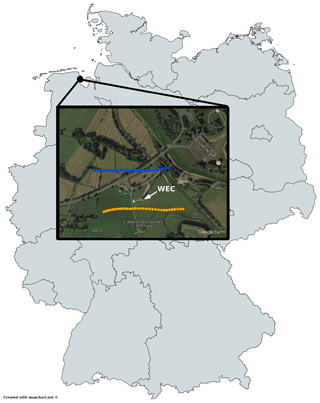
Figure 3Location of the E-112 WEC in the north-west of Germany north of Wilhelmshaven near the North Sea coast. MASC flight tracks in front (blue) and in the wake (orange) of the E-112 with northern main wind direction (5∘ north that day). On the © Google Earth image, the WEC is oriented toward the south-easterly wind direction. The map was created with https://mapchart.net (last access: 1 July 2019).
2.3 Available data
For the tip vortex evaluation, five flight legs (straight and level fly-by instances) are available 0.25 D downstream of the WEC rotor plane. Only one of these legs shows the necessary criterion for the circulation and core radius calculation (see the following sections). The one leg (two vortex measurements) that fits the criterion will be shown exemplary to present the evaluation method and the analytical solution using the BH model approach, including also the approach by Sørensen et al. (2014). At the remaining measurements, it often occurred that the measurement range of the pressure transducer, connected to the five-hole probe, was overstepped by the pressure differences created by the blade-tip vortex. These measurements could not be used for evaluation due to the absence of data at the vortex measurement.
The presented data were captured within a 15 min lasting flight pattern at about 18:30 LT (UTC+2) on a summer day. It can be expected that atmospheric conditions (wind direction and speed, thermal stratification, turbulence intensity) did not change significantly during this period. The average wind speed in the inflow was 8.8 m s−1 from the northerly direction (5∘) with a turbulence kinetic energy (TKE) of ≈0.1 m2 s−2 at hub height. These values have been calculated from a 10 s measurement (≈200 m flight distance) in the undisturbed atmosphere.
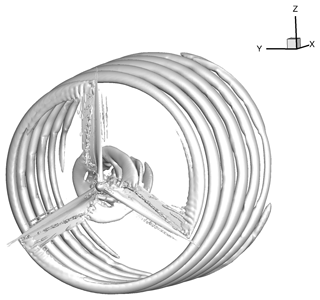
With the goal to measure detached-tip vortices behind a WEC, it is helpful to have at first an understanding of the behaviour of those vortices. Figure 4 shows the helical vortex pattern forming behind a WEC by representing the isosurfaces of the λ2 criterion of detached-tip vortices from computational fluid dynamics (CFD) simulation. The fully resolved unsteady Reynolds-averaged Navier–Stokes (URANS) simulation has been performed by the University of Stuttgart with the compressible flow solver FLOWer (Kroll and Fassbender, 2005), using the Menter SST (Menter, 1994) turbulence model. The modelled rotor is a stand-alone generic model of the Enercon E-112 WEC rotor, based on free-access airfoil data. For more details regarding the numerical methods, please refer to Cormier et al. (2018) in which the same methods have been applied and described. Figures 5 and 6 give a qualitative impression of the presence of the WEC wake. In both horizontal wind velocity and TKE, the wake and its effects are visible. Further downstream the helical pattern will start to meander and the symmetrical pattern will dissipate into turbulence. In the near vicinity of the WEC nacelle, these vortices follow a helical pattern. The helical structure is shown simplified by a ring vortex in Fig. 7 which is an approximation of the wake vorticity at high tip-speed ratio. The tangential velocity in this sketch can be split in its horizontal components at hub height (nacelle height). Here, the y axis points north (ideally anti-parallel to the main wind direction), similar to the conditions at the HeliOW campaign (see Fig. 3), and the x axis points east along the UAS flight path. Note that, at hub height, the tip vortex ideally has no w component (Fig. 7) under the vortex ring assumption. Thus, at this height, the tangential velocity can be split into its horizontal components u and v. The red rectangle indicates a change of perspective, showing a top view of a vortex spinning in the x−y plane. In reality, from planing flight paths until take-off of the UAS and the actual measurement, the wind direction changes slightly. Therefore, for later evaluations, the coordinate system has been rotated into the main wind direction.
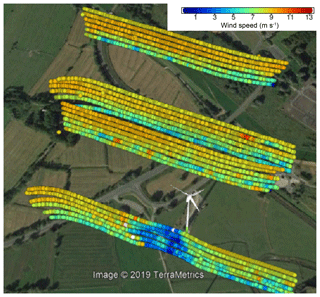
Figure 5Visualisation of the horizontal wind measurements at different flight leg altitudes (from 85 to 185 m above ground in 20 m steps) and different distances to the WEC (1, −1, −2 and −4 D). Significant wind deficit 1 D behind the WEC E-112. On this day, the wind direction was about 30∘ north. Image generated in © Google Earth.
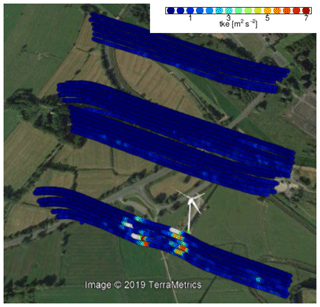
Figure 6Visualisation of the TKE from the same measurements as in Fig. 5. Blue areas represent low turbulence and red the highest measured turbulence. At 1 D, the presence of the wake and the produced turbulence by the tip vortices is visible. The averaging window for the for TKE calculation is 1 s, corresponding to 100 data points, and suits qualitative reading only. Image generated in © Google Earth.
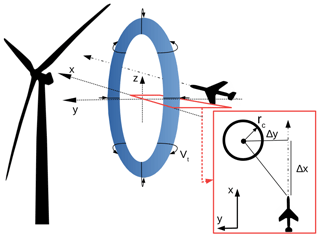
Figure 7Simplified sketch of a vortex pair passed by the UAS to the right. In reality, it would have rather a helical pattern than a ring shape. Velocities and axis are according to meteorological standards; therefore, axis and orientation are according to the in situ conditions. The y axis points north; x axis points east. At hub height, the w component (along z axis) vanishes. The red rectangle illustrates a top view of a tip vortex with distance Δy to the UAS.
3.1 Vortex model
To measure and evaluate tip vortices from UAS data, an analytical vortex model has to be found. Previous efforts to define a vortex were reviewed, e.g. by Jeong and Hussain (1995), comparing several definitions with data from direct numerical simulations and exact solutions of the Navier–Stokes equations. A universal definition of a vortex or a generally applicable model does not exist. Assuming incompressible flow and an irrotational velocity field, where the curl of the gradient of the velocity is zero, the circulation Γ, representing the strength of a vortex around a contour C, can be connected to the vorticity flux by Stokes' theorem. For any surface S that spans the curve C and dI being an infinitesimal tangential element along C,
The circulation Γ is the line integral of the tangential velocity along the curve C which is equal to the vorticity flux through the surface S, with n being the normal vector of the surface.
A circular integration in a cylindrical polar coordinate system with the azimuthal angle ϕ and the radius r yields
For a two-dimensional axisymmetric vortex, the circulation
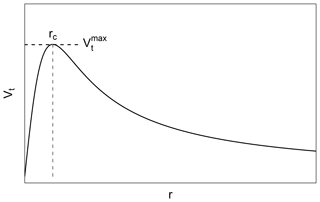
is a simple function of the radius and the tangential velocity Vt. Since real vortices in fluids experience viscous effects, the structure of detached-tip vortices of the blade of WEC cannot be sufficiently described by Eq. (3). Close to the centre of the vortex, lower tangential velocities persist, increasing to their maximum at the core radius rc of the vortex and decreasing again for further distances r. To account for that, in the context of WEC and also for detached-tip vortices from the wings of aircraft, an analytical model is necessary.
Since in this study detached vortices of a WEC converter are treated similarly to aircraft wake vortices, a few similar model approaches were possible. A comparison of analytical vortex models for tip vortices created by aircraft has been done by Ahmad et al. (2014). Also Fischenberg (2011) measured wake vortices created by the VFW 614 ATTAS manned aircraft (DLR Braunschweig) and compared the results to two similar vortex models proposed by Lamb (1939) and Burnham and Hallock (1982). Fischenberg concludes that both models show the ageing processes of a vortex wake known from theory. In general, the model by Burnham–Hallock shows a slightly better agreement in circulation and tangential velocity to the conducted measurements by Fischenberg. Also Vermeer (1992) uses the BH vortex model successfully to describe WEC wake vortices. According to these findings and its simplicity, it has been decided to use the analytical solution for wake vortices by Burnham–Hallock in this study. While the two counter-rotating vortices in the BH model used in aviation interact with each other, the two opposite vortices in a WEC wake do not do that. This is an important detail to point out. So for the identification of the vortex parameters (Γ, rc), a model of two counter-spinning vortices is not necessary. Here, a stand-alone vortex is considered. For the later analytical solution of the whole flight path perpendicular to the WEC wake, the BH model for two vortices is consulted.
The BH model does not provide a solution for the whole wake structure but for an idealised 2-D cut. Describing two (independent) counter-rotating wake vortices with a simple analytical model and comparing it to in situ measurements is a new approach in studying wind turbine wake structures.
Having a look at the BH model, a vortex is described by its circulation Γ, tangential velocity Vt and its core radius rc. The tangential velocity is the velocity of the air circling the vortex centre and is a function of the distance r to the vortex core.
The core radius rc is defined as the distance from the vortex centre (or core) at which the tangential velocity is at its maximum (circular symmetry). So the radius rc is also the radius at which the surface integral (see Eq. 1) is maximal, considering a circular surface. For r=rc, the maximum tangential velocity becomes (Eq. 5)
Figure 8 shows the tangential velocity Vt distribution of a BH-modelled vortex with the highest tangential velocity at the distance r=rc. The distribution is circle symmetric with the vortex core (r=0) in its centre.
In order to estimate the circulation and size of rc from transects through the vortices with MASC in the wake of a WEC, the following procedure is proposed.
3.2 Evaluation method
As shown above, it is likely to measure tip vortices at hub height. At this height, a simplification of the two vortices can be made. The blade-tip vortices can be considered as two-dimensional vortices of circular shape in the horizontal plane, and ideally the w component can be neglected. After subtracting the mean wind v∞, the vortex tangential velocity is
The norm of the tangential velocity then is
When measuring with a UAS, the measurement can be considered a snapshot of the in situ conditions. Figure 9 differentiates between two different scenarios of the UAS passing a vortex. Both are shown from a top view. Both scenarios will be explained in detail in the following paragraphs, with first focussing on Fig. 9a. Here, the UAS passes the vortex at its closest distance (Δy), marked as point 3 in the sketch, with Δy>rc; thus, the vortex core radius is not reached. Points 1 and 2 mark the positions of two corresponding tangential velocities of identical absolute value, when approaching the vortex and moving away from it again. The measured signal is similar to the dashed black line in Fig. 10 that is an example for Δy=2rc. From such data, only point 3 can be identified, since it is the point at which the measured tangential velocity is at its maximum. Points 1 and 2 are somewhere left and right of the maximum, with L being unknown. There are indefinite combinations of Γ and rc that could describe the vortex using Eq. (4).
Equations (8), (9) and (10) are known to describe the velocities and geometry of the measurement. Vt,1 (Vt,2) is the tangential velocity at the point 1 (and 2). Since there are four unknown parameters (Γ, rc, L and r1,2), the problem is not solvable.
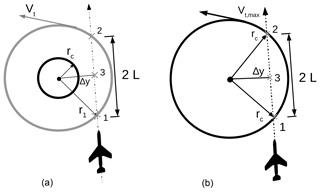
Figure 9Schematic of the UAS passing a vortex in the horizontal plane (top-down view). Two different cases have to be distinguished: the closest distance to the vortex Δy>rc (a) and the passing distance Δy<rc (b).
Now, we consider the case when the UAS passes a vortex at Δy<rc, as shown in Fig. 9b. The measured tangential velocity now provides a distinct feature: a double peak in the horizontal wind measurement. This double peak is caused by passing the maximum tangential velocity at r=rc at positions 1 and 2. Since the tangential velocity decreases from that point inwards (towards the vortex core), the velocity at point 3 is a local minimum, leading to a visible “dent” in the data (see red line in Fig. 10). Additionally, the ground speed of the UAS is known; hence, the distance L can be calculated. The three equations previously described above then become
With now only three (Γ, rc and Δy) unknown parameters, it is possible to solve the equations.
Dividing Eq. (12) by Eq. (11) eliminates Γ. Inserting Eq. (13) gives
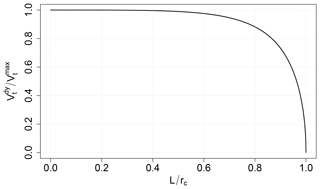
Equation (14) describes a tangential velocity ratio that is a function of L. Also L is known to range from 0 to rc. A dimensionless relationship () can be plotted and is shown in Fig. 11. By passing the vortex with Δy<rc and plotting the measured Vt against the distance to the vortex (Fig. 10), we can determine . Using the diagram in Fig. 11, we finally determine and thus rc.
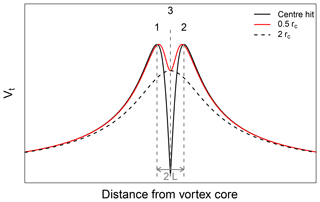
Figure 10Analytical solution of a UAS passing the vortex at a path crossing the centre (solid black line), passing at r=0.5rc (red line) and at a distance double the core radius (dashed black line). The peak-to-peak distance is 2 L (see Fig. 9), illustrated above for the solid black line.
3.3 Analytical reconstruction
As shown above, blade-tip vortices can be identified by their distinct “dent” feature, when the Δy<rc criterion is met. Basic geometry and the BH model further allow for a reconstruction (analytical solution) of the individually measured vortex, which is helpful to verify the measurements and evaluation technique. With Eqs. (15) and (16), the distance to each vortex core (centre), to and along the UAV flight path, can be calculated (Fischenberg, 2011). In Fig. 12, the distances of the UAS to two vortices spinning in opposite directions are shown. In the figure, vortex 1 is passed through its core and vortex 2 is passed with a slight offset. The flight path of the UAS is indicated with a dashed red line. Those distances are inserted into Eqs. (17) and (18) using the relation of Eq. (4); the tangential velocity along the meteorological x axis (u′ component) and y axis (v′ component) can be calculated:
While the y coordinate can be derived from the measurement (using Δy and the UAS position, s.a. Sect. 4.3) the x coordinate of the vortex xVortex 1,2 is the x coordinate of the flight path at the position “3”, e.g. Fig. 9.
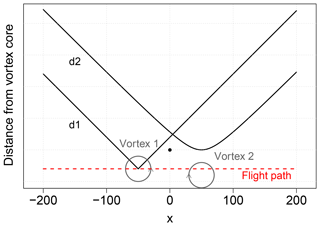
Figure 12Qualitative example of an ideal flight path (vortex 1) and a passing one with a little offset (vortex 2) of the UAS. For the field measurement, the distances d1 and d2 are calculated from the UAS GPS position and the location (offset) of the vortex in relative coordinates, with WEC at (0,0) indicated with a black dot. The vortex position can be derived from the extent of the tangential velocity Vt measured by the UAS and the peak-to-peak distance, explained in the previous sections. In this example, with Δy1=0 for d1 and for d2.
4.1 Vortex measurement
Figure 13a shows the component of the wind measurement behind the WEC at hub height. The data reveal several (near)-wake specific features. This flight leg shows two measurements of a tip vortex, indicated by the arrows in Fig. 13a. In between those two peaks, the wake deficit is measurable by a significant drop of the horizontal wind velocity. Due to the near vicinity to the nacelle, the wake deficit is dominated by turbulence created by the blade root vortices. Figure 14 shows a zoomed-in look at the measured vortices depicted in Fig. 13. Figure 14a shows the vortex measured while entering the wake (vortex 1) and 14b while leaving the wake (vortex 2). Both Fig. 14a and b show the plain UAS measurements.
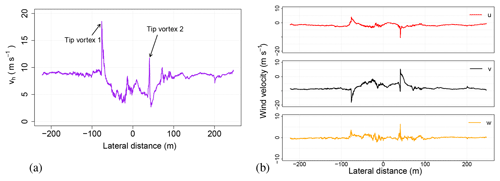
Figure 13(a) Horizontal wind vh measurement at hub height in the WEC wake at a distance of 0.25 D to the nacelle. The two tip vortices are indicated by the arrows. (b) The same measurement split into the three wind components (). The x axis is relative easting with the WEC position as origin (Δx in Fig. 7).
Figure 14c and d show the same measurement but the UAS coordinate system is rotated into the vortex rotational plane. This data rotation is necessary since the UAS travels and measures in the horizontal plane; the vortex rotational plane, however, differs slightly from the horizontal plane. This can be seen in the w component of the plain UAS measurement which is non-zero. To compensate for this fact, for the vortex evaluation, the data are rotated into the vortex rotational plane. This can be understood as the UAS canting into the rotational plane of the vortex to capture the rotational energy in a 2-D plane. Through the (individual) transformation, an error in the residual time series is introduced, but at a distance of ±rc around the vortex core where the evaluation takes place, the data are corrected. Meaning, in Fig. 14c, d, the dashed purple and solid purple lines are overlaid. A good indicator that the data rotation was successful is when the norm of the wind vector (dashed purple line) and the vh in between the dashed grey lines are about the same magnitude. Then it can be concluded that the two-dimensional vortex rotation (u and v components) includes the entire kinetic energy; i.e. the vertical wind component is now neglectable.
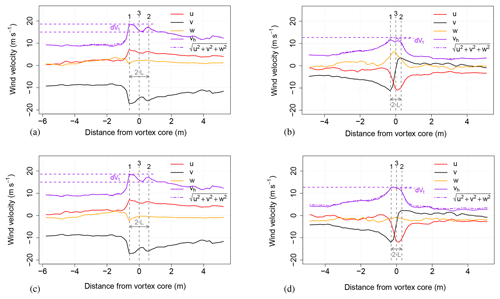
Figure 14Measured tip vortex 1 and tip vortex 2 from Fig. 13a. Dashed purple lines indicate the velocity deficit (dent), dashed grey lines the peak-to-peak distance. The horizontal wind velocity vh is a superposition of the tangential velocity and the horizontal wind of the inflow/surroundings. To eliminate the w component, the data have been rotated into the vortex coordinate system. This is necessary to measure the vortex correctly. Panels (a) and (b) show the plain UAS measurement of the vortices. (c, d) The UAS has been rotated into the vortex coordinate system (vortex plane) to capture the whole two-dimensional rotation.
Examining both vortices, the velocity distribution pattern of the UAS passing at distance r<rc is visible in the vh measurement. The horizontal wind velocity vh is a superposition of the tangential velocity, turbulence and the horizontal wind of the undisturbed inflow. The characteristics of the tangential velocity of vortex 1 (Fig. 14a, c) are almost solely determined by the v component, while in Fig. 14b, d the u component inheres an equal part. In the plain UAS measurement (i.e. before coordinate transformation), vortex 2 has a significant non-zero w component (Fig. 14b), indicating that the vortex did not rotate in the x−y plane. Especially Fig. 14d shows a significant reduction of the w component after the data rotation. Dashed purple lines indicate the velocity deficit dVt (dent); dashed grey lines indicate the peak-to-peak distance. The dot-dashed purple line can be interpreted as an extension of the horizontal wind velocity by the w component, essentially giving the norm of the wind vector:
Table 2 shows the derived parameters from the vortices depicted in Fig. 14. It has to be mentioned that vortex 1 made for a better and clearer measurement, since vortex 2 is influenced by the wind deficit and turbulence inside the wake. Vortex 1 shows a sharp jump in the tangential velocity which makes it easier to obtain the necessary quantities and provides more reliable results. The average of the obtained circulations is m2 s−1; the average core radius is m.
Figure 16 shows a two-dimensional cut through a skewed or canted vortex that results in an ellipse where the peak-to-peak distance is 2 L′. This peak-to-peak distance is underpredicted (). The introduced error Δy′ is visualised in Fig. 16 by dotted red lines. To overcome this issue, the measured data are rotated into the vortex hose if necessary. This simulates the UAS canting to follow the oblique vortex hose.
4.2 Quality control and error estimation
The wake of a WEC, especially as close as 0.25 D behind the nacelle, is a highly turbulent region. When measuring with an autonomous UAS, it is of interest whether the UAS is capable of manoeuvring stably in such an environment and if the measurement instrument (e.g. five-hole probe) is operating within its operational specifications. Figure 15a shows the attitude of the UAS while passing the WEC for the consulted flight leg and the angle of attack, sideslip and true air speed (panel b). The UAS is affected by the wake entry and exit. The motions of the UAS are well recognised by the IMU and auto-pilot (see Fig. 15a) and taken into account for the later post-processing. The UAS handles these motions without loss of control.

Figure 15(a) Attitude angles of the UAS from flight leg taken for the tip vortex evaluation. (b) Angle of attack (alpha) and sideslip (beta) at the five-hole probe. Dashed grey lines indicate the calibration range of the five-hole probe. Overstepped angles are extrapolated in post-processing. In blue is the true air speed of the UAS.
Dashed grey lines in Fig. 15b indicate the limit of the calibrated range of ±20∘ of the five-hole probe. Passing a tip vortex at Δy<rc is an extreme event, not only for the aircraft but also for the pressure probe. Angle of attack and sideslip are within the calibrated ranges, with one exception of vortex 1. Here, the sideslip is extrapolated. An examination of the true air speed (TAS) for the measurement (blue line in Fig. 15b) clearly shows the entry and exit of the wake. Changes in true air speed cannot be avoided. Usually small deviations from the calibrated TAS value of the five-hole probe do not result in significant changes in the calculated wind speed. The peaks visible in the TAS measurement, however, will have an effect on the wind velocity calculation. The influence of different air speed calibrations on UAS measurements is studied by Rautenberg et al. (2019a). There it is concluded that the deviation from the “true” wind speed is about 10 % or at most 1 m s−1, e.g. for a TAS error measured at vortex 2 of about 8 m s−1. So the peak velocities may be underestimated by 1 m s−1.
While this error has no significant influence on the ratio, it is significant when calculating the circulation Γ from Eq. (5). In the presented case, the circulation of vortex 2 is underpredicted by about 10 %.
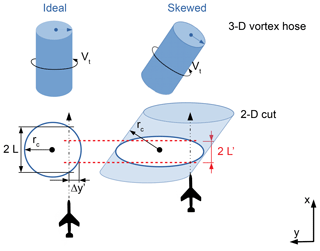
Figure 16Sketch of an ideal and skewed (exaggerated) vortex hose at hub height. The simplifications in the evaluation method only consider components in the x−y plane, which leads to an underprediction of the real peak-to-peak distance. The fact that the real “rc” does not lie in the x−y plane leads to an error. A horizontal cut through the vortex has an ellipsoidal geometry instead of a circular one, as in ideal measurement conditions.
4.3 Vortex reconstruction
The BH model provides a solution for two vortices spinning in opposite directions, as, for example, found in an aircraft wake. A similar constellation of vortex pairs can be found in a WEC wake at hub height (see Fig. 7), with their vortex cores positioned along the x axis. This approximation can only be done when the flight path is perpendicular to the wind (wake) direction to assure that the measured vortices are of the same age.
With the average values and retrieved from Table 2, the minimum measured tangential velocity between the two peaks (position “3” in Fig. 14) as well as a distance Δy can be derived. The resulting distance to the vortex core Δy can then be fed to a model, based on the BH approach. Figure 17 shows the analytical solution of u′ and v′ overlain with measured data of u an v. Overlain to the in situ data, the tangential velocity still contains the mean horizontal wind . For the analytical solution, the measured data have been rotated slightly (approximately 10∘) into the mean wind direction to fit the meteorological coordinate system with the vortex coordinate system, so the u component equals zero on average, and v is the predominant horizontal wind direction. In addition to the solely BH solution for the v′ component (dotted line in Fig. 17b), the long dashed line shows the same solution but multiplied with a correction factor to satisfy for the wind deficit in the wake. The general vortex model does not consider the mean horizontal velocity, so it needs to be accounted for, especially when there is a artificially induced drop behind the WEC in the wake (wake deficit). In the present case, the velocity deficit was measured to be about 65 %. It is visible as a jump in the mean horizontal wind between the two measured vortices. Similar deficits were already measured by Wildmann et al. (2014a) or Bartl et al. (2012). The velocity correction function is simply an upside-down Tukey window. The analytical solution remains uncorrected until it enters the wake of the WEC. After incorporating a deficit correction to the analytical solution, it is visible that the deficit in the wake plays an important role in the structure (placement, intensity, etc.) of the vortex, especially since the two vortices do not interact with each other, as the two vortices in the BH model for aircraft wakes do.

Figure 17Analytical solution (dashed lines) for u′ and v′ of the two vortices from the parameter evaluation. The corresponding wind components (u and v) from Fig. 13b from the UAS measurements are in grey. The long dashed solution in panel (b) additionally accounts for the deficit in the wake.
Here, we compare the airborne measured circulation Γ with data of the WEC itself. Equation (20) allows for a calculation of the blade-tip vortex strength by given parameters and describes the circulation for a rotor of constant thrust coefficient, e.g. (Sørensen et al., 2014):
with Nb being the number of blades and Ω the rotational velocity provided by the owner of the WEC. For the determination of the thrust coefficient CT, the following estimation is done.
The relatively low wind speed (v∞=8.8 m s−1 by UAS measurement) implies a pitch angle of β=0∘ when approximating the E-112 with the NREL 5 MW offshore WEC (Jonkman et al., 2009).
The tip-speed ratio () can also be calculated, and thus a thrust coefficient CT≈0.8 can be estimated from the CT–TSR relationship by Al-Solihat and Nahon (2018).
The calculated value for Γ from WEC-specific and atmospheric parameters is similar to the vortex strength that was extracted from the vortex measurements (average m2 s−1). The presented method, to calculate gamma from UAS data using a geometric simplification of the tip vortex and the application of the BH vortex model, provides reasonable results.
The BH vortex model does work for aircraft-induced vortices, as shown by Ahmad et al. (2014) as well as Fischenberg (2011), and as the results imply, it can be used to describe WEC wake vortex properties. Not least, both phenomena can be described by two vortices spinning in opposite directions, yet there is no interaction of the two opposite vortices, as usually intended in the aircraft wake model. Vortex patterns of a WEC wake show higher complexity than aircraft wake vortices. The whole wake is in motion, and different turbulence and shear forces interact with each other. Therefore, for the wake vortices, some simplifications had to be made; e.g. the shown evaluation method is only valid for a 2-D cut of the whole vortex hose. Also the blade root vortex was not analysed any further.
In this study, also the fact that the UAS experiences a change in TAS when entering the wake is addressed. Theoretically, the calibration range of the used five-hole probe is for a fixed air speed which changes when entering the wake. Since this evaluation uses the ratio of two velocities, the influence of a different calibration for the five-hole probe does not lead to a significant error. For the calculation of the circulation Γ, however, absolute velocities are necessary and a small error can be expected due to a change in TAS when entering and leaving the wake velocity deficit. The error is estimated to be ±10 % for the calculated wind velocities (Rautenberg et al., 2019a). An error estimation is given in Sect. 4.2.
The resulting circulation strength Γ derived from UAS data shows good accordance with the results obtained from Eq. (20). It can be concluded that the evaluation method, using the basic geometrical properties of a vortex, can be used to derive vortex properties in a WEC wake. Turbulence acting on the vortex and on the surrounding atmospheric flow can aggravate an evaluation since the evaluation is done mainly graphically. For example, the second tip vortex is embedded in a relatively high level of turbulence (wake deficit, shear, etc.). It also does not show a clear border to the undisturbed atmosphere as tip vortex 1 does. The reference velocity levels for the evaluation are therefore harder to extract from the measurements. Also a hit of a blade-tip vortex in flight changes the TAS locally and temporally, resulting in an error in the velocity measurement (usually 5 %–10 % off).
In addition, this method still has to be proven at larger distances to the WEC nacelle, where the vortices might begin to meander and get unstable. However, to our knowledge, this is the first quantitative analysis of WEC tip vortices using in situ measured turbulence data by a fixed-wing UAS.
The MASC Mk 3 system is capable of measuring detached-tip vortices in the wake of a WEC. The spatial and temporal resolution is sufficient to detect vortex patterns in the measurements. However, on many occurrences, the measured sideslip β left the calibration range of the five-hole probe in a matter that the corresponding pressure transducer was off the measuring range, leaving data lags in the time series. In conclusion, those measurements could not have been used.
For future measurements, the calibration of the (conical) five-hole probes could simply be expanded to larger angles up to ±40∘ (Fingersh and Robinson, 1998). This then allows for a lower TAS of the UAV, which in turn results in lower pressures at the pressure transducers and a better spacial resolution of the data. The path accuracy of the UAS will be upped by using an RTK (real-time kinematic) GPS. This will allow for precise back-calculations of the positions of the vortices. Wake meandering, wake and vortex widening can then be documented.
The proposed analytical vortex model by Burnham and Hallock is capable of describing WEC wake vortices. Yet, as for most analytical models, the analytical solution shown in this paper can and should be improved, e.g. to better fit the WEC wake (velocity deficit, blade root vortex near the nacelle). This evaluation was conducted with data obtained at 0.25 D from the nacelle. For a future additional field campaign, blade-tip vortices in the further wake shall be investigated.
The measurent UAS data can be provided by the authors (Moritz Mauz, Jens Bange, Andreas Platis) by ftp. Due to the amount and complexity of the data, we advise a brief introduction by the authors.
MM and JB developed the theoretical formalism and performed the analytic calculations and the UAS data evaluation. MC performed the numerical simulations and provided insights from a numerical point of view. AR added to the theory, piloted the aircraft and carried out the experiments with MM. All authors provided critical feedback and helped shape the research, analysis and paper.
The authors declare that they have no conflict of interest.
We thank Enercon GmbH for cooperation and WRD GmbH for the provision of a generic recreation of the E-112 geometry for the numerical simulations. For extensive technical support in the field campaign, we want to thank Martin Schön and Patrick Manz.
This research has been supported by the Projekträger Jülich, the BMWi (Federal Ministry for Economic Affairs and Energy) that funded the HeliOW project (0324121C) and the Deutsche Forschungsgemeinschaft.
This open-access publication was funded
by the University of Tübingen.
This paper was edited by Sandrine Aubrun and reviewed by two anonymous referees.
Ahmad, N. N., Proctor, F. H., Duparcmeur, F. M. L., and Jacob, D.: Review of Idealized Aircraft Wake Vortex Models, 52nd AIAA Aerospace Sciences Meeting, 13–17 January 2014, National Harbor, MD, USA, 2014. a, b
Al-Solihat, M. K. and Nahon, M.: Flexible Multibody Dynamic Modeling of a Floating Wind Turbine, Int. J. Mech. Sci., 142–143, 518–529, https://doi.org/10.1016/j.ijmecsci.2018.05.018, 2018. a
Barthelmie, R., Pryor, S., Wildmann, N., and Menke, R.: Wind turbine wake characterization in complex terrain via integrated Doppler lidar data from the Perdigão experiment, J. Phys. Conf. Ser., 1037, 052022, https://doi.org/10.1088/1742-6596/1037/5/052022, 2018. a
Bartl, J., Pierella, F., and Sætrana, L.: Wake Measurements Behind an Array of Two Model Wind Turbines, Enrgy. Proced., 24, 305–312, https://doi.org/10.1016/j.egypro.2012.06.113, 2012. a, b
Bodini, N., Zardi, D., and Lundquist, J. K.: Three-dimensional structure of wind turbine wakes as measured by scanning lidar, Atmos. Meas. Tech., 10, 2881–2896, https://doi.org/10.5194/amt-10-2881-2017, 2017. a
Burnham, D. C. and Hallock, J. N.: Chicago Monoacoustic Vortex Sensing System, Wake Vortex Decay, 4, 590–599, 1982. a
Cormier, M., Caboni, M., Lutz, T., Boorsma, K., and Krämer, E.: Numerical analysis of unsteady aerodynamics of floating offshore wind turbines, J. Phys. Conf. Ser., 1037, 072048, https://doi.org/10.1088/1742-6596/1037/7/072048, 2018. a
Fingersh, L. and Robinson, M.: Wind tunnel calibration of 5-hole pressure probes for application to wind turbines, 35th Aerospace Sciences Meeting and Exhibit, AIAA, USA, https://doi.org/10.2514/6.1997-854, 1998. a
Fischenberg, D.: Charakterisierung von Wirbelschleppen aus In-Situ-Flugmessdaten der Falcon D-CMET, Tech. rep., DLR Institut für Flugsystemtechnik, available at: https://elib.dlr.de/70300/ (last access: 21 August 2019), 2011. a, b, c
Jeong, J. and Hussain, F.: On the identification of a vortex, J. Fluid Mech., 285, 69–94, 1995. a
Jonkman, J., Butterfield, S., Musial, W., and Scott, G.: Definition of a 5-MW Reference Wind Turbine for Offsore System Development, Technical report, National Renewable Energy Laboratory, Colorado, 2009. a
Kim, Y., Jost, E., Bangga, G., Weihing, P., and Lutz, T.: Effects of ambient turbulence on the near wake of a wind turbine, J. Phys. Conf. Ser., 753, 032047, https://doi.org/10.1088/1742-6596/753/3/032047, 2016. a
Kroll, N. and Fassbender, J. K.: MEGAFLOW – Numerical Flow Simulations for Aircraft Design, Springer Verlag GmbH, Berlin Heidelberg, 2005. a
Lamb, H.: Hydrodynamics, Cambridge University Press, Cambridge, 1939. a
Menke, R., Vasiljević, N., Hansen, K. S., Hahmann, A. N., and Mann, J.: Does the wind turbine wake follow the topography? A multi-lidar study in complex terrain, Wind Energ. Sci., 3, 681–691, https://doi.org/10.5194/wes-3-681-2018, 2018. a
Menter, F.: Two-equation eddy-viscosity turbulence models for engineering applications, AIAA J., 32, 1598–1605, https://doi.org/10.2514/3.12149, 1994. a
Pixhawk-Organisation: PixHawk 2.1 Autopilot description, available at: http://pixhawk.org, last access: 1 July 2019. a
Rautenberg, A., Allgeier, J., Jung, S., and Bange, J.: Calibration Procedure and Accuracy of Wind and Turbulence Measurements with Five-Hole Probes on Fixed-Wing Unmanned Aircraft in the Atmospheric Boundary Layer and Wind Turbine Wakes, Atmosphere, 10, 124, https://doi.org/10.3390/atmos10030124, 2019a. a, b
Rautenberg, A., Schön, M., zum Berge, K., Mauz, M., Manz, P., Platis, A., van Kesteren, B., Suomi, I., Kral, S. T., and Bange, J.: The Multi-Purpose Airborne Sensor Carrier MASC-3 for Wind and Turbulence Measurements in the Atmospheric Boundary Layer, Sensors, 19, 2292, https://doi.org/10.3390/s19102292, 2019b. a
Sørensen, J. N., Mikkelsen, R., Sarmast, S., Ivanell, S., and Henningson, D.: Determination of Wind Turbine Near-Wake Length Based on Stability Analysis, J. Phys. Conf. Ser., 524, 012155, https://doi.org/10.1088/1742-6596/524/1/012155, 2014. a, b
Subramanian, B., Chokani, N., and S. Abhari, R.: Drone-Based Experimental Investigation of Three-Dimensional Flow Structure of a Multi-Megawatt Wind Turbine in Complex Terrain, J. Sol. Energ.-T. ASME, 137, 1007–1017, 2015. a
Vermeer, N.-J.: Local circulation on rotating wind turbine blades from velocity measurements in the wake of a model rotor, British Wind Energy Association Annual Wind Energy Conference 1992, Nottingham, 117–121, 1992. a, b
Wang, Z. Y., Plate, E. J., Rau, M., and Keiser, R.: Scale effects in wind tunnel modelling, J. Wind Eng. Ind. Aerod., 61, 113–130, https://doi.org/10.1016/0167-6105(96)00049-9, 1996. a
Wildmann, N., Hofsäß, M., Weimer, F., Joos, A., and Bange, J.: MASC – a small Remotely Piloted Aircraft (RPA) for wind energy research, Adv. Sci. Res., 11, 55–61, https://doi.org/10.5194/asr-11-55-2014, 2014a. a, b
Wildmann, N., Ravi, S., and Bange, J.: Towards higher accuracy and better frequency response with standard multi-hole probes in turbulence measurement with remotely piloted aircraft (RPA), Atmos. Meas. Tech., 7, 1027–1041, https://doi.org/10.5194/amt-7-1027-2014, 2014b. a
Wildmann, N., Vasiljevic, N., and Gerz, T.: Wind turbine wake measurements with automatically adjusting scanning trajectories in a multi-Doppler lidar setup, Atmos. Meas. Tech., 11, 3801–3814, https://doi.org/10.5194/amt-11-3801-2018, 2018. a
Zhang, W., Markfort, C. D., and Porté-Agel, F.: Near-wake flow structure downwind of a wind turbine in a turbulent boundary layer, Exp. Fluids, 52, 1219–1235, https://doi.org/10.1007/s00348-011-1250-8, 2012. a


