the Creative Commons Attribution 4.0 License.
the Creative Commons Attribution 4.0 License.
 | 17 Aug 2020
Validation of Sentinel-1 offshore winds and average wind power estimation around Ireland
Louis de Montera
Tiny Remmers
Ross O'Connell
Cian Desmond
In this paper, surface wind speed and average wind power derived from Sentinel-1 Synthetic Aperture Radar Level 2 Ocean (OCN) product were validated against four weather buoys and three coastal weather stations around Ireland. A total of 1544 match-up points was obtained over a 2-year period running from May 2017 to May 2019. The match-up comparison showed that the satellite data underestimated the wind speed compared to in situ devices, with an average bias of 0.4 m s−1, which decreased linearly as a function of average wind speed. Long-term statistics using all the available data, while assuming a Weibull law for the wind speed, were also produced and resulted in a significant reduction of the bias. Additionally, the average wind power was found to be consistent with in situ data, resulting in an error of 10 % and 5 % for weather buoys and coastal stations, respectively. These results show that the Sentinel-1 Level 2 OCN product can be used to estimate the wind resource distribution, even in coastal areas. Maps of the average and seasonal wind speed and wind power illustrated that the error was spatially dependent, which should be taken into consideration when working with Sentinel-1 Synthetic Aperture Radar data.
- Article
(1412 KB) - Full-text XML
- BibTeX
- EndNote


With the ever-increasing interest in offshore wind energy, the estimation of the available wind energy over large offshore areas has become necessary. According to the Global Wind Energy Council (Global Wind Council, 2014), offshore wind power costs are expected to reduce by about 45 % by 2050. One factor that can be associated with cost reduction is the increasing availability of accurate remote sensing data over large areas with a high resolution, which can significantly reduce project risk at the site-finding stage (McAuliffe et al., 2018). Moreover, the measurement of offshore wind speed contributes to the understanding of marine phenomena and boundary layer processes. Low-altitude meteorological parameters, such as wind, are therefore key parameters in the modelling of the Earth system.
Several studies have already attempted to assess the offshore wind energy potential using spaceborne scatterometers, such as ERS-1, ERS-2, NSCAT, QuickSCAT and ASCAT (Sánchez et al., 2007; Pimenta et al., 2008; Karagali et al., 2014; Bentamy and Croize-Fillon, 2014; Remmers et al., 2019). However, the grid spacing of these instruments is at best 12.5 km2, which prevents the assessment in coastal areas (0–20 km from the shore) and the study of fine sub-mesoscale processes that can affect turbine yields and climate processes. In this framework, spaceborne Synthetic Aperture Radar (SAR) sensors offer a much higher grid spacing, allowing for wind speed retrieval with a level of detail not discernible from scatterometer data.
In this study, the Sentinel-1 A and B Level 2 Ocean (OCN) product produced by the European Space Agency (ESA) was validated. This product, derived from SAR observations, provides measurement of neutral surface wind speed and direction at 10 m a.s.l. (above sea level) with a grid spacing of 1 km2. Even though this type of analysis was previously performed in other parts of Europe (Hasager et al., 2015), it has never been conducted using both marine and coastal in situ measurements at a national scale in Ireland, which has a significant offshore wind resource (Remmers et al., 2019). Moreover, to the authors' knowledge, the Sentinel-1 level 2 OCN product has not yet been validated against in situ measurements, with the exception of one match-up comparison in the waters adjacent to the Korean peninsula (Jang et al., 2019). Similarly, long-term statistics retrieved using this product, such as the average wind power, which is the most relevant for the wind energy industry, have never been analysed before.
The aim of this study was to validate and the Sentinel-1 A and B Level 2 OCN product against in situ measurements in Ireland and assess this data ability to describe the wind resources. First the satellite product and the study area are introduced, next the methodology is provided, and finally the results are presented and discussed.
2.1 Sentinel-1 SAR Level 2 OCN
Sentinel-1 A and B are two polar-orbiting satellites equipped with C-band SAR. This sensor, which records surface roughness, has the advantage of operating at wavelengths not impeded by cloud cover or a lack of illumination and can acquire data over a site during day or night in all weather conditions. The Sentinel-1 Level 2 OCN product includes a component called Ocean Wind Fields (OWI), which is a ground range gridded estimate of the surface wind speed and direction at 10 m a.s.l., assuming a neutral atmospheric stratification, with a grid spacing of 1 km2. The two satellites are located on the same orbit 180∘ apart and at an altitude close to 700 km. In Irish coastal waters, the acquisition mode is Interferometric Wide (IW) swath using the TOPSAR technique, which provides a better quality product by enhancing the image homogeneity (ESA, 2019). All Sentinel-1A and B SAR images in IW acquisition mode from 1 May 2017 to 1 May 2019, in the area located around Ireland between 51 and 56∘ N in latitude and 5 and 16∘ W in longitude, were collected (n=5509). The quality flag for these data ranges from 0 to 3 (0 being the best and 3 the worst) and, following visual inspection, only data with a quality flag ≤2 were used for the validation. The Level 2 product tiles were combined into a gridded map for the area of interest, in order to form a data cube where each pixel had a corresponding time series of measurements. The revisit rate ranges from 10 to 20 passes per month for most areas in Irish waters, which occur in the morning around 06:30 GMT or in the evening around 18:00 GMT (Greenwich mean time) in the winter and Irish standard time (IST) in the summer. Figure 1 shows the number of samples for each pixel, and Fig. 2 shows the average daily passing time of the satellites. The impact on quality flag from landmass contamination was visible with the reduced sample size in coastal areas. Areas with average passage times around noon mean that there are on average two satellite passages per day, one in the morning and one in the evening. Others areas have only one passage per day, in the early morning or evening. Data relating to areas with one passage per day are prone to diurnal bias in the wind statistics and so are less reliable.
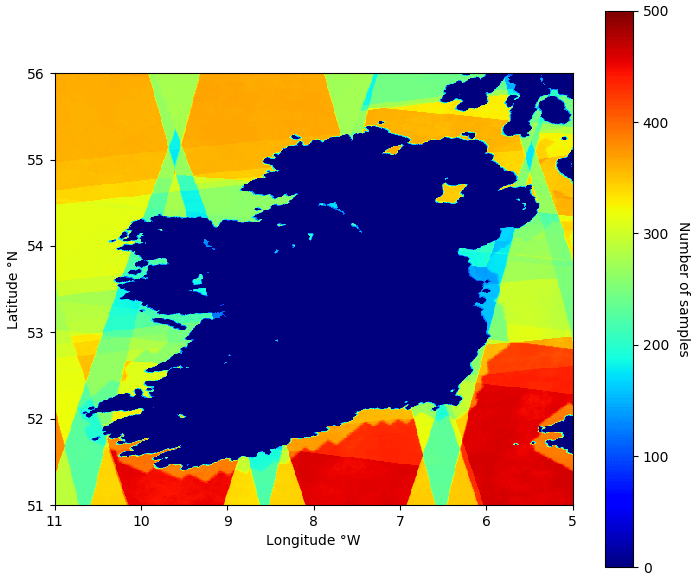
Figure 1Number of Sentinel-1 A and B passes across Ireland over a 2-year period running from May 2017 to May 2019 with an acceptable quality flag (≤2).

Figure 2Average daily hour of Sentinel-1 A and B passes across Ireland over a 2-year period running from May 2017 to May 2019 with an acceptable quality flag (≤2). Areas where the mean hour of passing is around midday indicate 2 satellite passages per day and are thus more reliable.
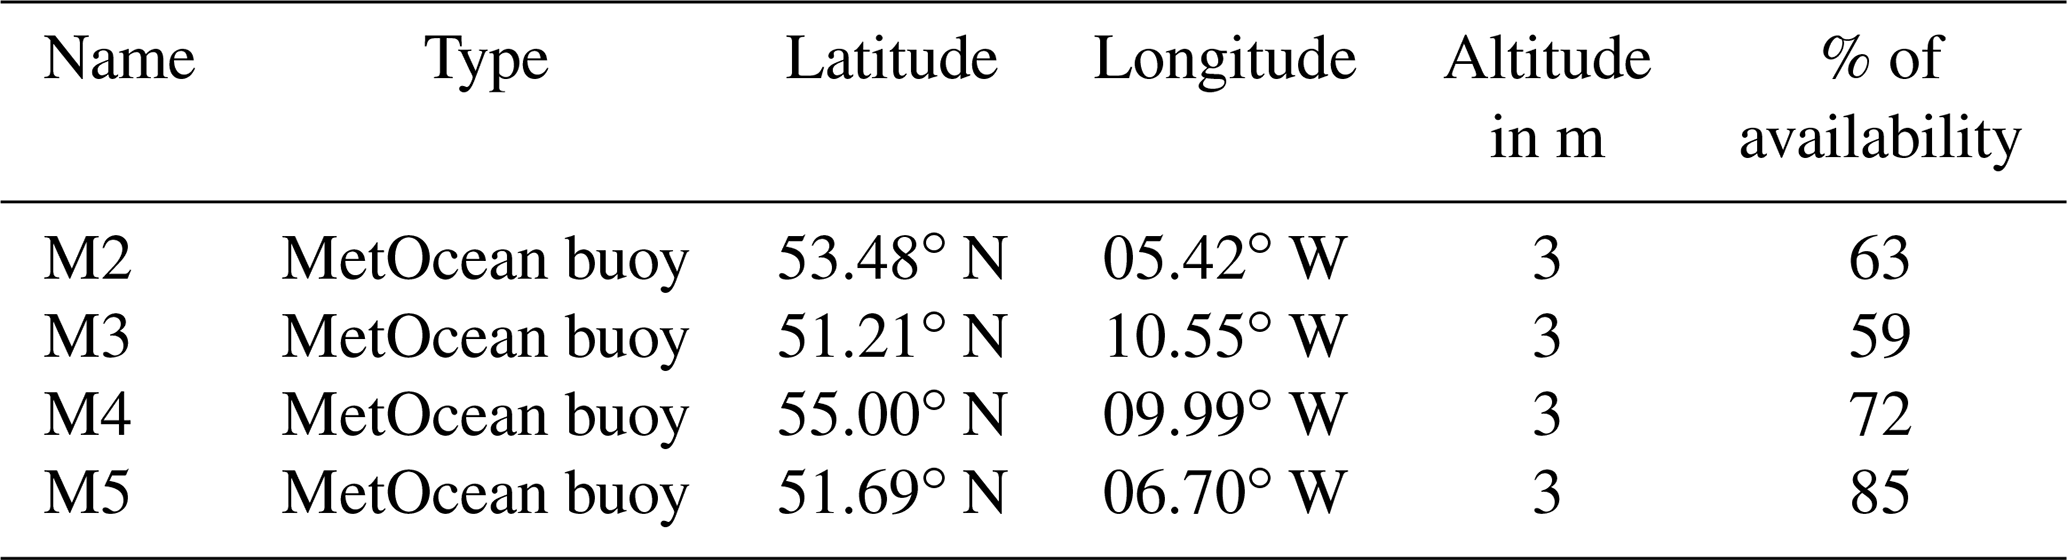
Table 1Location and characteristics of the weather buoys used in the comparison with Sentinel-1 SAR Level 2 OCN product.
2.2 In situ instruments
2.2.1 Weather buoys
Ireland's Marine Institute operates five offshore weather buoys named M2–M6. Their location is shown in Fig. 3. The data from these were downloaded from the Marine Institute website with a 2-year time series ranging from 1 May 2017 to 1 May 2019. The hourly product corresponds to the wind speed averaged over a period of 10 min every hour at 3 m a.s.l. As a result of extensive maintenance periods, the buoys are not always functional, leading to a lack of measurements in the dataset, up to several months, for some locations. Due to this phenomenon and a poor offshore coverage frequency from Sentinel-1 satellites, the M6 buoy was excluded in the validation analysis.
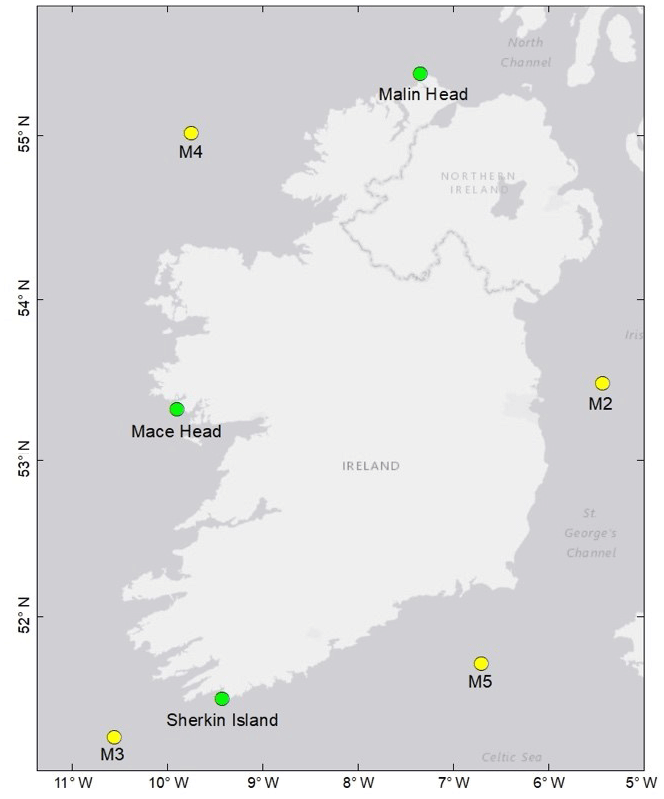
Figure 3Location of MetOcean buoys (yellow) and coastal weather stations (green) used in the validation of Sentinel-1 SAR surface winds.
In order to compare Sentinel-1 SAR Level 2 OCN product with this network of instruments, the in situ buoy measurements were extrapolated from 3 m to 10 m a.s.l. The following log law was used, assuming a neutral atmospheric stratification (Carvalho et al., 2017):
where U10 is the wind speed at 10 m (in m s−1), Ubuoy is the wind speed measured by the buoys (in m s−1), Zsat is the altitude of the satellite measurements (in m), Zbuoy is the altitude of the buoy measurements (in m), and Z0 is the roughness length of the sea surface (taken as 0.0002 m; Charnock, 1955). Table 1 gives the exact locations of these buoys and their percentage of availability.
2.2.2 Coastal weather stations
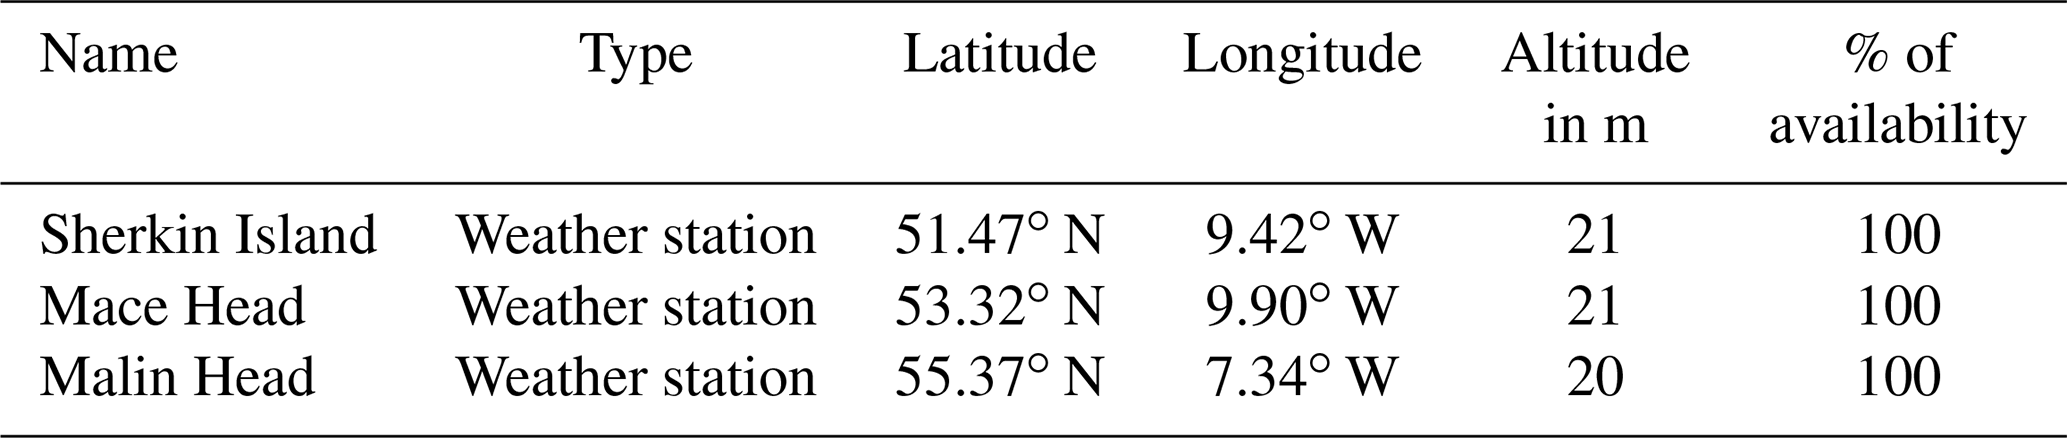
Three weather stations operated and maintained by Met Éireann, the Irish weather forecasting service, were used to validate the Sentinel-1 SAR Level 2 OCN wind speeds in coastal areas. These three stations were considered for the validation analysis because they are located close to the shore (less than 200 m, see Fig. 3), at a low altitude (∼20 m), and far from any hills or relief. The stations are situated on the west coast of Ireland at Sherkin Island, Mace Head and Malin Head and have continuous wind speed records during the 2-year period of study (Table 2). The predominant wind direction on the Irish west coast is eastward, flowing from the sea toward the land. Simulations of these type of flows have shown that for a moderate coastal slope, onshore wind speeds recorded in proximity of the shore can equate the wind speeds at sea just before reaching the coast (Bassi Marinho Pires et al., 2015). Following this principle, the wind speeds derived from satellite measurement were not scaled to the weather station terrain elevation but instead were considered as being in the same streamline and kept at the OCN product elevation of 10 m a.s.l. The weather station data were compared with Sentinel-1 SAR Level 2 OCN wind speeds measured with the closest pixel without a quality flag. Due to the complex Irish coastline and to avoid land contamination, the OCN measurements were one or two pixels away from the shore (i.e. 1 or 2 km). As the Level 2 OCN product values are already an average of SAR measurements (resolution 10 m and product resolution 1 km) further averaging was not applied.
Table 2Location and characteristics of the coastal weather stations used in the comparison with Sentinel-1 SAR Level 2 OCN product.
2.3 Assessment criteria
The error ei between Sentinel-1 Level 2 OCN wind speed, denoted as Ui, and the in situ measurement, denoted as ui, is defined as follows:
The criteria used in the comparison were the mean error (or bias), the standard deviation (σ), the root-mean-square error (RMSE), the mean absolute error (MAE) and the linear correlation coefficient (R), defined, respectively, by the following equations:
where U and u denote the mean of satellite and in situ wind speeds, respectively, σU and σu denote their standard deviation, and N denotes the number of match-up samples.
2.4 Wind distribution estimation
The average wind power density P (in W m−2), simply called wind power in the following, is the average kinetic energy passing through a unit of surface per unit of time. It can be estimated directly from the wind speed time series using the following formula:
where ρ is the air density (1.245 g m−3 at 10 ∘C) and Ui the wind speed. However, in order to compensate for the low number of samples provided by the satellites, some prior knowledge of the surface wind speed distribution can be used. It is assumed here that it follows a classical Weibull law that is fitted to the empirical histogram. The Weibull law probability density function is given by
where λ is a scaling parameter in m s−1 and k is a dimensionless shape parameter. The parameters of the best Weibull law corresponding to the dataset are obtained by the method of the moments (Pavia and O'Brien, 1986):
where μ is the mean wind speed and σ is its standard deviation. This method allows for prediction of the correct wind speed distribution without having the full information about it, thus enhancing the amount of information that can be obtained from the satellite data. In order to verify the accuracy of the method and of the satellite measurements, the parameters obtained with this method were compared with the parameters obtained with the in situ data in the same way. The wind power as a function of these parameters is given by the following formula (Justus et al., 1976):
where Γ is the gamma function.
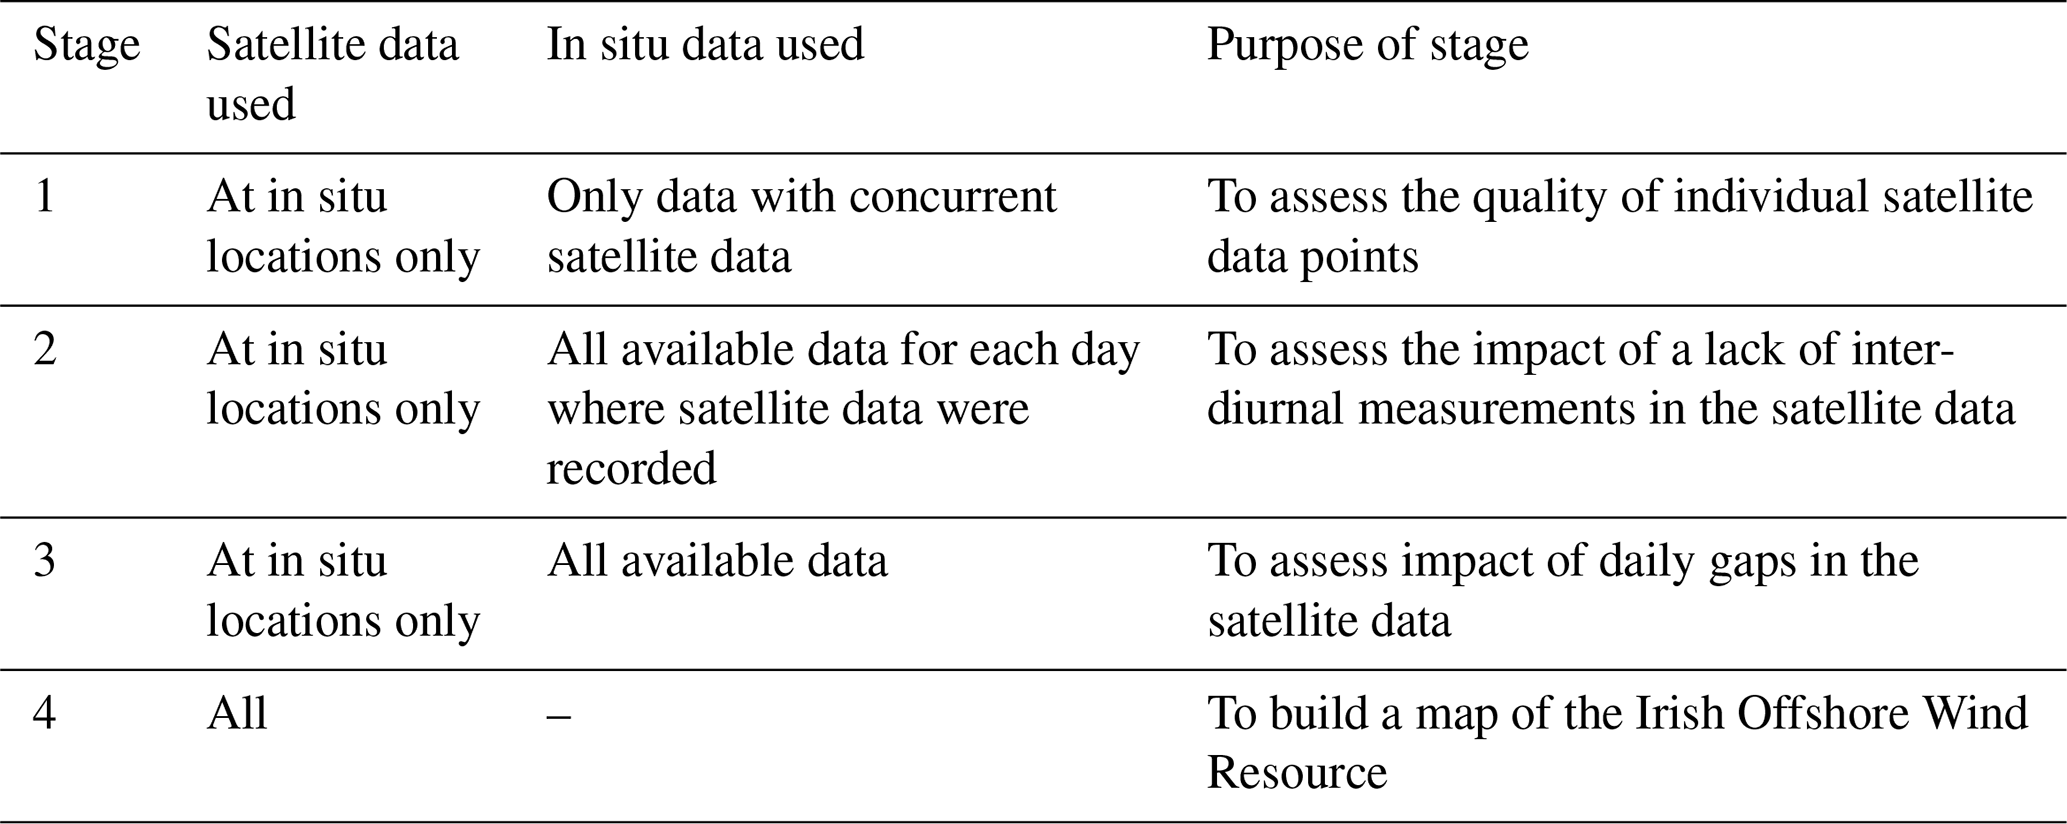
In this section, a stepwise approach is taken to assess the viability of Sentinel-1 Synthetic Aperture Radar Level 2 OCN product to characterise the long-term offshore wind resource around Ireland. This approach provides an appreciation of the error introduced by some key inherent limitations of the satellite data. The stages in this analysis are summarised in Table 3.
Table 3Key stage of the analysis. A stepwise approach was employed to allow an appreciation of the uncertainty introduced by key limitations of the satellite data when deriving long-term wind characteristics.
For each stage the methodology and results are discussed before moving to the next stage of analysis. Overall conclusions are outlined in Sect. 4.
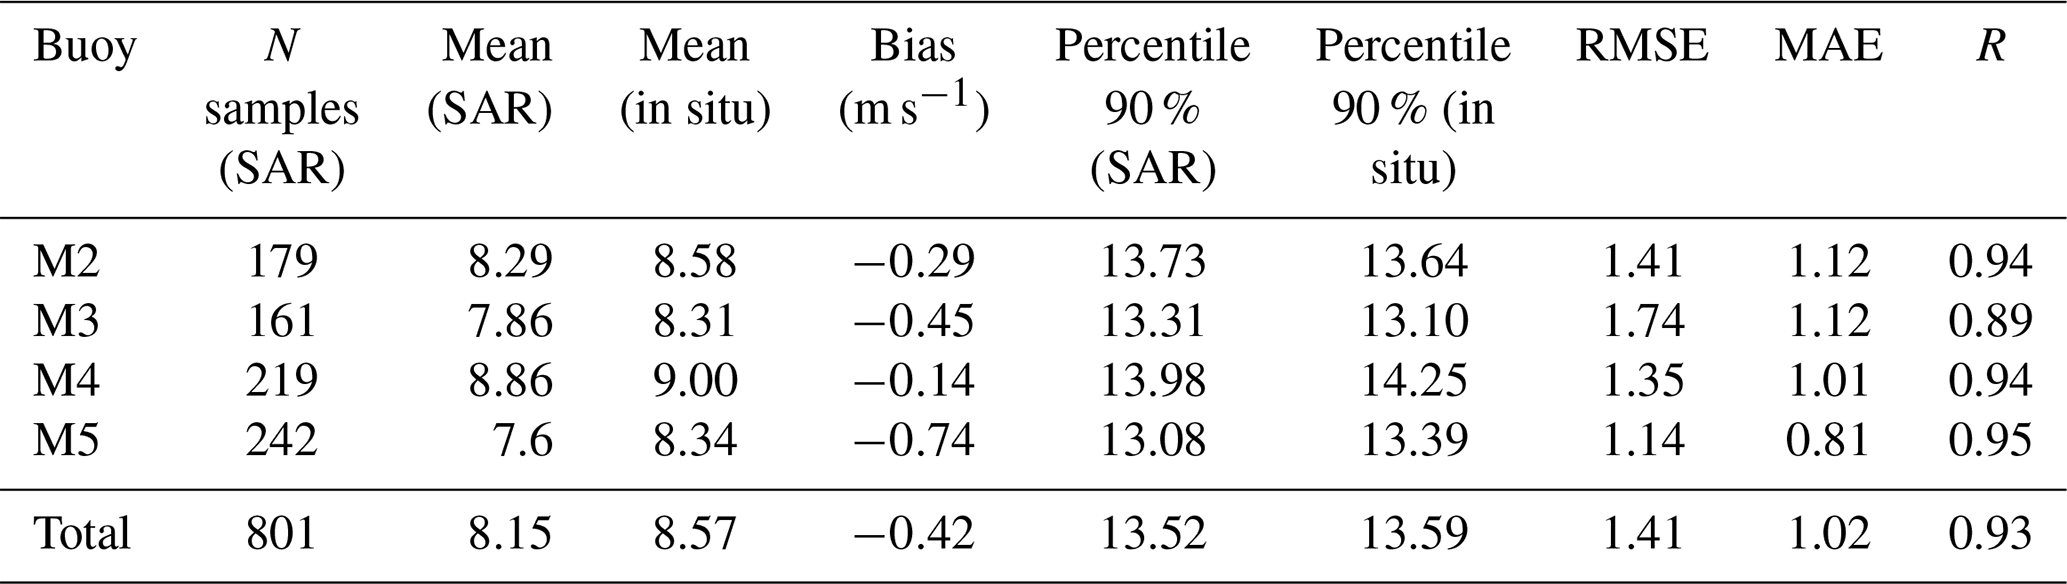
Table 4Results of the match-up comparison of satellite-measured wind speeds with in situ measured wind speeds from weather buoys.
3.1 Match-up comparison
Sentinel-1 SAR Level 2 OCN surface wind data and in situ wind data were co-located in space and time. Since the grid spacing of this product is very high (1 km2) and offshore winds have a low spatial heterogeneity caused by sea surface homogeneity, the grid spacing was slightly degraded in order to increase the number of samples. The best remotely sensed value, both in term of quality and distance, from the pixel directly adjacent to the in situ measurement (i.e. 3 km2) was chosen for the match-up comparison.
For all buoys, the wind speed correlation with the remotely sensed data at a 1 h time interval was around 0.99, which showed that the time difference between the satellite and in situ data does not introduce a significant source of error. Therefore, in the time domain, each in situ measurement with a corresponding satellite measurement performed within a 30 min time interval was selected for the analysis. Another factor in this respect is that Sentinel-1 SAR Level 2 OCN spatial averaging at the resolution of 1 km2 may somewhat compensate for the lack of time averaging. However, the bias due to these differences in the measurement technique, in space and time, is difficult to predict theoretically. Therefore, the bias can be caused not only by the SAR sensor intrinsic error but also by the different scales of measurement. Another source of potential error derived from the assumption of neutral atmospheric stability when scaling the buoy data from 3 m to 10 m a.s.l. using Eq. (1). Hence, the overall bias needed to be evaluated empirically through a match-up comparison.
The bias for all available data was found to be −0.42 and −0.39 m s−1, and the RMSE was 1.41 and 1.51 m s−1 for the buoys and weather stations, respectively (Tables 4 and 5). These results showed that Sentinel-1 SAR Level 2 OCN underestimates the in situ wind speed. A very high linear correlation coefficient of 0.93 for the buoys and 0.92 for the weather stations demonstrated that Sentinel-1 SAR data are suitable for estimating the local wind speed. For all locations, the number of match-up samples over the 2-year period of study was above 150, which is known to be the minimum number of samples needed to obtain correct wind speed statistics (Bentami and Croize-Fillon, 2014). The results also showed that the errors calculated with offshore buoys or coastal stations are very consistent. Therefore, it can be concluded that, taking the bias into account, Sentinel-1 SAR can be used to estimate the wind speed up to 1 km from the shore, which is the resolution of the instrument and the required distance to avoid land contamination.
Table 5Results of the match-up comparison of satellite-measured wind speeds with in situ measured wind speeds from coastal weather stations.
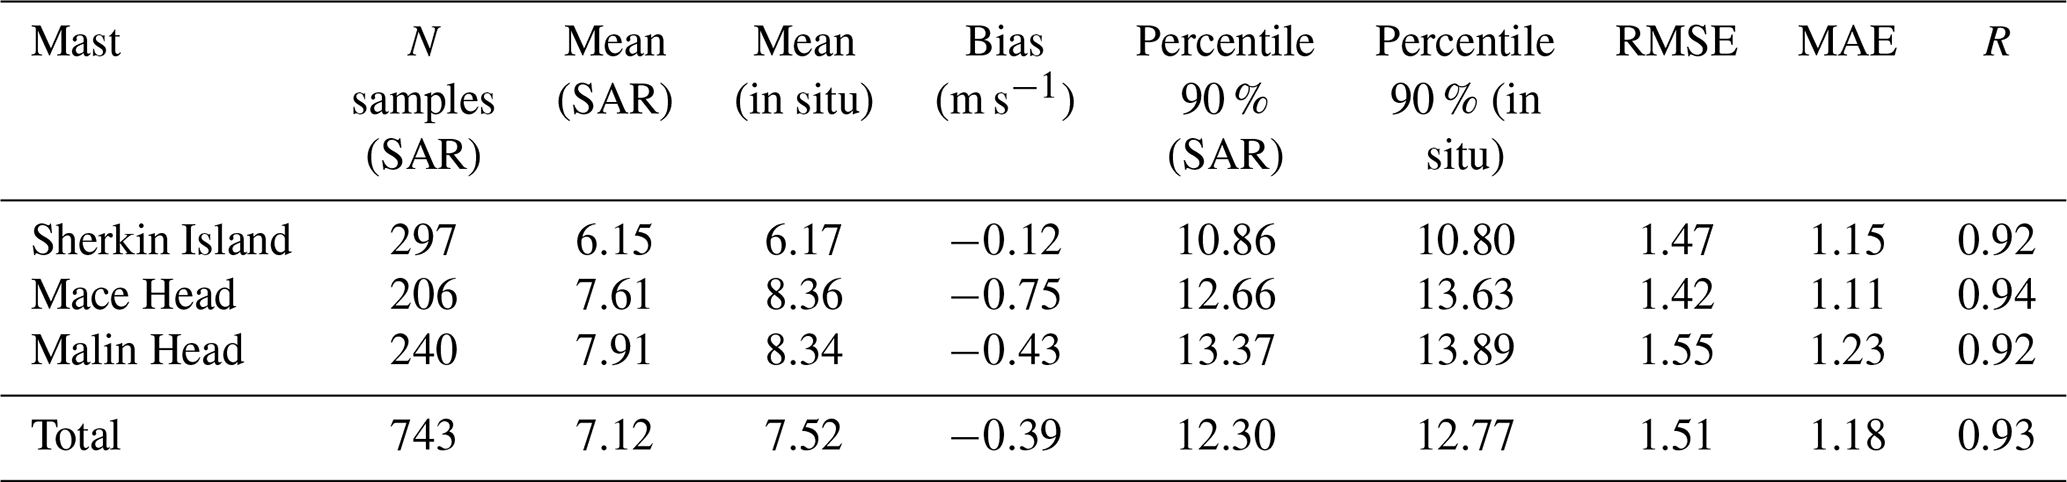
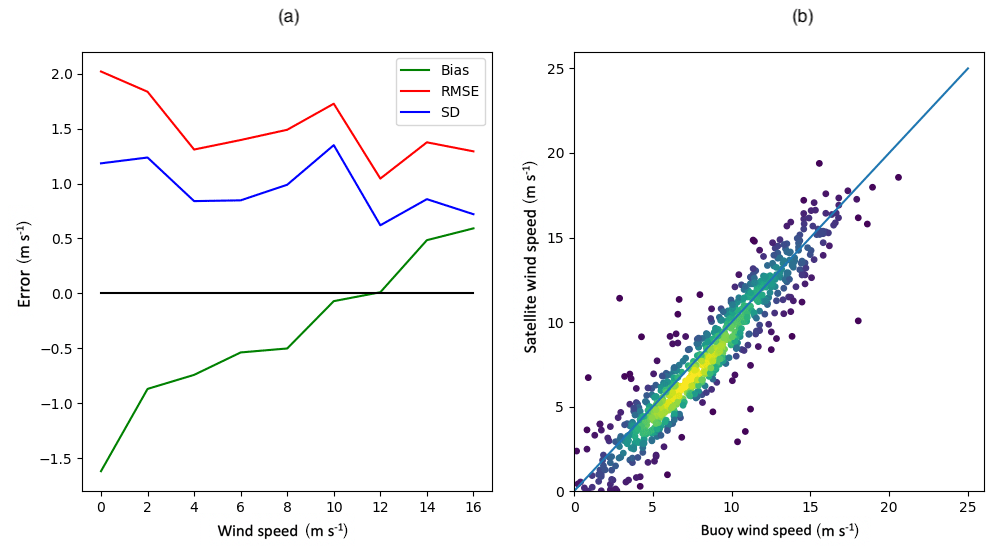
Figure 4Statistical representation of the Sentinel-1 Level 2 OCN error against weather buoy data as a function of SAR wind speeds (a) and scatterplot versus weather buoy data (b).
The bias was found to be wind speed dependent. Figure 4 (left) shows that the bias was stronger at small wind speed values and reduced as the wind speed increased. This is consistent with the fact that Sentinel-1 SAR uses the sea state in order to estimate surface winds. Indeed, low wind speeds do not necessarily cause a significant effect on the sea state and, consequently, the instrument does not always accurately estimate the surface winds. This problem is already well known and often leads to an unrealistically high number of very low wind speed values. This can be seen on the scatterplot in Fig. 4 (right), which also confirmed the results related to the bias.
As expected, the satellites also underestimated the wind power. The average error in the wind power was 6 % for the weather buoys and 13 % for the coastal weather stations, respectively (Figs. 5 and 6). Since the wind power is proportional to the cube of the wind speed, a higher error (∼20 %) would be expected. However, since the underestimation mainly affects low wind speed values and only slightly affects the strong values, the resulting error on the wind power was reduced. The higher bias for two of the coastal weather stations, namely Mace Head and Malin head, may be caused by generally lower wind speeds near the coast, and therefore the effect of the bias was amplified at those locations.
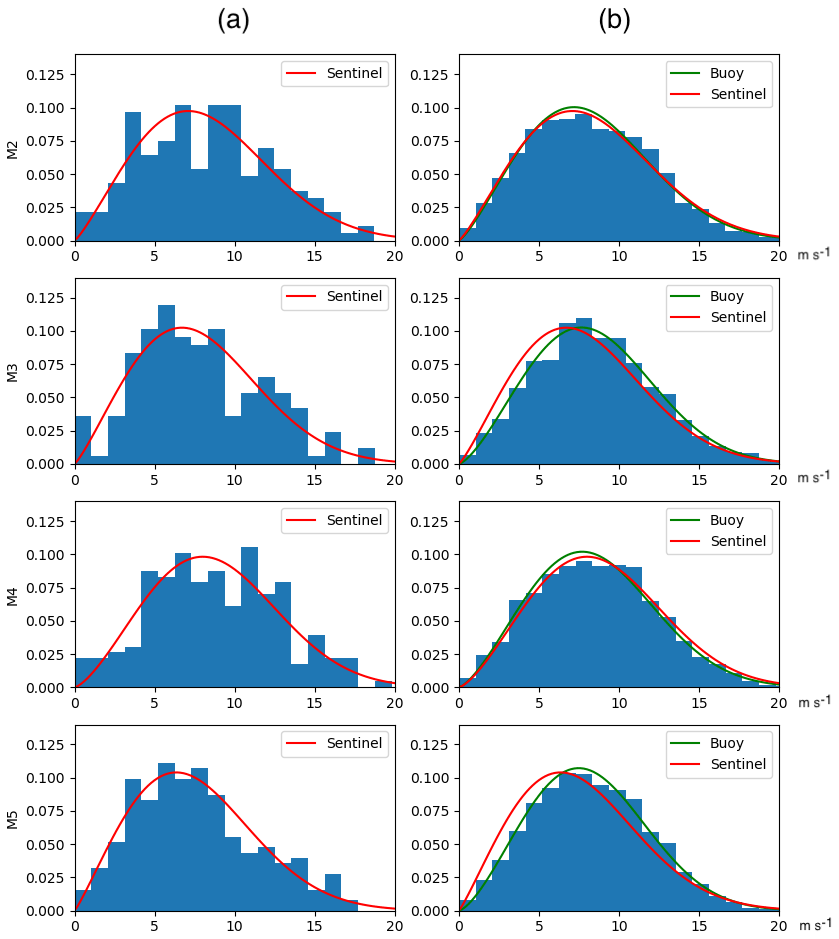
Figure 5Wind speed histograms of Sentinel-1 SAR Level 2 OCN with Weibull fit (red curves) (a). Wind speed histograms of in situ buoy data at the same locations with Weibull fits (green curves) (b). The Weibull fits of satellite data (red curves) have been reproduced over the corresponding buoy data (b) to allow a visual comparison with their Weibull fits in green.
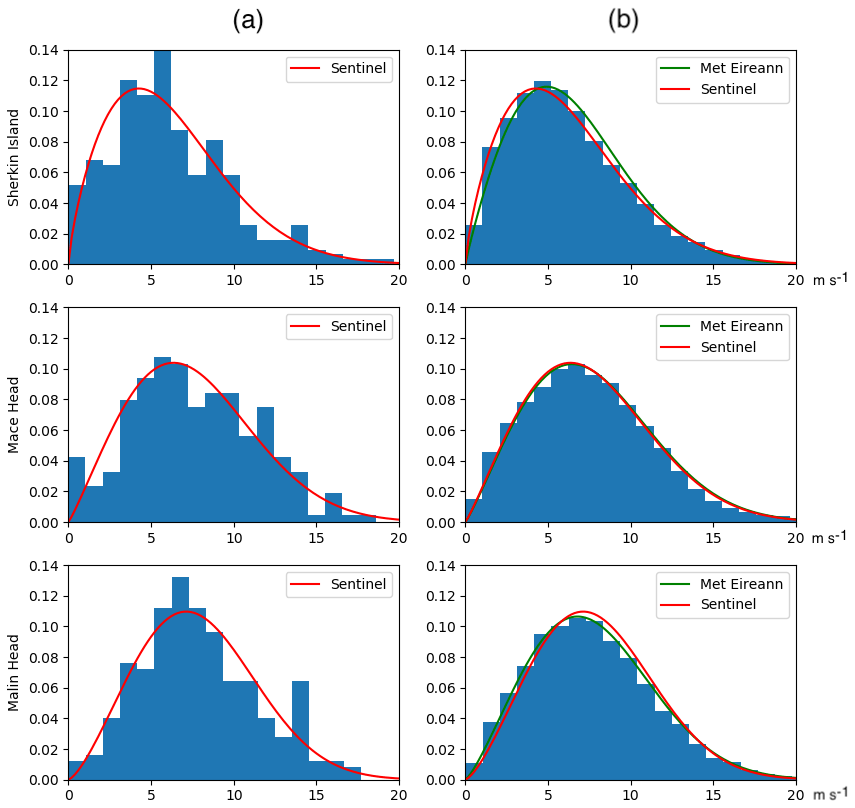
Figure 6Wind speed histograms of Sentinel-1 SAR Level 2 OCN with Weibull fit (red curves) (a). Wind speed histograms of in situ coastal weather station data at the same locations with Weibull fits (green curves) (b). The Weibull fits of satellite data (red curves) have been reproduced over the corresponding coastal weather station data (b) to allow a visual comparison with their Weibull fits in green.
3.2 Intra-diurnal variability
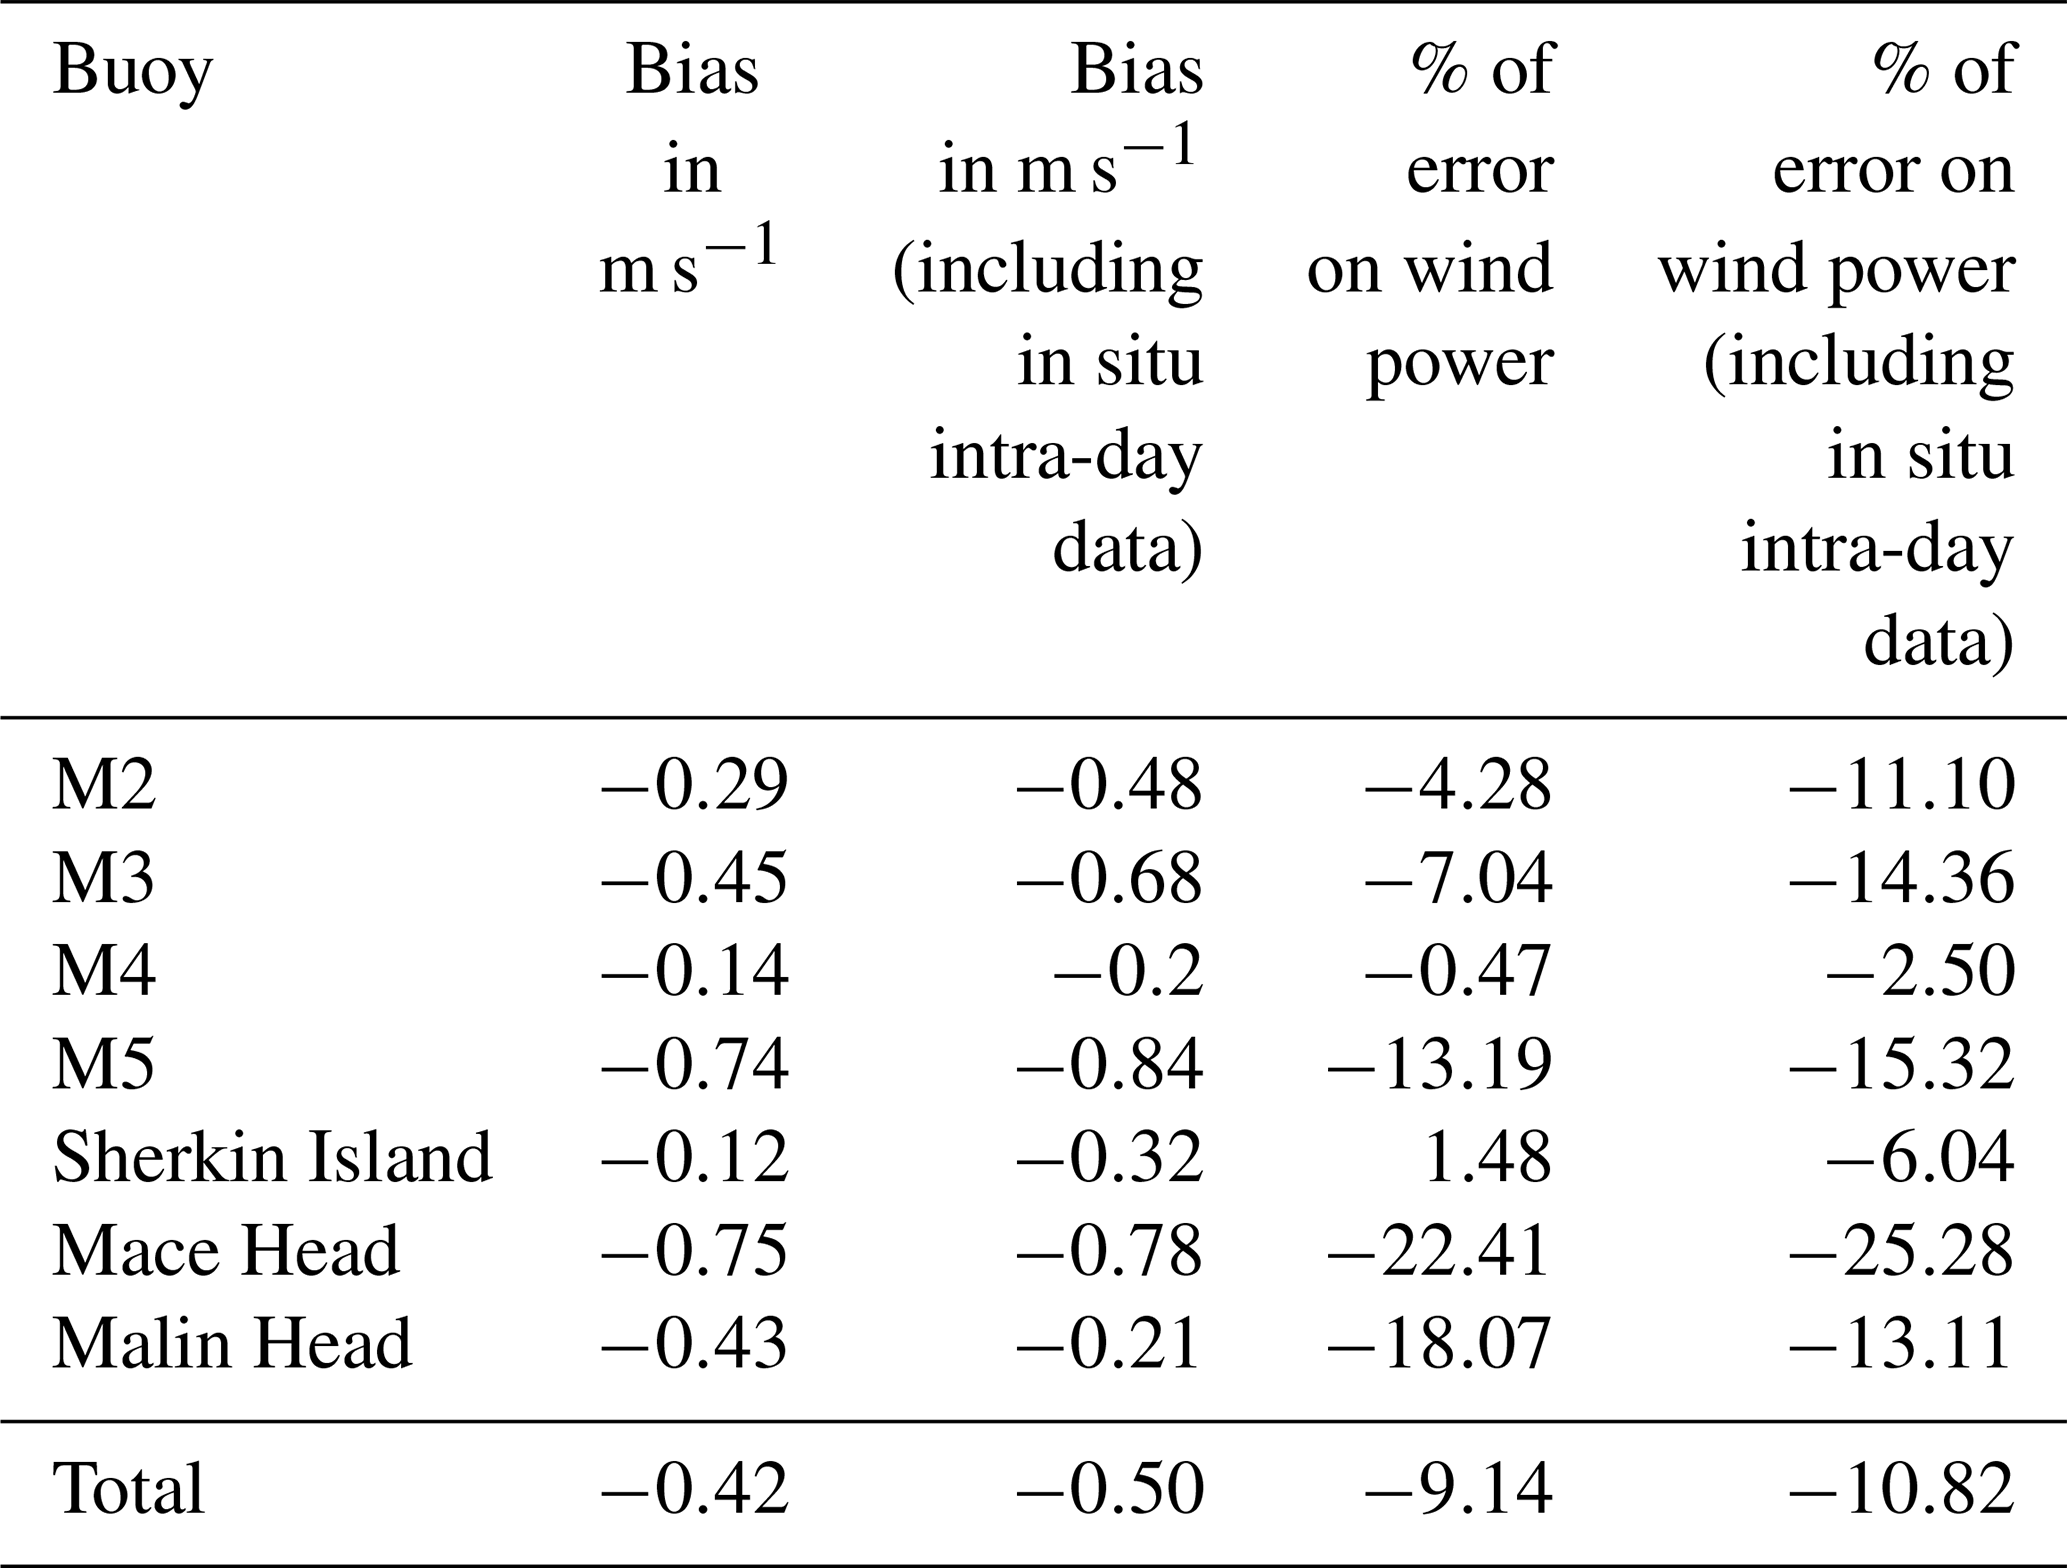
The main limitation of satellite remote sensing to accurately assess the offshore wind resource derives from their reduced temporal coverage and revisit time at a given location. Since wind speeds can have strong daily variations, the impact due to the lack of intra-diurnal measurements needs to be investigated. To do so, for each match-up between the satellites and the in situ instruments, all the in situ measurements from that 24 h period were added to the in situ data before computing the statistics (Fig. 7). The bias and the error on the wind power assessment were increased on average by 9.14 % across the 7 sites as shown in Table 8. It can be concluded that the lack of intra-diurnal satellite data has a relatively small impact on the results. Since the satellites pass different locations at different times of day, some in situ locations were more affected than others. However, the increase of error in the wind power due to intra-diurnal variability was always below 7 % of the total wind power.
Table 6Comparison of wind speed long-term statistics obtained from the four weather buoys with the ones obtained from the SAR data. These values are the results of the match-up comparison exercise and are used to evaluate the accuracy of the satellite data.
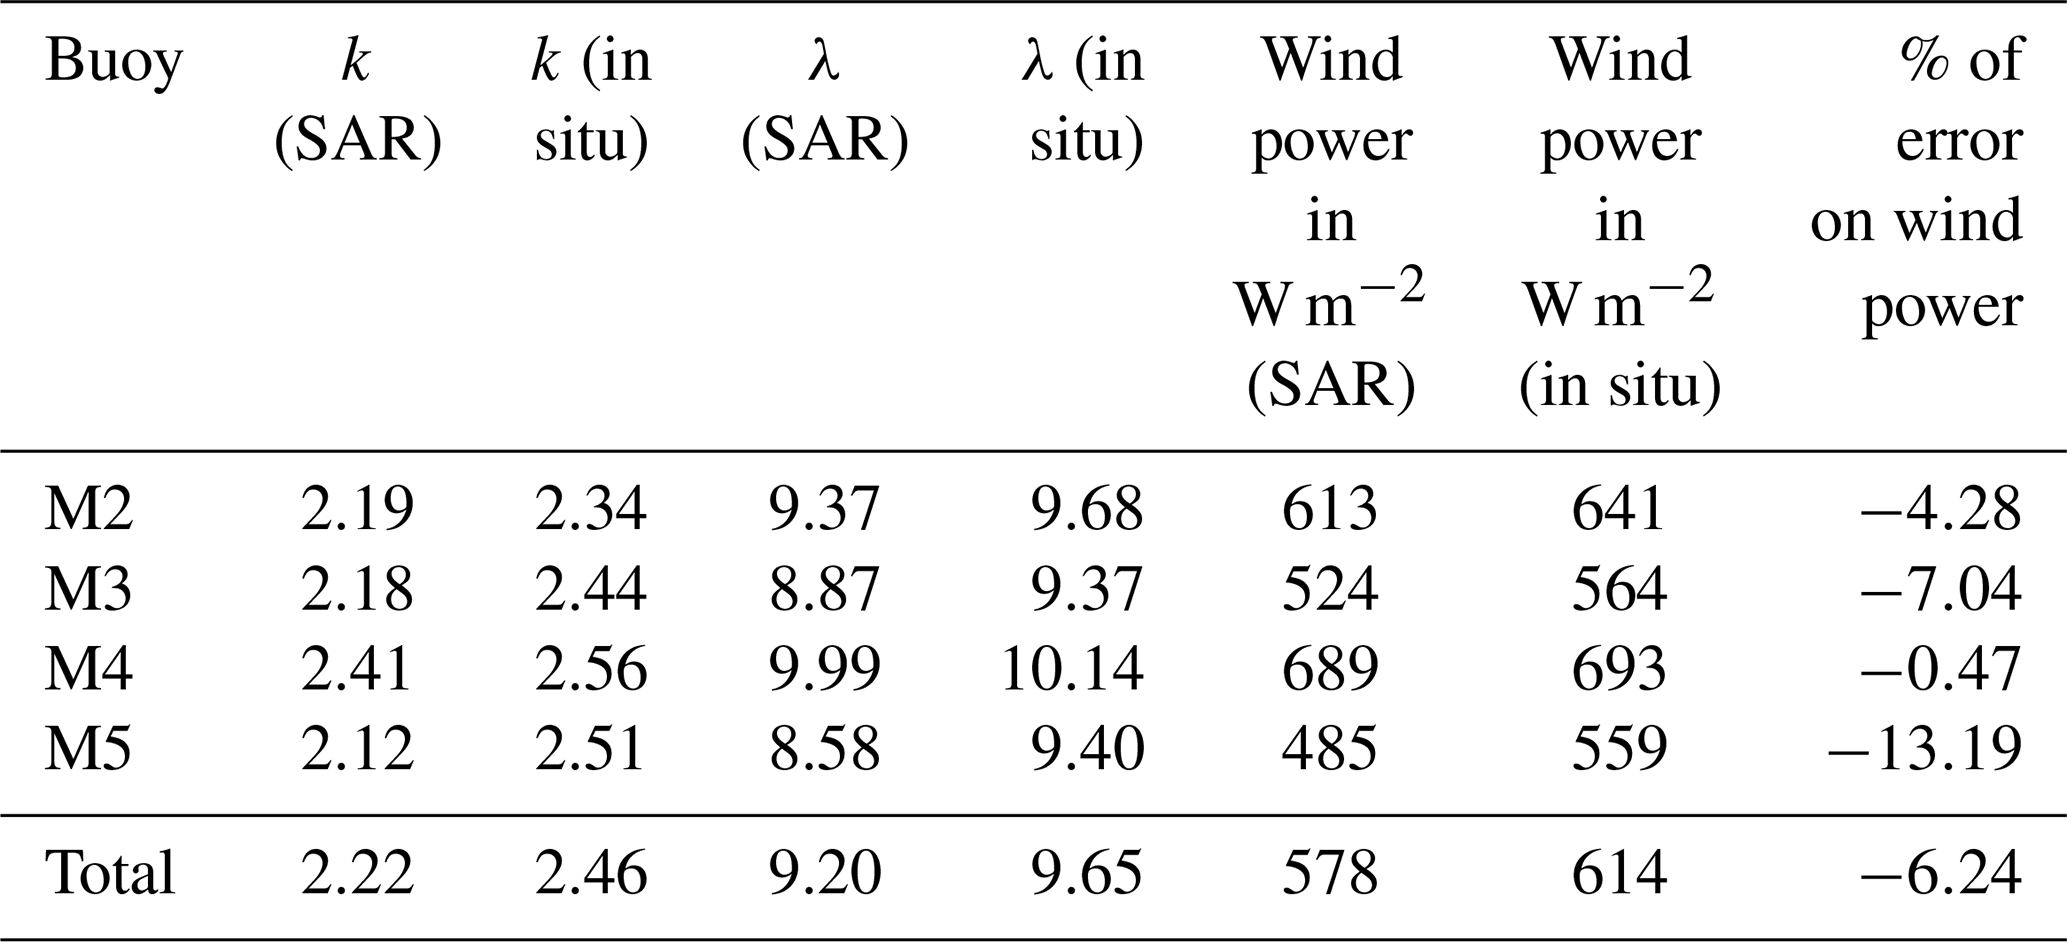
Table 7Comparison of wind speed long-term statistics obtained from the three coastal weather stations with the ones obtained from the SAR data. These values are the results of the match-up comparison exercise and are used to evaluate the accuracy of the satellite data.
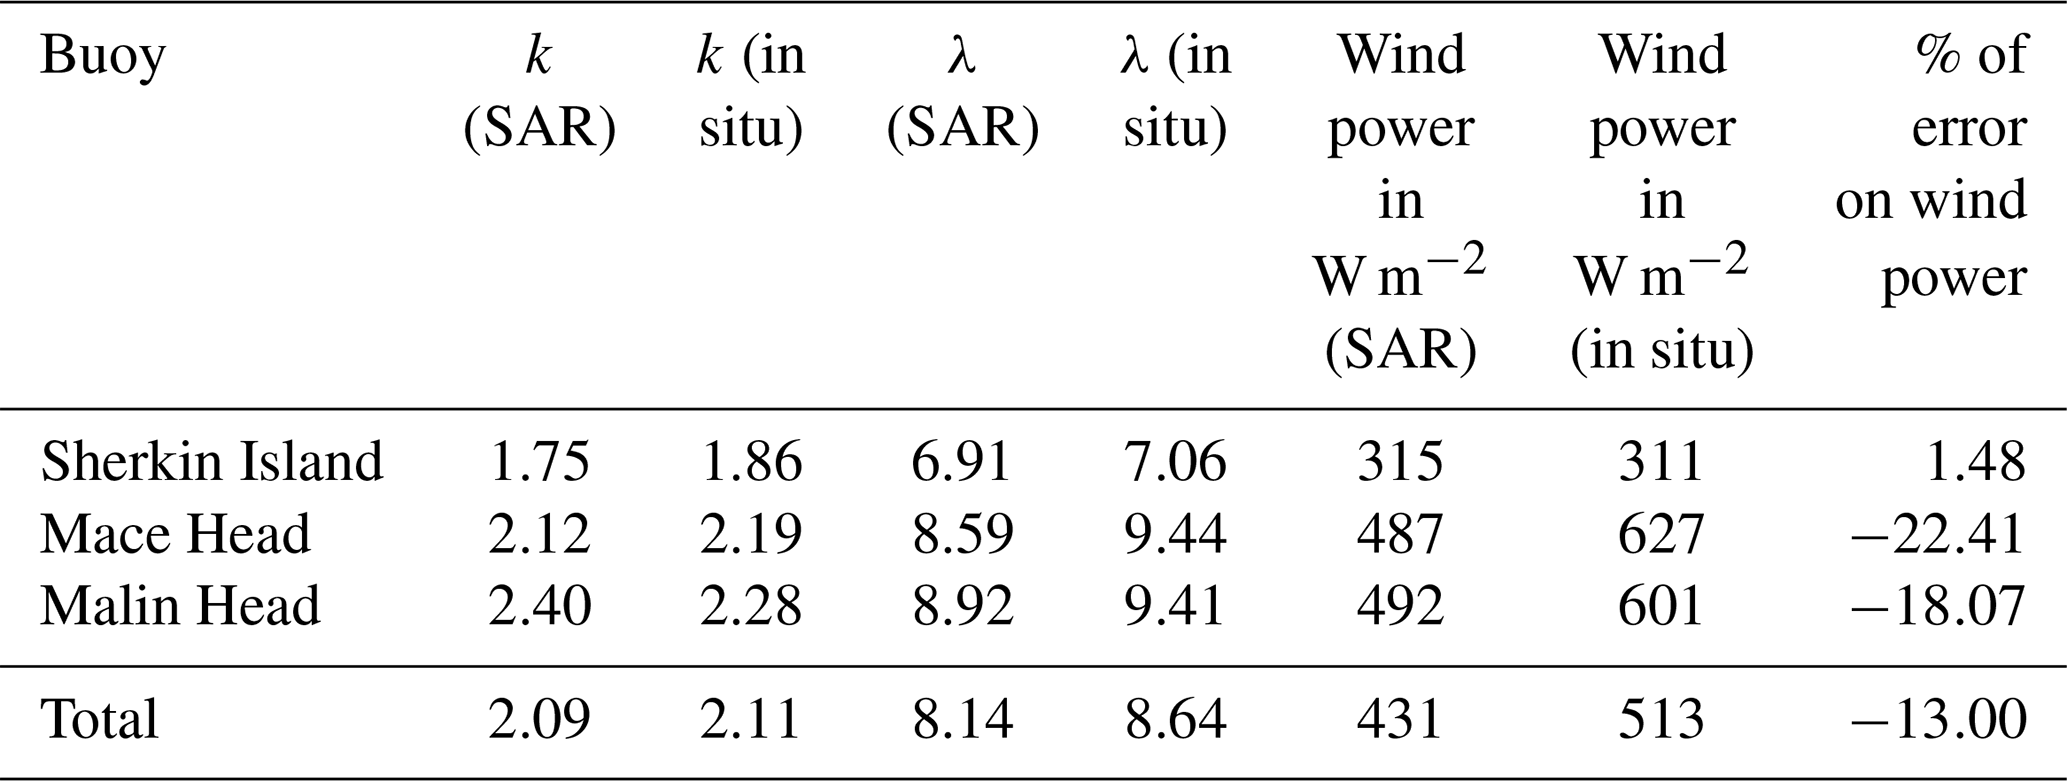
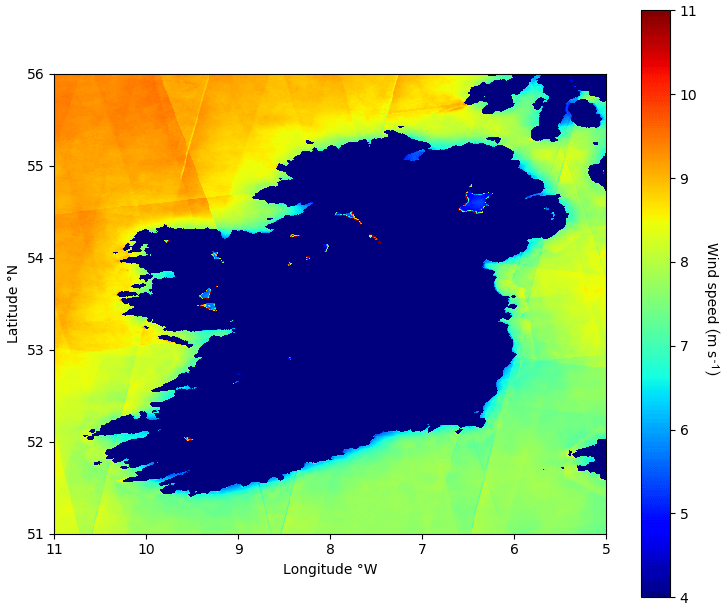
Figure 7Average wind speed off Ireland over a 2-year period running from May 2017 to May 2019 retrieved using the Sentinel-1 SAR Level 2 OCN product. Satellite tracks are visible, particularly in the northeast. These are an artefact of the analysis.
Table 8Increase in the bias and the error on the wind power when intra-diurnal data of in situ measurements are taken into account, compared with the same results obtained for the match-up comparison.
3.3 Temporal coverage assessment
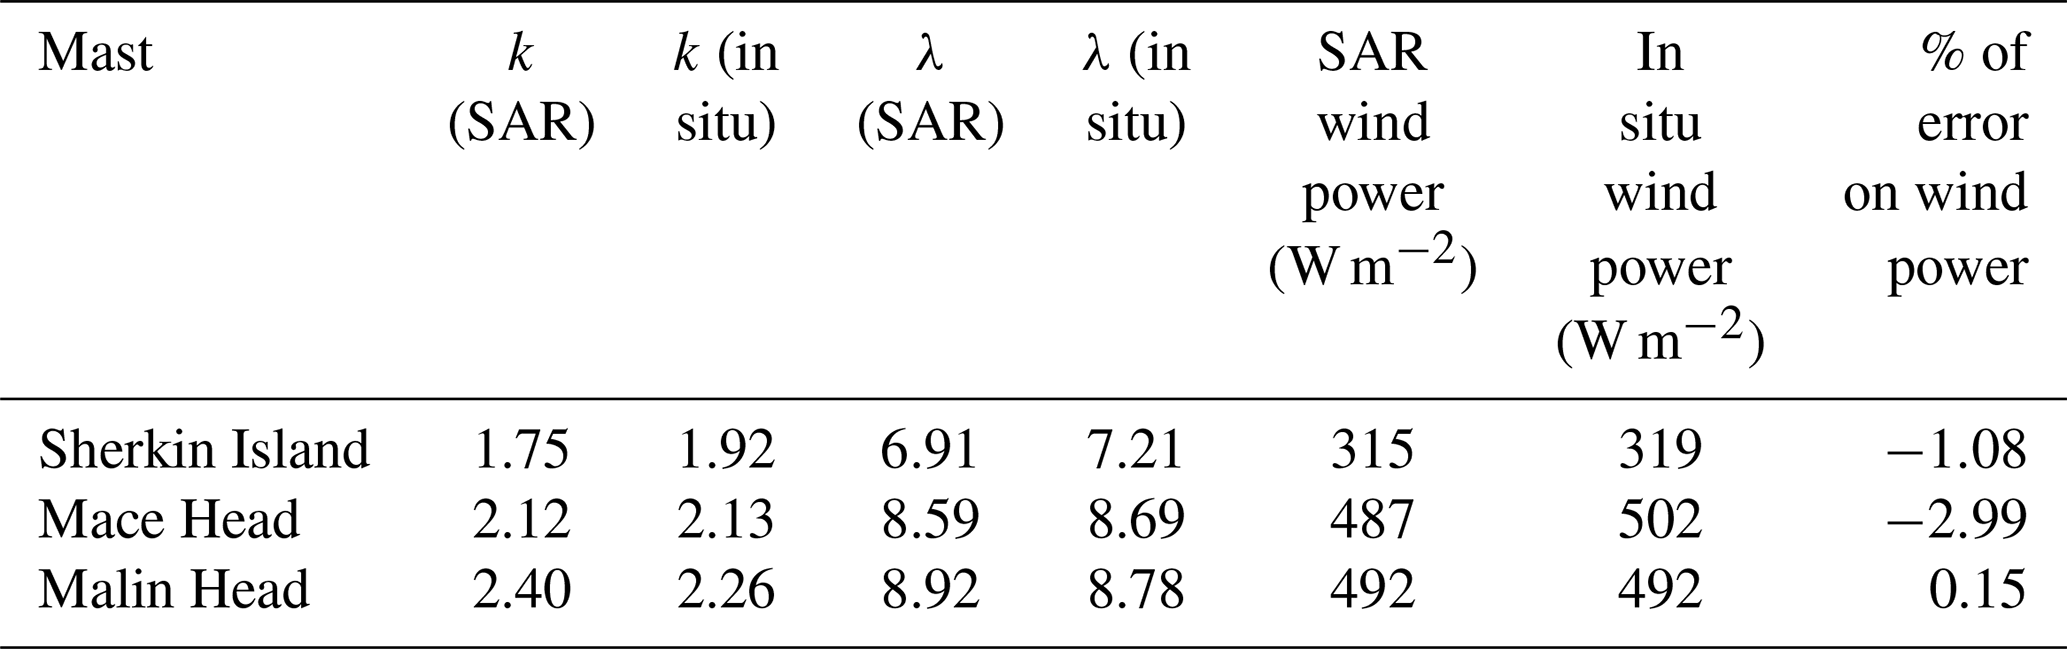
In this section all the available in situ data over the 2-year period of study were taken into account, including days for which there was no satellite pass. In order to compare statistics derived from the same time periods, the histograms of in situ data were computed using all of the available periods and the histogram of satellite data with satellite measurements available during these periods (see Figs. 5 and 6 for the Weibull distribution fits and Tables 6 and 7 for the corresponding parameters and wind powers). These figures showed that, although the histograms produced from the satellite data exhibited important discrepancies compared to the one produced from the in situ data, the SAR measurements were nonetheless sufficient to correctly estimate the Weibull laws describing wind speed statistics (in red for Sentinel-1 Level 2 OCN and in green for in situ devices in the figures). The analysis revealed a strong overall agreement between the in situ and SAR wind speed distributions, as can be seen in Tables 9 and 10. The Weibull parameters and the corresponding wind powers had very similar results, with wind power errors below ∼10 % and ∼5 % for the weather buoys and the coastal weather stations, respectively. These results were quite remarkable given the fact that the wind power is proportional to the cube of the wind speed, meaning that its calculation has a strong magnifying effect on the error.
Table 9Comparison of the long-term wind speed statistics produced from the weather buoy data with those produced from the SAR data at the same locations. These values evaluate the accuracy of the satellite-derived data to provide the correct long-term average wind statistics.
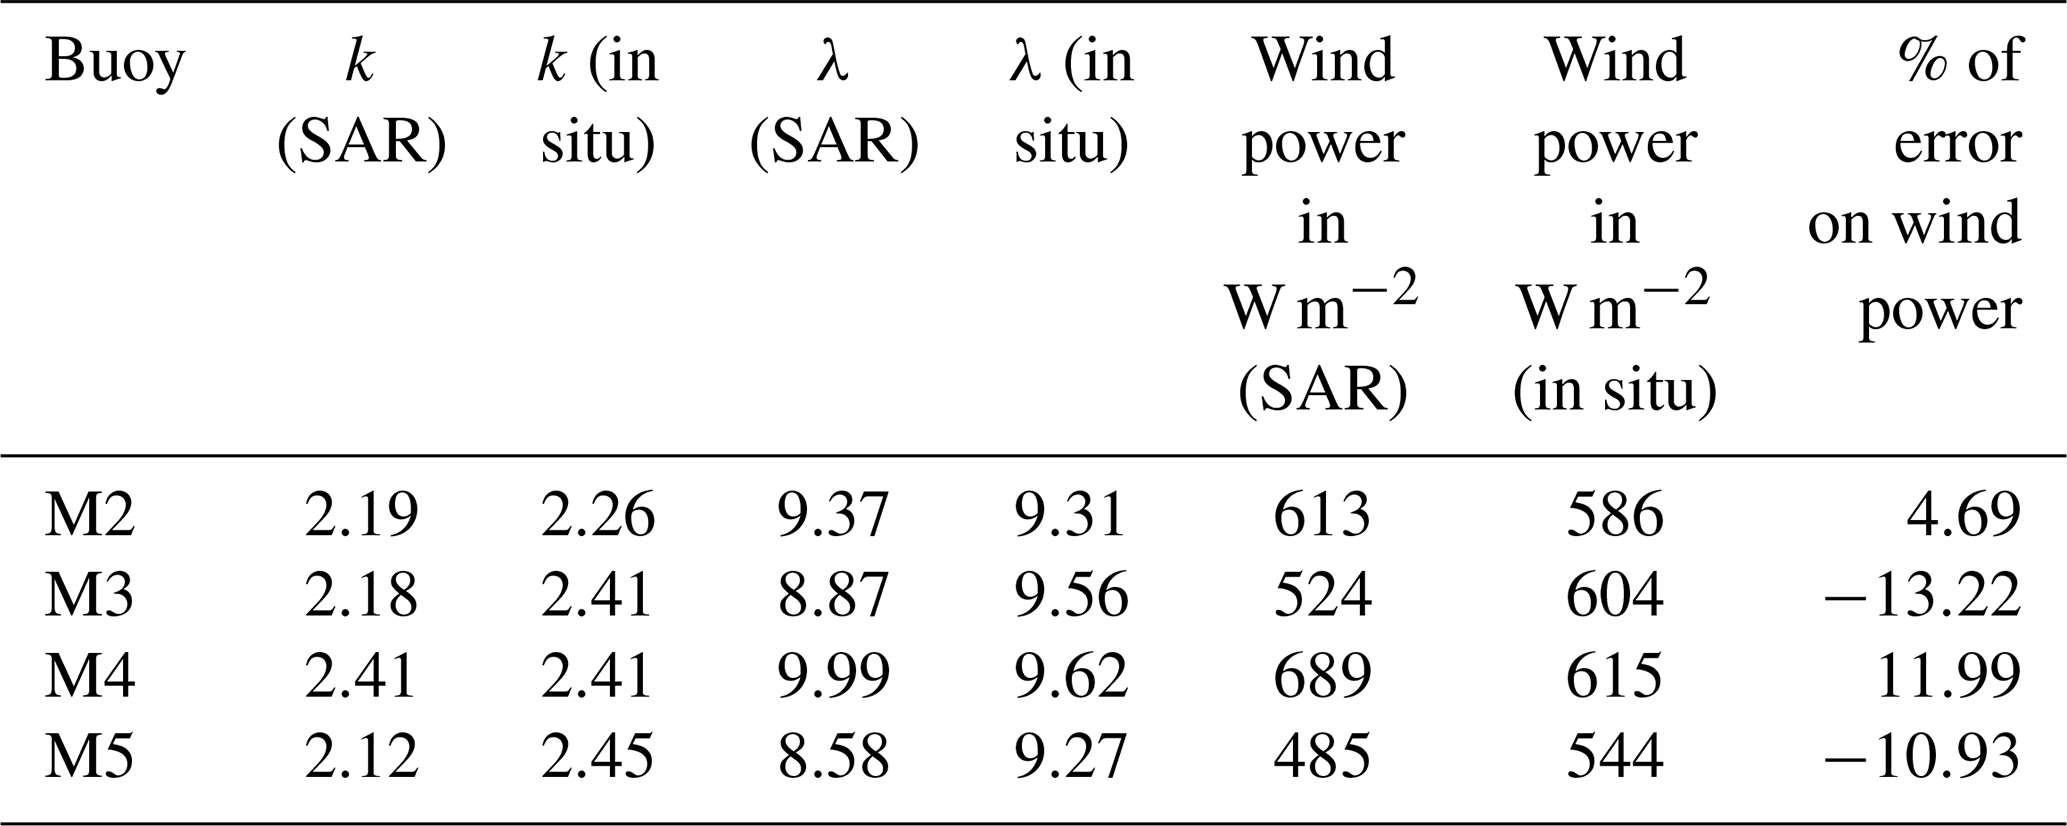
Table 10Comparison of the long-term wind speed statistics produced from the coastal weather station data with those produced from the SAR data. These values evaluate the accuracy of the satellite-derived data to provide the correct long-term average wind statistics.
The results show that the percentage error of the average wind power was lowest for the coastal weather stations. This may indicate that they could be more reliable than weather buoys, perhaps due to the presence of waves and the relatively low altitude of the buoys. This finding must be treated with caution given the relatively low number of weather stations included in this study. It is possible that the error in offshore locations could be overestimated due to inaccuracies with the weather buoy data, although there is no possibility of proving this with certitude. The validation of the Level 2 OCN product should be further investigated in coastal areas since land contamination and coastal topography can introduce bias. Another interesting feature is that the bias observed in the match-up comparison seemed to disappear in this climatological analysis. The main difference between the match-up comparison and the analysis performed here arises from including in situ data even when satellite data were not available. In this study, satellite data can be unavailable for two reasons: no data were recorded as a consequence of the relatively low revisit time of the satellite, or the data recorded were discarded if it was flagged as “bad quality”. The former should not have any effect on the long-term statistics since an increase in sample size will result in a better Weibull distribution. However, the latter might actually introduce an artificial bias in the match-up comparison by limiting it to a specific type of situation in which satellite measurements are easier to perform. For example, if good quality flags are more likely to correspond to turbulent situations, then the different scales at which the measurements are performed (10 min for in situ devices and 1 km2 for the satellite) can introduce a discrepancy. In that case, measurements in space will be less affected by the turbulence and closer to the average long-term distribution due to Kolmogorov's laws (Kolmogorov, 1941) stipulating that the variability linked to turbulence scales as function of Δt1∕2 in time and only as a function of Δx1∕3 in space. Finally, when the in situ database includes all types of situations, the in situ distributions converge towards the one obtained with the satellite data.
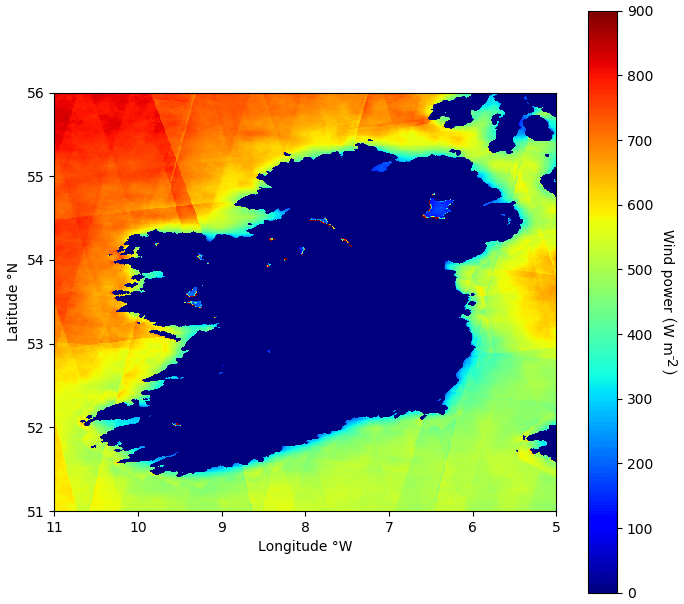
Figure 8Wind power off Ireland over a 2-year period running from May 2017 to May 2019 retrieved using the Sentinel-1 SAR Level 2 OCN product. Satellite tracks are visible, particularly in the northeast. These are an artefact of the analysis.
3.4 Long-term resource characterisation
In this section, the use of the Sentinel-1 Level 2 OCN product to assess wind resources around Ireland at 10 m a.s.l. with a 1 km2 grid spacing is presented. A clear separation of the mean wind speed into two different areas was clearly visible (Fig. 7). The northwest area, starting above 53∘ N and going until the beginning of the North Channel between Ireland and Scotland, was characterised by a climate of strong winds (above 9 m s−1), while the rest of the map had a more moderate wind climate, with a mean generally around 8 m s−1. This was consistent with the observations obtained from spaceborne scatterometers (Remmers et al., 2019).
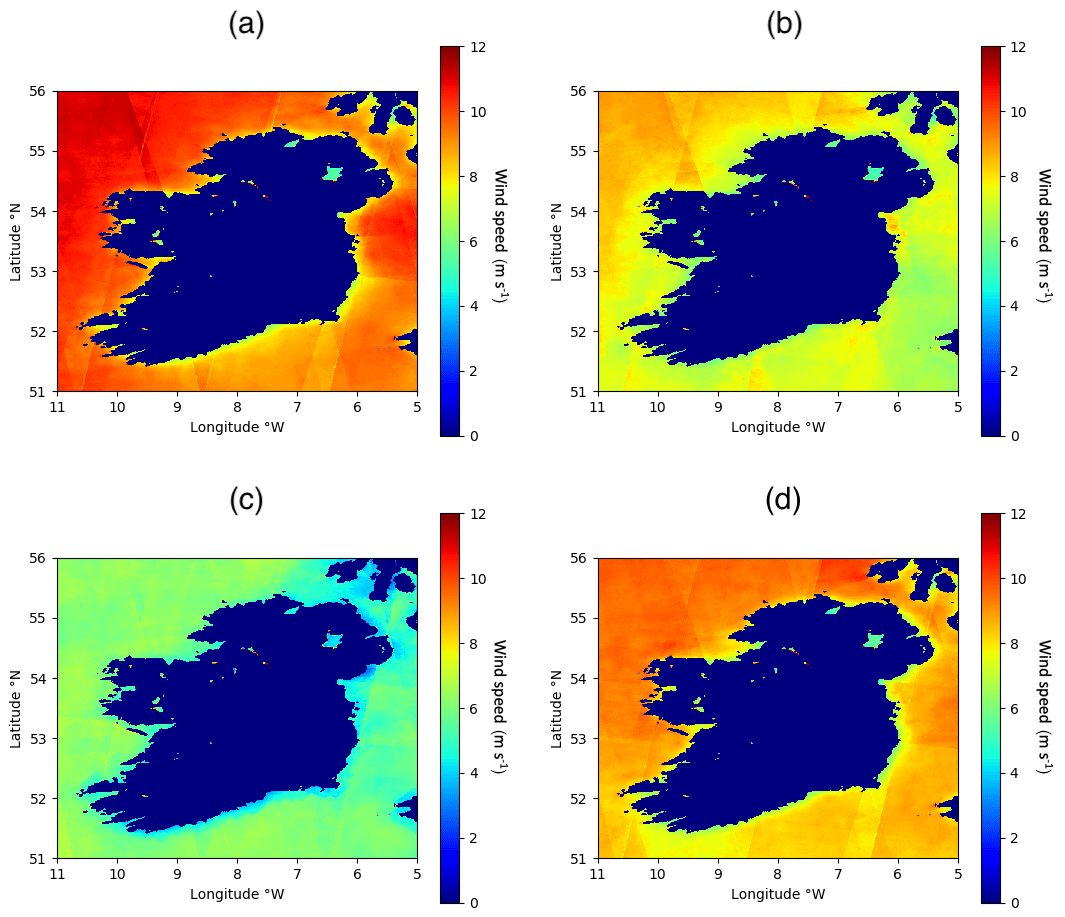
Figure 9Seasonal average wind speed off Ireland over a 2-year period running from May 2017 to May 2019 retrieved using the Sentinel-1 SAR Level 2 OCN product: winter (a), spring (b), summer (c) and autumn (d). Satellite tracks are visible, particularly in the northeast. These are an artefact of the analysis.

Figure 10Seasonal wind power off Ireland over a 2-year period running from May 2017 to May 2019 retrieved using the Sentinel-1 SAR Level 2 OCN product: winter (a), spring (b), summer (c) and autumn (d). Satellite tracks are visible, particularly in the northeast. These are an artefact of the analysis.
In terms of wind power, the results logically revealed a similar pattern with an increased heterogeneity, due to the fact that the wind power is connected to the cube of the wind speed (Fig. 8). The northwest area had an average wind power of 700 W m−2 in comparison with 500 W m−2 for the rest of the map, resulting in an overall difference of 20 % between the two areas. It is interesting to note that the central area of the Irish Sea also has a significant potential in terms of wind power, although it is lower than that of the northwest area. Regarding coastal areas, a steep horizontal gradient was observed from the shore up to 15–20 km offshore, with the exception of the remote peninsulas on the west coast where the gradient was much shorter or non-existent. In both analyses, the apparent swats can be attributed to the low sample size of satellite data, which correlates with Fig. 1. The better grid spacing of SAR data inevitably reduces the revisiting time and therefore the sample size. With time, these artefacts will diminish as the satellite acquires additional data.
The seasonal averages of wind speed and wind power showed expected trends of low and strong winds typical of the summer and winter seasons, respectively (Figs. 9 and 10). Autumn was also associated with strong winds, which correlated to the cyclonic activity in the North Atlantic Ocean ending their trajectory in this area of western Europe. The wind climate during spring was much more moderate than that of autumn.
As shown in Figs. 7 to 10, the tracks of the satellites were still visible. This discrepancy can be related to several factors, such as instrument bias associated with the incidence angle, difference in the number of samples (Fig. 1) affecting the quality of the Weibull fits, or simply a difference in the average time of the day at which the satellites pass (Fig. 2) resulting in a different impact of the intra-diurnal variability. Unfortunately, no clear correlation was found between these factors and the anomalies on the maps. It was only found that the edges of the swaths have more unrealistic values, which could be due to the incidence angle or the instrument thermal noise. As a consequence, a margin of 5 pixels (roughly equivalent to 5 km) was removed from the swaths before creating the maps. The areas with less observations also had a less reliable assessment of the mean wind speed and power; however, this limitation should disappear in the future as more samples become available. It can be concluded that the accuracy was dependent upon location, which is a factor that should be considered when using Sentinel-1 SAR data; this is shown to be particularly the case at the edge of swaths, and users should be aware of this limitation and filter the data accordingly.
Measurements from the Sentinel-1 Level 2 OCN product were compared with measurements from four weather buoys and three coastal weather stations located around Ireland. The match-up comparison indicated that the satellites underestimated the in situ data by 0.4 m s−1 on average, with an RMSE of 1.45 m s−1. These results were consistent between the weather buoys and the coastal weather station data. The bias was found to be stronger for low wind speeds, and to linearly decrease with an increase of wind speed strength. However, this discrepancy disappeared when the long-term statistics were computed including all available in situ data. This could be associated with the in situ measurements performed at a very different spatial scale to that of the satellite measurements (a few cm2 versus 1 km2). In any case, it was concluded that the Sentinel-1 Level 2 OCN product can be used to estimate the long-term wind speed distribution and the average wind power. This result could be obtained by using the method of the moments and assuming a Weibull law in order to compensate for the low temporal coverage of the satellites. Even though more investigation is needed to assess the OCN product in coastal area, this study showed that this remotely sensed data can be used to assess the wind resources in coastal areas as close as 1 km to the shore.
The fact that the satellites always pass at the same hour of the day, limiting their ability to record the intra-diurnal variability, was investigated and its effects on the long-term statistics were found to be minor. Finally, the error in the average wind power was found to be on the order of 10 % and 5 % for weather buoys and coastal weather stations, respectively. This result was quite remarkable given the fact that the wind power is proportional to the cube of the wind speed, which strongly enhances the original error from the wind speed. Maps of the average wind speed and wind power around Ireland were presented with a resolution of 1 km2. These maps indicated that the algorithm used to process the raw SAR data for the Sentinel-1 Level 2 OCN product needs to be improved since the satellite swaths were still visible. Users should exercise caution when working with Sentinel-1 SAR data since a location-dependent error was found at the swath edges. The cause of this discrepancy could not be identified, but perhaps a machine learning technique based on a learning dataset of in situ data could be used to mitigate this effect.
Future studies could focus on the combined use of SAR and scatterometer-measured wind speed in order to create climatologies constructed using a longer period than the 2-year period of this study. This could be particularly interesting to more accurately estimate the offshore wind energy resource. Another important application in the future would be to modify the acquisition mode in coastal areas for the satellites carrying SAR, in order to obtain the required information to estimate the wave heights. This information, only available in open seas with Sentinel-1, would be useful to correlate the wind and wave energy and thus provide a more detailed description of the marine environment for optimising offshore wind farm siting.
Data sets are available upon request by contacting the corresponding author.
LdM did the main part of the research and wrote the paper. TR provided some insights about wind speeds around Ireland and spaceborne scatterometer measurements. ROC helped with the preparation of the figures. CD supervised the work as an experienced researcher and contributed to answering referees comments.
The authors declare that they have no conflict of interest.
The authors would like to thank the Marine Institute for providing the offshore weather buoy data, Met Éireann for the coastal weather station data and ESA for the Sentinel-1 SAR Level 2 products. The authors also would like to thank the European Regional Development Fund (ERDF) INTERREG Atlantic Area Project ARCWIND for assuming the publication costs of this study.
This research has been funded by Science Foundation Ireland (SFI), Brockmann Consult GmbH and by the European Regional Development Fund (ERDF) INTERREG Atlantic Area Project ARCWIND.
This paper was edited by Andrea Hahmann and reviewed by two anonymous referees.
Bassi Marinho Pires, L., Fisch, G., Gielow, R., Souza, L. F., Avelar, A. C., De Paula, I. B., and Da Mota Girardi, R.: A Study of the Internal Boundary Layer Generated at the Alcantara Space Center, Am. J. Environ. Eng., 5, 2166–4633, https://doi.org/10.5923/s.ajee.201501.08, 2015.
Bentamy, A. and Croize-Fillon, D.: Spatial and temporal characteristics of wind and wind power off the coasts of Brittany, Renew. Energ., 66, 670–679, https://doi.org/10.1016/j.renene.2014.01.012, 2014.
Carvalho, D., Rocha, A., Gomez-Gesteira, M., and Silva Santos, C.: Offshore winds and wind energy production estimates derived from ASCAT, OSCAT, numerical weather prediction models and buoys – A comparative study for the Iberian Peninsula Atlantic coast, Renew. Energ., 102, 433–444, https://doi.org/10.1016/j.renene.2016.10.063, 2017.
Charnock, H.: Wind stress on a water surface, Q. J. Roy. Meteorol. Soc., 81, 639–640, 1955.
ESA: TOPSAR Processing, available at: https://sentinel.esa.int/web/sentinel/technical-guides/sentinel-1-sar/products-algorithms/level-1-algorithms/topsar-processing, last access: 9 December 2019.
Global Wind Energy Council, Global Wind Statistics, available at: http://www.gwec.net/wp-content/uploads/2015/02/GWEC_GlobalWindStats2014_FINAL_10.2.2015.pdf (last access: April 2019), 2020.
Hasager, C. B., Mouche, A., Badger, M., Bingöl, F., Karagali, I., Driesenaar, T., Stoffelen, A., Peña, A., and Longépé, N.: Offshore wind climatology based on synergetic use of Envisat ASAR, ASCAT and QuikSCAT, Remote Sens. Environ., 156, 247–263, https://doi.org/10.1016/j.rse.2014.09.030, 2015.
Jang, J., Park, K., Mouche, A., Chapron, B., and Lee, J.: Validation of Sea Surface Wind From Sentinel-1A/B SAR Data in the Coastal Regions of the Korean Peninsula, IEEE J. Select. Top. Appl. Earth Obs. Remote Sens., 12, 2513–2529, https://doi.org/10.1109/JSTARS.2019.2911127, 2019.
Justus, C. G., Hargraves, W. R., and Yalcin, A.: Nationwide Assessment of Potential Output from Wind-Powered Generators, J. Appl. Meteorol. Clim., 15, 673–678, https://doi.org/10.1175/1520-0450(1976)015<0673:NAOPOF>2.0.CO;2, 1976.
Karagali, I., Peña, A., Badger, M., and Hasager, C. B.: Wind characteristics in the North and Baltic Seas from the QuikSCAT satellite, Wind Energy, 17, 123–140, https://doi.org/10.1002/we.1565, 2014.
Kolmogorov, A. N.: Dissipation of Energy in Locally Isotropic Turbulence, Dokl. Akad. Nauk SSSR, 32, 16–18, 1941.
McAuliffe, F. D., Murphy, J., and Lynch, K.: Driving Cost Reductions in Offshore Wind: The LEANWIND Project Final Publication, Technical report, LEANWIND, Cork, Ireland, 2018.
Pavia, E. G. and O'Brien, J. J.: Weibull Statistics of Wind Speed over the Ocean, P. Roy. Soc. A, 25, 1324–1332, https://doi.org/10.1175/1520-0450(1986)025<1324:WSOWSO>2.0.CO;2, 1986.
Pimenta, F., Kempton, W., and Garvine, R.: Combining meteorological stations and satellite data to evaluate the offshore wind power resource of Southeastern Brazil, Renew. Energ., 33, 2375–2387, https://doi.org/10.1016/j.renene.2008.01.012, 2008.
Remmers, T., Cawkwell, F., Desmond, C., Murphy, J., and Politi, E.: The Potential of Advanced Scatterometer (ASCAT) 12.5 km Coastal Observations for Offshore Wind Farm Site Selection in Irish Waters, Energies, 12, 206–232, https://doi.org/10.3390/en12020206, 2019.
Sánchez, R. F., Relvas, P., and Pires, H. O.: Comparisons of ocean scatterometer and anemometer winds off the southwestern Iberian Peninsula, Cont. Shelf Res., 27, 155–175, https://doi.org/10.1016/j.csr.2006.09.007, 2007.