the Creative Commons Attribution 4.0 License.
the Creative Commons Attribution 4.0 License.
 | 10 Dec 2020
Characterization of the unsteady aerodynamic response of a floating offshore wind turbine to surge motion
Simone Mancini
Koen Boorsma
Marco Caboni
Marion Cormier
Thorsten Lutz
Paolo Schito
Alberto Zasso
The disruptive potential of floating wind turbines has attracted the interest of both the industry and the scientific community. Lacking a rigid foundation, such machines are subject to large displacements whose impact on aerodynamic performance is not yet fully explored. In this work, the unsteady aerodynamic response to harmonic-surge motion of a scaled version of the DTU 10 MW turbine is investigated in detail. The imposed displacements have been chosen representative of typical platform motion. The results of different numerical models are validated against high-fidelity wind tunnel tests specifically focused on the aerodynamics. Also, a linear analytical model relying on the quasi-steady assumption is presented as a theoretical reference. The unsteady responses are shown to be dominated by the first surge harmonic, and a frequency domain characterization, mostly focused on the thrust oscillation, is conducted involving aerodynamic damping and mass parameters. A very good agreement among the codes, the experiments, and the quasi-steady theory has been found, clarifying some literature doubts. A convenient way to describe the unsteady results in a non-dimensional form is proposed, hopefully serving as a reference for future works.
- Article
(1148 KB) - Full-text XML
- BibTeX
- EndNote


Lacking a rigid foundation, floating offshore wind turbines (FOWTs) are subjected to large displacements during their operation. Therefore, classical control strategies suitable for bottom-fixed turbines have to be redesigned accounting for these motions. The application of an inland turbine controller to an FOWT might lead, indeed, to dangerous controller-induced resonances (Nielsen et al., 2006). Moreover, floater displacements can be a major source of aerodynamic unsteadiness because their typical periods are comparable to the timescale of dynamic-inflow phenomena (, with τ being the timescale, D the rotor diameter, and V0 the free-stream wind velocity). Since the design of an FOWT controller cannot prescind from accurate inflow modelling (Pedersen, 2017), the presence of dynamic-inflow effects due to platform motions requires a detailed investigation.
The 6 degrees of freedom (DoFs) of an FOWT are shown in Fig. 1. Analysing different types of platforms, Sebastian and Lackner (2013) showed that the most excited modes depend on the floater configuration. However, owing to the usual alignment between the wind and the waves, pitch and surge motions are typically the most significant (Mantha et al., 2011). In particular, spar types of floaters (e.g. HYWINDTM) are more prone to pitching, whilst both semi-submersible (e.g. WindFLoatTM) and tension-leg platforms (TLPs) are particularly affected by surge oscillations that also drive the tensile load on the mooring lines (Madsen et al., 2020). In addition, small pitch rotations are often linearized to surge displacements to simplify the aerodynamic modelling. Even if the simple kinematics allow the use of the momentum theory with few modifications, it is still unclear whether current blade element momentum (BEM) codes can adequately model the aerodynamic response to the surge of an FOWT. In fact, neither the impact of unsteady effects nor the accuracy of current engineering dynamic-inflow models is uniquely acknowledged for this case.

The influence of surge motion on the performance of a floating turbine was addressed by several numerical studies. Regardless of the common benchmark provided by the NREL's 5 MW reference wind turbine (RWT), the results led to rather discordant conclusions. Studying the characteristic floater motion with a free-vortex wake (FVW) code, Sebastian and Lackner (2012) underlined the need of higher-fidelity models than BEM. Conversely, de Vaal et al. (2014) found that surge displacements in the typical frequency range of a TLP were slow enough for dynamic-inflow effects to be insignificant. Such a conclusion was drawn comparing a moving actuator disk (AD) to both a quasi-steady BEM and another BEM with Øye's dynamic-inflow model (Øye, 1990) implemented. At a similar frequency though, Micallef and Sant (2015) found relevant differences between BEM, generalized dynamic wake (GDW), and AD model results. They also noticed that the unsteadiness increased with the tip speed ratio (λ), which was confirmed by an FVW code too (Farrugia et al., 2016). The most detailed work on the aerodynamic effect of surge was performed by Tran and Kim (2016), who were the first to adopt a full CFD model for the purpose. Considering similar surge cases to de Vaal et al. (2014), they solved the RANS equations with a k−ωSST model featuring an overset mesh technique; the results were then compared against a BEM code with Øye's model and a GDW solver. The discrepancies at the highest frequencies and amplitudes introduced doubts about possible dynamic-inflow effects. Unfortunately, in all of these studies, the analysis was limited to the time domain. In the present work, the results are also presented in the frequency domain determining control-relevant parameters like the aerodynamic damping (caero), which rules the system dynamics in surge.
The lack of experimental data for code validation also hampered a clear understanding of dynamic-inflow effects due to surge. Most of the available works involved Froude-scaled models, tested in water basins equipped with fans to reproduce the wind. Apart from some tests on very small turbines (Farrugia et al., 2014; Sant et al., 2015; Khosravi et al., 2015), from which it was hard to draw any full-scale conclusion, a validation campaign on a 1:60 scaled version of the NREL 5 MW RWT was conducted by Ren et al. (2014), but the interest was mainly on the hydrodynamic loading, and the surge motion was considered an output. Similarly, Goupee et al. (2017) and Madsen et al. (2020) carried out plenty of tests to address the impact of the control strategy on the motion of different platforms. Nevertheless, it is very difficult to understand the influence of the unsteady aerodynamics from combined wind and wave tests. For this reason, Polimi decided to focus more specifically on the aerodynamics, aiming at both an increased comprehension and the generation of valuable data to serve as a benchmark for code validation. For this purpose, a 1:75 model of the DTU 10 MW RWT was designed within the project LIFES50+ (Bayati et al., 2017a, c). The scaled turbine was mounted inside Polimi's wind tunnel (GVPM) on a 2 DoF test rig that allowed the imposing of both pitch and surge motions. The first experiments conducted seemed to show relevant traces of unsteady effects due to surge (Bayati et al., 2016). However, after a thorough revision, it was understood that the results had been strongly biased by the tower flexibility. Therefore, a stiffer tower was manufactured to run new harmonic-surge tests in the project UNAFLOW (UNsteady Aerodynamics for FLOating Wind).
UNAFLOW was a collaborative project, belonging to the EU IRPWIND programme, which involved four research institutions: Polimi, ECN (now TNO), USTUTT (University of Stuttgart), and DTU (Technical University of Denmark). It focused on advanced aerodynamic modelling and novel experimental approaches for studying the unsteady behaviour of multi-megawatt floating turbine rotors (Bernini et al., 2018). The work, carried out between June 2017 and April 2018, was divided in two work packages: the first studied the two-dimensional airfoil aerodynamics by conducting tests in the DTU red wind tunnel; the second focused on the scaled-turbine-model performance under imposed harmonic-surge motions, comparing GVPM experiments with numerical results. The numerical part involved a full CFD model, provided by USTUTT, plus a BEM and a free-vortex code (AWSM) provided by TNO. Input to the lifting line codes were the airfoil polars obtained in the first work package. The significant number of data generated within UNAFLOW were made available to the scientific community, including a number of steady and unsteady tests on an SD7032 airfoil, steady and unsteady full turbine loads, and particle image velocimetry (PIV) wake measurements. The latter were investigated by Bayati et al. (2017b, 2018b), and an overview of the main results can be found in Bayati et al. (2018a). Concerning the CFD results, only those obtained with the axisymmetric model were addressed in Cormier et al. (2018) and included in the final project report (Bernini et al., 2018). Moreover, an inconsistency in the set-up of some simulations was later discovered, explaining the large discrepancies found in the comparison. For this reason, the results have been recently reviewed and updated, reaching a final convergence (Mancini, 2020).
In this work, the latest comparison of the turbine performance under harmonic surge is presented. With respect to the original UNAFLOW report (Bernini et al., 2018), the unsteady thrust response from wind tunnel measurements has been obtained with a revised inertia subtraction procedure; the full CFD results have been included, together with new BEM and AWSM simulations; the outcomes of an actuator line code (AL) have been added as an intermediate fidelity level. A frequency domain analysis has been performed focusing on control-relevant quantities, and the influence of the amplitude and frequency of the surge motion has been investigated. To have a theoretical reference, a simple linear model based on quasi-steady theory (Appendix A) has also been included in the comparison. In an attempt to give a more general representation to the unsteady analysis, the results in the frequency domain have been reported in a non-dimensional form, defining some meaningful parameters that may be conveniently used in future works. This paper aims to shed light on the surge-induced unsteady aerodynamics of an FOWT, providing the first publicly available experimental data to be used as a benchmark for code validation. The main research goal was to reach a clearer awareness of the impact of dynamic-inflow effects. As a side benefit, a valuable comparison of some state-of-the-art codes for the aerodynamic modelling of wind turbines has been produced, along with a robust non-dimensionalization strategy for the results.
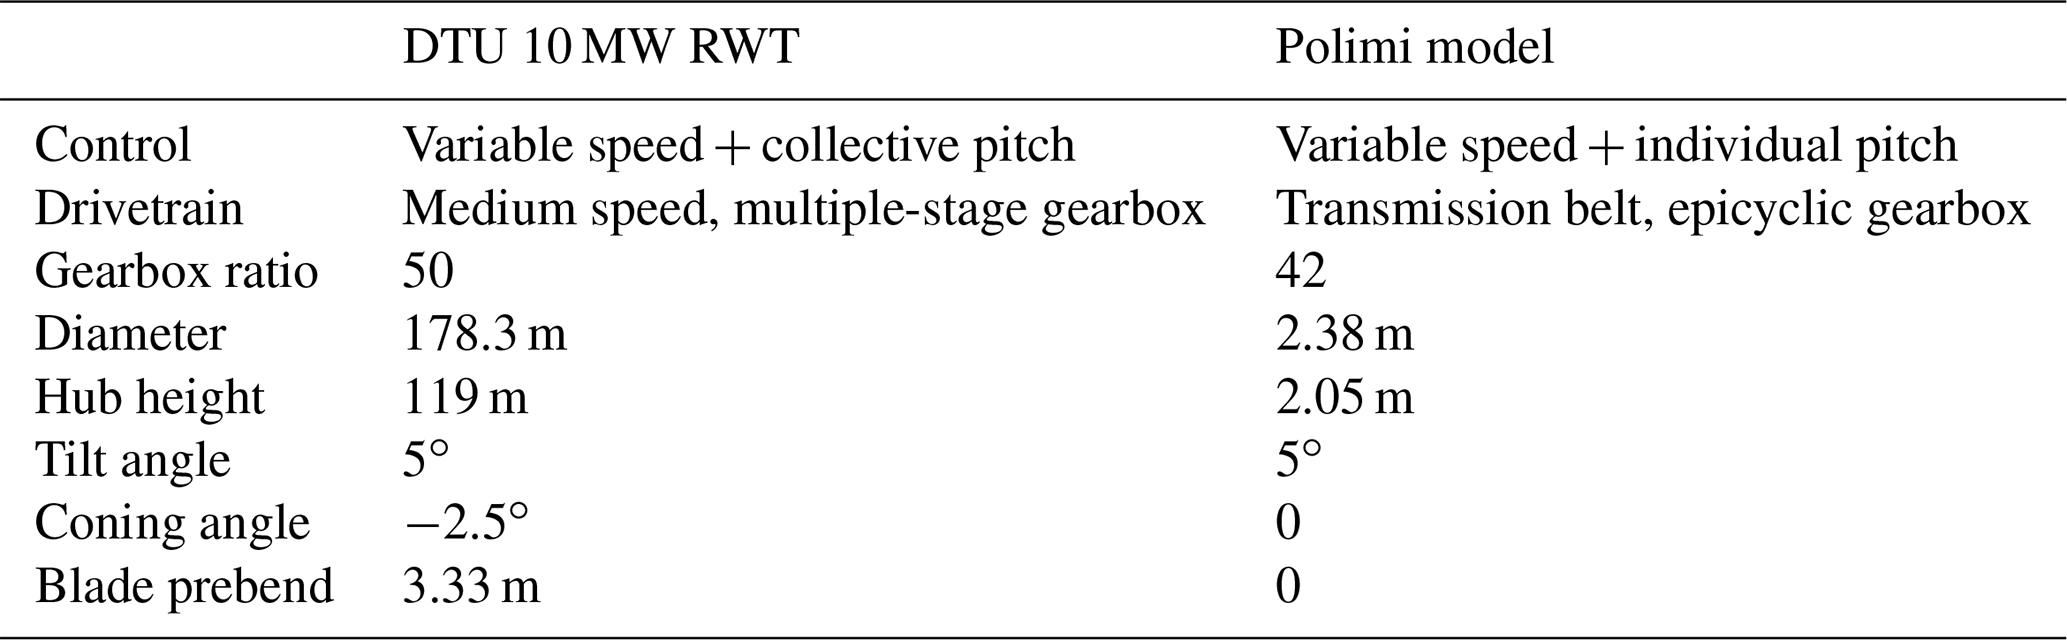
The turbine model tested in UNAFLOW was a 1:75 scaled version (2.38 m diameter) of the DTU 10 MW RWT. Such a reference rotor was chosen to resemble the size of current offshore units being installed. The model was completely designed and engineered by Polimi within LIFES50+, accurately matching the RWT aerodynamic coefficients, especially the thrust coefficient (CT) because of the leading role of thrust in the dynamics of an FOWT. Whilst in Froude-scaled models (e.g. Goupee et al., 2017; Madsen et al., 2020) the blade pitch is typically adjusted in order to cope with the steady thrust reduction due to lower Reynolds numbers, here a different approach was followed for better aerodynamic accuracy. Given that the dimensions were scaled by a factor of 75 to fit in the wind tunnel, and the wind velocity was scaled by a factor of 3 for surge actuation purposes, the Reynolds number was 225 times lower than in reality. Hence, a low Re profile (SD7032) was employed, changing the chord and twist distributions to fulfil the load compliance. Such a procedure allowed an accurate thrust reproduction throughout the whole operating range, along with a satisfactory torque match up to rated wind conditions (Bayati et al., 2017c). The scaled turbine was also equipped with variable speed and individual blade pitch controllers (Bayati et al., 2017a), but these features were not exploited in these tests. In Table 1 the key characteristics of the scaled turbine are compared to those of the RWT.
Table 1Key parameters of the DTU 10 MW compared to the Polimi's model.
The experimental campaign was carried out in the boundary layer test section of the GVPM (13.84 m wide × 3.84 m high × 35 m long). The tests were performed in an empty inlet configuration (i.e. without roughness elements or turbulence generators) aiming to obtain an inflow-velocity profile as constant as possible. Figure 2 shows the resulting wind speed and turbulence intensity (TI) distributions measured 5 m upstream of the rotor plane and normalized by the value measured at the hub height. The wind speed could be considered constant in the rotor zone, with a TI of around 2 %.
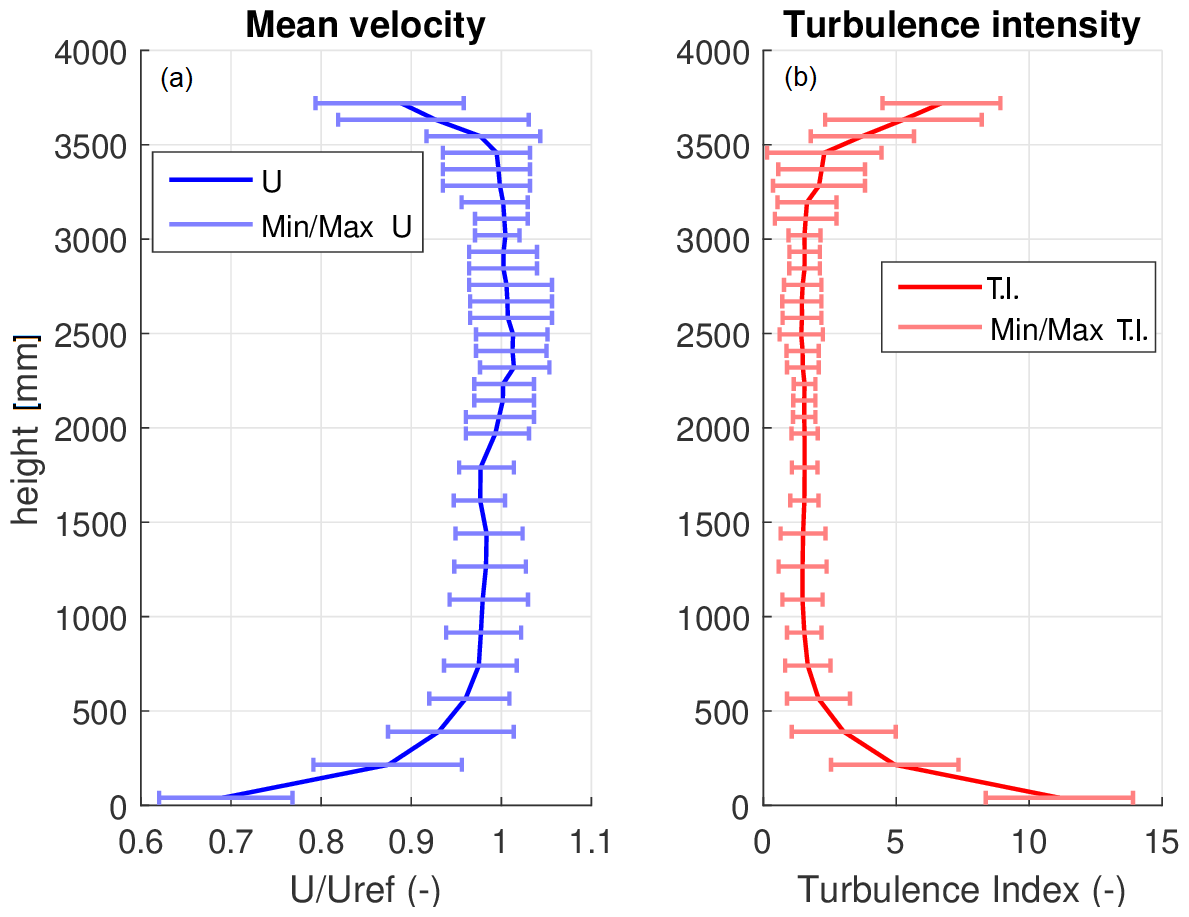
Figure 2Wind tunnel speed and TI profiles normalized by the value measured at hub height with error bars.
2.1 Experimental set-up
The model turbine was mounted on a slider, which was operated by means of a hydraulic actuator to produce the desired surge motion, as shown in Fig. 3; a schematic sketch with the reference system adopted in this work is also included. Another hydraulic piston was connected to a slider-crank mechanism underneath the tower, which allowed the control of the turbine pitch too. However, the latter feature was not exploited in UNAFLOW, and the mechanism was only used to place the rotor perpendicular to the inflow (i.e. to cancel the 5∘ design tilt angle). This choice was made to avoid the related periodic effects.
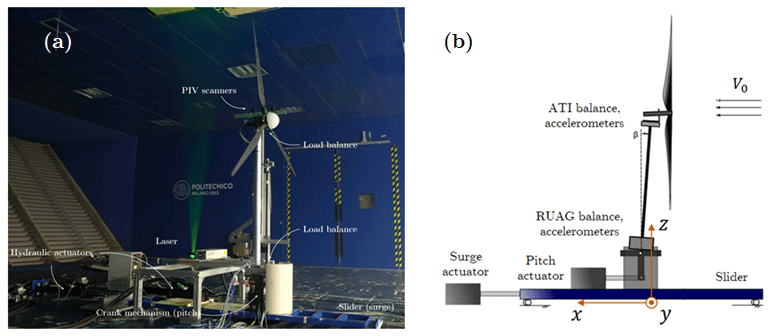
A wide array of sensors was employed to measure both dynamic response and flow field characteristics. All the instruments were synchronized and all of them sampled at 2 KHz. The shaft was equipped with an encoder and a proximitor, which measured the rotational speed and the azimuthal position, respectively. Loads were measured by means of two six-component balances, one mounted at the tower base (RUAG) and one underneath the nacelle (ATI); only the latter was used in the post-processing. Two accelerometers were placed next to each balance: at the base they measured along the surge and heave directions (x and z according to Fig. 3b); at the nacelle they measured along the surge and sway directions (x and y). To measure the surge position of the base, both a linear variable differential transformer (LVDT) and a laser transducer were placed. The laser was chosen as the reference measure for its lower delay. For the flow field, the incoming wind speed was measured by a Pitot tube located 5 m upstream of the turbine at a height of 1.5 m from the floor. The PIV system consisted of a pair of cameras mounted on an automatic traversing system and connected to an Nd:Yag laser, which enlightened the seed particles in the flow. The pictures were post-processed with PIVview 3C (PIVTEC) to create the 2D velocity contours in various zones of the near wake. However, this work focuses on the aerodynamic loads, and the wake measurements, despite being tightly linked, are not considered.
2.2 Steady tests
Before imposing the surge motion, steady tests were carried out at three different wind speeds to obtain the reference static performance. The operating conditions considered are reported in Table 2. The first two cases (named BELOW and RATED) were both at the optimal tip speed ratio (λ=7.5) with the blades in the neutral pitch position but with different wind velocities (variable speed rotor). The ABOVE case instead considered an above-rated wind speed with a lower λ and a blade pitch of 12.5∘ towards feather.
Table 2Operating conditions tested in UNAFLOW.
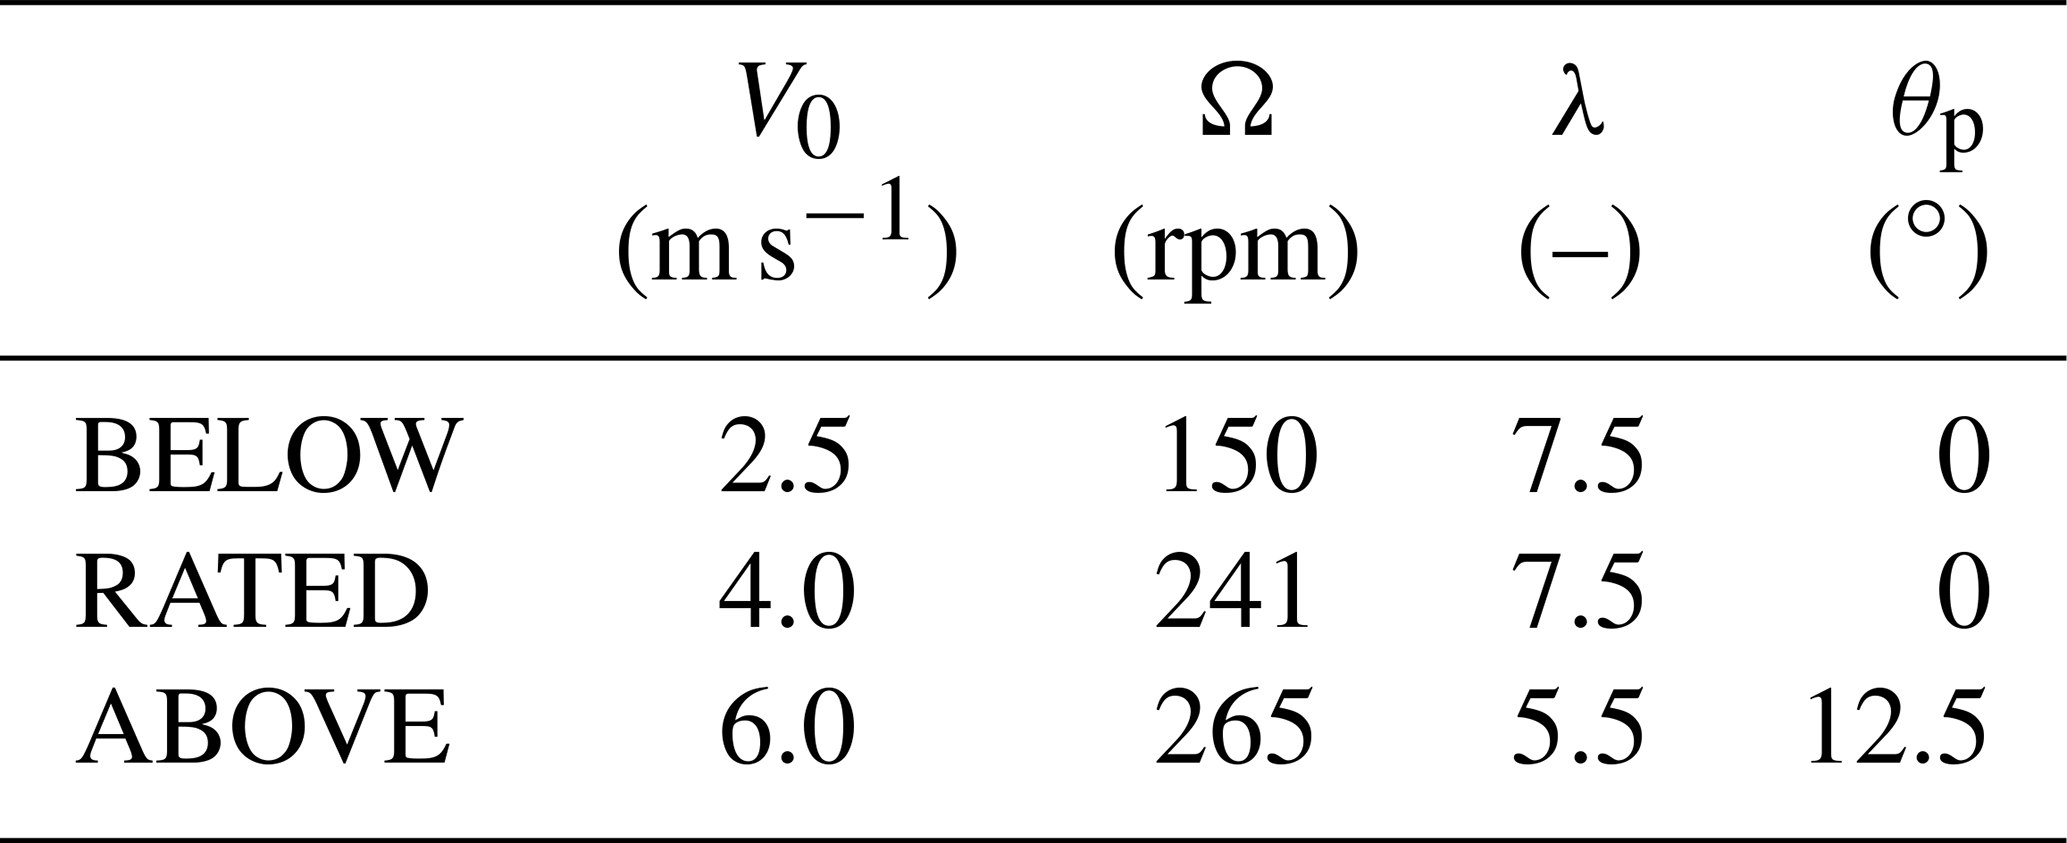
BELOW and RATED tests are called, respectively, RATED1 and RATED2 in the project report (Bernini et al., 2018).
2.3 Unsteady tests
For each of the three steady conditions, a number of unsteady tests were performed. A hydraulic actuator was used to impose a sinusoidal surge motion to the slider upon which the turbine was mounted. The displacement at the base of the tower could be expressed as
with As and fs being the surge amplitude and frequency, respectively. Different pairs of amplitude and frequency values were tested. Being the platform surge of an FOWT induced by the hydrodynamics, the frequency range of the motion depends on the wave's excitation. Therefore, different fs values were chosen to represent possible frequencies at which a peak in the sea wave spectrum might be found. The selected range went from 0.125 to 2 Hz at model scale, corresponding to Hz at full scale. This range was consistent with those investigated in the literature (de Vaal et al., 2014; Micallef and Sant, 2015; Farrugia et al., 2016; Tran and Kim, 2016). Provided that the real turbine oscillation amplitudes depend on the floater type and on site-specific parameters (e.g. water depth and mooring lines), different As values were considered at each frequency so as to cover a wide range of possibilities. The amplitude range selected guaranteed the magnitude of the angle-of-attack variation in surge to be limited, confining dynamic stall effects to the blade root only. A total of 84 unsteady tests were conducted: 28 for each steady operating condition. The full test matrix can be found in Bernini et al. (2018). It is important to observe that the standard turbine controller was not active during surge, and both the blade pitch and the rotational speed were kept constant at the values reported in Table 2.
One of the major challenges of the experimental campaign was the extraction of the aerodynamic thrust from the balance measurements. In fact, especially at the higher fs, the load signal was heavily affected by the nacelle inertial contribution due to the imposed surge acceleration. Originally the inertia subtraction was made assuming a perfectly rigid system: the aerodynamic part of the signal was extracted by subtracting from the force measured during surge, the one measured imposing the same surge motion without wind. Tests without wind were referred to as NOW (i.e. NO-Wind). Mancini (2020) showed that the high aerodynamic damping generated by the rotor when the wind was active had led to dynamic amplification effects, which had biased LIFES50+ results. The stiffer tower employed in UNAFLOW was proven able to mitigate such effects. Anyhow, an alternative inertia subtraction procedure capable of reducing the bias due to tower flexibility was proposed, and it has been used in this work. Having the acceleration measure along x (Fig. 3b) at the nacelle, the aerodynamic thrust force has been obtained as
with T being the aerodynamic thrust and FATI and ACC the ATI balance and the accelerometer measurements along x, respectively. The mass of the nacelle m, i.e. all that was attached to the ATI balance, has been estimated from the NO-Wind tests considering the amplitudes of the surge frequency harmonics extracted through a fast Fourier transform
A comparison among different inertia subtraction procedures can be found in Mancini (2020).
In order to avoid leakage in the frequency domain analysis, all the wind tunnel test signals have been windowed, always considering six full surge periods.
Four different numerical methods have been used for a numerical-experimental cross-validation: a BEM and an FVW (AWSM) part of the ECN's Aero-Module (Sect. 3.1), an AL (Sect. 3.2), and a full CFD model (Sect. 3.3). The codes have been selected to cover almost the whole state-of-the-art fidelity range available for the aerodynamic modelling of wind turbines. This way it is possible to better understand the capability of each method to deal with the unsteady aerodynamics.
3.1 Aero-Module
The ECN Aero-Module (Boorsma et al., 2011, 2016, 2020) contains two aerodynamic models, namely the blade element momentum (BEM) method similar to the implementation in the program for horizontal axis wind turbine analysis and simulation (PHATAS) (Lindenburg and Schepers, 2000) and a free-vortex wake code in the form of AWSM (van Garrel, 2003). Both models use aerodynamic look-up tables to evaluate the sectional airfoil performance. Several dynamic stall models, 3D correction models, wind modelling options, and a module for calculating the tower effect are included. The set-up allows us to easily switch between the two aerodynamic models whilst keeping the external input the same, which is a prerequisite for a good comparison between them.
3.1.1 Wake modelling
Since a pure BEM code only resolves the rotor plane, an engineering model has to be added to simulate wake effects. Therefore, the ECN dynamic-inflow model (Snel and Schepers, 1994) has been implemented to account for the aerodynamic rotor “inertia”. The dynamic-inflow model adds another term to the axial momentum equation. This term is proportional to the time derivative of the annulus averaged axial induction of the element under consideration, and its magnitude varies with the radial position.
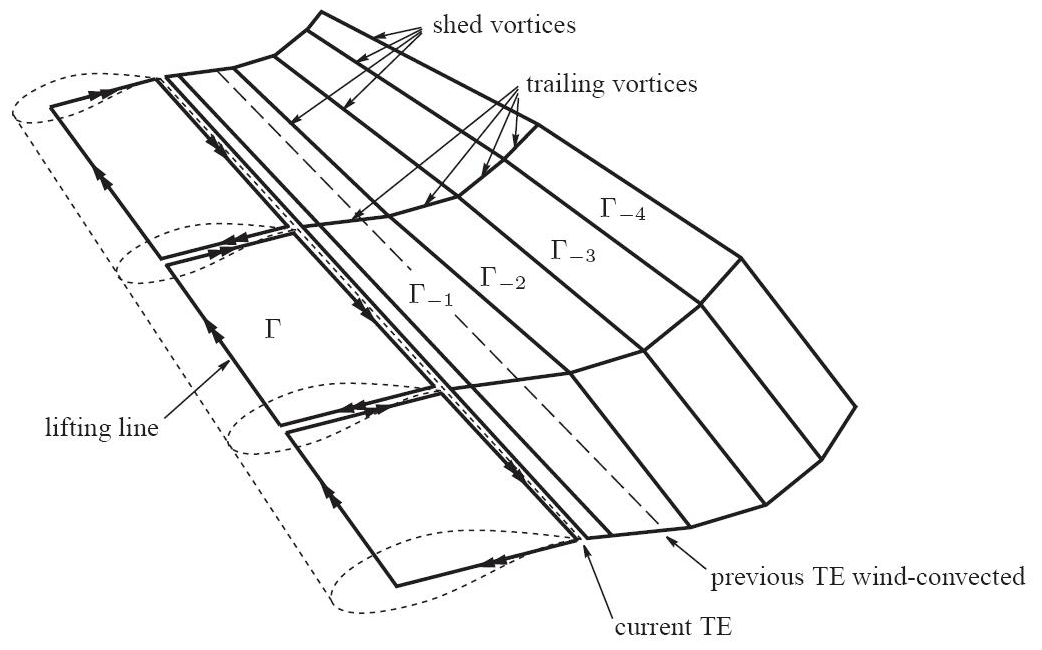
AWSM, instead, uses the blade geometry to create vortex lattices which are convected in the wake, conserving the shed and the trailing vorticity as depicted in Fig. 4. The trailing vorticity accounts for the spanwise circulation variation, whilst the shed vorticity accounts for the variation with time of the bound vortex. Consequently, all the wake-related flow phenomena (e.g. dynamic inflow, aeroelastic instabilities featuring shed vorticity variation and skewed wake effects) are modelled intrinsically, where they are covered by engineering models or not covered at all in BEM. If the wake points are modelled as free, the convection of each wake point is determined by the aggregate of the induced velocities from all vortices using the Biot–Savart law.
3.1.2 BEM implementation in surge
A turbine subjected to surge or pitching motions experiences apparent wind velocities at the rotor due to the movements of the tower base. Since these wind velocities add energy to the system (as they are induced by the waves), it can be argued that these should be incorporated in the effective wind speed used in the momentum part of the BEM equations. This is in addition to the obvious implementation of such relative motion in the element part of the BEM equations. The validity of this statement has been verified comparing a simulation with a moving rotor (which is used in the present work) to a simulation with a “fixed” rotor featuring a sinusoidal wind variation in agreement with the surge motion. Free-vortex wake simulations give nearly identical results for both approaches in this case, indicating that the main effect the wind turbine rotor experiences is the apparent wind effect rather than the rotor moving into and out of its own wake. For the BEM simulations it has been observed that the shape of the force response is inconsistent if apparent wind velocities are not taken into account in the momentum equations.
Implementation-wise, this can result in a challenge since an aeroelastic code is not always aware of whether the blade motion is due to the turbine flexibility (e.g. tower fore–aft bending) or due to the platform motion induced by waves. Recommended practice here is to register the translational and rotational movement at the tower base and extrapolate the resulting apparent wind velocities to the rotor plane locations of interest. For a pitching movement this would imply a linear variation with height of the apparent wind velocity over the rotor disk and hence a non-uniform inflow condition, which anyhow is a challenge for BEM simulations.
3.1.3 Aero-Module settings
To be consistent with the higher-fidelity models, a rigid version of the turbine has been simulated. The airfoil data have been obtained from the corresponding 2D experiment in UNAFLOW (Bernini et al., 2018) for clean conditions at a Reynolds number of 1×10⁵. Snel's 3D correction (Snel et al., 1993) has been used to account for rotational effects on the airfoil data. Also, the first-order dynamic stall model of Snel (1997) has been employed in all the simulations. The effect of tower stagnation has not been included instead. The time step has been kept at the approximate equivalent of 10∘ azimuth for both BEM and AWSM simulations, which has proved small enough to capture the surge motion and the related unsteady effects under investigation.
For the free-vortex wake simulations, the number of wake points has been chosen to make sure that the wake length developed for at least three rotor diameters downstream of the rotor plane. The wake convection has been set free for approximately two rotor diameters, then for the remaining part in the far wake, the blade average induction at the free-to-fixed wake transition has been applied to all the downstream wake points. These settings were shown to keep the average torque and thrust levels within a small percentage of a reference simulation featuring 25 rotor diameters wake length, while the dynamic loading appeared to not be affected at all.
3.2 Actuator line
The actuator line model has been chosen as an intermediate step between the free-vortex method and the full CFD. To run the simulations, a Polimi in-house-developed actuator line code for OpenFOAM (Schito, 2011) has been used. In contrast with a classical actuator line, such code adopts an effective-velocity model (EVM), as proposed by Schito and Zasso (2014), to evaluate the relative-velocity vector used in the calculation of the aerodynamic forces. In particular, instead of evaluating it at the very same point where the force is applied, the EVM considers a series of sampling points along a line placed perpendicularly to the wind and upstream of the profile leading edge, estimating the relative velocity as a vectorial average among the samples. This technique was successfully employed to model the aerodynamics of vertical-axis turbines (Schito et al., 2018; Melani et al., 2019). Thanks to the EVM, the smearing parameter of the regularization kernel function (a bivariate normal distribution) has been set equal to the characteristic cell size without problems of numerical stability. The length and position of the sampling line have been chosen according to the optimal values indicated by Schito and Zasso (2014). The code gives the possibility of imposing a surge motion to the actuator lines, and this has been exploited to replicate the unsteady wind tunnel tests. The airfoil polars that have been used are the same as in the Aero-Module simulations. Only the three blades have been modelled (as rigid actuator lines); neither the tower nor the nacelle has been taken into account.
The computational domain has reproduced faithfully the wind tunnel section width and height. The streamwise direction has been modified, setting the inlet section 5 m upstream of the turbine, i.e. where the wind velocity was measured, and the outlet more than six diameters downstream to allow for atmospheric-pressure recovery. The walls have been assumed smooth to avoid the need of modelling the boundary layers. Thanks to the absence of the turbine, a completely structured and flow-aligned grid has been generated. Cubic elements have been used in the rotor zone, and two cylindrical refinement zones have been set around the turbine. The detailed grid layout can be found in Mancini (2020). The chosen mesh had almost 3.5 millions cells, with 50 elements per actuator line and a characteristic cell dimension within the integral range of the inflow turbulence. Using a finer grid (11.6 millions elements, 75 per blade line) with the same layout, the average steady-turbine loads have varied less than 1 %.
Thanks to the absence of boundary layers, large-eddy simulations (LESs) have been conducted to solve the incompressible Navier–Stokes equations featuring the standard Smagorinsky model. More complex sub-grid-scale models could have been selected, but Sarlak et al. (2015) proved their impact small, provided that a sufficient grid refinement is present. A third-order QUICK (quadratic upstream interpolation for convective kinematics) scheme has been used for the convective term, with an almost purely second-order Crank–Nicolson scheme for the time derivatives. The solver is based on the PISO (pressure-implicit with splitting of operators) algorithm, using a multigrid linear solver for the pressure and a preconditioned bi-conjugate gradient method for the velocity components. The time step size (Δt=0.0005 s) has been selected in order to keep the Courant number below 0.5, prevent actuator line tips from crossing more than one cell per time step, and avoid the leakage in the frequency domain analysis.
3.3 CFD
The fully resolved CFD simulations have been run for a subset of cases to get more insights into the flow physics. The finite-volume flow solver FLOWer, originally developed by the German Aerospace Center, has been used for the present study (Kroll and Faßbender, 2005).
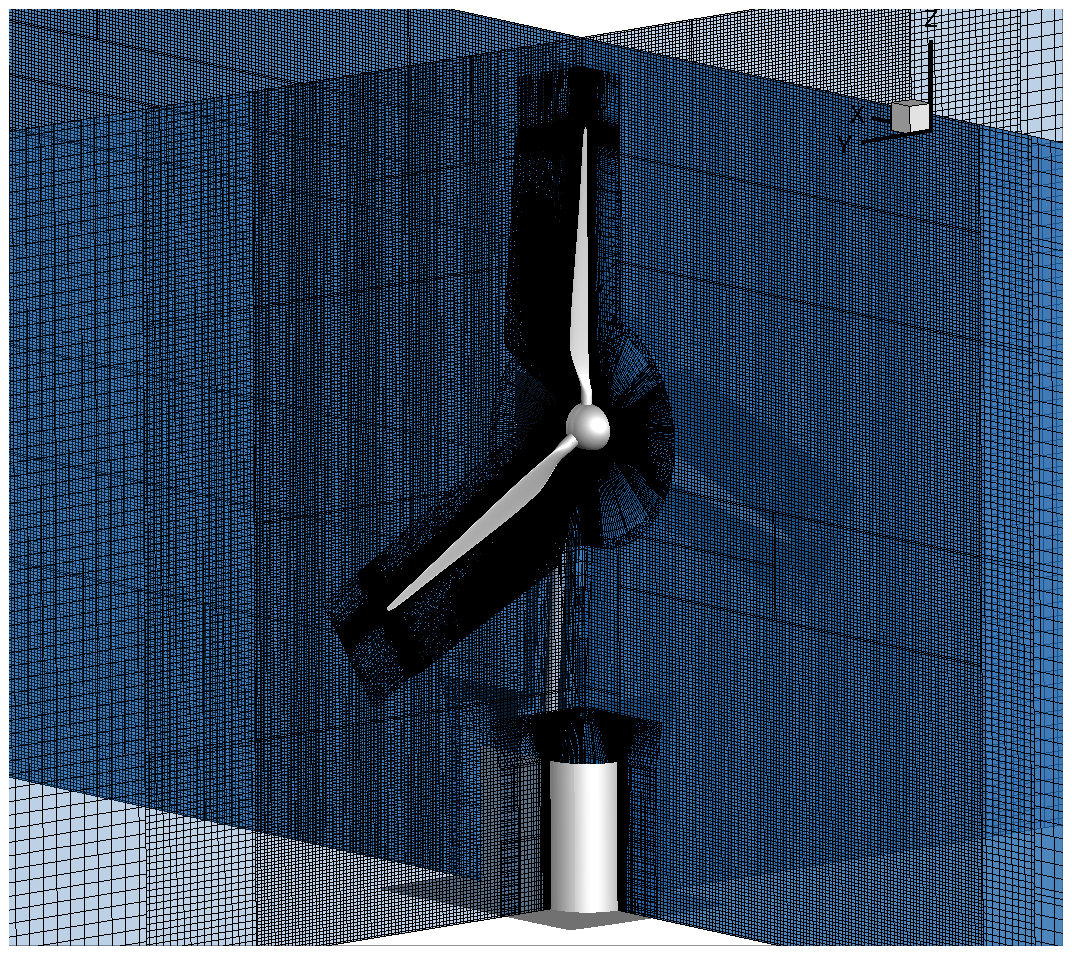
The computational set-up of the one-third model of the scaled wind turbine, presented in Cormier et al. (2018), has been extended to a full model of the wind turbine as shown in Fig. 5. The compressible unsteady Reynolds-averaged Navier–Stokes equations have been solved, using Menter's shear stress transport model for turbulence modelling (Menter, 1994). A second-order dual time-stepping scheme has been employed for the time discretization and combined with a multigrid algorithm to accelerate the convergence. The fifth-order weighted non-oscillatory (WENO) scheme has been used for the spatial discretization in the wake of the wind turbine in order to reduce the dissipation of the vortices (Kowarsch et al., 2013). In the body meshes and outside the wake region, the spatial discretization has been realized with the second-order Jameson–Schmidt–Turkel (JST) scheme (Jameson et al., 1981). All component grids have been embedded in a Cartesian background mesh by means of the Chimera overlapping-mesh technique. Thanks to this technique, relative motions between the components and the background grid can be realized allowing the simulation of both the rotation of the rotor attached to the fixed tower and the surge motion of the whole turbine. The hub has been extended from a 120∘ to a 360∘ section, and new meshes for the tower and its base have been generated. The grids have been created with the commercial tool Pointwise, combined with in-house automatizing scripts. The height of the first boundary layer cell in the body meshes has been chosen such that is ensured. The resulting numerical set-up consists of 118 millions cells. As the experimental streamwise velocity profile upstream of the turbine presented no shear in the rotor area, a uniform inflow has been applied at the inlet via a far-field boundary condition. To take into account the blockage effect due to the upper and lower walls of the wind tunnel, while optimizing the use of computational resources, the ceiling and the ground have been modelled by a slip boundary condition as in AL simulations but adding a displacement thickness of 12.5 cm to meet the experimental flow rate. The distance between the wind turbine and the boundaries of the computational box has been defined according to Sayed et al. (2015). The outlet and the lateral boundary conditions have been set as far-field and located nine and five rotor radii away from the wind turbine, respectively. A time step corresponding to a blade rotation of 1∘ with 60 inner iterations has been applied.
Since dynamic-inflow effects are known to be more relevant when the turbine loading is high, the comparison has been focused on rated wind conditions rather than above-rated. Furthermore, RATED tests (see Table 2) have been preferred to BELOW ones because of the better signal-to-noise ratio characterizing the measurements.
4.1 Steady comparison
The steady performance of the scaled turbine has been considered first, comparing the predictions of the different codes against the experiments without surge. The outcomes of this comparison are reported in Table 3 in terms of the steady thrust force (T0) and mechanical power (P0); the percentage errors have been defined with respect to the wind tunnel measurements. To run the steady CFD simulations, only the axisymmetric model (here referred to as 1∕3 CFD) has been used. However, the good agreement found with the quasi-steady theory (Sect. 4.2) has provided reliability when estimating the steady performance from the full CFD model (referred to as CFD in Table 3), averaging the unsteady loads over a full surge period. The consistency of this approach has been confirmed by the excellent match with the steady wind tunnel tests, showing maximum discrepancies below 2 %. The confidence has been raised further by the fact that the average values obtained from the two different surge simulations are almost identical.
Table 3Comparison of the steady-turbine model performance in RATED conditions.
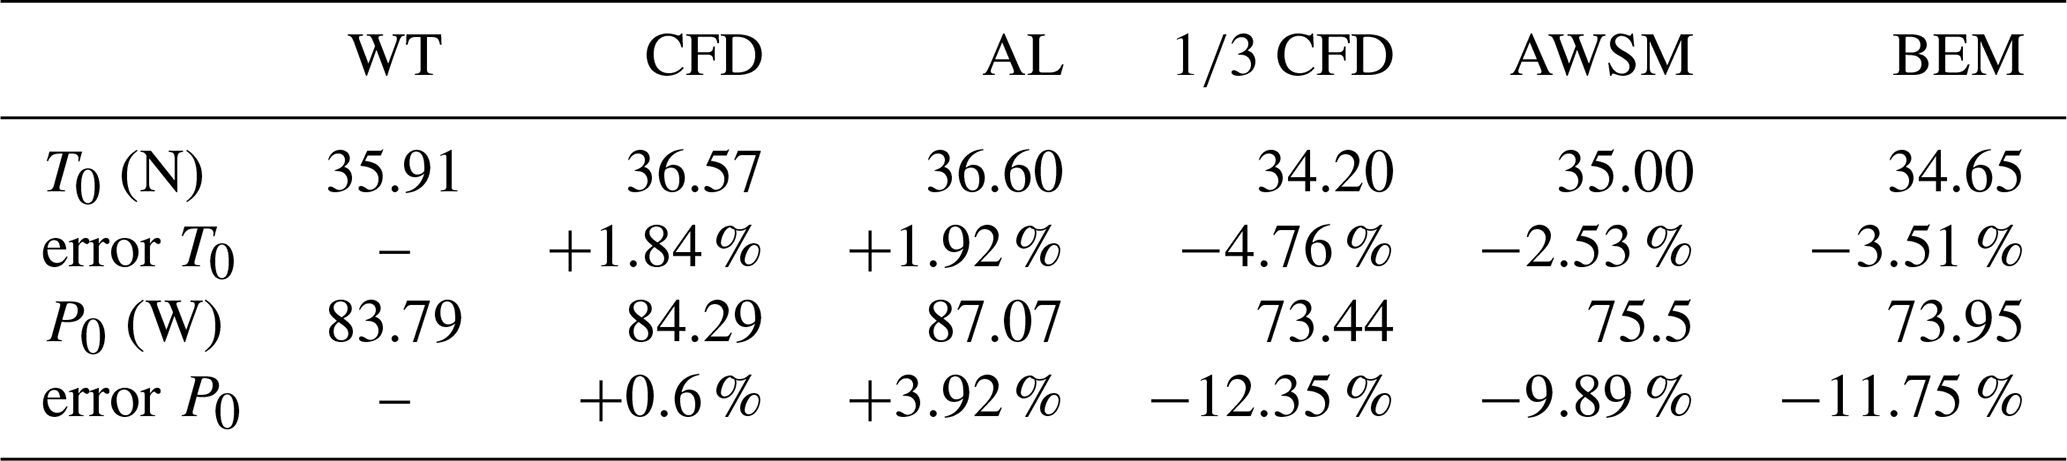
Similarly to the full CFD, the actuator line results are in very good agreement with the experiments. The Aero-Module codes (BEM and AWSM) show higher discrepancies especially for the power, which is underestimated by about 10 % by both models. The thrust is underrated as well but to a lower extent. Very similar values have been obtained by the axisymmetric CFD simulation too; hence BEM, AWSM, and 1∕3 CFD results are in good agreement among each other but systematically different from the full CFD, the AL, and the experimental tests. A significant source of this discrepancy appeared to be a small difference in the inflow velocity due to the fact that the reference wind speed of wind tunnel tests was measured 5 m upstream of the rotor, where the induction field had a slight impact that was not accounted for by all the models. However, the influence of such discrepancy on the unsteady investigation is expected to be negligible.
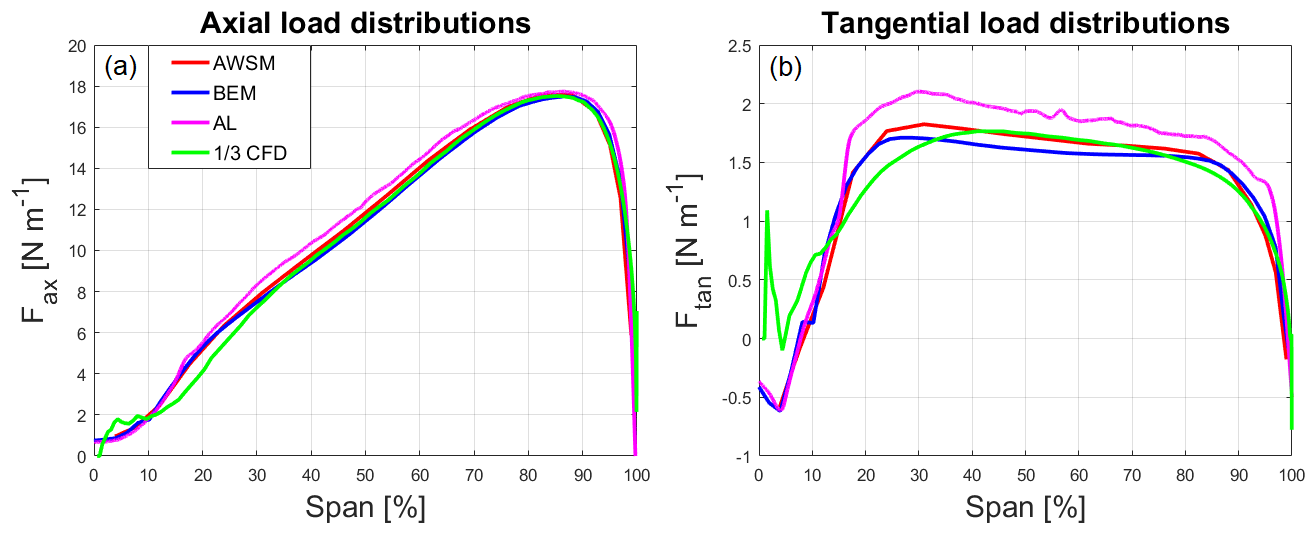
To deepen the steady comparison, the spanwise load distributions obtained with the different codes have been considered. In Fig. 6 the axial and tangential (i.e. contributing to thrust and torque, respectively) unit force distributions along the span are reported. Unfortunately, the spanwise distributions from CFD have been extracted from the steady axisymmetric simulation only. In regards to the axial load (Fig. 6a), the shape is the same for all the models, and the discrepancies are small throughout the span. In accordance with the integral values, the match among BEM, AWSM, and 1∕3 CFD is almost perfect; the AL's distribution is just slightly above the others. A greater discrepancy is found for the tangential force (Fig. 6b). Here, the shapes of the AL, BEM, and AWSM distributions are very similar to each other (owing to the fact that the same polars have been used), but the first shows greater values after 25 % of the span. The lower values, along with similar overall shapes, confirm the impact of the rotor-induced velocity on the measured wind speed ahead of the turbine. A greater undisturbed velocity would indeed increase the angle of attack along the span, leading to higher values of axial and tangential forces with the same distribution shape, similarly to AL. Because of the presence of the nacelle, the shape of the 1∕3 CFD differs significantly from the others at the blade root until around 40 % of the span. The root discrepancy does not produce any significant power variation though since its contribution to the integral torque is small.
4.2 Unsteady comparison
After having validated the predictions of the codes for the stationary turbine case, some of the surge tests belonging to the UNAFLOW matrix have been considered, all in RATED conditions (Table 2). The list of these tests is shown in Table 4, where the surge parameters are given (at model scale) along with the corresponding wind tunnel test number. The only tests replicated by all the codes are numbers 50 and 59.
Table 4Numerical-experimental test matrix: a exp + AL, b exp + BEM + AWSM, c exp + all codes. The values of the harmonic-surge frequencies (fs) and amplitudes (As) are listed.

The primary target of the unsteady experimental campaign was the characterization of the thrust force oscillation due to its leading role in the surge dynamics of an FOWT. Indeed, the scaled model was specifically designed to match the RWT thrust coefficient. Having the value available from both codes and experimental measurements, the mechanical power has also been taken into account. However, the wind tunnel torque measurements have been discovered to be affected by a mechanical resonance that biased the high-frequency results. For this reason, the analysis hereinafter presented is mostly focused on the thrust. Concerning the power, only the comparison of the surge frequency harmonic is shown in Sect. 4.2.2 for the sake of completeness.
4.2.1 Time domain analysis
The comparison of the thrust oscillation is first presented in the time domain, as typically found in the literature. At first, the impact of the surge motion on the mean aerodynamic thrust has been assessed since Micallef and Sant (2015) and Farrugia et al. (2016) observed a variation in the mean thrust coefficient during surge, also at the optimal λ. To check if the results are characterized by a similar behaviour, a mean thrust variation parameter can be defined as
with T0 being the steady value reported in Table 3 and the average of the thrust signal over a full surge period. Figure 7 plots the values of ϵT against the surge frequency for the different tests and simulations performed. In all cases, the surge motion does not seem to affect the mean thrust in any way. The maximum discrepancies with respect to the steady values are always below 0.5 % and completely insensitive to the surge parameters. Such small variations fall within the uncertainty level associated with each method. Therefore, for the purpose of this work, it is possible to consider .


Figure 8Thrust oscillation time histories for case 59 (a), same plot considering only the surge harmonic of wind tunnel measurements (b).
To continue the time domain thrust analysis, it has been decided to separate the unsteady part of the signals from the steady part by subtracting the mean values from the thrust time histories, thus considering
This way it is possible to avoid the steady discrepancies when the time histories of different methods are considered. In Fig. 8, the time histories of ΔT are compared to the experimental measurement and to the linear quasi-steady model prediction (Appendix A) for test number 59, which has been reproduced by all the codes (Table 4), although similar comments apply for the other tests as well.
The experimental thrust time history, obtained by subtracting the inertia of the nacelle as in Eq. (2), is reported in Fig. 8a. The presence of many harmonics other than the surge one is evident. The reason for this lies in the fact that the inertia subtraction works properly only on the surge harmonic. In fact, whilst the largest share of the surge frequency component of the balance signal (given by the very inertia of the nacelle) is removed, the disturbances in both balance and accelerometer signals could even be amplified depending on their relative phases (which are random). Therefore, the only meaningful harmonic after the inertia subtraction is the one at the surge frequency, and this has been extracted via a discrete Fourier transform. Thanks to the long experimental observation periods, it has been possible to get high-resolution spectra despite the high sampling rate. In addition, leakage has always been avoided by taking time window lengths being integer multiples of the test surge period.
The output of this filtering procedure, applied to the thrust oscillation of test 59, is reported in Fig. 8b. The comparison reveals a very good agreement among codes, quasi-steady theory, and wind tunnel predictions, confirming the validity of the surge harmonic extraction from the experimental measurements. Indeed, the numerical results appear totally dominated by the surge frequency component. In particular, BEM and AWSM responses are almost purely mono-harmonic. In AL large-eddy simulations, a certain number of high-frequency components are noticeable, although insignificant with respect to the surge harmonic. This is because, despite the smooth-flow boundary condition at the inlet, some turbulent eddies form upstream of the turbine due to the high wind tunnel Reynolds number () and due to the actuator forces in the rotor plane. Finally, the full CFD signal presents a clear component also at the blade passing frequency due to the modelling of the turbine tower.
The assessment of the unsteady time histories shows a promising agreement overall, with responses that often overlap with each other. Nevertheless, the time domain analysis hinders a quantitative comparison among the codes, the experiments, and the quasi-steady theory because the differences are too small to be recognizable.
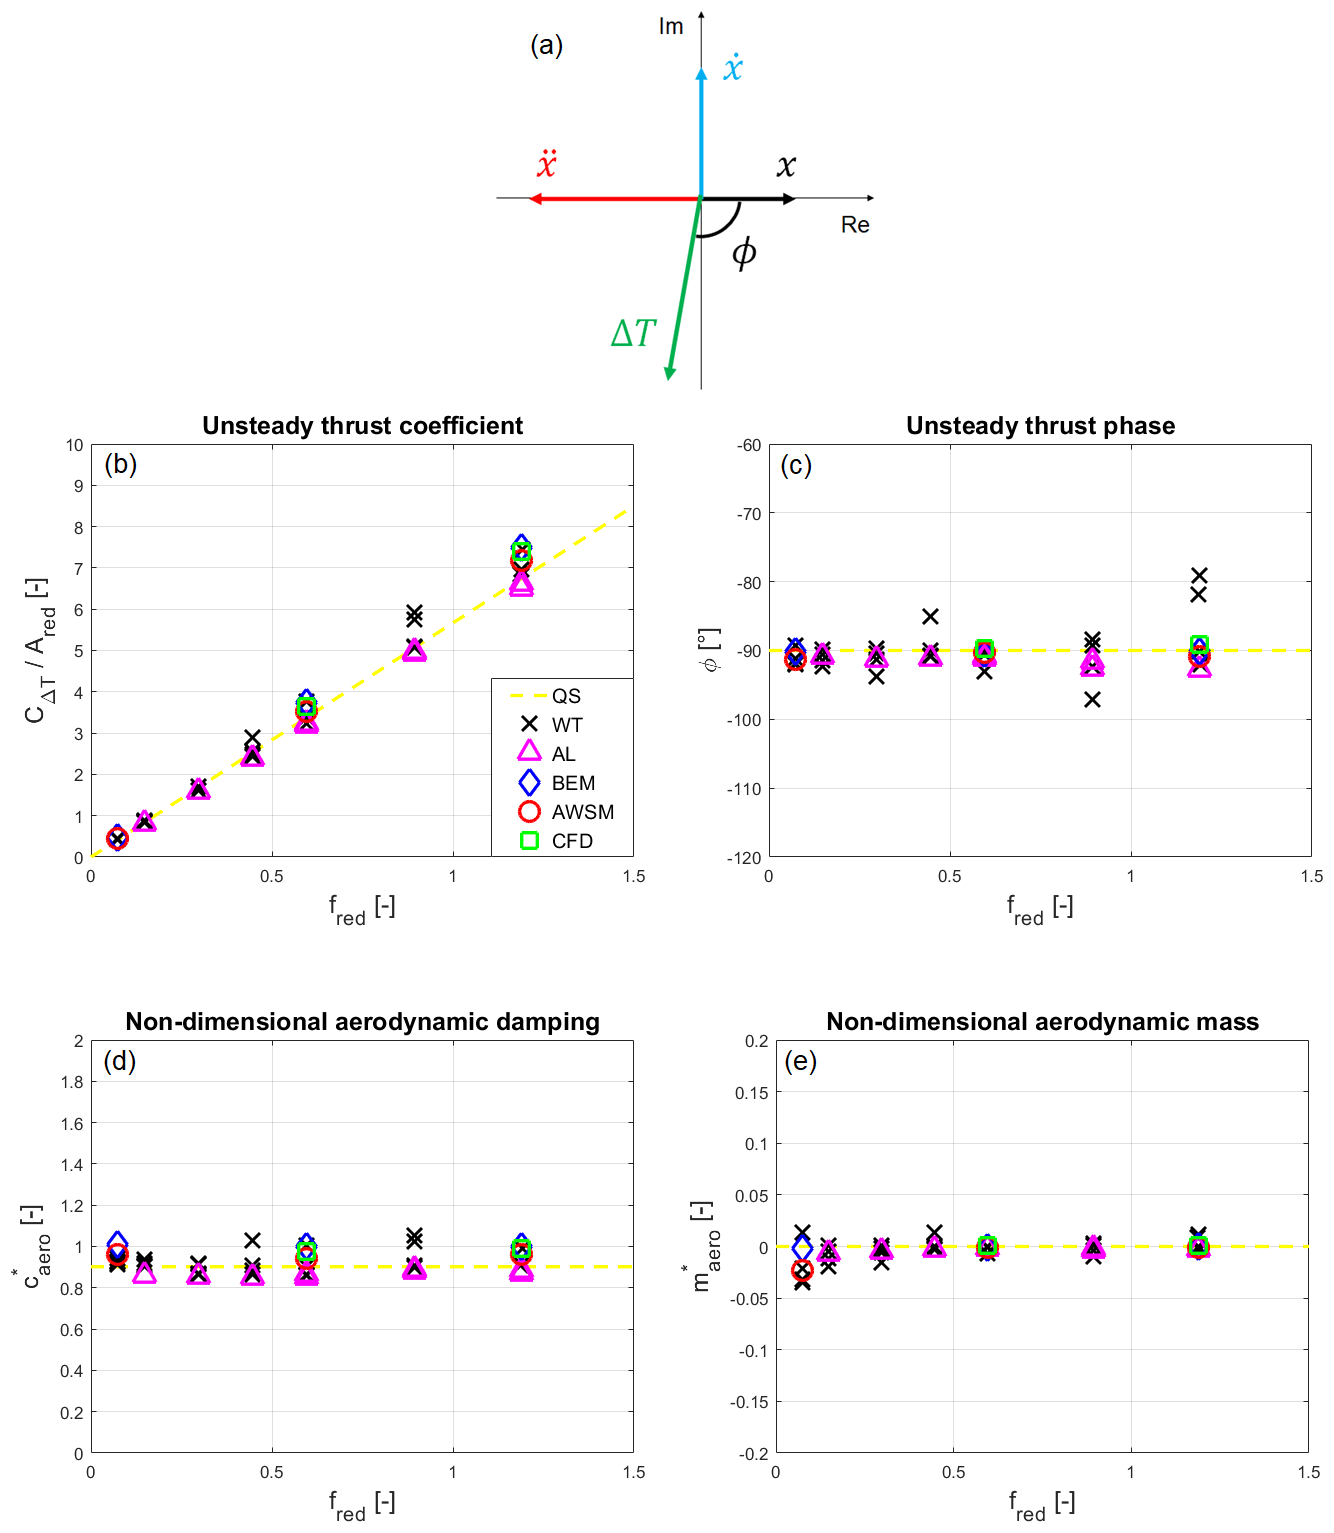
Figure 9Complex representation of the surge harmonic of the thrust oscillation (a), unsteady thrust coefficient comparison (b), comparison of the phase of the surge harmonic of the thrust oscillation (c), aerodynamic damping comparison (d), aerodynamic mass comparison (e).
4.2.2 Frequency domain analysis
Having observed that the surge harmonic rules the aerodynamic response of the turbine, its frequency domain characterization becomes fundamental to validate the results. This way, the unsteady response is completely described by its amplitude and phase, and thanks to the clear reference provided by the quasi-steady theory (Appendix A), it becomes much easier to spot dynamic-inflow effects due to surge. Indicating now with ΔT only the surge harmonic of the thrust oscillation, it is possible to represent it in the complex plane in terms of its amplitude and phase as
with ϕ being the phase shift between the thrust oscillation and the surge displacement at the surge frequency and i the imaginary unit. The term has been implied in this phasor representation. For the wind tunnel measurements, the base displacement signal imposed by the surge actuator (Eq. 1) has been chosen as a phase reference. The resulting scheme is reported in Fig. 9a. For control purposes, the thrust oscillation harmonic at the surge frequency can be more conveniently expressed in terms of the states of the system, defining two coefficients of utmost importance for the surge stability assessment: aerodynamic damping (caero) and aerodynamic mass (maero). Therefore, ΔT can be expressed in terms of these parameters as
with
Combining Eq. (7)–(9), the expressions for the aerodynamic damping and mass coefficients are immediately derived:
In order to extend the generality of the results obtained, paving the way for more robust comparisons here and also in future works, a non-dimensional characterization of the thrust oscillation harmonic at the surge frequency is proposed. For this purpose, a few non-dimensional groups have been defined. The first two are required to characterize the surge motion and have been called the surge reduced frequency (fred) and the surge reduced amplitude (Ared), respectively. They are defined as
Note that the reduced frequency is the inverse of the reduced velocity defined by Bayati et al. (2017b), and it compares the frequency of surge to the characteristic one of dynamic inflow, which is the most relevant source of unsteadiness associated with floater motions. The higher the fred, the greater the chance that dynamic-inflow effects will affect the response. The reduced amplitude might instead be used to evaluate the validity boundaries of the small-displacement assumption required to get the linear quasi-steady model (Appendix A).
To fully characterize the surge harmonic of the thrust response, its phase has been used as it is, while for the amplitude an unsteady thrust coefficient (CΔT) has been defined following the steady thrust coefficient definition:
with ρ being the air density and AD the area of the disk swept by the blades. Relying on the quasi-steady assumption, Eq. (A5) can be reworked, letting the non-dimensional groups appear so that an expression for the unsteady thrust coefficient is found:
The coefficient has been derived from the non-dimensionalization of Eq. (A7), and it has been called non-dimensional steady aerodynamic damping. An interesting fact is that it is only a function of the steady thrust coefficient curve of the turbine CT(λ); in fact
with λ0 being the steady-operating-condition tip speed ratio and c0 the steady aerodynamic damping defined in Appendix A.
Exploiting the new variables, the comparison of the results is presented in a non-dimensional form. In Fig. 9b, the amplitude of the thrust oscillation at the surge harmonic is characterized, plotting the ratio between the unsteady thrust coefficient and the reduced surge amplitude against the reduced surge frequency. The reason behind this choice is the linear trend foreseen by the quasi-steady theory, i.e. Eq. (15), that provides a clear theoretical reference for the comparison. It is worth noting that the slope of the quasi-steady reference has been evaluated analytically using the RWT characteristic curve, as explained in Appendix A. The plot reveals an excellent agreement among all the codes involved and the wind tunnel tests, with a maximum deviation of around 10 % at the highest reduced frequency. Anyway, all the numerical predictions fall inside the experimental test scatter. In contrast to the steady-turbine case, BEM, CFD, and AWSM tend to predict slightly higher values than the AL and the analytical model, with wind tunnel measurements typically in between. All the data seem to confirm the linear trend predicted with the quasi-steady assumption.
The comparison in terms of phase of ΔT is shown in Fig. 9c. According to the reference system of Fig. 3b, the quasi-steady model foresees ΔT to be in opposition to the phase with respect to the surge velocity. Having referred the phase to the surge displacement, the reference value is then ∘. Once again, the codes agree closely with the quasi-steady theory, with discrepancies just slightly increasing with fred. The phase values from the wind tunnel tests instead show a relevant scatter because of the uncertainty entailed by the inertia subtraction procedure. Especially at high frequencies, the share of the aerodynamic thrust in the balance measurement is much smaller than the inertial contribution due to the surge acceleration. As a result, when the subtraction is performed, the phase of ΔT appears much more sensitive to disturbances than its amplitude (Mancini, 2020).
Knowing the amplitude and the phase of the surge harmonic of the thrust oscillation, it is possible to evaluate the aerodynamic mass and damping coefficients from Eqs. (10) and (11). To continue with a non-dimensional analysis, the non-dimensional aerodynamic damping coefficient () and the non-dimensional aerodynamic mass coefficient () have been defined as
According to the quasi-steady theory, and . The non-dimensional comparison in terms of aerodynamic damping is reported in Fig. 9d. All the codes show a constant trend with respect to the reduced frequency, confirming the linearity of the plot in Fig. 9b and thus the validity of the quasi-steady assumption. Concerning the non-dimensional aerodynamic mass, Fig. 9e confirms that its values are always extremely close to 0, in agreement with the quasi-steady theory. Only a slight scatter appears at the lowest frequencies because of the inverse dependency of maero on the square of fs, as shown in Eq. (11); this amplifies even very small phase errors, leading to unphysical values of the aerodynamic mass.
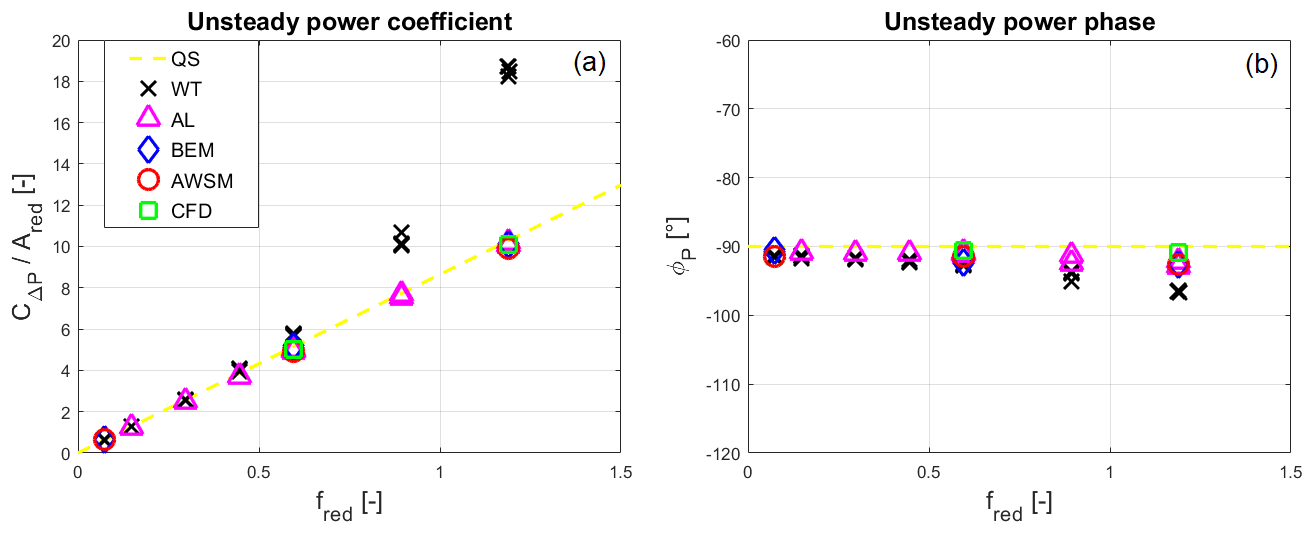
Figure 10Unsteady power coefficient comparison (a), comparison of the phase of the surge harmonic of the power oscillation (b).
Very similar considerations to those regarding the thrust can be made for the power oscillation. In particular, as the unsteady response is dominated by the surge harmonic, it is convenient to characterize it in the frequency domain. Similarly to the thrust, it is possible to represent the surge harmonic of the power oscillation (ΔP) in the complex plane as
with ϕP being the argument of ΔP, always with respect to the surge displacement harmonic, and again implying the term . Differently from the thrust case, the expression of the power oscillation in terms of the system states is avoided since ΔP only affects the power harvesting, not the system stability. To pass to a non-dimensional form, it is possible to define the unsteady power coefficient (CΔP) as
Then, reworking Eq. (A6), a non-dimensional expression linking the unsteady power coefficient to the steady-turbine operating conditions and to the surge parameters can be found, again relying on the quasi-steady assumption:
The latter expression perfectly corresponds to Eq. (15) concerning the thrust. This time though, the parameter depending on the turbine steady performance is rather than , and it is defined as
with CP being the turbine power coefficient and ζ0 the parameter defined in Eq. (A8), which links the power oscillation to the surge velocity.
The comparison in terms of the unsteady power coefficient is reported in Fig. 10a, always dividing by the reduced surge amplitude and plotting it against the reduced frequency to have a linear quasi-steady reference. As previously anticipated, the torque measured by the balances in the wind tunnel tests was subjected to a dynamic effect altering the power oscillation in the higher-frequency cases. In fact, the sharp amplitude increase arising as soon as fs exceeded 1 Hz and the contextual phase reduction (Fig. 10b) were caused by a power train resonance standing at 3.95 Hz. As long as the natural frequency was far, the angular degree of freedom behaved quasi-statically with respect to such a vibration mode, and the results were almost unaffected; getting closer to the resonance, a typical mechanical amplification phenomenon occurred. As a result, only the low-fred cases have been validated by the wind tunnel measurements. However, the excellent agreement among all the codes and the quasi-steady model gives great confidence in the validity of the numerical results regarding ΔP for the whole frequency range. The quasi-steady behaviour found is also consistent with what has been observed for the thrust, in which the codes' predictions have been confirmed by the experiments. If new unsteady tests will be conducted, some stiffness will be added to the angular degree of freedom (e.g. changing the transmission belt) in order to move the resonance farther from the fs range considered.
The phase comparison is reported in Fig. 10b, and it confirms the conclusions of the unsteady power coefficient case. Leaving the wind tunnel measurements aside, the codes show few discrepancies among each other. Nevertheless, a reduction in ϕP with respect to the quasi-steady value appears to occur at the higher frequencies, resembling a dynamic-inflow effect. A similar reduction has also been found by the actuator line in the phase of the thrust, with the other codes showing values closer to −90∘. In the power case, the codes seem to be more concordant among each other about the presence of this slight delay. However, no matter which code is considered, the maximum phase shift with respect to the quasi-steady reference is always below 3∘ and thus negligible. As for the amplitude plot, the low-frequency wind tunnel tests fully confirm the numerical outcomes, whilst a phase shift due to the resonance affects the higher-fred results.
The performance response to harmonic-surge motions of a 1:75 scaled version of the DTU 10 MW RWT has been investigated using state-of-the-art numerical models with different fidelity levels. For the first time, the unsteady results have been validated against high-fidelity wind tunnel tests specifically focused on the aerodynamics. These tests, in which the surge motion was imposed to the scaled turbine, were conducted in Polimi's facility (GVPM) within the UNAFLOW project. The comparison has revealed a surprisingly good agreement among the predictions of the different codes, with smaller discrepancies in the unsteady case than the steady one. The codes have all confirmed the aerodynamic response to be dominated by the component at the surge frequency. Hence, considering only that harmonic, it has been possible to clean the experimental measurements that were characterized by significant disturbances due to the complexity of the unsteady tests. The resulting thrust measurements have validated the codes' predictions for the whole test matrix. Concerning the torque, the experiments have been able to confirm only the low-frequency outcomes since the higher-frequency signals were biased by a mechanical resonance. However, the excellent agreement of the numerical results suggests the validity of the codes' predictions also for the unsteady power.
Owing to its leading role in the aerodynamic response, the surge harmonic has been characterized in the frequency domain. This has allowed a more quantitative comparison of the unsteady results, at the same time focusing on control-relevant parameters. The analysis has been presented in a non-dimensional form, aiming to maximize its generality. The focus on the surge harmonic has given the possibility to define a linear analytical model based on the quasi-steady assumption, with which both numerical and experimental results have been further validated. Despite the several approximations made, the quasi-steady model has shown an outstanding match with the other data, allowing the confirmation of conclusions drawn by de Vaal et al. (2014) that the aerodynamic response of a floating wind turbine to typical wave-induced surge motions at rated wind conditions can be well modelled with the quasi-steady assumption. In the conditions considered, the rotor unsteadiness has had little influence on the loads, and even the BEM code has produced accurate results using a classical dynamic-inflow model. The absence of mean performance variations due to surge has been an ulterior proof corroborating this evidence. Nevertheless, such a conclusion is tightly linked to the frequency range selected as well as to the specific timescale of dynamic inflow. In fact, fred is the parameter that rules the impact of dynamic-inflow effects. In this work, its values have not exceeded 1.2, but the increasing scatter of the results with higher frequencies likely indicates the inception of unsteady effects. The results presented have revealed that the accuracy of the quasi-steady assumption is almost insensitive to the surge reduced amplitude. However, the threshold up to which non-linear effects can be neglected and the small-displacement assumption holds should be verified. Regardless, the size of the rotors currently employed in offshore wind farms arouses little concern about the magnitude of Ared.
The linear quasi-steady model proposed, expressed in non-dimensional terms, might be a convenient tool for future works as well. As long as a similar reduced frequency range is considered, the load oscillation amplitudes can be effectively estimated by means of Eqs. (15) and (21), whilst the phase can be reasonably assumed equal to the quasi-steady reference. This approach separates the influence of the surge parameters from that of the steady operating conditions, allowing us to better understand the impact that each single variable has on the unsteady behaviour. Furthermore, its integral load perspective makes it suitable for control strategy design and assessment. For example, the increase in the load oscillation amplitudes, found by Micallef and Sant (2015) raising the tip speed ratio at constant As and fs, may be explained by an increase in both and linked to the steady characteristic curve shapes that, of course, depend on the controller. Moreover, the critical operating points where the stability is in jeopardy because of small (or negative) aerodynamic damping can be immediately found from the expression for . Then, the control strategy can be adjusted to modify the steady characteristic curves, adding some more surge damping where needed. In fact, a higher means a higher CΔT only if the surge is assumed imposed in Eq. (15); in reality, a higher damping would drastically reduce Ared, providing overall benefit.
In future works, higher reduced-frequency cases where dynamic-inflow effects appear will be addressed to understand what happens when the quasi-steady assumption fails. The code validation effort hereby described has increased the confidence of the numerical predictions, paving the way for the consideration of more critical cases. A similar characterization will also be attempted for the turbine pitch case, which is expected to be more challenging due to the radial variation in the imposed motion. Finally, a revision of the power train assembly is being carried out to make sure that, if new unsteady experiments have to be conducted, the torque measurements would not be affected by any resonance.
Exploiting the quasi-steady assumption, it is possible to obtain a theoretical reference for the unsteady performance of a turbine subjected to surge. In fact, as long as the motion period is long compared to the timescale of dynamic inflow, i.e. the reduced frequency of Eq. (12) is small, the induction field can be assumed to adjust immediately to the relative wind change imposed by the surge motion. If dynamic stall effects are neglected, the hypothesis of no dynamic inflow automatically implies the absence of airfoil unsteadiness since it occurs at larger timescales. Thus, assuming a quasi-steady behaviour, the turbine performance can be expressed in terms of the thrust and power coefficients, and the surge motion reduces to a change in the incoming wind speed experienced by the rotor (Vw), in particular
using the reference system of Fig. 3b. This modifies the expression of the tip speed ratio to become
Consequently, the turbine thrust and power responses can be expressed as
To obtain the easy reference used in the paper, the expressions have been linearized for small surge velocities, i.e. . In case of harmonic-surge displacements, this can be translated to a condition on the reduced surge amplitude Ared→0, which means As≪D. Hence, the linear approximation is likely to be suitable for modern multi-megawatt rotors employed in floating wind farms. Considering small variations around the steady operating conditions and a constant rotational speed (as in the wind tunnel tests), the following expressions for the thrust and power oscillations have been obtained:
with c0 and ζ0 functions only of the steady operating conditions of the turbine, defined as
By means of this simplified approach, it is possible to estimate the unsteady response knowing the steady operating point, the characteristic curves, and the surge motion parameters. Provided that the complete characteristic curves of the scaled model were unavailable, those of the RWT have been used in this work. In fact, the scaled turbine was designed to match the DTU 10 MW thrust coefficient, but also the power coefficient was well reproduced in rated conditions (Bayati et al., 2017a). The RWT performance curves, however, take into account the regulation as well, whilst in the experimental campaign both the rotational speed and the blade pitch were kept constant. To bypass this issue, the shapes of the curves in the neighbourhood of λ=7.5 have been approximated taking three points where the regulation has little or no influence, fitting them with a quadratic curve. Except for one at the optimal tip speed ratio, the other two points have been selected as close as possible to the first but with higher λ (i.e. λ=8 and 9.3). In the below-rated region, not too far from λ=7.5, the pitch regulation is very small indeed, and the rotational speed stays constant at its minimum value. Such a procedure had to be followed to evaluate c0, whilst for ζ0 the derivative of CP at the optimal tip speed ratio is obviously close to 0, and thus the knowledge of CP(λ0) is enough. Despite its simplicity, this approach can provide accurate predictions as long as the quasi-steady assumption holds (i.e. fred→0, thus ), the surge velocity is small (i.e. Ared→0, thus As≪D), and the right characteristic curves are used (i.e. if the regulation is active during surge the curves have to take it into account or vice versa). Finally, it is worth noting that a variable rotational speed might also be considered, adding little complication to the model.
All the data presented in this work are stored on an FTP server, together with the whole UNAFLOW database. Upon request the access keys will be granted without charge to anyone interested.
SM conducted the UNAFLOW project revision, ran the actuator line simulations, and coordinated the paper composition under the supervision of AZ and PS. KB and MCa performed BEM and AWSM simulations, while MCo and TL provided the CFD results. All the authors contributed with their ideas and thoughts to the development of the paper.
The authors declare that they have no conflict of interest.
The authors gratefully acknowledge HLRS Stuttgart and Cineca HPC for providing computational resources.
This research has been supported by IRPWIND – a part of the EERA joint programme on wind energy (project UNAFLOW) (grant no. 609795).
This paper was edited by Alessandro Bianchini and reviewed by two anonymous referees.
Bayati, I., Belloli, M., Bernini, L., and Zasso, A.: Wind tunnel validation of AeroDyn within LIFES50+ project: imposed Surge and Pitch tests, J. Phys.: Conf. Ser., 753, 092001, https://doi.org/10.1088/1742-6596/753/9/092001, 2016. a
Bayati, I., Belloli, M., Bernini, L., Giberti, H., and Zasso, A.: Scale model technology for floating offshore wind turbines, IET Renew. Power Gener., 11, 1120–1126, https://doi.org/10.1049/iet-rpg.2016.0956, 2017a. a, b, c
Bayati, I., Belloli, M., Bernini, L., and Zasso, A.: Wind Tunnel Wake Measurements of Floating Offshore Wind Turbines, Energy Procedia, 137, 214–222, https://doi.org/10.1016/j.egypro.2017.10.375, 2017b. a, b
Bayati, I., Belloli, M., Bernini, L., and Zasso, A.: Aerodynamic design methodology for wind tunnel tests of wind turbine rotors, Renew. Energy, 167, 1–12, https://doi.org/10.1016/j.jweia.2017.05.004, 2017c. a, b
Bayati, I., Belloli, M., Bernini, L., Boldrin, D. M., Boorsma, K., Caboni, M., Cormier, M., Mikkelsen, R., Lutz, T., and Zasso, A.: UNAFLOW project: UNsteady Aerodynamics of FLOating Wind turbines, J. Phys.: Conf. Ser., 1037, 072037, https://doi.org/10.1088/1742-6596/1037/7/072037, 2018a. a
Bayati, I., Bernini, L., Zanotti, A., Belloli, M., and Zasso, A.: Experimental investigation of the unsteady aerodynamics of FOWT through PIV and hot-wire wake measurements, J. Phys.: Conf. Ser., 1037, 052024, https://doi.org/10.1088/1742-6596/1037/5/052024, 2018b. a
Bernini, L., Bayati, I., Boldrin, D. M., Cormier, M., Caboni, M., and Mikkelsen, R. F.: UNsteady Aerodynamics for Floating Wind (UNAFLOW), Report, Politecnico di Milano, Milan, Italy, 2018. a, b, c, d, e, f
Boorsma, K., Grasso, F., and Holierhoek, J. G.: Enhanced approach for simulation of rotor aerodynamic loads, Report EC N-M–12-003, ECN, in: EWEA Offshore 2011, 29 November–1 December 2011, Amsterdam, 2011. a
Boorsma, K., Hartvelt, M., and Orsi, L. M.: Application of the lifting line vortex wake method to dynamic load case simulations, J. Phys.: Conf. Ser., 753, 022030, https://doi.org/10.1088/1742-6596/753/2/022030, 2016. a
Boorsma, K., Wenz, F., Lindenburg, K., Aman, M., and Kloosterman, M.: Validation and accommodation of vortex wake codes for wind turbine design load calculations, Wind Energ. Sci., 5, 699–719, https://doi.org/10.5194/wes-5-699-2020, 2020. a
Cormier, M., Caboni, M., Lutz, T., Boorsma, K., and Krämer, E.: Numerical analysis of unsteady aerodynamics of floating offshore wind turbines, J. Phys.: Conf. Ser., 1037, 072048, https://doi.org/10.1088/1742-6596/1037/7/072048, 2018. a, b
de Vaal, J. B., Hansen, M. O. L., and Moan, T.: Effect of wind turbine surge motion on rotor thrust and induced velocity, Wind Energ., 17, 105–121, https://doi.org/10.1002/we.1562, 2014. a, b, c, d
Farrugia, R., Sant, T., and Micallef, D.: Investigating the aerodynamic performance of a model offshore floating wind turbine, Renew. Energy, 70, 24–30, https://doi.org/10.1016/j.renene.2013.12.043, 2014. a
Farrugia, R., Sant, T., and Micallef, D.: A study on the aerodynamics of a floating wind turbine rotor, Renew. Energy, 86, 770–784, https://doi.org/10.1016/j.renene.2015.08.063, 2016. a, b, c
Goupee, J. A., Kimball, R. W., and Dagher, H. J.: Experimental observations of active blade pitch and generator control influence on floating wind turbine response, Renew. Energy, 104, 9–19, https://doi.org/10.1016/j.renene.2016.11.062, 2017. a, b
Jameson, A., Schmidt, W., and Turkel, E.: Numerical solution of the Euler equations by finite volume methods using Runge Kutta time stepping schemes, in: 14th fluid and plasma dynamics conference, Palo Alto, CA, USA, p. 1259, 1981. a
Khosravi, M., Sarkar, P., and Hu, H.: An Experimental Investigation on the Performance and the Wake Characteristics of a Wind Turbine Subjected to Surge Motion, in: 33rd Wind Energy Symposium 2015/AIAA SciTech Forum 2015, AIAA 2015-1207, Kissimmee, Florida, https://doi.org/10.2514/6.2015-1207, 2015. a
Kowarsch, U., Keßler, M., and Krämer, E.: High order CFD-simulation of the rotor-fuselage interaction, in: 44th European Rotorcraft Forum, Moscow, Russia, 2013. a
Kroll, N. and Faßbender, J. K.: MEGAFLOW – Numerical Flow Simulation for Aircraft Design, Springer Verlag, Braunschweig, Germany, 2005. a
Lindenburg, C. and Schepers, J. G.: Phatas-IV Aeroelastic Modelling, Release `DEC-1999' and `NOV-2000', Report ECN-CX–00-027, ECN, Petten, the Netherlands, 2000. a
Madsen, F. J., Nielsen, T. R. L., Kima, T., Bredmose, H., Pegalajar-Jurado, A., Mikkelsen, R. F., Lomholt, A. K., Borg, M., Mirzaei, M., and Shin, P.: Experimental analysis of the scaled DTU10MW TLP floating wind turbine with different control strategies, Renew. Energy, 155, 330–346, https://doi.org/10.1016/j.renene.2020.03.145, 2020. a, b, c
Mancini, S.: An Experimental, Analytical and Numerical Study of FOWT's Unsteady Aerodynamics, MS thesis, Politecnico di Milano, Milan, Italy, 2020. a, b, c, d, e
Mantha, D., Schlipf, M., Cordle, A., Pereira, R., and Jonkman, J.: Challenges in Simulation of Aerodynamics, Hydrodynamics, and Mooring-Line Dynamics of Floating Offshore Wind Turbines, in: 21st Offshore and Polar Engineering Conference, Maui, Hawaii, 2011. a
Melani, P. F., Schito, P., and Persico, G. B. A.: Experimental Assessment of an Actuator-Line Simulation Tool for VAWTs, in: Wind Energy Exploitation in Urban Environment. TUrbWind 2018, edited by: Battisti, L., Springer International Publishing, Milan, Italy, 177–200, https://doi.org/10.1007/978-3-030-13531-7_11, 2019. a
Menter, F. R.: Two-equation eddy-viscosity turbulence models for engineering applications, AIAA J., 32, 1598–1605, 1994. a
Micallef, D. and Sant, T.: Loading effects on floating offshore horizontal axis wind turbines in surge motion, Renew. Energy, 83, 737–748, https://doi.org/10.1016/j.renene.2015.05.016, 2015. a, b, c, d
Nielsen, F. G., Hanson, T. D., and Skaare, G.: Integrated dynamic analysis of floating offshore wind turbines, in: Proceedings of the 25th International Conference on Offshore Mechanics and Arctic Engineering, Hamburg, Germany, 671–679, 2006. a
Øye, S.: A simple vortex model of a turbine rotor, in: Proceedings of the third IEA symposium on the aerodynamics of wind turbines, Harwell, UK, 1–15, 1990. a
Pedersen, M. D.: Stabilization of Floating Wind Turbines, PhD thesis, NTNU, Trondheim, Denmark, 2017. a
Ren, N., Li, Y., and Ou, J.: Coupled wind-wave time domain analysis of floating offshore wind turbine based on Computational Fluid Dynamics method, J. Renew. Sustain. Ener., 6, 023106, https://doi.org/10.1063/1.4870988, 2014. a
Sant, T., Bonnici, D., Farrugia, R., and Micallef, D.: Measurements and modelling of the power performance of a model floating wind turbine under controlled conditions, Wind Energ., 18, 811–834, https://doi.org/10.1002/we.1730, 2015. a
Sarlak, H., Meneveau, C., and Sørensen, J. N.: Role of subgrid-scale modeling in large eddy simulation of wind turbine wake interactions, Renew. Energy, 77, 386–399, https://doi.org/10.1016/j.renene.2014.12.036, 2015. a
Sayed, M., Lutz, T., and Krämer, E.: Aerodynamic investigation of flow over a multi-megawatt slender bladed horizontal-axis wind turbine, in: Renewable Energies Offshore, Lisbon, Portugal, 773–780, 2015. a
Schito, P.: Large Eddy Simulation of wind turbines: interaction with turbulent flow, PhD thesis, Politecnico di Milano, Milan, Italy, 2011. a
Schito, P. and Zasso, A.: Actuator forces in CFD: RANS and LES modeling in OpenFOAM, J. Phys.: Conf. Ser., 524, 012160, https://doi.org/10.1088/1742-6596/524/1/012160, 2014. a, b
Schito, P., Bayati, I., Belloli, M., Bernini, L., Dossena, V., and Zasso, A.: Numerical Wind Tunnel Tests of an Open Data IPC-VAWT, in: Wind Energy Exploitation in Urban Environment. TUrbWind 2017, edited by: Battisti, L. and Ricci, M.,Springer, Cham, Milan, Italy, 113–122, https://doi.org/10.1007/978-3-319-74944-0_8, 2018. a
Sebastian, T. and Lackner, M. A.: Analysis of the Induction and Wake Evolution of an Offshore Floating Wind Turbine, Energies, 5, 968–1000, https://doi.org/10.3390/en5040968, 2012. a
Sebastian, T. and Lackner, M. A.: Characterization of the unsteady aerodynamics of offshore floating wind turbines, Wind Energ., 16, 339–352, https://doi.org/10.1002/we.545, 2013. a
Snel, H.: Heuristic modelling of dynamic stall characteristics, in: Conference proceedings European Wind Energy Conference, Dublin, Ireland, 429–433, 1997. a
Snel, H. and Schepers, J. G.: JOULE1: Joint investigation of Dynamic Inflow Effects and Implementation of an Engineering Model, Report ECN-C–94-107, ECN, Petten, the Netherlands, 1994. a
Snel, H., Houwink, R., van Bussel, G. J. W., and Bruining, A.: Sectional prediction of 3D effects for stalled flow on rotating blades and comparison with measurements, in: Proc. European Community Wind Energy Conference, Travemünde, Germany, 1993. a
Tran, T. T. and Kim, D. H.: A CFD study into the influence of unsteady aerodynamic interference on wind turbine surge motion, Renew. Energy, 90, 204–228, https://doi.org/10.1016/j.renene.2015.12.013, 2016. a, b
van Garrel, A.: Development of a Wind Turbine Aerodynamics Simulation Module, Report ECN-C–03-079, ECN, Petten, the Netherlands, 2003. a, b