the Creative Commons Attribution 4.0 License.
the Creative Commons Attribution 4.0 License.
 | 15 Sep 2021
Exploitation of the far-offshore wind energy resource by fleets of energy ships – Part 2: Updated ship design and cost of energy estimate
Aurélien Babarit
Félix Gorintin
Pierrick de Belizal
Antoine Neau
Giovanni Bordogna
Jean-Christophe Gilloteaux
This paper deals with a new concept for the conversion of far-offshore wind energy into sustainable fuel. It relies on autonomous sailing energy ships and manned support tankers. Energy ships are wind-propelled ships that generate electricity using water turbines attached underneath their hull. Since energy ships are not grid-connected, they include onboard power-to-X plants for storage of the produced energy. In the present work, the energy vector X is methanol.
In the first part of this study, an energy ship design was proposed, and its energy performance was assessed. In this second part, the aim is to update the energy and economic performance of such a system based on design progression.
In collaboration with ocean engineering, marine renewable energy and wind-assisted propulsion experts, the energy ship design of the first part has been revised. Based on this new design, a complete FARWIND energy system is proposed, and its costs (CAPEX and OPEX) are estimated. Results of the models show (i) that this FARWIND system could produce approximately 70 000 t of methanol per annum (approximately 400 GWh per annum of chemical energy) at a cost in the range EUR 1.2 to 3.6/kg, (ii) that this cost may be comparable to that of methanol produced by offshore wind farms in the long term and (iii) that FARWIND-produced methanol (and methanol produced by offshore wind farms) could compete with gasoline on the EU transportation fuel market in the long term.
- Article
(1478 KB) - Full-text XML
- Companion paper
- BibTeX
- EndNote


To date, fuels such as oil, natural gas and coal account for approximately 80 % of primary energy consumption globally (BP, 2018). Although this share is expected to decrease with the development of renewable power generation and the electrification of the global economy, some sectors may be difficult to electrify (e.g., aviation, freight). Therefore, if a global temperature change of less than 2 ∘C – as set out in the Paris agreement – is to be achieved, there is a critical need to develop carbon-neutral alternatives to fossil fuels.
To address this challenge, we proposed in Babarit et al. (2019) an energy system (FARWIND) which could convert the far-offshore wind energy resource into a sustainable fuel using fleets of energy ships; see Fig. 1. Energy ships are ships propelled by the wind which generate electricity by means of water turbines attached underneath their hulls. The generated electricity is converted into fuel using onboard power-to-gas (PtG) or power-to-liquid (PtL) plants. Hydrogen was not retained because it was found in Babarit et al. (2018) that hydrogen storage and transportation costs could account for nearly half of the cost of the delivered hydrogen when it is produced far offshore (because of the low volumetric energy density at ambient temperature and pressure conditions which is a well-known challenge for hydrogen storage and transportation). In contrast, the other possible energy vector options (synthetic natural gas (SNG), methanol, or Fischer–Tropsch fuel (FT fuel), Graves et al., 2011, and ammonia, Morgan, 2013) are much simpler to store, transport and distribute (particularly methanol and FT fuel, as they are liquid under standard conditions of temperature and pressure). Moreover, they can be incorporated into existing infrastructure with little to no modification. The drawback is that they each require the supply of an additional feedstock (carbon dioxide or nitrogen depending on the energy vector) and an additional conversion step in the energy conversion process. The additional conversion step decreases the overall energy efficiency and increases the size and complexity of the PtX plant. In a previous study (Babarit et al., 2019), we investigated whether these drawbacks could be compensated for by the easier storage, transportation and distribution of the products, and we found that methanol is the most promising solution; hence it is retained as the energy vector in this study.
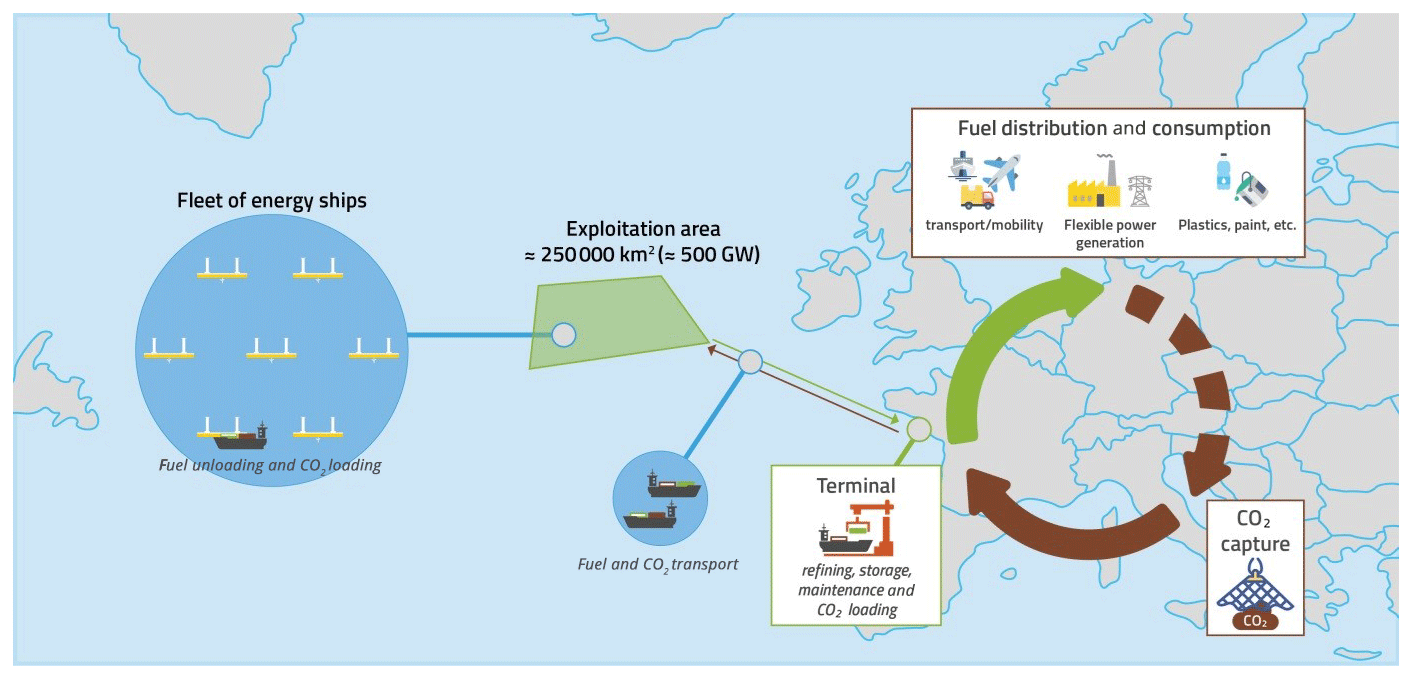
Figure 1The concept of sustainable methanol production from far-offshore wind energy by FARWIND energy systems.
The produced methanol is collected by tankers which are also used to supply the energy ships with the necessary feedstock (carbon dioxide) for power-to-methanol conversion. Of course, the CO2 supply source must be carbon-neutral for that system to produce sustainable methanol. Therefore, the CO2 must be captured either directly or indirectly from the atmosphere. Possible options include direct air capture (Keith et al., 2018), CO2 capture from flue gases from biomass or FARWIND-produced methanol combustion, and CO2 from biogas upgrading (Li et al., 2017; Irlam, 2017).
The overall aim of the present study is to investigate the energy and economic performance of the FARWIND energy system. A preliminary energy ship design was proposed in Babarit et al. (2020a), and its energy performance was investigated. The cost of energy was estimated in Babarit et al. (2020b). It was found that an initial FARWIND system could produce approximately 100 000 t of methanol per annum at a cost in the range of EUR 0.9 to 2.1/kg.
This preliminary design has been reviewed by ocean engineering and marine renewable energy's experts of the Marine Energy Alliance European project (EMEC, 2020) and wind-assisted propulsion experts (Blue WASP, 2020). Based on their feedback, the ship design has progressed, and the economic model has been refined. The aim of the present paper is to present that improved design, the economic model and the resulting levelized cost of energy. The present study also provides an example of how cost estimates develop throughout subsequent design stages.
The remainder of this paper is organized as follows. In Sect. 2, the specifications of the updated design and its velocity and power performance are presented. In Sect. 3, the specifications of the proposed energy system are presented, and its annual methanol production is estimated. Estimates of expenditures for the proposed energy system are provided and discussed in Sect. 4. Using those estimates and the estimates of annual methanol production, the cost of energy is estimated in Sect. 5 and market perspectives are discussed. Conclusions are presented in Sect. 6.

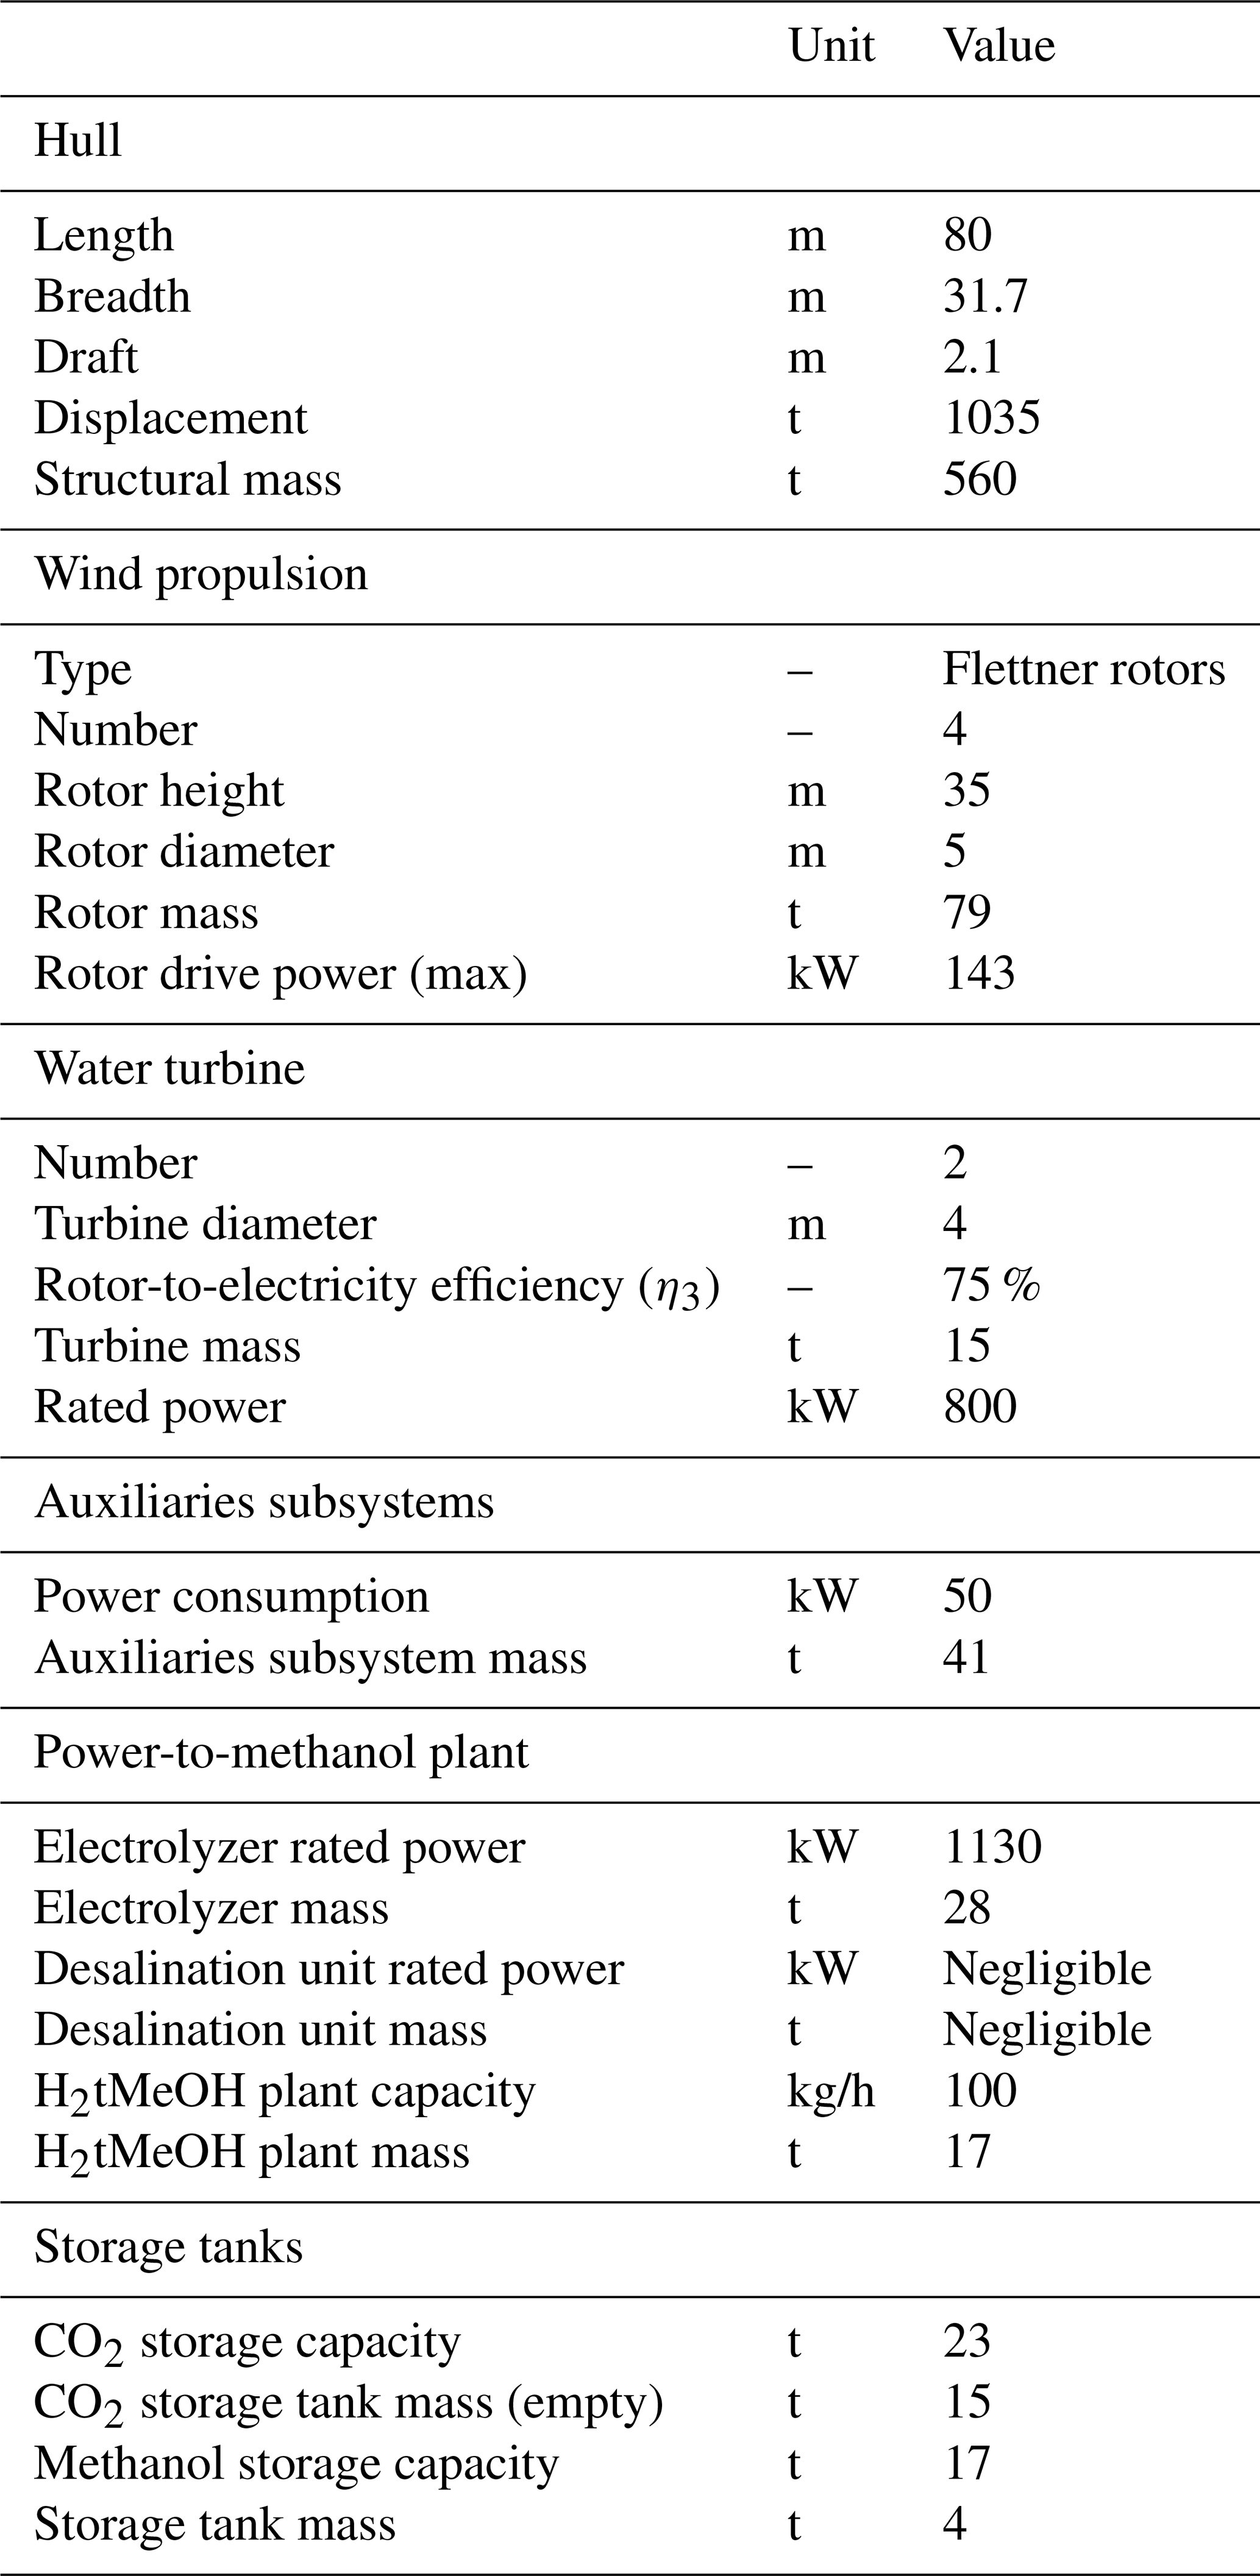
The energy ship design considered in this study is a revision of that presented in Babarit et al. (2020a); see Fig. 2. It is still an 80 m long catamaran with four 5 m diameter Flettner rotors and two water turbines. The hull shape is the same. However, the height of the Flettner rotors is increased from 30 to 35 m, and the rated power of each water turbine is reduced from 900 to 800 kW. The complete characteristics of the ship are summarized in Table 1. Explanations for the data shown in the table are provided in the following sections.
2.1 Rotors
The rotors' technical specifications (dimensions, mass, maximum rotor drive power) used in this study are based on that of the largest currently available Flettner rotor (Norsepower, 2021).
The propulsive force (thrust) T of a Flettner rotor depends on the lift coefficient CL, the drag coefficient CD, the apparent wind speed V, the apparent wind angle α, the rotor area A (height times diameter) and the air density ρa:
The lift coefficient and the drag coefficient depend on the ratio of the rotational velocity of the rotor to the apparent wind speed (spin ratio, SR). In Babarit et al. (2020a), we used the experimental data of Charrier (1979) for the aerodynamic coefficients of a Flettner's rotor as a function of the rotor's spin ratio SR. However, these experiments were carried out at low Reynolds numbers (∼10 000), with the Reynolds number defined as
where ν is the kinematic viscosity and D is the rotor diameter. Recently, formulas based on full-scale data (Reynolds number over 106) have been published (Tillig and Ringsberg, 2020). Those data have been used in the present study (Fig. 3) as they correspond better to real conditions.
Moreover, rotors must be powered for them to spin. In Babarit et al. (2020a), we assumed that the rotors' power consumption is constant (4 times 40 kW), whereas in practice it depends on the wind loading. In their work, Tillig and Ringsberg (2020) have developed a formula to estimate a rotor's power consumption as a function of the spin ratio. We used that formula in the present study.
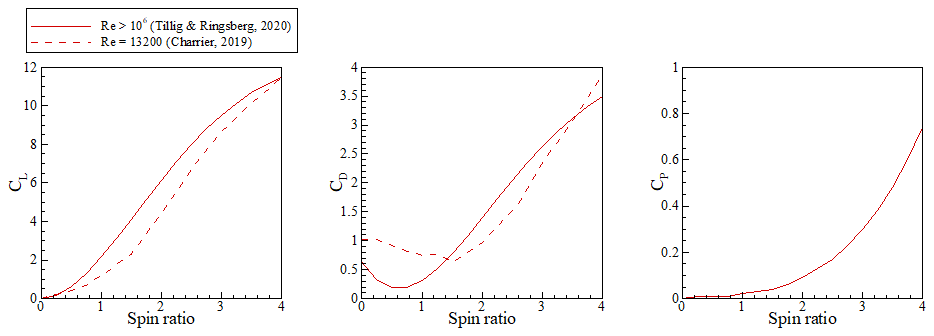
Figure 3Comparison of aerodynamic coefficients of Flettner rotors according to Charrier (1979) and Tillig and Ringsberg (2020).
In Babarit et al. (2020a), the effect of aerodynamic interactions between rotors was neglected. In the present study, it has been estimated using the approach proposed by Roncin and Kobus (2004) in which each rotor is modeled by a horseshoe vortex. The implementation follows that of Bordogna (2020).
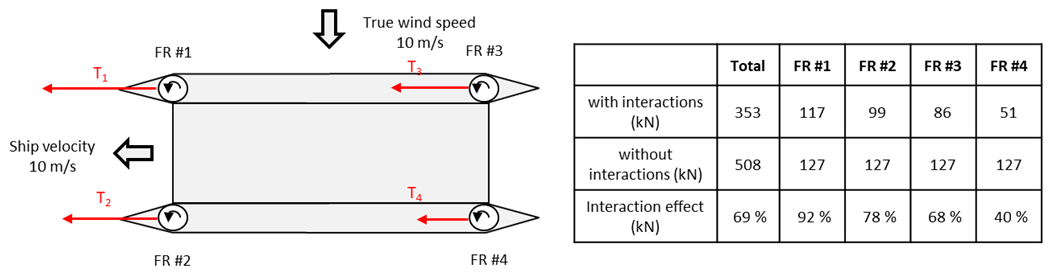
The total propulsive force (with and without aerodynamic interactions) and the propulsive force from each rotor are shown in Fig. 4 for rated conditions (10 m/s true wind speed, 90∘ true wind direction, SR = 3, 10 m/s ship velocity). They show that the interaction effect cannot be neglected as the total propulsive force is 69 % of that without interactions. A similar interaction effect has been found for other wind speeds (not reported here). Consequently, the model has been updated. The total propulsive force (Eq. 1) has been reduced by a constant factor of 30 % for all wind conditions.
The Earth atmospheric boundary layer was also not considered in the energy performance estimate in Babarit et al. (2020a). In the present study, a power law has been assumed with an exponent of 0.14. Thus, in the updated model, the wind speed W in Eq. (3) of Babarit et al. (2020a) is given by
where Z is 22.5 m (half the height of the rotor +5 m).
2.2 Hull
The hull shape is the same as for the preliminary design. However, the hull mass estimate has been refined. The revised mass estimate is based on a preliminary scantling of the hull structure which has been developed using rule NR600 of Bureau Veritas (2018). The corresponding hull weight estimate is 560 t, which is more than twice the estimate of the preliminary design. Moreover, the updated design assumes taller rotors (35 m), which are 20 t heavier than the 30 m rotors of the preliminary design. Consequently, the total displacement of the updated design is 1035 t (660 t for the preliminary design). The draft has increased from 1.6 m for the initial design to 2.1 m for the updated design.
Due to the increased displacement, the wetted surface increases to 1064 m2. The wave resistance coefficient has also been updated (see Fig. 5). As for the preliminary design, it was calculated using the software REVA (Delhommeau and Maisonneuve, 1987). One can see that the residuary resistance coefficient (wave making) is greater for the updated design than for the initial design, which is due to the increased displacement.
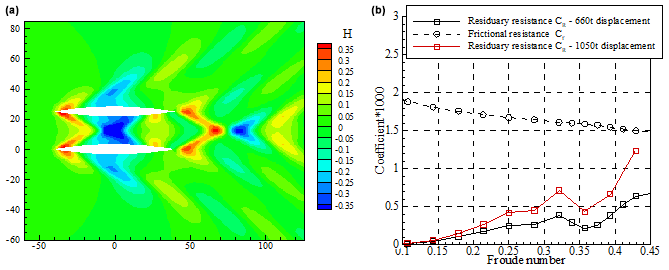
Figure 5(a) Wave pattern around the ship hull of the updated design for a Froude number = 0.357 (10 m/s ship velocity). (b) Hydrodynamic coefficients of the initial and updated design.
2.3 Water turbine
The water turbines' dimensions are the same as for the initial design (4 m diameter rotor). However, their mass is increased to 15 t each (7.4 t each for the initial design). Based on expert advice, the water turbine's energy efficiency has been reduced to 75 % (80 % for the initial design). The rated power is decreased to 800 kW (900 kW for the initial design).
2.4 Power-to-methanol plant
For rated wind conditions (10 m/s true wind speed, 90∘ true wind angle), the ship velocity is almost 10 m/s (see Sect. 2.7). The water turbines' power production is 1600 kW. The Flettner rotors' power consumption is approximately 420 kW. Assuming a further 50 kW power consumption for the auxiliary subsystems, the net power production available to the electrolyzer of the power-to-methanol plant is 1130 kW (1420 kW for the initial design). The weight estimate of an electrolyzer of such rated power is 28 t (35 t for the initial design).
Assuming the same 60 % efficiency for the electrolyzer and the same 78 % efficiency for the hydrogen-to-methanol plant as for the initial design (Babarit et al., 2020a), the rated power of the hydrogen-to-methanol plant is 680 kW (850 kW for the initial design). Its weight estimate is 17 t (24 t for the initial design).
2.5 Storage tanks
The capacities of the storage tanks (CO2 and methanol) are set such as they can accommodate 7 d of production at rated power (approx. 17 t of methanol). Thus, the CO2 tank weight is 15 t, and that of the methanol tank is 4 t (Babarit et al., 2020a).
2.6 Auxiliary equipment
As for the initial design (Babarit et al., 2020a), the weight of the auxiliary subsystems is taken equal to 10 % of the total mass budget excluding the hull weight (41 t).
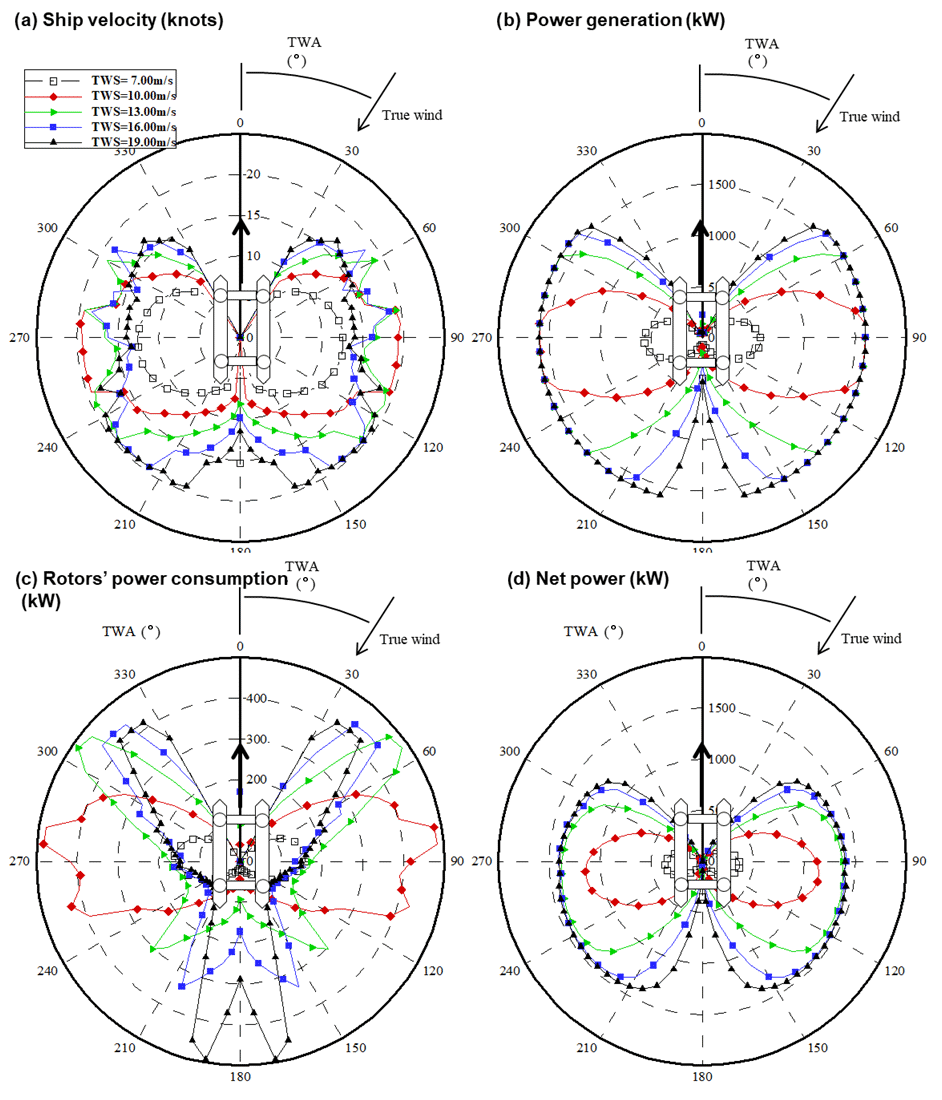
Figure 6Ship velocity (a), power generation (b), rotors' power consumption (c) and net power (d) of the updated ship design as function of wind conditions. TWA stands for true wind angle.
2.7 Power production charts
The velocity and power performance of the updated design has been calculated using the model presented in Babarit et al. (2020a). The results are shown in Fig. 6 as a function of the wind conditions (true wind speed and true wind angle). Note that for each data point the water turbine's induction factor and the rotors' spin ratio were optimized in order to maximize power production while satisfying the constraints (maximum rotation velocity and thrust force for the rotors, maximum power generation for the water turbine).
Overall, the velocity and power performance of the updated design resemble those of the initial design (albeit 10 % to 20 % smaller). As for the initial design, rated power (1600 kW) is achieved from a true wind speed of 10 m/s and a true wind angle of 90∘. However, a major difference is that the rotors' power consumption depends on the spin ratio in the updated design velocity and power performance prediction model, whereas it was fixed in Babarit et al. (2020a). Therefore, the net power keeps increasing with increasing wind speed (see panel d) despite the generated power having reached rated power (1600 kW).
As for the initial design, the water turbine's induction factor and the rotors' spin ratio were optimized to maximize power production for each data point while satisfying constraints (maximum rotation velocity and thrust force for the rotors, maximum power generation for the water turbine). Due to those constraints, there can be several settings (induction factor, spin ratio) for the same power generation, which explain the noisy behavior for the ship velocity in panel (a).
In the FARWIND energy system concept, the energy ships are deployed in fleets and are supported by tankers which collect the produced methanol and transport it to a shore-based terminal; see Fig. 1. The tankers also provide the energy ships with CO2. In this section, we estimate the characteristics and number of tankers as well as the number of energy ships in a FARWIND system.
3.1 Tanker design
In the considered energy ship design, the methanol storage tank capacity allows storage of 1 week of methanol production at full capacity. Therefore, each energy ship of the fleet must meet a tanker for methanol collection and CO2 refill at least once a week (to avoid stops in the production process because the methanol tank is full or because the CO2 tank is empty).
Thus, let us estimate the number of energy ships that can be served by one tanker. This depends on the duration of the CO2-loading and methanol-unloading operations. We assume that these operations take 6 h on average and that they are carried out continuously (including at night). Therefore, one tanker can service 28 energy ships per week (7 d/week × 24 h/d/6 h/operation). As the capacity of an energy ship's methanol tank is 17 t (23 t for the CO2 tank), the tanker may collect up to 473 t of methanol and supply 650 t of CO2 every week.
It is assumed that the tankers are operated by a crew and that the duration of their mission is 4 weeks. At the end of each 4-week mission, the tanker returns to a shore-based terminal to change crew, unload the methanol, and load CO2. Therefore, their total methanol capacity must be 1891 t (4 weeks × 473 t/week) and their total CO2 capacity must be 2601 t (4 weeks × 650 t/week). Assuming the CO2 will be stored as liquid in a cryogenic storage tank, and extrapolating from Chart (2019), the empty weight of a 2600 t capacity CO2 storage vessel is estimated to be 1700 t. For methanol, the mass of the required tank is estimated to be 410 t. The tanker will be carrying maximum cargo weight (4720 t) when it leaves the terminal (full CO2 tank and empty methanol tank). This cargo weight is relatively similar to the average vessel size of small crude oil (3600 deadweight (dwt)), chemical (4900 dwt) and LPG vessels (3500 dwt) (Lindstad et al., 2012). According to MAN Energy Solutions (2019), the propulsion power of a 5000 t deadweight bulk carrier is 1410 kW for a service speed of 12 knots. These are the values which we used for the service speed and propulsion power of the tanker.
3.2 FARWIND system design
Following Babarit et al. (2018), it is assumed that the fleet of energy ships is deployed at a distance of 1000 km from the terminal. Therefore, the tankers must travel 1000 km to meet the energy ships and a further 1000 km when returning to the terminal. At a service speed of 12 knots, the tanker's round-trip will take 90 h. Considering the duration of unloading–loading operations and other maintenance operations, we estimate that the tanker will be away from the fleet of energy ships for a duration of 1 week.
To ensure continuous operation of the energy ships, the tanker must be replaced immediately when it leaves the production zone. Therefore, each group of 28 energy ships must be supported by more than one tanker. It can be shown that the minimum number of tankers per fleet must be at least 1.25, meaning that the optimal FARWIND system comprises a fleet of 112 energy ships supported by five tankers. Over a year, the number of round-trips between the terminal and the production zone is 10.4 for each tanker. The maximum methanol production of that system (assuming 100 % capacity factor for the energy ships) is approximately 100 000 t per annum.
3.3 Annual methanol production of the proposed FARWIND system design
Since energy ships are mobile, their route schedules can be dynamically optimized based on weather forecasts in order to maximize energy production. This was performed using a modified version of the weather-routing software QTVLM (Abd-Jamil et al., 2019). The coordinates of the starting and arrival point are 50.5∘ N, 18.9∘ W (approximately 1000 km from the port of Brest, France). Over the 3 years 2015, 2016 and 2017, it was found that an average capacity factor of over 75 % can be achieved.
That estimate does not consider downtime due to maintenance (availability). According to Sheng (2013) and Pfaffel et al. (2017), the failure rate of wind turbines is on the order of one failure per annum. Given the greater complexity of the energy ship system (additional energy conversion subsystems in comparison to a wind turbine, e.g., power-to-methanol plant), it is assumed that the average failure rate of energy ships is two failures per annum. The corresponding downtime is driven by accessibility and repair time. As accessibility at sea can be challenging and as energy ships are mobile, it is assumed that most of the repairs are performed at a port. Moreover, it is assumed that despite the failure, the energy ship is able to sail to that port at an average velocity of 10 knots (corresponding to half the rated velocity) without assistance (e.g., tug boat). Assuming that the distance between the production area and a port (with a dedicated shipyard) is 1000 km, it would take approximately 2 d for that energy ship to go to the port. Assuming a further 3 d for the repair and 2 d for the energy ship to go back to the production area, the downtime per failure is 7 d. Thus, for a failure rate of two failures per annum, the total downtime per annum is 2 weeks corresponding to a 96 % availability.
Taking into account that availability estimate, it appears that a capacity factor of 72 % can be achieved. The corresponding annual methanol production would be 70 600 t per annum. Note that it would require the supply of 97 400 t of CO2, as the production of 1 kg of methanol requires 1.38 kg of CO2.
For the sake of illustration, let us estimate the number of 5000 t bulk carriers which could be powered by a FARWIND system. As mentioned in Sect. 3.1, their propulsion power is 1410 kW for a service speed of 12 knots. Assuming that they would sail at that speed 292 d per year (80 % of the time) and that their engine efficiency is 40 %, the required chemical energy is approximately 24 700 MWh per year. With a total of 70 600 t of methanol corresponding to approximately 386 000 MWh of chemical energy, the designed FARWIND energy system could power approximately sixteen 5000 t cargo vessels.
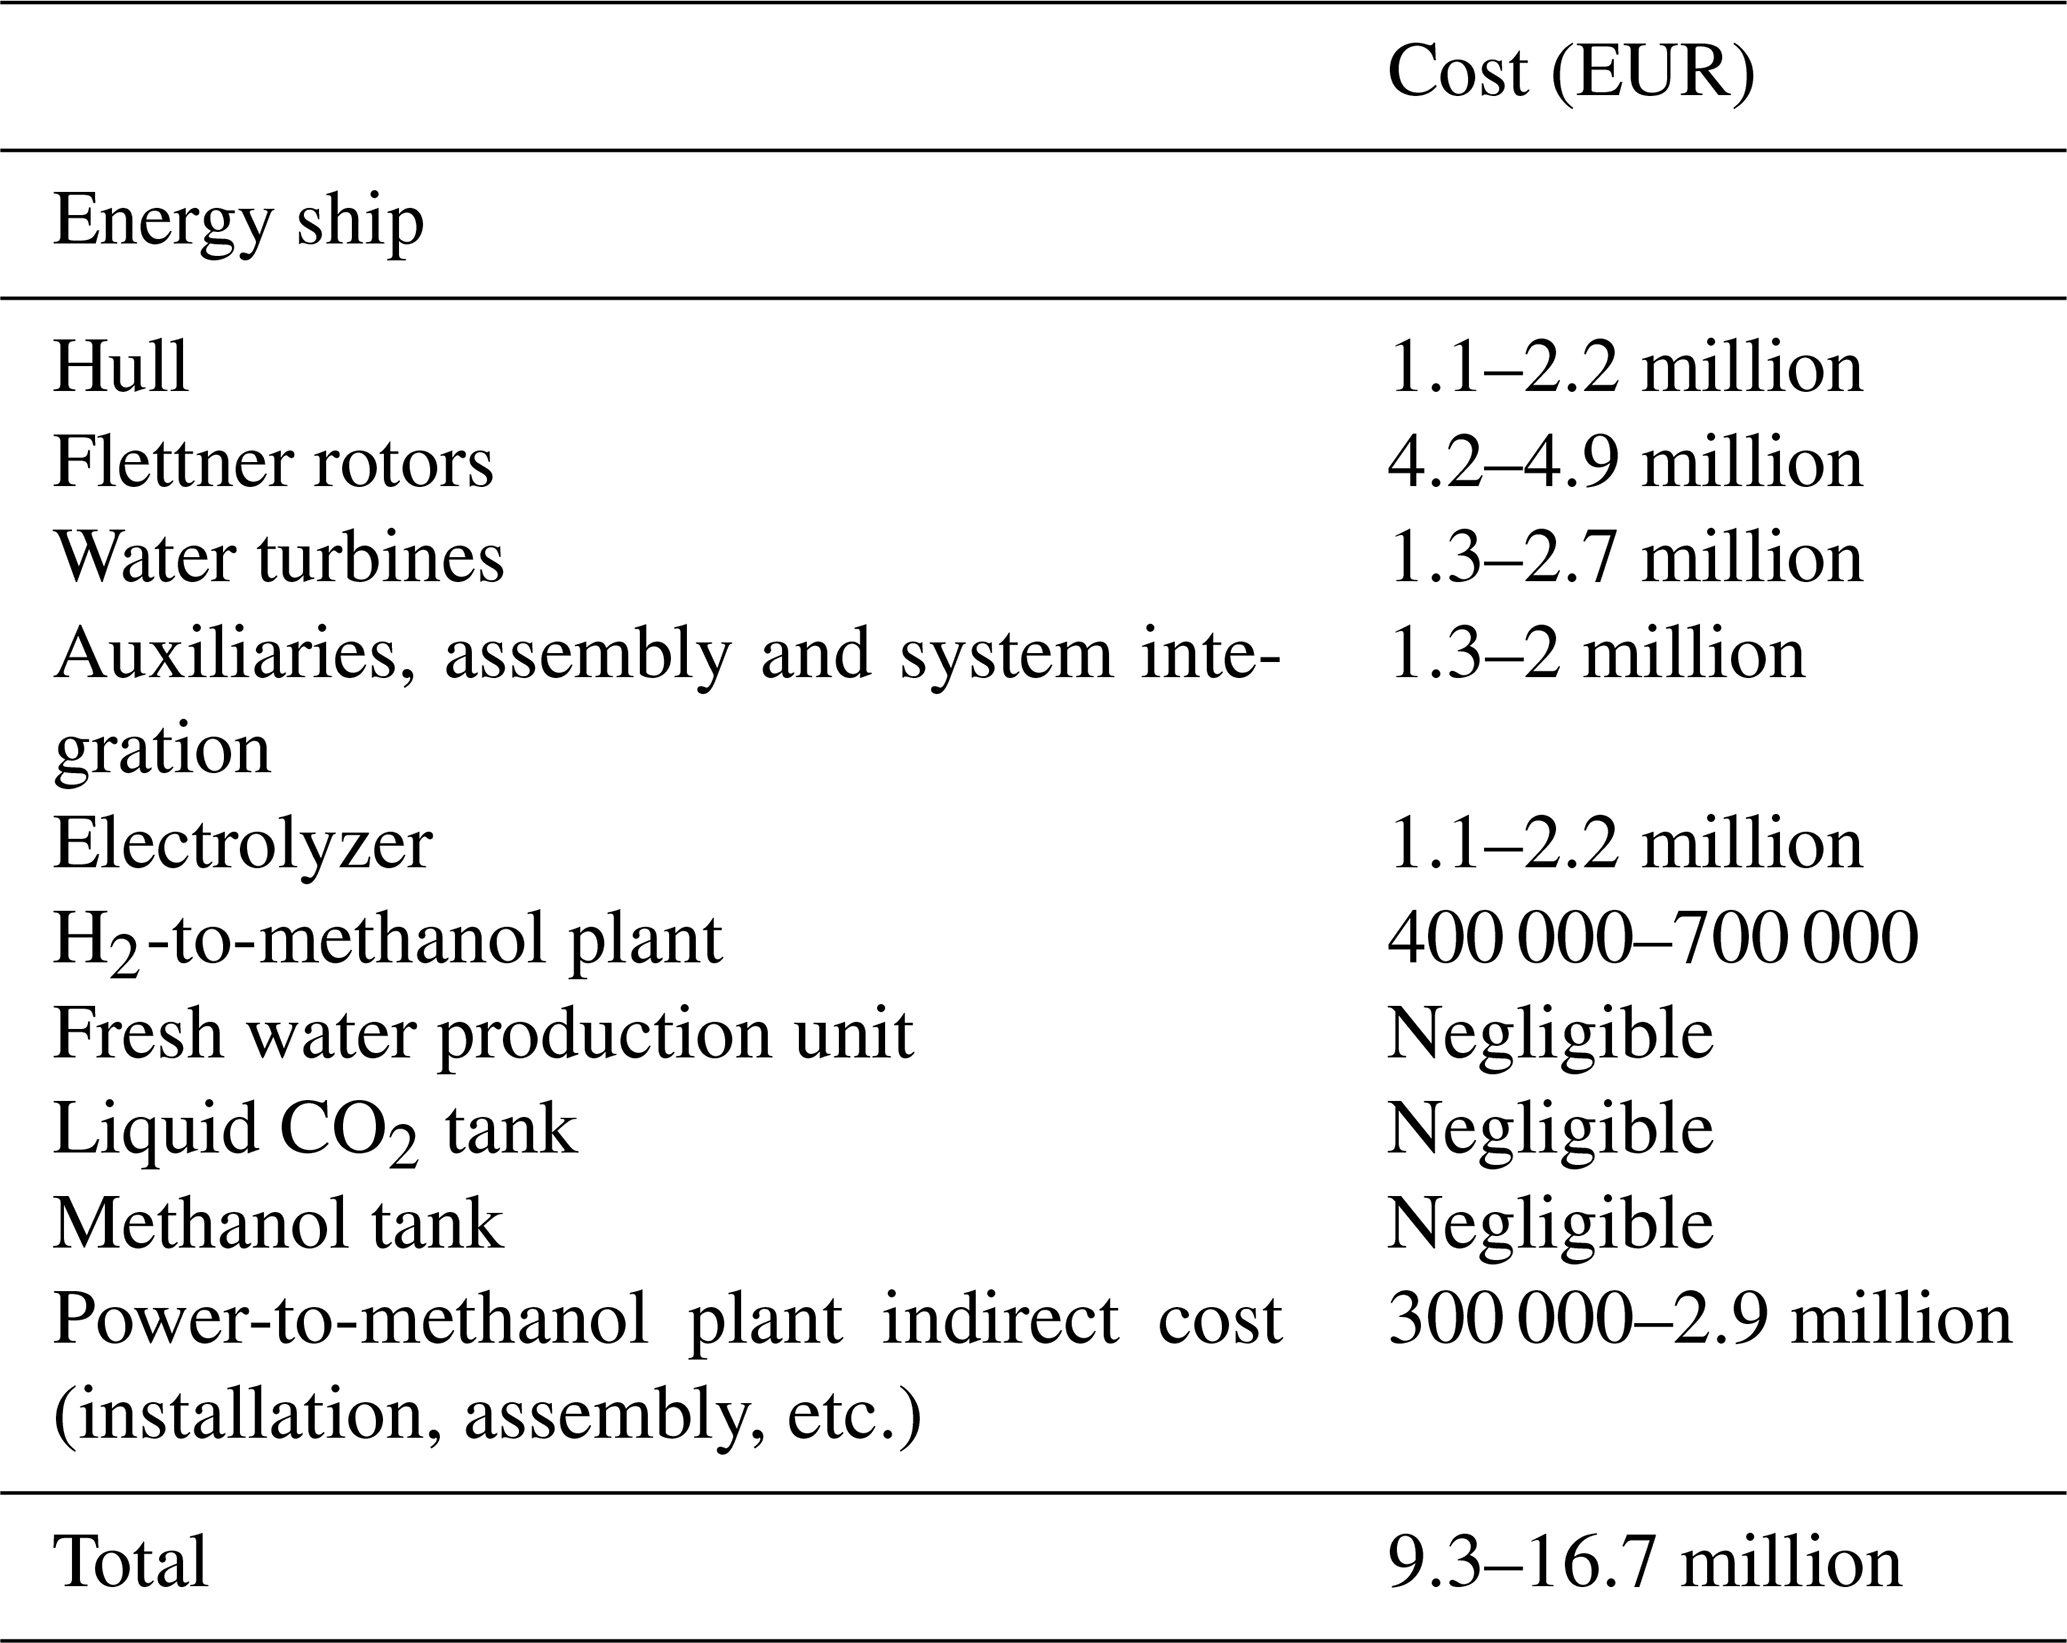
Table 2Estimates of the capital cost of a prototype of the proposed energy ship.
4.1 Capital cost of a first-of-a-kind energy ship
Table 2 shows estimates of the capital cost of a prototype of the proposed energy ship.
The hull cost estimate was obtained using the usual approach which is to multiply the hull weight by a price per metric ton of fabricated steel. That price includes procurement and workforce required for hull construction. Thus, it depends on steel market price and shipyard location. The typical cost range is EUR 2000/t (South-East Asia construction) to EUR 4000/t (northern Europe). The hull weight estimate being 560 t, we retain a hull cost in the range of EUR 1.1 million to 2.2 million.
According to Jukka Kuuskoski (personal communication, 2019), the cost of four 30 m Flettner rotors is in the range of EUR 3 million to 3.5 million. For four 45 m tall Flettner rotors, we assumed that the cost is approximately proportional to the rotor mass excluding foundation. That mass being 42 t for a 30 m tall rotor and 59 t for a 35 m tall rotor (Norsepower, 2021), we retain a Flettner rotor cost in the range of EUR 4.2 million to 4.9 million.
The water turbine cost estimate assumes that it is proportional to its rated power. We assume that the price is in the range of EUR 800 to 1700/kW, which yields a water turbine cost in the range EUR 1.28 million to 1.72 million.
Ship common systems, ship assembly and system integration typically represent 20 % of the total cost of a ship according to Shetelig (2013). We applied this ratio to the sum of the hull cost, Flettner rotor cost and water turbine cost. The other equipment was not taken into account because its installation factor is taken into account separately.
Holl et al. (2016) have developed scaling laws for the cost of the electrolyzer and the freshwater production unit based on market surveys. They depend on the nominal power of the equipment. Applying the electrolyzer scaling law to the 1130 kW capacity electrolyzer of the energy ship results in an estimated cost of EUR 1.4 million, equivalent to EUR 1250/kW. This is in agreement with the range EUR 1000 to 1950/kW reported in Schmidt et al. (2017) for polymer electrolyte membrane (PEM) electrolyzers (which we used in this study). As for the freshwater production, the application of the scaling law of Holl et al. (2016) yielded a cost estimate of EUR 9000, which is very small in comparison to the other costs.
According to Brynolf et al. (2018), the cost of a hydrogen-to-methanol plant is in the range EUR 600–1200/kW of methanol. As the estimated efficiency of the power-to-methanol conversion process is 49 % (Babarit et al., 2020a), it corresponds to EUR 300 to 600/kW of electrolyzer input power. Thus, we retain EUR 400 000–700 000 for the hydrogen-to-methanol plant capital cost.
For the liquid CO2 and methanol storage tanks, suppliers and prices can be found on the internet (e.g., Gitank, 2021; Chart, 2019); typical costs are EUR 300/t of capacity for methanol and EUR 1000/t of capacity for liquid CO2. Overall, their costs are negligible in comparison to other costs.
The electrolyzer and hydrogen-to-methanol costs do not include installation and assembly, transportation, building, etc. Those costs are usually taken into account using an installation factor. According to Parks et al. (2014), the lower end of the installation factor is 1.2 and up to 2 for the higher end. This leads to a cost of EUR 300 000–2.9 million.
4.2 Capital cost of a first-of-a-kind FARWIND energy system
According to the discussion in Sect. 3.2, a FARWIND energy system should include a fleet of 112 energy ships and five tankers. One can expect the unit cost for a fleet of 112 energy ships to be significantly smaller than the cost of an energy ship prototype. To take this into account, a learning rate of 10 % was assumed on the unit cost of the energy ship as function of the built capacity; see Table 2. It can be noted that such a learning rate corresponds to what was observed for wind turbines (Lindman and Soderholm, 2012). It leads to a range of capital cost of EUR 620 million to 1.11 billion for the first fleet of energy ships. It corresponds to an average unit cost of EUR 5.5 million to 9.9 million per energy ship.
For the tanker, according to Lindstad et al. (2012), the price of commercial ships is in the range of EUR 500 to 4750 per metric ton of deadweight, depending on the type of ship and size. The lower price is for crude oil tankers greater than 140 000 dwt, while the higher price is for roll-in/roll-off (ro-ro) ships of 7000 dwt. In the present study, we retain a cost range of EUR 2500 to 4000/t of deadweight, leading to a tanker cost in the range of EUR 12.5 million to 20 million.
Thus, overall, the total capital cost of a FARWIND system comprised of 112 energy ships and five tankers is expected to be in the range of EUR 680 million to 1.21 billion (EUR 3.7 million to 6.7 million per megawatt of installed capacity).
4.3 Operational expenditures
Expected operation and maintenance (O&M) costs, including the cost of CO2 supply, are summarized in Table 3 and detailed below.
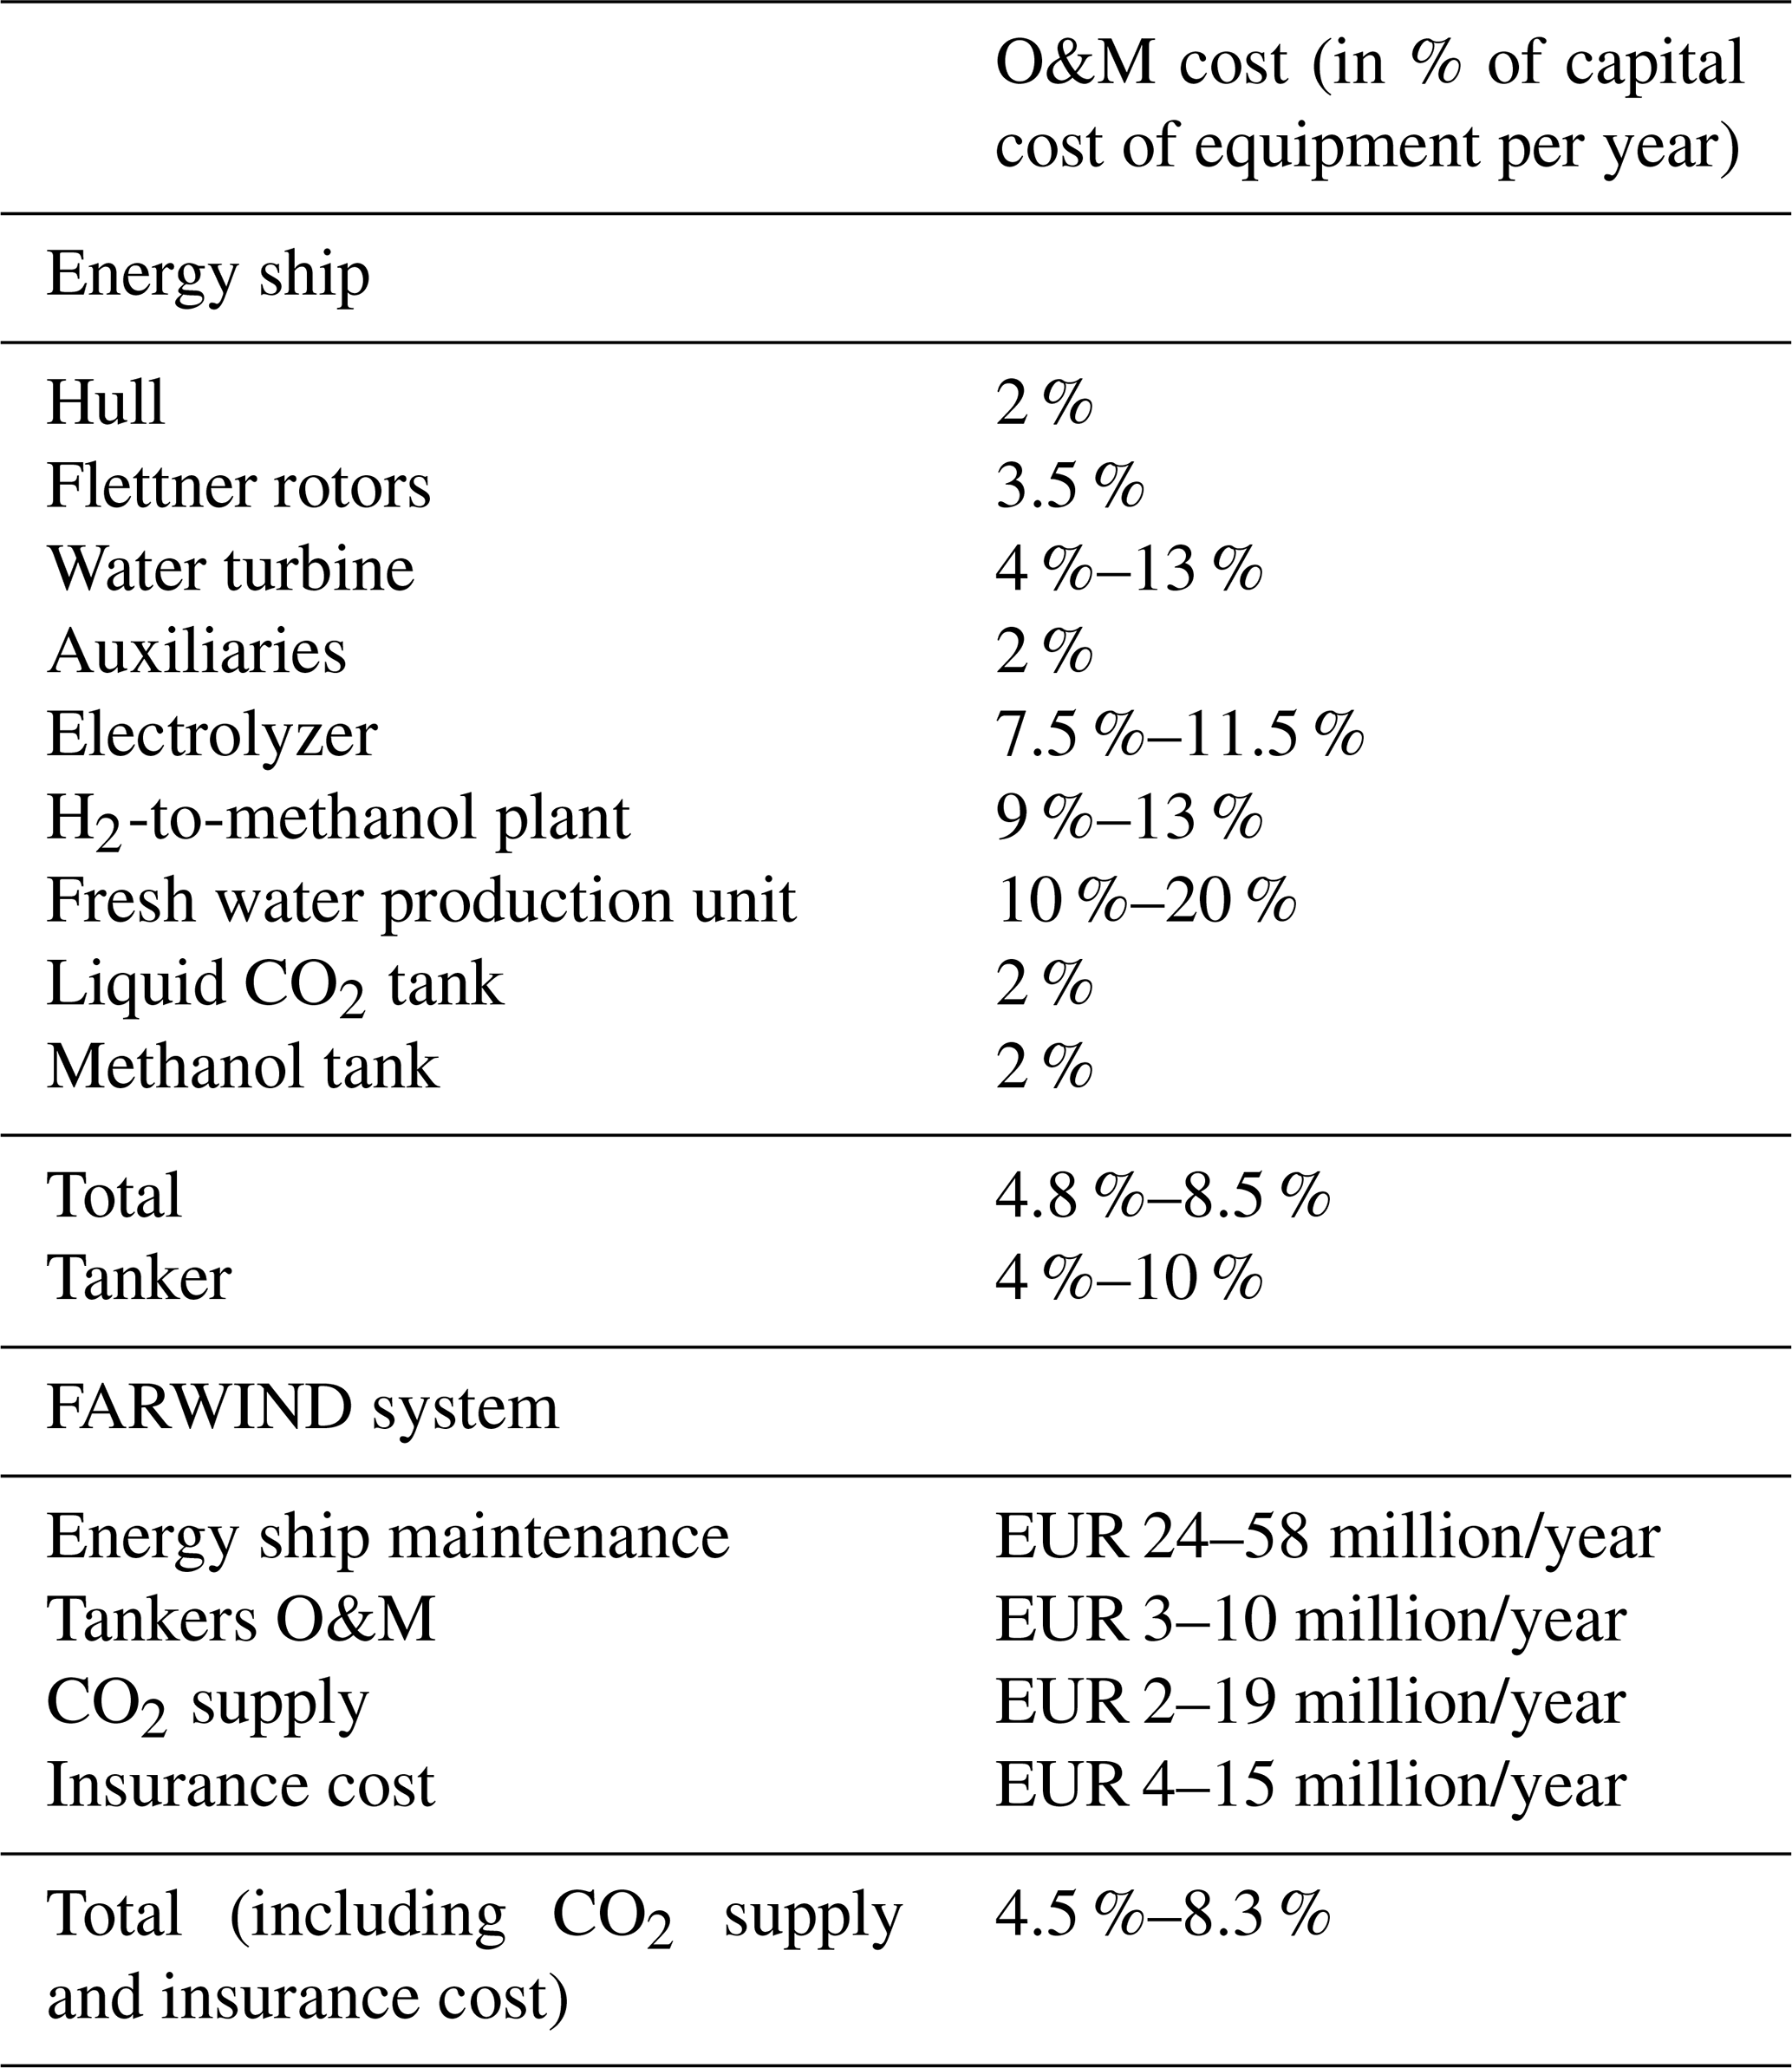
Table 3Estimates of the operation and maintenance of a first-of-a-kind FARWIND energy system.
4.3.1 Energy ship and tanker operation and maintenance cost
According to Holl et al. (2016), the maintenance cost of the water turbine is in the range 4 % to 13 % of the capital cost, and that of the freshwater production unit is between 10 and 20 %. According to Chardonnet et al. (2017), the maintenance cost for the electrolyzer is on the order of 4 % of capital cost. It is 2 %–5 % according to Brynolf et al. (2018). It is unclear whether that maintenance considers stack replacement. Indeed, PEM electrolyzers' stack lifetime is on the order of 50 000 h. Thus, assuming a capacity factor of 72 %, they would have to be replaced every 8 years. According to Brynholf et al. (2018), stack replacement cost is 60 % of the electrolyzer cost. It leads to an additional 7.5 % maintenance cost for the electrolyzer. Thus, we retain 7.5 %–11.5 % for the maintenance cost of the electrolyzer. The same range is assumed for the hydrogen-to-methanol plant.
For the Flettner rotors, the maintenance cost is expected to be on the order of 3.5 % of the rotors' capital cost (Jukka Kuuskoski, personal communication, 2020). For the other subsystems (hull, auxiliaries, storage tanks), it is expected that the maintenance costs would be small; a 2 % maintenance cost was arbitrarily selected. Overall maintenance costs for the energy ship are thus on the order of 3.7 % to 5.3 %.
For the tanker, following Holl et al. (2016), we estimate operation and maintenance costs to be 4 % to 10 %.
4.3.2 CO2 supply cost
The ambition of the FARWIND energy system is to provide a sustainable alternative to the use of liquid fossil fuels (e.g., oil). Therefore, as mentioned in the introduction, the CO2 must be captured directly or indirectly from the atmosphere.
According to Keith et al. (2018), the cost for direct air capture (DAC) using large-scale wet absorption DAC technology is in the range of EUR 80 to 204/t of CO2. The cost of CO2 capture from biogas upgrading is on the order of EUR 15 to 100/t of CO2 (Li et al., 2017). In the case of CO2 capture from flue gases from combustion of biomass or FARWIND-produced methanol, the cost of carbon capture is on the order of EUR 35 to 50/t (assuming that it would be similar to that for capture of CO2 from power production processes involving coal or natural gas; Irlam, 2017). Note that for both biogas upgrading and biomass or methanol combustion, the CO2 concentration in the source is much greater than in ambient air, which results in a more effective capture than with DAC.
Carbon dioxide may also be extracted from seawater (Willauer et al., 2012). Indeed, some of the CO2 present in the atmosphere dissolves in the ocean. However, this new technology is in its early stages of development (Willauer et al., 2017).
In any case, the captured CO2 must be liquefied for efficient transportation. The energy requirement for CO2 liquefaction is on the order of 0.1 kWh/kg according to Oi et al. (2016), which is low; hence its associated cost is expected to be negligible.
Therefore, we estimate the cost of CO2 production to be in the range of EUR 20 to 200/t. As 97 400 t of CO2 is required to produce 70 600 t of methanol, the CO2 supply cost is estimated to be in the range of EUR 2–20 million per annum.
4.3.3 Insurance cost
Insurance cost is generally taken as 0.6 % of CAPEX per year for vessels at the concept stage. However, for a new technology, this percentage of CAPEX may be higher, potentially as high as 1 %–2 %. In this study, we have retained 0.6 %–1.2 %.
5.1 Short-term cost
The levelized cost of methanol (LCOM) can be calculated as (Holl et al., 2016)
where I is the total capital cost, λ is the total O&M rate, AMP is the annual methanol production and is the capital recovery factor, in which i is the weighted average cost of capital (WACC) and n is the lifetime in years. Assuming a WACC in the range of 6 %–10 % and a lifetime of 20–25 years, the capital recovery factor is in the range of 7.8 %–11.7 %. The methanol cost is thus in the range of EUR 1.2–3.6/kg (EUR 225 to 660/MWhth). Note that the low end of the range (high end) was obtained by using the most optimistic cost data (most pessimistic cost data).
This cost is 3 to 9 times greater than the current market price for methanol (EUR 0.4/kg ≈ EUR 72/MWh in the first quarter of 2021). However, it does not consider a price on greenhouse gas (GHG) emissions. At least 0.675 kg of CO2 is produced per kilogram of methanol produced using conventional processes (which are based on coal or natural gas) (Martin and Grossmann, 2017). In 2018, the carbon tax was EUR 44.6/t in France and EUR 110/t in Sweden; if CO2 emissions were taken into account, the methanol price would increase by EUR 6/MWhth and EUR 13/MWhth respectively. Thus, unfortunately, even with a rather significant carbon tax, the cost of methanol produced with a first-of-a-kind FARWIND system would not be competitive.
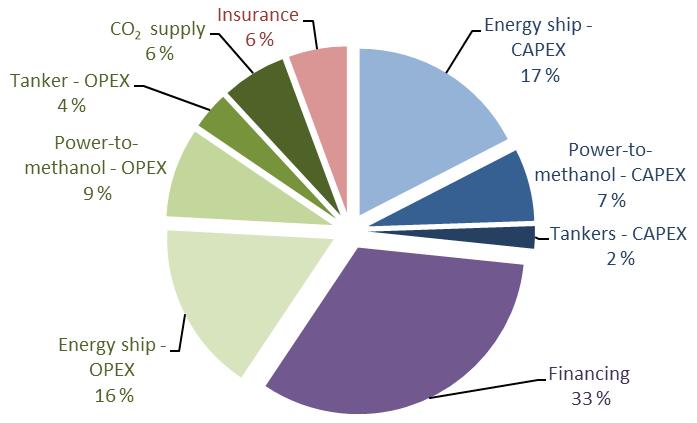
Figure 7Cost breakdown of methanol produced by a first-of-a-kind FARWIND system. The shown data correspond to an average cost scenario (methanol cost equal to EUR 2.4/kg).
Figure 7 shows the cost breakdown for an average cost scenario. One can see that the main cost sources are the financing cost (33 % of total methanol cost), the energy ship's capital cost (hull + Flettner rotors + water turbines + auxiliaries and integration, 17 % of total methanol cost), and operation and maintenance cost of the FARWINDERs (16 %). The total cost of energy storage – including the power-to-methanol plants' capital cost and maintenance cost, CO2 supply, and tanker capital cost and operation and maintenance cost – accounts for 25 % of total cost.
5.2 Comparison with methanol production by offshore wind turbines
Let us compare the cost of methanol production by FARWIND systems and offshore wind turbines. In this respect, we assume that the first-of-a-kind FARWIND system is deployed by 2030. At that time, according to IRENA (2019), the global offshore wind energy capacity will have reached 230 GW.
The key economic drivers in power-to-gas or power-to-liquid processes are the cost of input electricity to the power-to-gas/liquid plant and the power-to-gas/liquid plant capacity factor (Fasihi et al., 2016; Ioannou and Brennan, 2019). Based on those data, one can calculate the methanol production cost using
where I′ is the capital cost of the power-to-methanol plant, λ′ is the O&M rate of the power-to-methanol plant plus the insurance rate, CF is the plant capacity factor, Prated is the rated power of the plant, ηMeOH is the plant efficiency (49 %; see Babarit et al., 2020a), LCOEelec is the cost of input electricity to the power-to-methanol plant, is the CO2 cost per unit mass and LHVMeOH is the lower heating value of methanol per unit mass (the factor 1.38 corresponds to the fact that it takes 1.38 kg of CO2 to produce 1 kg of methanol).
Table 4Expected costs of a power-to-methanol plant by 2030 (excluding input electricity).
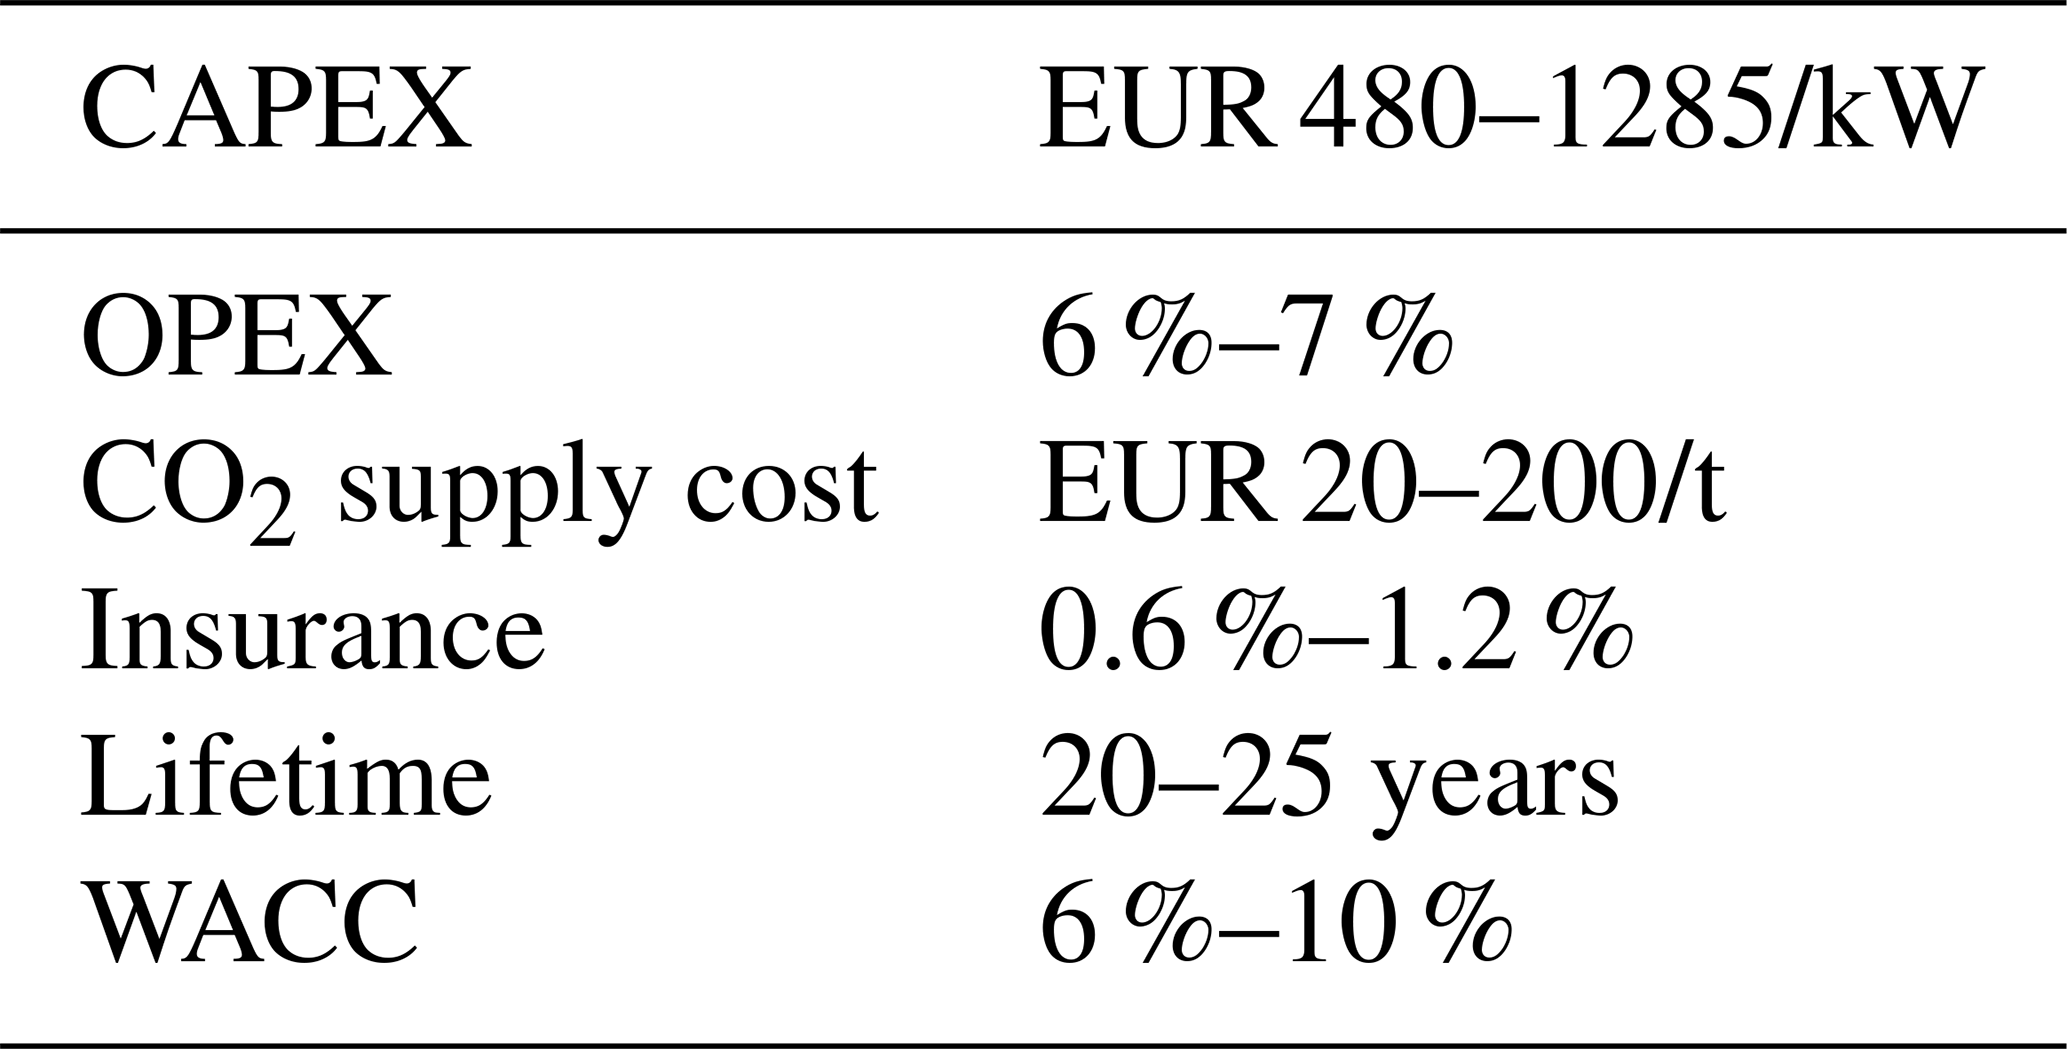
Table 4 shows the cost assumption for the power-to-methanol plant of the offshore wind farm. The capital cost is assumed to be a third of that of the first-of-a-kind FARWIND system as the power-to-methanol plant would be much larger (Brynolf et al., 2018) and as it may be shore-based. According to IRENA (2019), the cost of electricity from offshore wind farms will be in the range of EUR 40 to 80/MWh by 2030 with capacity factors in the range of 36 % to 58 %. Therefore, using Eq. (4), we find that the methanol production cost by offshore wind farms would be in the range of EUR 110 to 375/MWhth (EUR 0.6 to 2.1/kg) by 2030. Thus, by 2030, the cost of methanol produced by a FARWIND energy system (EUR 1.3 to 2.1/kg) would not be competitive with that produced by a shore-based power-to-methanol plant powered by a large offshore wind farm.
However, that would be the case for a first-of-a-kind FARWIND, whereas it would be for an expected global capacity of 230 GW for offshore wind turbines. Therefore, provided that sufficient FARWIND capacity is installed, FARWIND-produced methanol may become comparable to that of methanol produced by offshore wind farms. This is shown in Fig. 8, which shows a comparison of the long-term methanol cost produced by FARWIND systems and by offshore wind farms. A learning rate of 10 % was assumed both for the FARWIND systems and for the methanol-producing offshore wind farms. However, for the offshore wind farm, it has been taken into account that the cost of input electricity assumes an installed 230 GW global offshore wind capacity. Therefore, it can be expected that it would take a further 230 GW to achieve a cost reduction of 10 % of that part of the methanol cost (second term in Eq. 4). Thus, the methanol production cost of offshore wind farms as a function of the installed capacity COW (in gigawatts) can be written
Note that, in agreement with the cost data of Brynolf et al. (2018), it has been assumed that the capacity of the first methanol-producing offshore wind farm is 200 MW.
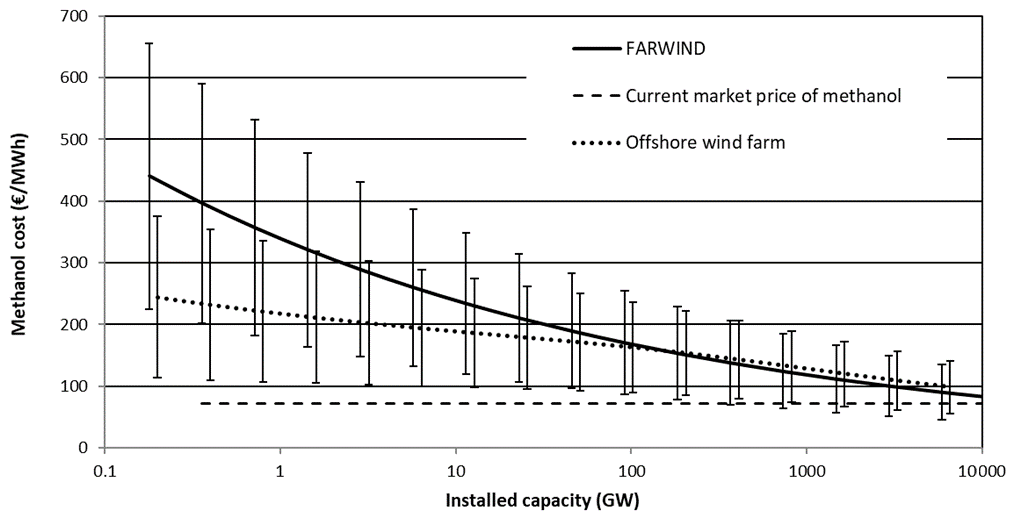
Figure 8Comparison of long-term methanol cost produced by FARWIND systems and offshore wind farms as function of the installed capacity.
5.3 Long-term cost and market potential
Let us now consider the perspective of carbon-neutral methanol produced by FARWIND systems or offshore wind farms for the transportation fuel market. Indeed, methanol can be blended with gasoline in low quantities for use in existing road vehicles. According to Methanol Institute (2014), the blend can include up to 15 % methanol by volume (M15 fuel). Moreover, flexible fuel vehicles which can run on an 85 %–15 % methanol–gasoline mix (M85 fuel) have been developed and commercialized (e.g., the 1996 Ford Taurus), and M100 (100 % methanol) vehicles are in development (Olah et al., 2018). Thus, carbon-neutral methanol could be used as a low-carbon substitute to oil on the transportation fuel market.
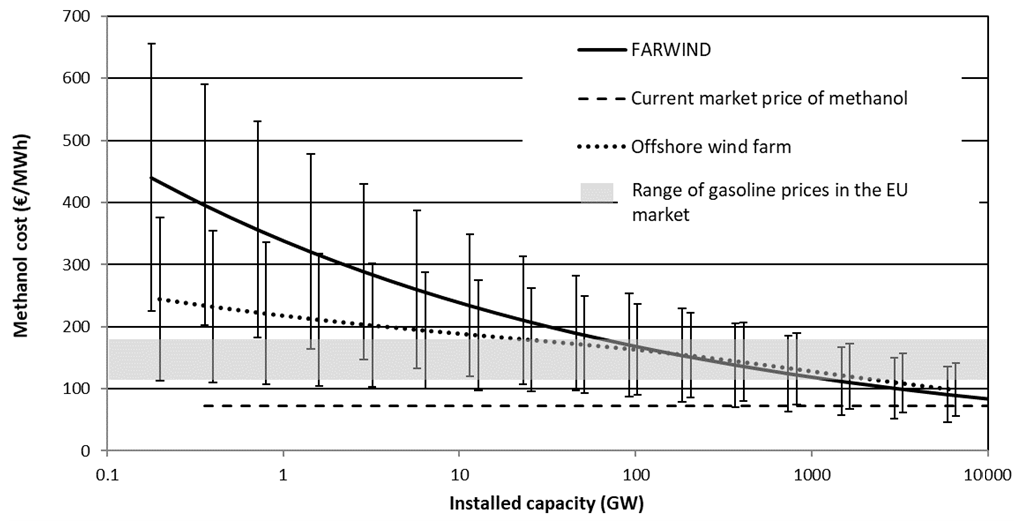
Figure 9Cost of methanol produced by FARWIND systems and offshore wind farms as a function of the installed capacity and comparison with current market price of gasoline in the EU.
Let us compare the cost of FARWIND-produced methanol and methanol produced by offshore wind farms to the gasoline price in the EU. Gasoline price ranges from EUR 1.1/L (Bulgaria) to EUR 1.7/L (Netherlands), the price differences arising from different policies on fuel taxes in different countries (European Commission, 2019). This price range is equivalent to EUR 112 to 173/MWhth, since the standard density of gasoline traded in the EU is 0.755 kg/L, and its energy content is approximately 13 kWhth/kg. Thus, as can be seen in Fig. 9 and provided that tax policies are favorable, carbon-neutral methanol produced by offshore wind farms may already be competitive with gasoline on the EU transportation fuel market. For FARWIND-produced methanol, it may take “only” a few tens of gigawatts of installed capacity to be competitive.
5.4 Uncertainty discussion of cost of energy
In the present study, the economic feasibility is based on broad assumptions that undoubtedly include considerable uncertainty. That uncertainty has been taken into account by considering ranges for the cost parameters. The ranges were determined based on suppliers and/or experts' recommendations and/or publicly available literature. The uncertainty was propagated by applying the most optimistic cost data (most pessimistic cost data) to determine the low end (high end) of the levelized cost of methanol.
Regarding energy production, no uncertainty was applied. This is because energy production results from a deterministic numerical model. Comparisons with experiments (which are not yet available) are necessary to determine its level of accuracy. This may lead to the higher end of the cost of methanol estimate actually being underestimated should the actual energy production be significantly smaller than that predicted by the numerical model. On the other hand, if the design of the energy ship was optimized for the specific purpose of increased profitability, the proposed system might become significantly more competitive compared to the current design.
In this paper, we proposed an energy system for sustainable methanol production from the far-offshore wind energy resource. It is based on an autonomous fleet of 112 energy ships and five manned tankers for the collection and transport of the produced methanol, as well as the supply of CO2 to the energy ships. The system's methanol production is expected to be on the order of 70 600 t per annum (approximately 390 GWh per annum of chemical energy). The cost of this methanol is expected to be in the range of EUR 1.2–3.6/kg for the first-of-a-kind FARWIND system, which is significantly greater than the current market price for fossil-fuel-derived methanol (EUR 0.4/kg). However, methanol can be used as a substitute to fossil fuels on the fuel transportation market: since the price of transportation fuel is high in most European countries. Assuming that a cost reduction similar to that observed for land-based wind energy can be achieved, the cost of FARWIND-produced methanol could compete with gasoline in the EU.
The cost of methanol produced by a first-of-a-kind FARWIND system is unlikely to be competitive with that produced by a large shore-based power-to-methanol plant powered by an offshore wind farm. However, provided that sufficient FARWIND capacity is installed, FARWIND-produced methanol may become comparable to that of methanol produced by offshore wind farms.
However, one should note that the present study is based on many broad assumptions that include considerable uncertainty. Further work is needed to confirm the findings. Moreover, one should note that the cost of FARWIND-produced methanol is based on a particular energy ship design, which might be optimized to reduce costs.
The code and data supporting the findings of this study are available from the corresponding author upon request.
AB and JCG conceived of the presented idea. AB developed the theory and performed the computations. GB contributed to the modeling of the aerodynamic interactions. PdB, AN and FG performed the structural analysis of the hull. AB wrote the manuscript in consultation with all other co-authors.
Aurélien Babarit and Félix Gorintin are co-founders of Farwind Energy: http://www.farwind-energy.com (last access: 14 September 2021), which aims at commercializing the technology described in the paper.
Publisher's note: Copernicus Publications remains neutral with regard to jurisdictional claims in published maps and institutional affiliations.
This research was partially carried out in the Marine Energy Alliance project, which is financially supported by Interreg North-West Europe.
This research has been supported by the Interreg North-West Europe (Marine Energy Alliance project).
This paper was edited by Amir R. Nejad and reviewed by two anonymous referees.
Abd-Jamil, R., Chaigneau, A., Gilloteaux, J.-C., Lelong, P., and Babarit, A.: Comparison of the capacity factor of stationary wind turbines and weather-routed energy ships in the far-offshore, J. Phys.-Conf. Ser., 1356, 2019.
Babarit, A., Gilloteaux, J-C., Clodic, G., Duchet, M., Simoneau, A., and Platzer, M. F.: Techno-economic feasibility of fleets of far offshore hydrogen-producing wind energy converters, Int. J. Hydrogen Energy, 43, 7266–7289, https://doi.org/10.1016/j.ijhydene.2018.02.144, 2018.
Babarit, A., Gilloteaux, J.-C., Body, E., and Hetet, J.-F.: Energy and economic performance of the FARWIND energy system for sustainable fuel production from the far-offshore wind energy resource, in: Proc. Of the 14th International conference on ecological vehicles and renewable energies (EVER 2019), Monaco, https://doi.org/10.1109/EVER.2019.8813563, 2019.
Babarit, A., Clodic, G., Delvoye, S., and Gilloteaux, J.-C.: Exploitation of the far-offshore wind energy resource by fleets of energy ships – Part 1: Energy ship design and performance, Wind Energ. Sci., 5, 839–853, https://doi.org/10.5194/wes-5-839-2020, 2020a.
Babarit, A., Delvoye, S., Clodic, G., and Gilloteaux, J.-C.: Exploitation of the far-offshore wind energy resource by fleets of energy ships. Part B. Cost of energy, Wind Energ. Sci. Discuss. [preprint], https://doi.org/10.5194/wes-2019-101, 2020b.
Blue WASP: Preliminary analysis of Flettner rotor aerodynamic interaction for two given conditions, Technical report, 9 pp., November 2020.
Bordogna, G.: Aerodynamics of wind-assisted ships, PhD thesis, Delft University of Technology, Delft, 2020.
BP: BP Statistical review of world energy, 67th edition, BP, London, UK, June 2018.
Brynolf, S., Taljegard, M., Grahn, M., and Hansson, J.: Electrofuels for the transport sector: a review of production costs, Renew. Sust. Energ. Rev., 81, 1887–1905, https://doi.org/10.1016/j.rser.2017.05.288, 2018.
Bureau Veritas: NR600 Hull structure and arrangement for the classification of cargo ships less than 65 m and non cargo ships less than 90 m, Edition November 2018, available at: available at: https://marine-offshore.bureauveritas.com/nr600-hull-structure-and-arrangement-classification-cargo-ships-less-65-m-and-non-cargo-ships-less (last access: 19 February 2021), 2018.
Chardonnet, C., De Vos, L., Genoese, F., Roig, G., Giordano, V., Rapoport, S., Bart, F., De Lacroix, T., Ha, T., Van Genabet, B., Lanoix, J.-C., and Vanhoudt, W.: Study on early business cases for H2 in energy storage and more broadly power to H2 applications, Tractebel & Hinicio, Final report, 2017.
Charrier, D.: Etude théorique et expérimentale de l'effet “Magnus” destiné à la propulsion des navires, PhD thesis, Université de Paris VI, Paris, 1979.
Chart: Technical manual: carbon dioxide storage tank, Manual #11650869 Rev, Chart industries, Ball ground, USA, 2019.
Delhommeau, G. and Maisonneuve, J.-J.: Extensions du code de calcul de résistance de vagues REVA : prise en compte des effets de fond et de portance, Compte-rendu des 1e Journées de l'hydrodynamique, Nantes, France, 1987.
EMEC: Marine Energy Alliance – FARWIND: feasibility review, Technical report, 24 pp., October 2020.
European Commission: Consumer prices of petroleum products inclusive of duties and taxes, Prices in force on 18 November 2019, 2019.
Fasihi, M., Bogdanov, D., and Breyer, C.: Techno-economic assessment of power-to-liquids (PtL) fuels production and global trading based on hybrid PV-wind power plants, Energ. Procedia, 99, 243–268, https://doi.org/10.1016/j.egypro.2016.10.115, 2016.
Gitank: GI Chemical Technical Brochure, available at: https://www.gitank.com/methanol-storage-tanks, last access: 9 July 2021.
Graves, C., Ebbesen, S. D., Mogensen, M., and Lackner, K. S.: Sustainable hydrocarbon fuels by recycling CO2 and H2O with renewable or nuclear energy, Renew. Sust. Energ. Rev., 15, 1–23, https://doi.org/10.1016/j.rser.2010.07.014, 2011.
Holl, M., Rausch, L., and Pelz, P. F.: New methods for new systems – how to find techno-economically optimal hydrogen conversion system, Int. J. Hydrogen Energy, 42, 22641–22654, https://doi.org/10.1016/j.ijhydene.2017.07.061, 2017.
Ioannou, A. and Brennan, F.: A techno-economic comparison between a grid-connected and non-grid connected offshore floating wind farm, in: Proc. Of the IEEE 2019 Offshore energy and storage summit (OSES), Brest, France, https://doi.org/10.1109/OSES.2019.8867350, 2019.
IRENA: Future of wind – deployment, investment, technology, grid integration and socio-economic aspects, International Renewable Energy Agency, Abu Dhabi, October 2019.
Irlam, L.: Global costs of carbon capture and storage – 2017 update, Global CCS institute, Melbourne, Australia, June 2017.
Keith, D. W., Holmes, G., St Angelo, D., and Heidel, K.: A process for capturing CO2 from the atmosphere, Joule, 2, 1573–1594, https://doi.org/10.1016/j.joule.2018.05.006, 2018.
Li, H., Tan, Y., Ditaranto, M., Yan, J., and Yu, Z.: Capturing CO2 from biogas plants, Energ. Procedia, 114, 6030–6035, https://doi.org/10.1016/j.egypro.2017.03.1738, 2017.
Lindman, A. and Soderholm, P.: Wind power learning rates: a conceptual review and meta-analysis, Energ. Econom., 34, 754–761, https://doi.org/10.1016/j.eneco.2011.05.007, 2012.
Lindstad, H., Asbjornslett, B. E., and Stromman, A. H.: The importance of economies of scale for reductions in greenhouse gas emissions from shipping, Energ. Policy, 46, 386–398, https://doi.org/10.1016/j.enpol.2012.03.077, 2012.
MAN Energy solutions: propulsion trends in bulk carriers, available at: https://www.man-es.com/docs/default-source/marine/propulsion-trends-in-bulk-carriers-manpm-00-0615-preview.pdf?sfvrsn=2aa2ebbf_6 (last access: 14 September 2021), 2019.
Martin, M. and Grossmann, I. E.: Towards zero CO2 emissions in the production of methanol from switchgrass. CO2 to methanol, Comput. Chem. Eng., 105, 308–316, https://doi.org/10.1016/j.compchemeng.2016.11.030, 2017.
Methanol Institute: M15 methanol gasoline blends: 35 years of research and experience supports its use, Methanol facts, Methanol Institute, Singapore, 2014.
Morgan, E. R.: Techno-economic feasibility study of ammonia plants powered by offshore wind, Dissertations 697, University of Massachussets, Amherst, 2013.
Norsepower: Rotor Sail Technology, Commercial brochure, available at: https://www.norsepower.com/download/brochure.pdf, last access: 19 February 2021.
Oi, L. E., Eldrup, N., Adhikari, U., Bentsen, M. H., Badalge, L., and Yang, S.: Simulation and cost comparison of CO2 liquefaction, Energ. Procedia, 86, 500–510, https://doi.org/10.1016/j.egypro.2016.01.051, 2016.
Olah, G. A., Goeppert, A., and Surya Prakash, G. K.: Beyond Oil and Gas: the methanol economy. Third, updated and enlarged edition, Wiley-VCH, 2018.
Parks, G., Boyd, R., Cornish, J., and Remick, R.: Hydrogen station compression, storage, and dispensing: technical status and costs, Technical report NREL/BK-6A10-58564, National Renewable Energy Laboratory, 2014.
Pfaffel, S., Faulstich, S., and Rohrig, K.: Performance and reliability of wind turbines: a review, Energies, 10, 1904, https://doi.org/10.3390/en10111904, 2017.
Roncin, K. and Kobus, J.-M.: Dynamic simulation of two sailing boats in match racing, Sports Engineering, 7, 139–152, https://doi.org/10.1007/BF02844052, 2004.
Schmidt, O., Gambhir, A., Staffel, I., Hawkes, A., Nelson, J., and Few, S.: Future cost and performance of water electrolysis: an expert elicitation study, Int. J. Hydrogen Energy, 42, 30470–30492, https://doi.org/10.1016/j.ijhydene.2017.10.045, 2017.
Sheng, S.: Report on wind turbine subsystem reliability: a survey of various databases. Presentation NREL/PR-5000-59111, National Renewable Energy Laboratory, Golden, CO, June 2013.
Shetelig, K.: Shipbuilding cost estimation: parametric approach, Norwegian University of Science and Technology, Trondheim, Norway. 61 pp., 2013.
Tillig, F. and Ringsberg, J. W.: Design, operation and analysis of wind-assisted cargo ships, Ocean Eng., 211, 107603, https://doi.org/10.1016/j.oceaneng.2020.107603, 2020.
Willauer, H. D., Hardy, D. R., Schultz, K. R., and Williams, F. W.: The feasibility and current estimated capital costs of producing jet fuel at sea using carbon dioxide and hydrogen, J. Renew. Sust. Energy, 4, 033111, https://doi.org/10.1063/1.4719723, 2012.
Willauer, H. D., DiMascio, F., and Hardy, D. R.: Extraction of carbon dioxide and hydrogen from seawater by an electrolytic cation exchange module (E-CEM) part V: E-CEM effluent discharge composition as a function of electrode water composition, Naval research laboratory, Washington D.C., 2017.
- Abstract
- Introduction
- Specifications of the updated energy ship design
- Specifications of the proposed FARWIND energy system
- Estimation of expenditures
- Cost of energy estimates
- Conclusions
- Code and data availability
- Author contributions
- Competing interests
- Disclaimer
- Acknowledgements
- Financial support
- Review statement
- References