the Creative Commons Attribution 4.0 License.
the Creative Commons Attribution 4.0 License.
Investigating the loads and performance of a model horizontal axis wind turbine under reproducible IEC extreme operational conditions
Kamran Shirzadeh
Horia Hangan
Curran Crawford
Pooyan Hashemi Tari
The power generation and loading dynamic responses of a 2.2 m diameter horizontal axis wind turbine (HAWT) under some of the IEC 61400-1 transient extreme operational conditions, more specifically extreme wind shears (EWSs) and extreme operational gust (EOG), that were reproduced at the WindEEE Dome at Western University were investigated. The global forces were measured by a multi-axis force balance at the HAWT tower base. The unsteady horizontal shear induced a significant yaw moment on the rotor with a dynamic similar to that of the extreme event without affecting the power generation. The EOG severely affected all the performance parameters of the turbine.
- Article
(12536 KB) - Full-text XML
- Companion paper
-
Supplement
(119318 KB) - BibTeX
- EndNote
In the past 2 decades, wind energy has grown to become one of the primary sources of energy being installed worldwide in an effort to reduce greenhouse gas emissions. One of the main factors of this increasing trend is the continued decreasing price of electricity generated by wind energy devices. It is still expected for this market to grow by having even lower levellized cost of electricity (LCOE) in the near future (Tran and Smith, 2018). This price reduction can be facilitated by more technological advancements (e.g. building larger rotors) and better understanding of the interaction between different wind conditions and the turbines in order to increase the life cycle of these wind energy systems.
The dynamic nature of the atmospheric boundary layers (ABLs) affects all the dynamic outputs of the wind turbines; these all bring challenges to further growth of the wind energy share in the energy sector. One of the main challenges for today's wind turbines is the power generation fluctuations which cause instability in the grid network (Anvari et al., 2016). It has been reported that the effect of the extreme events can get transferred to the grid with even amplification in magnitudes (amount of power generation is related to the cube of wind velocity); the power output of the whole wind farm can change by 50 % in just 2 min (Milan et al., 2013). These turbulent features also induce fatigue loads on the blades (Burton et al., 2011) predominantly for the flap-wise loadings (Rezaeiha et al., 2017), which then get transferred to the gearbox (Feng et al., 2013), bearings and then the whole structure. Implementation of lidar technology can make a revolutionary contribution to this matter by measuring the upstream flow field and give enough time to the control system to properly adjust itself (e.g. blade pitch angles, generator load) in order to reduce overall power fluctuations and the mechanical load variations (Bossanyi et al., 2014).
During the past few decades some comprehensive design guidelines have been developed in terms of load analysis. The International Electrotechnical Commission (IEC) included some deterministic design load cases for commercial horizontal axis wind turbines (HAWTs) in operating conditions in the IEC 61400-1 document (IEC, 2005) followed by statistical analysis introduced in the latest edition (IEC, 2019). Herein the power generation and loads on a scaled HAWT are being tested under representative deterministic gust design conditions as per IEC 2005. This is an extension to the previous study (Shirzadeh et al., 2020) that incorporated the developments of the corresponding scaled extreme operational gust (EOG) and extreme wind shears (EWSs) and included the extreme vertical and horizontal shears (EVSs and EHSs), in the WindEEE Dome.
From an aerodynamic perspective the effective angle of attack on the blades and consequently the global lift and drag forces increase during wind gust conditions, which result in blade torque, thrust and root moment amplification. Several experimental studies have been conducted to control the rotor aerodynamics under these transient events. The application of the adaptive camber airfoil in a gusty inflow generated by are active grid was investigated by Wester et al. (2018). These types of airfoils have coupled leading and trailing edge flaps, which can be adjusted to de-camber the profile with increasing lift force. This proved to reduce the integral lift force about 20 % at the peak in a gust event. Petrović et al. (2019) developed an algorithm for a PI controller of the pitch angles of a scaled wind turbine in the wind gust conditions generated by an active grid. Using the algorithm, they were able to reduce over-speeding of the rotor and the blades' bending moments.
The effect of the wind shears on wind turbine aerodynamics has been studied by several investigators. The effect of various steady shear flows and turbulence intensities, generated by active grid, on the near-wake region of a small-scale turbine was investigated by Li et al. (2020) using particle image velocimetry (PIV) measurements. It has been found that the absolute mean velocity deficit in this region remains symmetric, and it is insensitive to the inflow non-uniformity. Also, the mean power production does not change with the amount of the shear. However, the power fluctuation has a linear correlation with the amount of background turbulence intensity; in other words, the effect of higher shears translated as a higher inflow turbulence and therefore higher fluctuations in power. Similar results were reported by Sezer-Uzol and Uzol (2013), who used a three-dimensional unsteady vortex-panel method to investigate the effect of transient EWS on the performance of a HAWT. They found that due to the EWS, the blades experience asymmetrical surface pressure variations. Consequently, the rotor produces power and thrust with a high amplitude of fluctuations, which can cause significant structural issues and reduce the lifetime of the turbine. From the field data perspective, it has been reported that for the same reference wind speed, higher turbulence intensities result in relatively higher-power efficiencies below the nominal operational condition, but the efficiency decreases in transition to rated power (Albers et al., 2007).
Mostly, transient flow fields have been previously generated either numerically or physically by means of active grids. While some of these studies produced various transient flows, none had attempted to reproduce the EOG and EWS as per IEC standards and apply them to a wind turbine with a relevant scaling, which constitutes the main objective of the present study. The work has been performed at the WindEEE Dome at Western University Canada. Along with the numerical simulations and field data, this setup can contribute to fast development of the new control prototypes of HAWT for customized transient wind effects.
The paper is organized as follows. Section 2 briefly presents the target deterministic operational extreme conditions. Section 3 details the WindEEE chamber and the experiment setups; this section also provides the details about the uniform flow fields used as reference values for comparisons. Section 4 presents the results from EWSs and EOG and the capability of the facility in reproducing these conditions. Section 5 is dedicated to conclusions.
Prior to introducing the deterministic gust models, it is informative to know how the standard (IEC, 2005) classifies wind turbines based on a reference wind speed and turbulence intensity (TI). The TI in the standard is given for a specific height and is defined as the ratio of the mean standard deviation of wind speed fluctuations to the mean wind speed value at that height, both calculated in 10 min intervals. Three classes of reference wind speeds (Uref: I–III) and three classes of turbulence intensities (Iref: A–C) are defined, which gives a combination of nine external turbine design conditions that have specified values. One further class for special conditions (e.g. off-shore and tropical storms) is considered which should be specified by the designer. Correspondingly, extreme wind speed models as a function of height (Z) with respect to the hub height (Zhub) with recurrence periods of 50 years () and 1 year () are defined as follows:
Based on the turbulence class, the streamwise hub height velocity standard deviation (σu) is defined by what is called the normal turbulence model as Eq. (3).
is the average velocity at hub height.
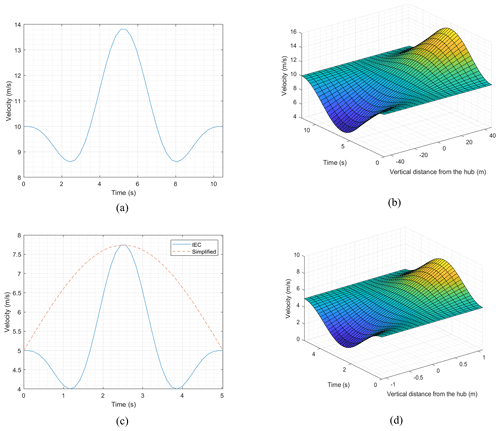
Figure 1Extreme operational conditions for a full-scale HAWT IIIB class with 92 m diameter and hub height of 80 m at 10 m s−1 uniform wind speed, (a) extreme operational gust and (b) extreme vertical shear on the rotor with hub height as reference, The scaled extreme condition, (c) the IEC EOG and the simplified EOG that was targeted, and (d) extreme vertical shear. Adopted from Shirzadeh et al. (2020).
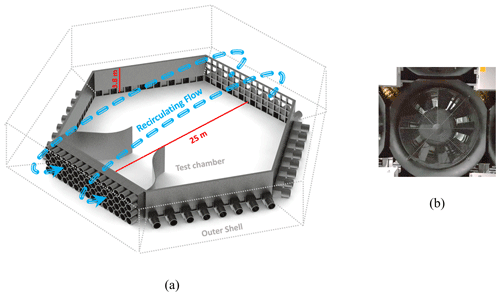
Figure 2WindEEE dome, (a) the test chamber and the contraction walls with the flow recirculation path through the outer shell in closed-circuit 2D flow mode, and (b) the adjustable vanes at the inlets of the 60 fans at 70 % opening vane state.
Based on Eqs. (2) and (3), the hub height gust magnitude (Ugust) is given as
Taking t=0 as the beginning of the gust, the velocity time evolution of the EOG is defined as
T is the duration of the EOG, specified as 10.5 s, D is the diameter of the rotor, and Λu is the longitudinal turbulence scale parameter, which is a function of the hub height:
The EWS can be added to or subtracted from the main uniform or ABL inflows. The EVS velocity time evolution at a specific height (Z) can be calculated using Eq. (7).
The EWS duration is 12 s. For a commercial IIIB class HAWT with 92 m diameter and 80 m tower hub height, at 10 m s−1 average velocity, the prescribed EOG and EVS are presented in Fig. 1a and b. The time windows in these figures start and end with the extreme event. The standard gust durations in operation conditions are relatively long compared to the response time of scaled wind turbines. Herein, we assume these time durations (10.5 s for EOG and 12 s for EWS) correspond to four complete rotor revolutions in commercial wind turbines, which typically have a rotational speed in the range of ∼15–20 RPM. In other words, the gust time duration is equal to the advection of the four complete tip vortex loops from a specific blade in the wake by the free stream. Accordingly, the timescale becomes a function of rotor angular velocity or the tip speed ratio (i.e. TSR, the ratio of the blade tip linear velocity over the free stream), free stream velocity and diameter of the rotor; for a scaled wind turbine, the duration corresponding to four revolutions in similar nominal operating conditions is on the order of 1 s. The experiments in the earlier study showed that the fastest possible gust obtained in the WindEEE Dome with the desired peak factor was around 5 s (Shirzadeh et al., 2020). Therefore, it is possible to relevantly decrease the wind speed and TSR to match up the parameters based on the assumption above that results in Eq. (8):
where Ts is the scaled time (here it is 5 s) and λ is the operating TSR. Assuming a similar IIIB class HAWT with a hub height of ∼2 m with the 2.2 m diameter-scaled wind turbine, at 5 m s−1 average hub height velocity, the extreme condition profiles look identical to the full-scale ones (the same peak factor but different gust time) as presented in Fig. 1c and d. These are the inflow fields that are considered in the present experiments. Therefore, based on this assumption, the turbine should be working at 1.1 TSR. Also due to hardware limitation in the physical experiments, the EOG has been simplified by excluding the velocity drops before and after the main peak as is shown in Fig. 1c as the red dashed line. This simplification stretches the actual rising and falling time, yet this is the compromise that was made due to hardware limitations. For a wind turbine that operates in a specific average wind, it is the velocity excursion above the average wind speed that is important to capture. More detailed information about the scaling method and the extreme operational condition (EOC) flow fields is accessible in Shirzadeh et al. (2020).
It is worth mentioning that these extreme operational condition models are relatively simple and not able to capture the real dynamics of the ABL flow field that directly affect the performance of the turbine (Schottler et al., 2017; Wächter et al., 2012). However, they provide practical guidelines for the development and wind tunnel testing of HAWTs.
As mentioned earlier, in this study similar inflow fields with the ones developed in Shirzadeh et al. (2020) were reproduced to investigate the responses of the wind turbine to these scaled transient conditions. For each extreme event only one measurement run was performed. The reproducibility of these events was ensured by direct comparison with the previous study.
3.1 WindEEE Dome
The experiments were carried out at the Wind Engineering, Energy and Environment (WindEEE) Dome at Western University, Canada. The test chamber has a 25 m diameter footprint and 3.8 m height with a total number of 106 fans, of which 60 fans are mounted along one of the hexagonal walls in a 4×15 matrix and 40 fans are mounted on the rest of the peripheral five walls (Fig. 2a). Six other larger fans are in a plenum above the test chamber, usually being used for 3D flows like tornadoes and down bursts (Hangan et al., 2017). In the present study, experiments were carried out using the dome in 2D flow (e.g. ABL, uniform straight flows) closed-circuit mode in which just the 60-fan wall is operated. In this mode the flow recirculates from the top through the outer shell as is shown in Fig. 2a. Each of these fans are 0.8 m in diameter and are individually controlled to a percentage of their 30 kW maximum power using variable frequency drives. In order to reach higher velocities at lower fan power set points at the test chamber for generating EOG, a 2D contraction with ratio of 3 was installed at the outlet of the 60-fan wall that extends for 7.5 m downstream (Fig. 2a). These fans are equipped with adjustable inlet guiding vanes (IGVs). They can be adjusted stationarily from 0 % open (close) to 100 % open or dynamically in an open–close cycle (Fig. 2b). By using this feature the EOGs were produced. The EWSs were produced by power modification of the five middle fan columns (20 fans). Therefore, contraction walls had no effect on the EWS flow fields.
3.2 Experimental setup for power and load performance
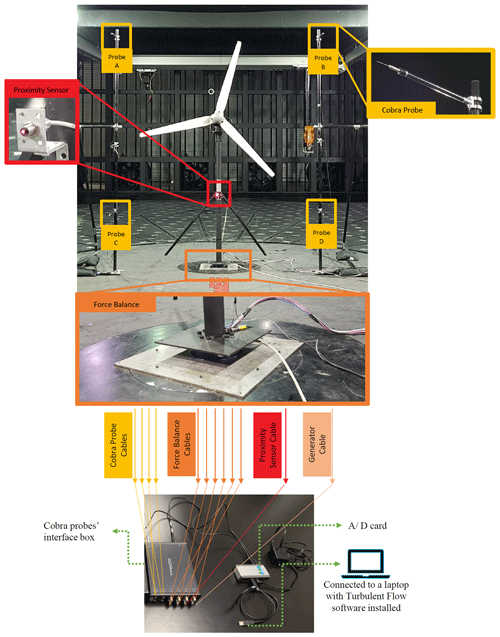
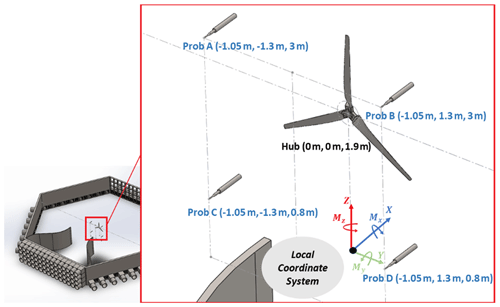
To measure the velocity of the flow field, four cobra probes (TFI Ltd., 2011) are used in a plane 1 m upstream (∼0.5 D) of the rotor with 1.3 m left and right offset from the rotor's hub. The probes are set at 3 m and 0.8 m heights corresponding to the highest and lowest heights of the rotating blades' tips (Fig. 3). With this configuration the cobra probes can give a proper perception of the flow field over the wind turbine rotor plane. More specific details about cobra probes are found in Shirzadeh et al. (2020). The wind turbine was mounted on a six-component force balance sensor for measuring all three shear forces and three moments at the base of the tower. In addition, a light photoelectric diffuse reflection proximity sensor (Autonics BR200-DDTN) was used, which gives a voltage pulse once it detects a light reflection from the blade passing in front. Using the pulse, one can measure the angular velocity of the rotor with a high resolution (three times a revolution). The turbine has 1 kW rated power at 12 m s−1 wind speed and a nominal TSR of 5; detailed specifications of blade geometry and the power curve of the turbine are available in Refan and Hangan (2012). This wind turbine is equipped with a three-phase AC generator. A specific electrical circuit was used to convert the voltage and current to DC and feed the power to the resistors. The last parameter that was monitored was the voltage from the terminals of the power resistors which were set at a constant 8.1 Ω in order to keep the rotor at the desired TSR (1.1) that has been calculated based on the averaged wind speed from all the cobra probes. At the end, eight analogue voltage cables (six voltages from force balance, one from proximity sensor and one from load terminals) plus four cobra probe cables gathered to one deck were synchronized and logged at 2000 Hz frequency for 90 s for each experiment run. All the signals were calibrated as zero in the turbulent flow data acquisition software when the 60 fans were off.
The schematic of the positioning of the wind turbine and the cobra probes relative to the local coordinate system (centre of the WindEEE dome/base of the tower) is depicted in Fig. 4. Some of the loads at the base are inherently correlated with the performance of the wind turbine. Based on this local coordinate system, the most important force in terms of both magnitude and correlation with turbine performance at the base is in the X direction, which represents the thrust of the rotor, plus the drag force of the tower. The X moment represents torque on the generator plus induced vortex shedding moment; the Y moment shows the bending moment due to drag on the whole structure (correlated to the forces in the X direction). The moment around the Z axis shows the twist due to horizontal non-uniformity of the flow. The Z force represents the lift on the structure.
3.3 Baseline uniform inflows
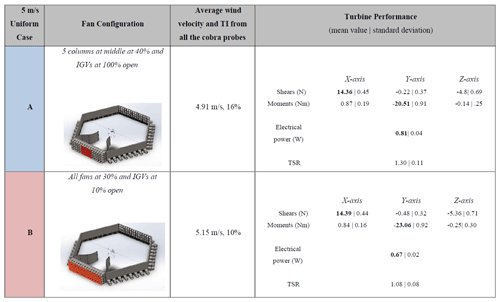
As mentioned earlier, in this study four unsteady extreme condition cases (EVS, EHS, negative EVS and EOG) are considered for the investigation. For the EWSs just the 20 middle fans and in the EOG all of the fans were operated. Some of the results from power performance and loadings of each case are normalized with their corresponding averaged data from one of the two different 5 m s−1 steady uniform wind inflow cases (cases A and B in Table 1). Cases A and B were used to normalize the EWSs and the EOG respectively. The reason for using different uniform cases is due to the difference in the flow characteristics (TI and spectra) related to the different fan setups for each case. At this low TSR, considerable parts of the blades are in stall, and the TI magnitude can affect the flow behaviour on the suction side of the blades and result in noticeable difference in loads and power performance of the wind turbine. The mean and rms values of the data obtained from the force balance, turbine power and TSR from these two uniform cases are tabulated in Table 1. The bolded values in this table will be used to normalize the corresponding data from the transient experiment cases.
Table 1The mean values of loads and power generation in different steady uniform cases (with the same load, 8.1 Ω).
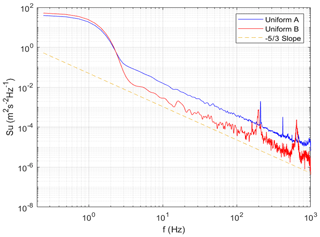
The spatially averaged turbulence spectra by the four cobra probes for these two uniform cases are presented in Fig. 5. There is a consistent noise from the fans with its harmonics at some specific high frequencies (∼200 and 400 Hz in case A, ∼200 and 600 Hz in case B). Due to the steadiness of the flow, a large share of the energy is distributed at the low-end frequencies (i.e. frequencies lower than 3 Hz). In this region, the two cases show the same energy distribution. However, for frequencies higher than and equal to 3 Hz or length scales of 1.65 m and smaller (based on the frozen turbulence hypothesis at 5 m s−1 average wind speed, ), the difference in energy distribution is noticeable with lower turbulence energy in case B in all the corresponding frequencies relative to case A. All the spectra follow the slope consistent with the Kolmogorov theory in the inertial subrange (Pope, 2000).
3.4 Uncertainty analysis
The epistemic uncertainty of the cobra probes depends on turbulence levels, but is generally within ±0.5 m s−1 up to about 30 % turbulence intensity according to the manufacturer (TFI Ltd., 2011). Considering the 5 m s−1 average wind velocity in the experiments, the uncertainty of the probes is 10 %. The JR3 multi-axis force and torque sensor (75E20S4-6000N) at the base of the tower has a stated ±0.25 % nominal accuracy based on the maximum rated load for each axis; refer to Fig. 4 for the axis orientation relative to the wind tunnel. The nominal accuracy of this sensor along each axis based on the data sheet is tabulated in Table 2. These values represent the largest possible uncertainties that the sensor might have; however, generally, it is more precise. A special calibration process was performed by the JR3 company per request, using 58.75 Nm (400 lb ⋅ 6.5 in) reversed and repeated moments about the Y axis; the reported values were 58.77, −58.63, 58.86 and −58.98 Nm. This calibration test implies a ±0.12 Nm error on average when loaded close to the range of our experiments. This load sensor has a 19 cm diameter, which made mounting the turbine directly on its surface possible. It would have been ideal to use the JR3 (30E12A4-40N) model; however, the size of this model is too small (7 cm diameter), which made the mounting process very challenging, with the possibility of damaging the sensor. Only the X (thrust-aligned) force and Y (overturning/nodding) moment will be presented in the Results section, as the other loads have very small mean values leading to unacceptably high uncertainties.
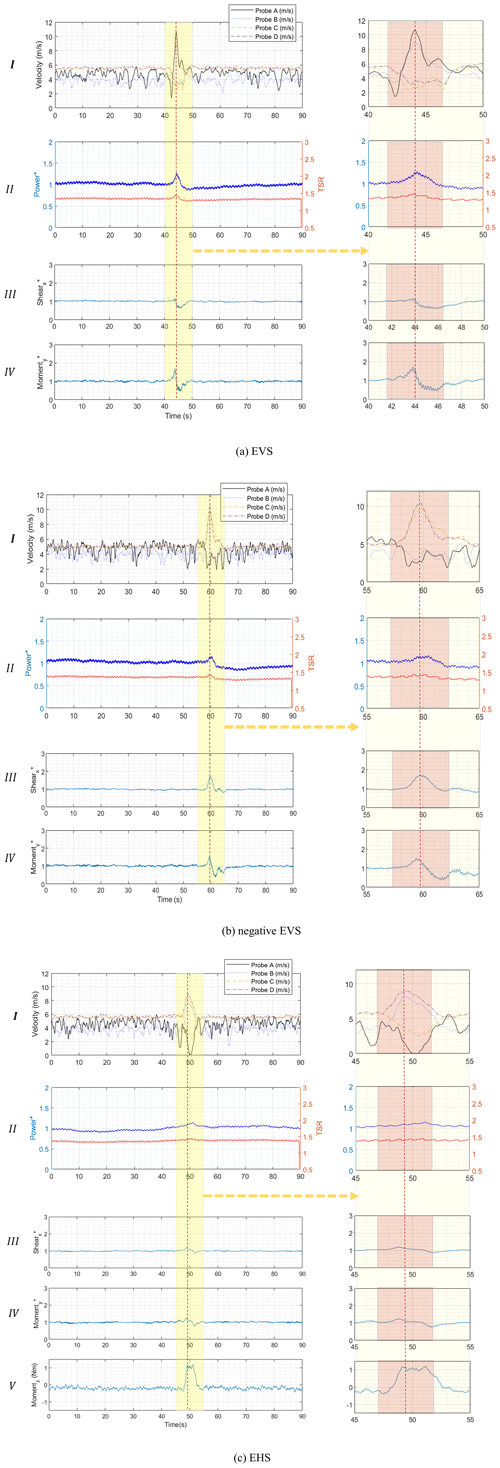
Figure 6The time history of the results from all the measuring instruments in (a) the EVS and (b) the negative EVS. Windows I, II, III and IV from top to bottom in each panel show the wind velocities from four cobra probes, the power performance of the turbine, the X shear and the Y moment at the base of the tower respectively. Panel (c) is for the EHS and has an additional window V that reports the Z moment. The starred axis indexes are normalized by their corresponding value from uniform case A. The 10 s window around the extreme events has been magnified and replotted at the right side of each panel with a red 5 s window highlighting the theoretical duration of the extreme event and the red dashed line assumed as the centre of the events which passes through the first velocity peak.
All the values from the measuring instruments presented in Sect. 4 have been filtered by the moving-average method except for the rotor speed. The averaging windows for the wind velocities, the generator voltage and the loads were chosen as 0.2, 0.2 and 0.5 s respectively based on the criteria described in Chowdhury et al. (2018), which preserved the main shape of signal time history, filtering low-powered high-frequency fluctuations. Therefore, the processed data have aleatoric or random uncertainties within. The combined uncertainties have then been calculated with the root sum squared of these two types of uncertainties and presented as the percentage of their corresponding mean values in Table 3. In this table, the epistemic uncertainty for the Y moment has been calculated based on the calibration results, but value for the X force is based on the data sheet. As mentioned earlier, the X force and the Y moment are caused by the rotor thrust and drag. Therefore, having high uncertainty in the X force can be compensated for by comparing it to the Y moment, which has a more reliable value. The propagation of uncertainty due to normalizing some of the parameters in extreme operational cases with steady cases has been neglected.
4.1 Unsteady EWS
The time history of the results from EVS, negative EVS and EHS cases generated by changing the fan power set points is presented in Fig. 6a–c respectively. There are four windows (I, II, III and IV) in all of these panels which have been arranged as follows: window I shows the filtered wind velocity time histories from the four cobra probes, window II shows the normalized electrical power along with the TSR, and windows III and IV show the filtered force and moment time histories exerted at the tower base in the X direction and around the Y axis respectively. Note that in these figures, the axis force has been referred as shear, as it exerts a shear force at the base. The starred axis indexes are normalized by their corresponding values from the uniform case A. In addition, a 10 s window around the extreme events has been 4× magnified and replotted at the right sides of these panels which present the effect of extreme events in better details. The vertical red dashed line passes through the first wind velocity peak, and it has been assumed as the centre of the event. Based on this line a 5 s red window has been depicted that highlights the theoretical duration of the extreme event in the magnified plots.
Window II in all figures illustrates that these transient shear cases do not have a significant effect on the overall power performance of the wind turbine. The initial increase and decrease in power productions are just due to the time lag between the high and the low peaks of the shears (∼1.5 s) reaching the rotor, which is noticeable from the magnified cobra probe time history in window I in Fig. 6a–c. More details about the extreme event velocity fields are accessible in Shirzadeh et al. (2020). The EVSs do not have any significant effect on the loads at the base of the tower (windows III and IV in Fig. 6a and b).
The highly correlated behaviour between force on the X axis and moment around the Y axis is clear in all these figures, comparing windows III and IV.
In the EHS case, the most important load component at the tower base in terms of magnitude and its correlation with the extreme event is the Z-axis moment. Therefore, the additional window V in Fig. 6c shows this extreme condition induces a 1.2 Nm yaw moment on the structure. While the high probable uncertainty in reporting this value based on Table 2 has been recognized, if one normalizes this number using Eq. (9), one gets 0.009414. Accordingly, for a full-scale wind turbine with 92 m diameter working in an average 10 m s−1 wind speed, the induced yaw moment on the structure by an EHS event would be 351 kNm.
where ρ is the density of the air, A is the swept area of the rotor and D is the diameter. As a full-scale (87 m diameter) numerical simulation under steady velocity of 10 m s−1 with typical yaw condition suggests, the yaw moment can vary between ∼30 and 90 kNm as the blades rotate (Cai et al., 2016). Accordingly, the amount of yaw moment induced by the EHS (varying between 0 and 350 kNm) is at least 3 times the magnitude of the yaw experienced by the turbine in uniform inflow conditions.
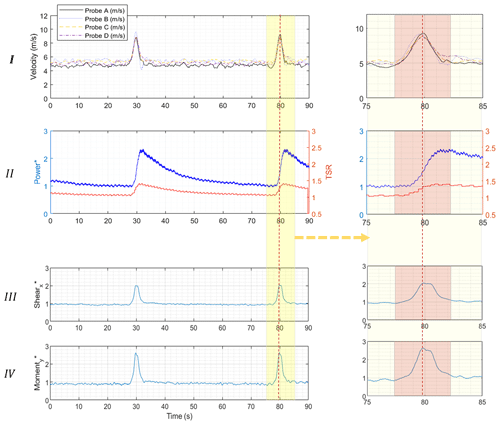
Figure 7The time history of the results from all the probes in EOG using IGVs: window I shows the wind velocities from four cobra probes, window II shows power performance of the turbine, and windows III and IV show the X shear and Y moment at the tower base. The starred axis indexes are normalized by their corresponding value from uniform case B. The 10 s window around the extreme events has been magnified and replotted at the right side with a red 5 s window highlighting the theoretical duration of the extreme event and the red dashed line assumed as the centre of the events which passes through the velocity peaks.
4.2 Unsteady EOG
The EOG significantly affected the power generation and the loads. As the window II in Fig. 7 shows, this event can dangerously increase the rotor rotational speed without control systems (the TSR increased 33 %). The electrical power increased 148 % at the end of the gust event. However, the electrical power generation might not be the proper quantity for comparison at these low rotational speeds. The generator efficiency is highly dependent on the rotor speed. Therefore, some part of this boost in power production is due to the fact that generator efficiency also increased as the rotor speeded up. The mechanical power should be a better quantity for comparison, but it was not possible to measure with the current setup. The overall drag on the structure (X shear) and its bending moment (Y moment) at the base increased by 105 % and 167 % respectively. According to the magnified windows in Fig. 7, the loads have a similar profile shape as the gust with the same order of rising and falling time (windows III and IV). However, the power generation peak happens at the end of the gust event and then slowly decays afterwards (window II). The extractable energy in a gust with a specific amplitude and time duration partially accumulates in the rotor rotational momentum with the excess in the form of higher instantaneous power generation. After the gust event, the stored momentum gradually transforms into power.
4.3 Reproducibility of the extreme events
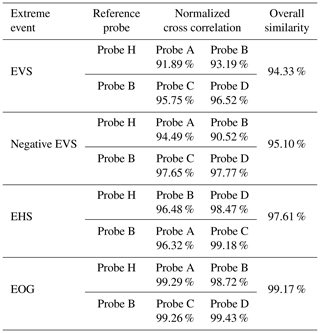
In order to investigate the reproducibility of these extreme events in the WindEEE dome, a normalized cross correlation of the velocity signals between the current and the previous study (Shirzadeh et al., 2020) has been performed. The reference probes from the previous study are probes H and B that were installed at similar heights or lateral distances depending on the event. For example, probe H in the EVS event was located at 3 m height in the previous study, similar to probes A and B in this study. For the analysis, firstly, the velocity data in a 20 s window around the event have been extracted from both velocity time histories. Secondly, with a specific amount of time lag between the velocity signals from this study and the reference probe, the extreme events were perfectly aligned. Finally, the normalized cross correlation was calculated. This way, the shapes of the velocity signals were compared. At the end, the averaged value of similarity from all four probes has been reported as the overall similarity of these events to the previous study as it has been tabulated in Table 4. Accordingly, the IGVs are highly capable of generating similar profiles of EOG with more than 99 % of similarities. Modulating the fan power set points for creating the EHS and EVSs shows consistent results, with around 97 % and 94 % similarities.
An experimental study has been carried out to investigate the effect of transient extreme operating conditions based on the IEC standard (specifically EWSs and EOG) tailored and scaled for a 2.2 m diameter HAWT at the WindEEE dome at Western University. The main assumption used for the length and time scaling is that the duration of each extreme condition is equal to the advection time of the four tip vortex loops in the wake by the free stream. Other parameters were adjusted accordingly to accommodate for hardware limitations in generating the flow fields. Two uniform cases as the baselines for comparing the effect of different scenarios were also carried out.
The unsteady EVSs and EHS did not have any noticeable effect on the power performance and overall loading at the base of the turbine. Nevertheless, EHS induced a significant yaw moment on the structure. These extreme shears could induce severe fatigue loads at the blade bearings, blade roots and yaw bearing. Having load cells at the blade roots and nacelle–tower junction or yaw bearing could have given more information about the load dynamics and the out-of-plane moment in these scenarios.
The EOG affects the turbine significantly. Results showed that the power generation and loadings can increase significantly with a high dynamic behaviour. In the EOG event, the loading profiles are correlated with the shape of the gust event itself (the peak of the loads are at the same point as the gust peak), but the power generation's peak happens at the end of the gust event.
Overall, this study presents an alternative experimental procedure for investigating the global loading and power generation of a wind turbine under scaled reproducible deterministic transient wind conditions. The procedure has the potential to be improved upon and used for developing and testing new wind energy prototypes in transient conditions.
In future work, for the EVS and EHS cases it is advisable to investigate the loads on the blade roots and bearings as well as yaw bearing to implement a fatigue load analysis. In the present study the TSR was determined from wake effect scaling and physical limits of the test apparatus, resulting in a TSR ∼ 1.1. In future work, an attempt should be made to test at higher TSR through test apparatus and controller modifications. Testing of the effect of different extreme event durations at different operating TSRs would help validate the suggested time scaling.
Code is available upon request.
Data are available upon request.
The supplement related to this article is available online at: https://doi.org/10.5194/wes-6-477-2021-supplement.
KS carried out all the experiments with supervision of HH. KS wrote the main body of the paper with input from all authors.
The authors declare that they have no conflict of interest.
All authors thank Gerald Dafoe and Tristan Cormier for helping with the measurement setups, with special thanks to George Sakona for calibration of the load sensor. The present work is supported by the WindEEE dome CFI grant and by NSERC Discovery Grant R2811A03.
The present work is supported by the WindEEE dome CFI grant and by NSERC Discovery Grant R2811A03.
This paper was edited by Alessandro Bianchini and reviewed by Rodrigo Soto and one anonymous referee.
Albers, A., Jakobi, T., Rohden, R., and Stoltenjohannes, J.: Influence of meteorological variables on measured wind turbine power curves, in: European Wind Energy Conference and Exhibition 2007, vol. 3., EWEC 2007, May 2007, Milan, Italy, 2007.
Anvari, M., Lohmann, G., Wächter, M., Milan, P., Lorenz, E., Heinemann, D., Tabar, M. R. R., and Peinke, J.: Short term fluctuations of wind and solar power systems, New J. Phys., 18, 063027, https://doi.org/10.1088/1367-2630/18/6/063027, 2016.
Bossanyi, E. A., Kumar, A., and Hugues-Salas, O.: Wind turbine control applications of turbine-mounted LIDAR, J. Phys.: Conf. Ser., 555, 012011, https://doi.org/10.1088/1742-6596/555/1/012011, 2014.
Burton, T., Jenkins, N., Sharpe, D., and Bossanyi, E.: Wind Energy Handbook, 2nd Edn., John Wiley and Sons Ltd, Chichester, UK., 2011.
Cai, X., Gu, R., Pan, P., and Zhu, J.: Unsteady aerodynamics simulation of a full-scale horizontal axis wind turbine using CFD methodology, Energy Convers. Manage., 112, 146–156, https://doi.org/10.1016/j.enconman.2015.12.084, 2016.
Chowdhury, J., Chowdhury, J., Parvu, D., Karami, M., and Hangan, H.: Wind flow characteristics of a model downburst, in: Fluids Engineering Division Summer Meeting, 51555, V001T03A005, 2018.
Feng, Y., Qiu, Y., Crabtree, C. J., Long, H., and Tavner, P. J.: Monitoring wind turbine gearboxes, Wind Energy, 16, 728–740, https://doi.org/10.1002/we.1521, 2013.
Hangan, H., Refan, M., Jubayer, C., Romanic, D., Parvu, D., LoTufo, J., and Costache, A.: Novel techniques in wind engineering, J. Wind Eng. Indust. Aerodynam., 171, 12–33, https://doi.org/10.1016/j.jweia.2017.09.010, 2017.
IEC – International Electrotechnical Commission: IEC 61400-1: Wind turbines – Part 1: Design requirements, 3rd Edn., Geneva, Switzerland, 2005.
IEC – International Electrotechnical Commission: IEC 61400-1: Wind energy generation systems – Part 1: Design requirements, 4th Edn., Geneva, Switzerland, 2019.
Li, L., Hearst, R. J., Ferreira, M. A., and Ganapathisubramani, B.: The near-field of a lab-scale wind turbine in tailored turbulent shear flows, Renew. Energy, 149, 735–748, https://doi.org/10.1016/j.renene.2019.12.049, 2020.
Milan, P., Wächter, M., and Peinke, J.: Turbulent Character of Wind Energy, Phys. Rev. Lett., 110, 138701, https://doi.org/10.1103/PhysRevLett.110.138701, 2013.
Petrović, V., Berger, F., Neuhaus, L., Hölling, M., and Kühn, M.: Wind tunnel setup for experimental validation of wind turbine control concepts under tailor-made reproducible wind conditions, J. Phys.: Conf. Ser., 1222, 012013, https://doi.org/10.1088/1742-6596/1222/1/012013, 2019.
Pope, S. B.: Turbulent scalar mixing processes, Cambridge University Press, Cambridge, 2000.
Refan, M. and Hangan, H.: Aerodynamic Performance of a Small Horizontal Axis Wind Turbine, J. Solar Energ. Eng., 134, 021013, https://doi.org/10.1115/1.4005751, 2012.
Rezaeiha, A., Pereira, R., and Kotsonis, M.: Fluctuations of angle of attack and lift coefficient and the resultant fatigue loads for a large Horizontal Axis Wind turbine, Renew. Energy, 114, 904–916, https://doi.org/10.1016/j.renene.2017.07.101, 2017.
Schottler, J., Reinke, N., Hölling, A., Whale, J., Peinke, J., and Hölling, M.: On the impact of non-Gaussian wind statistics on wind turbines – an experimental approach, Wind Energ. Sci., 2, 1–13, https://doi.org/10.5194/wes-2-1-2017, 2017.
Sezer-Uzol, N. and Uzol, O.: Effect of steady and transient wind shear on the wake structure and performance of a horizontal axis wind turbine rotor, Wind Energy, 16, 1–17, https://doi.org/10.1002/we.514, 2013.
Shirzadeh, K., Hangan, H., and Crawford, C.: Experimental and numerical simulation of extreme operational conditions for horizontal axis wind turbines based on the IEC standard, Wind Energ. Sci., 5, 1755–1770, https://doi.org/10.5194/wes-5-1755-2020, 2020.
TFI Ltd.: Cobra Probe, Turbulent Flow Instrumentation Pty Ltd, available at: https://www.turbulentflow.com.au/Products/CobraProbe/CobraProbe.php (last access: 12 June 2020), 2011.
Tran, T. T. D. and Smith, A. D.: Incorporating performance-based global sensitivity and uncertainty analysis into LCOE calculations for emerging renewable energy technologies, Appl. Energy, 216, 157–171, https://doi.org/10.1016/j.apenergy.2018.02.024, 2018.
Wächter, M., Heißelmann, H., Hölling, M., Morales, A., Milan, P., Mücke, T., Peinke, J., Reinke, N., and Rinn, P.: The turbulent nature of the atmospheric boundary layer and its impact on the wind energy conversion process, J. Turbulence, 13, N26, https://doi.org/10.1080/14685248.2012.696118, 2012.
Wester, T. T. B., Kampers, G., Gülker, G., Peinke, J., Cordes, U., Tropea, C., and Hölling, M.: High speed PIV measurements of an adaptive camber airfoil under highly gusty inflow conditions, J. Phys.: Conf. Ser., 1037, 072007, https://doi.org/10.1088/1742-6596/1037/7/072007, 2018.


