the Creative Commons Attribution 4.0 License.
the Creative Commons Attribution 4.0 License.
 | 02 Jun 2022
Damage equivalent load synthesis and stochastic extrapolation for fatigue life validation
Present verification of the fatigue life margins on wind turbine structures utilizes damage equivalent load (DEL) computations over a limited time duration. In this article, a procedure to determine long-term fatigue damage and remaining life is presented as a combination of stochastic extrapolation of the 10 min DEL to determine its probability of exceedance and computationally fast synthesis of DELs using level crossings of a Gaussian process. Both the synthesis of DELs and long-term stochastic extrapolation are validated using measured loads from a wind farm. The extrapolation for the blade root flap and tower base fore–aft damage equivalent moment is presented using a three-parameter Weibull distribution, whereby the long-term damage equivalent load levels are forecast for both simulated and measured values. The damage equivalent load magnitude at a selected target probability of exceedance provides an indicator of the integrity of the structure for the next year. The extrapolated damage equivalent load over a year is validated using measured multi-year damage equivalent loads from a turbine in the Lillgrund wind farm, which is subject to wakes. The simulation of damage equivalent loads using the method of level crossings of a Gaussian process is shown to be able to reconstruct the damage equivalent load for both blade root and tower base moments. The prediction of the tower base fore–aft DEL is demonstrated to be feasible when using the Vanmarcke correction for very narrow band processes. The combined method of fast damage equivalent load computations and stochastic extrapolation to the next year allows a quick and accurate forecasting of structural integrity of operational wind turbines.
- Article
(4094 KB) - Full-text XML
- BibTeX
- EndNote


The fatigue damage on wind turbine structures is strongly influenced by the stochastic inflow to the turbine, which is mainly composed of wind turbulence and spatial variations such as shear and veer (Dimitrov et al., 2017). For offshore substructures, irregular ocean waves also result in dynamic loads leading to fatigue damage. The Palmgren–Miner rule (Miner, 1945) is the standard approach followed in the design of wind turbines by which it is ensured that the linear damage sum over an intended lifetime is lower than unity after considering required safety margins. Since the Miner damage variable is not a physically measurable quantity, a substitute for damage is used, which is the damage equivalent load (DEL). This is the load level at a particular number of cycles which results in the same damage as the original summation of a multitude of different load cycles with different amplitudes. Damage equivalent load provides a measurable quantity from an operating turbine that can be compared with results from simulations made in the design phase, whereas Miner's damage is an abstract quantity of the ratio of the number of cycles that is difficult to quantify. Therefore verification of fatigue life on wind farms is usually made using DELs and not damage.
The conventional wind turbine fatigue design process considers a set of aeroelastic load simulation results under normal operation and transients and standstill under normal turbulence conditions, whereby the load cycles determined over a short period of time at each mean wind speed are assumed to repeat continually over the turbine's full expected lifetime. However, it is seldom accurate to consider that the load cycle amplitudes and cycle counts seen in simulations of a few hours (depending on the number of turbulence seeds) can be taken to repeat over 25 years, a typical wind farm lifetime. The International Electrotechnical Commission (IEC) 61400-1 standard (IEC, 2019) informally recommends a stochastic extrapolation process to determine the amplitude and cycle count of the largest amplitude loads as part of the fatigue design process. Moriarty et al. (2004) used extrapolation of load amplitudes to determine the long-term fatigue damage equivalent load, in a manner similar to extreme load extrapolation. Since the load amplitude is extrapolated, the probability of the load amplitude and number of cycles is conditional on the joint distribution of turbulence and mean wind speed. However the DEL is insensitive to isolated changes in load amplitudes for fixed wind turbulence, and therefore extrapolation using the load amplitudes may be conservative as such a process also takes into account isolated amplitude extremes within 10 min. Load measurements from wind farms show a wide variation in damage equivalent loads, much more than seen in the conventional design process due to varying inflow turbulence. The question then needs to be addressed as to whether larger damage equivalent loads seen in measurements as compared to simulated values encountered in the design process using limited load simulations are indicative of reduced structural reliability and decreased lifetime.
To better quantify fatigue life over a long time, it is needed to perform stochastic extrapolation of the short-term DELs to determine the probability of exceeding the DEL magnitude over the long term and thereby determine the life of the structure. In the present work, the DEL itself is extrapolated as a stochastic variable and taken to be fully correlated to the wind turbulence. The DEL being an aggregated quantity is not affected by isolated changes in load amplitudes over 10 min, but the change in DEL that is modeled is due to change in turbulence at a given mean wind speed. Therefore, the probability distribution of DEL is conditional only on the mean wind speed, as is the case with wind turbulence. Extrapolation of extreme loads (Natarajan and Verelst, 2012) is mandated by IEC 61400-1 to determine the 50-year ultimate design load level, but there is no mandatory requirement presently to extrapolate fatigue DEL. The DEL is an aggregated quantity over a period of 10 min or more, the value of which is relatively stable and may not change significantly for isolated load excursions resulting from the randomness of a stationary process. However, the real conditions on the wind farm have varying wind turbulence intensities for a given mean wind speed, thus resulting in varying damage equivalent loads. The resulting DEL values from different 10 min simulations over different wind turbulence at a given mean wind speed can be extrapolated so that the probability of exceeding a target damage equivalent load level over a long-term period can be determined. This is more accurate and realistic than the conventional process used today of assuming that the same load cycles over a limited set of load simulations are prevalent for the entire life of the turbine.
The fatigue damage as expressed in terms of the DEL is strongly dependent on the wakes within wind farms (Gallinos et al., 2016) due to strong correlation of several load components with the wind turbulence in the wake. This implies that varying atmospheric conditions such as the wind direction and stability can influence the wake turbulence and thereby also change the DELs on the turbine of interest. Since the turbulence in wakes is a function of a multitude of variables such as the turbine position, the wind direction, upstream turbine thrust, and upstream turbine yaw, it is not readily feasible to quantify the cumulative distribution function (CDF) of the wake turbulence. Herein, a novel approach is put forward to determine the return period of the DEL magnitudes conditional on the mean wind speed, wherein the variation in the DEL is considered to directly correlate to the variation in the wake turbulence. It is also common that many wind farms possess a wind turbine that is instrumented with load sensors and from which only the 10 min load statistics are archived. This usually implies the 10 min mean, standard deviation, maximum, and minimum are available. The DEL is often not stored, as its computation requires rainflow counting or similar procedures to be available on the turbine computer, which is often not the case. In such situations, it is essential that the DEL can be computed from the measured standard deviations of the loads. This is not a prevalent practice but is straightforward to map the standard deviation of loads to the DEL if the underlying stochastic process is assumed to be Gaussian or Poisson. In the following sections, the 1-year DEL at the blade root and tower base of wind turbines in a farm is predicted both using stochastic extrapolation of the measured DEL and through synthesis of the DELs using the measured load standard deviations over limited intervals. The method of synthesis of DELs using 10 min statistics also allows the computation of DELs without the need for detailed turbine information to be present, such as is required for an aeroelastic model. This allows the wind farm owner to simulate DELs quickly without access to detailed turbine information that is possessed only by the wind turbine manufacturer.
Some authors refer to extrapolation to imply the prediction of DELs for a future time interval based on measured DELs and wind conditions in the past (Hübler et al., 2018b, a). In the present work, extrapolation of DEL is defined as a stochastic methodology to determine the return period of increasing DEL magnitudes outside the domain of present results. Continuous monitoring and assessment of the turbine structural life is crucial since the costs of unplanned downtime and repairs outweigh the cost of monitoring; also, early correction of wind farm operation ensures safety of structures for their intended lifetime and for life extension. Wind farm operational correction can be carried out by derating upstream wind turbines to reduce the wake turbulence generated by those turbines and thus lower loads on the downstream wind turbines (Dimitrov and Natarajan, 2021; Munters and Meyers, 2018). In the next sections, the ability to use measured or simulated 10 min load statistics to directly quantify DELs and the use of the stochastic extrapolation methodology to forecast the return period of DELs are explained, which leads to a criterion to determine if the measured DELs on a wind turbine are within design limits.
Given load cycles over 10 min intervals as obtained through rainflow counting of the output time series of aeroelastic simulations, the annual 10 min damage equivalent load at a given mean wind speed bin is conventionally computed as
where Nv is the number of hours in a year at the mean wind speed; Neq is the equivalent number of cycles, v; ni is the number of load cycles of amplitude, Li; and m is an exponent of the SN curve of the material. The load time series used to compute ni and Li in Eq. (1) are conventionally results from rainflow counting of limited aeroelastic simulations performed under conditions important for fatigue damage. The duration of the load time series over all mean wind speeds and operational conditions simulated is seldom more than a few days, and the same load cycles are assumed equivalently prevalent for the lifetime of the wind turbine. In practice, a load measurement campaign will provide a wide scatter in DELs (Barber et al., 2016), so it may be difficult to ascertain, based on the limited simulations, the design DEL value that is to be considered for assuring that the magnitude of the measured DELs are within acceptable limits to ensure structural integrity. Instead of assuming the same limited number of load cycles repeated for the lifetime of the turbine in Eq. (1), it is more realistic to determine the probability of exceedance of DELs over a period and thereby determine the number of cycles for each DEL magnitude.
While frequency domain DEL computation methods such as Dirlik's method (Ragan and Manuel, 2007) have been used by some, these methods require knowledge of the load spectrum and may not always be the best choice for design validation due to erroneous spectra. On the other hand, level-crossing methods need not always require availability of the process spectrum. If the 10 min statistics of the standard deviation, maxima, and minima of loads are available, then assuming the load amplitude can be expressed as a Gaussian process, the probability of crossing an amplitude level, Li, follows a Rayleigh distribution (Meirovitch, 2001); that is
where
Here gi is the number of standard deviations, σL, away from the mean, μL. The number of load cycles with amplitude greater than Li (upcrossings) is given by (Meirovitch, 2001)
where ν is the mean crossing frequency, which here will be assumed to be the first rotational frequency (P) of the rotor for the blade flap loads and the first natural frequency for the tower base in the loading direction of interest. Based on the Rayleigh distribution decay rate, a load amplitude bin can be determined which provides one load cycle in that amplitude bin; that is the number of upcrossings of level Li minus upcrossings of Li+ΔLi is unity. Equations (3) and (4) assume a Gaussian process with a single mean crossing frequency of interest. For broadband Gaussian processes or Poisson processes, the methods of Cramer–Leadbetter (Cramer and Leadbetter, 1967) can be used, which have also been proven for extreme value analysis (Madsen et al., 1986). However for highly damped structures, the energy in the stochastic response is representative of a very narrow band process, and in such cases, Eq. (4) can overly magnify the rate of level crossings. Vanmarcke (1975) prescribed a correction factor to accurately determine the level crossings of very narrow band processes, which states that the rate of crossings of such a process is
where
α is the Vanmarcke bandwidth parameter, which for a very narrow band process will approach unity. The Vanmarcke correction regulates the peak crossings of different load levels by conditioning them on the bandwidth parameter α. Thus this correction can be directly applied for the computation of DELs of processes with different bandwidths.
For a Gaussian process with a known standard deviation, Eq. (1) can also be written as
We assume gi is a standardized random normal variable between recorded loads that provides a unit cycle for each amplitude level. Equation (7) in combination with Eqs. (4)–(6) allows very fast computation of the damage equivalent load over a time interval of relevance, without the need for aeroelastic load simulations. The only inputs needed are the 10 min mean, standard deviation, minimum and maximum load levels, and the dynamic frequency of interest. This also implies that the DEL values over several input wind conditions (wind turbulence, mean wind speed) can be determined over a long time, without limiting the DEL to only a few 10 min computations per mean wind speed as is the practice today.
2.1 Extrapolation of fatigue
The DEL values show a wide scatter based on the varying inflow turbulence due to wake conditions and other contributions at any given mean wind speed. While knowledge of the 10 min load statistics will enable the ready reconstruction of the DEL as per the previous section, it is also essential to determine the probability of exceedance of a DEL magnitude, that is, to determine the magnitude of the DEL that can possess a 1-year return period or a 10-year return period. The DEL is a stochastic variable that is dependent on wind turbulence, wind direction, etc., and herein it is assumed that the DEL follows a Weibull distribution with three parameters. Hoole et al. (2019) showed that the three-parameter Weibull distribution was more accurate in modeling fatigue life as compared to two-parameter distributions. Extrapolation of the tail of the Weibull distribution will provide the long-term DEL values and the corresponding return period for those values. The cumulative distribution function (CDF) of the DEL magnitudes over different 10 min intervals may be determined using their median rank (Hoole et al., 2019), from which a three-parameter Weibull distribution can be fit, whereby the probability of a damage equivalent load magnitude, d, is given as
The three-parameter Weibull distribution is fit to the median rank, which can be computed using DEL values from aeroelastic simulations, from field measurements, or as obtained with the Gaussian process approach described in the previous subsection. The median rank is fit to measured or simulated DEL using the empirical relationship for Weibull distributions:
where i is the sorted rank of the load Li and N is the number of DEL values used in the fitting process.
Extrapolation of the fitted CDF is made to a minimum of a 1-year return period, whereby the DEL magnitude with a 1-year return period is identified. This provides a readily implementable technique to compute the DEL for a long duration of at least 1 year without requiring simulation of the full period. It also provides a robust DEL value over a long time, rather than applying the conventional methodology used in practice (IEC, 2019) of simulating loads for a minimal duration and assuming the same load cycles are applicable for the full lifetime.
The results from stochastic extrapolation of simulated blade root flap damage equivalent moment, obtained from limited aeroelastic simulations, are shown in Fig. 1. The extrapolation in Fig. 1 uses Eqs. (8) and (9) at a mean wind speed of 10 m s−1 using simulated blade root moments under normal turbulence inflow. Figure 1 shows that the extrapolation of the probability of exceedance monotonically reduces up to very low values of 10−15, and this methodology can therefore be used to extrapolate DELs across different mean wind speeds and wind turbulence levels to their asymptotic target probability of exceedance.
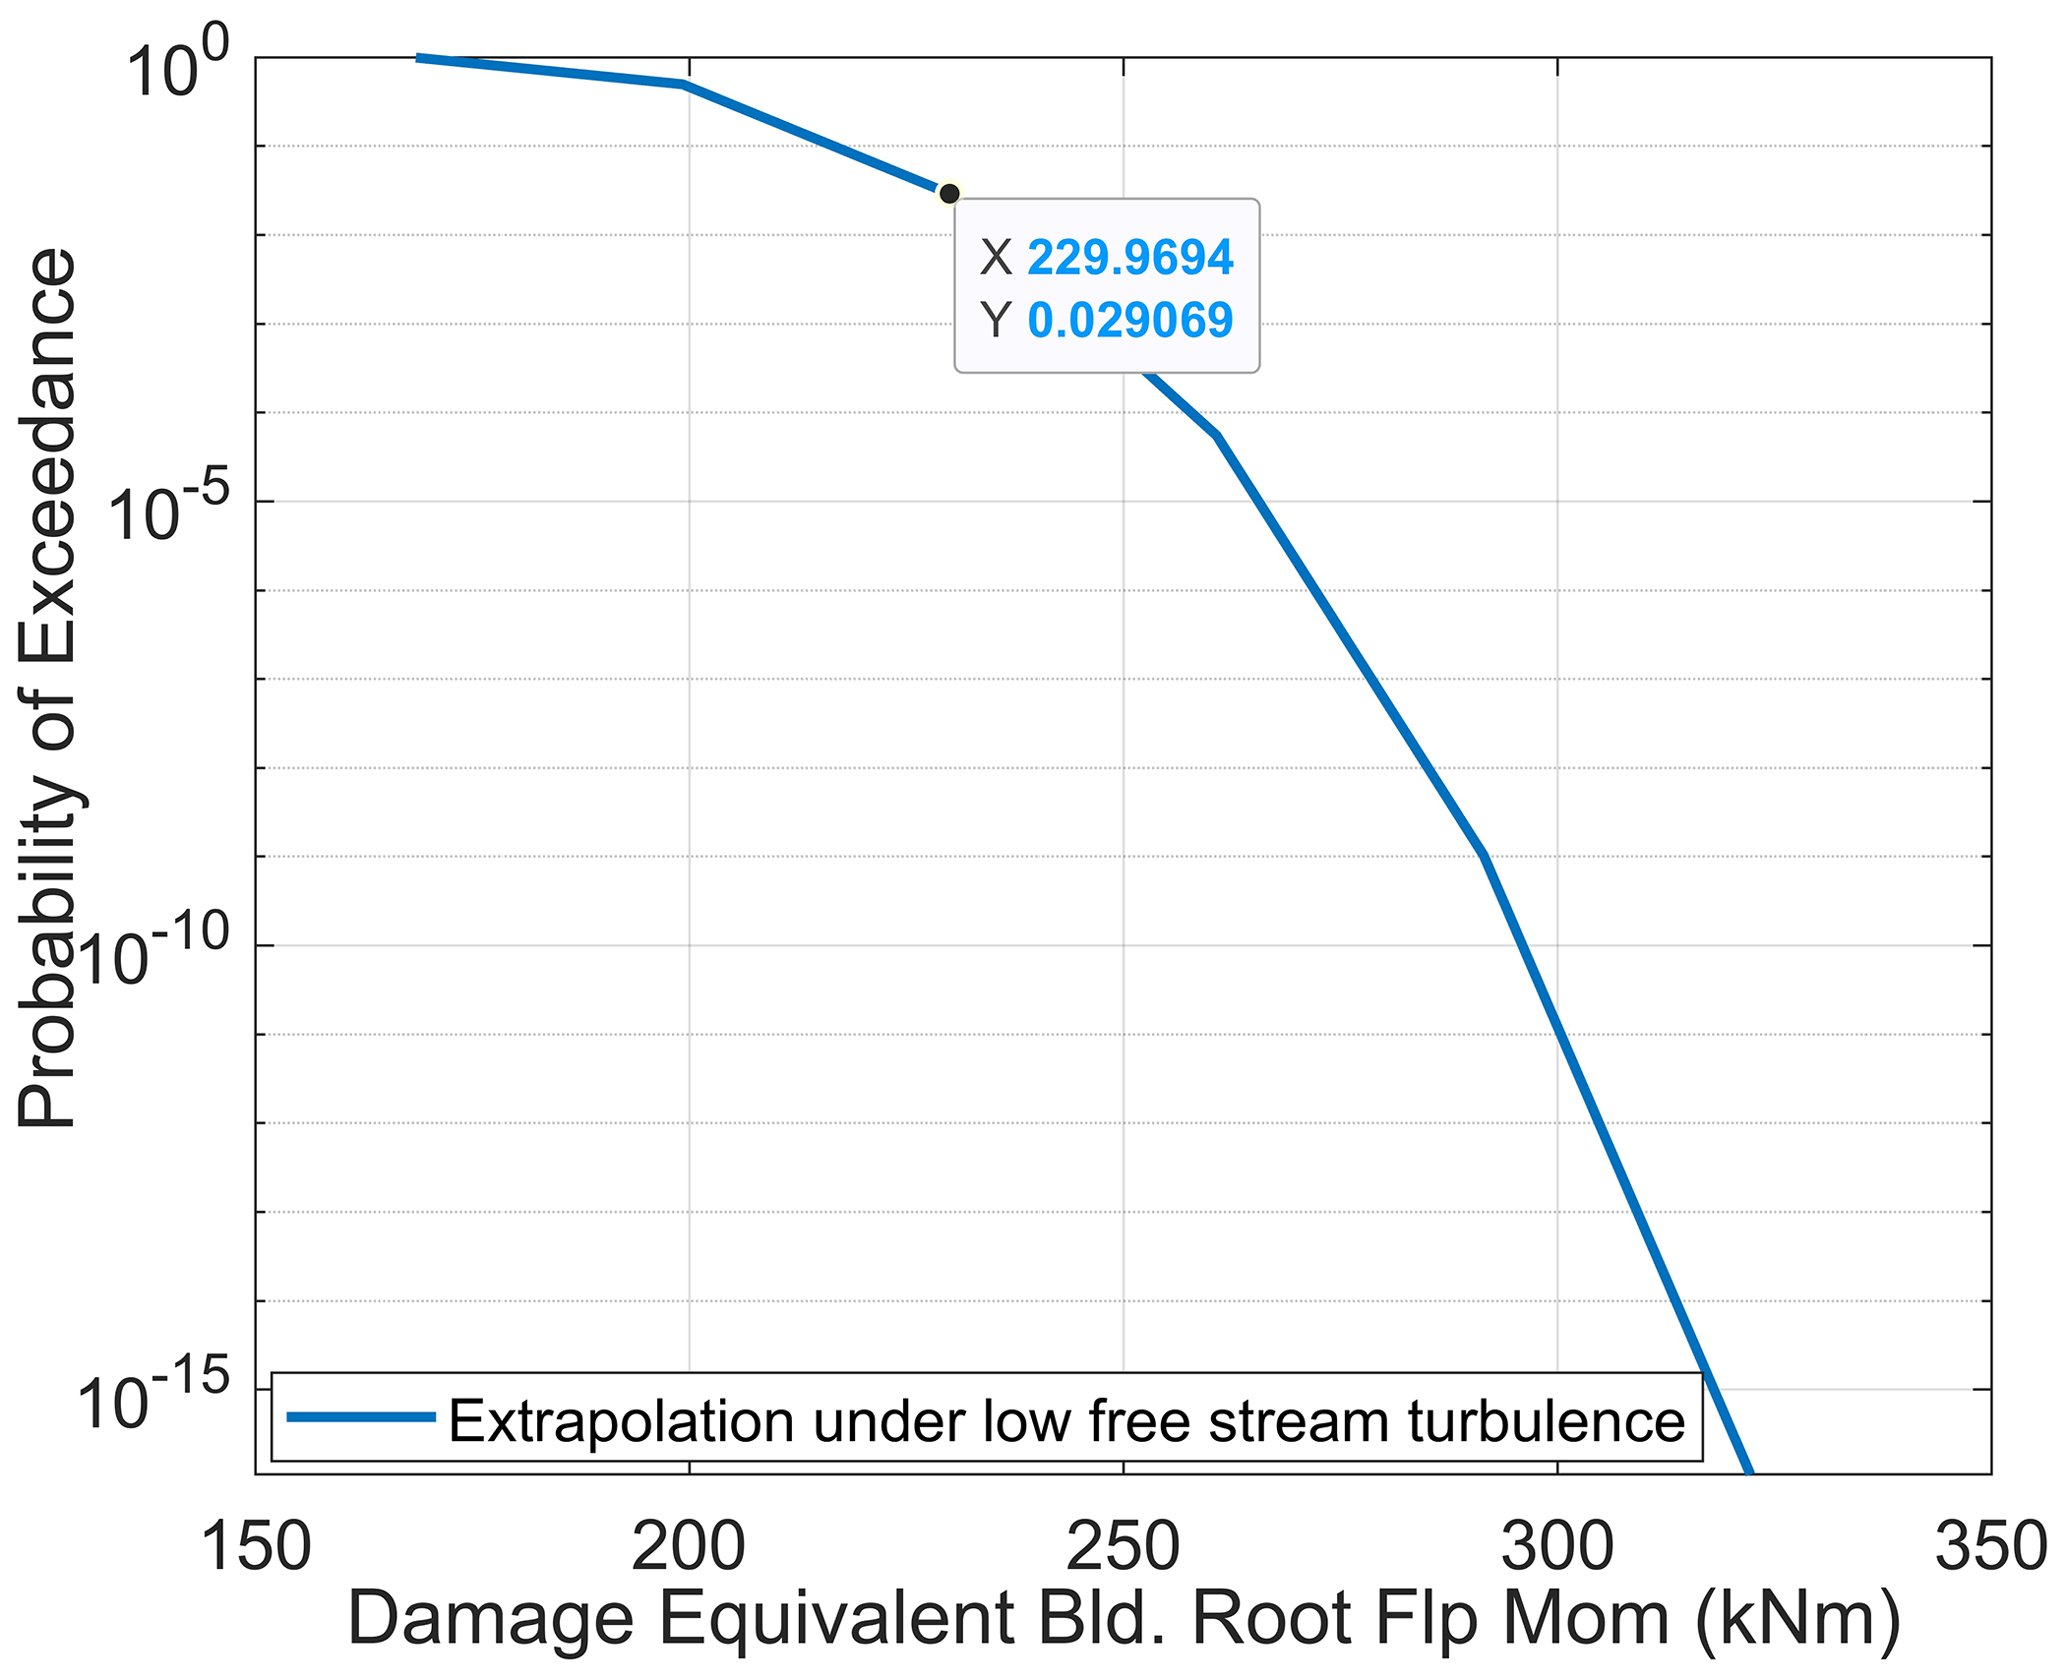
Figure 1Blade root flap damage equivalent moment extrapolation at 10 m s−1 for low wind turbulence.
2.2 Measurement data
Loads and supervisory control and data acquisition (SCADA) measurements from a 2.3 MW wind turbine within the Lillgrund offshore wind farm (Dimitrov and Natarajan, 2021) are used in the validation of the methodology described in the above subsections. The blade root and tower base loads on a fully instrumented turbine (C-08) that is the middle turbine in the bottom row shown in Fig. 2 are used in this process. Depending on the wind direction, varying inflow turbulence is experienced by this turbine due to the wake effects, equivalent to added turbulence. This results in a wide scatter in damage equivalent moments at any given mean wind speed, an example of which is shown in Fig. 3.
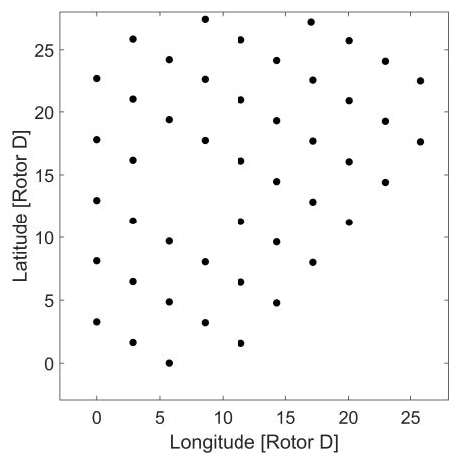
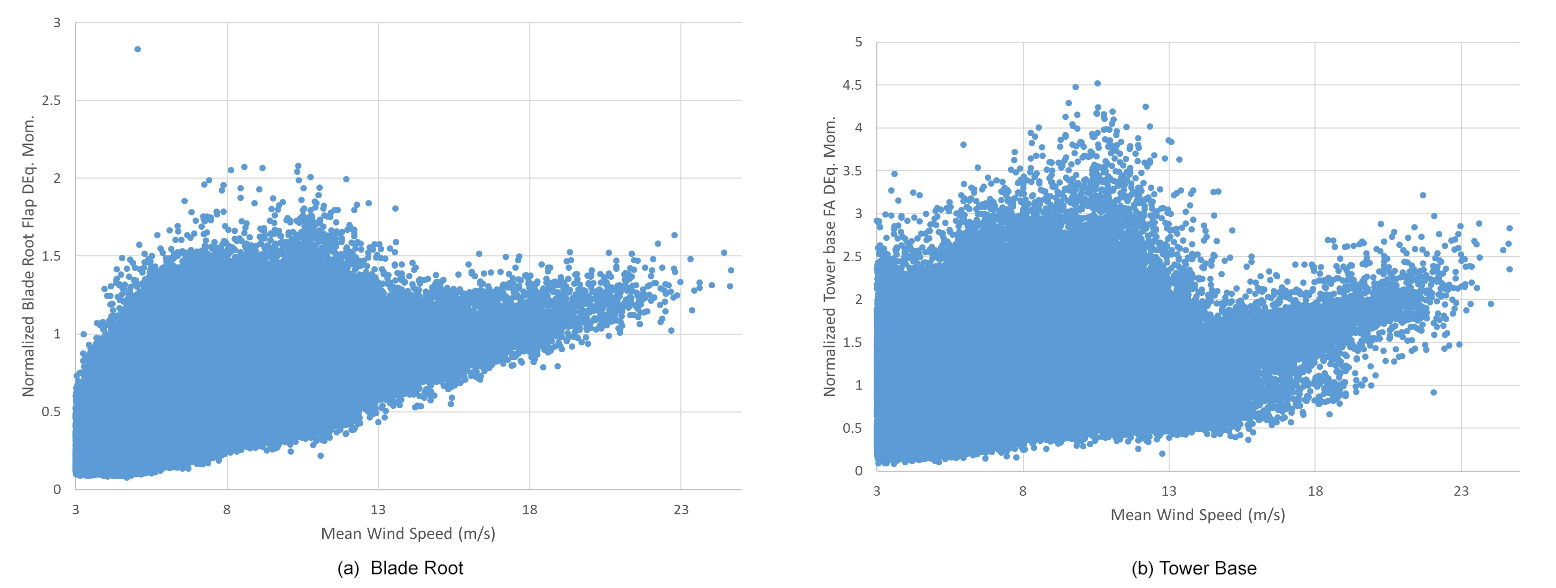
Figure 3Measured 10 min (a) blade root flap and (b) tower base fore–aft damage equivalent moments, on the C-08 turbine. The coefficient of variation (CoV) of blade root flap DELs below rated wind speed is 0.49 and above rated wind speed is 0.17. The CoV of tower base fore–aft (FA) DELs below rated wind speed is 0.47 and above rated wind speed is 0.29.
Simulated DEL using the conventional tools depicted in Fig. 4 does not provide such a variation as seen in Fig. 3 due to limited 10 min samples, and therefore the stochastic models in Eqs. (4)–(6) are needed to replicate the variation in DEL seen in measurements. Extrapolation to a 1-year probability of exceedance is made using both a small subset of the measured DELs and a stochastic simulation set. The 1-year extrapolated DEL values for both the tower base and the blade root are validated with the measured DELs over a year.
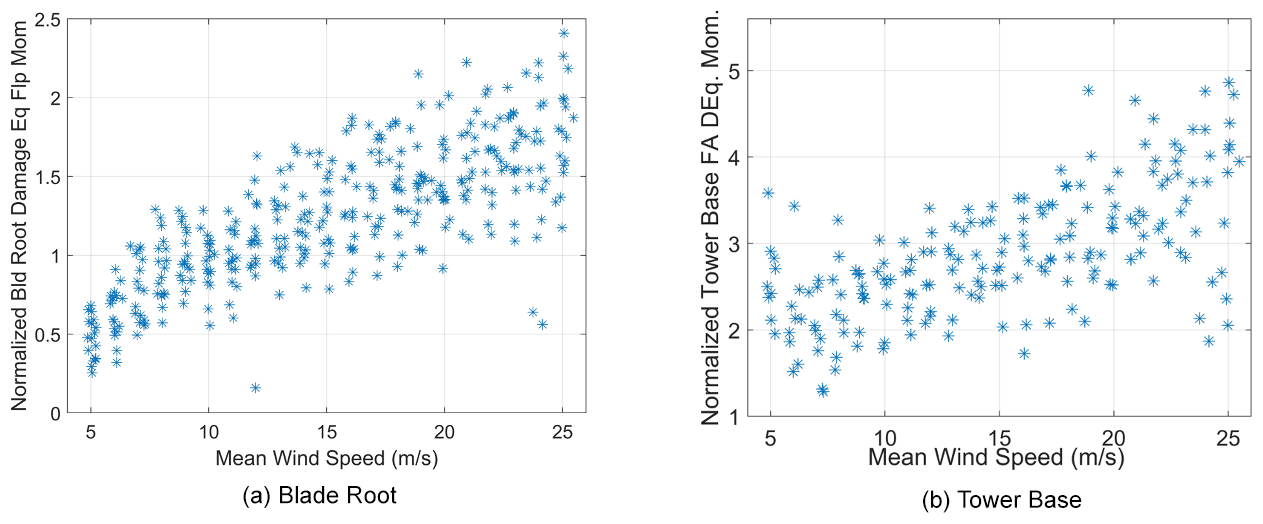
Figure 4Simulated 10 min (a) blade root flap damage equivalent moment and (b) tower base fore–aft damage equivalent moment, over different mean wind speeds and turbulence. The CoV of blade root flap DELs below rated wind speed is 0.31 and above rated wind speed is 0.22. The CoV of tower base FA DELs below rated wind speed is 0.31 and above rated wind speed is 0.23.
The blade root flap moment and the tower base fore–aft moment are the main focus points, as these two moments are strongly driven by wind turbulence and wake effects. The life consumption of the blade and support structure within a wind farm are highly dependent on these load components. For the blade root flap moment, the primary frequency of interest for fatigue damage is the rotor rotational speed, or the “P” frequency. While the blade flap moments also contain multiples of P, such as 2P or 3P, these are of much lower energy content and the primary energy content is the P frequency. For the support structure, the primary excitation frequency is usually the first natural frequency of the structure. It is assumed that the turbine designs have been made as to not result in resonant excitation. While the tower fore–aft moment spectra have a peak at their natural frequency, it is assumed that this is not caused by excitation from rotor harmonics, such as 3P.
Under the above conditions of turbine operation, the blade root flap damage equivalent moment is narrow-band Gaussian and the tower base fore–aft damage equivalent moment is equivalent to a very narrow band Gaussian process. The reason for the very narrow band assumption for the tower base fore–aft moment is due to the strong aerodynamic damping of the support structure during turbine operation, as also later explained through Fig. 9b. This implies that Eq. (4) can be used to compute the DEL cycles for the blade root flap moment and Eqs. (5) and (6) may be used to compute DEL cycles for the tower fore–aft moment. Finally Eq. (7) is used to compute the DELs. To validate the above assumptions, the computed DELs are compared for each 10 min period for a variety of wind and wake conditions over a year with the respective measured DELs.
Further time-domain aeroelastic simulations using the HAWC2 software (Larsen and Hansen, 2012) are also made to compute the blade root and tower base damage equivalent moments of the 2.3 MW wind turbine. The DELs obtained from all three methods, that is, Gaussian process analysis, aeroelastic simulations, and field measurements, are extrapolated to determine the 1-year DEL value. Based on this extrapolation, a criterion is established in the following sections that allows lifetime assessment of blades and towers.
4.1 Extrapolation with measured loads and comparisons with aeroelastic simulation results
Figure 3 describes the measured blade root flap damage equivalent moments and tower base fore–aft damage equivalent moments over a 1-year period normalized by a characteristic value and as a function of mean wind speed for turbine C-08. The large spread in the measured DELs is due to the varying turbulence from the wake as a function of wind direction. The turbine loads are also simulated using the properties of the 2.3 MW wind turbine in the HAWC2 aeroelastic tool with the Technical University of Denmark (DTU) controller. Figure 4 depicts the normalized blade root flap and tower base fore–aft DELs using the results from a limited number of aeroelastic load simulations over all IEC 61400-1 turbulence classes and with 12 random seeds of wind turbulence at each mean wind speed. Figure 4 shows a typical number of simulation-based results as made in the final turbine design and type certification.
The scatter observed in Fig. 4 is due to the different IEC class turbulence levels used in the simulation along with the randomness of the turbulence seed, while the scatter in DELs in Fig. 3 is due to the significant difference in turbulence due to different wake situations at different mean wind speeds and in different wind directions. Therefore there is a significantly greater variation in DELs in the measured signals in Fig. 3 versus the simulated DELs in Fig. 4 for most of the wind speeds. In Fig. 3, there are far fewer measurements obtained at the higher mean wind speeds above 14 m s−1 as compared to lower mean wind speeds. Further at higher mean wind speeds, the wake effects in the measurements are reduced due to the lower thrust on the upstream wind turbine, and therefore the variation in turbulence seen by the measurement turbine is smaller at higher mean wind speeds. However the load simulations in Fig. 4 included wind inflow with the highest IEC turbulence class “A” and therefore is supposed to represent a safe upper load level. The question arises as to whether the measured DEL magnitudes on the actual turbine imply that the structures on the turbine are close to their intended fatigue lifetime or that their reliability is sufficiently intact to enable continued operation for further years. This question can be answered only if the probability of exceedance of the DEL magnitudes is assessed. The wind turbine structure is designed to meet a target annual probability of failure in fatigue, and since the DEL is representative of the damage suffered, the probabilities of exceedance of the DEL magnitudes over a 1-year return period are compared.
The stochastic extrapolation of the DELs using the three-parameter Weibull distribution is validated using the measured blade root flap DEL. The measured turbulence variation at each mean wind speed is divided into 50 bins, and one 10 min DEL is taken from each bin to compute the median rank. The three-parameter Weibull distribution is then fit to the resulting median rank subset. This stochastic fit is then extrapolated to a 1-year probability of exceedance and compared with the global median rank of the 1-year measured DELs to validate the approach. The results are shown in Fig. 5 for two different mean wind speeds, wherein it can be seen that the tail of the extrapolated fitted distribution corresponding to the 1-year exceedance probability matches the median rank of the measured DELs very well. This process can therefore be replicated at all mean wind speeds and over all turbulence levels to determine DEL magnitudes with multi-year return periods. The resulting DEL magnitude probability can be weighted with the probability of mean wind speed to determine the DEL over all mean wind speeds.
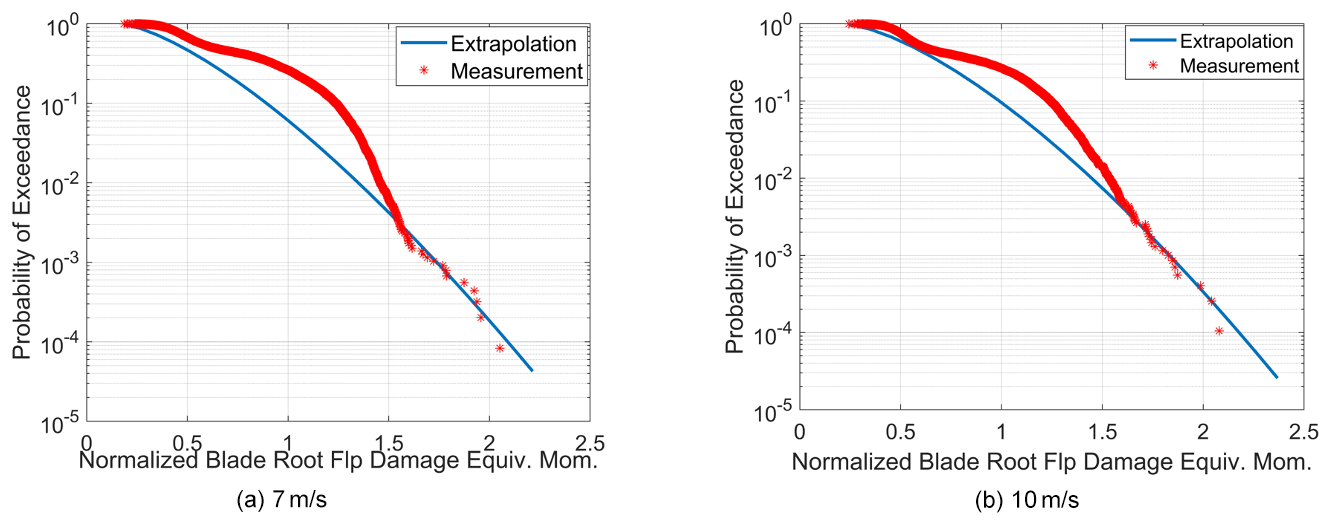
Figure 5Validation of the stochastic extrapolation method with the measured 1-year median rank of the DEL.
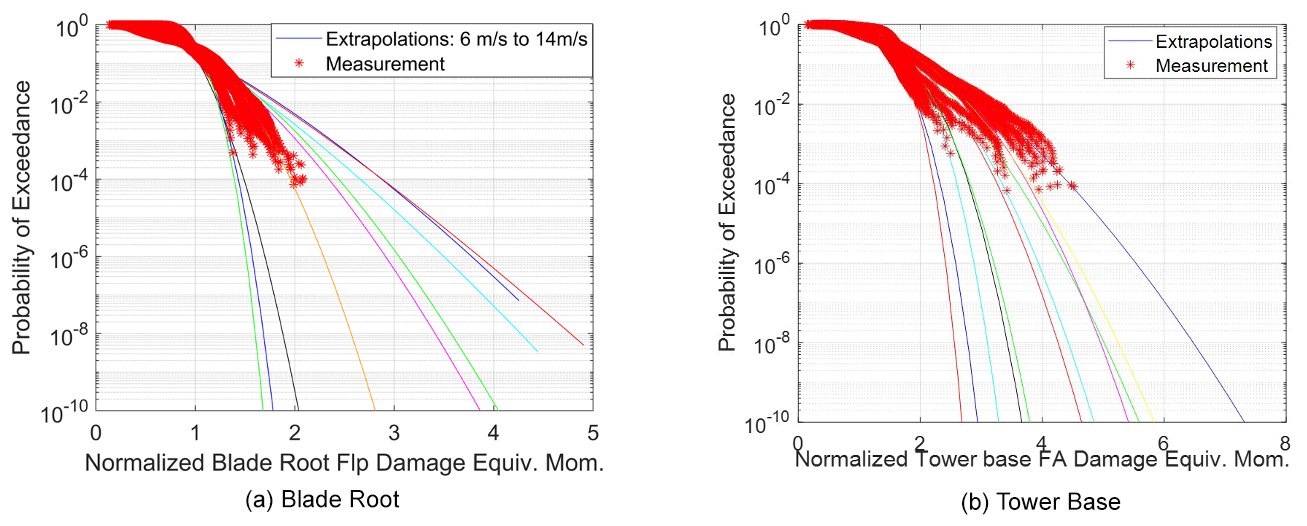
Figure 6Comparison of the 10 min (a) extrapolated blade root flap bending damage equivalent moments and (b) the extrapolated tower base fore–aft damage equivalent moments, using measurements. For the blade root, extrapolated curves begin at the far left (5 m s−1 – lowest DEL), move to the right with increasing mean wind speed until 11 m s−1 (highest DEL), and then move left again with increasing mean wind speed. For the tower base, extrapolated curves begin at the middle at 5 m s−1 and move to the right (highest DEL) until 8 m s−1, before moving to the left again.
The method proposed is applicable for any number of DELs from different load components that are strongly dependent on wind turbulence. While the influence of the tail region is greater for larger material exponents such as for blades, enabling a longer-term DEL prediction, it is not insignificant for steel towers. Therefore the methodology presented herein seeks to use limited load measurements and load simulation results to enable a comparison of the corresponding estimated 1-year DELs between the field installation and design. The long-term DEL magnitude should be bounded with increase in time, and the tail of the DEL should be accurately represented, which is what is shown to be the case in Fig. 5. As can be seen, the rate of increase in DEL reduces significantly with reduction in the probability of exceedance and asymptotically approaches the empirical distribution from the measured DELs. This implies that the desired annual or long-term probability of failure can be actively measured.
Based on the validations shown in Fig. 5, Fig. 6 displays the long-term extrapolated values for the blade root flap damage equivalent moment and tower base damage equivalent moment to very low probabilities of exceedance, from which the DEL magnitude corresponding to the desired exceedance probability can be determined. It can be seen that extrapolation using the three-parameter Weibull distribution reproduces the same trend as the empirical distribution using the measurements while allowing for predicting the DEL magnitudes asymptotically to lower probabilities of exceedance for the blade root and tower base over various mean wind speeds.
The same extrapolation can also be performed using only the simulated DEL values for the same two load sensors, and the results are shown in Fig. 7. The simulated DELs cover all IEC turbulence classes, and these are representative of the turbulence levels experienced by the actual turbine. However the simulated results use the 90 % quantile of turbulence, whereas the measured turbulence covers a range of quantiles. Consequently, it can be compared if the extrapolation using the simulated DELs in Fig. 7 has a higher 1-year DEL magnitude at the 1-year probability of exceedance than the measured 1-year DEL magnitudes over different mean wind speeds. The weighted probability of the DEL with the annual probability of mean wind speeds can be quantified to enable a definite conclusion on a target annual DEL magnitude, above which the turbine structure can be said to possess a diminished annual reliability level.
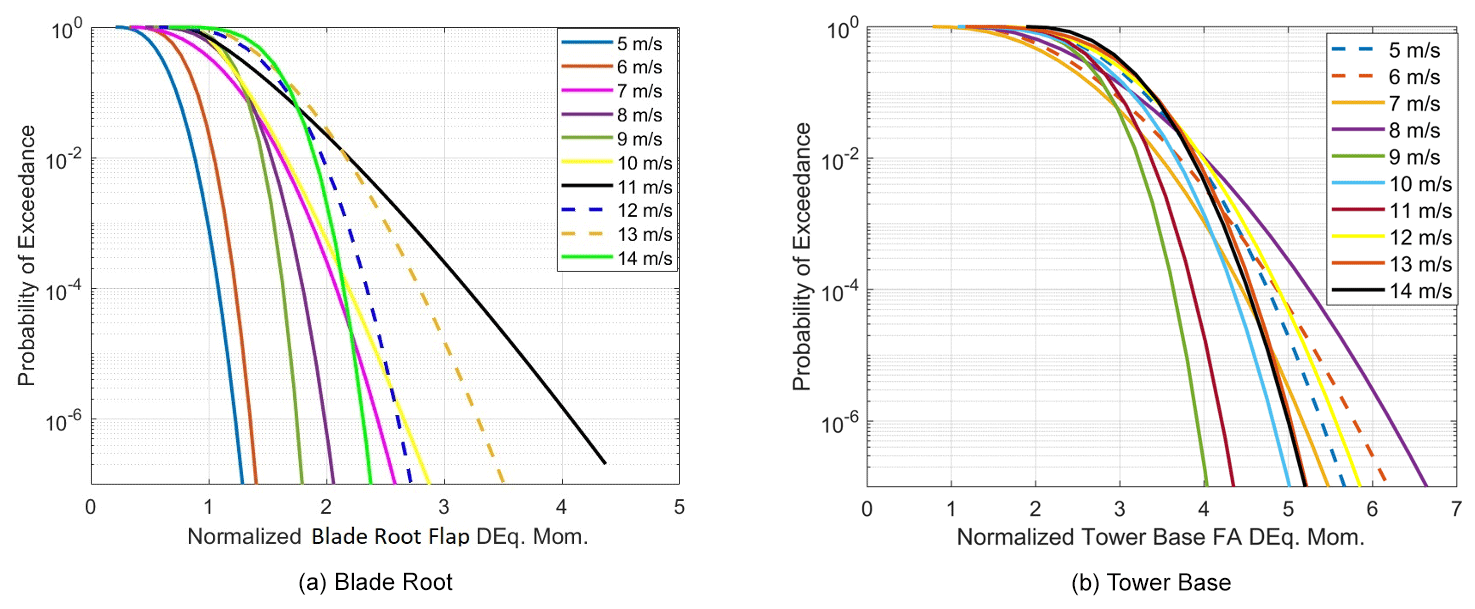
Figure 7Comparison of the 10 min (a) extrapolated blade root flap bending damage equivalent moments and the (b) extrapolated tower base fore–aft damage equivalent moment, using simulations.
It should be noted that while the process of verification of the structural integrity in fatigue is presented, the quantification of the structural reliability or remaining life of the specific operational turbine is not made herein since the actual design loads of the specific turbine used in its design are not available.
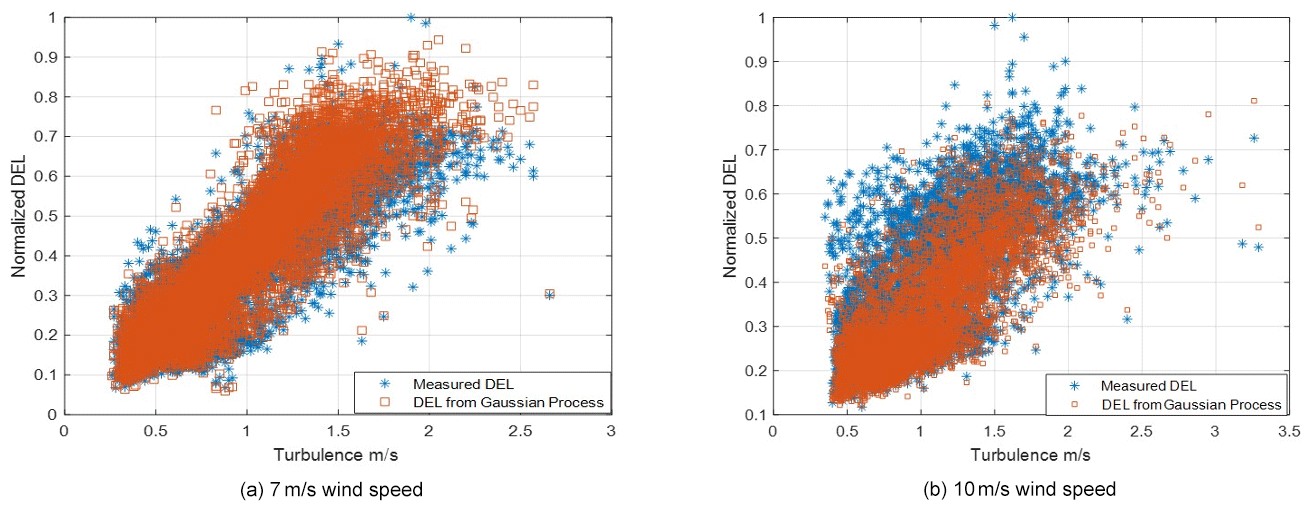
Figure 8Comparison of the 10 min blade root flap bending damage equivalent moments between the Gaussian process method and measurement data on the C-08 turbine.
4.2 Extrapolation with Gaussian process analysis (GPA)
Since aeroelastic simulation is time-consuming and therefore provides limited DEL results, the methods for narrow-band and very narrow band processes as explained in previous sections are used to directly simulate 1 year of DELs for the C-08 wind turbine blade root and tower base. The 10 min measured load statistics are used to determine the DEL values. Using load levels within the measured minimum and maximum load level and using the measured 10 min standard deviation as σL, a 1-year DEL simulation is made using Eqs. (4)–(7), which requires only a few seconds on a standard laptop computer. Many load measurement statistics often do not possess DEL magnitudes, and under such conditions, the DEL magnitudes can be re-created using Eqs. (4)–(7). If measured 10 min load statistics are unavailable, then the aeroelastic simulations can be used to determine a range of mean and standard deviations relevant for the 10 min load magnitudes as a function of mean wind speed and wind turbulence.

Figure 9(a) Comparison of the 10 min tower base fore–aft damage equivalent moment with measurements at 7 m s−1 using the Gaussian process method without Vanmarcke correction. (b) Comparison of the power spectrum of the tower base moment showing the small increase in energy at its first peak with the corresponding much larger peak in the blade root flap moment.
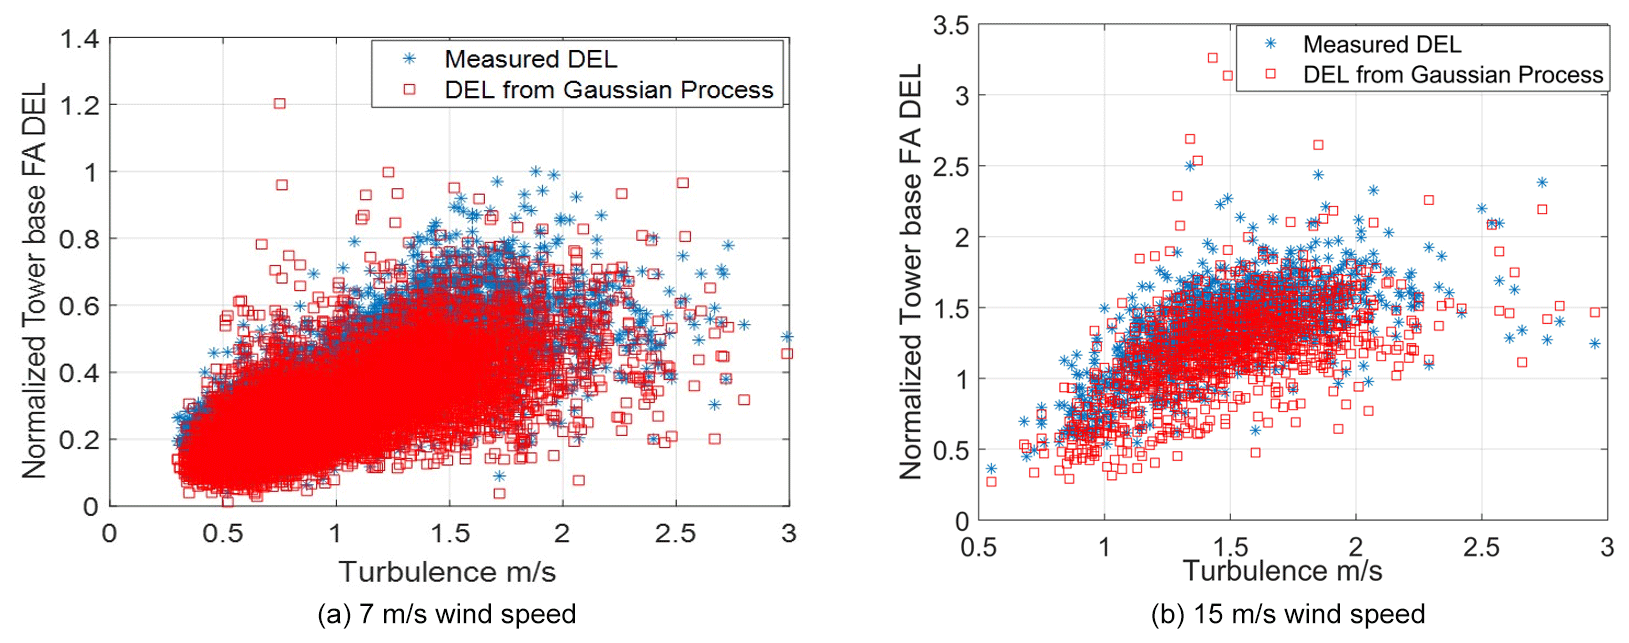
Figure 10Comparison of the 10 min tower base fore–aft bending damage equivalent moments between the Gaussian process method and measurement data on the C-08 turbine.
Figure 8 compares the resulting blade root flap damage equivalent moment from the GPA with the measured DELs at two different mean wind speeds. The results in Fig. 8 show that for all the different wind turbulence variations with various wake angles, the simple Gaussian process analysis provides a similar quantification of the true DEL to that seen in measurements. For these blade root flap DELs, Eq. (4) is used directly without the Vanmarcke correction to obtain the number of crossings of different levels. However if the same method is used (i.e., without the Vanmarcke correction) for the tower base fore–aft damage equivalent moment, then as seen in Fig. 9a, the tower base fore–aft DELs are greatly amplified in comparison to the measured DELs. The power spectrum of the tower base fore–aft (FA) moment is compared with the blade root flap in Fig. 9b, from which it can be seen that the first peak for the tower moment has a much smaller energy rise relative to its starting point than the corresponding first peak in the blade moment, which has an energy jump of about a 100 on the power spectral density (PSD) scale. This is due to significant aerodynamic damping that is not considered in Eq. (4). Therefore the bandwidth of the spectrum needs to be provided in the expression for level crossings, which is exactly what the Vanmarcke correction applies.
The Vanmarcke correction in the limit that α→1 provides the equivalent bandwidth for a highly damped system, and herein α is taken as 0.99 to model the peak crossings of the tower base moment. Figure 10 provides the same comparison for the tower base fore–aft damage equivalent moment, with the Vanmarcke correction, and now a very good match between the DELs computed with this methodology and the measured DELs is seen.
The validation of the simulated DELs with the measurements shown in Figs. 8 and 10 over a year is sufficient justification for considering that the underlying stochastic process is Gaussian. The matching comparisons in Figs. 8 and 10 imply that the results from the GPA can be sampled to also perform a stochastic extrapolation of the DEL magnitudes to obtain a 1-year DEL value or values of even higher return periods. Considering the computation speed of the Gaussian process analysis, it is also possible to directly simulate multi-year damage equivalent moments if the corresponding standard deviation, minimum, and maximum values of the loads are known, for example from past measurements on similar turbines. Figure 11 displays the extrapolated 1-year DEL values for the blade root and tower base with the GPA as compared to measurements and the three-parameter Weibull CDF, where it can be seen that the extrapolation using GPA shows similar trends to using a parametric Weibull fit to data. The empirical DEL using measurements reaches a 1-year probability of exceedance up to 10 m s−1, beyond which the measurements have fewer data. Since the results of GPA tally well with measured DELs for the blade and tower, this method can also be used to detect anomalous wind turbine operation, such as if DEL values that are significantly different from the predictions by GPA are measured. This can happen, for example, if there is tower resonance with the rotor rotational speed or if there is a shutdown of the turbine under high turbulence or other uncommon events.
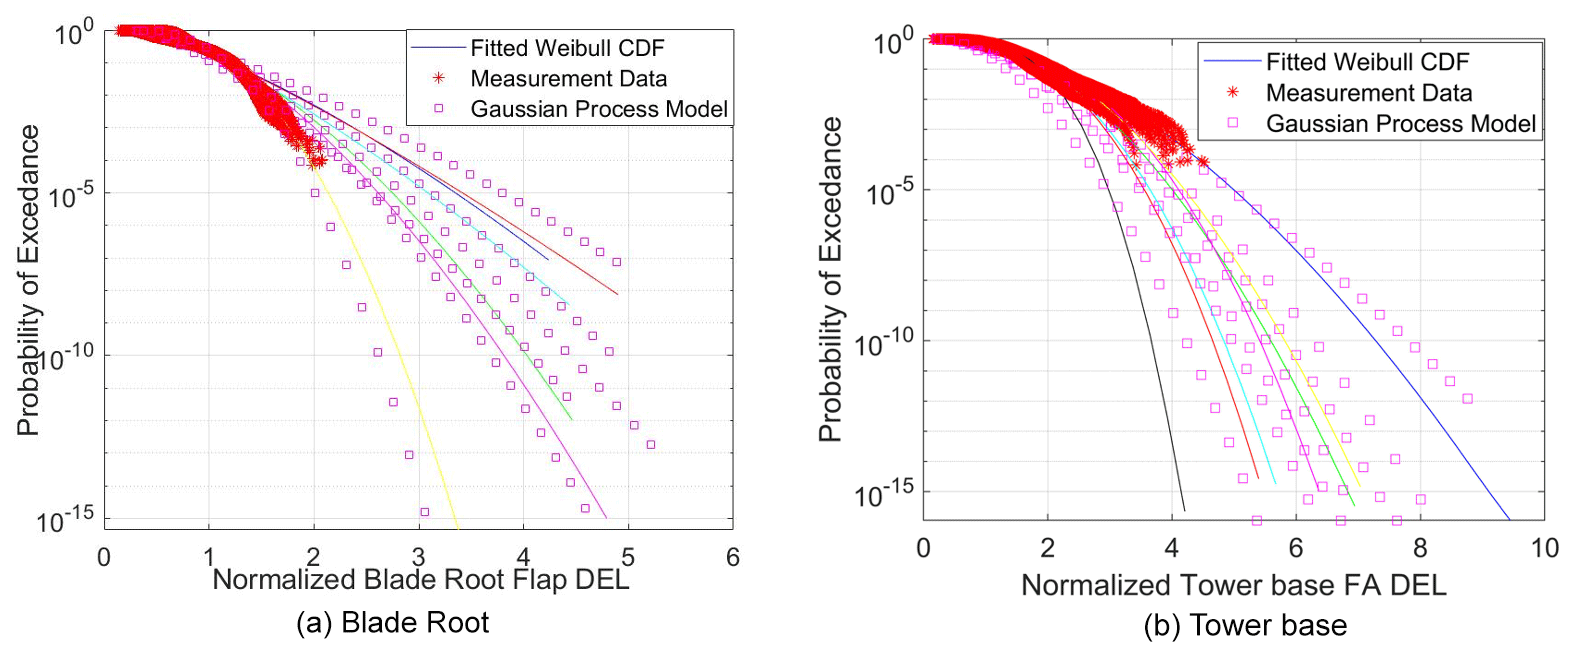
Figure 11Comparison of the 10 min (a) extrapolated blade root flap damage equivalent moment and (b) tower base fore–aft damage equivalent moment, using the Gaussian process method and measurement data on the C-08 turbine between 7 and 13 m s−1. Blade: measurement 1-year DEL – between 1.9 and 2.3, Weibull CDF 1-year DEL – between 2 and 2.7, and GPA 1-year DEL – between 1.9 and 3.1. Tower: measurement 1-year DEL – between 3.3 and 4.4, Weibull CDF 1-year DEL – between 2.9 and 4.4, and GPA 1-year DEL – between 2.8 and 4.4.
Based on this method, the extrapolated simulated DEL magnitudes (also using simulated standard deviations) should display higher DEL values for the same probability of exceedance as compared to the extrapolated measured DEL values, in which case the structural integrity of the turbine structure is not compromised. This allows a direct quantification of the life consumption of the turbine structures in a farm if the certification design loads of the turbines in question are available so that the relative difference in the DEL magnitudes with the actual inflow conditions is obtained. Without such an extrapolation, the probability of obtaining DEL magnitudes higher than the design DEL magnitudes is not known, and therefore the extrapolation of DEL is a necessary procedure.
Methodologies for computing DELs over multiple years and determining the probability of exceedance of DEL magnitudes were developed and validated using measurements from the Lillgrund wind farm. The synthesis of DELs using available mean and standard deviation of the loads was presented and validated for the blade root flap moment and tower base fore–aft moment. This provides a fast methodology to simulate the DELs for long durations without loss of accuracy. Different approaches for narrow-band processes (blade flap) and very narrow band processes (tower base fore–aft) were delineated and shown to also be usable as data sets for stochastic extrapolation to determine probabilities of exceedance. A suitable indicator to verify structural integrity of the turbine structure was proposed as the magnitude of the DEL at the 1-year probability of exceedance, based on past measurements and compared to the corresponding DEL magnitude in the design basis. The process of structural integrity verification was shown and quantified through the comparison of extrapolated DELs from measurements obtained from a single turbine with the corresponding extrapolated DEL magnitudes using simulation results. The capability to synthesize DELs from 10 min load statistics also allows ease of storage of multi-year data, without the need for time-series analysis. The combined methods of synthesis of DELs and stochastic extrapolation allow forecasting damage into the future and can be used as a decision-making tool to implement wind farm control methods that either reduce loads or increase power production, based on the need.
Measurement data from the wind turbine and the wind farm used in this work are not publicly available due to a non-disclosure agreement between the Technical University of Denmark and the providers of the data.
The author has declared that there are no competing interests.
Publisher's note: Copernicus Publications remains neutral with regard to jurisdictional claims in published maps and institutional affiliations.
The author is grateful to Gunner Larsen from DTU Wind Energy for his inputs.
This research has been supported by the European Union's Horizon 2020 Framework Programme, H2020 Societal Challenges – Secure, Clean and Efficient Energy, TotalControl Project (grant no. 727680).
This paper was edited by Amir R. Nejad and reviewed by three anonymous referees.
Barber, S., Mechler, S., and Nitschke, M.: The effect of wakes on the fatigue damage of wind turbine components over their entire lifetime using short-term load measurements, J. Phys. Conf. Ser., 753, 072022, https://doi.org/10.1088/1742-6596/753/7/072022, 2016. a
Cramer, H. and Leadbetter, M.: Stationary and Related Stochastic Processes, John Wiley & Sons Inc, New York, ISBN 9780471183907, 1967. a
Dimitrov, N. and Natarajan, A.: Wind farm set point optimization with surrogate models for load and power output targets, J. Phys. Conf. Ser., 2018, 012013, https://doi.org/10.1088/1742-6596/2018/1/012013, 2021. a, b
Dimitrov, N. K., Natarajan, A., and Mann, J.: Effects of normal and extreme turbulence spectral parameters on wind turbine loads, Renew. Energ., 101, 1180–1193, https://doi.org/10.1016/j.renene.2016.10.001, 2017. a
Gallinos, C., Dimitrov, N., Larsen, T., Natarajan, A., and Hansen, K.: Mapping Wind Farm Loads and Power Production – A Case Study on Horns Rev 1, J. Phys. Conf. Ser., 753, 032010, https://doi.org/10.1088/1742-6596/753/3/032010, 2016. a
Hoole, J., Sartor, P., Booker, J., Cooper, J., Gogouvitis, X. V., and Schmidt, R. K.: Systematic statistical characterisation of stress-life datasets using 3-Parameter distributions, Int. J. Fatigue, 129, 105216, https://doi.org/10.1016/j.ijfatigue.2019.105216, 2019. a, b
Hübler, C., Gebhardt, C. G., and Rolfes, R.: Methodologies for fatigue assessment of offshore wind turbines considering scattering environmental conditions and the uncertainty due to finite sampling, Wind Energy, 21, 1092–1105, 2018a. a
Hübler, C., Weijtjens, W., Rolfes, R., and Devriendt, C.: Reliability analysis of fatigue damage extrapolations of wind turbines using offshore strain measurements, J. Phys. Conf. Ser., 1037, 032035, https://doi.org/10.1088/1742-6596/1037/3/032035 2018b. a
IEC: International Standard IEC61400-1: Wind Turbines – Part 1: Design Guidelines, ISBN 978-2-8322-6253-5, 2019. a, b
Larsen, T. J. and Hansen, A. M.: How to HAWC2, the user's manual, Tech. Rep. R-1597, Technical University of Denmark, Department of Wind Energy, ISBN 978-87-550-3583-6, 2012. a
Madsen, H. O., Krenk, S., and Lind, N.: Methods of Structural Safety, Prentice Hall, Englewood Cliffs, NJ, ISBN 0-13-579475-7, 1986. a
Meirovitch, L.: Fundamentals of Vibrations, McGraw Hill, New York, ISBN 978-1577666912, 2001. a, b
Miner, M. A.: Cumulative damage in fatigue, J. Appl. Mech., 12, 159–164, 1945. a
Moriarty, P. J., Holley, W. E., and Butterfield, S. P.: Extrapolation of Extreme and Fatigue Loads Using Probabilistic Methods, Tech. Rep. NREL/TP-500-34421, https://doi.org/10.2172/15011693, 2004. a
Munters, W. and Meyers, J.: Dynamic Strategies for Yaw and Induction Control of Wind Farms Based on Large-Eddy Simulation and Optimization, Energies, 11, 177–190, 2018. a
Natarajan, A. and Verelst, D. R.: Outlier robustness for wind turbine extrapolated extreme loads, Wind Energy, 15, 679–697, 2012. a
Ragan, P. and Manuel, L.: Comparing Estimates of Wind Turbine Fatigue Loads using Time-Domain and Spectral Methods, Wind Eng., 31, 83–99, 2007. a
Vanmarcke, E.: On the distribution of the first-passage time for normal stationary random processes, J. Appl. Mech., 42, 215–220, 1975. a