the Creative Commons Attribution 4.0 License.
the Creative Commons Attribution 4.0 License.
 | 20 Jun 2022
Reduction of wind-turbine-generated seismic noise with structural measures
Daniel Peter
Christine Thomas
Reducing wind turbine noise recorded at seismological stations promises to lower the conflict between renewable energy producers and seismologists. Seismic noise generated by the movement of wind turbines has been shown to travel large distances, affecting seismological stations used for seismic monitoring and/or the detection of seismic events. In this study, we use advanced 3D numerical techniques to study the possibility of using structural changes in the ground on the wave path between the wind turbine and the seismic station in order to reduce or mitigate the noise generated by the wind turbine. Testing a range of structural changes around the foundation of the wind turbine, such as open and filled cavities, we show that we are able to considerably reduce the seismic noise recorded by placing empty circular trenches approx. 10 m away from the wind turbines. We show the expected effects of filling the trenches with water. In addition, we study how relatively simple topographic elevations influence the propagation of the seismic energy generated by wind turbines and find that topography does help to reduce wind-turbine-induced seismic noise.
- Article
(9325 KB) - Full-text XML
- BibTeX
- EndNote


The seismic energy generated by wind turbines (WTs) has been shown to propagate up to distances of 15 km and more (Schofield, 2001). This seismic energy or seismic noise can be measured by nearby seismic stations built for the detection of seismic events and/or seismic monitoring activities (Legerton et al., 1996; Rushforth et al., 1999; Schofield, 2001; Rushforth et al., 2003; Styles et al., 2005; Westwood et al., 2011, 2015; Stammler and Ceranna, 2016; Neuffer and Kremers, 2017; Westwood and Styles, 2017; Neuffer et al., 2019, 2021). The noise may result in the deterioration of the recording quality at seismic stations, therefore leading to a conflict between seismological station owners and WT operators (Neuffer et al., 2019). However, since renewable energy is needed, we see an increase in the number of WTs around the world, but the functionality and task fulfillment of seismic monitoring networks still have to be preserved (Neuffer and Kremers, 2017).
Most of the seismic waves generated by WTs that are influencing seismic recordings are surface waves and especially Rayleigh waves (Gortsas et al., 2017; Neuffer and Kremers, 2017). The parameters of seismic noise produced (e.g., strength, frequency content) highly depend on the wind speed, height, number and type of the influencing WT (Neuffer and Kremers, 2017). The height of nearby WTs is affecting the frequency content of the noise wavefield in that ground vibrations generated by taller turbine towers are emitting lower frequencies, while smaller towers radiate higher frequencies (Neuffer and Kremers, 2017; Stammler and Ceranna, 2016). The frequency range of the WT-induced seismic noise that affects seismic stations and monitoring tasks lies in a range of 1–10 Hz (Hu et al., 2020; Zieger and Ritter, 2018; Friedrich et al., 2018; Marcillo and Carmichael, 2018; Stammler and Ceranna, 2016; Neuffer and Kremers, 2017; Neuffer et al., 2019; Zieger and Ritter, 2018), correct for distances above 1 km or so. At smaller distances higher frequencies will be observed.
Because the proposed distances between seismic monitoring stations and WTs of 15 km is not always fulfilled (Neuffer and Kremers, 2017), and often the distances are much smaller, solutions to these problems of WT noise interfering with seismic measurements still need to be found. A consensus between WT operators and seismological stations and seismic networks is imperative for growth in the field of clean energy generation, and simple filtering operations to remove the seismic noise induced by WTs do not seem to be the solution to the problem (Neuffer and Kremers, 2017); however, advanced filtering methods may help to reduce WT noise and still allow seismic events to be detected.
A possible solution to this problem may be through the emerging field of seismic metamaterials. The original definition of seismic metamaterials is engineered media that acquire one (or more than one) property not found in naturally occurring materials; these composites are usually designed using a combination of multiple elements arranged in repeating patterns, at one or multiple scales, that need to be smaller than the typical wavelength of the wave they aim to control (Brûlé et al., 2020). Following Brûlé et al. (2020) there are four main types of seismic metamaterials: (i) seismic soil metamaterials, (ii) buried mass resonators, (iii) above-surface resonators and (iv) auxetic materials.
While most of these metamaterials are difficult to produce in large dimensions and since they are very expensive, their use for mitigating the noise of WTs is limited. However, in a recent study, the influence of trees on the seismic wavefield has been explored (Colombi et al., 2016b; Liu et al., 2019; Lim et al., 2021), and the presence of these trees been shown to lower seismic noise for a station place behind the trees. Buried mass resonators are, in principle, also useful candidates. However, they still possess very large dimensions, and their construction is economically not feasible for attenuating WT noise. For instance, Palermo et al. (2016) have shown that in order to attenuate seismic waves for a frequency range of 1–10 Hz, one needs a seismic barrier of buried resonators, each with heights larger than 1.5 m, a radius of 0.5 m and weights around 6700 kg.
Seismic soil metamaterials may be a possible realistic candidate to mitigate the WT noise. Despite large dimensions, they are relatively cheap, because they may be constructed as an array of large holes with certain predefined shapes. Miniaci et al. (2016) have shown that one can mitigate seismic energy for a maximum frequency of 6 Hz with an array of cross-like cavities of 9 m wide by 10 m deep, separated by 2 m between them and arranged in an area of 100 m2. A less restrictive experiment has been carried out by Brûlé et al. (2017), where the authors show that they can mitigate the seismic energy for frequencies smaller than 10 Hz, by a grid of cylindrical holes properly distributed in the ground. These holes allow the distribution of the seismic energy inside the grid, producing an effect of dynamic anisotropy akin to an effective negative refraction index.
Based on the studies mentioned above, in this work we perform full 3D numerical wave propagation simulations that allow us to test the influence of structural changes such as cavities and trenches both filled and empty in order to reduce WT seismic noise at seismological stations. We first start by modifying the numerical large-scale seismic soil metamaterials proposed by Miniaci et al. (2016) to understand the influence of the arrangement and number of unit cells that are necessary to obtain the desired attenuation results. Next we simplify the concept introduced by Miniaci et al. (2016) and Brûlé et al. (2017) and place simple circular holes (empty and filled with water) in front of the WTs and investigate how this configuration helps to mitigate the seismic energy. Continuing, we study how simple topographic elevations influence the propagation of the seismic energy generated by WTs. We finally conclude the results of our investigations and propose the most appropriate scenario to avoid seismic noise generated by WTs.
To mitigate the effect of WTs on seismological stations, we perform fully 3D numerical simulations of elastic/acoustic wave propagation using the SPECFEM3D Cartesian code freely available through the web page of the Computational Infrastructure for Geodynamics (CIG) at https://github.com/geodynamics/specfem3d (last access: 26 May 2022). The code uses the spectral-element method to solve the 3D elastic/acoustic equations of motion in the time domain. The use of full 3D waveform modeling allows us to take into account the correct geometrical spreading of the seismic waves and to properly model surface waves. At the boundaries of the domain, the code uses Clayton–Engquist–Stacey (Clayton and Engquist, 1977; Stacey, 1988) and/or perfectly matched layer (PML) (Komatitsch and Martin, 2007; Komatitsch and Tromp, 2003) absorbing conditions to avoid unphysical reflections. For each model we generate a complex hexahedral mesh using the software Trelis and MeshAssist (Gharti et al., 2017). Special attention and effort are dedicated to the meshing process: it is a critical step in the modeling procedure since a good mesh guarantees the good convergence of the numerical method. In particular, the spectral element method in combination with hexahedral meshes leads to a symmetric mass matrix which allows the significant reduction of the computational cost of the numerical simulation while keeping spectral accuracy of the solution (Komatitsch and Tromp, 1999). We run each numerical simulation on 10 nodes with 720 processors in total, with an approximately total simulation time of 2 h. In the next sections we introduce different scenarios to determine the most efficient way to mitigate the WT-generated seismic noise.
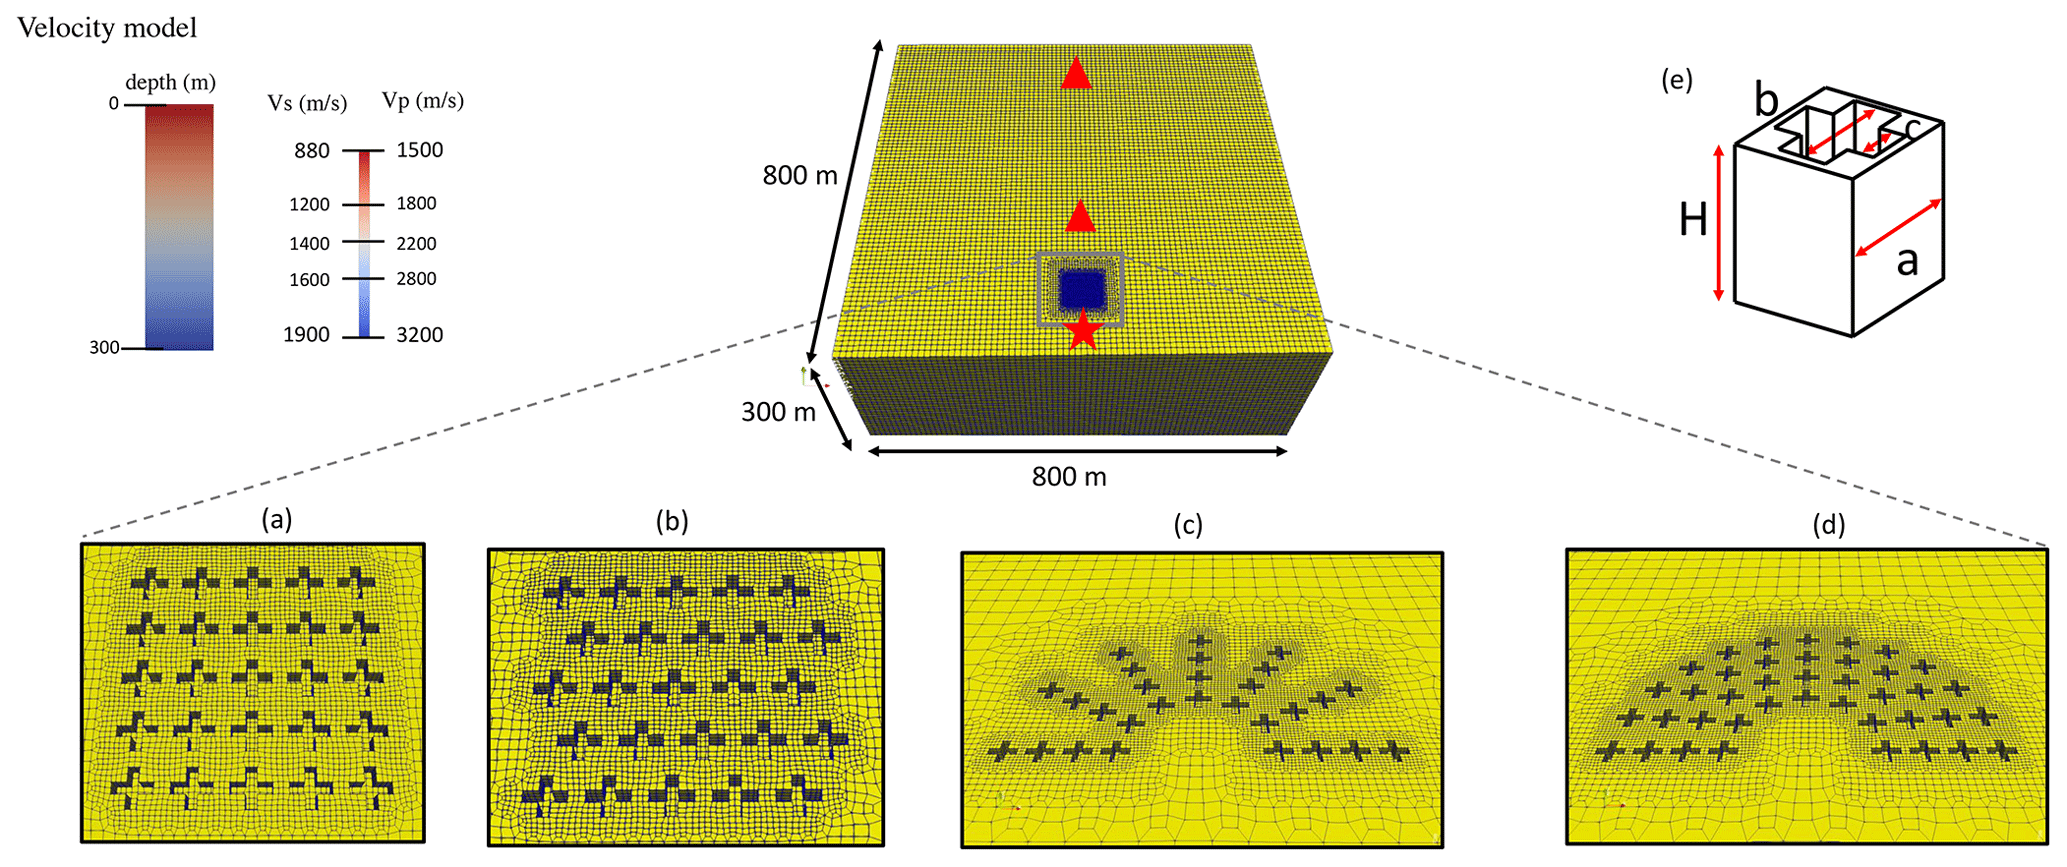
Figure 1Mesh examples of the cross-shaped cavities used for the different numerical simulations. The red star indicates the place of the WT and the red triangles the places of the seismic stations. Note that we also considered seismic stations towards the sides of the box. (a) Grid of 5×5 cavities distributed in an area of 50×50 m2. (b) Same as (a) but with two shifted lines of cavities. (c, d) Cross-shaped cavities arranged in a half-circular arrangement. (e) Unit cell detailing the dimensions of the cell, a, b and c and depth H.
2.1 Cross-shaped holes as metamaterials
First we consider the case of cross-shaped holes in the ground as presented by Miniaci et al. (2016) where these seismic soil metamaterials were shown to attenuate the seismic wavefield sufficiently to protect buildings. Their cross-shaped unit cells had the dimensions of a=10 m, b=9 m, c=2.5 m and H=10 m (see Fig. 1e), and based on the Floquet–Bloch theory (Kittel et al., 2004), the authors predict several frequency band gaps between 2–6 Hz, a frequency range which is useful for our purposes. However, the number and arrangement of individual unit cells needed to obtain the desired frequency band gap are not clear for seismological applications since Floquet–Bloch theory assumes periodicity in the structure (Gomez Garcia and Fernández-Álvarez, 2015). To show the effect of these metamaterials on seismic waveforms, Miniaci et al. (2016) considered an array of cross-shaped unit cells distributed within a rectangular grid of dimensions 100×100 m2.
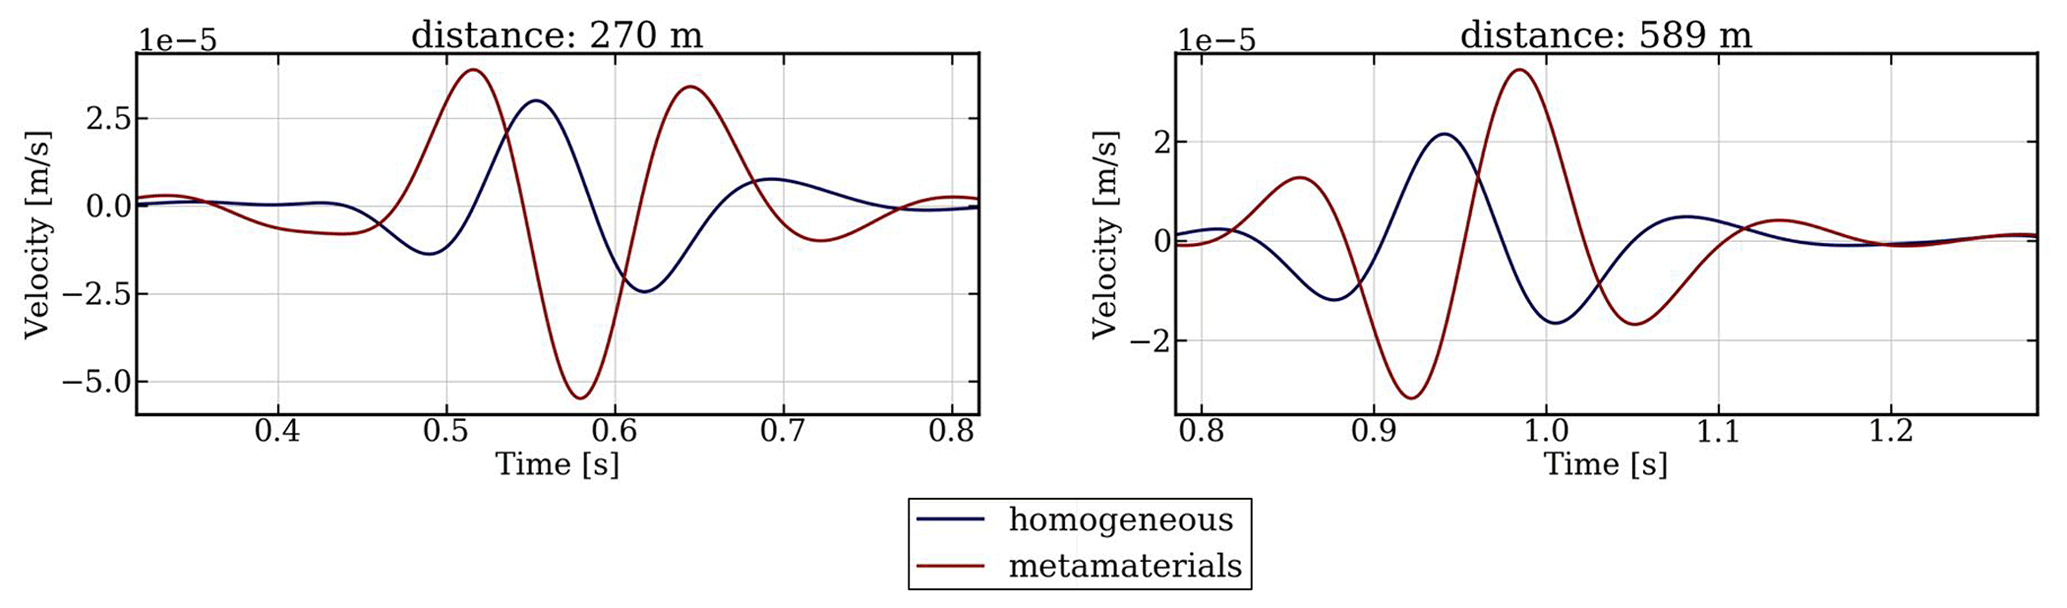
Figure 2Simulation results for the cross-shaped cavities (red line) in comparison with models without cavities (homogeneous model, blue line). The distance of the seismic station is indicated on top of each graph.
This kind of arrangement is too extreme for our purposes; however, it allows us to understand the effects of wave propagation when we change the number of unit cells and their arrangement in order to keep the number of unit cells to the lowest possible number, which ultimately will keep the cost and the total engineered area to a minimum. For this purpose we created 12 different numerical models formed by different arrangements of individual cross-shaped unit cells (see Fig. 1e). For each model we consider an arrangement of 5×5 cross-shaped unit cells of dimensions presented in Fig. 1, covering five different areas of dimensions 50(×50), 80(×80), 100(×100), 120(×120) and 150(×150) m2. For each of these models we also created an additional model by shifting the intermediate layers of cross-shaped cavities (see Fig. 1a and b). Additionally, we consider two more models where the distribution of cross-shaped metamaterial is circular (see Figs. 1c and 2d) to avoid diffraction around the structures and wavefront healing processes. The total dimensions of the models are m (length, width, depth). We numerically model a frequency range of seismic energy between 1–10 Hz with a Ricker wavelet centered at 5 Hz as a source time function. At the edges and bottom of the models we consider absorbing boundaries, and at the top we consider the free surface condition. Unlike previous studies (e.g., Miniaci et al., 2016; Palermo et al., 2016), the structural model is assumed to be a velocity increasing with depth, with varying velocities vp=1500–3200 m s−1 and vp=1.7 vs and a constant density of ρ=2300 kg m−3.
Results for the vertical (Z) component of seismometers located behind the metamaterials given in Fig. 1a are presented in Fig. 2. We can observe that for the Ricker wavelet source with a dominant frequency of 5 Hz the seismic energy is not attenuated; on the contrary it is increased. This is likely due to interference of scattered waves from the different cross-shaped cavity walls. In addition, the waveforms change, also due to superposition of waves scattered from the cavity sides. Similar amplification results are obtained when shifting the individual cross-shaped unit cells (see Fig. 1b–d). The shift of every second row with respect to the first seems to have little to no effect on the seismic waveforms, also for different distances. One needs to take into account that the wavelength of the propagated wavelet at the surface is about 1500 (m s−1) (Hz) =300 m, almost half the total length of our models. Also, the location of the source is about 40 m away from the first unit cell cavity. It thus seems that these kind of cross-shaped large-scale seismic metamaterials are not able to reduce seismic energy for our 5 Hz wavelet, but when we tested source wavelets with higher frequencies (15 to 25 Hz) the energy was attenuated. However, our target frequencies for the attenuation of WT noise are in the range of 1–10 Hz; thus this size and type of metamaterial are not of practical use for our purposes, because they would have to have very large dimension for attenuating waves with frequencies below 10 Hz, thereby increasing costs and environmental impact.
2.2 Half-circular trenches
We now consider simpler models compared to the cross-shaped metamaterials presented by Miniaci et al. (2016). To do so, we create a total of 18 models with half-circular trenches, nine of them empty and nine filled with water. We included varying depths of 20, 15, 10 and 5 m and included two different widths of 3 and 5 m (see Fig. 3) and a radius of 10 m. Again we numerically model a frequency range of seismic energy between 1–10 Hz with a Ricker wavelet centered at 5 Hz as a source time function. The point source is placed 10 m in front of the trenches, at the center of the trench, while the stations are placed at a range of distances behind the trenches. We use a numerical model with dimensions of m (length, width, depth) discretized with more than 100 million global points (see Fig. 3). At the edges and bottom of the model we consider absorbing boundaries and at the top the free surface condition. The structural models are assumed to have constant velocities vp=1500 m s−1 and vs=900 m s−1 and density ρ=2300 kg m−3. The reason for using constant velocities for this scenario is the fact that adding material to the trenches is computationally difficult to implement due to the creation of the meshes, and we therefore resort to a simpler case for filled and empty trenches so that the difference in the seismic recordings is only due to the filling material for a better comparison.
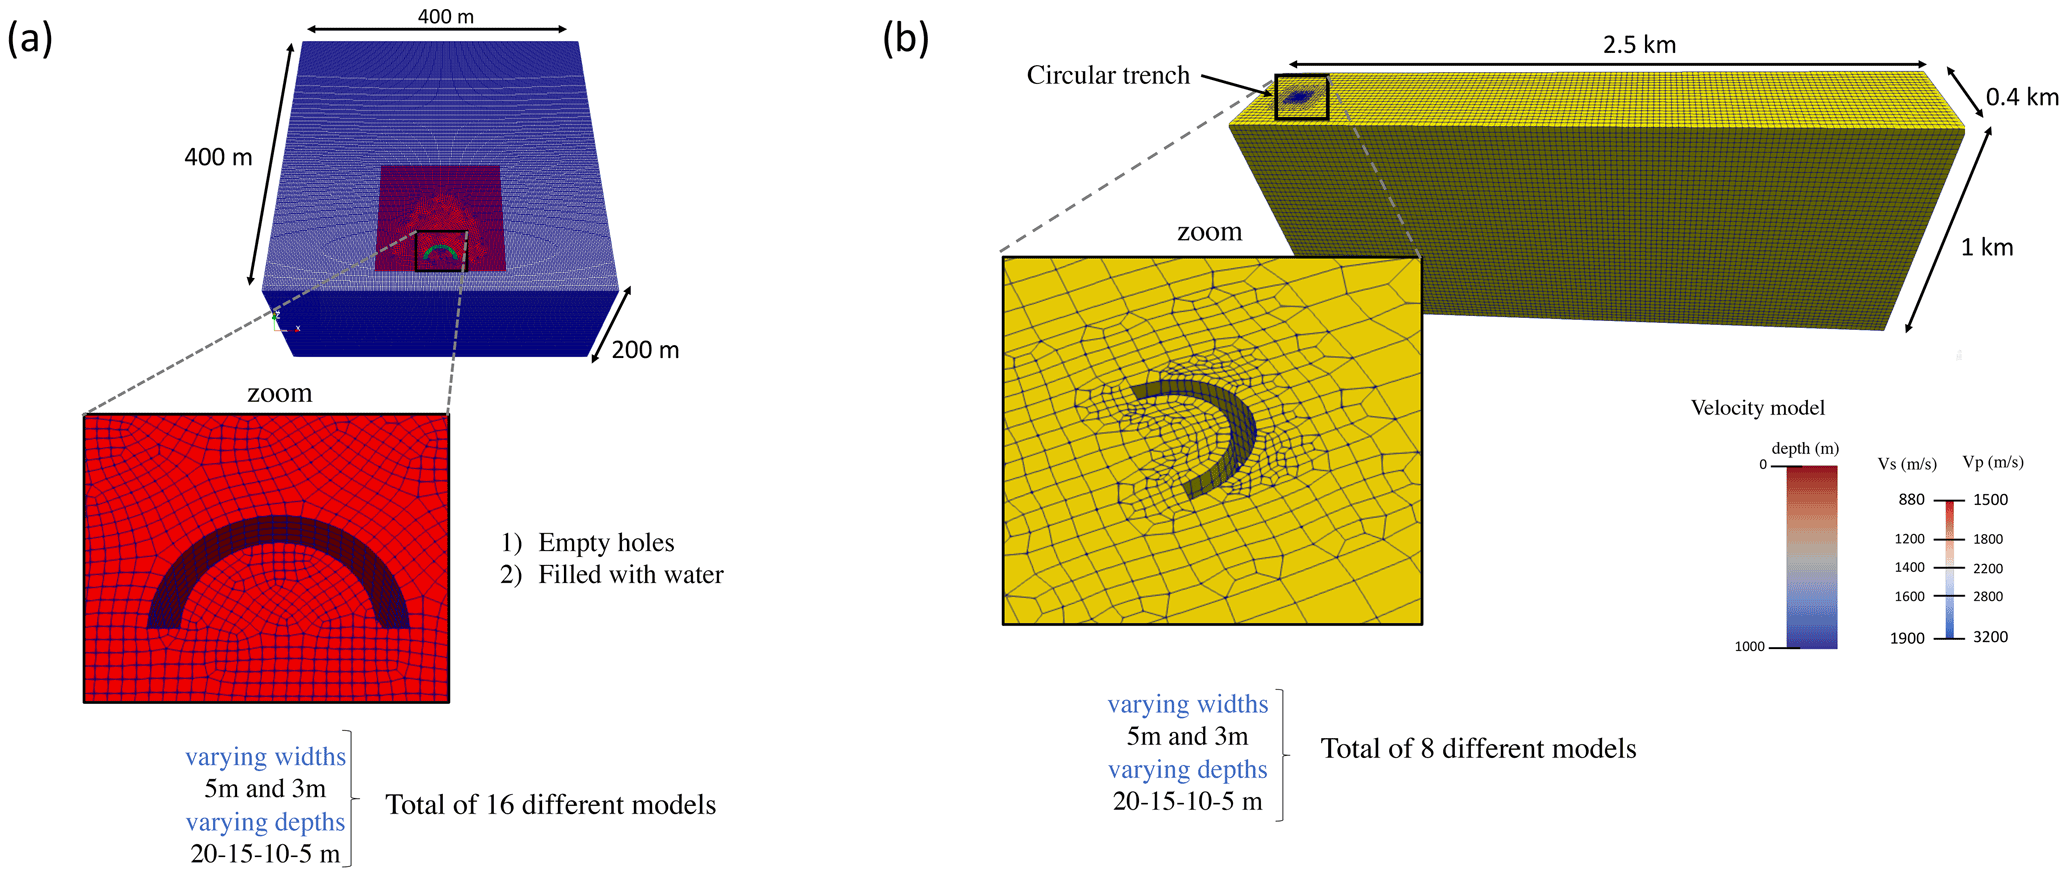
Figure 3(a) Mesh examples of models with half-circular holes either empty or filled with water with varying width and depths as indicated. For these models the velocities are constant. For more information see text. (b) Mesh example of the large-scale models created with empty holes with varying widths and depths. For these models, P and S velocities increase with depth as indicated. Seismic stations are placed across the entire surface 35 m apart.
Results for the vertical (Z) component seismic recordings for the model with empty trenches are presented in Fig. 4a. We can observe that all models attenuate the seismic energy in a similar way, and only for 5 m deep trenches is the attenuation less pronounced. We also find that for all directions and distances of stations with respect to the WT, the model that best attenuates the seismic energy is a trench that is 5 m wide and 15 m deep. The deepest (20 m) and widest (5 m) trench shows effective attenuation results but it is not the best scenario. At larger distances (355 m) all models, excluding those with 5 m depth, behave virtually equal, and at shorter distances (28 m) the best models are those with the deepest trenches.
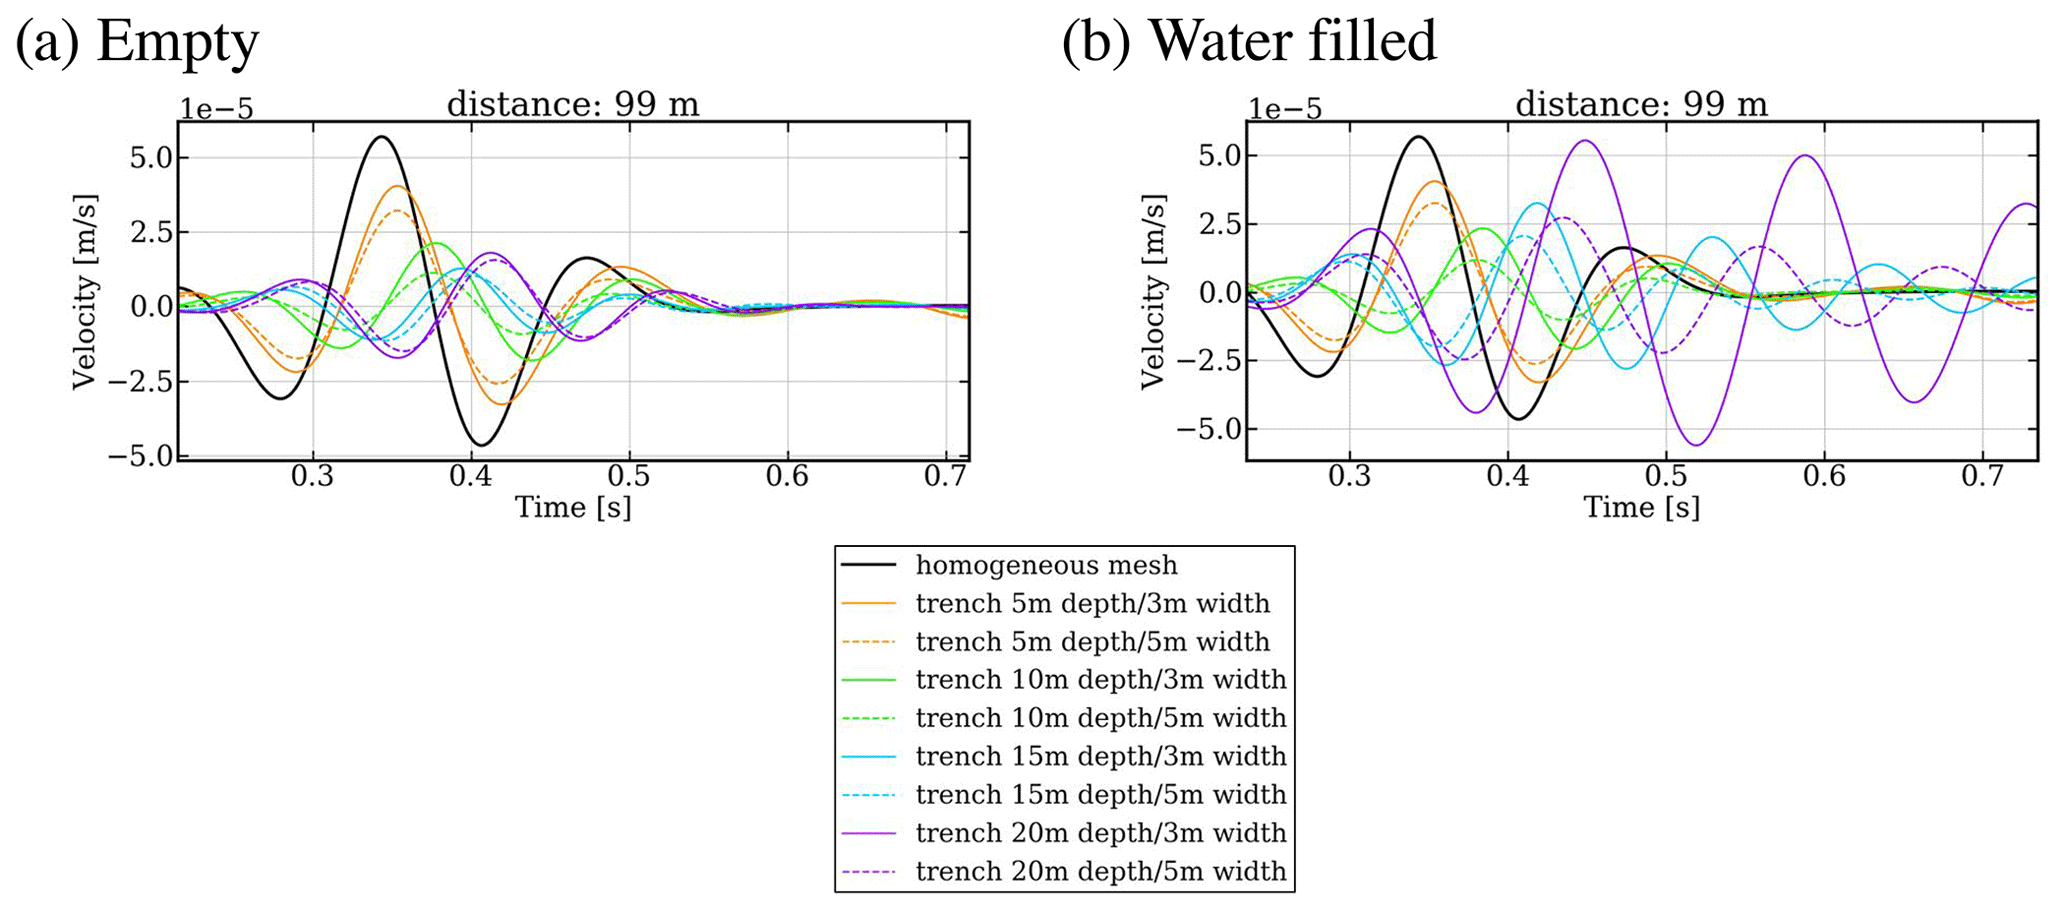
Figure 4(a) Simulation results for cavities as empty half-circular trenches (see Fig. 3) using a Ricker source time function centered at 5 Hz. Different sizes of cavities are shown by different colors (see legend), and the waveform of the model without cavity is shown as a black solid line. (b) Same as (a) but for cavities filled with water.
Results for the models with trenches filled with water show a more complex behavior compared with empty trenches (see Fig. 4b). This is because reverberations are generated by the presence of a fluid in the trenches. At short distances (28 m) a similar behavior is observed compared to empty trenches where the models with 5 m width and with 15 and 20 m depth show the most attenuating effects. Also, at larger distances we can observe that some models still attenuate the energy similar to Fig. 4a, but the coda is longer than for the empty trenches due to the presence of reverberations in the water-filled trenches. At the distance of 99 m, the 20 m deep and 3 m wide trench increases the seismic energy to higher amplitudes compared with the original seismic energy without any trench (purple line in Fig. 4b). This indicates that filling the circular trenches with water, or indeed other material, may have the opposite effect to the desired attenuation of seismic energy, since amplification effects similar to those that occur in sedimentary basins can be expected (Olsen, 2000; Wirth et al., 2019). We tried models of trenches filled with other material, i.e., material with a different velocity and attenuation; however, the effect was the same as filling them with water. Modeling porous small-scale material was not possible due to the size of possible meshes in combination with our frequencies and model sizes.
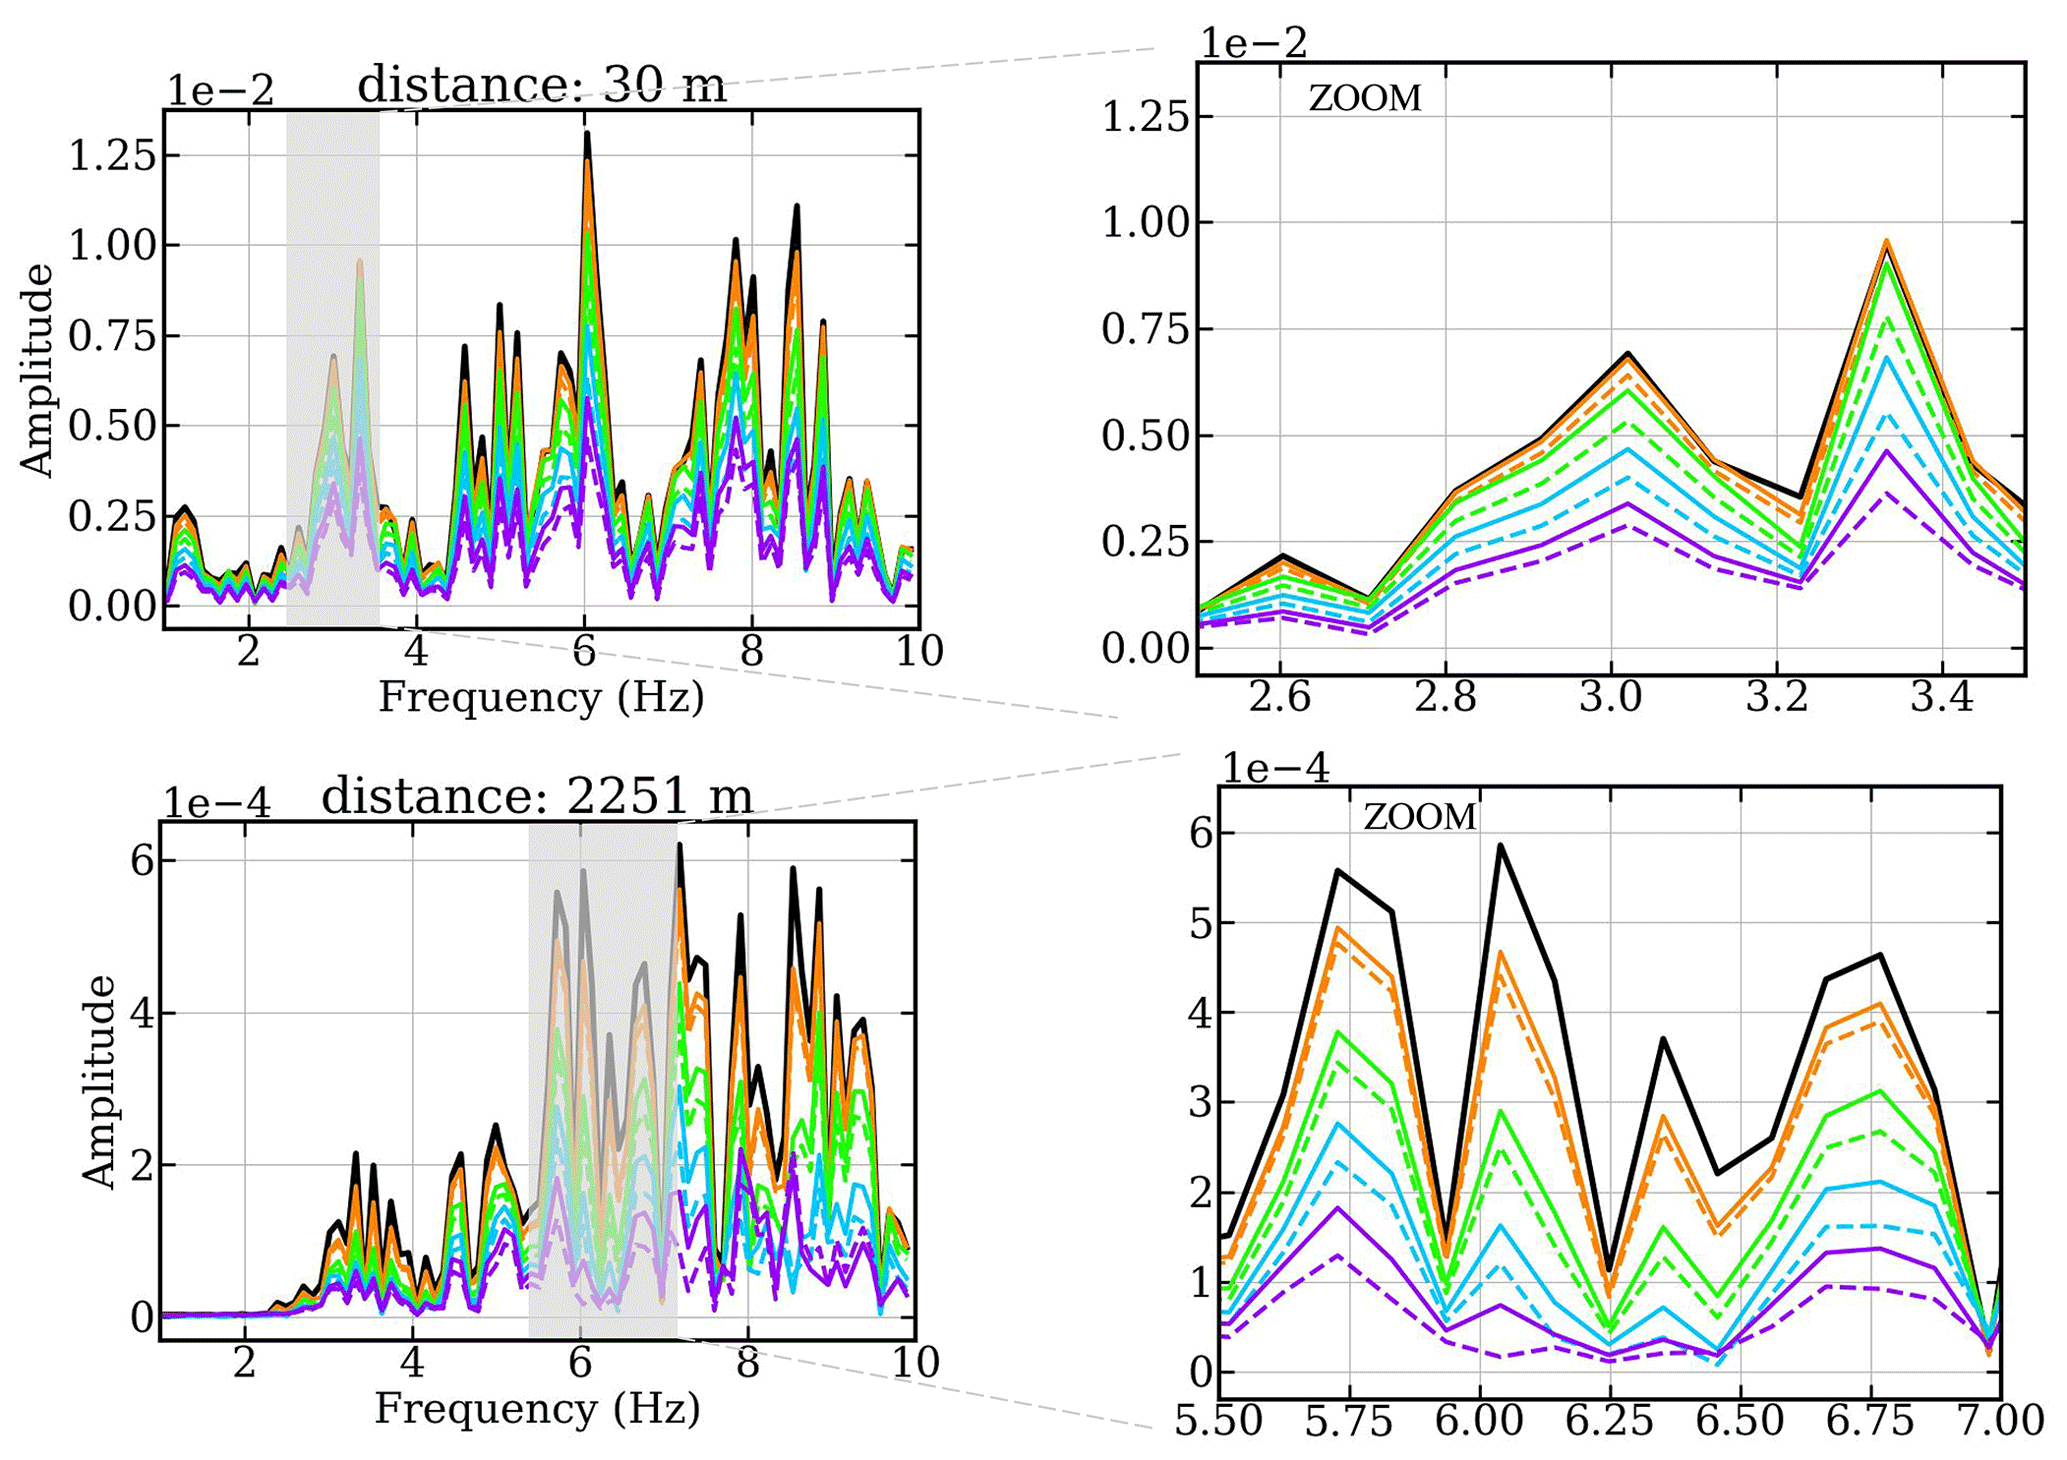
Figure 5Frequency spectra of the simulation results for the seismic noise from the source time function from Neuffer et al. (2021) and in presence of half-circular trenches with varying dimensions compared with a model without trenches (black curve). See Fig. 3b for the models considered here and Fig. 4 for the legend of models depicted by the colors.
The results obtained in this section are, however, encouraging since we can observe a reduction of WT-generated noise by placing half-circular trenches between the WTs and seismic stations. These constructions lower the financial and environmental impacts compared to results presented by Miniaci et al. (2016). Note that the above models were generated only for short distances between WT and stations. However, most seismic stations are more than 100 m away from WTs, and we will explore a more realistic scenario in the next section.
2.3 Empty half-circular trenches at larger distances
Encouraged by the results obtained in the previous section, we investigate how empty trenches can attenuate the seismic energy at large distances and in the presence of structural changes in the soil (i.e., trenches) and with more realistic sources. We create a total of eight modes with empty half-circular trenches within a model with dimensions of m (length, width, depth) discretized with more than 100 million global points (see Fig. 3b) with boundary conditions as above. The velocities in the model increase with depth as in the scenario with cross-shaped holes, with vp=1200–3200 m s−1 and vs=900–2400 m s−1 and a constant density of ρ=2300 kg m−3 (see Fig. 3b and c). Using this model allows us to properly take into account the generation of surface waves at larger distances compared to the previous experiments, where we had to use a homogeneous velocity due to the complexity of the models with water-filled trenches.
Different to the experiments above, for this case we use source time functions that are taken from seismic noise measurements made by Neuffer (2020) and re-inject these at the place of the WT as a point source for the three spatial coordinates. The seismic measurements by Neuffer (2020) were collected in the Windpark “Bürgerwindpark A31 Hohe Mark” located in Heiden (NRW, Germany), which consists of two WT concentration zones with three WTs per zone. Within the concentration zones, the WTs are located about 500 m apart, and a nearby motorway is found 500 m from the nearest WT. The identically constructed WTs are of the type Enercon E-115. The WT with the largest distance to the motorway and to the other WTs was selected as the study object to conduct different measurements with 17 mobile seismic stations to identify the movements of the tower, foundation and the immediately adjacent subsurface within the MISS project (Minderung der Störwirkung von Windenergieanlagen auf seismologische Stationen, Neuffer et al., 2021). For our study, we use the seismic recording from one accelerometer installed at a distance of 8 m from the WT. Following calculations made by Gortsas et al. (2017), we select the magnitude of the point source to be 78.202 MNm. Despite the assumed point source being too simplistic compared to a realistic scenario were the WT type, aerodynamic conditions and foundations play a crucial role in the seismic noise generation (Barthelmie and Pryor, 2006; Pryor et al., 2005; Barthelmie et al., 2006; Gortsas et al., 2017; Barthelmie et al., 2007, 2010, 2016; Hu et al., 2018; Letson et al., 2019; Hu et al., 2020), it allows us to test whether empty half trenches can attenuate complex waveforms within the frequency range of 1–10 Hz and with a realistic amplitude.
Results for the vertical (Z) component are presented in Fig. 5 as frequency spectra. Here we show spectra over waveforms due to the complex nature of the source and to be able to detect whether any frequencies are attenuated or increased compared with the model without structural changes (trenches) that is shown by the black line. In addition, previous studies also display spectra rather than waveforms (e.g., Stammler and Ceranna, 2016; Neuffer and Kremers, 2017; Neuffer et al., 2019; Zieger and Ritter, 2018), and we aim for a better comparison with those studies. In our results in Fig. 5, we can observe the overall reduction of noise amplitudes for all frequencies when placing circular trenches between the WT and the seismic stations. The models that most effectively reduce the seismic energy are those that are deepest (purple lines), with the wider trenches (dashed lines) reducing the energy slightly better than narrower trenches (solid lines). Our half-circular trenches act as barrier to seismic energy, but for shallower trenches the energy of waveforms can still travel below the structure. Therefore the reduction of energy is less pronounced here.
Finally, since wind turbines are now often found in wind parks, we test the influence of our half-circular trenches on the wavefield generated by two wind turbines. The scenario is shown in Fig. 6a where two WTs are separated by a distance of 200 m. In front of each WT we place a circular trench of 5×15 m (width, depth). The numerical model has total dimensions of km (length, width, depth), and again the velocity increases with depth (see Fig. 3). Frequency spectra for the vertical (Z) component for one and two wind turbines with and without half-circular trenches are shown in Fig. 6b, where we can observe that the trenches also efficiently attenuate the seismic energy for two wind turbines at large distances.
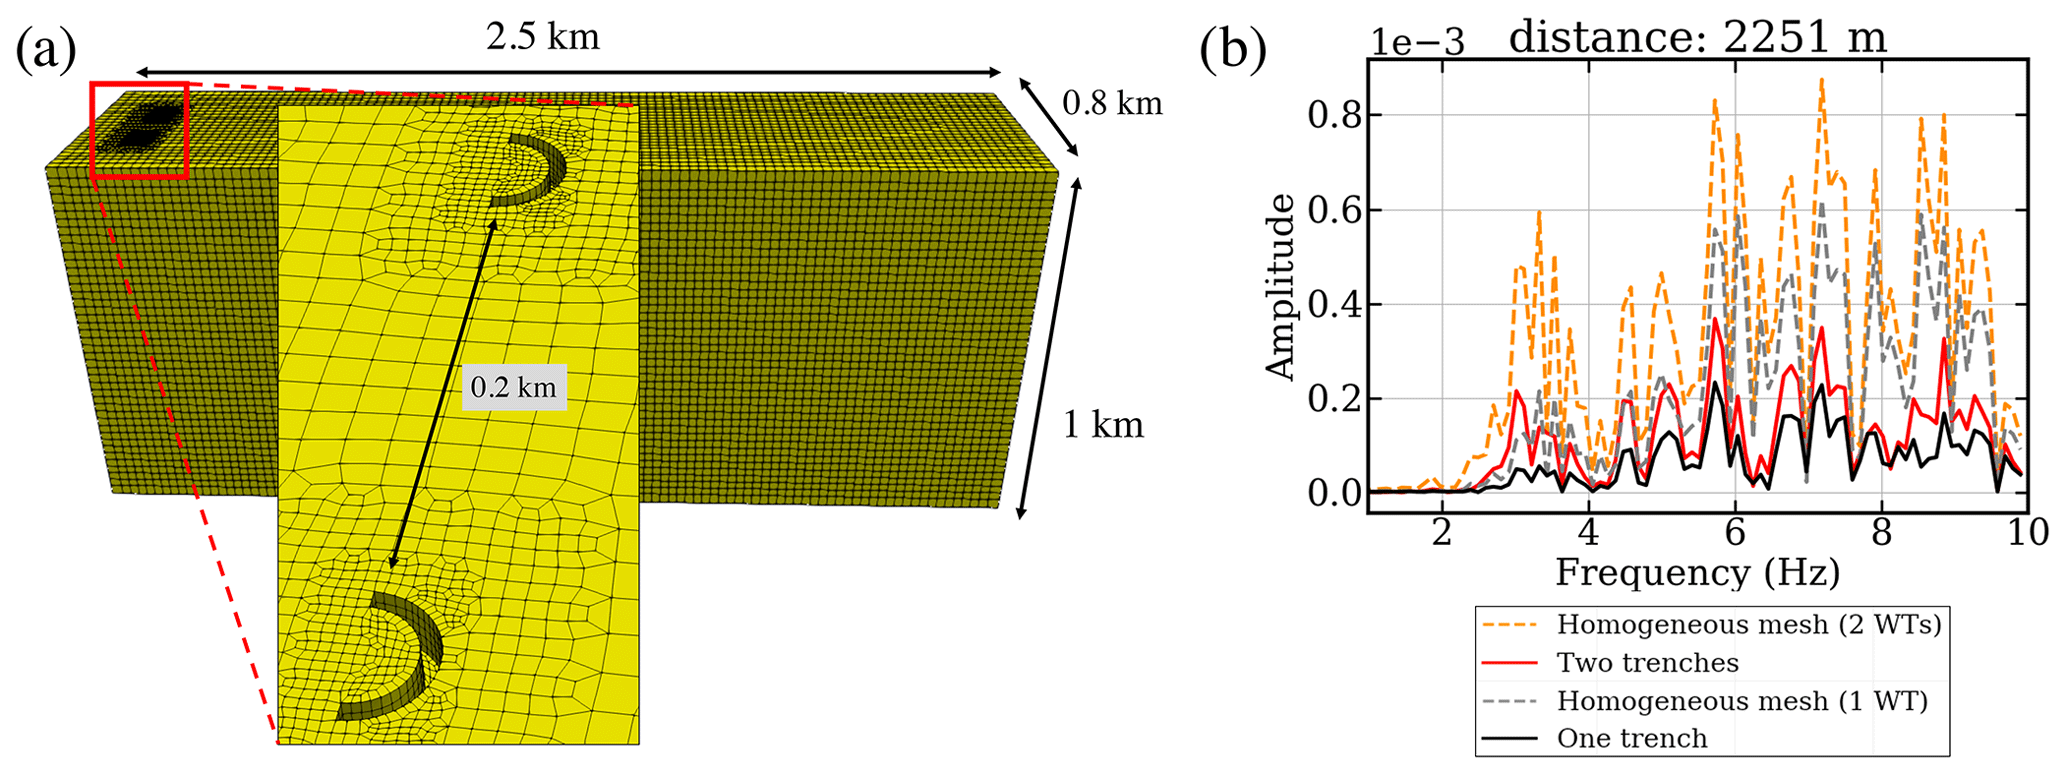
Figure 6(a) Setup with two wind turbines, each with a half-circular trench in the direction of the seismic station. (b) The spectra of the model without trenches (dashed lines) and with trenches (solid lines). The orange and red lines indicate the case of two wind turbines, and the gray and black lines those of one wind turbine.
2.4 Topographic effects
As a last numerical experiment we change our model to include topographic variations at the surface. It is well known that topographic variations have an effect on noise waveform amplitudes (Lacanna et al., 2014; Köhler et al., 2012), and it will be instructive to see how WT noise is affected by simple topography since many WTs are placed at the top of hills. We model this scenario using the source measurements made by Neuffer (2020) as source input as described above. The model dimensions are m (length, width, depth) and we create topography in the shape of mounds with varying heights of 33.5, 67, 100, 153 and 200 m (see Fig. 7a). The velocity model for the bulk model domain (i.e., the box) is the same as above with velocities increasing with depth. Inside the tomographic mounds we change the velocity, including higher and lower velocities with and without random scattering media (see Fig. 7b). All these models in Fig. 7a and b have the same topographic horizontal extension and velocity variations, which guarantees that the differences observed in the simulations are only due to the topographic elevations. The WTs are placed at the top of the mounds.
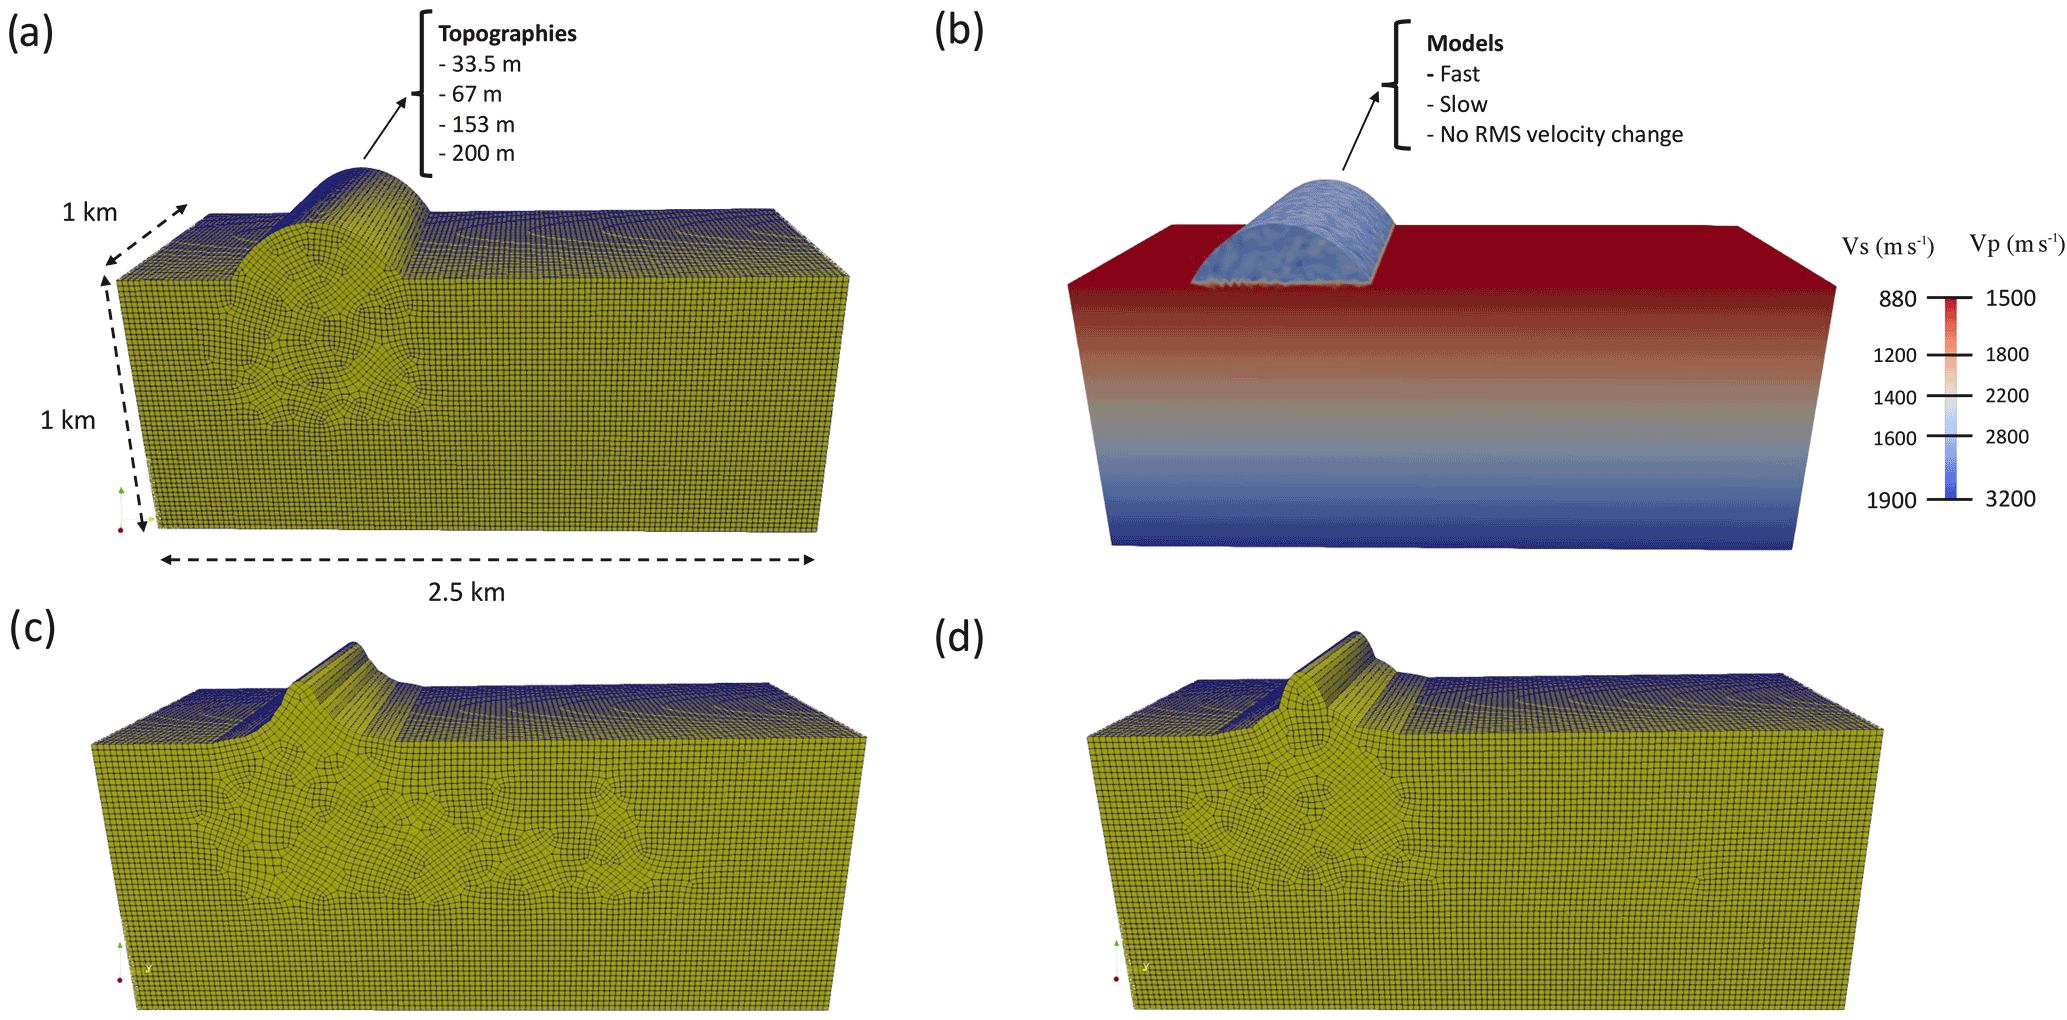
Figure 7(a) Mesh examples of large-scale models with topographic mounds as shown. The length of the models is 2.5 km, and topography heights are shown. (b) Velocity model outside the mound with increasing velocity with depth as shown by the colors. Inside the mound, velocity variations with and without scattering are included as shown. With scattering the rms velocity is either higher, lower or the same as the top layer of the box at zero elevation. Without scattering the velocity is either higher, lower or the same as the top layer of the box. (c, d) Two different models with more complex topography: (c) smoother model and (d) rougher model.
As mentioned before, in our numerical simulations, we consider that the topographic elevation may have a different velocity perturbation compared with the top layer of the bulk of the model domain, i.e., at zero elevation (see Fig. 7g). This will introduce an impedance (velocity × density) contrast at the bottom of the topography for the case of lower or higher velocities both with and without scatterers. Therefore we expect changes in waveform and energy also due to these impedance contrasts.
Looking at different scenarios, we find that mounds with the same velocity as the top layer of the box reduce the recorded seismic energy for most frequencies for all topographic heights, and including scattering into these models emphasizes the effects. Higher mounds reduce the energy more efficiently than smaller mounds. If we use a velocity decrease inside the mound compared with the top layer of the box, we instead find increased energy for all frequencies, and including scattering in that model increases the energy even more. This can be explained in analogy to sedimentary basins where the trapped energy in the basin increases due to wave interference and depending on the structural geometry of the basin (Shumway, 1960; Olsen, 2000; Wirth et al., 2019). If, however, the velocity is faster in the mounds compared with the top layer of the box, the seismic energy recorded at the seismic station is reduced, and even further reduced when scattering is included (Fig. 8). As above, the reduction of the energy correlates with the height of the hills, with larger hills reducing the energy more efficiently. Because the modeling of attenuation within the topographic region remains outside the capabilities of our numerical models, we instead included intrinsic attenuation in the entire numerical models, and general observations remain virtually unchanged.

Figure 8Spectra of the simulation results for the propagation of seismic energy in the presence of topographic variations (see Fig. 7 for the models considered here). The source is placed at the top of the mounds, and the mounds are filled with a scattering medium where the rms velocity is faster than the top layer of the box (zero elevation).
The mounds modeled here are very simple topography, and one can expect that the amplification or reduction of the energy is dependent on the morphology of the topographic elevations. For evaluating how complex topographic variations affect the seismic noise recorded at stations behind the topographic variations, we consider two additional models given in Fig. 7c–d. Both scenarios' variations have an elevation of 200 m, and the topographic elevation has a random velocity perturbation of scatterers in a velocity model that is the same as the top layer of the box (i.e., at zero elevation). Results are presented in Fig. 9, where we compare to the simplified hill presented in Fig. 7 with the same height of 200 m as the top of the complex topography. We can observe that the complex topographies reduce the energy for some frequencies, and for others they increase the energy. This is also true for different distances of stations from the WT, but it is not necessarily the same frequency for which the energy is enhanced or reduced. We can observe that in general the amplitude and reduction of seismic energy will depend on the complex topography and will affect each particular frequency differently.
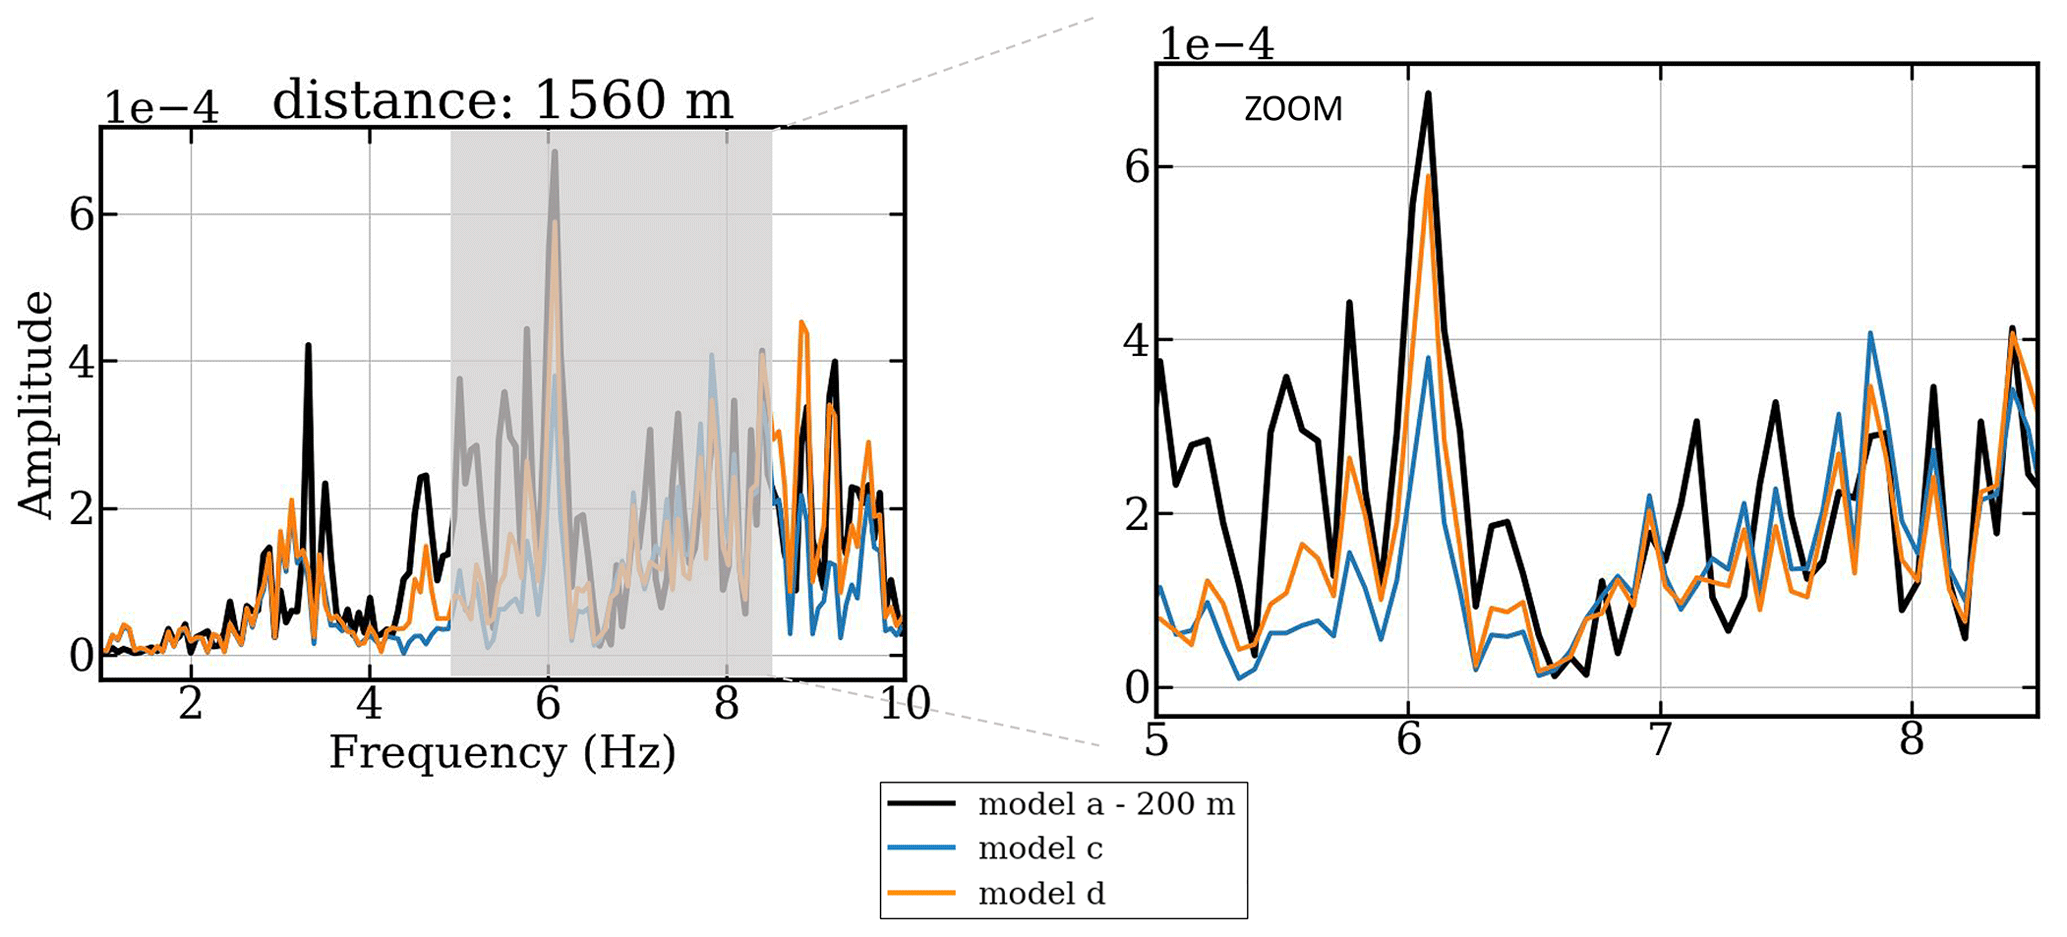
Figure 9Spectra for the simulation results for the seismic noise for the models with complex topographic variations (orange and blue lines) in comparison with the 200 km high mound (black line). The source (WT) is placed at the top of the hill, and the recording seismic station is placed 1560 km behind the WT. The models are presented in Fig. 7a, c, and d with 200 m height. We include scatters for which the rms velocity variation is the same as the top layer of the box (zero elevation).
The demand for renewable energy systems increases every year around the world. In particular, the expansion of wind energy is expected to help renewable electricity generation to rise, and it is expected to increase the most in absolute generation terms among all renewables (Tabassum-Abbasi et al., 2014). This increase in the number of wind turbines conflicts with seismic stations since the noise generated by wind turbines is recorded at seismic stations (e.g., Neuffer et al., 2021, 2019; Neuffer and Kremers, 2017; Stammler and Ceranna, 2016). Therefore it is imperative to find ways to mitigate the noise recorded at seismic stations in order to allow for the building of new WTs and contribute to the passage to renewable energy systems.
The mitigation of seismic noise is an active area of research today, and the recent rise in the number of studies offering solutions for seismic wave mitigation is large (Colombi et al., 2016a, b, 2020; Palermo et al., 2016; Zeighami et al., 2021). Motivated by the study of Colombi et al. (2016a), we model different scenarios including structural changes on the wave path between the source of noise, i.e., the WT, and the seismic stations.
In the case of cross-shaped cavities, we find no suitable attenuation, and instead the amplitude of the wave increased. Contrary to Miniaci et al. (2016) the cross-shaped cavities we used were too small to effectively attenuate the energy. Unlike the case shown in Miniaci et al. (2016), where the cavities were more closely connected to each other, here the energy still travels past the structural changes and amplifies through scattering effects and waveform interference.
To simplify the complexity of the cross-shaped metamaterials by Colombi et al. (2016a) and also potentially reduce dimensions and construction costs, we showed that we are able to effectively mitigate WT noise within the frequency range of 1–10 Hz with half-circular trenches 10 m from the WTs between the WT and the seismic stations. This reduction is seen for distances of 2.5 km, and therefore we conclude that this scenario is a possibility to mitigate the effects of WT noises on seismic stations. However, the filling of the trenches has the opposite effect, due to reverberations of energy within the trench, if it is filled with water or other material. Therefore the trenches, if empty, act like a barrier to seismic energy, and in order to reduce energy efficiently, they need to be deep enough so that the energy cannot diffract around the bottom of the trench. The fact that filling the trenches with water or other material may oppose the desired effects is important to take into consideration because for realistic soil environments, the integrity of the trench can be compromised by having, for example, non-consolidated sediments. Alternative solutions to this situation can be keeping the integrity of the trench with a cement casing as done in the oil industry (Davies et al., 2014) and/or using springs or highly attenuative materials like auxetic metamaterials placed between the walls. One could, for example, design certain auxetic metamaterials with well-known (predicted) properties inside the walls that will trap seismic waves in a certain frequency range. This will stabilize the walls and trap the energy, but of course, it needs further numerical studies in the field of engineering as well.
Our results are consistent when considering a Ricker source or injecting seismic noise generated by WTs (Neuffer et al., 2019) and using a realistic magnitude (Gortsas et al., 2017). Despite the measurement used as a source of seismic noise belonging to a single experiment made by Neuffer et al. (2019), our results should be consistent when considering different sources of WT noise since the energy reduction is observed within a complete frequency window of 1–10 Hz. The trenches in our setup are located close to the wind turbine. The trenches cannot be placed around the station, since they would then affect the signals the seismic station is supposed to record.
Our numerical simulations of WT noise propagation in the presence of topography show that terrains with topographic elevations can help to mitigate the seismic noise recorded at seismological stations; however, modeling a mound with low velocity material, also with scattering, instead increases the energy recorded at the seismic stations. This is in contrast to the case of the “Energieberg” (hill for energy production) in the center of the city of Karlsruhe, Germany. At the top of the hill, three WTs and a photovoltaic system are installed. This hill is around 60 m high and is a disposal site for waste, which seems to produce a strong damping of seismic signals. Zieger (2019) and Ritter (2020) conducted several seismic measurements on WTs placed at a distance from the hill, in order to determine the influence of the subsurface on WT-induced seismic signals for this special case. They found that the WT-induced seismic signals are not visible at distances of 130 m (Zieger, 2019), making this hill a form of metamaterial.
The decline of the seismic amplitudes along the measuring profile away from the hill may be explained by an impedance contrast at the bottom of the waste disposal site between the highly unconsolidated waste material and the natural sediments of the Upper Rhine Plain (Zieger, 2019). Our models include such an impedance contrast at the bottom of our imposed topography, and for low velocities we measure energy increases. Therefore we assume that in particular the attenuation of unconsolidated waste inside the hill is responsible for the seismic noise reduction. With our numerical models we cannot include such attenuation effects. But previous studies showed that unconsolidated material filled with cracks or poroelastic materials generate different attenuation effects, leading to reduction of the seismic energy (Zieger, 2019) or an increase (Hunziker et al., 2018; Müller et al., 2010; Johnston et al., 1979; Toksöz et al., 1979; Biryukov et al., 2016).
Numerical simulations combining different soil parameters such as porosity and plasticity have not been considered in this study due to numerical capability limitations; however their role may be crucial to design the best scenario to attenuate seismic noise emerging from WTs (e.g., Ghaedizadeh et al., 2016; Bessa et al., 2019; Meng et al., 2021; Ji et al., 2020; Mirzaali et al., 2017; Amireddy et al., 2018; Wang et al., 2019). New generations of numerical codes with the necessary capabilities including these effects (e.g., Colombi et al., 2020) will allow a more realistic design of scenarios that will help to mitigate the WT-generated seismic noise.
The data used in this paper is available at https://doi.org/10.5281/zenodo.6652289 (Abreu, 2022).
The SPECFEM3D Cartesian code primarily developed by Dimitri Komatitsch, Jean-Pierre Vilotte, and Jeroen Tromp and the SPECFEM Development Team is freely available through the web page of the Computational Infrastructure for Geodynamics (CIG; https://github.com/geodynamics/specfem3d, last access: 26 May 2022). MeshAssist primarily developed by Hom Nath Gharti is freely available through the webpages https://github.com/homnath/MeshAssist (last access: 17 June 2022) and https://doi.org/10.5281/zenodo.883448 (Gharti et al., 2017). Trelis is available through the webpage https://coreform.com/products/cubit-trelis/ (last access: 17 June 2022).
CT designed and directed the project. RA and DP performed the numerical experiments. RA and CT wrote the manuscript.
The contact author has declared that neither they nor their co-authors have any competing interests.
Publisher’s note: Copernicus Publications remains neutral with regard to jurisdictional claims in published maps and institutional affiliations.
Rafael Abreu acknowledges help and continuous support from Stefan Klingen and Christian Maas for installing and running specfem3d-cartesian at the cluster of the University of Münster as well as the help of Hom-Nath Gharti in the process of the mesh creation. The seismic data used as source input were provided by Tobias Neuffer.
Rafael Abreu and Christine Thomas acknowledge funding from the Europäischer Fonds für regionale Entwicklung (EFRE) (MISS research project (grant nos. EFRE 0801039 and KEE-2-002A)).
This paper was edited by Sara C. Pryor and reviewed by two anonymous referees.
Abreu, R.: RafaelAbreuSeis/WT-input-data: (Version V0), Zenodo [data set], https://doi.org/10.5281/zenodo.6652289, 2022.
Amireddy, K. K., Balasubramaniam, K., and Rajagopal, P.: Porous metamaterials for deep sub-wavelength ultrasonic imaging, Appl. Phys. Lett., 113, 124102, https://doi.org/10.1063/1.5045087, 2018. a
Barthelmie, R. and Pryor, S.: Challenges in predicting power output from offshore wind farms, J. Energ. Eng., 132, 91–103, 2006. a
Barthelmie, R., Wang, H., Doubrawa, P., Giroux, G., and Pryor, S.: Effects of an escarpment on flow parameters of relevance to wind turbines, Wind Energy, 19, 2271–2286, 2016. a
Barthelmie, R. J., Larsen, G., Frandsen, S., Folkerts, L., Rados, K., Pryor, S., Lange, B., and Schepers, G.: Comparison of wake model simulations with offshore wind turbine wake profiles measured by sodar, J. Atmos. Ocean. Tech., 23, 888–901, 2006. a
Barthelmie, R. J., Frandsen, S. T., Nielsen, M., Pryor, S., Rethore, P.-E., and Jørgensen, H. E.: Modelling and measurements of power losses and turbulence intensity in wind turbine wakes at Middelgrunden offshore wind farm, Wind Energy, 10, 517–528, 2007. a
Barthelmie, R. J., Pryor, S. C., Frandsen, S. T., Hansen, K. S., Schepers, J., Rados, K., Schlez, W., Neubert, A., Jensen, L., and Neckelmann, S.: Quantifying the impact of wind turbine wakes on power output at offshore wind farms, J. Atmos. Ocean. Tech., 27, 1302–1317, 2010. a
Bessa, M. A., Glowacki, P., and Houlder, M.: Bayesian machine learning in metamaterial design: Fragile becomes supercompressible, Adv. Mater., 31, 1904845, https://doi.org/10.1002/adma.201904845, 2019. a
Biryukov, A., Tisato, N., and Grasselli, G.: Attenuation of elastic waves in bentonite and monitoring of radioactive waste repositories, Geophysical Supplements to the Monthly Notices of the Royal Astronomical Society, 205, 105–121, 2016. a
Brûlé, S., Javelaud, E. H., Enoch, S., and Guenneau, S.: Flat lens effect on seismic waves propagation in the subsoil, Sci. Rep., 7, 1–9, 2017. a, b
Brûlé, S., Enoch, S., and Guenneau, S.: Emergence of seismic metamaterials: current state and future perspectives, Phys. Lett. A, 384, 126034, https://doi.org/10.1016/j.physleta.2019.126034, 2020. a, b
Clayton, R. and Engquist, B.: Absorbing boundary conditions for acoustic and elastic wave equations, B. Seismol. Soc. Am., 67, 1529–1540, 1977. a
Colombi, A., Colquitt, D., Roux, P., Guenneau, S., and Craster, R. V.: A seismic metamaterial: The resonant metawedge, Sci. Rep., 6, 1–6, 2016a. a, b, c
Colombi, A., Roux, P., Guenneau, S., Gueguen, P., and Craster, R. V.: Forests as a natural seismic metamaterial: Rayleigh wave bandgaps induced by local resonances, Sci. Rep., 6, 1–7, 2016b. a, b
Colombi, A., Zaccherini, R., Aguzzi, G., Palermo, A., and Chatzi, E.: Mitigation of seismic waves: Metabarriers and metafoundations bench tested, J. Sound Vib., 485, 115537, https://doi.org/10.1016/j.jsv.2020.115537, 2020. a, b
Davies, R. J., Almond, S., Ward, R. S., Jackson, R. B., Adams, C., Worrall, F., Herringshaw, L. G., Gluyas, J. G., and Whitehead, M. A.: Oil and gas wells and their integrity: Implications for shale and unconventional resource exploitation, Mar. Petrol. Geol., 56, 239–254, 2014. a
Friedrich, T., Zieger, T., Forbriger, T., and Ritter, J. R.: Locating wind farms by seismic interferometry and migration, J. Seismol., 22, 1469–1483, 2018. a
Ghaedizadeh, A., Shen, J., Ren, X., and Xie, Y. M.: Tuning the performance of metallic auxetic metamaterials by using buckling and plasticity, Materials, 9, 54, https://doi.org/10.3390/ma9010054, 2016. a
Gharti, H. N., Langer, L., Roth, M., Tromp, J., Vaaland, U., and Yan, Z.: MeshAssist: an open-source and cross-platform meshing assistant tool, https://doi.org/10.5281/zenodo.883448, Zenodo [code], 2017. a
Gomez Garcia, P. and Fernández-Álvarez, J.-P.: Floquet–Bloch theory and its application to the dispersion curves of nonperiodic layered systems, Math. Probl. Eng., 2015, 475364, https://doi.org/10.1155/2015/475364, 2015. a
Gortsas, T. V., Triantafyllidis, T., Chrisopoulos, S., and Polyzos, D.: Numerical modelling of micro-seismic and infrasound noise radiated by a wind turbine, Soil Dyn. Earthq. Eng., 99, 108–123, 2017. a, b, c, d
Hu, W., Letson, F., Barthelmie, R., and Pryor, S.: Wind gust characterization at wind turbine relevant heights in moderately complex terrain, J. Appl. Meteorol. Clim., 57, 1459–1476, 2018. a
Hu, W., Barthelmie, R. J., Letson, F., and Pryor, S. C.: Seismic Noise Induced by Wind Turbine Operation and Wind Gusts, Seismol. Res. Lett., 91, 427–437, 2020. a, b
Hunziker, J., Favino, M., Caspari, E., Quintal, B., Rubino, J. G., Krause, R., and Holliger, K.: Seismic attenuation and stiffness modulus dispersion in porous rocks containing stochastic fracture networks, J. Geophys. Res.-Sol. Ea., 123, 125–143, 2018. a
Ji, G., Fang, Y., and Zhou, J.: Porous acoustic metamaterials in an inverted wedge shape, Extreme Mech. Lett., 36, 100648, https://doi.org/10.1016/j.eml.2020.100648, 2020. a
Johnston, D. H., Toksöz, M., and Timur, A.: Attenuation of seismic waves in dry and saturated rocks: II. Mechanisms, Geophysics, 44, 691–711, 1979. a
Kittel, C., McEuen, P., and McEuen, P.: Introduction to Solid State Physics, 8th edn., Wiley, New York, ISBN: 978-0471415268, 2004. a
Köhler, A., Weidle, C., and Maupin, V.: On the effect of topography on surface wave propagation in the ambient noise frequency range, J. Seismol., 16, 221–231, 2012. a
Komatitsch, D. and Martin, R.: An unsplit convolutional perfectly matched layer improved at grazing incidence for the seismic wave equation, Geophysics, 72, SM155–SM167, 2007. a
Komatitsch, D. and Tromp, J.: Introduction to the spectral element method for three-dimensional seismic wave propagation, Geophys. J. Int., 139, 806–822, 1999. a
Komatitsch, D. and Tromp, J.: A perfectly matched layer absorbing boundary condition for the second-order seismic wave equation, Geophys. J. Int., 154, 146–153, 2003. a
Lacanna, G., Ichihara, M., Iwakuni, M., Takeo, M., Iguchi, M., and Ripepe, M.: Influence of atmospheric structure and topography on infrasonic wave propagation, J. Geophys. Res.-Sol. Ea., 119, 2988–3005, 2014. a
Legerton, M., Manley, D. P., Sargent, J., Snow, D., and Styles, P.: Low frequency noise & vibration levels at a modern wind farm, in: Inter-Noise 96, Noise control: the next 25 years, Liverpool, 30 July–2 August 1996, 459–462, https://pascal-francis.inist.fr/vibad/index.php?action=getRecordDetail&idt=2724083 (last access: 26 May 2022), 1996. a
Letson, F., Barthelmie, R. J., Hu, W., and Pryor, S. C.: Characterizing wind gusts in complex terrain, Atmos. Chem. Phys., 19, 3797–3819, https://doi.org/10.5194/acp-19-3797-2019, 2019. a
Lim, C. et al.: Natural seismic metamaterials: the role of tree branches in the birth of Rayleigh wave bandgap for ground born vibration attenuation, Trees, 35, 1–17, https://doi.org/10.1007/s00468-021-02117-8, 2021. a
Liu, Y.-f., Huang, J.-k., Li, Y.-g., and Shi, Z.-f.: Trees as large-scale natural metamaterials for low-frequency vibration reduction, Constr. Build. Mater., 199, 737–745, 2019. a
Marcillo, O. E. and Carmichael, J.: The detection of wind-turbine noise in seismic records, Seismol. Res. Lett., 89, 1826–1837, 2018. a
Meng, Z., Ouyang, Z., and Chen, C. Q.: Multi-step metamaterials with two phases of elastic and plastic deformation, Compos. Struct., 271, 114152, https://doi.org/10.1016/j.compstruct.2021.114152, 2021. a
Miniaci, M., Krushynska, A., Bosia, F., and Pugno, N. M.: Large scale mechanical metamaterials as seismic shields, New J. Phys., 18, 083041, https://doi.org/10.1088/1367-2630/18/8/083041, 2016. a, b, c, d, e, f, g, h, i, j
Mirzaali, M., Habibi, M., Janbaz, S., Vergani, L., and Zadpoor, A.: Crumpling-based soft metamaterials: The effects of sheet pore size and porosity, Sci. Rep., 7, 1–7, 2017. a
Müller, T. M., Gurevich, B., and Lebedev, M.: Seismic wave attenuation and dispersion resulting from wave-induced flow in porous rocks – A review, Geophysics, 75, 75A147–75A164, 2010. a
Neuffer, T.: Microseismic Noise Induced by Wind Turbines, PhD thesis, Ruhr-Universität Bochum, https://doi.org/10.13154/294-7199, 2020. a, b, c
Neuffer, T. and Kremers, S.: How wind turbines affect the performance of seismic monitoring stations and networks, Geophys. J. Int., 211, 1319–1327, 2017. a, b, c, d, e, f, g, h, i, j
Neuffer, T., Kremers, S., and Fritschen, R.: Characterization of seismic signals induced by the operation of wind turbines in North Rhine-Westphalia (NRW), Germany, J. Seismol., 23, 1161–1177, 2019. a, b, c, d, e, f, g
Neuffer, T., Kremers, S., Meckbach, P., and Mistler, M.: Characterization of the seismic wave field radiated by a wind turbine, J. Seismol., 25, 825–844, 2021. a, b, c, d
Olsen, K.: Site amplification in the Los Angeles basin from three-dimensional modeling of ground motion, B. Seismol. Soc. Am., 90, S77–S94, 2000. a, b
Palermo, A., Krödel, S., Marzani, A., and Daraio, C.: Engineered metabarrier as shield from seismic surface waves, Sci. Rep., 6, 1–10, 2016. a, b, c
Pryor, S., Schoof, J., and Barthelmie, R.: Climate change impacts on wind speeds and wind energy density in northern Europe: empirical downscaling of multiple AOGCMs, Clim. Res., 29, 183–198, 2005. a
Ritter, J.: Erarbeitung eines Prognosetools für seismische Immissionen an Erdbeben-Messstationen in Nordrhein-Westfalen (NRW), Karlsruher Institut für Technologie, Tech. rep., https://www.gd.nrw.de/zip/seismische-immissionen-kit-bericht.pdf (last access: 26 May 2022), 2020. a
Rushforth, I., Styles, P., Manley, D., and Toon, S.: Microseismic investigations of low frequency vibrations and their possible effects on populations, J. Low Freq. Noise V. A., 18, 111–121, 1999. a
Rushforth, I., Moorhouse, A., and Styles, P.: An Integrated Acoustic/Microseismic Approach to Monitoring Low Frequency Noise & Vibration – A Case Study, Build. Acoust., 10, 77–95, 2003. a
Schofield, R.: Seismic measurements at the stateline wind project, Laser Interferometer Gravitational Wave Observatory, LIGO-T020104-00-Z, https://dcc-backup.ligo.org/public/0027/T020104/000/T020104-00.pdf (last access: 26 May 2022), 2001. a, b
Shumway, G.: Sound speed and absorption studies of marine sediments by a resonance method, Geophysics, 25, 451–467, 1960. a
Stacey, R.: Improved transparent boundary formulations for the elastic-wave equation, B. Seismol. Soc. Am., 78, 2089–2097, 1988. a
Stammler, K. and Ceranna, L.: Influence of wind turbines on seismic records of the Gräfenberg array, Seismol. Res. Lett., 87, 1075–1081, 2016. a, b, c, d, e
Styles, P., Stimpson, I., Toon, S., England, R., and Wright, M.: Microseismic and infrasound monitoring of low frequency noise and vibrations from windfarms, Recommendations on the Siting of Windfarms in the Vicinity of Eskdalemuir, Scotland, Report to MOD/FTI/BWEA, 125 pp., https://docs.wind-watch.org/AEG-Eskdalemuir.pdf (last access: 26 May 2022), 2005. a
Tabassum-Abbasi, Premalatha, M., Abbasi, T., and Abbasi, S.: Wind energy: Increasing deployment, rising environmental concerns, Renew. Sust. Energ. Rev., 31, 270–288, 2014. a
Toksöz, M., Johnston, D. H., and Timur, A.: Attenuation of seismic waves in dry and saturated rocks: I. Laboratory measurements, Geophysics, 44, 681–690, 1979. a
Wang, Y.-F., Liang, J.-W., Chen, A.-L., Wang, Y.-S., and Laude, V.: Wave propagation in one-dimensional fluid-saturated porous metamaterials, Phys. Rev. B, 99, 134304, https://doi.org/10.1103/PhysRevB.99.134304, 2019. a
Westwood, R., Styles, P., and Toon, S.: Monitoring and modelling the vibrational effects of small (<50 kw) wind turbines on the Eskdalemuir IMS station, Seismic monitoring and multiphysics modelling of ground-borne vibrations from small wind turbines, Fourth International Meeting on Wind Turbine Noise, Rome, Italy, 12–14 April 2011, https://doi.org/10.13140/2.1.2131.4880, 2011. a
Westwood, R. F. and Styles, P.: Assessing the seismic wavefield of a wind turbine using polarization analysis, Wind Energy, 20, 1841–1850, 2017. a
Westwood, R. F., Styles, P., and Toon, S. M.: Seismic monitoring and vibrational characterization of small wind turbines: A case study of the potential effects on the Eskdalemuir International Monitoring System Station in Scotland, Near Surf. Geophys., 13, 115–126, 2015. a
Wirth, E. A., Vidale, J. E., Frankel, A. D., Pratt, T. L., Marafi, N. A., Thompson, M., and Stephenson, W. J.: Source-dependent amplification of earthquake ground motions in deep sedimentary basins, Geophys. Res. Lett., 46, 6443–6450, 2019. a, b
Zeighami, F., Palermo, A., and Marzani, A.: Rayleigh waves in locally resonant metamaterials, Int. J. Mech. Sci., 195, 106250, https://doi.org/10.1016/j.ijmecsci.2020.106250, 2021. a
Zieger, T.: Experimental quantification of seismic signals induced by wind turbines, PhD thesis, Karlsruher Institut für Technologie, https://doi.org/10.5445/IR/1000096453, 2019. a, b, c, d
Zieger, T. and Ritter, J. R.: Influence of wind turbines on seismic stations in the upper rhine graben, SW Germany, J. Seismol., 22, 105–122, https://doi.org/10.1007/s10950-017-9694-9, 2018. a, b