the Creative Commons Attribution 4.0 License.
the Creative Commons Attribution 4.0 License.
 | 11 Jul 2022
A model test study on the parameters affecting the cyclic lateral response of monopile foundations for offshore wind turbines embedded in non-cohesive soils
Martin Achmus
During their service life, monopiles supporting offshore wind turbines are subjected to a large number of lateral cyclic loads resulting from complex environmental conditions such as wind and waves varying in amplitude, direction, load eccentricity and frequency. The consequential accumulation of displacements and rotations of the foundation structure with cyclic loading is one key concern in the design of monopiles. Nevertheless, the relevant offshore guidelines do not provide suitable procedures for predicting such deformations. Although there are several methods for this purpose in the literature, some of them produce very different or even contradictory results, which prevents a consistent approach to dimensioning. This paper briefly summarizes the current standardization regarding design of monopiles for cyclic lateral loading and provides some examples of possible prediction models from the literature. To highlight the need for further research, the predictions according to different approaches are compared and evaluated by a calculation example and a parameter study. Further, the results of a small-scale 1 g model test campaign on the load-displacement behaviour of monopile foundations subjected to lateral cyclic loading and the influencing parameters are presented, evaluated and compared with the findings of other research groups. In this way the test results can help to support or improve model development and provide insight into key issues relevant to monopile design. The parameters that have been assessed include the cyclic load magnitude, cyclic load ratio, load eccentricity, soil relative density, the grain size distribution of the non-cohesive bedding material and the pile embedment length.
- Article
(4221 KB) - Full-text XML
- BibTeX
- EndNote


Offshore wind energy is one of the promising solutions for sustainable energy, but for the wind industry to be competitive, it is vital that costs are significantly reduced for future projects. This can be achieved, on the one hand, by introducing new technologies and, on the other hand, by improving existing technologies and design methods. One of the areas where costs can be reduced is the support structure, which accounts typically for about 16 % to 35 % of the total cost of an offshore wind turbine (OWT) and whose cost increase substantially with water depth (Bhattacharya et al., 2021). With regard to continuously increasing water depths of future wind farm sites and projects, an improved design of the foundation structure can therefore make a significant contribution to the competitiveness of offshore wind energy.
Up to now, the prevailing support structure for offshore wind energy converters at low to medium water depths is the monopile foundation, a single pile with large diameter (D) and a relatively small ratio of embedment length (L) to the diameter () that transfers the predominantly horizontal loads from the action of wind and waves into the seabed. Its popularity can be explained by its suitability for mass fabrication, robustness for most soil conditions, relatively simple design and therefore cost efficiency. To extend the range of applications of the monopile and make use of the related benefits, pile diameters have to be extended (leading to decreasing ratios), and more accurate design methods, specifically tailored to the offshore wind industry, have to be developed.
A governing factor in the design of monopile foundations is compliance with serviceability limit state and associated strict tilting tolerances. This means that an accurate prediction of pile displacement and rotation accumulation resulting from cyclic-occurring horizontal loads plays a key role for the final dimensions of the foundation structure and therefore its costs. However, current offshore guidelines do not provide appropriate procedures for the prediction of pile displacement accumulations, which is especially true for monopiles, which due to their large dimensions and low ratios have a significantly different load-displacement behaviour than long and slender piles. For this reason, a variety of new empirical and numerical approaches for the estimation of cyclic deformation behaviour of monopiles have been proposed in the literature. Although these methods were usually developed specifically for monopile foundations, they sometimes provide very different and partly contradictory results with respect to the resulting deformations and the governing parameters.
The article at hand first summarizes the current standards and developments regarding the estimation of permanent deformations of offshore monopiles before selected prediction models are compared with each other on the basis of a calculation example and a parameter study. In order to gain further insight into the deformation behaviour of monopiles due to lateral cyclic loading, results of a comprehensive test campaign of small-scale 1 g model experiments are presented and discussed. The results are used to identify the governing parameters and to evaluate existing empirical approaches. Based on the results, qualitative conclusions can be drawn. The findings can thus contribute to a better understanding of the complex processes associated with the cyclic load-bearing behaviour of piles and to the development of improved calculation approaches.
The design of offshore structures, such as monopile foundations for offshore wind turbines, is usually based on the latest version of the offshore guidelines, e.g. DNV GL (2018) or API (2014). These also regulate the required design checks, which include the proofs for ultimate limit states (ULSs), serviceability limit states (SLSs), fatigue limit states (FLSs) and accidental limit states (ALSs). In the case of large-diameter monopiles for OWTs, the SLS proof for long-term lateral cyclic loading resulting from millions of wind and wave loads is often decisive for the dimensioning of the foundation. For this proof, limit values for permanent pile head displacement or rotation at seabed level are usually specified by turbine manufacturers or structural designers, whose compliance is to ensure the safe and smooth operation of the turbine until the end of its planned service life. As an example, the DNV GL (2018) guideline for this proof provides the usual limit values of 0.5∘ pile head rotation, including an installation tolerance of 0.25∘, which means that the additional accumulated rotation due to lateral cyclic loading must be limited to less than 0.25∘ in this case. Both the DNV GL (2018) and the API (2014) guideline mention the so-called p–y method as a possibility to model the pile–soil interaction in horizontal direction and to predict the load-deformation behaviour of a pile foundation due to lateral loads. This method models the pile–soil system by discretising the pile into a number of elastic beam elements, interconnected by nodal points, and with uncoupled soil support springs laterally attached to these nodal points. Loads such as horizontal forces or moments are applied directly to the pile head. The characteristics of the springs (p–y curves) are hereby non-linear and describe the relationship between soil's bedding resistance (p) and lateral pile displacement (y). Therefore, the reliability of the calculated prediction of pile deformations by this method strongly depends on the chosen formulation of the p–y curves. While API (2014) refers to API RP 2GEO (2014) for an approach to the construction of p–y curves, the DNV GL (2018) does not recommend a specific approach but points out that any p–y method to be used for piles larger than 1.0 m in diameter should be validated by means of other methods (e.g. finite element calculations). This remark results from the fact that most p–y approaches (including the API RP 2GEO, 2014, method) are largely based on some well-documented field tests on small-diameter, long and therefore slender piles reported by Reese et al. (1974), O'Neill and Murchison (1984), and others. Since the load transfer behaviour of such slender and thus more flexible piles with large ratios differs significantly from that of rigid piles (e.g. typical large-diameter monopiles), these methods should not be used for this field of application without further validation. In addition to this general issue regarding the p–y method or most of the approaches for the determination of p–y curves, the DNV GL (2018) guideline states that the SLS proof of a monopile requires that it represents the behaviour of the soil under cyclic loading in such a way that cumulative deformations in the soil are appropriately calculated as a function of the number of load cycles at each load amplitude in the applied history of SLS loads. However, no specific procedure for this purpose is mentioned in DNV GL (2018) either. In contrast, the p–y method according to API RP 2GEO (2014) allows for the consideration of cyclic loads by a simple adjustment of the proposed p–y curves by an empirical calibration factor. When being applied, this factor leads to an overall softer foundation response and a reduced pile capacity without considering the number of applied load cycles, load magnitude or other parameters of the load or the pile–soil system. As the calibration factor according to the API RP 2GEO (2014) approach was derived from field tests with less than 100 load cycles in most cases, this method is widely deemed to be unsuitable for SLS verifications of monopiles for OWTs, especially when large-diameter piles are used. In this context, the API (2014) states that the methods referred to are only intended as recommendation. Therefore, if further detailed information from advanced soil testing and pile testing in the centrifuge, at model scale or even at full scale is available, then also other methods may be justified.
In summary, as can be seen from the above, both offshore guidelines, while regulating the principles of design of offshore foundations, do not provide a generally applicable method for pile deformation assessment due to lateral cyclic loading for SLS verification of large-diameter monopiles. Instead, it is up to the designer to choose a suitable method for this purpose. Accordingly, there are several publications on the subject of cyclic laterally loaded piles in the literature and on how deformations due to such loads can be predicted. Most of the methods proposed are based either on a limited number of small-scale model tests at 1 g or tests in the centrifuge, with a few approaches also based on field experiments. Mostly, these approaches were derived from best-fit curves, for which it has been found that for a given load level and type of loading, the ratio of the pile head displacement accumulated after N load cycles (yN) and the maximum displacement reached within the first cycle (y1) can most generally be described as a function of the number of load cycles (N) by either a power or a logarithmic function as shown in Eqs. (1) and (2).
Here, α and t are referred to as accumulation parameters and may be defined differently depending on the chosen approach taken from the literature. It should be noted that according to some methods, also pile head rotations (θN, θ1) are used as deformation variables in Eqs. (1) or (2) instead of the pile head displacements (yN, y1). The maximum deformation reached within the first load cycle (y1 or θ1) is usually determined from monotonic load-displacement or load-rotation curves, which in turn can be calculated using a suitable method as, for example, finite element calculations, an appropriate p–y method (e.g. Kallehave et al., 2012; Sørensen, 2012; Thieken et al., 2015) or the PISA method (see, for example, Byrne et al., 2017, 2019; amongst other). Although both equations (Eqs. 1 and 2) are often considered to describe the variation in accumulated pile deformations with the number of load cycles, most studies indicate that for a pile–soil system that behaves almost rigid, the power function according to Eq. (1) gives more accurate results, whereas the logarithmic function better fits a flexible pile behaviour when subjected to cyclic loading (see, for example, Peralta, 2010).
While early publications on the topic of cyclic laterally loaded pile foundations focused primarily on the behaviour of long and slender piles with a limited number of mostly one-way load cycles (see, for example, Hettler, 1981; Little and Briaud, 1988; Long and Vanneste, 1994; Lin and Liao, 1999), the interest of the last decade has been mainly in predicting the behaviour of piles with dimensions and loading conditions typical for offshore monopile foundations (e.g. rigid pile behaviour, higher number of load cycles, one- and two-way loading). In order to clearly describe constant cyclic loading conditions, the two load parameters ζb and ζc defined by Eqs. (3) and (4) are well established.
In these equations, the reference horizontal force or moment (Href or Mref) is that corresponding to monotonic loading of a pile soil system at failure or at a reference displacement or rotation (yref or θref) at the soil surface. As a geotechnical failure of a rigid, laterally loaded pile in sand due to monotonic loading can require large pile deformations, it has become common practice to define Href or Mref not at pile failure but at significantly lower reference values for yref or θref. Further, Hmin and Hmax are the minimum and maximum horizontal forces being applied to the pile within a load cycle, with associated moments Mmin and Mmax acting on the pile head at ground level. Therefore, ζb can be interpreted as the cyclic load magnitude, while ζc is the loading type, with Hmax and Hmin taking positive and negative values for two-way loading, respectively.
Since offshore loads are of course not constant cyclic loads, it is common practice to divide the real and highly variable in situ load series into load packages with constant mean load and amplitude using various methods (e.g. rain flow counting). Subsequently, the individual load packages with corresponding load cycle numbers can be converted into a single load package with clearly defined load parameters ζb and ζc, as well as an equivalent number of load cycles (Nequ), so that this equivalent load package provides a comparable damage or load to the structure as the original load series. As a result, even simple approaches, such as those shown in Eqs. (1) and (2), can be used to predict the deformation accumulation of a pile under variable load amplitudes. However, since the determination of equivalent load packages and cycle numbers is a broad topic, this paper is limited only to the subject of constant loads. For procedures to determine equivalent load packages from random two-way lateral loads, reference is made to LeBlanc et al. (2010b) and Jalbi et al. (2020), for example.
In order to investigate the load-bearing behaviour of large-diameter piles in sand subjected to long-term lateral cyclic loading, Peralta (2010) conducted a series of 34 scaled 1 g model tests (13 monotonic and 21 cyclic) on model piles (D=60 mm) with ratios within the range of 3.33–8.33 and up to 10 000 load cycles. The tests involved cyclic one-way loading only, with loads being applied with an eccentricity (h) of 240 mm (distance between load application point and soil surface). Both rigid and flexible pile–soil systems with different relative soil densities (Dr) and pile bending stiffnesses (EpIp) were investigated. In addition, also the influence of the cyclic load magnitude ζb was considered. As a result, it has been found that the measured pile displacement accumulations of the rigid pile–soil systems followed a power function as shown in Eq. (1), while a logarithmic trend (Eq. 2) was observed for the piles with a more flexible behaviour. For the accumulation parameters given in Eqs. (1) and (2), Peralta (2010) suggests values of αP=0.12 and tP=0.21 for rigid and flexible pile–soil systems, respectively, regardless of the soil relative density. An influence of the load magnitude (ζb) on the accumulation parameters (αP and tP) was also not observed; the load magnitude (ζb) and soil relative density (Dr) correlated only with the value of y1.
LeBlanc et al. (2010a) also conducted a series of 21 small-scale model tests (6 monotonic and 15 cyclic) at 1 g, in which the influence of not only the load magnitude ζb but also the loading type ζc and the soil relative density (Dr) was investigated in more detail. The rigid model pile had a diameter (D) of 80 mm and a ratio of 4.5, which is typical for large-diameter monopiles. Lateral loads have been applied with up to 65 370 load cycles (at least 7400) and an eccentricity (h) of 430 mm resulting in an ratio of 5.38. In order to take scaling effects into account and to ensure comparability of the dilatancy and shearing behaviour of the soil (dry silica sand) between the model and true scale, the model tests were carried out at relative densities (Dr) of only 0.04 (very loose) and 0.38 (medium dense). As the shear parameters of the soil are stress-dependent (at least for very small vertical stresses), LeBlanc et al. (2010a) provide a graphical relationship between vertical effective stress with reference stress taken at a depth (z) of 0.8 L, soil relative density (Dr) and peak friction angle (φ′), which can be used to convert the relative densities used in the model tests to a true-scale monopile. Based on the results of the conducted cyclic tests LeBlanc et al. (2010a) propose the power function approach given in Eq. (5) to describe permanent increases in pile head rotation (Δθ) with load cycle number (N).
For the accumulation parameter (αθ, LB) they recommend a value of 0.31. The factors Tb, LB and Tc, LB were identified to be dependent on load characteristics and soil relative density and have been defined in terms of graphical functions (see LeBlanc et al., 2010a). While Tb, LB increases linearly with load magnitude (ζb) and takes larger values for a higher relative density (Dr), the Tc, LB function indicating the influence of the loading type (ζc) on the pile head rotation accumulation is according to the results of LeBlanc et al. (2010a) not affected by soil relative density (Dr) and shows a maximum of approximately 4 at a cyclic load ratio of (asymmetric two-way loading).
Another approach was proposed by Klinkvort and Hededal (2013), who in their centrifuge tests (5 monotonic and 12 cyclic) on almost rigid model piles with diameters (D) of 28 and 40 mm, respectively, and a constant ratio of 6 applied up to 10 000 load cycles (however, most of the tests involved only 500 load cycles) with a normalized load eccentricity () of 15. The soil relative density (Dr) in these tests ranged from 0.79 to 0.96, and the applied cyclic loads also varied in both their load magnitude (ζb) and cyclic load ratio (ζc). The results regarding the pile head displacement have been found to follow a power law according to Eq. (1), but unlike the findings of Peralta (2010), Klinkvort and Hededal (2013) found an influence of the load magnitude (ζb) and cyclic load ratio (ζc) on the accumulation parameter. An impact of the soil relative density (Dr), however, could not be determined. As a result, Klinkvort and Hededal (2013) defined the accumulation parameter (α) from Eq. (1) as follows:
where Tb,K&H and Tc, K&H were defined by two functions depending on ζb and ζc, respectively. While the Tb, K&H function indicates a linear increase with cyclic load magnitude (ζb), Tc, K&H(ζc) is given by a third-order polynomial with a maximum value slightly larger than 1 for and even negative values of up to −1.95 for perfect two-way loading (), which means that the accumulation of displacement is reversed for this loading condition and the pile moves back to its initial position.
Li et al. (2015) conducted one of the few field test studies, in which four open-ended steel pipe piles with an outer diameter (D) of 340 mm, wall thickness (t) of 14 mm and an embedment length (L) of 2200 mm () were tested in an over-consolidated fine sand with a relative density (Dr) close to 1. All loads have been applied with a normalized eccentricity () of 1.18. Two pile tests were performed to derive monotonic load-displacement curves and determine Href (see Eq. 3). In the other two tests, cyclic one-way loads (ζc=0) were applied in three load packages of different cyclic load magnitudes, increasing from small to larger values of ζb and with different numbers of load cycles ranging from N=40 to N=4007 for each load package. After cycling, monotonic tests were performed in order to determine the post-cyclic load-displacement response of the piles and to see the effect of the cyclic loading history. The results of the cyclic tests have been fitted by both power and logarithmic functions as given in Eqs. (1) and (2) and with respect to pile head displacement (y), as well as pile head rotation (θ). Further, a Miner-rule-based superposition method with both models (the logarithmic and power law functions) was applied to the results to prove the validity of this method to predict the accumulated pile head response to multi-amplitude lateral cyclic loading. From the evaluation of the results, Li et al. (2015) propose and as power law accumulation parameters for displacement (y) and rotation (θ), respectively. For the corresponding logarithmic accumulation parameters they suggest and . However, since these values are based on only two cyclic tests with one-way loading, no conclusions can be drawn about the influence of varying soil relative density (Dr) or other cyclic load ratios (ζc). Regarding the superposition model, Li et al. (2015) found a very good overall prediction of the model with both logarithmic and power functions.
A study involving considerably more model tests and different boundary conditions was conducted by Truong et al. (2019). In this study, 17 centrifuge tests (3 static and 14 cyclic) with different soil relative densities (Dr=0.57 to Dr=0.95), pile slenderness ratios ( and ) and load magnitudes (ζb) were conducted. The model piles had diameters (D) of 11 mm and 40 mm. Also normalized load eccentricity was varied between and , and cyclic loads have been applied with load cycle numbers (N) between 50 and 1500 with different cyclic load ratios (ζc). In addition to these centrifuge tests, Truong et al. (2019) also considered the test results of Klinkvort and Hededal (2013), Li et al. (2015), and Rosquoët et al. (2007) to develop a new method for the estimation of pile head displacement accumulations with load cycle number (N). Based on the aforementioned results, they suggest a power law as given in Eq. (1) in combination with an accumulation parameter (α) according to Eq. (7) to account for different soil relative densities (Dr>0.5) and cyclic load ratios (ζc).
Following this approach, maximum pile head accumulations result from cyclic load ratios of about and lower soil relative densities (Dr). Further, Truong et al. (2019) could not confirm a significant effect of the load magnitude (ζb) or the eccentricity of applied loads (h), although these variables are of course included in Eq. (1) as the displacement due to initial loading (y1) depends on them.
A recent proposal for an approach to calculate the accumulation parameter (α) given in Eq. (1) for pile head displacement from Li et al. (2020) is based on a series of 20 centrifuge tests (2 monotonic and 18 cyclic) on model piles with a diameter (D) of 18 mm and an embedment length (L) of 90 mm (). In this study, two different soil relative densities (Dr=0.5 and Dr=0.8) have been tested, and cyclic loads have been applied with load cycle numbers (N) ranging from 42 to 153, a normalized load eccentricity () of 8 and several different load magnitudes (ζb), as well as cyclic load ratios (ζc). Together with Eq. (1), for the accumulation parameter (α) Li et al. (2020) suggest the formulation of Klinkvort and Hededal (2013) given in Eq. (6) but define a new set of functions to derive Tb and Tc (here referred to as Tb, L and Tc, L). In contrast to Klinkvort and Hededal (2013), Li et al. (2020) found Tb independent from load magnitude to be a constant, taking a value of . The parameter Tc, L is given by two equations, each dependent on the cyclic load ratio (ζc), for the two soil relative densities (Dr) used in their test series. According to this approach, the largest accumulation parameter (α) and therefore most displacement accumulation results from asymmetric cyclic two-way loading with and a soil relative density (Dr) of 0.5.
From the above, it can be seen that a variety of different approaches exists for the estimation of cyclic deformation accumulations. Even if the studies and methods mentioned here represent only part of the approaches to be found in the literature, it is already apparent from this that due to the complexity of the mechanisms driving displacement accumulation and inherent differences in reported tests, disagreements in results of different studies and the approaches derived from them are to be expected. Therefore, careful examination of the assumptions and the applicability of each proposed method is required. To facilitate a comparison of the individual methods mentioned and the most important underlying boundary conditions, these are summarized briefly in Table 1.
Table 1Overview of models for cyclic displacement or rotation accumulation resulting from lateral cyclic loading.
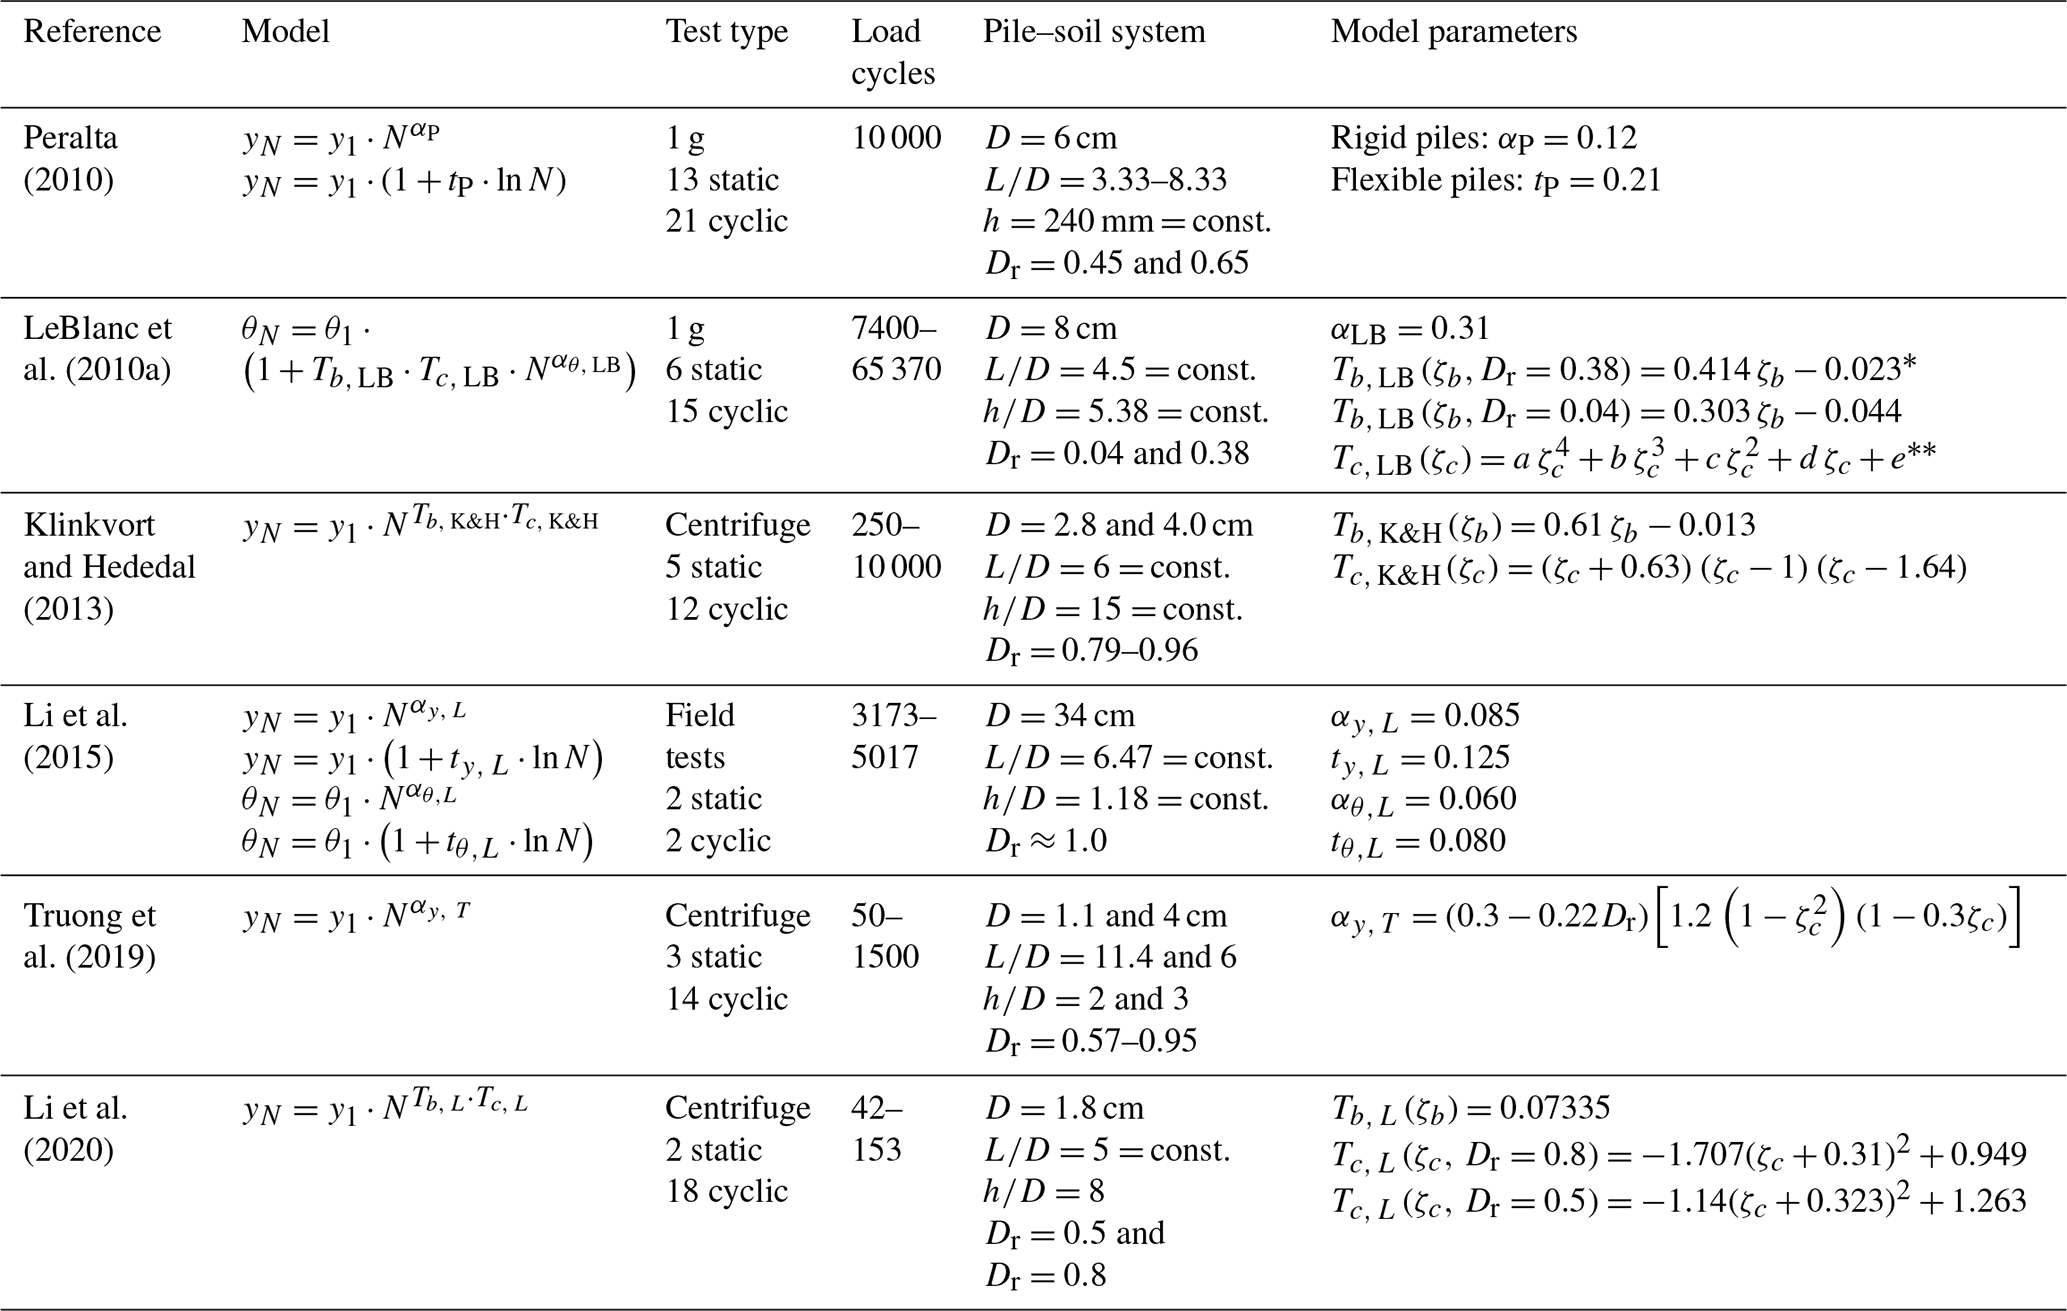
* Tb and Tc functions fitted based on the graphical representations given in LeBlanc et al. (2010a).
Polynomial factors for the determination of : a=113.33; b=288.56; c=238.88; d=73.48; and e=9.94, as well as Tc(ζc>−0.3): a=3.06; ; c=5.22;
; and e=0.99.
To allow not only a qualitative but a quantitative comparison of the different empirical methods for the prediction of monopile deformation accumulations resulting from lateral cyclic loading given in Table 1, a calculation example and a parameter study are presented in the following. Since all the above approaches describe deformation of the pile accumulated after a certain number of load cycles (yN or θN) as a function of the initial deformation after first loading (y1 or θ1), a monotonic load-displacement or load-rotation curve, respectively, is the basis for further calculations. Therefore, Fig. 1 shows the response of a steel pile ( kN m−2, γs=68 kN m−3, νs=0.27) with typical monopile dimensions (D=8 m, t=0.08 m, L=32 m) and an ratio of 4 to monotonic loading. It was calculated for a load eccentricity (h) of 32 m with the p–y method proposed by Thieken et al. (2015) using the freely accessible pile design program IGTHPile V3.1 (Terceros et al., 2015). The relevant soil parameters for the calculation representative of a homogeneous and dense sand layer are given in the bottom line of Table 2.
On the one hand, these curves can be used to determine the displacement or rotation (y1 or θ1) for a given load, and, on the other hand, they can be used to determine the reference load (Href) for the definition of the load magnitude (ζb) according to Eq. (3). However, as there is no single criterion for determining Href, this value had to be evaluated for each approach according to the specifications of the respective authors. Relevant deformation criteria for the definition of the reference load (Href) and corresponding values taken from Fig. 1 are given in Table 2. It should be mentioned that due to the different specifications regarding the reference load (Href), a direct comparison of load magnitudes (ζb) between different approaches (see Table 1) is not possible. In order to be able to make a direct comparison of the various prediction models within the framework of the parameter study, the cyclic loads were defined in terms of absolute magnitude (Hmax) rather than their relative load magnitude (ζb). Since the relative load magnitude (ζb) is nevertheless required as an input variable for some of the models shown in Table 1, it was determined and summarized in Table 2 for a bandwidth of horizontal loads (Hmax) depending on the associated value of the reference force (Href) for each method. Here, it can be seen that both the reference pile capacities (Href) and therefore also the associated relative load magnitudes (ζb(Hmax)) vary over a wide range depending on the chosen criterion, even exceeding the value of 1 when θref=0.5∘ is applied as proposed by Truong et al. (2019).
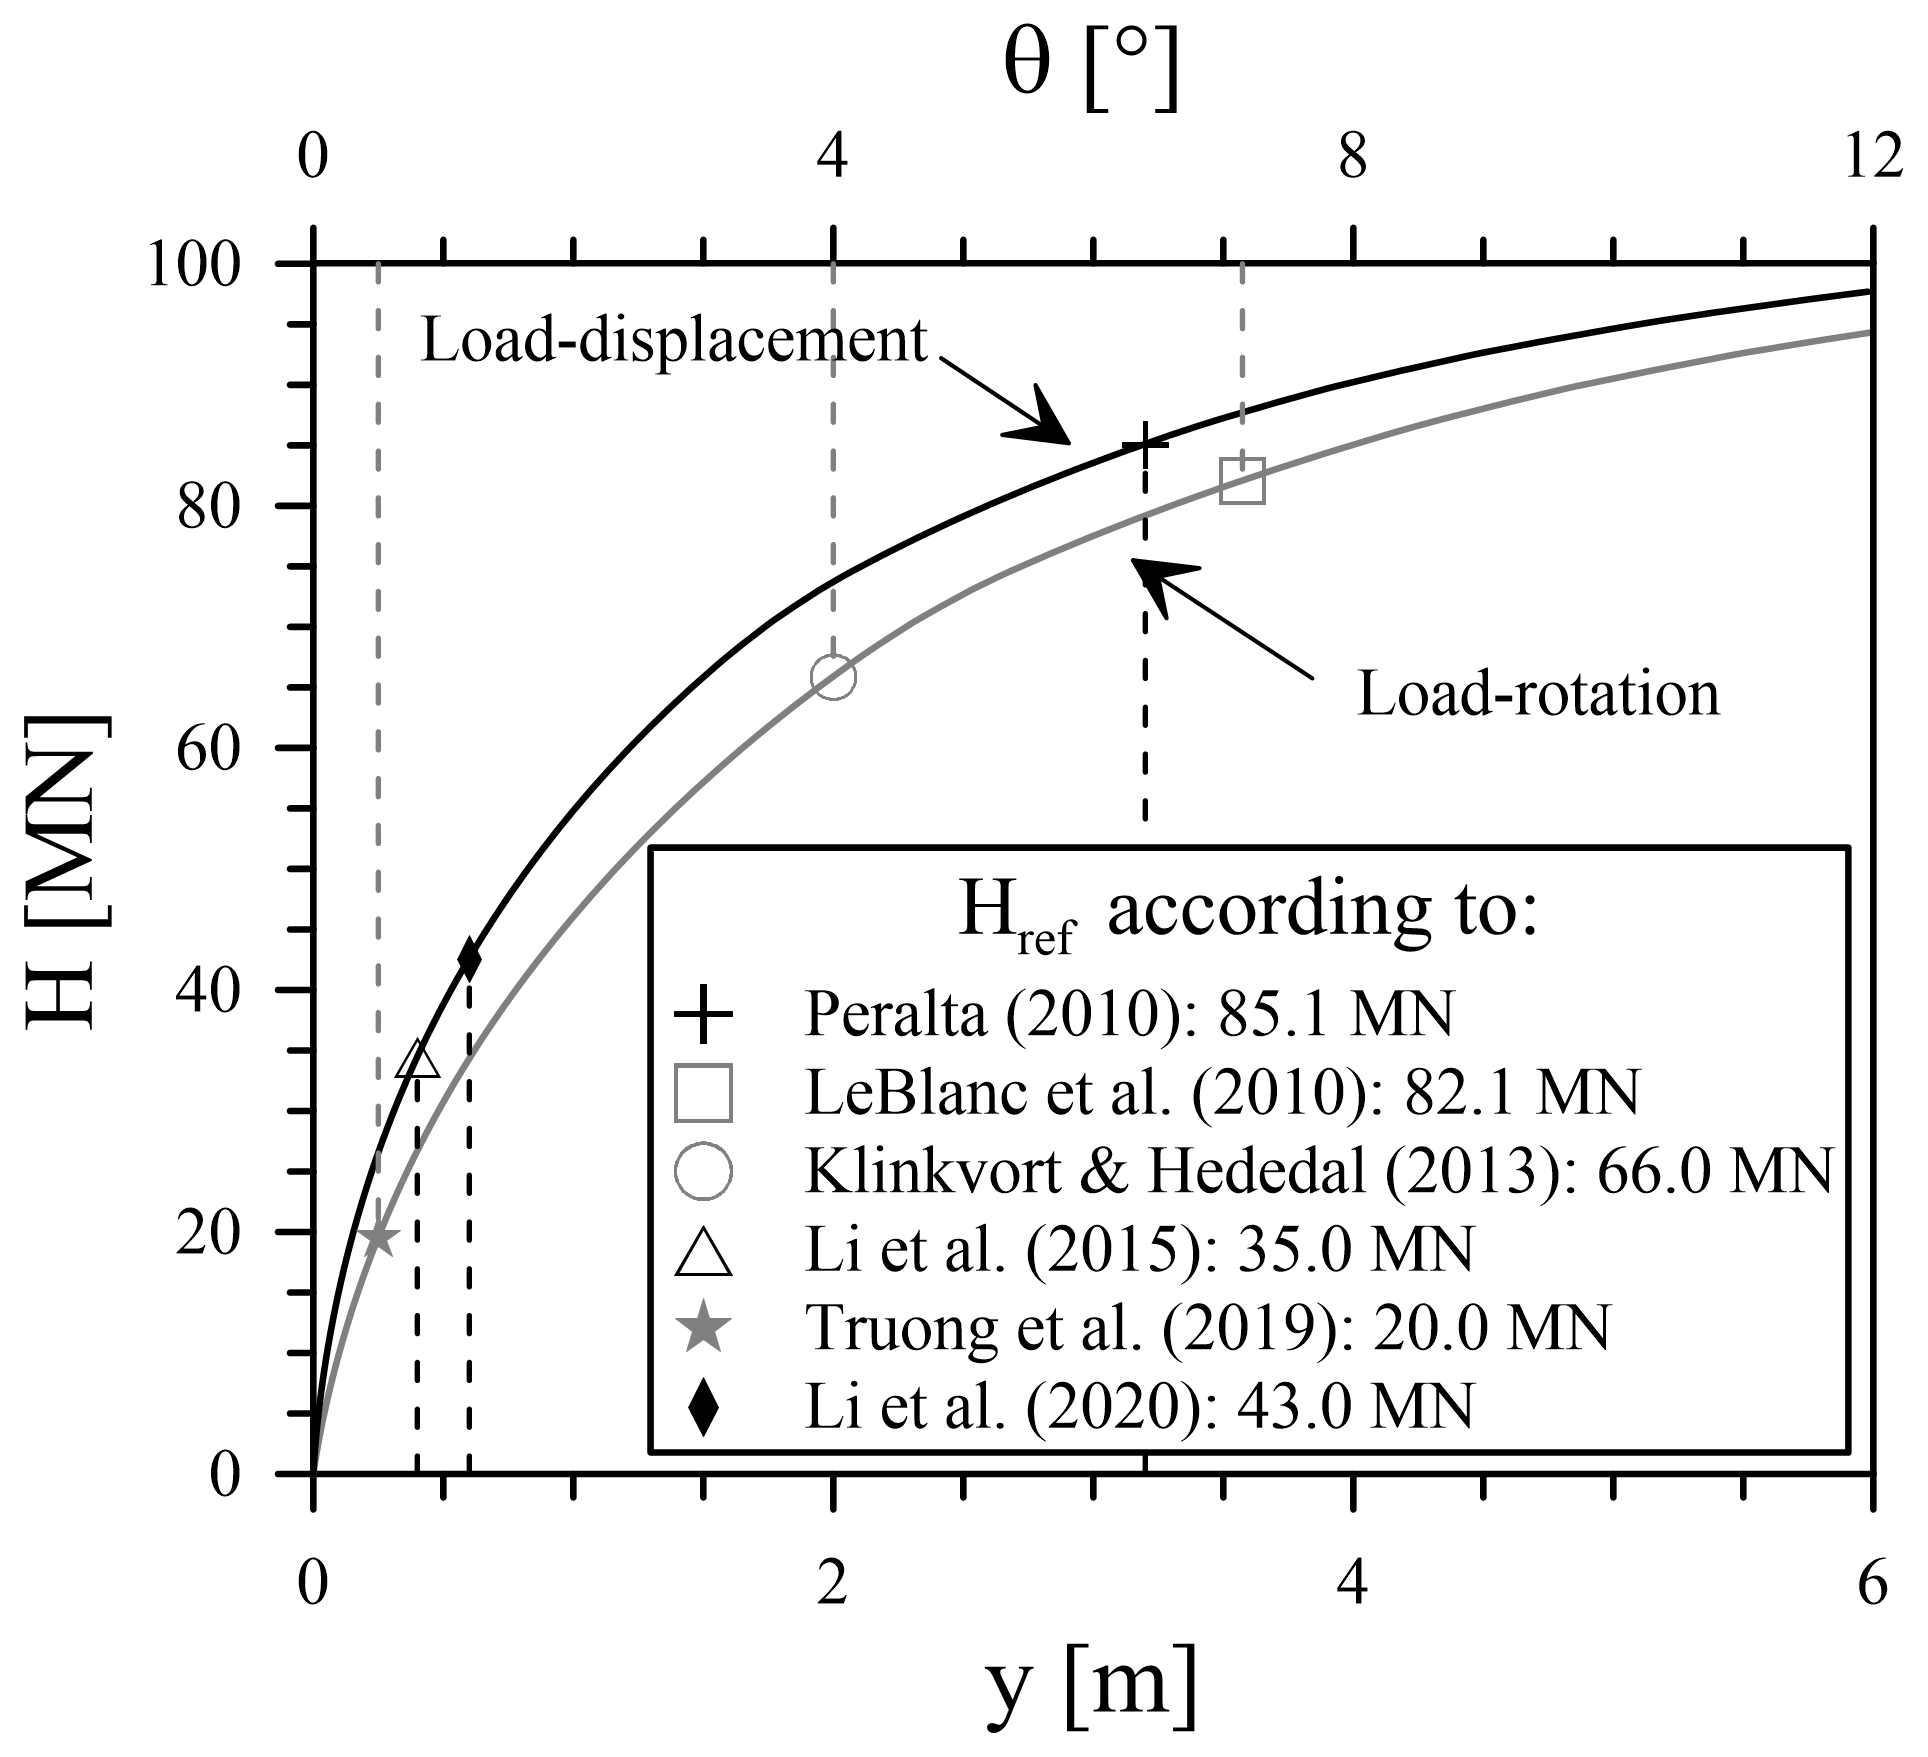
Figure 1Monotonic load-deformation response of a horizontally loaded pile (D=8 m, t=0.08 m, L=32 m, h=32 m) in dense sand calculated with the p–y method according to Thieken et al. (2015) and reference loads (Href) defined by different criteria (see Table 2).
Table 2Different criteria for the definition of the reference horizontal load (Href) and corresponding values determined from Fig. 1 with relative load magnitudes (ζb) for selected values of Hmax.
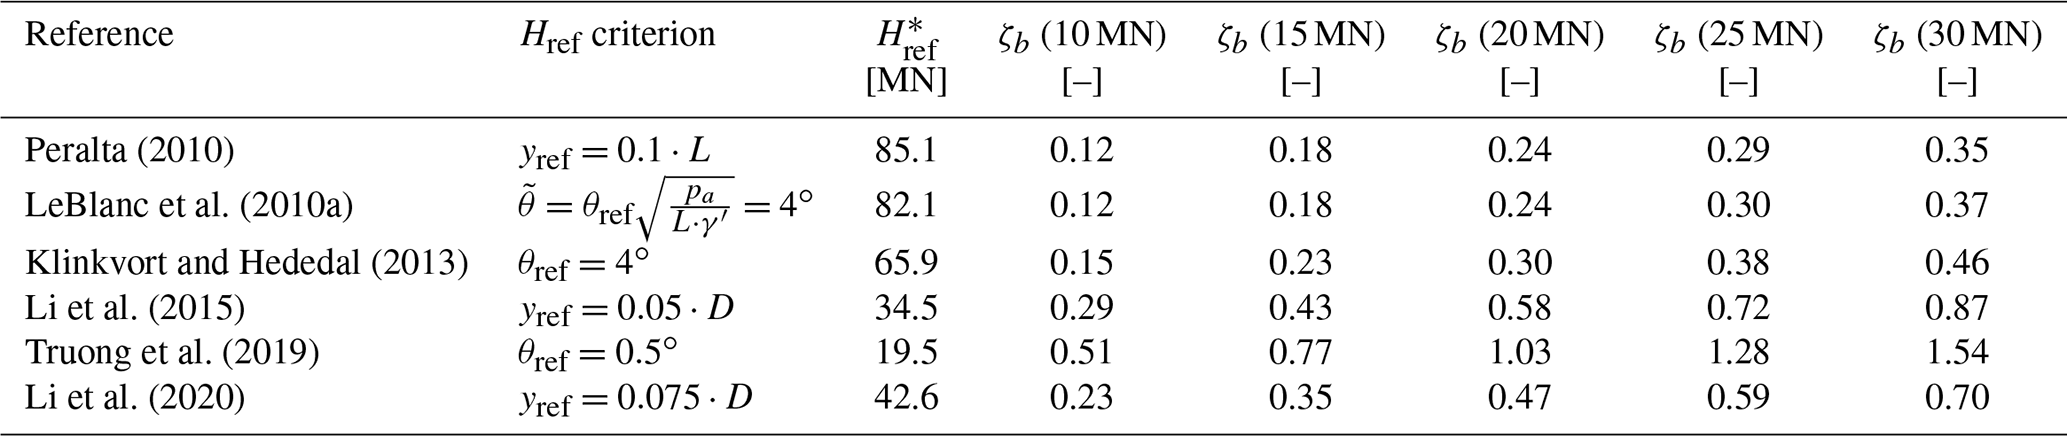
* Calculated with kN m−3; ∘; kN m−2; ; kN m−2; ; and υ=0.225 based on Thieken et al. (2015).
Table 1 shows that the majority of the listed approaches refer to the pile head displacement (y) as a deformation variable even if the reference load (Href) is partly derived from pile head rotation (θ). Only LeBlanc et al. (2010a) and Li et al. (2015) provide methods for calculating the pile head rotation, whereby Li et al. (2015) propose both accumulation parameters for pile head displacement and rotation. In order to be able to compare the individual approaches with each other, the pile head displacement was chosen as the relevant deformation variable. To enable at least a qualitative comparison, the approach of LeBlanc et al. (2010a) was therefore also applied to displacements without changing any of the model parameters, although this is not actually permissible. Furthermore, it can be seen from Table 1 that, according to the listed approaches, only the soil relative density (Dr), the load magnitude (ζb) and the cyclic load ratio (ζc) have an influence on the model parameters. For the parameter study, bandwidths of the mentioned parameters (Dr, ζb, ζc) were used, which lie within the application range of the examined approaches. For the method of LeBlanc et al. (2010a), the functions for Tb, LB(Dr, ζb), which in model scale apply for soil relative densities (Dr) of 0.04 and 0.38, were related to relative densities (Dr) of 0.08 and 0.75 in true scale (see Sect. 2). In cases where there are two functions for a parameter depending on, for example, the soil relative density (see, for example, Tc, L according to Li et al., 2020 in Table 1) or another input value, linear interpolation was performed between the two functions as needed.
The results of the parameter study are given in Fig. 2. Here, the pile head displacements after a given number of load cycles (yN) and the corresponding normalized pile head displacements () calculated according to the six methods summarized in Table 1 and the aforementioned assumptions are depicted. In order to assess the influence of the different input variables separately, only one parameter was varied and plotted on the x axis for each diagram. When evaluating the results presented in Fig. 2, it must be kept in mind that the approaches of Peralta (2010) and Li et al. (2015) in particular were derived for one-way cyclic loading (ζc=0) only. For the sake of completeness, these are nevertheless shown in Fig. 2d and h, where the absolute and normalized pile head displacement (yN and ) is plotted against the cyclic load ratio (ζc).

Figure 2Results of the parameter study on the pile head displacement accumulation and the influence of different input variables: comparison of the prediction models given in Table 1.
For cyclic one-way loading (ζc=0) with Hmax=15 MN (corresponding to relative load magnitudes (ζb) between 0.18 and 0.77, see Table 2) and a soil relative density (Dr) of 0.7, it can be seen from Fig. 2a and e that according to all methods considered an accumulation of pile head displacement with increasing load cycle number (N) occurs. The lowest accumulation results from the approaches of LeBlanc et al. (2010a) and Li et al. (2015, 2020), in which after 30 000 load cycles takes values of approximately 2.2, 2.4 and 2.0, respectively. However, it should be noted that the approach of LeBlanc et al. (2010a) will result in slightly higher values () for further increasing load cycle numbers when compared to Li et al. (2015) and Li et al. (2020) due to its formulation (see Eq. 5) deviating from Eq. (1) and the resulting higher accumulation rate. The largest normalized pile head displacements are predicted when applying the method of Truong et al. (2019), taking a value of and corresponding to an absolute pile head displacement (yN) of 0.59 m after 30 000 load cycles. The results according to the approaches of Klinkvort and Hededal (2013) and Peralta (2010) fall between the results of the previously mentioned methods.
Looking at Fig. 2b showing the influence of the maximum cyclic load (Hmax) and thus indirectly the influence of the cyclic load magnitude (ζb) on the pile head displacement (y) after 10 000 load cycles (N), it is obvious that in general larger absolute displacements (y) occur for higher cyclic loads (Hmax). When considering the normalized pile head displacements () in Fig. 2f instead, it becomes clear that only the results according to LeBlanc et al. (2010a) and Klinkvort and Hededal (2013) are affected by the maximum cyclic load (Hmax) or the load magnitude (ζb), respectively. Here, the Klinkvort and Hededal (2013) approach is much more sensitive to an increase in maximum cyclic load (Hmax) even though the cyclic load magnitude (ζb) for the chosen loads (10 MN MN) and for the definition of the reference load (Href) according to this approach is in a moderate range from (see Table 2). Also it should be noted that the trends and differences shown with regard to the results in the accumulation rate () according to Klinkvort and Hededal (2013) compared to LeBlanc et al. (2010a) increase further with a larger number of load cycles (N). Nevertheless, according to both Klinkvort and Hededal (2013) and LeBlanc et al. (2010a) the accumulation rate () generally increases with increasing cyclic load magnitude (ζb), whereas this is not the case for the other approaches mentioned. Here, higher absolute displacement (yN) in the case of increasing maximum cyclic loads (Hmax) only results from an increase in y1.
Figure 2c and g show the influence of the soil relative density (Dr) on the absolute and normalized pile head displacement (yN and ). From the plot, it can be seen that relative soil density (Dr) only has an impact on the results according to the approaches of LeBlanc et al. (2010a), Truong et al. (2019), and Li et al. (2020). However, it must be kept in mind that the soil relative density (Dr) has an influence on the soil parameters and thus on the monotonic load-displacement curve and consequently y1, which was not taken into account here for reasons of comparability. Therefore, lower values would actually be the result for the absolute displacements (yN) with increasing soil density (Dr). Nevertheless, according to both Truong et al. (2019) and Li et al. (2020), higher soil relative density (Dr) results in lower pile head displacement accumulation. As already shown in Fig. 2a and e, the approach according to Truong et al. (2019) here also yields the largest deformations overall. However, these also decrease the most with increasing soil relative density (Dr), although they are still always above the other results. The results according to LeBlanc et al. (2010a) are somewhat different. Here, a slight increase in the accumulated displacements with increasing soil relative density (Dr) can be observed. Nevertheless, the results according to LeBlanc et al. (2010a) are in a similar range as those according to the other approaches with the exception of Truong et al. (2019). This is due to the fact that the soil relative density (Dr) according to LeBlanc et al. (2010a) seems to have only a minor influence.
In Fig. 2d and h the influence of the cyclic load ratio (ζc) for a maximum cyclic load (Hmax) of 15 MN and a soil relative density (Dr) of 0.7 after 10 000 load cycles (N) is given. Irrespective of the fundamental differences in the results according to the approaches investigated, it follows from these diagrams that a variation in the cyclic load ratio (ζc) also leads to deviating results with different overall trends. While for almost all approaches except Peralta (2010) and Li et al. (2015), who did not provide information on the influence of the cyclic load ratio (ζc), a rather asymmetric load with results in the highest displacements; for the Klinkvort and Hededal (2013) approach this is true for ζc=0. Furthermore, it is also apparent that the different approaches are differently sensitive to the cyclic load ratio (ζc). In particular, the results according to Li et al. (2020) stand out, in which only a marginal influence of the cyclic load ratio (ζc) can be recognized. In contrast, the other approaches show significantly larger differences when ζc differs from zero.
Considering the partly deviating or even contradictory results shown above, both with respect to the absolute values (yN) and the trends shown with regard to the influence of the different input parameters on the accumulation rate (), it is clear that there is a need for further research. The inconsistencies shown between the different approaches lead at best to an over-dimensioning of monopile dimensions and therefore increasing costs and at worst even to uncertainties with regard to the long-time deformation behaviour of the foundation that could render the structure unsuitable for its intended function earlier than planned. One possible reason for the existing discrepancies could be, for example, the usually very limited number of tests on which the various approaches are based.
4.1 Objective, test program and experimental set-up
To identify and quantify the influencing parameters affecting the load-displacement behaviour of a rigid pile due to lateral cyclic loading in more detail, a large campaign of small-scale 1 g model tests has been designed. The parameters that have been assessed include the cyclic load magnitude (ζb), cyclic load ratio (ζc), load eccentricity (h), soil relative density (Dr), the grain size distribution of the non-cohesive bedding material (soil) and the pile embedment length (L). In total, the entire test program, which is summarized in Table 3, comprised 15 test series (TSs) with more than 150 individual tests on four different pile–soil systems in dry sand. A pile–soil system is here defined as a system with the same embedment length (L), soil relative density (Dr), pile diameter (D) and bedding material (soil). As a model pile a tubular aluminium pipe with an outer diameter (D) of 50 mm and a wall thickness (t) of 3.2 mm was used. Two different embedment lengths (L) of 300 mm () and 400 mm (), as well as two different bedding materials (F34 and S40T, see Sect. 4.2) with two relative densities (Dr) of 0.4 (medium dense) and 0.6 (dense), are considered by which the four pile–soil systems (see Table 3) are defined. According to the non-dimensional stiffness ratio suggested by Poulos and Hull (1989) all four systems can be characterized to behave almost rigid, similar to a true-scale monopile. In order to investigate the influence of the load eccentricity (h) or the ratio of horizontal force to overturning moment, the ratio of load eccentricity (h) to embedment length (L) was varied in the range of to for pile–soil system 1 and to for pile–soil system 4. For pile–soil systems 2 and 3 the ratio () was kept constant, taking a value of 1.0.
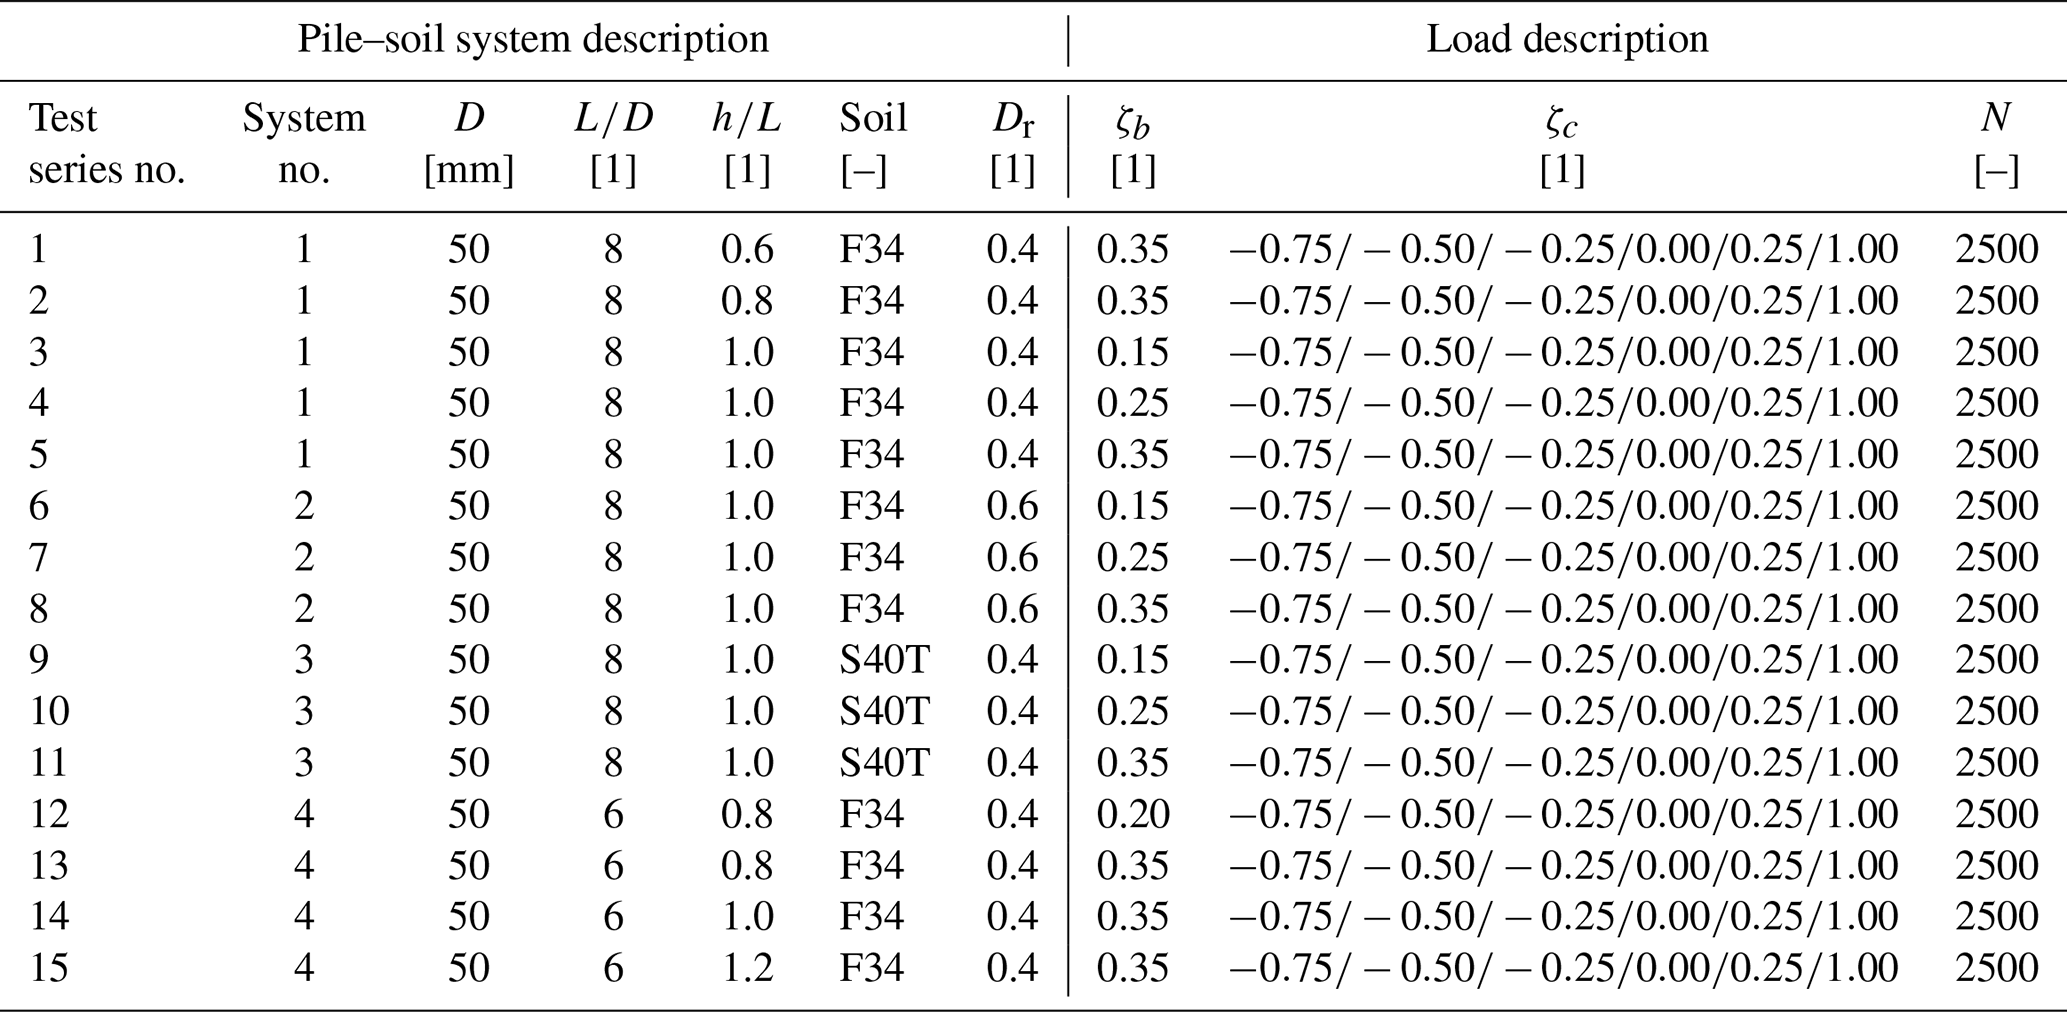
The loading conditions in the model tests comprised both displacement-controlled monotonic loading tests (ζc=1) and load-controlled cyclic loading (sinusoidal) with different cyclic load magnitudes (ζb) and cyclic load ratios (ζc) at a constant frequency of 0.1 Hz with 2500 load cycles (N) each. The cyclic load magnitude (ζb) was defined according to Eq. (3) based on a reference load (Href) that has been defined for each configuration of pile–soil system and load eccentricity (h) from the determined monotonic load-displacement curves by application of a pile failure criterion (see Sect. 4.3.1). To evaluate the influence of different cyclic load ratios (ζc) as given in Eq. (4), one- and two-way loads with values of have been applied. In order to increase the significance of the experimental results and to confirm repeatability, all tests given in Table 3 have been conducted at least twice.
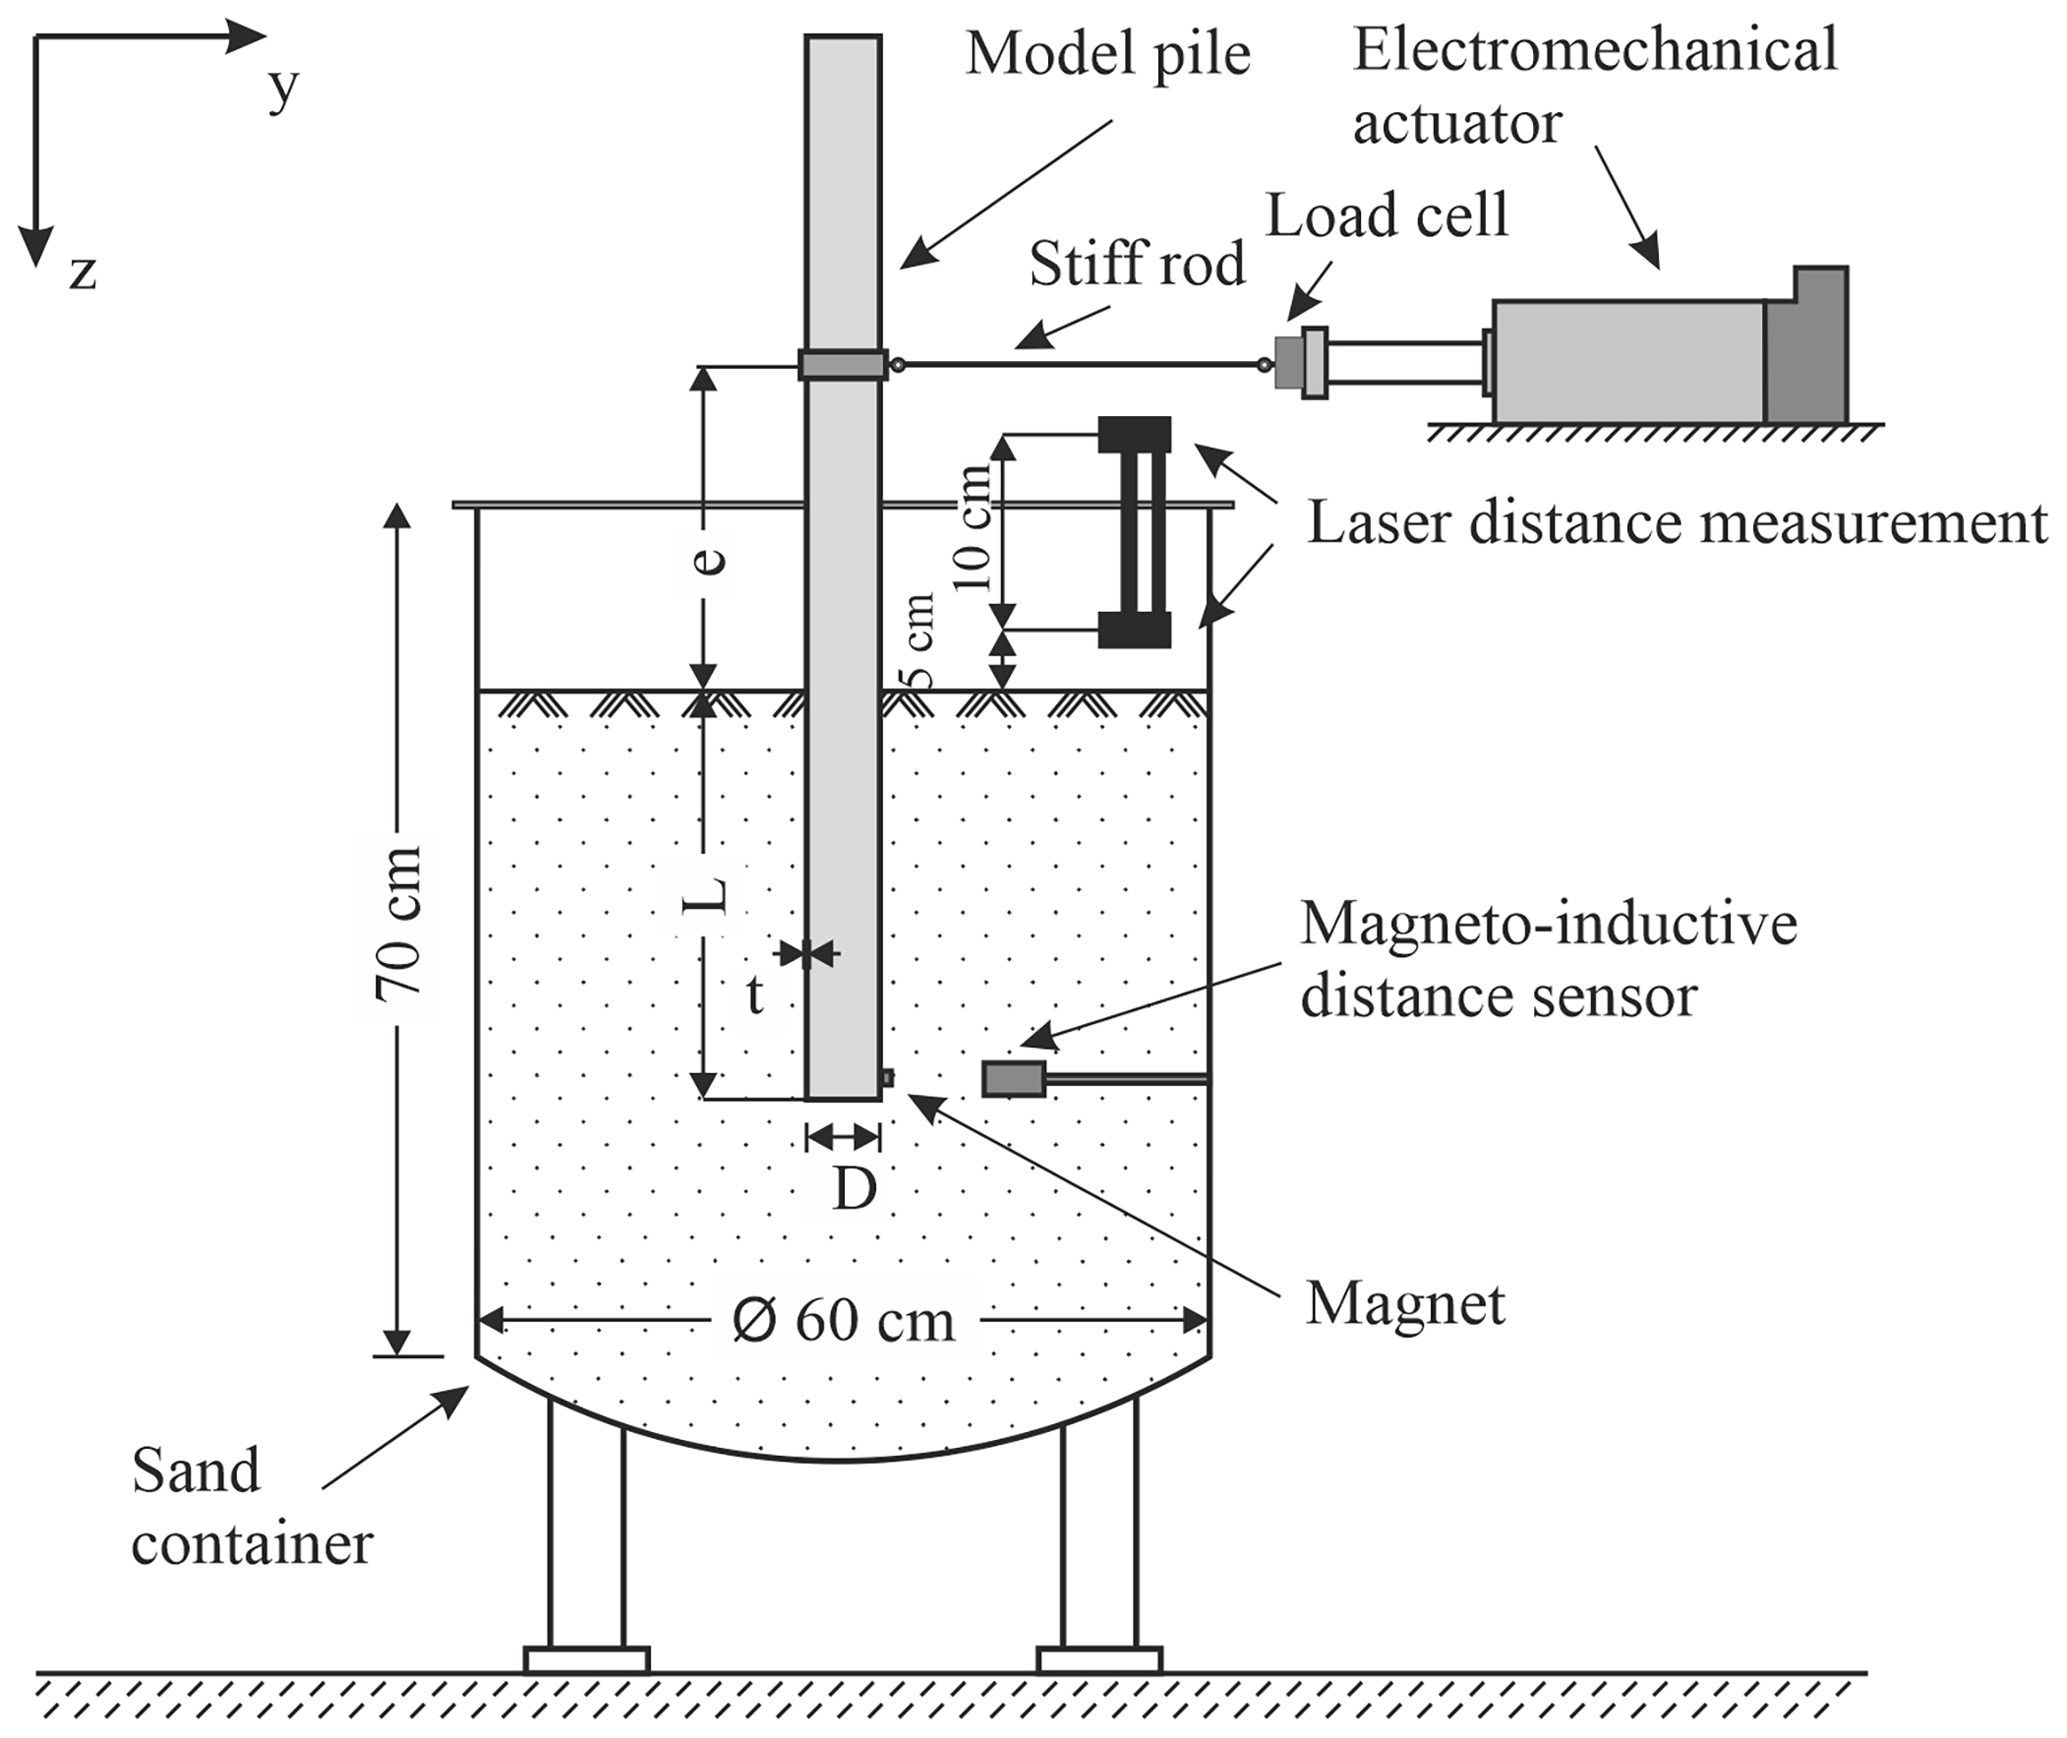
The small-scale model tests were carried out on a specially designed test rig, consisting of a sand container, a model pile, an electromechanical actuator and several sensors. Figure 3 shows the schematic structure of the experimental set-up, its dimensions and its individual components. For more detailed information on the test equipment or scaling considerations, refer to Frick and Achmus (2020). Physical quantities measured in the y direction (see Fig. 3), such as displacements or forces imposed by pulling with the actuator, are positive in the following.
4.2 Soil properties and sand sample preparation
For the model test campaign, two different non-cohesive bedding materials were chosen to investigate the influence of the grain size distribution to the pile response due to lateral cyclic loading. Both materials are commercially available silica sands with the designations F34 and S40T. The F34 is a fine- to medium-grained sand having a mean effective particle size (d50) of 0.18 mm and a uniformity coefficient (CU) of 1.90. In contrast, the S40T is a coarse sand (d50=0.82 mm) with a slightly narrower graded grain size distribution (CU=1.4). For both bedding materials the sand characteristics and peak friction angles () determined from standard shear box tests with normal stresses (σv) of 20, 40 and 80 kN m−2 and soil relative densities (Dr) of 0.4 are given in Table 4. The grain size distributions of both soils are depicted in Fig. 4.


Before each small-scale model test a uniform sand sample with one of the two chosen soil relative densities (Dr) had to be prepared. This was done by air pluviation through a series of diffusor meshes and with a defined drop height. In a series of preliminary tests, appropriate meshes and drop heights were determined, with whose help the desired soil relative densities (Dr) for the two different bedding materials (see Table 3) could be achieved. Furthermore, it could be shown that the selected preparation procedure leads to homogeneous and reproducible sand conditions in a normally consolidated state. To avoid complex stress fields and local changes in soil density due to model pile installation influencing the test results, it was decided to omit the pile installation procedure from the model tests and prepare the sand around the pre-installed pile. Nevertheless, in order to allow mobilization of shear stresses at the pile toe, the sand container was first filled to a height of about 5 cm above the later position of the pile toe before the pile was placed in the container, slightly pushed into the 5 cm thick sand bed and fixed in position by a clamping system. The remaining soil preparation was then carried out around the already installed pile. The soil dry unit weight (γ) resulting from this preparation procedure for the S40T sand with a relative density (Dr) of 0.4 is 16.1 kN m−3. For the F34 sand, the soil dry unit weight (γ) is 15.0 and 15.5 kN m−3 for relative densities (Dr) of 0.4 and 0.6, respectively.
4.3 Test results
4.3.1 Monotonic test results
In order to be able to apply comparable load conditions in terms of the load magnitude (ζb) in the cyclic tests despite different pile–soil systems and lever arms (h), first monotonic load tests were carried out for the determination of load-displacement curves and a reference load (Href) for each configuration. Figure 5 presents the variations in normalized monotonic lateral load () with normalized pile head displacement () at the soil surface for all four pile–soil systems and in the case of pile–soil systems 1 and 4 for different load eccentricities (h) additionally. Here, the pile head displacements (y) calculated from the measured displacements of the two laser distance transducers (see Fig. 3) are depicted as solid lines. To ensure the reproducibility of the tests and to check the quality of the sand sample preparation, each test was conducted at least twice. As some scattering could be observed especially for pile–soil system 2 () and pile–soil system 4 with a normalized load eccentricity () of 1.2, these tests have even been done four times.
For this study, the reference load (Href) should be defined as the ultimate lateral pile capacity (Hult) at total pile failure. The failure load (Hult) that can be resisted by a rigid pile is a function of the ultimate lateral resistance that can be mobilized by the soil against the pile. The mobilized soil resistance in the case of a laterally loaded rigid pile is again characterized by two failure mechanisms. The first occurs at shallow depths and is due to the formation of a passive wedge in front of the pile and in the direction of loading. The second is associated with the plastic flow of soil around the pile in the horizontal plane at greater depths. For the occurrence of both failure mechanisms and thus the mobilization of the full soil resistance against the pile, very large displacements are required. From the monotonic test results depicted in Fig. 5 it emerges that total pile capacity (Hult) defined by full soil plastification and a load-displacement curve approaching a horizontal tangent has not been reached despite very large displacements. In order to be able to determine the pile capacities (Hult) and therefore the chosen reference loads (Href) of the individual pile–soil systems, the method of Manoliu et al. (1985) was applied to the results. This method assumes that load displacement of a laterally loaded pile can be described by a hyperbolic function. Therefore, the method allows for the estimation of the pile failure load (Hult) by the extrapolation of measured test data. Corresponding extrapolation curves derived by application of this approach are depicted in Fig. 5 as dashed lines.
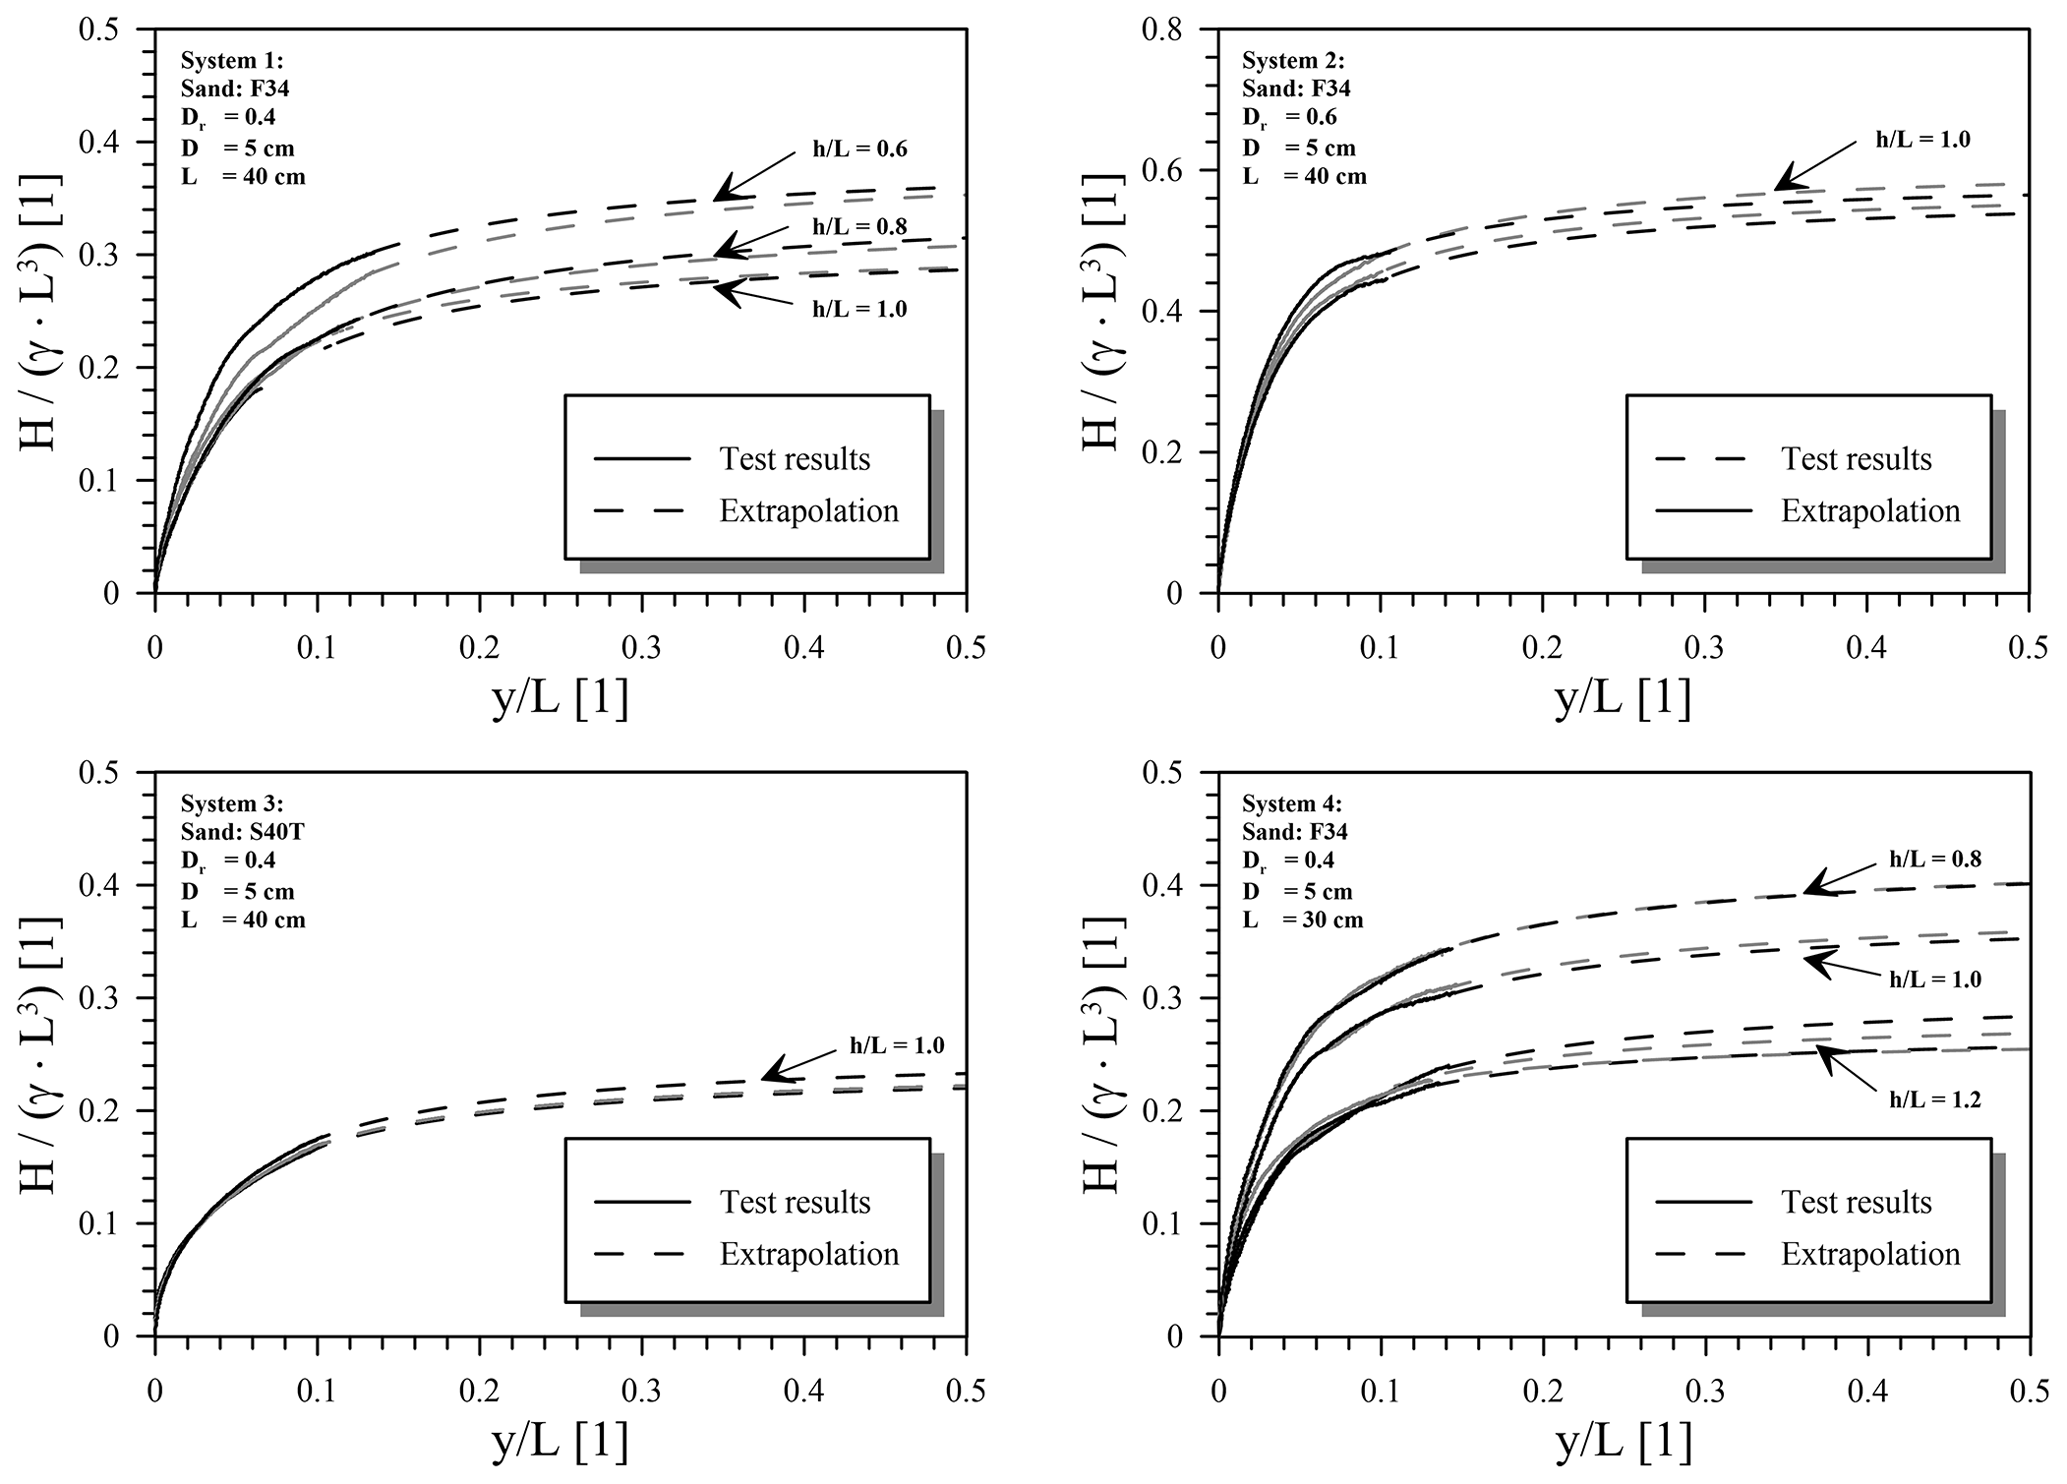
Figure 5Load-displacement curves from monotonic lateral load tests and extrapolations according to Manoliu et al. (1985).
As some slight scattering could be observed in the monotonic test results and extrapolations (Fig. 5), mean values for the pile failure load (Hult) or reference load (Href), respectively, were used for each configuration to define the cyclic load magnitude (ζb) according to Eq. (3) for each configuration. The normalized and absolute reference values of the horizontal load (Href) determined for each test configuration according to the previously mentioned procedure are summarized in Table 5.
Table 5Pile reference loads (Href) determined by extrapolation of test results.

4.3.2 Cyclic test results
The cyclic tests summarized in Table 3 have been conducted for cyclic load magnitudes (ζb) of 0.15, 0.25 and 0.35 and cyclic load ratios (ζc) ranging from nearly balanced two-way loading () to one-way loading with complete unloading (ζc=0.00) or partial unloading () in each cycle. Based on the findings of Jalbi et al. (2019), who proposed a practical method to predict the nature of monopile loading conditions (ζb and ζc) and evaluated 15 existing wind turbines in Europe using their method, the load magnitudes (ζb) and cyclic load ratios (ζc) selected for this study are of particular interest for practical application. According to Jalbi et al. (2019) typical load magnitudes (ζb) for normal operational conditions range from 0.1 to 0.2. In extreme wind and wave loading cases also load magnitudes (ζb) of up to 0.4 may be reached. With regard to the cyclic load ratio (ζc) they found that loads on monopiles are mostly one-way (ζc≥0) under normal operational conditions but may also be two-way (ζc<0) in extreme loading scenarios, especially in deep waters. It should be mentioned that Jalbi et al. (2019) also assumed the reference load (Href) for the definition of the load magnitude (ζb) by back-calculations, in which ultimate pressure of the ground profile was mobilized (= total ground and therefore pile failure) so that values given for ζb should be comparable with those of this study (see Sect. 4.3.1).
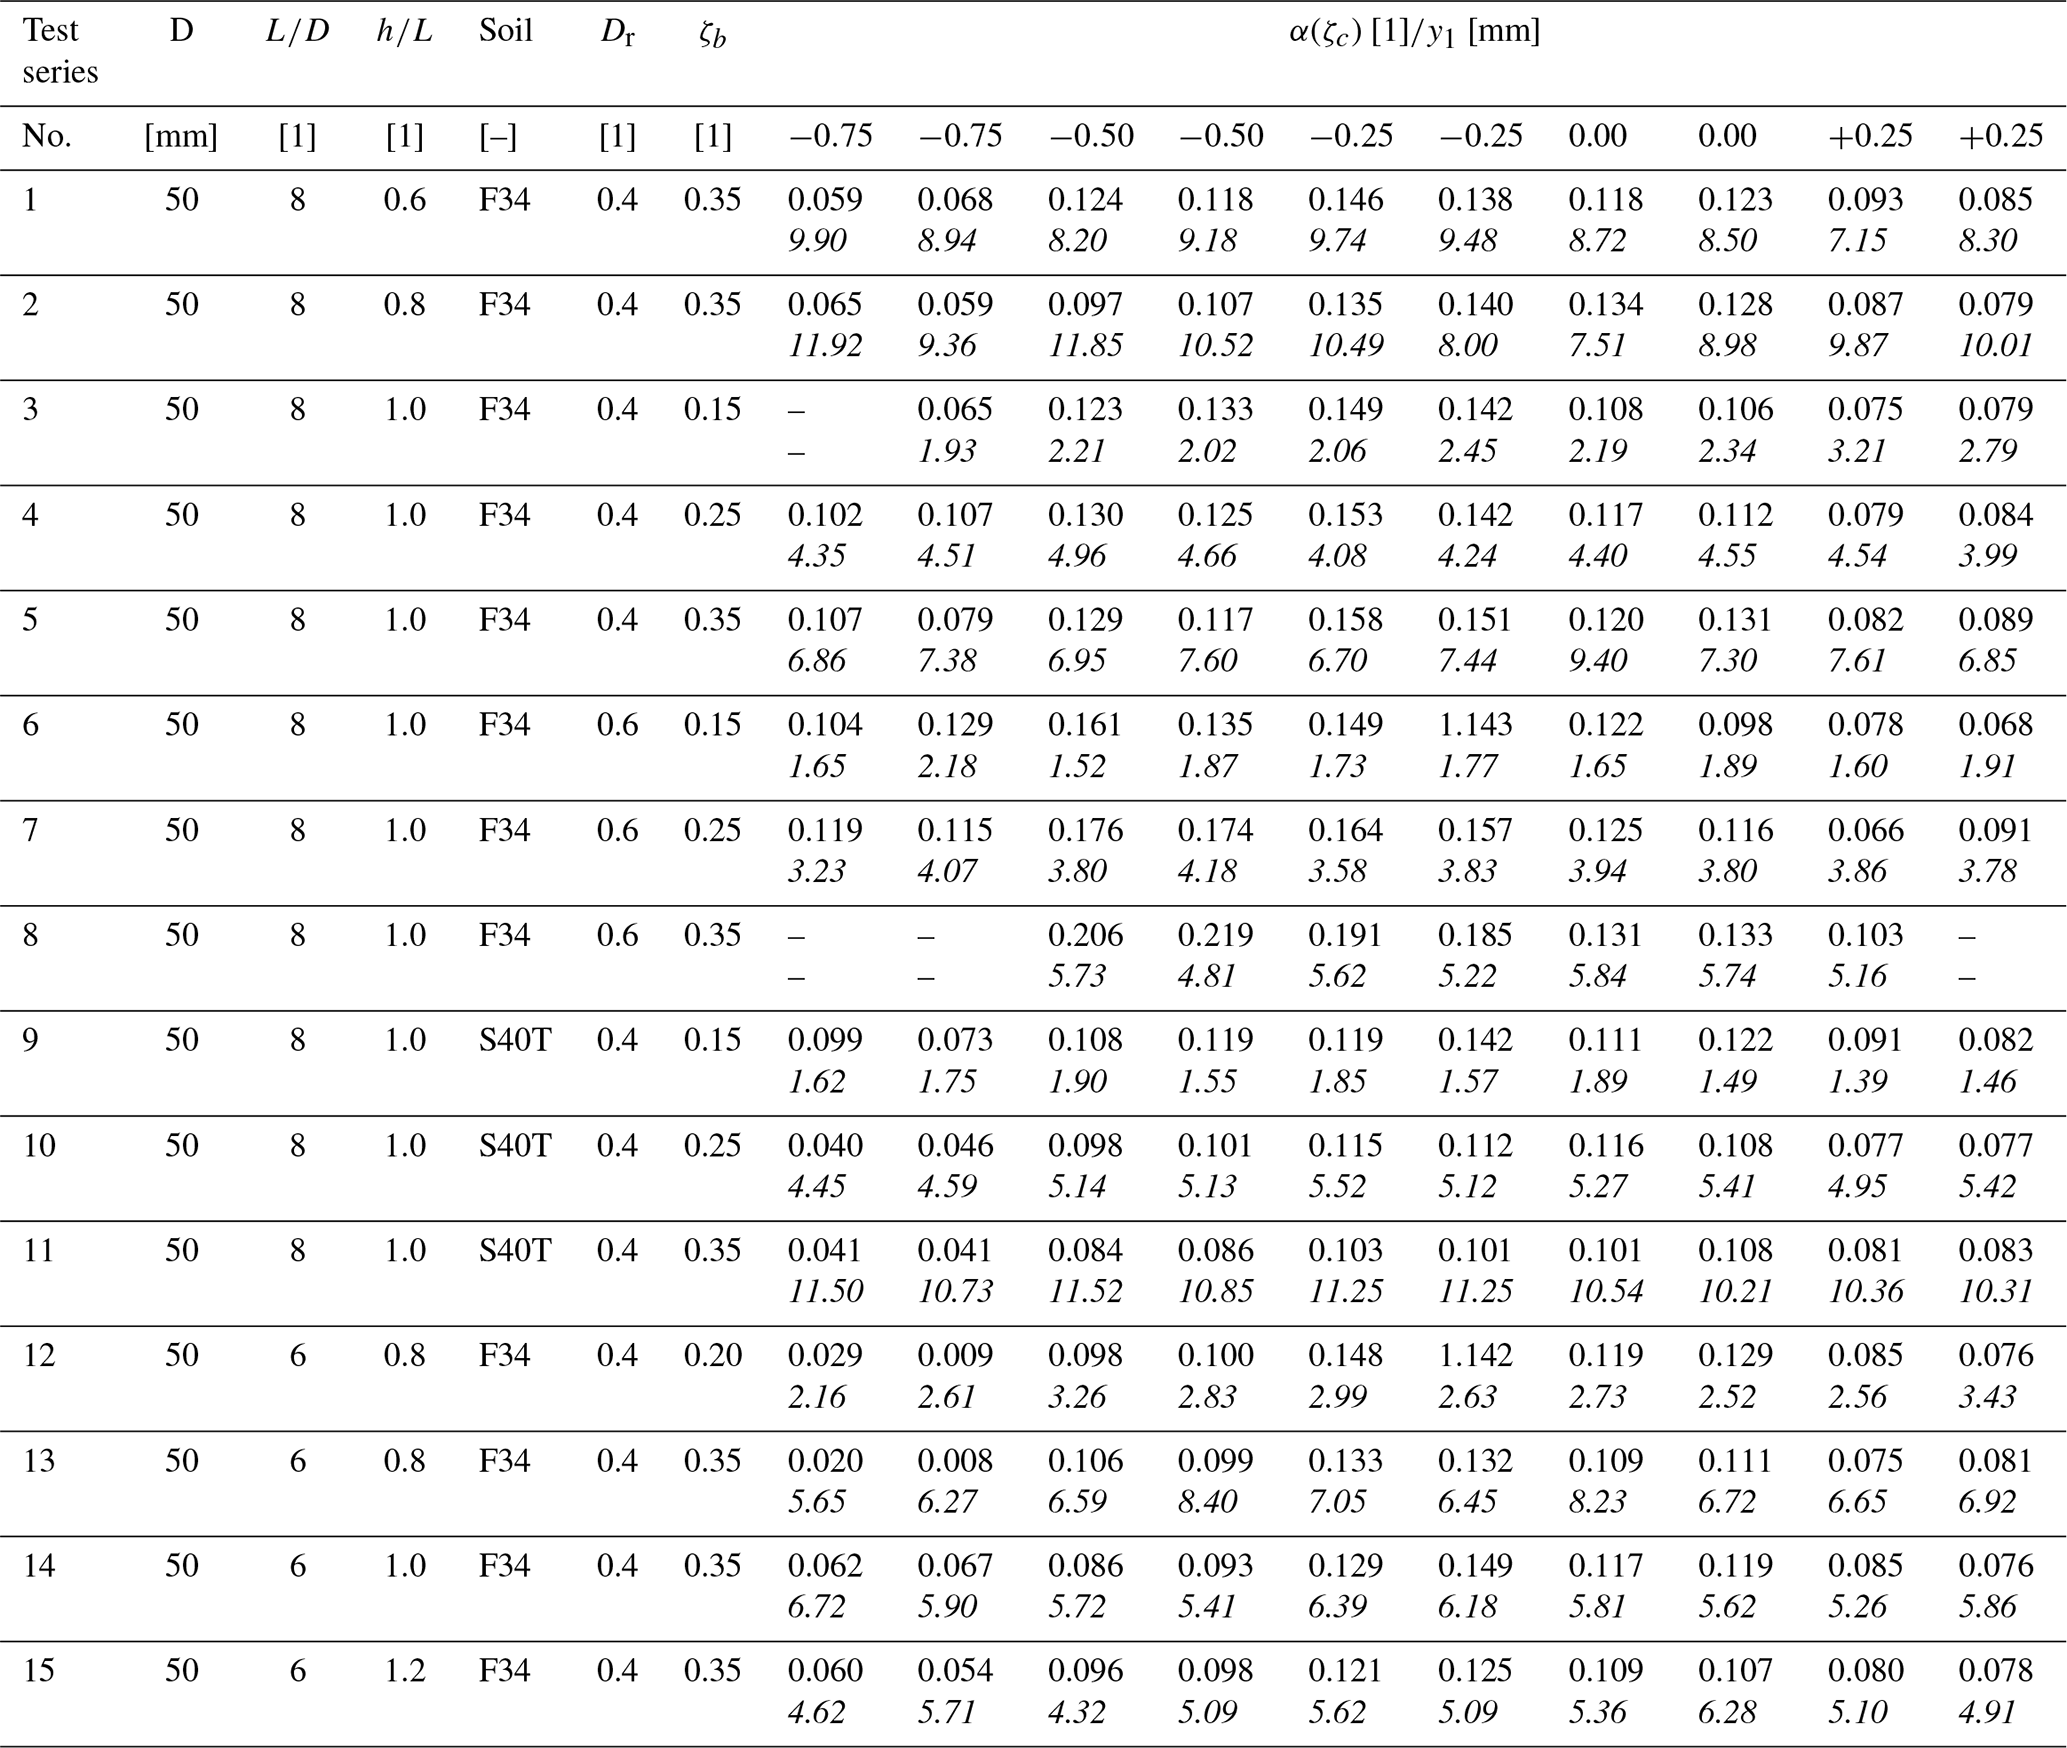
In Fig. 6, the results of all cyclic tests are plotted in terms of normalized pile head displacement () against load cycle number (N) for each of the 15 test series separately. In addition, power functions according to Eq. (1) have been fitted to the measured test results and are also shown in Fig. 6. The underlying maximum pile head displacement after application of the first load cycle (y1), as well as the determined accumulation parameter (α) which is dependent on the cyclic load ratio (ζc) for each individual test, is listed in Table 6 for clarity.
In general, it can be seen from Fig. 6 that the tests can be reproduced well in most cases. Furthermore, it can be seen that the measured curves can be described very well by the selected power function (Eq. 1). Only in a few cases (see, for example, test series 5: ) does there seem to be a minimal overestimation of measured values as the number of load cycles increases. With respect to the influence of the cyclic load ratio (ζc), a clear trend can be recognized in all test series. Irrespective of the load eccentricity (h) or the pile embedment length (L), for pile soil systems 1 (test series 1–5), 3 (test series 9–11) and 4 (test series 12–15), the highest displacement accumulation consistently results from an unbalanced two-way loading with a cyclic load ratio (ζc) of −0.25. In the case of pile–soil system 3 (test series 9–11) with the S40T sand as bedding material and a soil relative density (Dr) of 0.4, however, the difference between the tests with and ζc=0.00 is less pronounced. Also for pile–soil system 2 (test series 6–8) with dense (Dr= 0.6) F34 sand the largest displacements are the result of an asymmetric two-way loading, however, not with a cyclic load ratio (ζc) of −0.25 but of −0.5. The lowest displacement accumulations for all test series result from loading with a cyclic load ratio (ζc) of −0.75 (nearly balanced two-way loading) or +0.25 (one-way loading without complete unloading in each cycle). A negative accumulation for loads with large negative cyclic load ratios (ζc) as reported by Klinkvort and Hededal (2013) could not be observed, although very small accumulations were recorded in some cases for the tests with (see, for example, test series 12 and 13). Another general trend that emerges from the results shown in Fig. 6 is that a large part of the total deformations due to lateral cyclic loading already takes place within the first 500 to 1000 load cycles, while subsequently there is a slowly decreasing accumulation rate (sedation). An exception here is test series 8 (F34, Dr=0.6 and ζb=0.35), in which the test results with negative cyclic load ratios (ζc) show a strong increase in displacements even beyond a cycle number (N) of 1000. This is due to the fact that in this configuration with high cyclic loads (large Href and ζb), especially with alternating loads (ζc<0), the pile moved slowly out of the soil while cycling, resulting in progressive failure. This is also the reason why no results are shown for cyclic load ratios (ζc) of −0.75 for this test series as here an even earlier failure occurred. Having this is mind, the results for pile–soil system 2 (test series 6–8) and especially those of test series 8 should be treated with caution.
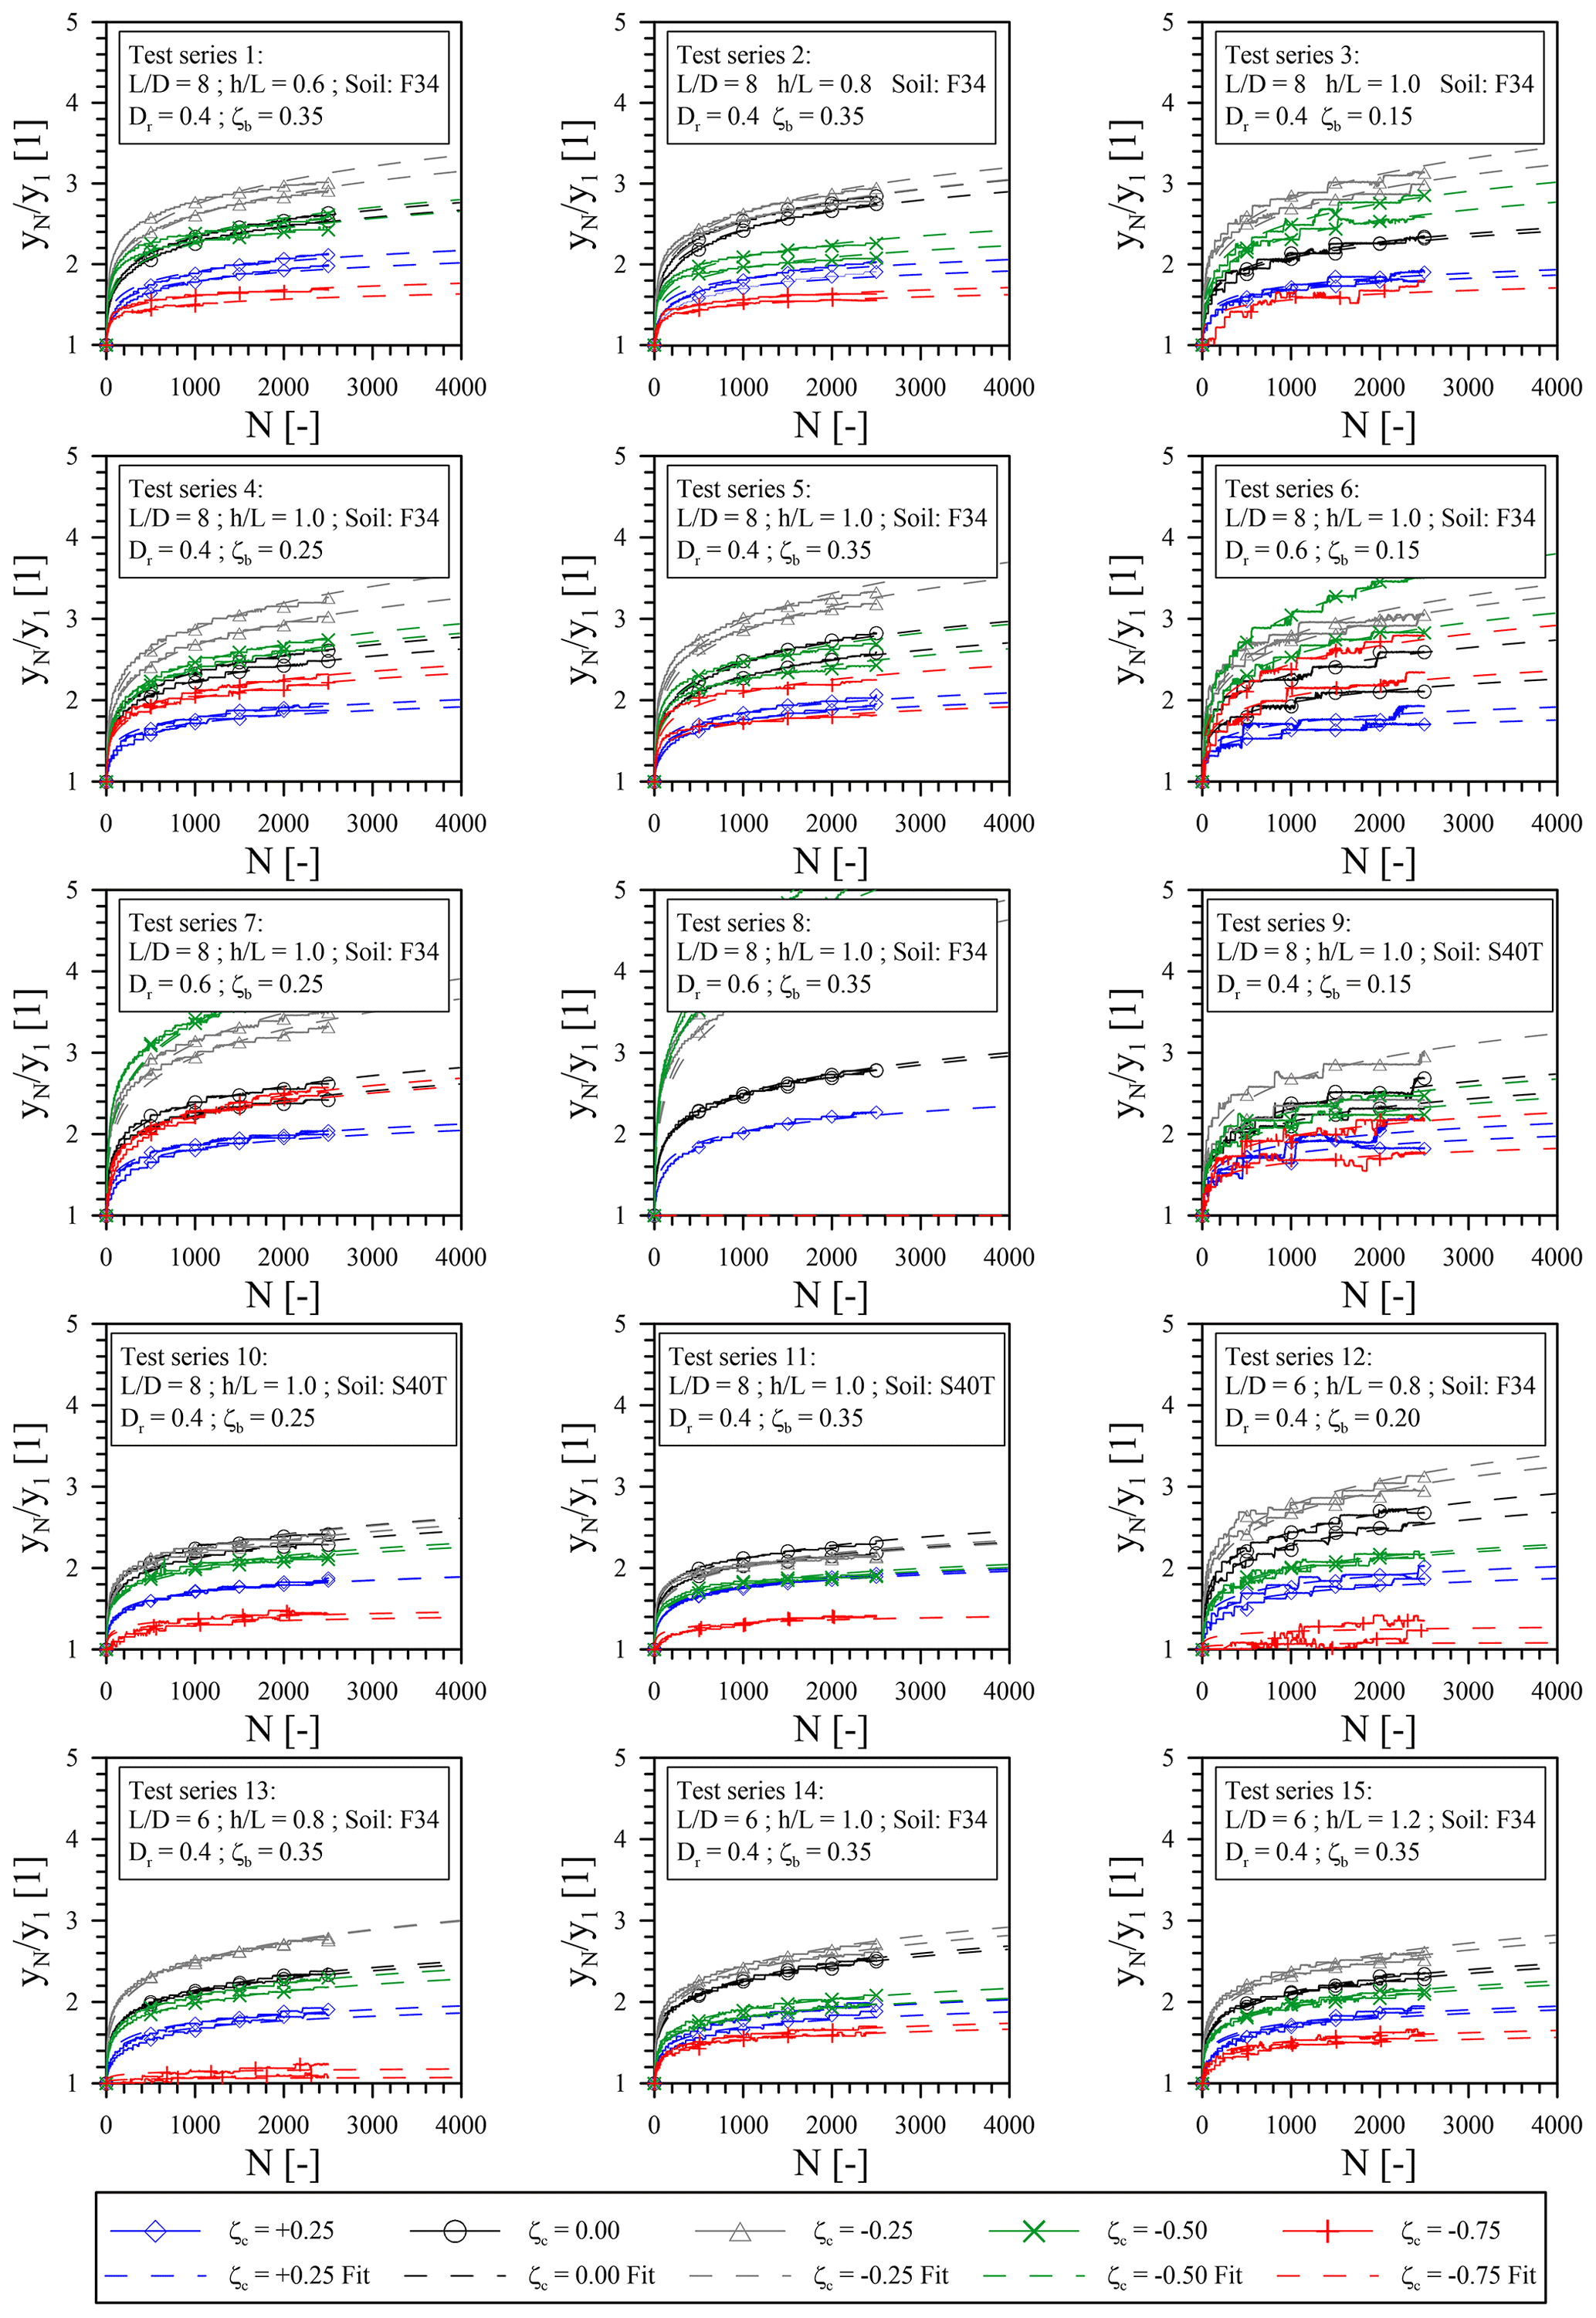
Figure 6Cyclic test results: normalized pile head displacement () against load cycle number (N) for all 15 test series.
Table 6Cyclic test results: determined accumulation parameters α(ζc) and measured pile head displacements after first loading (y1).
4.3.3 Evaluation
In order to evaluate the cyclic test results from Fig. 6 with respect to the influence of the applied cyclic loading conditions or different parameters of the pile–soil system on the displacement accumulation, the accumulation parameters (α) for cyclic one-way loading (ζc=0) from Table 6 were used as a reference value and plotted against the variable parameters of the investigated pile–soil systems (Dr, , ) and the load magnitude (ζb) in Fig. 7. In general it is evident from Fig. 7 that the determined accumulation parameters for cyclic one-way loading (α(ζc=0)) are subjected to a certain degree of unsystematic scattering, ranging from a maximum value of 0.1343 to a minimum value of 0.0983. The mean of all α values for cyclic one-way loading (ζc=0) is 0.1169 (see Table 6). The deviations in the results for the individual tests with identical boundary conditions (redundant tests) are generally smaller, but they are nevertheless present and probably due to experimental scatter.
In Fig. 7a the influence of the cyclic load magnitude (ζb) can be seen. When taking into account only the accumulation parameters α(ζc=0) for pile–soil system 1 (black symbols) or 2 (green symbols), a slight increase in the accumulation parameter (α) with cyclic load magnitude (ζb) can be observed. Nevertheless, the opposite is true for systems 3 (blue symbols) and 4 (red symbols). When all pile–soil systems are considered in a linear regression analysis, the aforementioned trends almost cancel each other out, resulting in only a negligible increase in the accumulation parameter (α) with cyclic load magnitude (ζb). Nevertheless, the linear equation describing the possibly existing dependency of the accumulation parameter (α) on the cyclic load magnitude (ζb) is given in Fig. 7a for completeness.
An evaluation of the results with respect to the soil relative density (Dr) as shown in Fig. 7b also does not allow any clear conclusion to be drawn. On the one hand, only one system with a higher soil relative density (Dr) was investigated, and, on the other hand, the results of the individual pile–soil systems scatter over such a range that the linear regression shown in Fig. 7b can only provide an approximation. Similar to the influence of the cyclic load magnitude (ζb), a trend of a slightly increasing accumulation parameter (α) with soil relative density can be seen, but this increase is also considered negligible due to the existing scatter and the minor slope of the regression curve.
In Fig. 7c all accumulation parameters for cyclic one-way loading (α(ζc= 0)) are plotted against the relative load eccentricity (). Taking all values into account a decreasing trend with increasing load eccentricity (h) results from the linear regression analysis. If only the values for system 1 (black symbols) or system 3 (blue symbols) are considered, for which the load eccentricity was varied, it becomes clear that this behaviour is also more likely to be due to experimental scattering. For system 1, where the normalized lever arm () was varied in the range of 0.6 to 1.0, the largest accumulation parameter (α) was determined for the mean value of . For system 3 () a similar observation can be made. Since the lever arm (h) only defines the ratio of the horizontal force to the applied overturning moment, a maximum value of the accumulation parameter (α) in the middle of the investigated bandwidth for the normalized load eccentricity () is not plausible.
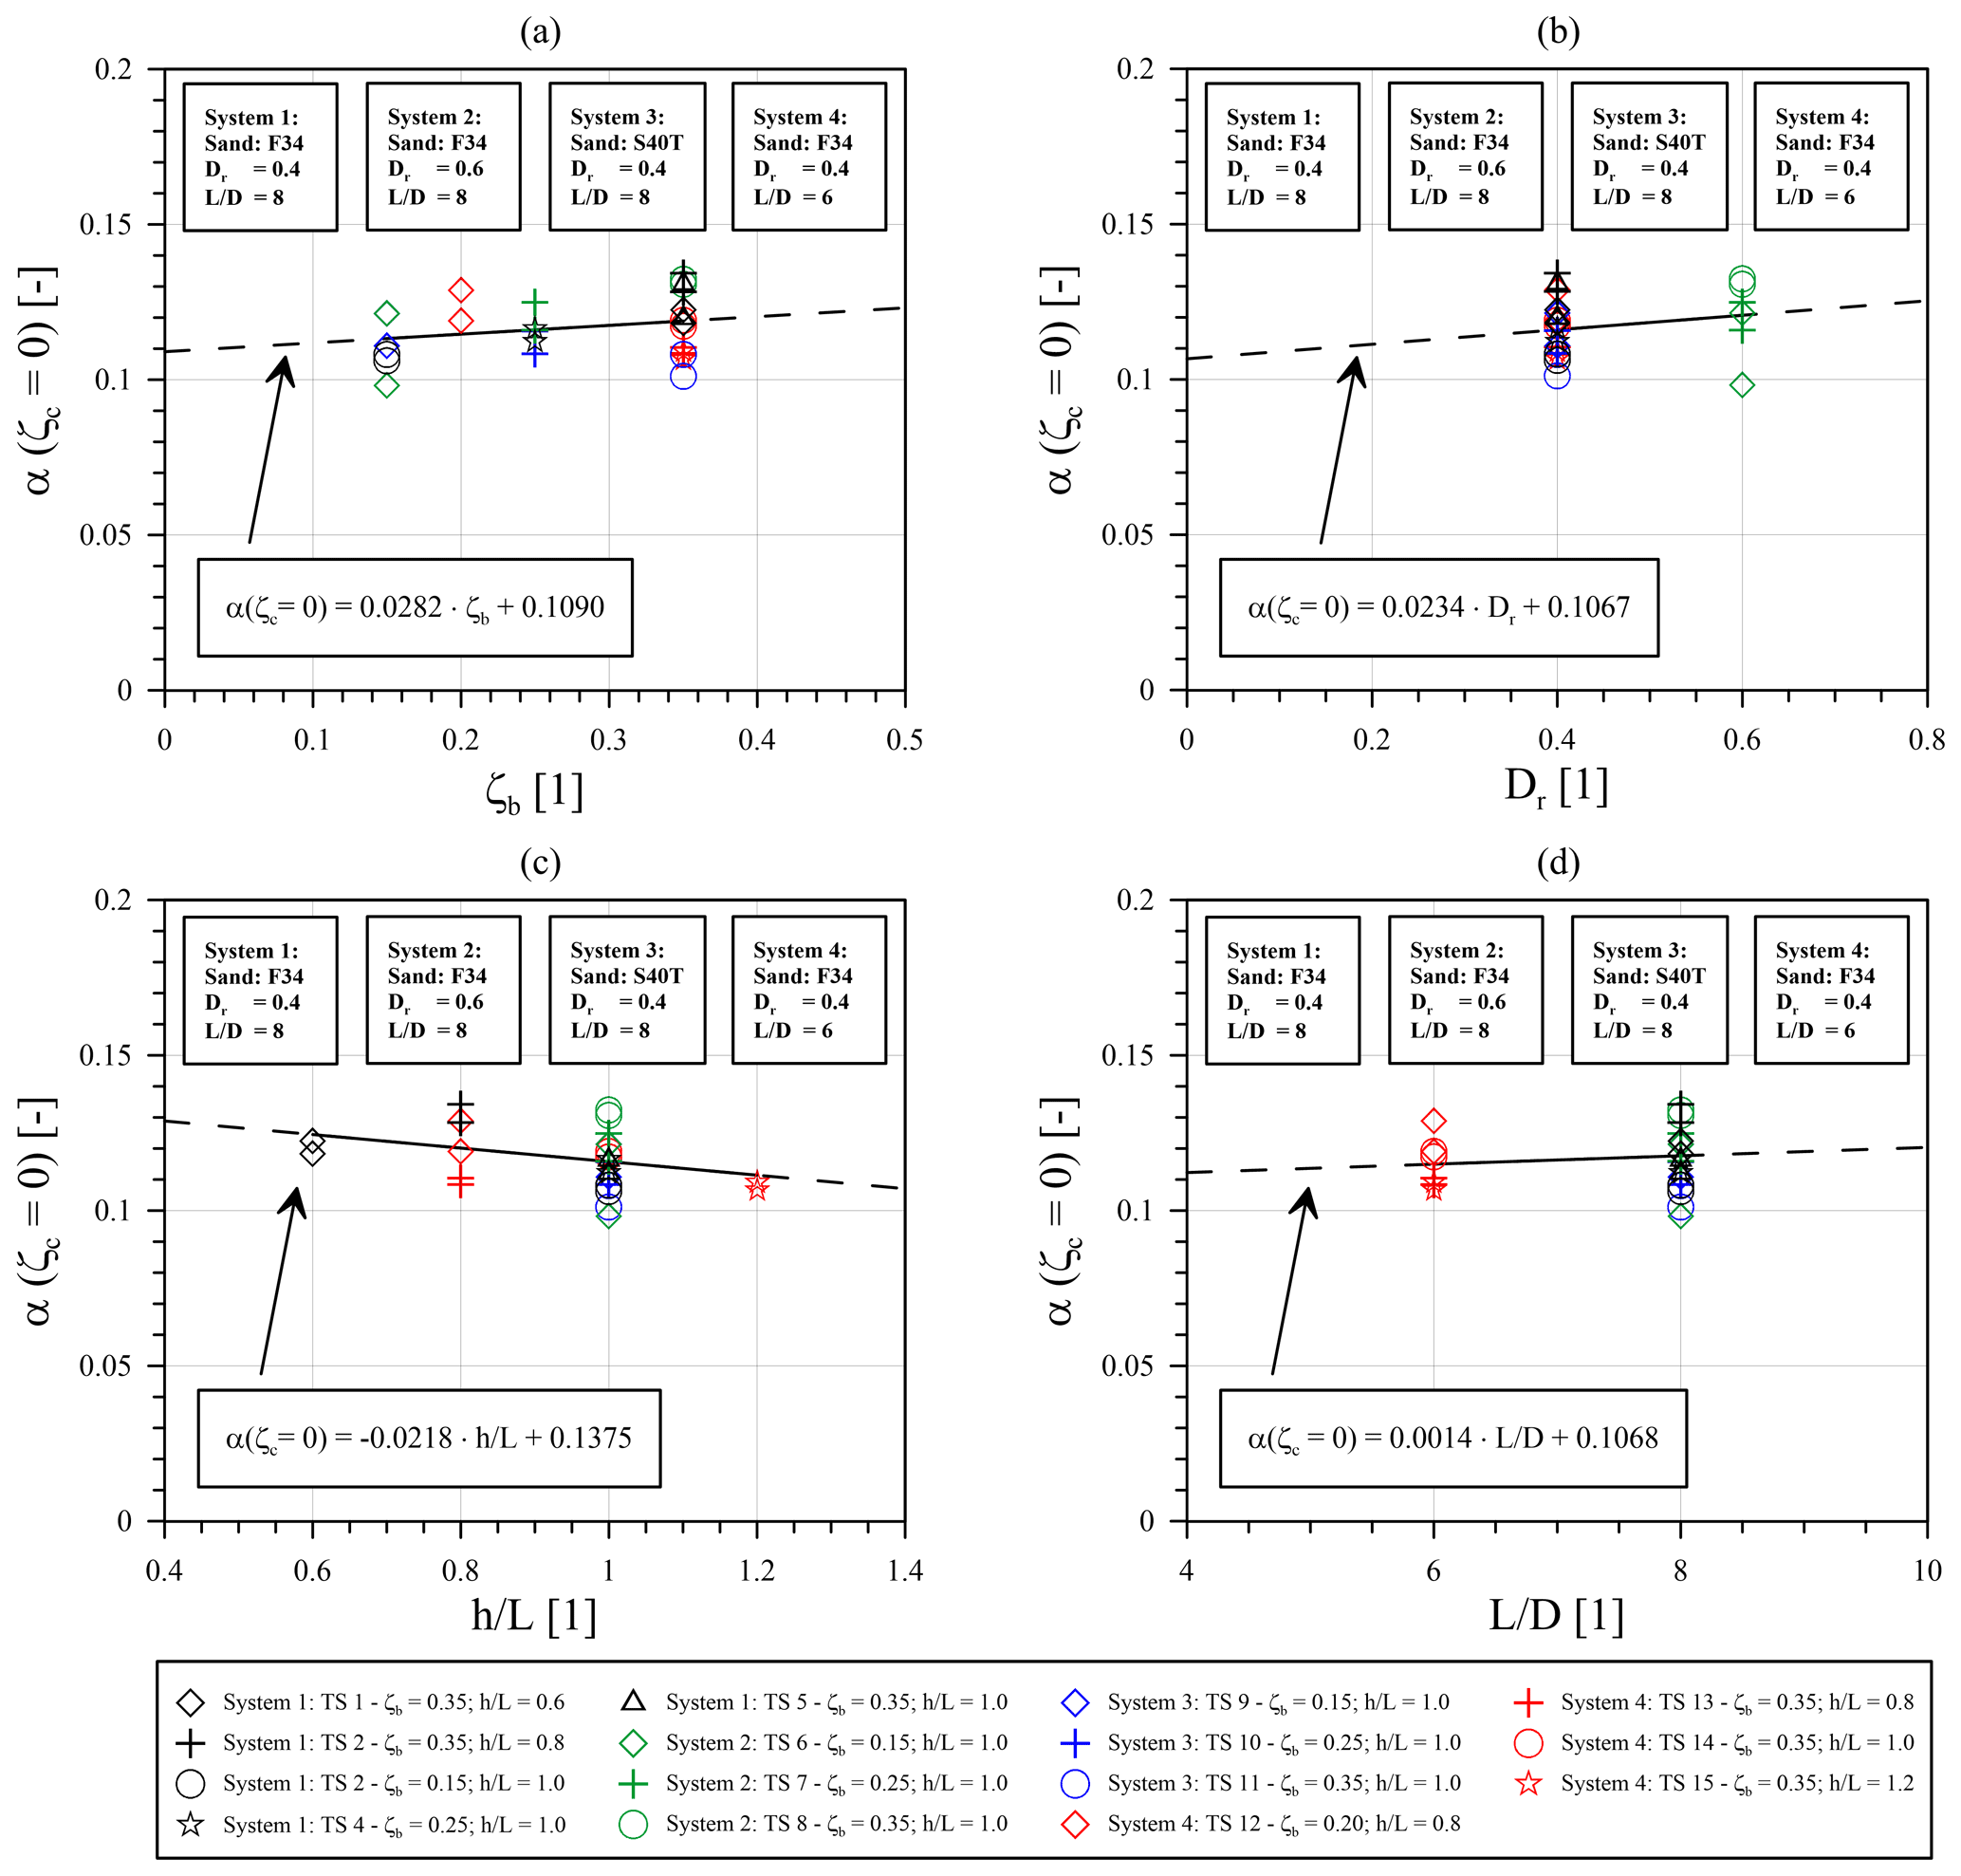
Figure 7Evaluation of cyclic test results: relationship of the accumulation parameter α for ζc=0 with (a) load magnitude ζb, (b) soil relative density Dr, (c) normalized load eccentricity and (d) normalized embedment length .
Finally, Fig. 7d shows the determined accumulation parameters (α) for ζc=0 as a function of the normalized pile embedment length (). As for the other investigated parameters (ζb, Dr, ), there is no appreciable influence of the pile embedment length (L) on the accumulation parameter (α) at least for the rigid piles in the investigated range of normalized embedment length () and for one-way cyclic loading (ζc=0).
Although no clear trend emerges from any of the graphs in Fig. 7 in view of the scatter present, a linear regression analysis was performed for each plot. The resulting equations describing the determined and aforementioned dependencies are given in the respective diagrams for completeness. Due to the insignificance of the observed dependencies combined with the existing variance of the results, it seems that there is no remarkable influence of the investigated parameters on the accumulation parameter (α) at least for one-way cyclic loading (ζc=0). Nevertheless, it should be kept in mind that at least the initial displacement (y1) depends strongly on the mentioned load or pile–soil system parameters, which is why the absolute accumulated displacement after a certain number of load cycles (yN) is of course not independent of the mentioned input variables (see Eq. 1).
Further, Fig. 8 shows the accumulation parameter (α) and its dependency on the cyclic load ratio (ζc) for all four pile–soil systems. Here, the results for test series 8 with negative cyclic load ratios (ζc<0) have been excluded from evaluation due to the aforementioned reasons (see Sect. 4.3.2). Furthermore, due to the previously determined predominant independence of the accumulation parameter for cyclic one-way loading (α(ζc=0)), it was decided not to normalize the accumulation parameters (α(ζc)) on the basis of one of the other parameters (e.g. ζb or Dr), as suggested, for example, by Klinkvort and Hededal (2013), Truong et al. (2019), and Li et al. (2020). Instead, the results in Fig. 8 are enveloped by two functions defining an upper and lower bound of the accumulation parameter (α) for the investigated pile–soil systems and boundary conditions, illustrating the possible range of α values.
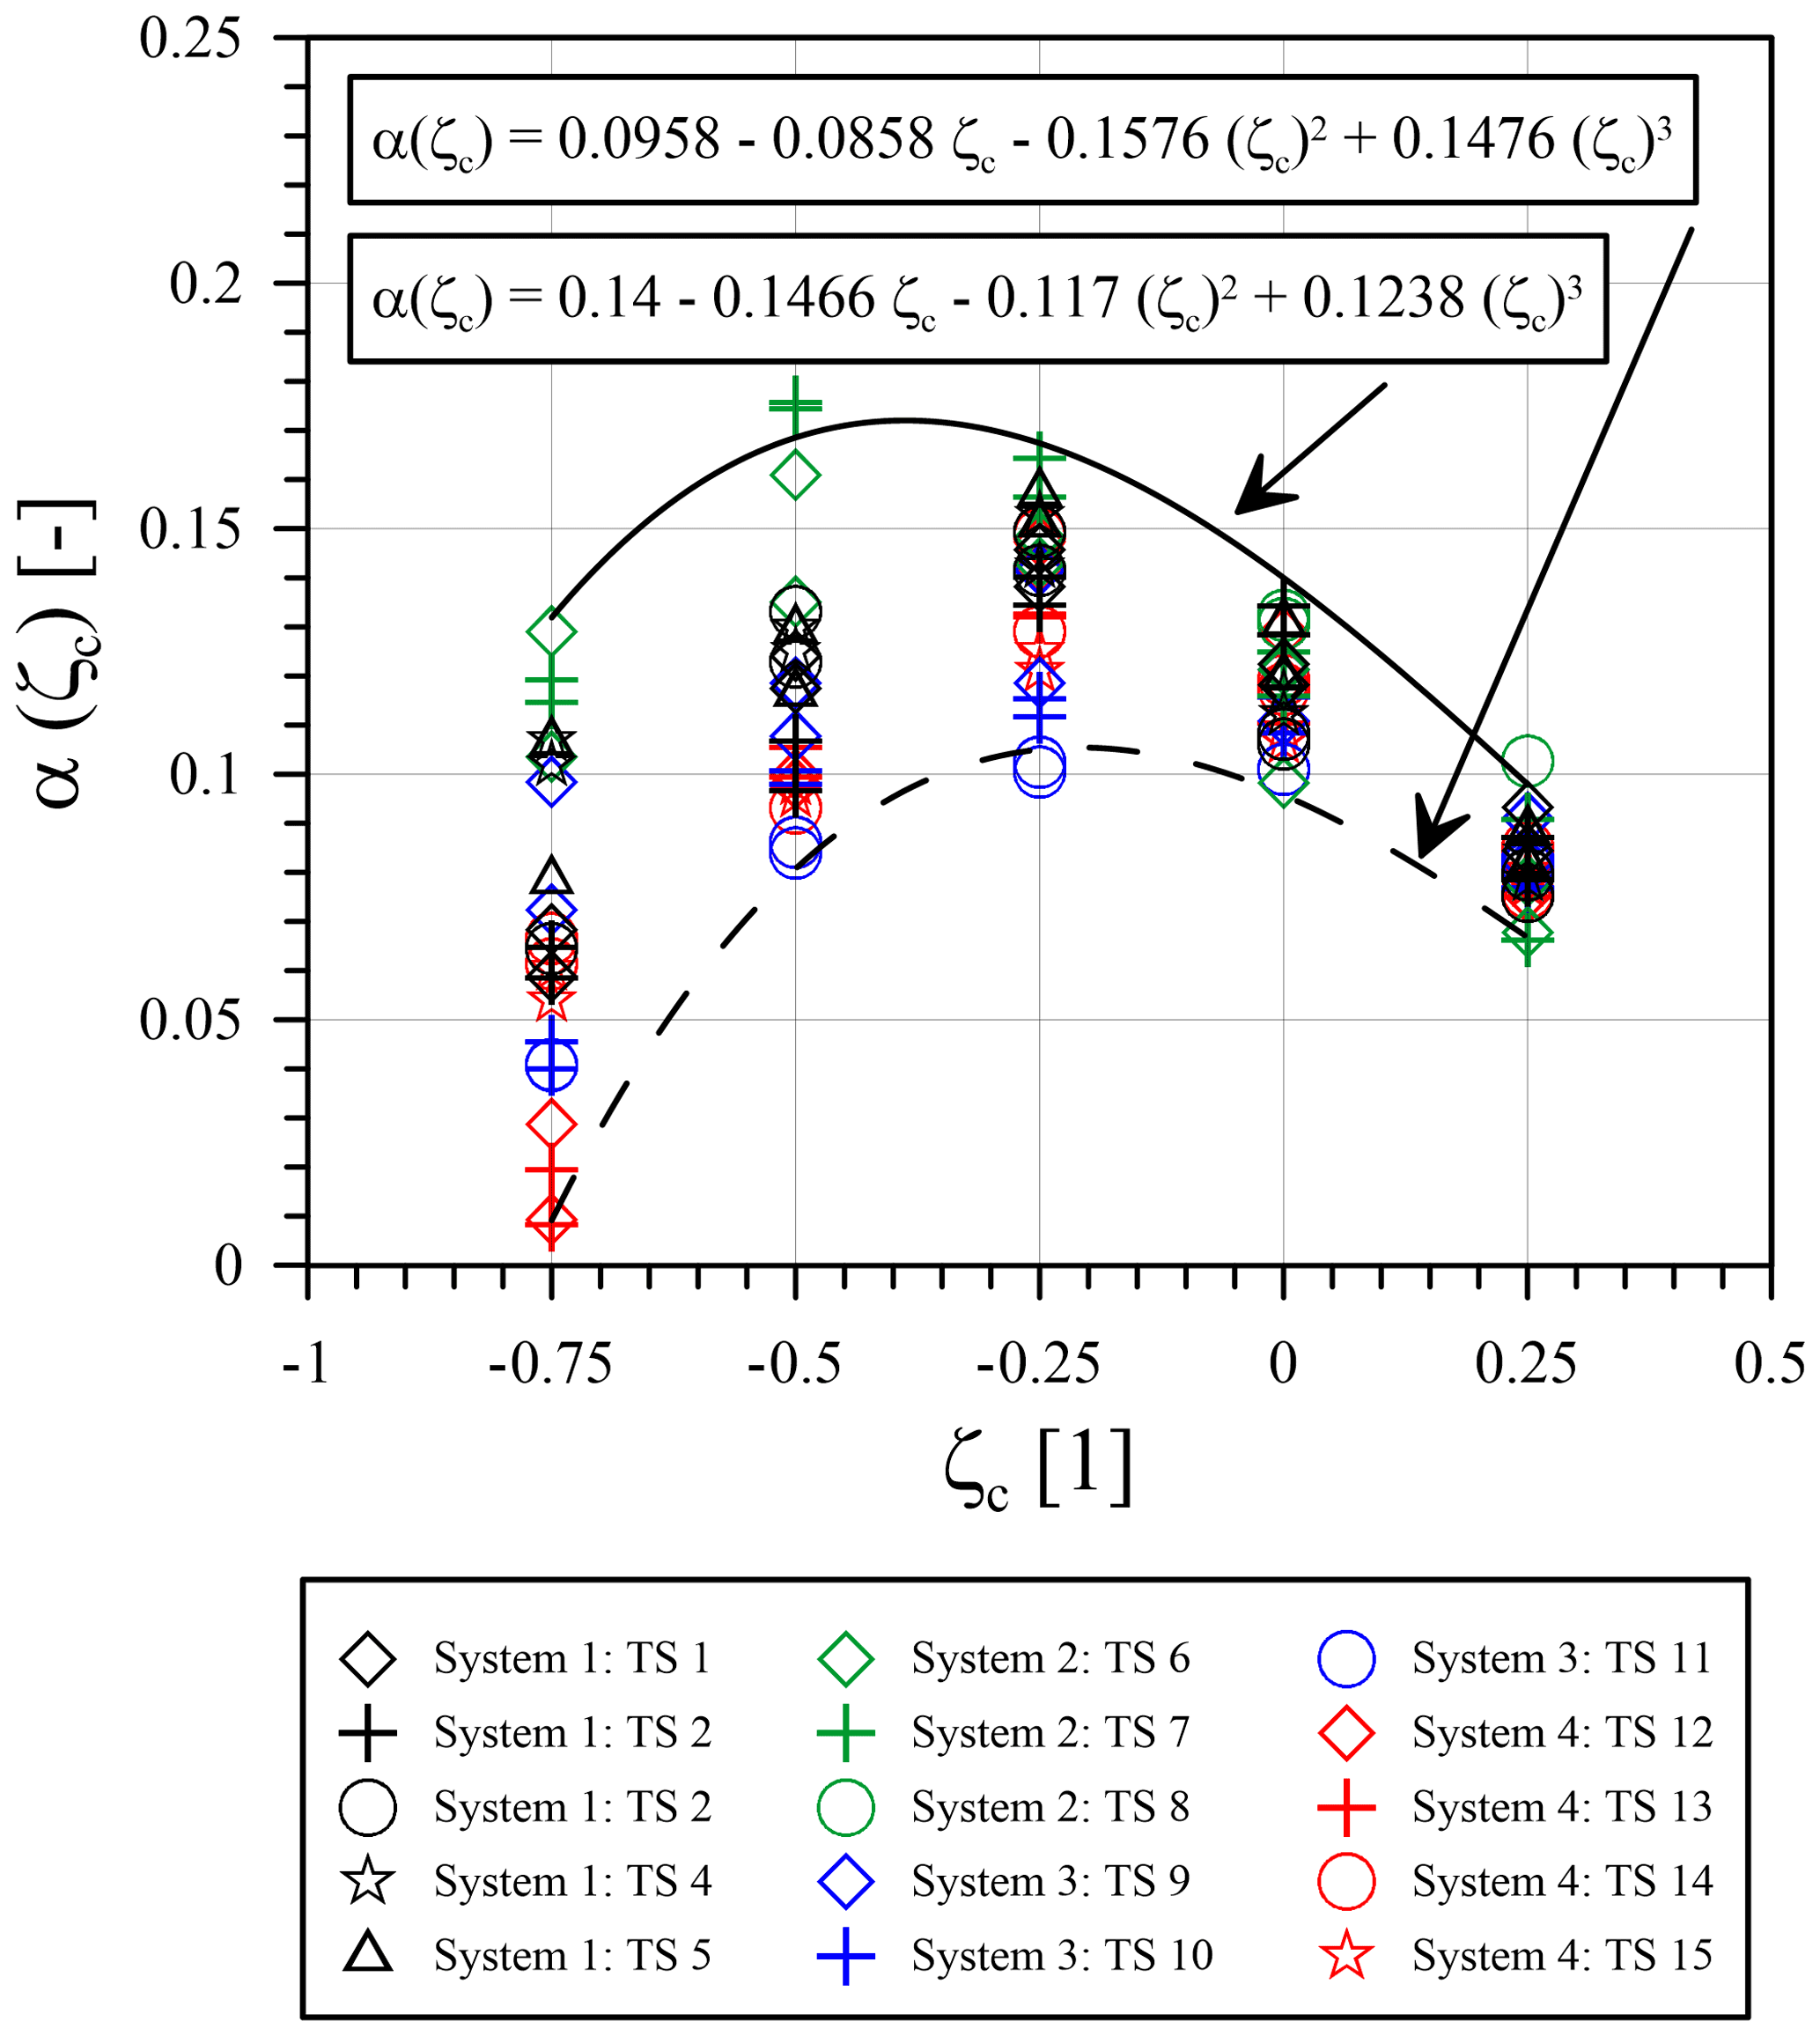
Figure 8Evaluation of cyclic test results: relationship between accumulation parameter (α) with cyclic load ratio (ζc) and corresponding lower and upper bound curves.
In general, it can be seen from Fig. 8 that the largest values for the accumulation parameter (α) result from unbalanced two-way loading (ζc<0) taking a maximum value of approximately 0.17 for pile–soil system 2 at a cyclic load ratio (ζc) of −0.5 and being more or less independent from cyclic load magnitude (ζb). On closer examination, it emerges that for all other pile–soil systems (1, 3 and 4) the maximum accumulation parameter (α) occurs with a lower value at a cyclic load ratio (ζc) of −0.25. It could be concluded that both the maximum of the accumulation parameter (α) and its occurrence with respect to the cyclic load ratio (ζc) depend on the soil relative density (Dr). In the investigated cases, an increase in the soil relative density (Dr) from 0.4 (system 1) to 0.6 (system 2) leads to a slight increase and simultaneous shift in the maximum accumulation parameter (α) towards a more negative value of the cyclic load ratio (ζc). Nevertheless, as already described in Sect. 4.3.2, the results for pile–soil system 2 should be handled with care. When considering only the results for pile–soil systems 1, 3 and 4, a certain spread of the determined accumulation parameters (α) is still evident, but basically they follow a consistent trend. Within the above-mentioned range of values for pile–soil systems 1, 3 and 4, the values for system 1 in particular are at the upper bound, while the accumulation parameters (α) for systems 3 and 4 tend to be below this. Especially for a cyclic load ratio (ζc) of −0.75 the accumulation parameters (α) for system 4 with a shorter embedment length partially lie in a very low range. Due to the scattering of the results, a clear final conclusion cannot be drawn. However, it is evident from the results that both the embedment length (L) of the pile (compare system 1 and system 4 in Fig. 8) and the grain size distribution (compare system 1 and system 3 in Fig. 8) appear to have an effect on the accumulation parameter (α).
In this section the findings and results from the conducted experimental 1 g model test campaign are discussed and compared with those of other research groups so that a classification of the results is possible. With respect to the accumulation parameter (α) from Eq. (1), the results indicate that it appears to be largely independent of the cyclic load magnitude (ζb), the soil relative density (Dr), the load eccentricity (h) and the embedment length of the pile (L) for one-way cyclic loading (ζc=0) as long as the pile–soil system is characterized by an almost rigid load-displacement behaviour. Despite some scattering in the results for the accumulation parameter (α), which could probably be due to irregularities in the test execution (soil sample preparation, etc.), a mean value of (with and ) could be determined. This mean value fits quite well with the value of αP=0.12 proposed by Peralta (2010) who also determined it from scaled 1 g model tests on rigid piles subjected to cyclic one-way loading (ζc=0) only. Similar to the present study, Peralta (2010) also found the accumulation parameter (α(ζc=0)) to be independent from cyclic load magnitude (ζb), the soil relative density (Dr) and the normalized pile embedment length () as long as the pile behaves almost rigid.
In contrast, Li et al. (2015) proposed a lower value of (see Table 1) for cyclic one-way loading (ζc=0) based on two cyclic laterally loaded field tests on rigid piles. This could indicate that accumulation parameters (α) from small-scale model tests cannot be easily transferred to true scale due to differences in the stress state of the surrounding soil and the resulting differences in soil behaviour (e.g. dilatancy, stiffness). This assumption can be supported by Richards et al. (2021) who investigated the stress effect on the response of model monopiles to unidirectional cyclic lateral loading (ζc=0) in sand by model tests either at 1 g or in the centrifuge. Although in this study an approximation function according to Eq. (5) was used to describe the cyclic displacement behaviour, it was found that the accumulation parameter (α) of this equation (not directly comparable with α according to Eq. 1) decreases logarithmically with stress level under otherwise constant boundary conditions. Qualitatively, according to Richards et al. (2021) the cyclic responses have been found to be similar across stress level, anyway. It is therefore obvious that the present results provide higher accumulation parameters (α) than comparable large-scale experiments or centrifuge tests at higher stress levels.
This can also be verified using the approach of Li et al. (2020), which is based on a series of centrifuge tests. According to this approach, the accumulation parameter (α) from Eq. (1) can be calculated by the multiplication of the two parameters Tb, L and Tc, L that describe the influence of the load magnitude (ζb) and the cyclic load ratio (ζc), together with the soil relative density (Dr), respectively (for corresponding equations see Table 1). Due to the definition of Tc,L according to Eq. (9), together with Eq. (8), for cyclic one-way loading (ζc=0) the accumulation parameter (α) for this approach would have to result in when the proposed functions for Tb, L and Tc, L would fit the underlying test results perfectly.
Since the results of Li et al. (2020), on which the approach and the functions are based, are also subjected to scattering, the constant value of Tb, L is only an approximation of the experimentally determined accumulation parameters (α(ζc=0)), which is why the proposed Tc, L functions (see Table 1) do not yield the value of 1 when the cyclic load ratio (ζc) is 0. Nevertheless, the approach yields accumulation parameters (α) of about () 0.07335 for cyclic one-way loading (ζc=0), which is slightly less than the value given by Li et al. (2015) and provides another indication of the stress dependence of the accumulation parameter (α). Further, Li et al. (2020) confirm the accumulation parameter (α) to be independent from cyclic load magnitude (ζb), similar to the results presented in the article at hand.
Somehow different are the findings of Klinkvort and Hededal (2013), in which the accumulation parameter (α) depends on the cyclic load magnitude (ζb) and the cyclic load ratio (ζc). For cyclic one-way loading (ζc=0) the accumulation parameter (α) according to Klinkvort and Hededal (2013) results directly from the equation for Tb, K&H in Table 1, which, for example, yields a value of 0.231 for a cyclic load magnitude (ζb) of 0.4, linearly further increasing for higher load magnitudes (ζb). This is contrary to the findings of most other authors mentioned in Table 1 except LeBlanc et al. (2010a) whose approach is not directly comparable as it is not based on Eq. (1). In addition, the Klinkvort and Hededal (2013) approach seems to provide very high accumulation parameters (α(ζc=0)) compared to other methods, at least for load magnitudes (ζb) larger than 0.2. Here, the definition of the reference load Href for the determination of the load magnitude (ζb) according to Klinkvort and Hededal (2013) has to be kept in mind (see Table 2). Nevertheless, such high accumulation parameters (α) from centrifuge tests are contrary to the findings of Richards et al. (2021) and the assumption of decreasing accumulation parameters (α) with stress level. Nevertheless, the results of Klinkvort and Hededal (2013) support the assumption that the accumulation parameter (α) is independent of the soil relative density (Dr), which has also been found in the present study, at least for cyclic one-way loading (ζc=0).
According to the approach of Truong et al. (2019), the accumulation parameter (α) for cyclic one-way loading (ζc=0) is independent from cyclic load magnitude (ζb) as already proposed by Li et al. (2020) and also found in this study. Nevertheless, it linearly decreases with soil relative density (Dr). For relative densities (Dr) of 0.4 and 0.6, as used in the experiments presented above, unidirectional cyclic loading (ζc=0) results in accumulation parameters of 0.212 and 0.168 using the approach of Truong et al. (2019). This is significantly higher than the values obtained in the present study () and contradicts the assumption of a decreasing accumulation parameter (α) with stress level in that the Truong et al. (2019) approach is based on centrifuge tests. On the other hand, this approach yields an accumulation parameter (α) of 0.113 for a soil relative density (Dr) of 0.85, which is much closer to the value resulting from this study. Possibly, a stress-dependent conversion of the soil relative density (Dr), as proposed by LeBlanc et al. (2010a), could provide an explanation for the resulting deviations (see Sect. 2). However, the dependence of the accumulation parameter (α) for unidirectional loading (ζc= 0) on the soil relative density (Dr) proposed by Truong et al. (2019) contradicts the results of the present study, as well as those of Klinkvort and Hededal (2013) and Li et al. (2020).
Further, the influence of a variable cyclic load ratio (ζc) on the accumulation parameter (α) is now discussed. Due to the above-mentioned, partly different dependencies of the estimation approaches for the accumulation parameter (α), however, a direct comparison is not possible. In order to enable a reliable comparison, the results for the accumulation parameter (α) with cyclic load ratio (ζc) according to the different approaches presented are shown in normalized form in Fig. 9. By normalizing to α(ζc= 0), the previously mentioned differences of the approaches with respect to the accumulation parameter (α) for one-way loading (ζc=0) are omitted so that the influence of the cyclic load ratio (ζc) can be considered in isolation. Only the influence of the soil relative density (Dr) according to the approach of Li et al. (2020) cannot be excluded in this way due to the two proposed non-linear functions for Tc, L(ζc, Dr) (see Table 1). For this reason, Fig. 9 shows two curves for this approach, in which both curves define the limits of applicability of the Li et al. (2020) method with respect to the soil relative density (). The results according to Peralta (2010) and Li et al. (2015) are not depicted in Fig. 9 as both methods only propose an accumulation parameter (α) for cyclic one-way loading (ζc=0). To allow a comparison with the results of the present study, also the lower and upper bound curves for the accumulation parameter (α) determined and proposed in Sect. 4.3.3 are plotted in normalized form in Fig. 9.
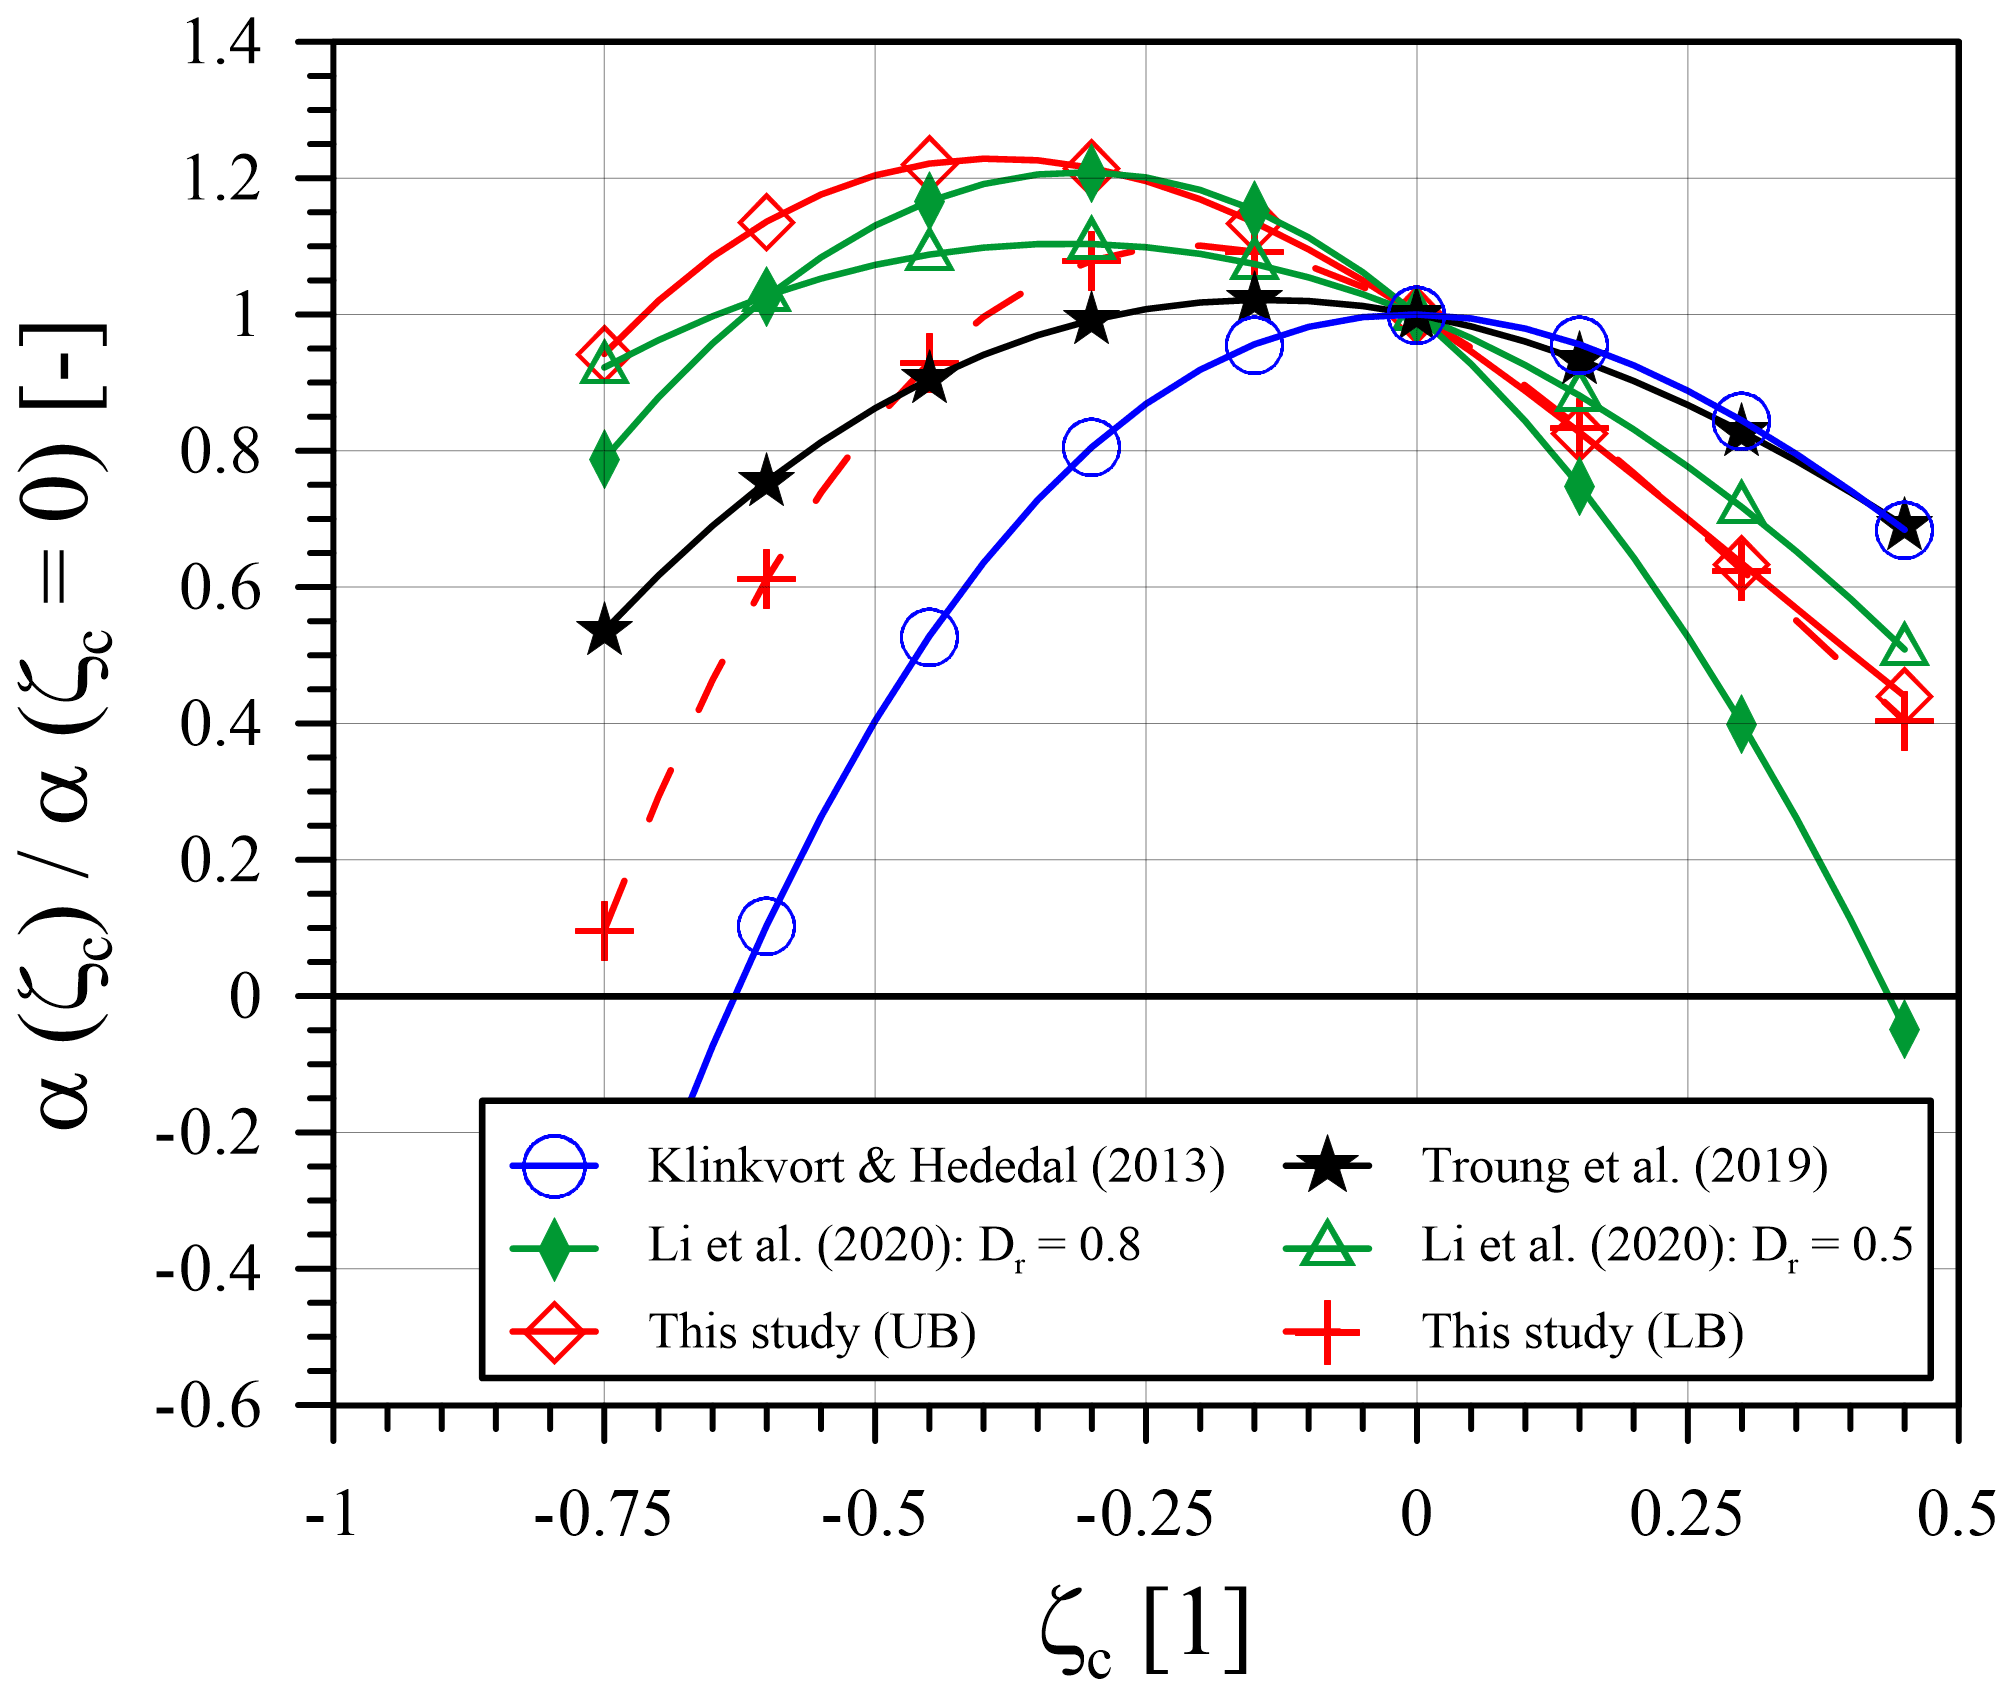
Figure 9Normalized accumulation parameter (α) with cyclic load ratio (ζc) for different approaches and comparison with the proposed lower bound (LB) and upper bound (UB) curves.
Figure 9 shows that in particular the approach according to Li et al. (2020) fits well with the results of the current study. For both soil relative densities (Dr) of 0.8 and 0.5, the results are within the proposed limits (lower bound, LB, and upper bound, UB) for two-way loading (ζc<0), while for one-way loading (ζc≥0) the Li et al. (2020) curve for a soil relative density (Dr) of 0.8 is increasingly divergent and below the proposed boundaries (conservative). The Truong et al. (2019) approach also shows a qualitatively similar shape to the proposed boundary curves but overall is slightly below the lower bound curve for cyclic two-way loading (ζc<0) and moderately above for one-way loading (ζc≥0). All the aforementioned curves show a maximum value between approximately 1.23 and 1.02 for an unbalanced two-way loading with cyclic load ratio (ζc) in the range of −0.4 to −0.15. This is generally also in agreement with the findings of LeBlanc et al. (2010a) who report a maximum accumulation for cyclic two-way loading with a cyclic load ratio (ζc) of −0.6 but whose approach is not included in this comparison due to the different formulation of this approach (see Table 1). Somehow different are the findings of Klinkvort and Hededal (2013), whose approach provides a maximum accumulation parameter (α) for cyclic one-way loading with complete unloading in each cycle (ζc=0). For more positive cyclic load ratios (ζc>0), the normalized accumulation parameter according to Klinkvort and Hededal (2013) resembles the values of the Truong et al. (2019) approach that lie slightly above the proposed upper bound curve.
In this paper, a brief summary of current regulations and recommendations for the serviceability limit state dimensioning of offshore monopile foundations in sand supporting wind turbines was given. Based on this summary, it was shown that current offshore guidelines (DNV GL, 2018, and API, 2014) provide design requirements but do not recommend appropriate design procedures for predicting deformations for large-diameter piles subjected to long-term lateral cyclic loading. Instead, a variety of different methods for the prediction of such deformations can be found in the literature, some of which have been briefly presented. Based on example calculations, it was shown that the proposed methods for deriving the cyclic load-deformation behaviour of monopile foundations yield partly significantly different results. Furthermore, it could be shown that depending on the chosen approach, the results exhibit a partly contradictory trend with regard to the influence of some input variables such as load or soil parameters. To better understand this outcome, a comprehensive experimental small-scale model test campaign involving approximately 150 single tests on different pile–soil systems subjected to varying loading conditions (ζb and ζc) being representative for the environmental conditions of an offshore monopile foundation (Jalbi et al., 2019) was conducted and evaluated. Based on the results, it could be shown that a power function (Eq. 1) is very suitable for representing the pile head displacement accumulation of rigid piles under different cyclic one- and two-way loading conditions with constant mean load and amplitude. For the accumulation parameter (α) of the power function, it was found from the conducted tests that it is almost independent of the cyclic load magnitude (ζb), the soil relative density (Dr), the load eccentricity (h) and the pile embedment length (L) for cyclic one-way loading (ζc=0) as long as the pile–soil systems can be classified as behaving rigidly. Comparison of these findings and the determined mean value for with values derived from other methods showed that this observation is only shared by some authors. Furthermore, it was shown that the determined absolute value of the accumulation parameter for one-way cyclic loading (ζc=0) seems to exhibit a stress dependence. Therefore, the direct transfer of the presented results to true scale cannot be recommended. With regard to the influence of different cyclic load ratios (ζc), the test results of the test campaign conducted showed a relatively clear trend. Maximum accumulation and therefore accumulation parameters (α(ζc)) in general result from unbalanced two-way loading () and lead to an increase in the accumulation parameter (α) by a factor of up to 1.23 compared to one-way loading (ζc=0). Since the determined accumulation parameters for variable cyclic load ratios (α(ζc)), on the one hand, vary slightly due to experimental scatter and, on the other hand, seem to be at least slightly influenced by other variables (e.g. Dr), two equations for an upper and a lower bound of the accumulation parameter (α(ζc)) were proposed. If the proposed limit curves for the accumulation parameter (α(ζc)) are normalized to the accumulation parameter for cyclic one-way loading (α(ζc=0)), then a comparison with the results obtained by other approaches shows relatively good agreement. In order to be able to make a prediction of the cyclic displacement accumulation of a pile using the power function according to Eq. (1), the accumulation parameter for one-way cyclic loading (α(ζc=0)) should first be known as accurately as possible. This can be achieved by site-specific numerical simulations or centrifuge testing to avoid unwanted stress effects. Another possibility would be to determine functions for the stress-dependent conversion of the proposed accumulation parameter (α) from the present small-scale model tests (see, for example, Richards et al., 2020). For deviating load conditions (varying cyclic load ratios (ζc)), a range of possible accumulation parameters (α(ζc)) can be estimated using the proposed upper and lower bound curves by normalizing these curves and multiplying the resulting factor by the pre-determined site-specific accumulation parameter for one-way loading (α(ζc= 0)). Further research should especially focus on the accurate determination of the accumulation parameter for cyclic one-way lateral loading (α(ζc=0)).
Measurement data from the small-scale 1 g experiments are available upon request from the authors.
DF prepared and carried out the presented test campaign, evaluated the measurement data, and wrote the paper. MA aided in the design of the experimental test campaign, advised on evaluation of the data and supervised the work. Both authors were involved in the peer review of the work.
The contact author has declared that none of the authors has any competing interests.
Publisher’s note: Copernicus Publications remains neutral with regard to jurisdictional claims in published maps and institutional affiliations.
This study was carried out in the scope of the research project “Accumulation of lateral displacements of piles under general cyclic one- and two-way loading” funded by the Deutsche Forschungsgemeinschaft (DFG, German Research Foundation) – project no. 393683178. The authors sincerely acknowledge DFG support.
This research has been supported by the Deutsche Forschungsgemeinschaft (grant no. 393683178).
The publication of this article was funded by the open-access fund of Leibniz Universität Hannover.
This paper was edited by Amir R. Nejad and reviewed by Gudmund Reidar Eiksund and Tomas Sabaliauskas.
API: Recommended practice 2A-WSD – Planning, Designing, and Constructing Fixed Offshore Platforms – Working Stress Design, American Petroleum Institute, Version November 2014.
API RP 2GEO: Recommended practice 2GEO – Geotechnical Foundation Design Considerations, American Petroleum Institute, Version July 2014.
Bhattacharya, S., Lombardi, D., Amani, S., Aleem, M., Prakhya, G., Adhikari, S. Abdullahi, A., Alexander, N., Wang, Y., Cui, L., Jalbi, S., Pakrashi, V., Li, W., Mendoza, J., and Vimalan, N.: Physical modelling of offshore wind turbine Foundations for TLR (Technology Readiness Level) studies, J. Mar. Sci. Eng., 9, 589, https://doi.org/10.3390/jmse9060589, 2021.
Byrne, B. W., Burd, H., McAdam, R. A., and Houlsby, G. T.: PISA: New design methods for offshore wind turbine monopiles, Proceedings of the 8th International Conference for Offshore Site Investigation and Geotechnics (OSIG), 12–14 September 2017, Royal Geographical Society, United Kingdom, London, 142–161, 2017.
Byrne, B. W., Burd, H. J., Zdravkovic, L., Abadie, C. N., Houlsby, G. T., Jardine, R. J., Martin, C. M., McAdam, R. A., Pacheco Andrade, M. Pedro, A. M. G., Potts, D. M., and Taborda, D. M. G.: PISA design methods for offshore wind turbine monopiles, Proceedings of the Offshore Technology Conference, 6–9 May 2019, Houston, Texas, Paper No. OTC-29371-MS, https://doi.org/10.4043/29373-MS, 2019.
DNV GL: DNVGL-ST-0126 – Support structures for wind turbines, Det Norske Veritas, Germanischer Lloyd (GL), Version July 2018.
Frick, D. and Achmus, M.: An experimental study on the parameters affecting the cyclic lateral response of monopiles for offshore wind turbines in sand, Soils Found., 60, 1570–1587, https://doi.org/10.1016/j.sandf.2020.10.004, 2020.
Hettler, A.: Verschiebungen starrer und elastischer Gründungskörper in Sand bei monotoner und zyklischer Belastung [Deformations of rigid and elastic foundation structures in sand under monotonic and cyclic loading], PhD thesis, Veröffentlichung des Instituts für Bodenmechanik und Felsmechanik der Universität Fridericiana in Karlsruhe, Heft 9, 1981 (in German).
Jalbi, S., Arany, L., Salem, A., Cui, L., and Bhattacharya, S., A method to predict the cyclic loading profiles (one-way or two-way) for monopiles supported offshore wind turbines, Mar. Struct., 63, 65–83, https://doi.org/10.1016/j.marstruc.2018.09.002, 2019.
Jalbi, S., Hilton, J., and Jacques, L.: Assessment of Practical Methods to Predict Accumulated Rotations of Monopile-Supported Offshore Wind Turbines in Cohesionless Ground Profiles, Energies, 13, 3915, https://doi.org/10.3390/en13153915, 2020.
Kallehave, D., LeBlanc Thilsted, C., and Liingaard, M. A.: Modification of the API p-y formulation of initial stiffness of sand, Proc. of the 7th International conference Offshore Site Investigation and Geotechnics, 11–14 September 2012, Royal Geographical society, United Kingdom, London, 465–472, 2012.
Klinkvort, R. T. and Hededal, O.: Lateral response of monopile supporting an offshore wind turbine, Geotechnical Engineering, 166, 147–158, https://doi.org/10.1680/geng.12.00033, 2013.
LeBlanc, C., Houlsby, G. T., and Byrne, B. W.: Response of stiff piles in sand to long-term cyclic lateral loading, Géotechnique, 60, 79–90, https://doi.org/10.1680/geot.7.00196, 2010a.
LeBlanc, C., Byrne, B. W., and Houlsby, G. T.: Response of stiff piles to random two-way lateral loading, Géotechnique, 60, 716–721, https://doi.org/10.1680/geot.09.T.011, 2010b.
Lin, S. S. and Liao, J. C.: Permanent strains of piles in sand due to cyclic lateral loads, J. Geotech. Geoenviron., 125, 798–802, https://doi.org/10.1061/(ASCE)1090-0241(1999)125:9(798), 1999.
Little, R. L. and Briaud, J.: Full scale cyclic lateral load tests on six single piles in sand, Miscellanous Paper No. GL-88-27, Texas A&M University, College Station, Texas, 1988.
Li, W., Igoe, D., and Gavin, K.: Field tests to investigate the cyclic response of monopiles in sand, P. I. Civil Eng.-Geotec., 168, 407–421, https://doi.org/10.1680/jgeen.14.00104, 2015.
Li, Q., Askarinejad, A., and Gavin, K.: Lateral response of rigid monopiles subjected to cyclic loading: centrifuge modelling, P. I. Civil Eng.-Geotec., ISSN 1353-2618, https://doi.org/10.1680/jgeen.20.00088, 2020.
Long, J. H. and Vanneste, G.: Effects of cyclic lateral loads on piles in sand, J. Geotech. Eng., 120, 33–42, 1994.
Manoliu, I., Dimitriu, D., V., Radulescu, N., and Dobrescu, G.: Load-deformation characteristics of drilled piers, Proceeding of the 11th International Conference on Soil Mechanics and Foundation Engineering, 12–16 August 1985, United states, San Francisco, 3, 1553–1558, 1985.
O'Neill, M. W. and Murchison, J. M.: An evaluation of p-y relationships in sands, A report to the American Petroleum Institute (PRAC 82-41-1), University of Houston, Department of Civil Engineering, Research Report No. GT-DF02-83, 1983.
Peralta, P.: Investigation on the behaviour of large diameter piles under long-term lateral cyclic loading in cohesionless soil, PhD Thesis, Leibniz University Hannover, Institute for Geotechnical Engineering, Mitteilungsheft 71, 2010.
Reese, L. C., Cox, W. R., and Koop, F. D.: Analysis of laterally loaded piles in sand, Proceedings of the Offshore Technology Conference, 5–7 May 1974, Houston, Texas, United States, Paper No. OTC 2080, 473–483, 1974.
Richards, I. A., Bransby, M. F., Byrne, B. W., Gaudin, C., and Houlsby, G. T.: Effect of stress level on response of model monopile to cyclic lateral loading in sand, J. Geotech. Geoenviron., 147, ISSN 1943-5606, https://doi.org/10.1061/(ASCE)GT.1943-5606.0002447, 2021.
Poulos, H. G. and Hull, T.: The role of analytical geomechanics in foundation engineering, Foundation Engineering: Current Principles and Practice, ASCE, 2, 1578–1606, 1998.
Rosquoët, F., Thorel, L., Garnier, J., and Canepa, Y.: Lateral cyclic loading of sand-installed piles, Soils Found., 47, 821–832, https://doi.org/10.3208/sandf.47.821, 2007.
Sørensen, S. P. H.: Soil-structure interaction for non-slender large-diameter offshore monopiles, PhD Thesis, Aalborg University Denmark, Department of Civil Engineering, e-ISBN 9788792982360, 2012.
Terceros, M., Schmoor, K. A., and Thieken, K.: IGTHPile V4 Software & Reference Manual, https://www.igth.uni-hannover.de/de/forschung/igth-pile/ (last access: 5 July 2022), 2015
Thieken, K., Achmus, M., and Lemke, K.: A new static p-y approach for piles with arbitrary dimensions in sand, Geotechnik, 38, 267–288, 2015.
Truong, P., Lehane, B. M., Zania, V., and Klinkvort, R. T.: Empirical approach based on centrifuge testing for cyclic deformations of laterally loaded piles in sand, Géotechnique, 69, 133–145, https://doi.org/10.1680/jgeot.17.P.203, 2019.
- Abstract
- Introduction
- State of the art
- Comparison of different empirical approaches for the estimation of cyclic lateral deformation
- Small-scale model tests
- Discussion
- Conclusions
- Data availability
- Author contributions
- Competing interests
- Disclaimer
- Acknowledgements
- Financial support
- Review statement
- References