the Creative Commons Attribution 4.0 License.
the Creative Commons Attribution 4.0 License.
 | 02 Aug 2022
Evaluation of different power tracking operating strategies considering turbine loading and power dynamics
Florian Pöschke
Horst Schulte
This work focuses on the design, implementation, and implications of different operational strategies for wind turbines when providing a power tracking functionality. Power tracking is necessary for the contribution to stabilization of the electrical grid. Specifically, two different operational strategies are used as the foundation for a model-based control design that allows the turbine to follow a given power demand. The first relies on keeping a constant rotational speed while varying the generator torque to match the power demand. The second approach varies both the generator torque and the rotational speed of the turbine equally to yield the desired power output. In the power reduction mode, both operational strategies employ the pitch to maintain the desired rotational speed of the turbine. The attainable power dynamics of the two closed-loop systems with varying power demands are analyzed and compared. Reduced-order models formulated as transfer functions and suitable for integration into an upper-level control design are proposed. It is found that the first strategy involving only the generator torque while keeping a constant rotational speed provides significantly faster power control authority. Further, the resulting fatigue loading in turbulent wind conditions is discussed for the two operational strategies, where constant operational storage is emulated to enable a bidirectional variation in the power output. Without any additional load-reducing control loops, the results suggest that the first operational strategy involving variation in the generator torque only is more favorable with regard to the resulting loading of the turbine structure. The simulation studies are conducted for NREL's 5 MW reference turbine using FAST.
- Article
(2825 KB) - Full-text XML
- BibTeX
- EndNote


The provision of ancillary services by wind turbines is an increasingly important function for a stable and reliable operation of the electric power system (van Kuik et al., 2016). These ancillary services may comprise features like the reaction to frequency deviations for balancing load variations at different timescales (Margaris et al., 2012; Rebello et al., 2020) or supporting black start of the power system (Shan et al., 2020; Jain et al., 2020). Effectively, these concepts vary the active and reactive power injection to match the demands of the electric grid, and therefore active power control on a turbine level is involved. Power system studies usually consider the turbine as a variable and adjustable power source (Margaris et al., 2012). For participation in grid stabilization, local control loops may be designed on the turbine level resulting in a variation in the power output depending on the measured states of the electrical grid; see, e.g., the droop-based approaches in Margaris et al. (2012), Aho et al. (2013), Van de Vyver et al. (2016), and Abouzeid et al. (2019) or the comparison of different approaches in Jain et al. (2020). Moreover, wind turbines may be clustered with other distributed power generators into a virtual power plant aiming for a coordinated response governed by a central control scheme. For the design and implementation of these control loops, knowledge about the attainable dynamics of the energy conversion system is necessary (Xin et al., 2013; Björk et al., 2021). As a result, simple models are needed capable of portraying the relevant dynamics emerging from power tracking operation of wind turbines.
Apart from the benefits of power tracking for the electrical grid, the power tracking functionality has been reported to possibly enhance wind turbine operation by limiting structural loading (Petrović and Bottasso, 2017) or reducing and balancing loads within a wind farm (Boersma et al., 2017; Kazda et al., 2018; Vali et al., 2019). Axial induction control is a method that alters the individual turbine operating point aiming for an optimization of the overall wind farm power production. To achieve this, the turbine is either statically or dynamically derated (Boersma et al., 2017; van der Hoek et al., 2022). In the static case, the energy extraction of the upstream turbines is reduced to possibly increase the energy contained in the wind for the downstream turbines (Kanev et al., 2018; van der Hoek et al., 2022). Within the dynamic approach, an additional time-variable signal is superimposed on the pitch angle command to induce additional turbulence and beneficially influence wake mixing and wake recovery (Goit and Meyers, 2015; Munters and Meyers, 2018; Frederik et al., 2020; van der Hoek et al., 2022). For the application of these schemes experimentally or in the field (Campagnolo et al., 2016; van der Hoek et al., 2019, 2022; Frederik et al., 2020), controllers are necessary that are capable of either statically or dynamically tracking a desired operating point on the power and thrust coefficient surfaces of the turbine.
On the wind turbine level, power tracking results in an enlarged operational range that needs to be coped with by the wind turbine controller compared to the usual strategy that aims for a maximization of the power output in the partial-load region and a limitation of power above rated wind speed (Aho et al., 2016; Pöschke et al., 2020; Jain et al., 2020). The operating trajectory that results in the desired power output, however, is not unique and therefore depends on the choice of the operational scheme encoded in the control strategy. This can be illustrated by considering the generator power given as
where ωg and Tg are the rotational speed and generator torque, respectively. From Eq. (1), it is apparent that a variation in the power output according to the demand can be achieved by an adjustment of the rotational speed, the generator torque, or both. Consequently, there is a need to study the implications of different operating strategies for power tracking as discussed in Deshpande and Peters (2012), Aho et al. (2013, 2016), Jeong et al. (2014), Mirzaei et al. (2014), Zhu et al. (2017), and Lio et al. (2018). All of the works address the nonunique distribution of possible operating points on the power conversion surface, where different objectives like constant rotational speed (Aho et al., 2013; Jeong et al., 2014; Mirzaei et al., 2014; Zhu et al., 2017; Lio et al., 2018), the constant tip speed ratio (Mirzaei et al., 2014; Zhu et al., 2017; Lio et al., 2018), or the minimum thrust coefficient (Zhu et al., 2017; Lio et al., 2018) may determine the operating trajectories enforced by the controller. Most of the works apply augmented versions of commonly used control loops to enable the power tracking functionality by varying the set points of the applied controller (Deshpande and Peters, 2012; Aho et al., 2013, 2016; Jeong et al., 2014; Zhu et al., 2017; Lio et al., 2018). Comparisons of the different operating strategies considering both the power tracking accuracy and the resulting loading of the wind turbine structure are drawn in Jeong et al. (2014) and Aho et al. (2016). As the wind turbine is a nonlinear system governed by its aerodynamic properties, gain-scheduled proportional–integral control schemes are usually applied that, depending on the current pitch position, alter the feedback gains to accommodate the varying dynamical properties of the turbine (and thereby implicitly relate the control input to the current wind speed). This relation of the current pitch position to the expected dynamics is usually derived at the nominal operating points. A straightforward application of the same gain-scheduled pitch control as for nominal operation will result in degraded dynamical performance (Galinos et al., 2019) as the expected dynamics accommodated by the gain scheduling is different depending on the power operating point and the wind speed due to the nonlinear nature of the wind turbine (Mirzaei et al., 2014). Therefore, model-based control concepts can be used that explicitly shape the control gains in all desired operating points equally as discussed in Mirzaei et al. (2014), Inthamoussou et al. (2016), and Pöschke et al. (2020). In this article, the loading of the turbine structure depending on the chosen strategy is compared, where identical performance constraints determine the individual feedback gains used to obtain a similar closed-loop disturbance rejection dynamics in both operating strategies despite being operated at different trajectories. This aims for a mitigation of the effects introduced by the control algorithms, such that a plain comparison of the different operating strategies can be conducted.
Additionally to the loading perspective, this paper aims to feed the discussion on the integration of dynamical turbine models for control design and simulation studies of large-scale power systems and wind farms. The model-based control framework employed allows us to enforce similar turbine dynamics with respect to the wind in both investigated schemes, such that fundamental properties only influenced by the operating strategy and subject to varying power demands may be revealed and discussed. This is exploited to study the power tracking behavior of the two distinct strategies and derive simplified analytical models of the turbine power output dynamics. These models are useful for portraying the turbine dynamics when participating in large-scale power system simulations and control design.
The article is structured as follows: in Sect. 2 the rationale for the chosen operating strategies is discussed, while Sect. 3 covers the applied control design. The simulation results are discussed in Sect. 4, where both the resulting loading and the attainable power tracking dynamics are analyzed. The conclusion is drawn in Sect. 5.
Two different operating strategies are chosen and compared. In the first strategy, termed OS1, the demanded power is achieved by a variation in the generator torque only while keeping the rotational speed at its nominal value depending on the current wind speed. Contrarily, in OS2 the controller enforces a variation in both the generator torque and the rotational speed to meet the power demand. Compared to other strategies involving the limited extraction of rotational energy to support frequency events, the control strategies presented here are conceptualized to enable a permanent operation at the desired power level.
With ωopt(v) and Topt(v) being the steady-state rotational speed and generator torque for the partial- and full-load region depending on the current effective wind speed v and pd being the normalized desired power output of the turbine, the two strategies used for turbine operation are formalized as follows:
OS1 employs the generator to produce the desired power by a reduction in the torque directly proportional to the demand pd. In this strategy, the controller is set to enforce the same rotational speed irrespective of the power output demand pd by an adjustment of the pitch. Contrarily, in OS2 a reduction in both the rotational speed and the generator torque set points proportionally to is designed, also incorporating regulation by pitching. The minimum rotational speed was limited to ωmin=0.75 (or 9.1 rpm for the 5 MW reference turbine) to avoid hitting the first tower eigenfrequency with the three-per-revolution (3P) excitation of the rotation; see the Campbell diagram for the reference turbine in Jonkman and Jonkman (2016). To achieve this, the operating-point-dependent factor is introduced in Eq. (2). For a power tracking command of pd=1 in both strategies equally, the turbine is operated on the commonly considered operating trajectory trying to maximize the power extraction in the partial-load region and limiting the power to its rated value in the full-load region. The derating is designed to provide power reduction relative to the currently available power, such that, for example, a power tracking command pd=0.7 aims for a 70 % power production of the possibly extractable power from the wind. This applies for both the partial-load and the full-load region equally. If an operation at a constant power is desired, the power tracking command can be recalculated as a function of the currently available power.
The continuous description of the desired operational strategies encoded in Eq. (2) is discretized at 280 operating points for each strategy. The steady-state inputs of the wind turbine are derived for the corresponding operating points, and subsequently, a linearization analysis using the built-in functionality of FAST (Jonkman and Jonkman, 2016) is conducted to capture the rotational dynamics at each point. The linearization points are chosen to represent discrete power output values at at wind speeds covering a range of m s−1 with a denser distribution of operating points around rated wind speed. The resulting linearization points on the power coefficient surface of the considered turbine for the different operational strategies are illustrated in Fig. 1. The operating strategies share a common operational concept for a power demand of pd=1 (Fig. 1 and Eq. 2), which represents the nominal operating strategy used in wind turbine control for energy maximization. Figure 1 shows that the introduction of reduced-power modes enlarges the range of possible operating points and consequently the dynamical properties that the controller needs to cope with appropriately.
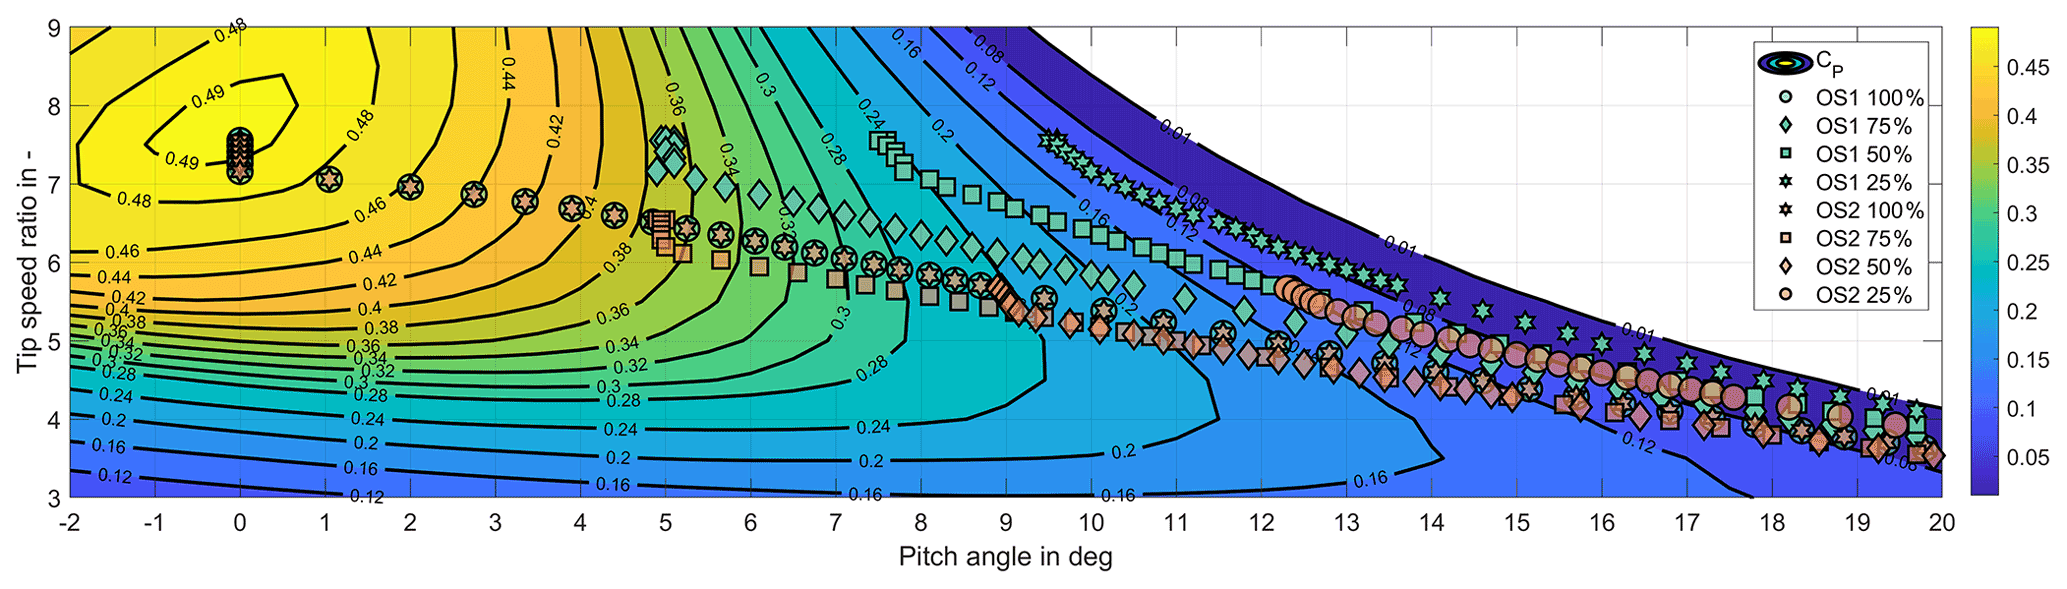
Figure 1Linearization points on the power coefficient surface for the strategies OS1 and OS2.
The identified linear model dynamics Ai, Bi, and Bdi gained by the linearization procedure are then interconnected to form an overall nonlinear description in a so-called Takagi–Sugeno structure, which is described as
where the state, input, and disturbance of the system are given by the rotational speed (x=ω), the generator torque and pitch angle (), and the wind speed (d=v), respectively. The steady-state values of the state, input, and disturbance in the linearization points are represented by x0i, u0i, and d0i, respectively. The framework is based on the definition of convex membership functions hi(z) spanning across the entire operational range, which blend the individual linear submodels in operation depending on the current power output demand, operational strategy, and wind speed; i.e., .
The control scheme is built on a disturbance observer. The observer estimates the current effective wind speed by a measurement of the rotational speed, generator torque, and pitch angle. The estimate is used to calculate the maximum currently available power. The wind speed reconstruction is achieved by augmenting the system description in Eq. (3) by an artificial effective wind speed, i.e., , where the observer dynamics characterizing is then given as
The disturbance input gains Bdi are used to construct the augmented system matrix; C=[1 0] represents the output matrix, and τ=4 s assigns an artificial first-order disturbance model to the reconstructed wind state . The wind speed estimate provided by the observer is used in the calculation of the current operating conditions influencing the membership functions in the nonlinear modeling framework; i.e., . These membership functions are then used for the scheduling of the observer dynamics in Eq. (4) and the control input of the system. The estimate determines both a feedback () and a feed-forward term () in the control input of the turbine, such that the system input is given as
To obtain the necessary feedback gains Ki and Li that jointly shape the closed-loop system behavior for the different operating points, a linear matrix inequality approach (VanAntwerp and Braatz, 2000) to control design is conducted. It embeds the feedback gain design into a convex optimization problem involving stability of the closed-loop dynamics. Using linear matrix inequality region constraints (Chilali and Gahinet, 1996), the eigenvalues characterizing the closed-loop properties of the wind turbine model dynamics within the complex plane are restricted. The region constraints are chosen to be identical for both operating strategies, effectively resulting in very similar operating behavior with respect to the disturbance rejection. A lot of classical problems from control theory can be recast into linear matrix inequality design constraints (Boyd et al., 1994; VanAntwerp and Braatz, 2000), where the Takagi–Sugeno framework represents one possible way of obtaining the necessarily involved system description. Details about the applied control scheme and its design process for wind turbines are discussed in Pöschke et al. (2020, 2022). Whereas in Pöschke et al. (2020) several degrees of freedom including tower or drivetrain dynamics are considered and actively damped, the applied controller in this work uses the rotational dynamics as the only degree of freedom and measured quantity similarly to the experimental wind tunnel validation discussed in Pöschke et al. (2022). The model-based design process can be applied to widespread linearization points determined by the control engineer's choice of operational strategy.
Whereas in Pöschke et al. (2020, 2022) OS1 is applied for the studies involving power tracking and load analysis, within this work OS2 is added. Effectively, this is achieved by introducing an additional variable as the premise in the Takagi–Sugeno framework used for the nonlinear modeling of the turbine dynamics; i.e., z2=nOS. This has no effect on the general control approach but introduces an additional dimension into the operating space coped with by the premise variables. Even though we present the two operational strategies separately to underline the comparison of resulting loading and power tracking dynamics, essentially the turbine is operated by one controller that is capable of blending and switching between the different strategies.
Application of the described control scheme to the FAST (Jonkman and Buhl, 2005) implementation of NREL's 5 MW reference turbine (Jonkman et al., 2009) allows studying the impact of the two operational strategies on the loading and the response time for changes in the power output. The pitch speed is limited to 8 in all considered scenarios. In the following two sections, the discussed operational strategies are compared from two different perspectives. First, the loading of the turbine structure in turbulent wind for some components is analyzed as this influences the possible choice of operating trajectories with regard to the overall cost of energy. Second, the response time of the power output to instantaneous changes in the power demand is compared for the two operational concepts. Due to the possibly fast dynamics needed in the range of milliseconds to hours (Machowski et al., 2008), the attainable power dynamics of wind turbines is a crucial metric for a successful contribution to grid-stabilizing services.
Essentially, the same controller is used for turbine operation in the two strategies. It is capable of blending between the operational strategies as shown in Fig. 2. It is illustrated how the operational strategy is linearly varied from OS1 at 160 s to OS2 within 15 s, which results in a reduction in the rotational speed until matching the trajectory for the operation of the turbine in OS2 only with the same wind excitation. Subsequently, the opposite change in operational strategy is conducted from 195 to 210 s. While a small delay in the reduction and increase in rotational speed due to the rotor inertia is visible, the controller is capable of altering the operational strategy online and the turbine trajectories smoothly follow the demand. In Fig. 2d the power output of the turbine is shown. The two operational strategies OS1 and OS2 result in approximately the same power production, which in this case was set to demand 70 % of the available power (or pd=0.7). When transitioning from OS1 to OS2, an increase in output power is apparent in a time range from 160 to approx. 175 s, which stems from the energy released due to the decline in rotational speed being previously stored in the turbine rotation. Consequently, the opposite effect is visible when returning to nominal rotational speed by blending from OS2 to OS1 in the time range of 195 to 210 s.
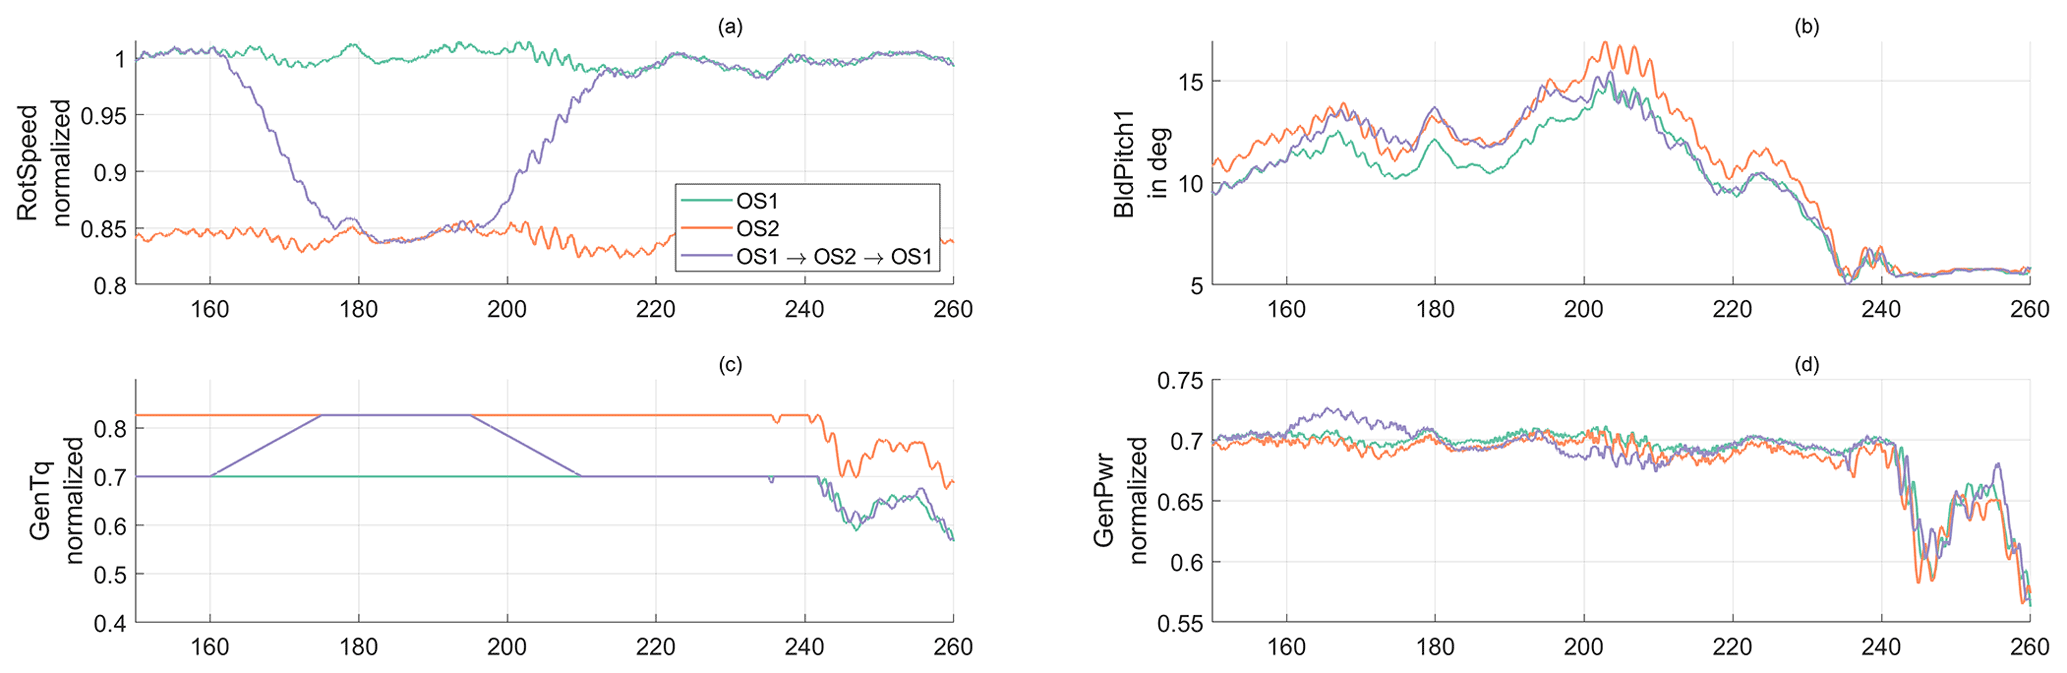
Figure 2(a) Wind turbine rotational speed, (b) blade pitch angle, (c) generator torque, and (d) turbine power output in turbulent wind for OS1 and OS2 at 70 % power production, where additionally a 15 s ramp transition at 160 s from OS1 to OS2 and back at 195 s is shown.
4.1 Loading in turbulent wind
To compare the structural loading, the turbine was simulated in a turbulent wind field for 40 min at different power set points, with an exemplary operating trajectory shown in Fig. 3 comparing OS1 to OS2. The wind time series was synthesized using TurbSim (Jonkman and Buhl, 2006) and configuring a normal turbulence model at a mean wind speed of 12 m s−1. Different constant power demand settings of are chosen to emulate varying levels of power storage that can be released into the electrical grid by a variation in the power demand (and the opposite way). This flexibility for a reaction to changes in the electrical grid comes at the expense of a reduced energy yield depending on the level of power output reduction.
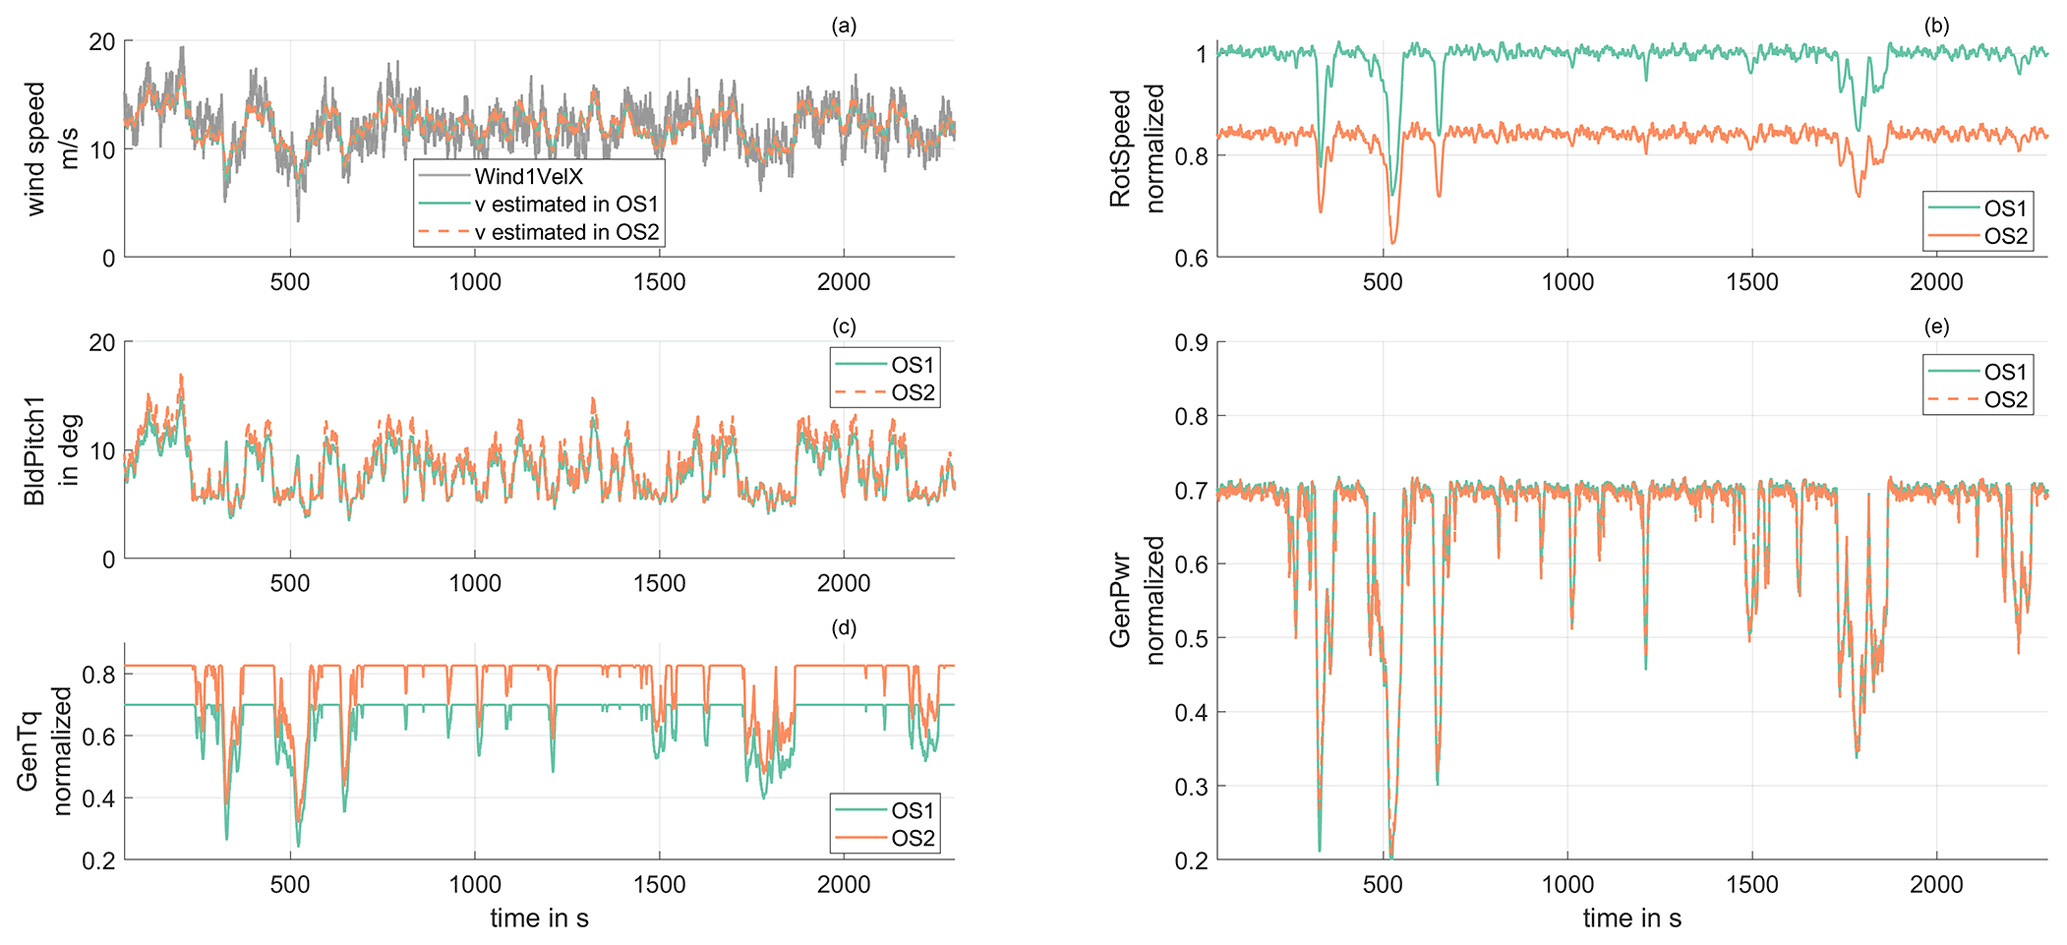
Figure 3(a) Excitation wind speed and wind estimate of the disturbance observer, (b) wind turbine rotational speed, (c) blade pitch angle, (d) generator torque, and (e) turbine power output for OS1 and OS2 at 70 % power production.
In Fig. 4, the resulting damage equivalent loads (DELs) of different turbine components are visualized. All the DELs are normalized to the result when operating the turbine in strategy OS1 at pd=1, i.e., in nominal operation aiming for maximization of the energy yield. As designed, for pd=1, the turbine behaves identically for both strategies, which is reflected by the identical loading experienced.
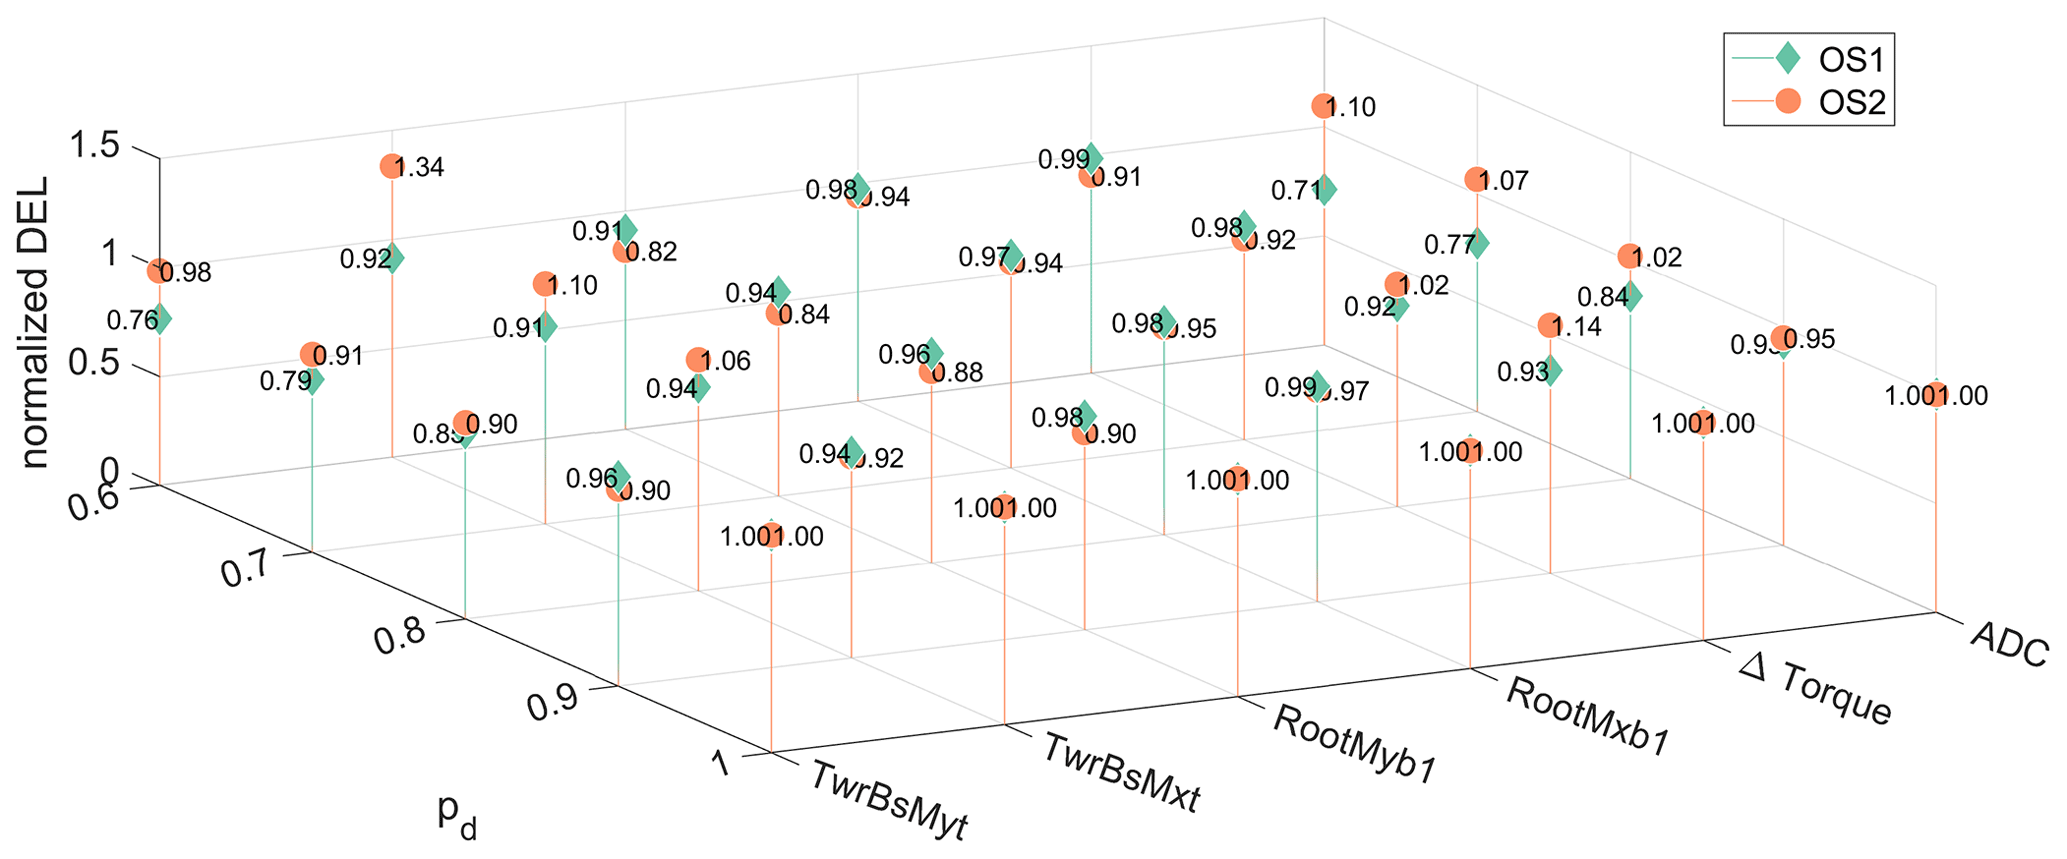
Figure 4Comparison of damage equivalent loads (DELs) for OS1 and OS2 at different constant power tracking set points , where the data are normalized to the results of pd=1 in OS1. The data are obtained from operation of the turbine in turbulent wind for 40 min with a mean wind speed of 12 m s−1, where the simulated wind turbine trajectories for pd=0.7 are shown in Fig. 3.
For a power reduction at pd=0.9, OS1 results in a greater tower loading for both tower fore–aft (TwrBsMyt) and tower side to side (TwrBsMxt) compared to OS2. Contrarily, at higher levels of power reduction, i.e., , OS1 shows smaller fatigue loading of the tower compared to OS2. The blade loading is slightly reduced in OS2 compared to OS1 as represented by the out-of-plane torque (RootMyb1) and in-plane torque (RootMxb1). Further, it is observed that the loading caused by the difference torque acting on the low-speed drivetrain shaft (Δ torque) is reduced in OS1 compared to OS2 at small power derating values (i.e., ), while OS2 shows a reduced loading compared to OS1 at higher derating. The pitch activity is greatly affected by the operational concept employed, as can be seen by the increase in the actuator duty cycle (ADC) (Riboldi, 2016), where OS1 shows a significantly smaller pitch activity compared to OS2.
4.1.1 Discussion – loading in turbulent wind
Surprisingly, the fatigue loading of the tower is not reduced in OS2 compared to OS1, despite the fewer blade–tower interactions due to the reduced rotational speed, as can be seen in Fig. 4. The simulation results suggest that the greater pitch magnitudes (see also the ADC in Fig. 4) for reacting to the varying wind speed in OS2 compared to OS1, along with the strong coupling of the tower to the pitch movement (Bossanyi, 2003), are responsible for this effect. Additionally, in OS2 the turbine operates at smaller rotational speed, and consequently, the 3P excitation of the tower due to the rotation is closer to the eigenfrequency of the tower movement. This is supported by the increasing relative tower loading with growing power reduction commands, where in OS2 the rotational speed becomes smaller, and thus an increasing loading in the tower, especially in the side-to-side movement, is visible. Opposed to the results discussed in Jeong et al. (2014), Aho et al. (2016), and Lio et al. (2018), OS2 shows increased loading of the tower structure compared to OS1. Additionally for OS1, increasing power reduction commands result in decreased loading as also found in Aho et al. (2013, 2016). The greater pitch magnitudes needed for balancing the rotational speed at the desired value are visible in the increased ADC for OS2 compared to OS1 shown in Fig. 4, which is supported by the findings in Aho et al. (2016) and Lio et al. (2018). The pitch activity decreases for greater power reduction in OS1 as also observed in Aho et al. (2013), while for OS2 the pitch activity increases with increasing power reduction commands. The blade loading is positively affected when operated at a lower rotational speed in OS2 as also reported in Aho et al. (2013, 2016), especially in the flapwise direction. The increased drivetrain loading represented by Δ torque shown in Fig. 4 in OS2 compared to OS1 especially at a small power reduction is also observed in Aho et al. (2016) but is opposed to the results presented in Jeong et al. (2014) and Lio et al. (2018).
While we have designed a basic controller that only operates based on the rotational speed and pitch angle measurement as shown in Pöschke et al. (2022), the resulting load profiles may be influenced by the introduction of additional performance shaping control architectures. To achieve this, additional degrees of freedom may be introduced into the modeling and control design process, yielding feedback loops actively shaping the closed-loop dynamics of components like the drivetrain or the tower movement, as discussed in, e.g., Bossanyi (2003) or specifically for the applied disturbance observer-based approach used here in Pöschke et al. (2020). From this perspective, the discussed results within this work constitute a fundamental confrontation of operational strategies without any further load-reducing loops. This is supported by the control approach yielding similar closed-loop disturbance rejection dynamics for both operational strategies by an identical definition of performance constraints formulated in the model-based design process, which results in the similar evolution of the power output that can be seen in Fig. 3e.
4.2 Power tracking dynamics
To provide flexible, fast, and predictable control authority to grid-stabilizing services and the control loops therein, the response characteristics to changes in the power demand are crucial. To assess the dynamics involved, the turbine is faced with instantaneous demand changes while operating in different constant wind conditions at a constant power output of pd=0.7 prior to the event. The stepwise changes in the power demand are bidirectional; i.e., increase and reduction in the power output demand at steps of Δp are simulated. The applied steps are defined as
The simulation is repeated for wind speeds of m s−1 roughly covering a range of common operating wind speeds and in conjunction with the bidirectional steps possibly reveals nonlinear effects. The resulting step responses of the turbine power for operational strategies OS1 and OS2 are depicted in Fig. 6a and b, respectively. The results therein are normalized to the demanded magnitude for all steps and power production before the event (effectively to result in comparable steps from 0 to 1 or −1).
Figure 4a shows that the power output of the turbine precisely follows the demand and is immediately adjusted to the new operating point when operating the turbine in OS1, where only the generator torque and pitch angle are varied, enforcing a constant rotational speed. This holds for both an increase and a decrease in the power demand equally.
In contrast, for OS2 the power output depends on the current operating condition and form of the demand. For a sudden decrease in the power, a settling time of approx. 4 s can be uniformly observed irrespective of the demanded magnitude and current wind speed. However, for an increase in power demand, the power output trajectory is determined by the current inflow conditions. At higher wind speeds, the power output shows similar operating trajectories and settling times as seen at a power decrease. At lower wind speeds, the settling time rises significantly and also shows a decline at the beginning of the demand step or closely afterwards as can be observed in the trajectories that have not settled to the demanded value at a time of 75 s.
The different operating strategies yield varying amounts of ultimate loading depending on the considered structural turbine component, wind speed, and magnitude of the power demand step, which is shown in Fig. 5. The greatest absolute increase in ultimate loading for all considered components is found at a wind speed of 12 m s−1, which is an information shadow due to the normalization in Fig. 5. The simulation data show that the magnitude of the power demand step dictates the additional ultimate loading experienced by the turbine as the ultimate loading is smaller for steps of . Additionally, a tendency for smaller ultimate loading for a reduction in the power output (Δpd<0) compared to the stepwise increase in power is visible. OS1 is superior compared to strategy OS2 in avoiding additional ultimate loading due to the variation in power output especially at greater wind speeds (12 and 16 m s−1). Contrarily, significant differences in ultimate loading are also found when an increase in power is demanded () at low wind speeds, where OS2 is shown to be superior to OS1.
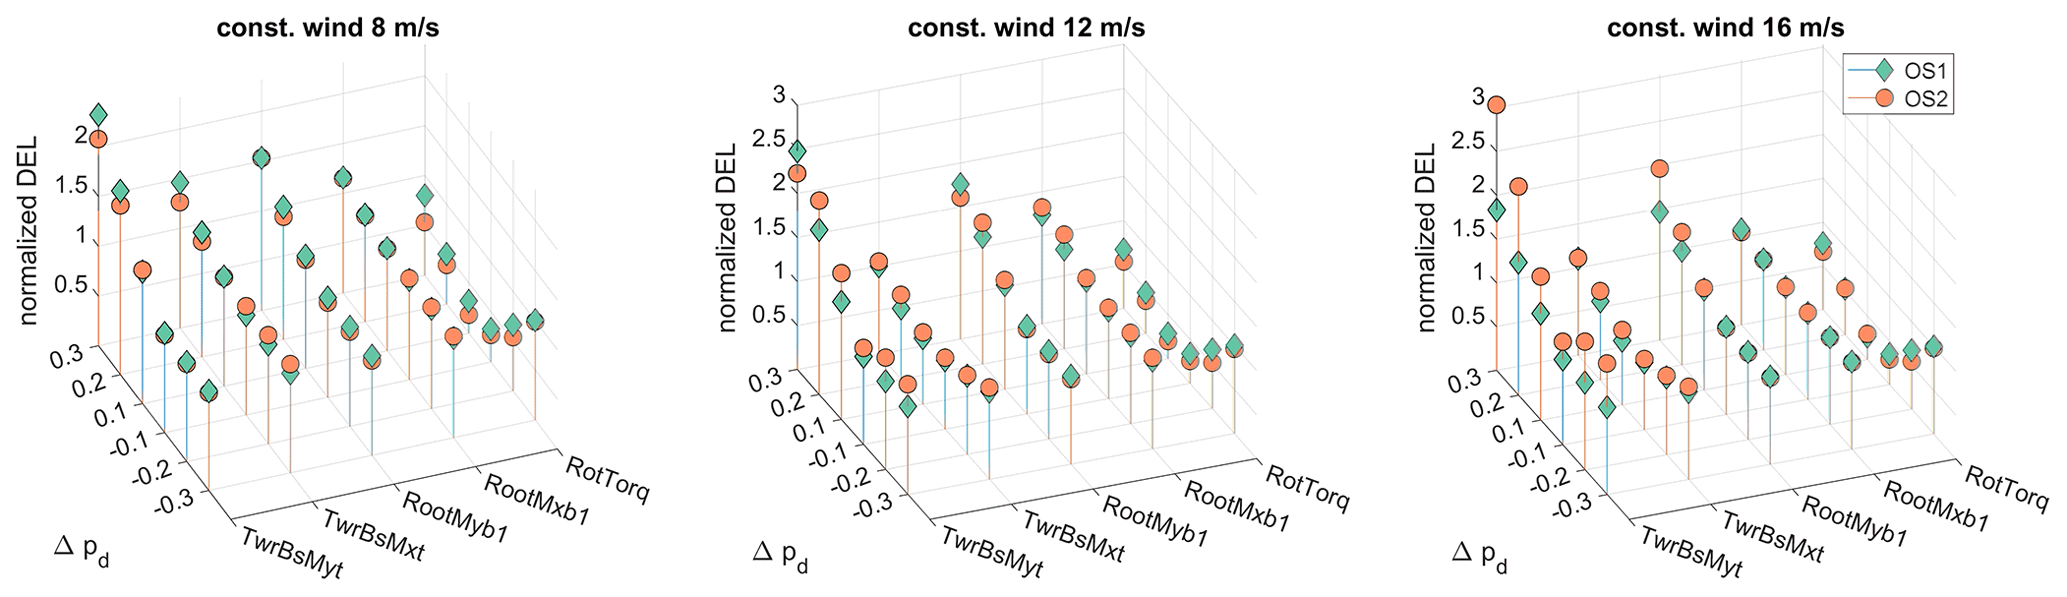
Figure 5Comparison of normalized ultimate loads for stepwise variation in power demand operated in different constant winds. The results are normalized to the ultimate load occurring for a step of in OS1 for each of the considered ultimate loads and winds.

Figure 6Normalized step response for demand steps of when operating the turbine at a power reserve with pd=0.7 in constant wind for (a) OS1 and (b) OS2. Comparison of the step response to the synthetic transfer functions GOS1(s) and GOS2(s) designed for control design and simulation studies on a power system or wind farm level.
4.2.1 Discussion and modeling – power tracking dynamics
The results reveal the dependency of the response characteristic on the operational strategy employed. For OS1, very fast responses to the step demand are possible. This aligns with Jeong et al. (2014) and Aho et al. (2016), where an increased power tracking performance is found when keeping the rotational speed constant and varying the power with the torque only. The response illustrated in Fig. 4b reveals a first-order dynamic behavior in OS1 that can be attributed to the generator torque dynamics used in the simulation model. It is observed that the first-order dynamics is present irrespective of the current wind speed, step magnitude, or direction of step. In the frequency domain, this transfer function can be given as
with timescale TOS1 governed by the generator torque loop. The transfer function GOS1(s) is found to be sufficient for describing the power demand dynamics of the wind turbine if a strategy like (or very similar to) OS1 is chosen by the turbine control engineer. The step response of the transfer function with TOS1=20 ms is shown in Fig. 6a.
If, however, acceleration and deceleration of the turbine are involved in meeting the desired power demand as defined for OS2, the attainable power dynamics depends on the current operating point and direction of the step demand as illustrated in Fig. 5c. As a result, an adequate model of the active power dynamics for this strategy depends on the current operating point and step magnitude, revealing the nonlinearities inherited in the system. From Fig. 6 it can be observed that especially an increase in power, i.e., Δpd>0, results in varying response dynamics due to the varying levels of excess power when increasing the power demand.1 Further, it can be observed that the resulting power dynamics is governed by the applied control scheme, which is the cause for the non-minimum phase behavior seen at some operating trajectories. This behavior is observed when operating the turbine in the partial-load region (i.e., in the simulated cases for a wind speed of v=8 m s−1), where the generator torque is employed to control the rotational speed. When the power command increases, the altered rotational-speed set point results in a reduction in the generator torque by the controller to allow turbine acceleration. This effect necessitates an extension of the transfer function assigned to OS1 to account for this kind of non-minimum phase behavior that usually is also an important aspect in the modeling of hydro-power for grid studies and control design (Kishor et al., 2007; Björk et al., 2021).
Following the conception of OS2, the response characteristic is governed by two processes consisting of generator torque actuation in parallel to a variation in the rotational speed. The rotation is determined by a combination of excess power for (de-)acceleration and the wind turbine inertia. Following this reasoning, a simple transfer function for OS2 consisting of two parallel paths described as
is shown to provide a reasonable match with the simulated turbine step response; see Fig. 6b. As the dynamics vary with the wind speed, the transfer function displaying the power dynamics in OS2 needs re-parametrization depending on the current operating point, i.e., the parameters are functions of the wind speed k/a/b/c/dI/II=f(v). The parameters of the “upper” and “lower” bound (for the considered scenarios in Fig. 6b) in GOS2(s) are displayed in Table 1. While the number of 10 parameters might seem complex to parametrize, the two configurations follow a physically interpretable rationale as follows.
Table 1Values of the transfer functions used for upper- and lower-bound parametrization in OS2.
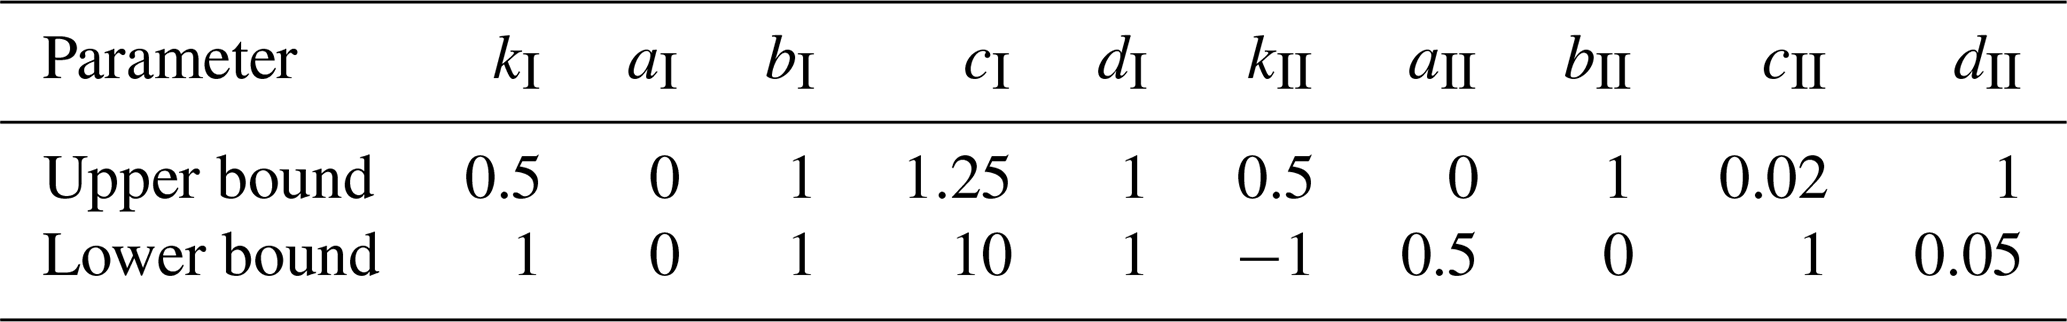
The upper-bound parametrization corresponds to the highest simulated wind speed of v=16 m s−1 and consists of two parallel first-order functions; i.e., . The two parallel processes consist of torque and rotational-speed set-point variation, and therefore, cI and cII describe the dynamics of closed-loop torque and inertia-based rotational-speed evolution, respectively. As the concept in OS2 relies on an equal set-point sharing among torque and rotational speed (established by in Eq. 2), setting kI/II to 0.5 is an intuitive choice. On the other hand, in the lower-bound parametrization corresponding to partial-load operation at v=8 m s−1, the discussed controller interaction from the rotational speed to the torque actuation plays a dominant role and decays when the desired rotational speed is reached. Therefore, the two parallel process are (I) the torque-actuated rotation as a first-order transfer function and (II) a negative derivative transfer function . The influence of GII(s) vanishes as s→0 to account for the non-minimum phase behavior stemming from the control interaction. Note that cI represents the inertia in combination with the available power in both the upper and the lower bound but due to the varying power levels substantially depends on the current wind speed; see the parameters in Table 1.
From consideration of the ultimate loading, it was found that OS1 by remaining at constant rotational speeds tends to be superior to OS2 in avoiding additional ultimate loading of the components. As concluded for fatigue loading in turbulent wind, the lower pitch magnitudes needed in OS1 compared to OS2 cause smaller excitation of the turbine structure and consequently result in lower or similar ultimate loading when instantaneously adjusting the current power demand. At the lower wind speed (8 m s−1) and a power increase of , OS2 significantly outperformed OS1 in ultimate loading, especially for the tower. Those scenarios, however, showed unsatisfactory response dynamics to the power changes in OS2, as discussed for the power output trajectories in Fig. 6b. The comparatively low power that is solely available for an acceleration of the turbine has positive effects on the ultimate loading experienced by the turbine in these cases.
Within this contribution, it is discussed how different operational strategies for wind turbines can be integrated into a model-based control design by choice of the linearization points. The influence on the attainable power dynamics for supporting the electrical grid and the resulting loading are analyzed for synthetically designed scenarios. The presented simulation studies reveal the dependency of the power dynamics on the operational strategy. It is found that OS1 (keeping the rotational speed constant) provides significantly faster control authority in the power dynamics compared to OS2, where a deceleration or acceleration of the turbine's rotor is performed. This result is supported by the findings in Jeong et al. (2014) and Aho et al. (2016). While for OS1 the fast generator dynamics governs, the response in OS2 is mainly determined by the turbine's inertia. This underlines the additional flexibility in following a power demand in favor of the electrical grid when using OS1, where the amount of injected power can be controlled by the generator torque at a fast scale.
While faster power dynamics in OS1 could be expected, the results from a loading perspective are surprising, which holds for both the fatigue loading during turbulent wind and the ultimate loading at power demand steps. Except for the lower blade out-of-plane loading in OS2, it was found that OS1 in the considered turbulent wind scenario and turbine setup showed smaller fatigue loading of the tower despite the greater rotational speed. OS1 also tends to decrease the ultimate loads when following a power demand step compared to OS2. In general, it is found that a reduced-power-output operating point results in reduced turbine loading.
While the presented results suggest an application of OS1 from both considered perspectives, i.e., loading and power dynamics, the considered scenarios within this work are limited, and a variety of different aspects can determine the choice of the operational strategy applied to the turbine (also, e.g., bird fatalities – Baerwald et al., 2009 – or noise emissions – Leloudas et al., 2007 – decrease with lower rotational speed). Additionally, as shown in Zhu et al. (2017) and Lio et al. (2018), operating the turbine at lower rotational speeds decreases the thrust coefficient of the turbine and thus possibly mitigates the wake-induced effects for downstream turbines in OS2 compared to OS1. For the application of dynamic induction control, Munters and Meyers (2018) and Frederik et al. (2020) concluded that the Strouhal number can be used to obtain the variation frequency, and a value of 0.25 is identified as favorable. For the considered turbine here this results in operating point changes with a time period of 62 s. As some operating trajectories in OS2 showed settling times above 15 s, the impact on the effectiveness of the dynamic induction approach has to be evaluated. For OS1, however, the fast power tracking on the timescale of the generator dynamics indicates sufficient response characteristics for many applications. In this study, it is demonstrated how a dedicated control design allows for an online variation in the operational strategy, such that wind turbines can flexibly adjust the operational strategy subject to varying external demands.
For studying stability of the power system with a high share of decentralized generation, the participating power units and their relevant dynamical behavior must be considered and combined with models of the electrical grid. Therefore, modeling approaches are needed capable of portraying relevant dynamical properties while satisfying complexity constraints to be suitable for the large-scale integration in both advanced control design on a power system level and the required simulations studies. The results obtained from the simulation studies suggest that the model for portraying the relevant dynamics depends on the chosen operating strategy. When aiming for constant rotational speed in a reduced-power mode, a first-order transfer function governed by the closed-loop generator dynamics is seen to provide a reasonable model description. If a simultaneous rotational-speed variation is assigned in the control scheme, the inertial response of the turbine rotor in conjunction with the available excess power needs to be considered in the description. Due to the nonlinearities in the energy conversion process and the control interaction, the model for this operational strategy necessarily comprises varying parameters depending on the considered operating point.
For inquiries about the source code and data, please reach out to the corresponding author.
FP and HS conceptualized the study and operating trajectories. FP conducted the control design and simulation studies. FP and HS analyzed the results, drew conclusions, and created the manuscript.
The contact author has declared that neither of the authors has any competing interests.
Publisher's note: Copernicus Publications remains neutral with regard to jurisdictional claims in published maps and institutional affiliations.
This research has been supported by Horizon 2020 (grant no. 883985 (project POSYTYF – POwering SYstem flexibiliTY in the Future through RES); see https://posytyf-h2020.eu/ (last access: 21 July 2022)).
This paper was edited by Katherine Dykes and reviewed by three anonymous referees.
Abouzeid, S. I., Guo, Y., and Zhang, H.-C.: Dynamic control strategy for the participation of variable speed wind turbine generators in primary frequency regulation, J. Renew. Sustain. Ener., 11, 013304, https://doi.org/10.1063/1.5064846, 2019. a
Aho, J., Pao, L., and Fleming, P.: An Active Power Control System for Wind Turbines Capable of Primary and Secondary Frequency Control for Supporting Grid Reliability, in: 51st AIAA Aerospace Sciences Meeting including the New Horizons Forum and Aerospace Exposition, Grapevine (Dallas/Ft. Worth Region), Texas, USA, 7–10 January 2013, 0456, https://doi.org/10.2514/6.2013-456, 2013. a, b, c, d, e, f, g
Aho, J., Fleming, P., and Pao, L. Y.: Active power control of wind turbines for ancillary services: A comparison of pitch and torque control methodologies, in: 2016 American Control Conference (ACC), 6–8 July 2016, Boston, MA, USA, 1407–1412, https://doi.org/10.1109/ACC.2016.7525114, 2016. a, b, c, d, e, f, g, h, i, j, k
Baerwald, E. F., Edworthy, J., Holder, M., and Barclay, R. M. R.: A large-scale mitigation experiment to reduce bat fatalities at wind energy facilities, J. Wildlife Manage., 73, 1077–1081, https://doi.org/10.2193/2008-233, 2009. a
Björk, J., Johansson, K. H., and Dörfler, F.: “Dynamic Virtual Power Plant Design for Fast Frequency Reserves: Coordinating Hydro and Wind”, in IEEE Transactions on Control of Network Systems, 1–12, https://doi.org/10.1109/TCNS.2022.3181553, 2022. a, b
Boersma, S., Doekemeijer, B., Gebraad, P., Fleming, P., Annoni, J., Scholbrock, A., Frederik, J., and van Wingerden, J.-W.: A tutorial on control-oriented modeling and control of wind farms, in: 2017 American Control Conference (ACC), 24–26 May 2017, Seattle, WA, USA, 1–18, https://doi.org/10.23919/ACC.2017.7962923, 2017. a, b
Bossanyi, E. A.: Wind turbine control for load reduction, Wind Energy, 6, 229–244, https://doi.org/10.1002/we.95, 2003. a, b
Boyd, S., Ghaoui, L. E., Feron, E., and Balakrishnan, V.: Linear Matrix Inequalities in System and Control Theory, Society for Industrial and Applied Mathematics, https://doi.org/10.1137/1.9781611970777, 1994. a
Campagnolo, F., Petrović, V., Bottasso, C. L., and Croce, A.: Wind tunnel testing of wake control strategies, in: 2016 American Control Conference (ACC), 6–8 July 2016, Boston, MA, USA, 513–518, https://doi.org/10.1109/ACC.2016.7524965, 2016. a
Chilali, M. and Gahinet, P.: H∞ design with pole placement constraints: an LMI approach, IEEE T. Automat. Contr., 41, 358–367, https://doi.org/10.1109/9.486637, 1996. a
Deshpande, A. S. and Peters, R. R.: Wind turbine controller design considerations for improved wind farm level curtailment tracking, in: 2012 IEEE Power and Energy Society General Meeting, 22–26 July 2012, San Diego, CA, USA, 1–6, https://doi.org/10.1109/PESGM.2012.6343975, 2012. a, b
Frederik, J. A., Weber, R., Cacciola, S., Campagnolo, F., Croce, A., Bottasso, C., and van Wingerden, J.-W.: Periodic dynamic induction control of wind farms: proving the potential in simulations and wind tunnel experiments, Wind Energ. Sci., 5, 245–257, https://doi.org/10.5194/wes-5-245-2020, 2020. a, b, c
Galinos, C., Urbán, A. M., and Lio, W. H.: Optimised de-rated wind turbine response and loading through extended controller gain-scheduling, J. Phys. Conf. Ser., 1222, 012020, https://doi.org/10.1088/1742-6596/1222/1/012020, 2019. a
Goit, J. P. and Meyers, J.: Optimal control of energy extraction in wind-farm boundary layers, J. Fluid Mech., 768, 5–50, https://doi.org/10.1017/jfm.2015.70, 2015. a
Inthamoussou, F. A., De Battista, H., and Mantz, R. J.: LPV-based active power control of wind turbines covering the complete wind speed range, Renew. Energ., 99, 996–1007, https://doi.org/10.1016/j.renene.2016.07.064, 2016. a
Jain, A., Sakamuri, J. N., and Cutululis, N. A.: Grid-forming control strategies for black start by offshore wind power plants, Wind Energ. Sci., 5, 1297–1313, https://doi.org/10.5194/wes-5-1297-2020, 2020. a, b, c
Jeong, Y., Johnson, K., and Fleming, P.: Comparison and testing of power reserve control strategies for grid-connected wind turbines, Wind Energy, 17, 343–358, https://doi.org/10.1002/we.1578, 2014. a, b, c, d, e, f, g, h
Jonkman, J. M. and Buhl, M. L.: FAST Users Guide, Tech. rep., National Renewable Energy Laboratory, NREL/TP-500-38230, https://doi.org/10.2172/15020796, 2005. a
Jonkman, J. M. and Buhl, M. L.: TurbSim User's Guide, Tech. rep., National Renewable Energy Laboratory, NREL/TP-500-38230, NREL/TP-500-39797, https://doi.org/10.2172/891594, 2006. a
Jonkman, J. M. and Jonkman, B. J.: FAST modularization framework for wind turbine simulation: full-system linearization, J. Phys. Conf. Ser., 753, 082010, https://doi.org/10.1088/1742-6596/753/8/082010, 2016. a, b
Jonkman, J. M., Butterfield, S., Musial, W., and Scott, G.: Definition of a 5 MW Reference Wind Turbine for Offshore System Development, Tech. rep., National Renewable Energy Laboratory, NREL/TP-500-38060, https://doi.org/10.2172/947422, 2009. a
Kanev, S., Savenije, F., and Engels, W.: Active wake control: An approach to optimize the lifetime operation of wind farms, Wind Energy, 21, 488–501, https://doi.org/10.1002/we.2173, 2018. a
Kazda, J., Merz, K., Tande, J. O., and Cutululis, N. A.: Mitigating turbine mechanical loads using engineering model predictive wind farm controller, J. Phys. Conf. Ser., 1104, https://doi.org/10.1088/1742-6596/1104/1/012036, 2018. a
Kishor, N., Saini, R., and Singh, S.: A review on hydropower plant models and control, Renew. Sust. Energ. Rev., 11, 776–796, https://doi.org/10.1016/j.rser.2005.06.003, 2007. a
Leloudas, G., Zhu, W. J., Sørensen, J. N., Shen, W. Z., and Hjort, S.: Prediction and Reduction of Noise from a 2.3 MW Wind Turbine, J. Phys. Conf. Ser., 75, 012083, https://doi.org/10.1088/1742-6596/75/1/012083, 2007. a
Lio, W. H., Mirzaei, M., and Larsen, G. C.: On wind turbine down-regulation control strategies and rotor speed set-point, J. Phys. Conf. Ser., 1037, 032040, https://doi.org/10.1088/1742-6596/1037/3/032040, 2018. a, b, c, d, e, f, g, h, i
Machowski, J., Bialek, J., and Bumby, J.: Power System Dynamics: Stability and Control, John Wiley & Sons, Ltd, ISBN 9780470725580, 2008. a
Margaris, I. D., Papathanassiou, S. A., Hatziargyriou, N. D., Hansen, A. D., and Sorensen, P.: Frequency Control in Autonomous Power Systems With High Wind Power Penetration, IEEE T. Sustain. Energ., 3, 189–199, https://doi.org/10.1109/TSTE.2011.2174660, 2012. a, b, c
Mirzaei, M., Soltani, M., Poulsen, N. K., and Niemann, H. H.: Model based active power control of a wind turbine, in: 2014 American Control Conference, 4–6 June 2014, Portland, OR, USA, 5037–5042, https://doi.org/10.1109/ACC.2014.6859055, 2014. a, b, c, d, e
Munters, W. and Meyers, J.: Towards practical dynamic induction control of wind farms: analysis of optimally controlled wind-farm boundary layers and sinusoidal induction control of first-row turbines, Wind Energ. Sci., 3, 409–425, https://doi.org/10.5194/wes-3-409-2018, 2018. a, b
Petrović, V. and Bottasso, C. L.: Wind turbine envelope protection control over the full wind speed range, Renew. Energ., 111, 836–848, https://doi.org/10.1016/j.renene.2017.04.021, 2017. a
Pöschke, F., Gauterin, E., Kühn, M., Fortmann, J., and Schulte, H.: Load mitigation and power tracking capability for wind turbines using linear matrix inequality-based control design, Wind Energy, 23, 1792–1809, https://doi.org/10.1002/we.2516, 2020. a, b, c, d, e, f
Pöschke, F., Petrović, V., Berger, F., Neuhaus, L., Hölling, M., Kühn, M., and Schulte, H.: Model-based wind turbine control design with power tracking capability: A wind-tunnel validation, Control Eng. Pract., 120, 105014, https://doi.org/10.1016/j.conengprac.2021.105014, 2022. a, b, c, d
Rebello, E., Watson, D., and Rodgers, M.: Ancillary services from wind turbines: automatic generation control (AGC) from a single Type 4 turbine, Wind Energ. Sci., 5, 225–236, https://doi.org/10.5194/wes-5-225-2020, 2020. a
Riboldi, C. E.: On the optimal tuning of individual pitch control for horizontal-axis wind turbines, Wind Engineering, 40, 398–416, https://doi.org/10.1177/0309524X16651545, 2016. a
Shan, M., Shan, W., Welck, F., and Duckwitz, D.: Design and laboratory test of black-start control mode for wind turbines, Wind Energy, 23, 763–778, https://doi.org/10.1002/we.2457, 2020. a
Vali, M., Petrović, V., Steinfeld, G., Y. Pao, L., and Kühn, M.: An active power control approach for wake-induced load alleviation in a fully developed wind farm boundary layer, Wind Energ. Sci., 4, 139–161, https://doi.org/10.5194/wes-4-139-2019, 2019. a
Van de Vyver, J., De Kooning, J. D. M., Meersman, B., Vandevelde, L., and Vandoorn, T. L.: Droop Control as an Alternative Inertial Response Strategy for the Synthetic Inertia on Wind Turbines, IEEE T. Power Syst., 31, 1129–1138, https://doi.org/10.1109/TPWRS.2015.2417758, 2016. a
van der Hoek, D., Kanev, S., Allin, J., Bieniek, D., and Mittelmeier, N.: Effects of axial induction control on wind farm energy production – A field test, Renew. Energ., 140, 994–1003, https://doi.org/10.1016/j.renene.2019.03.117, 2019. a
van der Hoek, D., Frederik, J., Huang, M., Scarano, F., Simao Ferreira, C., and van Wingerden, J.-W.: Experimental analysis of the effect of dynamic induction control on a wind turbine wake, Wind Energ. Sci., 7, 1305–1320, https://doi.org/10.5194/wes-7-1305-2022, 2022. a, b, c, d
van Kuik, G. A. M., Peinke, J., Nijssen, R., Lekou, D., Mann, J., Sørensen, J. N., Ferreira, C., van Wingerden, J. W., Schlipf, D., Gebraad, P., Polinder, H., Abrahamsen, A., van Bussel, G. J. W., Sørensen, J. D., Tavner, P., Bottasso, C. L., Muskulus, M., Matha, D., Lindeboom, H. J., Degraer, S., Kramer, O., Lehnhoff, S., Sonnenschein, M., Sørensen, P. E., Künneke, R. W., Morthorst, P. E., and Skytte, K.: Long-term research challenges in wind energy – a research agenda by the European Academy of Wind Energy, Wind Energ. Sci., 1, 1–39, https://doi.org/10.5194/wes-1-1-2016, 2016. a
VanAntwerp, J. G. and Braatz, R. D.: A tutorial on linear and bilinear matrix inequalities, J. Process Contr., 10, 363–385, https://doi.org/10.1016/S0959-1524(99)00056-6, 2000. a, b
Xin, H., Gan, D., Li, N., Li, H., and Dai, C.: Virtual power plant-based distributed control strategy for multiple distributed generators, IET Control Theory A., 7, 90–98, https://doi.org/10.1049/iet-cta.2012.0141, 2013. a
Zhu, J., Ma, K., Soltani, M., Hajizadeh, A., and Chen, Z.: Comparison of loads for wind turbine down-regulation strategies, in: 2017 11th Asian Control Conference (ASCC), 17–20 December 2017, Gold Coast, QLD, Australia, 2784–2789, https://doi.org/10.1109/ASCC.2017.8287618, 2017. a, b, c, d, e, f
As the command is normalized to the currently available power, the same magnitude of Δpd results in different power levels usable for an acceleration of the turbine depending on the wind speed.