the Creative Commons Attribution 4.0 License.
the Creative Commons Attribution 4.0 License.
 | 09 Aug 2022
Computational-fluid-dynamics analysis of a Darrieus vertical-axis wind turbine installation on the rooftop of buildings under turbulent-inflow conditions
Pradip Zamre
Thorsten Lutz
The behaviour of a rooftop-mounted generic H-rotor Darrieus vertical-axis wind turbine (H-VAWT) is investigated numerically in realistic urban terrain. The interaction of the atmospheric boundary layer with the different buildings, topography, and vegetation present in the urban environment leads to the highly turbulent-inflow conditions with continuously changing inclination and direction. Consequently, all these factors can influence the performance of a VAWT significantly. In order to simulate a small H-VAWT at rooftop locations in the urban terrain under turbulent-inflow conditions, a computational approach is developed. First, the flow field in the terrain is initialized and computed with inflow turbulence. Later, the mesh of wind turbine is superimposed on the mesh of the terrain at two distinct locations and different heights for further computation in the turbulent flow field. The behaviour of the H-VAWT is complex due to the 3D unsteady aerodynamics resulting from continuously changing the angle of attack, blade–wake interaction, and dynamic stall. To get more insight into the behaviour of a rooftop-mounted H-VAWT in turbulent flow, high-fidelity delayed detached-eddy simulations (DDESs) are performed at different rooftop positions and the results compared against the behaviour under uniform-inflow conditions in the absence of inflow turbulence. It is found that the performance of a wind turbine is significantly increased near the rooftop positions. The skewed flow at the rooftop location increases the complexity. However, this effect contributes positively to increasing the performance of H-VAWT wind turbines.
- Article
(10547 KB) - Full-text XML
- BibTeX
- EndNote


Wind energy is available in abundance, but it is not uniformly distributed. The growth of wind energy is mainly related to large-scale horizontal-axis wind turbines (HAWTs) and wind farms located onshore and offshore. Though it is known for its potential, the available offshore sites are reducing because of expansions of wind farms. Considerable losses are associated with energy transportation from sources to places where it is consumed (Gasch and Twele, 2011; Tosatto and Chatzivasileiadis, 2021). Distributed and decentralized wind power is associated with the application of the small, medium, and lower end of large-scale wind turbine technologies (up to 2 MW) in remote deployment or small-scale wind farms. Distributed and decentralized power generation emerges as complementary infrastructure to the conventional power systems that envision electricity generation close to the consumption site, e.g. urban and suburban environment, lowering the capital investments in transmission lines. The concept of urban wind energy is not new. In the past, there have already been efforts to investigate the feasibility of harnessing the urban wind by installing small wind turbines on the roof of existing buildings or as stand-alone deployments in an urban area (Balduzzi et al., 2012; Mithraratne, 2009; van Wijk, 2011; Toja-Silva et al., 2013). Wind turbines can also be integrated with buildings, designed aerodynamically to accelerate the wind (KC et al., 2019; Karadag and Yuksek, 2020). It is a well-known fact that the mean wind speed in urban environments is lower than in open areas or rural areas. However, some locations tend to be windier, such as rooftops, building edges, or a passage between two buildings. The interaction of the atmospheric boundary layer with the rough terrain and obstacle of different shapes and permeability present along the flow path leads to complex flow conditions in the built environment with lower velocities, high turbulence, and continuously changing direction. These conditions can severely influence the behaviour and dynamic loads of the small wind turbine.
1.1 Vertical-axis wind turbines (VAWTs) in turbulent urban flow field
In general, the research areas of urban wind energy and small wind turbines overlap each other. In the wind industry, wind turbines can be classified into two categories, namely horizontal- and vertical-axis wind turbines, based on their axis of rotation. The horizontal-axis wind turbine concept has been proven mature, successful, and economical on a large scale, but it is wind-direction-dependent. Hence, it needs a yaw mechanism. In the built environment, the flow inclinations negatively affect the performance of a small HAWT (Bianchi et al., 2013). In this regard, the VAWT concept has several advantages in the urban environment. In skewed flow, the performance of the H-Darrieus VAWT rotor increases above the non-skewed flow (Mertens et al., 2003). It has the omnidirectional wind catching capability. Thus no yaw mechanism is needed, which reduces mechanical complexity. VAWTs typically have fewer moving parts, and a generator can be installed at ground level. It could lead to lower maintenance costs and higher availability. The wake recovery of the VAWT is faster than that of the HAWT (Kinzel et al., 2012), which allows a dense cluster of wind turbines in the wind farm, increasing the power density (Dabiri, 2011). Also, the VAWT concept has potentially lower noise emissions than the HAWT of the same power class (Kern et al., 2019). However, the VAWT concept has some drawbacks. Its performance is lower than that of the HAWT. The underlying physics behind the operation of the VAWT is more complex than the HAWT. The inherent unsteadiness is caused by the continuously changing angle of attack and relative velocity during the revolution.
The influence of turbulence on the behaviour of the VAWT is one of the significant research areas considering the applications of small VAWTs in urban environments. One approach to investigate the influence of the turbulence on the VAWT is based upon correlating the performance and on-site wind measurements. Previously, Möllerström et al. (2016) studied a 200 kW Darrieus VAWT in an open field. Their study concluded that turbulence positively impacts energy extraction, and the effect is more evident at higher tip speed ratios. Also, the performance of the wind turbine and optimal tip speed ratio (λ) increase with turbulence intensity (TI), allowing optimization of control strategies to capture more high-energy wind gusts. A study by Bertényi et al. (2012) also found that turbulence has no adverse effect on the performance of VAWTs using “gust tracking”. Pagnini et al. (2015) compared the performance of a small commercial VAWT with a HAWT of the same rated capacity of 20 kW installed at the Port of Savona. It is concluded that both wind turbines are sensitive to turbulence and not suitable for installation in complex areas where turbulence levels are often high. Kooiman and Tullis (2010) studied the effects of wind velocity and direction fluctuations on the energy production of rooftop-installed VAWTs in urban environments. The output power varied with wind velocity fluctuations but was roughly independent of the wind direction changes. The authors also compared data from urban-environment testing with the earlier work of Bravo et al. (2007) on the same wind turbine in a low-turbulence wind tunnel. It was found that the performance of the wind turbine degraded marginally at TI <15 % compared to the smooth flow benchmark at TI <2 %. In all these discussed studies, there has been no consistency about the influence of the turbulence on the behaviour of a VAWT. Also, replicating the flow characteristics from the urban environment in the wind tunnel poses serious challenges. Most of the wind tunnel facilities are designed for aerospace research with very low background turbulence intensity and in an urban environment large scales dominate the turbulence intensity, which can easily exceed 10 %. The size of eddies differs over a broader range of integral length scales. These factors limit the scope of addressing the topic of turbulence in the wind tunnel.
The advancement in computing capacities and infrastructure allows us to use high-fidelity computational fluid dynamics (CFD) methods to investigate complex flow behaviour. A broader range of approaches have been used to explore different aerodynamics phenomena of the VAWT. One of the earliest studies to model the influence of inflow turbulence on the VAWT was carried out by Brahimi and Paraschivoiu (1995). The effect of turbulence intensity on the performance of an offshore VAWT was investigated by Siddiqui et al. (2015), who found that performance deteriorates by almost 23 % to 42 % as turbulence intensity increases from 5 % to 25 %. Rezaeiha et al. (2018) studied the impact of different operational parameters on an H-Darrieus rotor along with turbulence intensity. The authors found that with an increase in turbulence level the dynamic stall at a low tip speed ratio is delayed, and the power coefficient increases. However, at the optimal tip speed ratio, the turbulence has a relatively marginal influence. Also, the turbulence reduces the impact of the shaft wake on the blade forces in downwind passage. All these studies primarily focused on the influence of turbulence on the performance of the VAWT under controlled conditions but not under realistic conditions ordinarily present in the urban environment. Siddiqui et al. (2021) analysed the effect of turbulence and ground clearance on the performance of a rooftop VAWT using three-dimensional Reynolds-averaged Navier–Stokes (RANS) simulations. Contrary to the study of Mertens et al. (2003), it was found that the performance of a VAWT enhanced at height, offering less ground shearing effect. Also, with increasing turbulence intensity, a drop in performance is observed. To the best of the authors' knowledge, there have been no high-fidelity delayed detached-eddy simulation (DDES) or large-eddy simulation (LES) studies of a rooftop-mounted H-Darrieus rotor available in realistic urban terrain and under turbulent-inflow conditions.
1.2 Scope and objectives
This work aims to investigate the aerodynamic performance of a rooftop-mounted H-Darrieus rotor vertical-axis wind turbine in a realistic urban environment under turbulent-inflow conditions considering the topography, different buildings, and large vegetation area. A large area is considered for the investigation to mimic the development of a realistic urban boundary layer. A generic reference H-Darrieus rotor is scaled up based on the geometrical parameter for the present work. As a basis for comparison, the scaled-up variant is analysed under the uniform-flow conditions. With the existing high-fidelity process chain, the characteristics of the H-Darrieus rotor can be analysed at different heights over the rooftops of buildings under resolved turbulent conditions. Variations in height are aimed at investigating wind turbine performance at different turbulence levels and inclinations. The power coefficients and normal and tangential loads are compared with the reference case at uniform inflow.
2.1 CFD solver
The FLOWer is a compressible, block-structured RANS solver developed by the German Aerospace Center (DLR) (Rossow et al., 2006). At the Institute of Aerodynamics and Gas Dynamics (IAG; University of Stuttgart), FLOWer is continuously developed to incorporate new features and to improve its performance. The overlapping grid technique CHIMERA enables the assembly of independent grids of each component by embedding them into a background mesh (Benek et al., 1985). Furthermore, the solver is extended with the functionality of higher-order finite-difference weighted essentially non-oscillatory (WENO) scheme (Kowarsch et al., 2013) and different detached-eddy simulation (DES) models (Weihing et al., 2018). Also, it has been extended with vegetation modelling capabilities (Letzgus et al., 2018). The FLOWer has proven capabilities for wind turbine and helicopter simulations in several projects.
2.2 Generation of inflow turbulence
The inflow turbulence is generated using the in-house code PROFGEN, which is adopted from the work of Mann (1998). This model is based on the von Karman isotropic spectrum ϕ(κ) and uses the rapid distortion theory to estimate the effect of shear. Three input parameters are required: length scale l0, stretching factor Γ, and energy dissipation . Here, l0 and determine the magnitude and the distribution of energy in the spectral domain, respectively. Γ controls the level of shear and anisotropy.
The fluctuating components of atmospheric turbulence u′ are transformed into a volume force term fs and are applied to a transverse plane downstream from the inlet. It is defined as force per unit volume applied to accelerate the mean velocity field from to and, as per Troldborg et al. (2014), is given by
Here and are the magnitude of the mean and the fluctuating velocity with index n, respectively; Δx is the grid spacing normal to the transverse plane.
2.3 Vegetation modelling
The forest blocks are modelled as a porous medium. The drag caused by the vegetation is added to the momentum and energy equations via the volume force source term. It is based on the approach of Shaw and Schumann (1992). The drag depends on the local foliage density a(z). It is possible to model the forest heterogeneously, considering local foliage density and height values for different parts of the vegetated area. The drag source term is given by
where ρ, cd, , and u are density, the drag coefficient, local magnitude of velocity, and velocity vector, respectively. The leaf area index (LAI) over the height is defined as
A lower value of LAI represents sparse vegetation, while a higher value of LAI represents dense vegetation.
2.4 Computational set-up
2.4.1 The H-Darrieus turbine and its scaling
The examined wind turbine is based on a generic fixed-pitched, two-bladed H-rotor VAWT designed by Li et al. (2016). It has a diameter of 2 m, a blade height of 1.2 m, a blade chord length of 0.265 m, fixed pitch of 6∘, and NACA0021 airfoil section. It has been investigated experimentally in the wind tunnel as well as in the field by Li et al. (2016). The blade cross-section area is constant over the complete blade length. The central shaft has a diameter of 0.216 m. For rooftop application in the present study, it is scaled up by a factor of 3.5, keeping the solidity constant. The solidity (σ) is calculated as follows:
where n is the number of blades, c is the blade chord length, and D is the diameter of a VAWT, respectively.

The scaled version has a rotor diameter of 7 m, a blade height of 4.2 m, a blade chord length of 0.9275 m, and a central shaft diameter of 0.756 m. Dimensions for the original and the scaled-up versions are given in Table 1.

Figure 1Aerial view of Morgenstelle campus (© Google Earth 2020) and wind rose from synthetic wind statistics (©Landesanstalt für Umwelt Baden-Württemberg 2021).
2.4.2 Terrain and wind direction
For the investigation, the “Morgenstelle” campus of the University of Tübingen from southern Germany is selected, as depicted in Fig. 1. The synthetic wind atlas data presented in Fig. 1 show that the south-west is the main wind direction, with densely forested hills lying in the upstream region of the built environment. There are four to five high-rise buildings with heights of 40 m and higher.
2.4.3 CFD model
The wind turbine at the original scale is numerically investigated and validated using the FLOWer flow solver at the IAG by Dessoky et al. (2019). The results showed good agreement with experiments. In the present study, the computational set-up including time steps is consistent with Dessoky et al. (2019). As described in Sect. 2.4.1, the computation grids are also scaled with the same scaling factor applied to the wind turbine. The blades and shaft grids have a fully resolved boundary layer (y+⩽1) with 32 cell layers. A shaft is considered in the simulation with a height being equal to the blade span. Blades are meshed using the commercial mesh generation applications Pointwise and Gridgen. Based on the convergence study conducted for different grids of the original wind turbine using FLOWer, the selected blade mesh is composed of 336 cells in the chordwise direction and 48 cells in the spanwise direction. The CHIMERA intersection area is defined near the outer periphery of the rotating zone to assemble the wind turbine in the background grid. No changes have been made in the wind turbine grid throughout the study.
The computational approach is discussed in Sect. 2.5. For the investigations in uniform inflow, the background grid is created by using the in-house automated tool. The background grid is of Cartesian type and has dimensions of m in the x, y, and z direction, respectively. The grid has hanging nodes enabling different levels of refinements. However, the background grid used for the uniform-flow condition is not shown in this study. The near-wake region has a grid refinement size of 8.625 % of the chord shown in Fig. 3. No inflow turbulence is applied. The background grid specific to the uniform-inflow investigations is not relevant to the urban-terrain investigations.

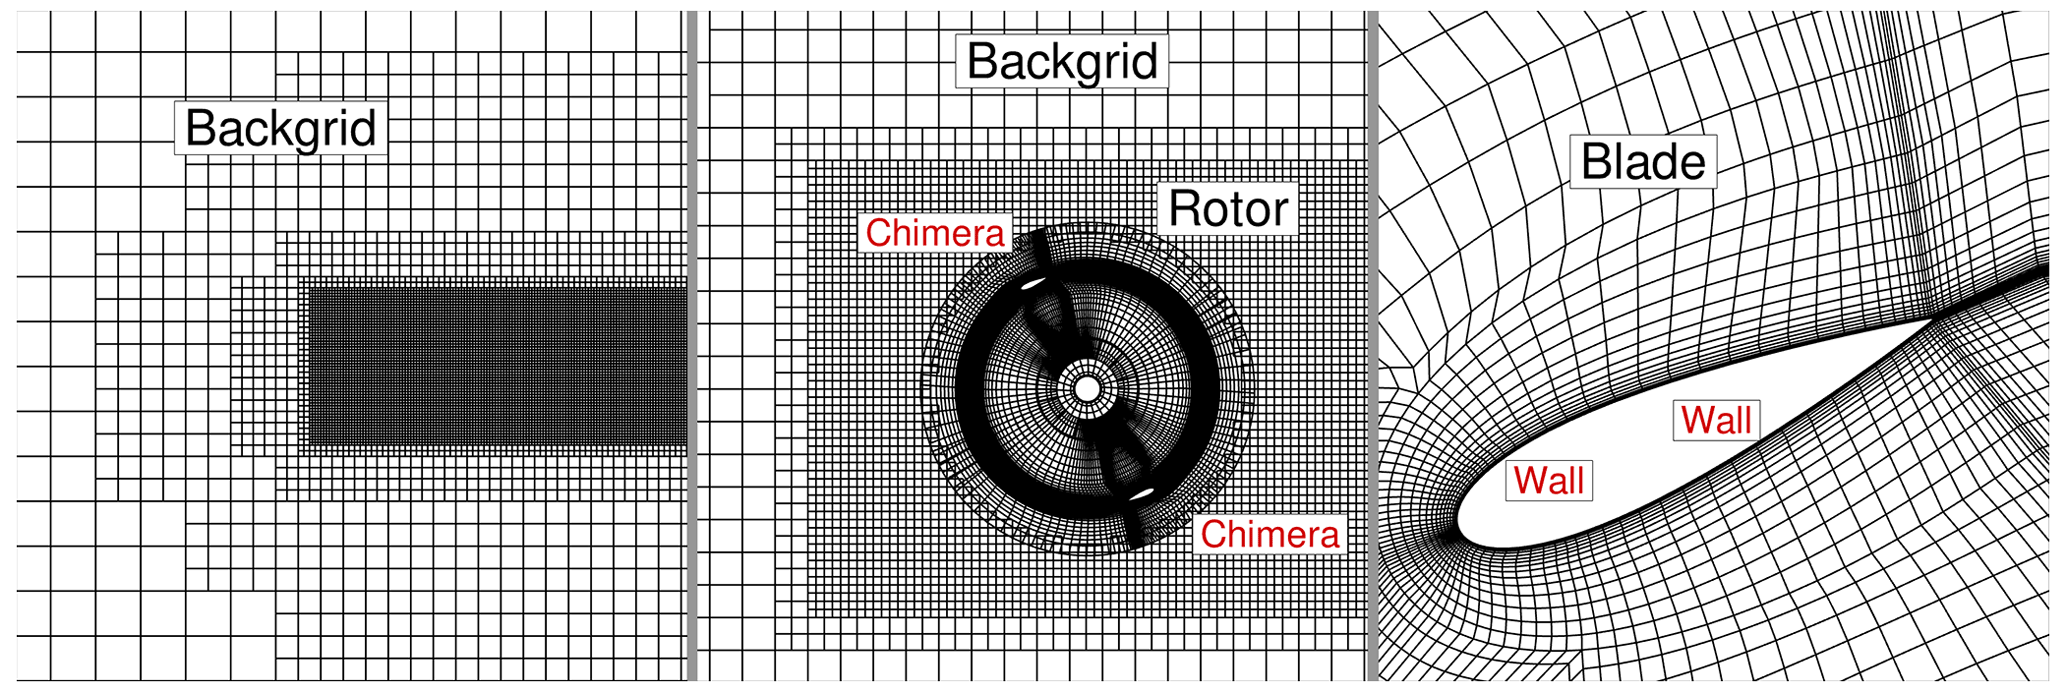
Figure 3Computational grid of the H-VAWT for the uniform-inflow study. Boundary conditions are shown in red-coloured text. (Not to scale, and every fourth cell of the mesh is shown).

In the case of urban-terrain simulations, computation grids for the buildings are created using Pointwise and Gridgen. Different building structures, terrain, forested blocks, and the assembly of the computation grids are shown in Fig. 2. The Cartesian background grid of the terrain has the smallest cell size of 1 m in the region of interest, transiting to 8 m resolution in the remaining domain by the usage of hanging nodes. In order to resolve the inflow turbulence, a channel-like region from inlet to outlet is meshed with a resolution of 1 m, which covers all considered built environments along with the forest and topographical features. It results in 105 million cells in the background mesh. The boundary layer for the terrain and building meshes is resolved with 64 layers, which results in y+⩽2. The extent of the background mesh is m in the x,y, and z direction, respectively. The chosen values of LAIs for forest blocks vary from 1.8 to 2.0, corresponding to the winter season. For the overall investigation of the wind turbines in urban terrain, a complete set-up consists of background mesh, two rotors, shafts, wake refinement regions, and remaining built structures along with vegetation. Figure 4 shows the rooftop-mounted H-VAWTs on top of buildings A and B. It has approximately 153 million cells and 19 000 blocks.
2.4.4 Boundary conditions and solver set-up
In the case of uniform inflow with a wind velocity of 8 m s−1, far-field boundary conditions are defined for all sides of the computational domain. No-slip boundary conditions have been introduced for the surfaces of all components.
For the investigation in the urban terrain, a generic log law profile based on the New European Wind Atlas is defined via a Dirichlet boundary condition at the inlet. At the start of the simulation, the whole computational domain is initialized with the wind profile. The lateral sides, topside, and outlet are realized as far-field boundary conditions with zero-order extrapolation. The ground and the surfaces of the rotors and the built environment are defined as no-slip walls. Turbulence intensity of 10 % and a length scale of 50 m are used as input parameters to PROFGEN in order to generate inflow turbulence as per the Kaimal spectrum. Turbulence is introduced by momentum source terms on the transverse plane at 96.5 m downstream from the inlet and approximately 450 m upstream from the built environment under consideration.
For the present study, DDESs are performed employing a dual time-stepping scheme for temporal discretization. The Menter shear stress transport (SST) model is used for turbulence modelling (Menter, 1994). A second-order scheme with the Jameson–Schmidt–Turkel (JST) artificial dissipation term (Jameson et al., 1981) is used for spatial discretization in the boundary layer. The fifth-order WENO scheme is applied to the background mesh to ensure less numerical dissipation and reconstruction of fluxes and more accurate propagation of vortical, turbulent structures.
2.5 Computational approach
In the absence of the experimental or field measurements for the scaled-up VAWT, the performance under uniform-inflow conditions without inflow turbulence is considered a basis for comparison with realistic conditions. However, experimental results are available for the original unscaled VAWT in Li et al. (2016). Ferreira et al. (2007) studied a 2D VAWT numerically and experimentally. The authors showed that detached-eddy simulations (DESs) reasonably predict the generation and shedding of vorticity. It also exhibits acceptable sensitivity to spatial and temporal grid refinement. It implies that scale-resolving DES simulations can be used where validation data are limited or nonexistent. Therefore, the scaled-up VAWT is investigated by applying a high-fidelity approach at the reference condition of uniform inflow of 8 m s−1 for different operating points in the first part of the present study. The power coefficient vs. tip speed ratio (CP−λ) curve serves as a basis for selecting the operating point and comparing the behaviour of the wind turbine in realistic urban terrain.

Figure 5Computational approach for the investigation of VAWTs in urban terrain under turbulent-inflow conditions.
The simulations of VAWTs in urban terrain are divided into two sets with different purposes. In the first set of simulations, VAWTs are not present. The injected turbulence is allowed to develop and propagate through the domain. Once the turbulent flow field is well developed within the domain, the complete field solution is saved. As shown in Fig. 5, this field solution serves as a starting point for the second set of simulations. After this instance, the earlier simulation is continued, and the averaging of the flow variables is started in order to get mean wind profile, turbulence intensity, and skew angles. As per recommended practices for the deployment of the wind turbines in the built environment (Baring-Gould et al., 2017), for the rotors more than 2 m diameter, the wind turbine should be positioned in such a way that it receives an acceptable level of wind speeds and turbulence intensity. Based on the flow separation, mean wind speed, and turbulence intensity, positions of wind turbines are chosen over the rooftop of building A and B for a second set of simulations. The details are discussed in Sect. 3.2. At these two locations, three different heights, 10, 12, and 20 m, are selected for VAWT investigation. The rationale behind selecting the 20 m height is to compare the performance of the H-VAWT at a relatively distant position from the rooftop with the other two positions, which are near the rooftop. It is expected that the distant position from the rooftop will be less influenced by the geometry of the buildings.
From the saved field solution of the first set of simulations, a second set of simulations are conducted. The meshes of wind turbines and wake refinement regions are introduced to an existing urban-terrain solution and computational set-up at desired locations by interpolation as shown in Fig. 5. The wind turbine meshes are initialized at a reference flow velocity and simulated further for a selected operating point. A similar procedure is repeated for the remaining cases. With this approach, significant computation time is saved, and it also increases the pace of the simulation. Details are discussed in Sect. 2.6. The urban terrain without wind turbines can be simulated with a larger time step as there are no moving parts. However, in the case of VAWT simulations the time steps are smaller than the terrain-only simulation. Based on the mean wind speed at a corresponding height and selected operating point, the rotational speed is calculated. It is kept constant throughout the simulations. Active pitch control or dynamic changes in rotational speed depending on the fluctuations in the incoming wind are not considered. It is expected that the wind turbine will not run efficiently at the selected tip speed ratio most of the time by keeping the rotational speed constant in the turbulent flow field. However, it is important to note that the fluctuations in the wind speed occur over a very short time span. It would have been practically very difficult to adjust the tip speed ratio for every second or revolution during simulations. Therefore, for simplicity the tip speed ratio and rotational speed are assumed to be constant over the short time period considered in the evaluation of the turbine performance in turbulent inflow. A similar assumption can be found in studies of Li et al. (2016), Balduzzi et al. (2020), and Hohman et al. (2018) as well. Though the turbulent inflow possesses higher energy content than uniform inflow, the energy is extracted at lower efficiency as the consequence of the optimal tip speed ratio is not maintained in turbulent inflow. Therefore, the moment and forces are averaged over 30 revolutions. This results in the maximum value of the power of the turbine at the selected tip speed ratio and fixed rotational speed.
To sum up, three different parts with three different but interdependent objectives are included in the present study. In the first part, a scaled-up VAWT is investigated under uniform-flow conditions. In the second part, a turbulent flow field in the urban terrain is analysed, while in the third part, wind turbines are investigated in urban terrain under turbulent-inflow conditions.
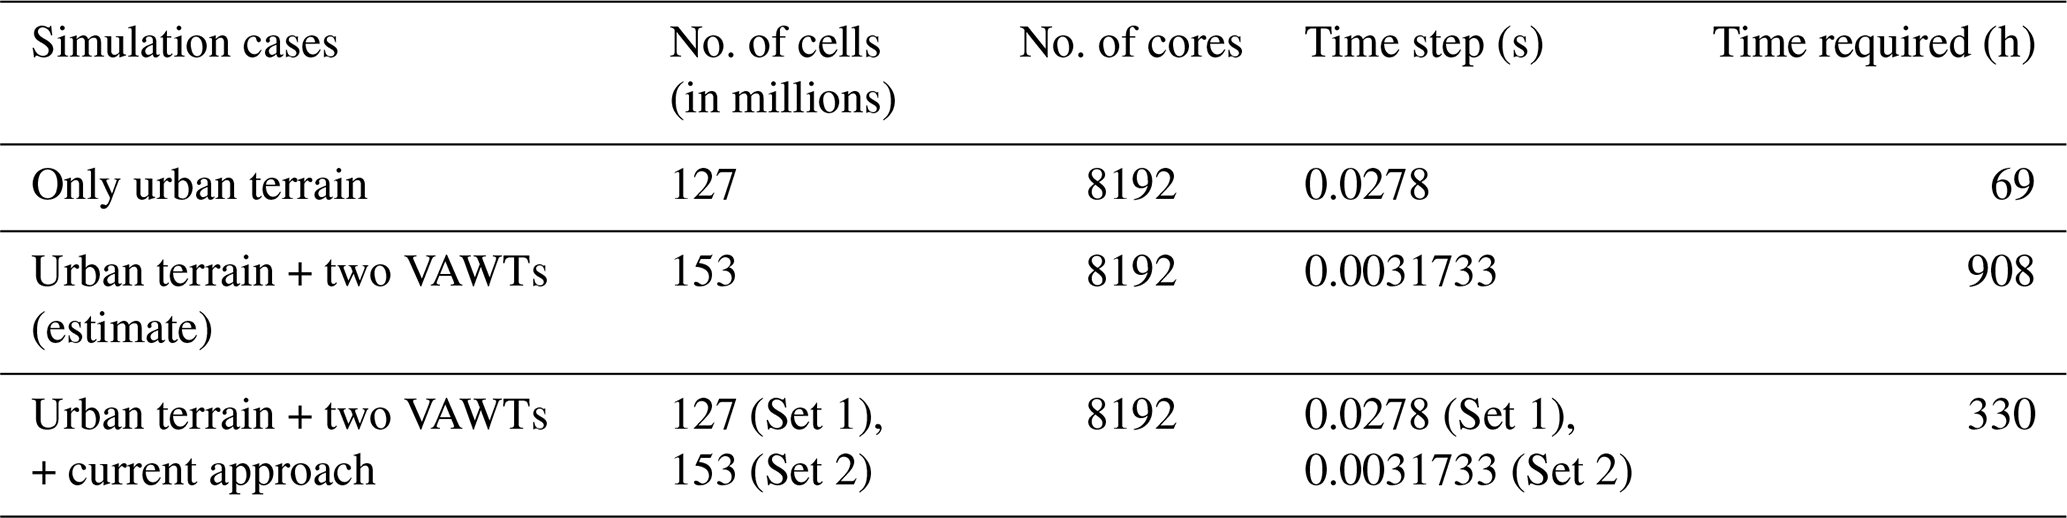
2.6 Computation time
As discussed in Sect. 2.5, there are three parts in the present study. Out of these three parts, it is obvious that due to the terrain the second and third part need significant computation time. Table 2 provides information about computation time needed for different approaches. The second part focuses on only terrain simulations under turbulent inflow. The set-up has 127 million cells, and for the complete simulation, with 8192 cores, approximately 3 d of computation time is needed. If the wind turbines are simulated from the start instead of introducing them in an already-developed turbulent flow field, it would have taken approximately 38 d of computation time with 8192 cores. As the behaviour of the wind turbine is investigated at three different heights, the procedure needs to be repeated. It will result in a huge computation time requirement. With the current approach, a wind turbine simulation in urban terrain needs approximately 14 d of computation time. The limiting factor is the small time step required for the wind turbine simulations. With a larger time step, other problems related to convergence and numerical stability arise. For the terrain-only simulation, the time step is larger than the wind turbine simulation. As discussed in Sect. 2.5, the current approach with an overlapping grid technique and interpolation provides flexibility to introduce a wind turbine in the fully developed turbulent flow field.
2.7 Evaluation
The scaled-up variant of the H-Darrieus rotor is evaluated under reference conditions of uniform inflow at 8 m s−1 for different tip speed ratios. After four revolutions, the forces and moments converge, and the trend shows a periodic nature. Revolutions after this point are considered for evaluation. The moment is averaged to calculate the power coefficient for the CP−λ curve under reference conditions.
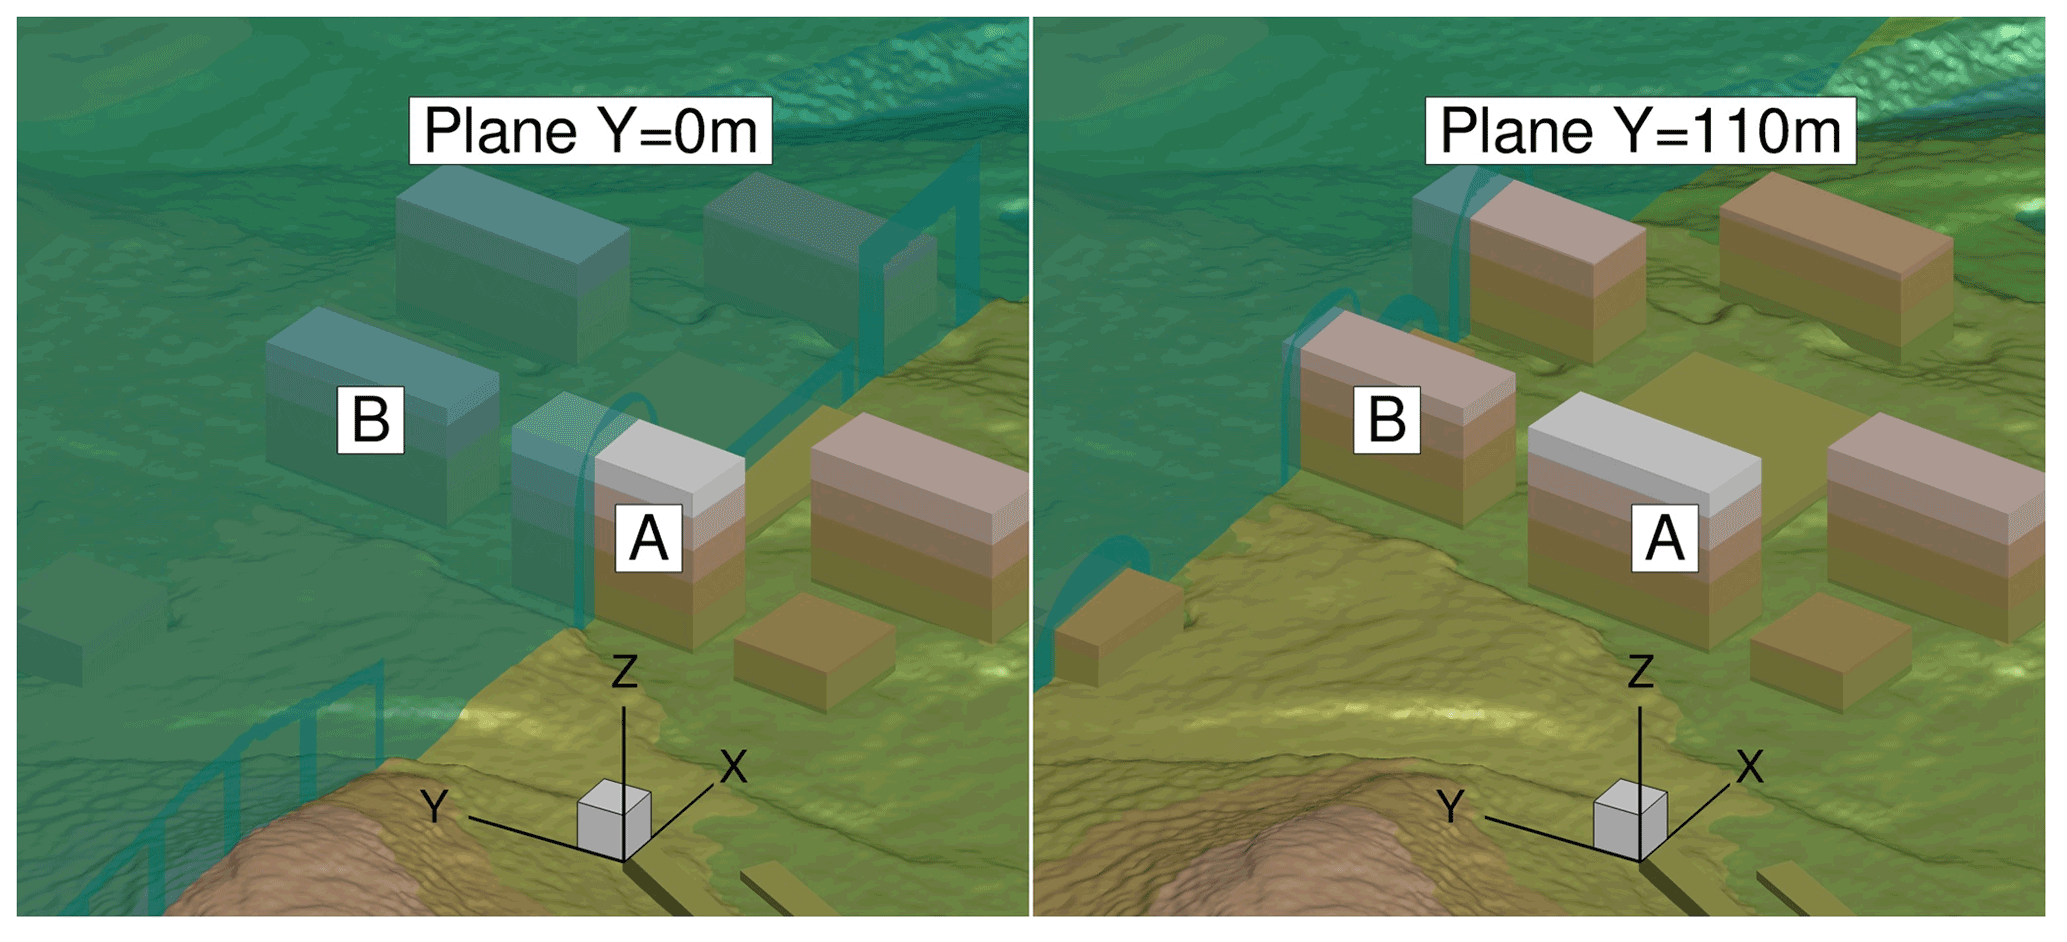
In urban-terrain simulations, the flow field is averaged after turbulence is propagated through the complete domain. It is needed to evaluate the flow conditions at the rooftop. As shown in Fig. 6, the post-processing plane Y=0 m passes through building A, while Y=110 m passes through building B. Based on the averaged velocity profiles and turbulence intensity, two different locations are identified at the rooftop of building A and B. At these locations, the wind turbine is placed at three distinct heights of 10, 12, and 20 m from the rooftop to investigate the influence of the skewed flow over the buildings.
For H-VAWT investigations in urban terrain, the wind turbines are simulated for a total of 42 revolutions after initialization. The first 12 revolutions are not considered for the post-processing as some time is needed to develop the wake of the wind turbines. The last 30 revolutions are averaged to calculate moment and tangential and normal forces along with the respective standard deviations.
The results are presented in three different subsections. First Sect. 3.1 investigates scaled H-VAWT under uniform conditions without any terrain and inflow turbulence. Second Sect. 3.2 presents the flow field analysis of the urban terrain under inflow turbulence without wind turbines. Subsequently, the behaviour of the rooftop-mounted H-VAWTs under realistic conditions at different heights is discussed in Sect. 3.3.
3.1 Wind turbine simulations under uniform-inflow conditions

Figure 7Normalized moment and tangential and normal forces of a single blade at different tip speed ratios under reference conditions with uniform inflow of 8 m s−1 without terrain.
This section compares the power coefficient, blade forces, and moment of the scaled-up wind turbine at different tip speed ratios under uniform-inflow conditions with a wind speed of 8 m s−1. After the near-wake development, a periodic nature is observed for the variables over the revolutions. The scaled-up wind turbine is investigated at tip speed ratios of 1.2, 1.8, 2.0, 2.75, 3.0, and 4.0. The rotational speed of the wind turbine is adjusted as per tip speed ratio, keeping the free-stream velocity constant. Based on chord and tangential velocity, the Reynolds number Rec ranges from 6.096×10⁵ to 20.319×10⁵.
Figure 7 shows the variations in normalized moment (MZ) and tangential (Ft) and normal force (Fn) of a single blade for the different tip speed ratios during the last revolution. In the absence of inflow turbulence, the unsteady effects on the loads and moments come from phenomena like continuous change in angle of attack, blade–vortex interaction, and blade wake interaction, which are intrinsic in the operation of a VAWT. A more or less sinusoidal nature can be seen in the moment curves in the first half of the revolution for all the operating points in the left panel of Fig. 7. This part contributes most to the moment generation. In the beginning of the revolution from azimuth angles of 0 to 30∘, an increasing λ results in lower moments. For all operating points from azimuth angles of 75 to 180∘, the moment increases gradually; reaches a maximum around 90 to 100∘; and then decreases gradually, reaching zero or negative values at 180∘. The tangential force shown in the middle panel of Fig. 7, which is responsible for the production of the moment, shows an excellent correlation with the moment in the left panel. In the case of λ=1.2, the moment and tangential force decrease rapidly from the maximum compared to other λ values. This is attributed to the dynamic stall, which is an inherent effect of the operation of a VAWT at low tip speed ratios. Similar behaviour was observed for the original unscaled H-VAWT, which has been studied by Bangga et al. (2017) for the dynamic stall phenomenon. Also, Rezaeiha et al. (2018) performed 2.5D simulations for a two-bladed H-VAWT with a NACA0012 airfoil to investigate the influence of the operational parameters. The authors found similar behaviour at lower λ while studying the influence of the tip speed ratio on the performance. A negligible difference is observed in peak moment and tangential force for λ=1.8 and 2.0.
In the second half of the revolution from azimuth angles of 180 to 360∘, moments and tangential forces show an irregular trend. The local wind speed experienced by a blade for these azimuth positions is slowed down due to the energy extraction in the first half revolutions. Fluctuations are observed in moment and tangential force at azimuth positions from 240 to 330∘ as blade wake interaction has a dominant effect in second half revolution. The influence of the shaft can be seen as a sudden drop in tangential force and jump in normal force at an azimuth position of 270∘. For λ=1.8 and 2.0, the wind turbine generates a relatively higher moment in the second half revolution compared to other tip speed ratios. However, the magnitude is far lower than the first half of the revolution. With increasing λ, the nature of the curve flattens in the second half of the revolutions, implying very small moment generation and decrease in the influence of the wake caused by the shaft. At higher λ, an increase in rotational speed results in larger effective blockage to the flow. It creates a large deficit in the streamwise velocity in the wake, which also affects the wake generated from the shaft.
The right panel of Fig. 7 shows variations in normal forces. As the blade moves further from an azimuth of 0∘, the normal force increases, gradually reaching a maximum around an azimuth of 100–105∘, and then it decreases. After an azimuth position of 180∘, the direction of the force is reverted. Unlike the moment and tangential force, the normal force increases for λ>1.8. The effect of the shaft can be seen at an azimuth position of 270∘.
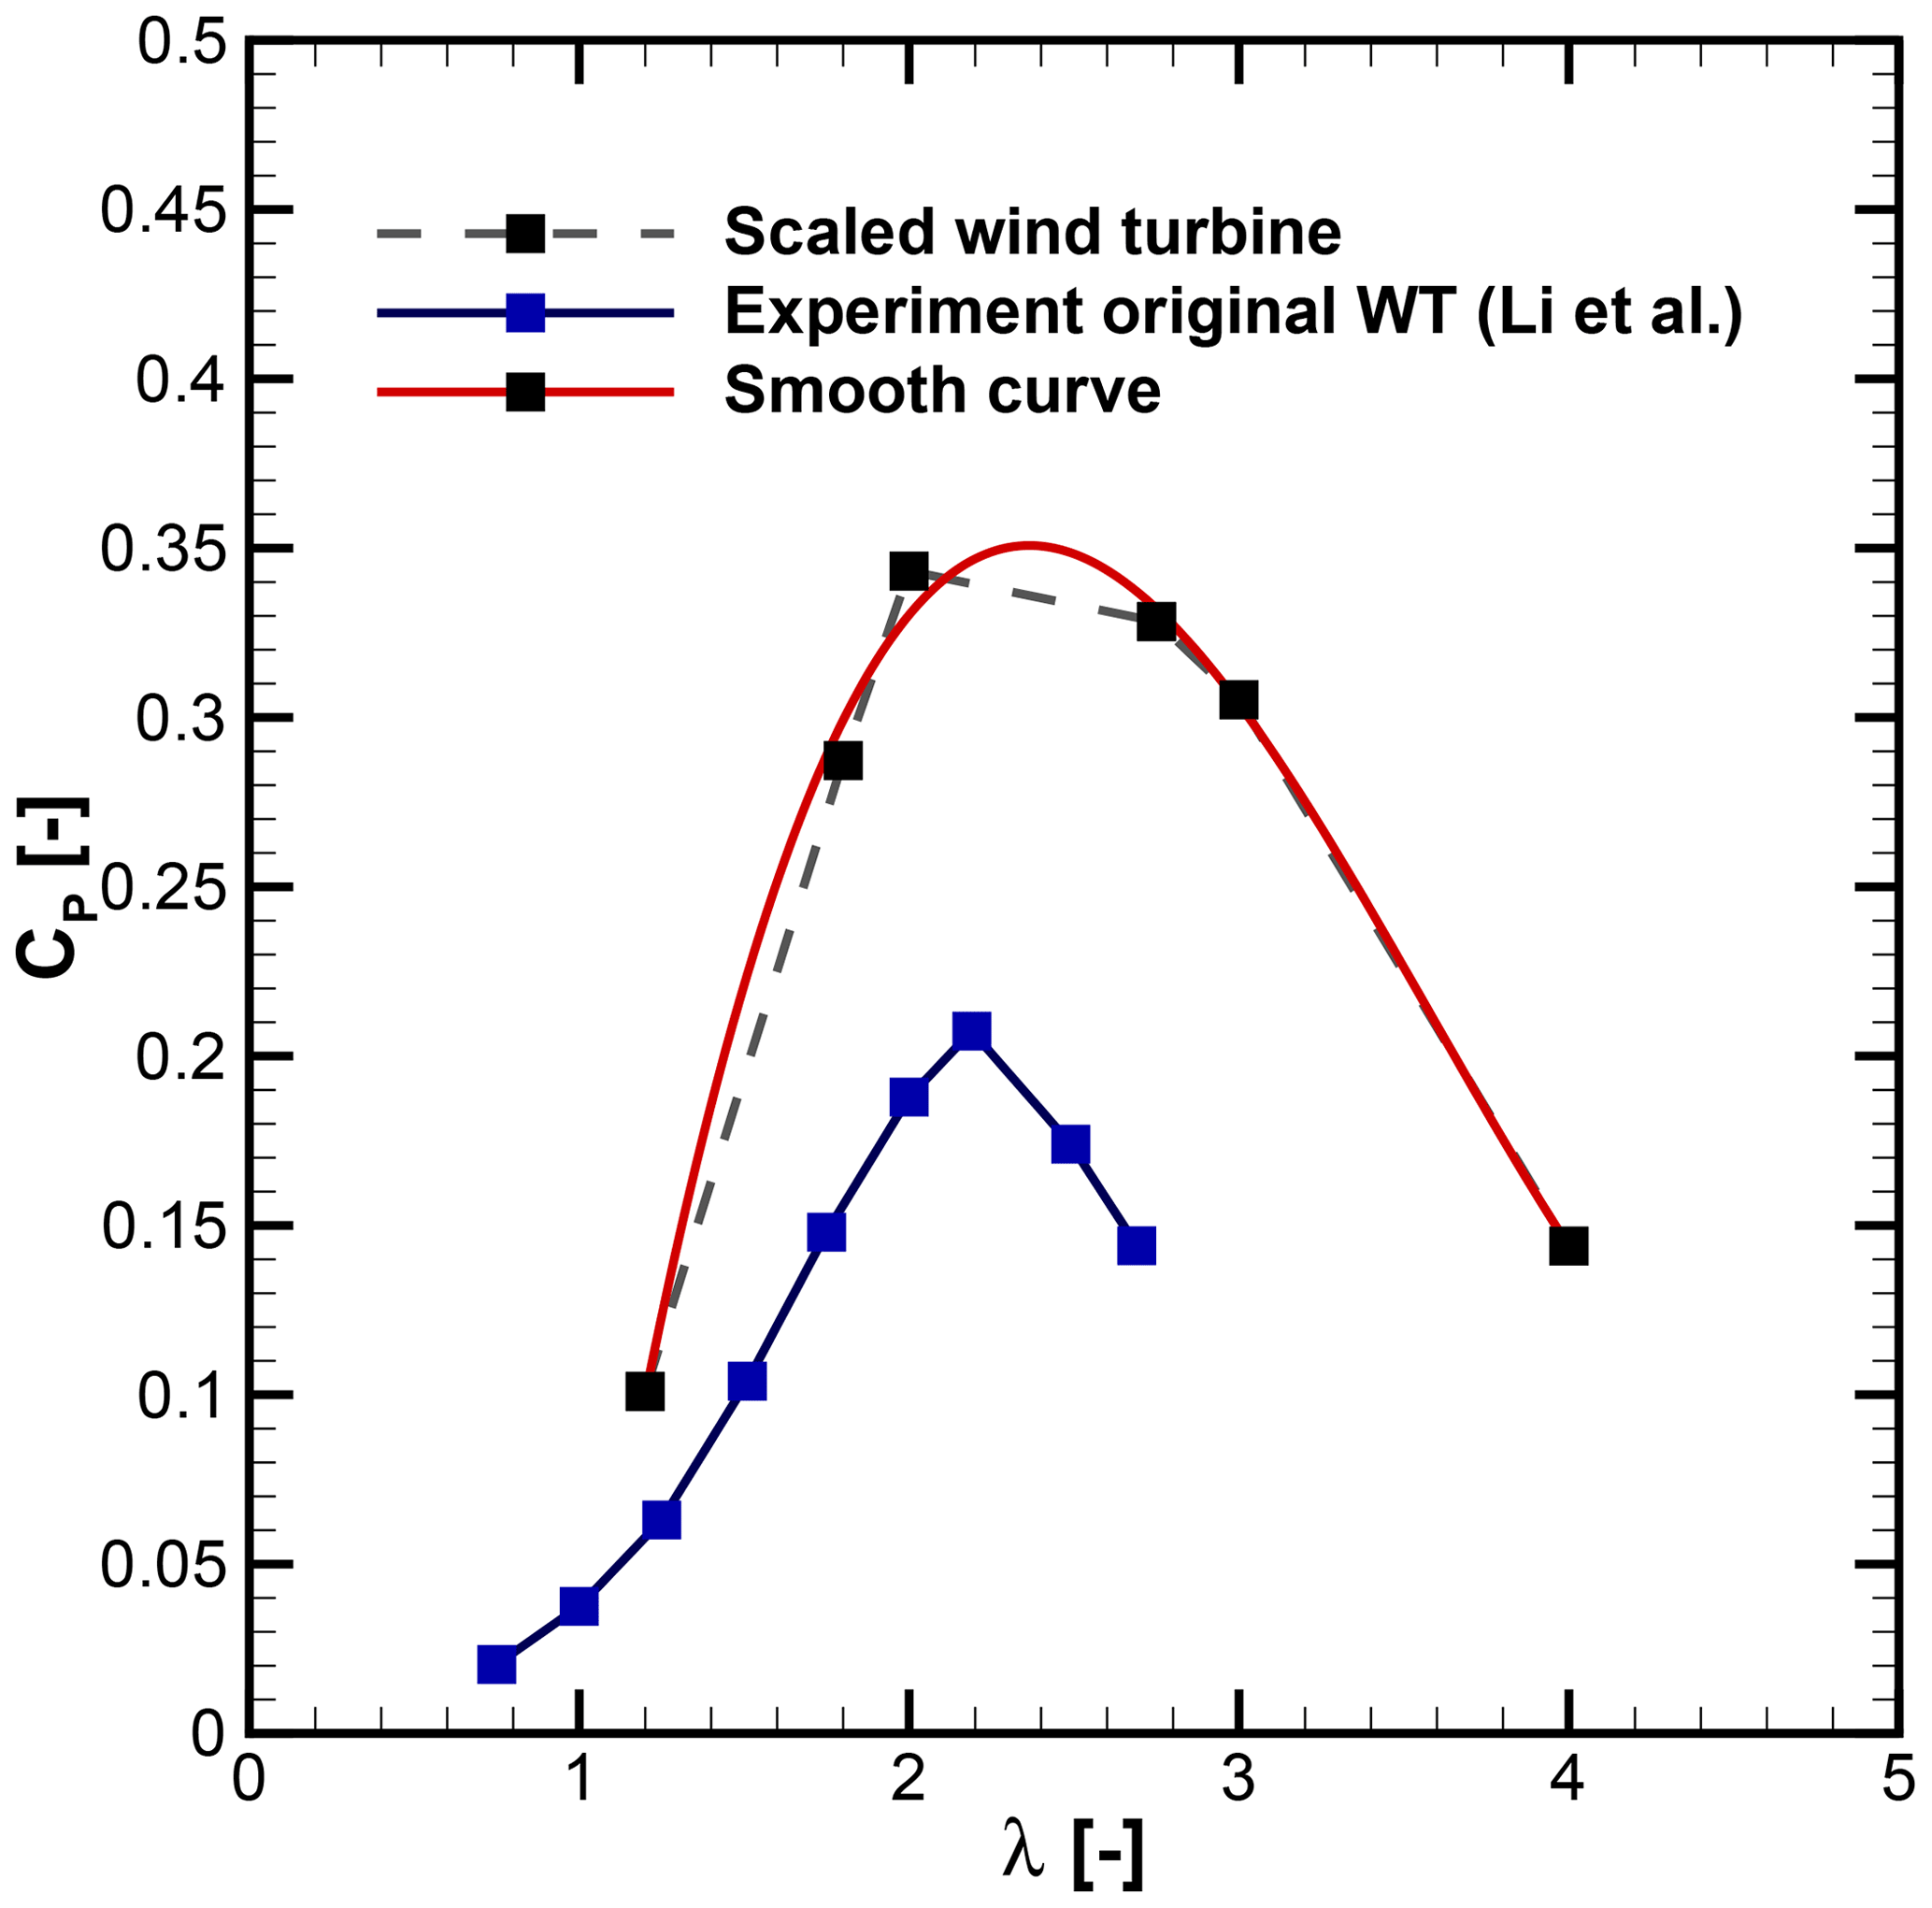
Figure 8Power coefficient for different tip speed ratios (λ) under uniform-inflow conditions.
The power coefficient of the scaled-up version at different operating points along with smooth curve and experimental values for the original wind turbine (Li et al., 2016) is shown in Fig. 8. The scaled-up wind turbine shows improvement in the power coefficient at all considered tip speed ratios. By scaling up, the Reynolds number based on the chord increases, which results in enhancement of the power of the H-VAWT. Roh and Kang (2013) studied the effect of the Reynolds number on the straight-bladed VAWT. The study found that the power production of the VAWT is directly dependent on the Reynolds number. Rezaeiha et al. (2018) studied the impact of operational parameters on characteristics of VAWTs and concluded that an increasing chord-based Reynolds number Rec significantly improves the turbine performance. For the scaled-up wind turbine, Cp increases with λ, reaching a maximum of 0.35 for , and then decreases. The normalized moment curves for λ=1.8 and 2.0 are almost identical, as depicted in the left panel of Fig. 7. However, the larger rotational speed for λ=2 results in higher CP. Similarly, the normalized moment for λ=2 and 2.75 varies considerably, but CP differs by a small amount. For λ larger than λopt, the thrust increases, while power decreases. It results in decreasing CP. As λ=2.75 is near λopt, it is selected for the wind turbine investigation in urban terrain. Details are discussed in Sect. 3.3.
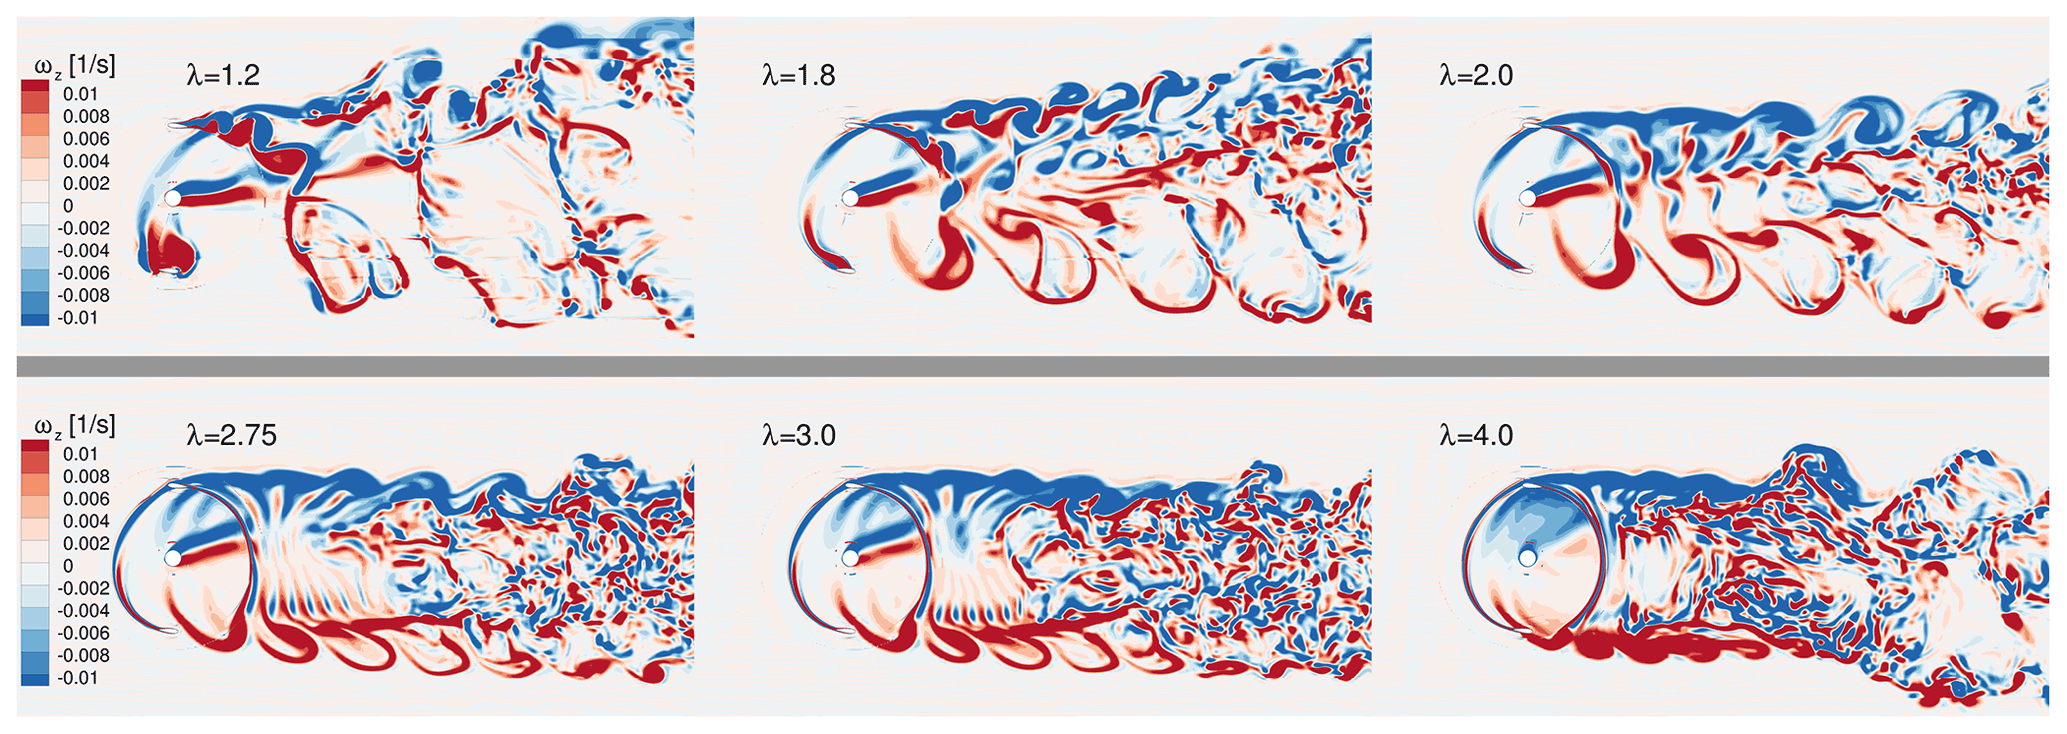
In Fig. 9, Z vorticity contours in the horizontal plane passing though the rotor have been depicted for different tip speed ratios. There are significant differences in the wakes of low, middle, and high tip speed ratios. Particularly, it can be seen how vortices are formed and how they propagate into the wake. For λ=1.2, no coherent vortical structures can be seen in the wake. In the case of λ=1.8 and 2.0, the coherent vortical structures are dominant in the wake, and they propagate over long distances downstream. A further increase in λ results in early breakdown of vortical structures downstream of the rotor. It can be clearly seen in the case of λ=3.0 and 4.0. The temporal frequency of the vortex shedding relative to the free stream increases with an increase in tip speed ratio. It leads to the stacking of the shed vortices and shear layers in the wake as well as behind the upwind passage of blades. Therefore, the wake profile is strongly dependent on the tip speed ratio.
3.2 Urban-terrain simulations under turbulent inflow
This section analyses the flow field in the urban terrain under the application of a log law wind profile and inflow turbulence in the absence of wind turbines. The results from these studies are the basis for the wind turbine investigations under turbulent urban conditions, which are discussed in Sect. 3.3.
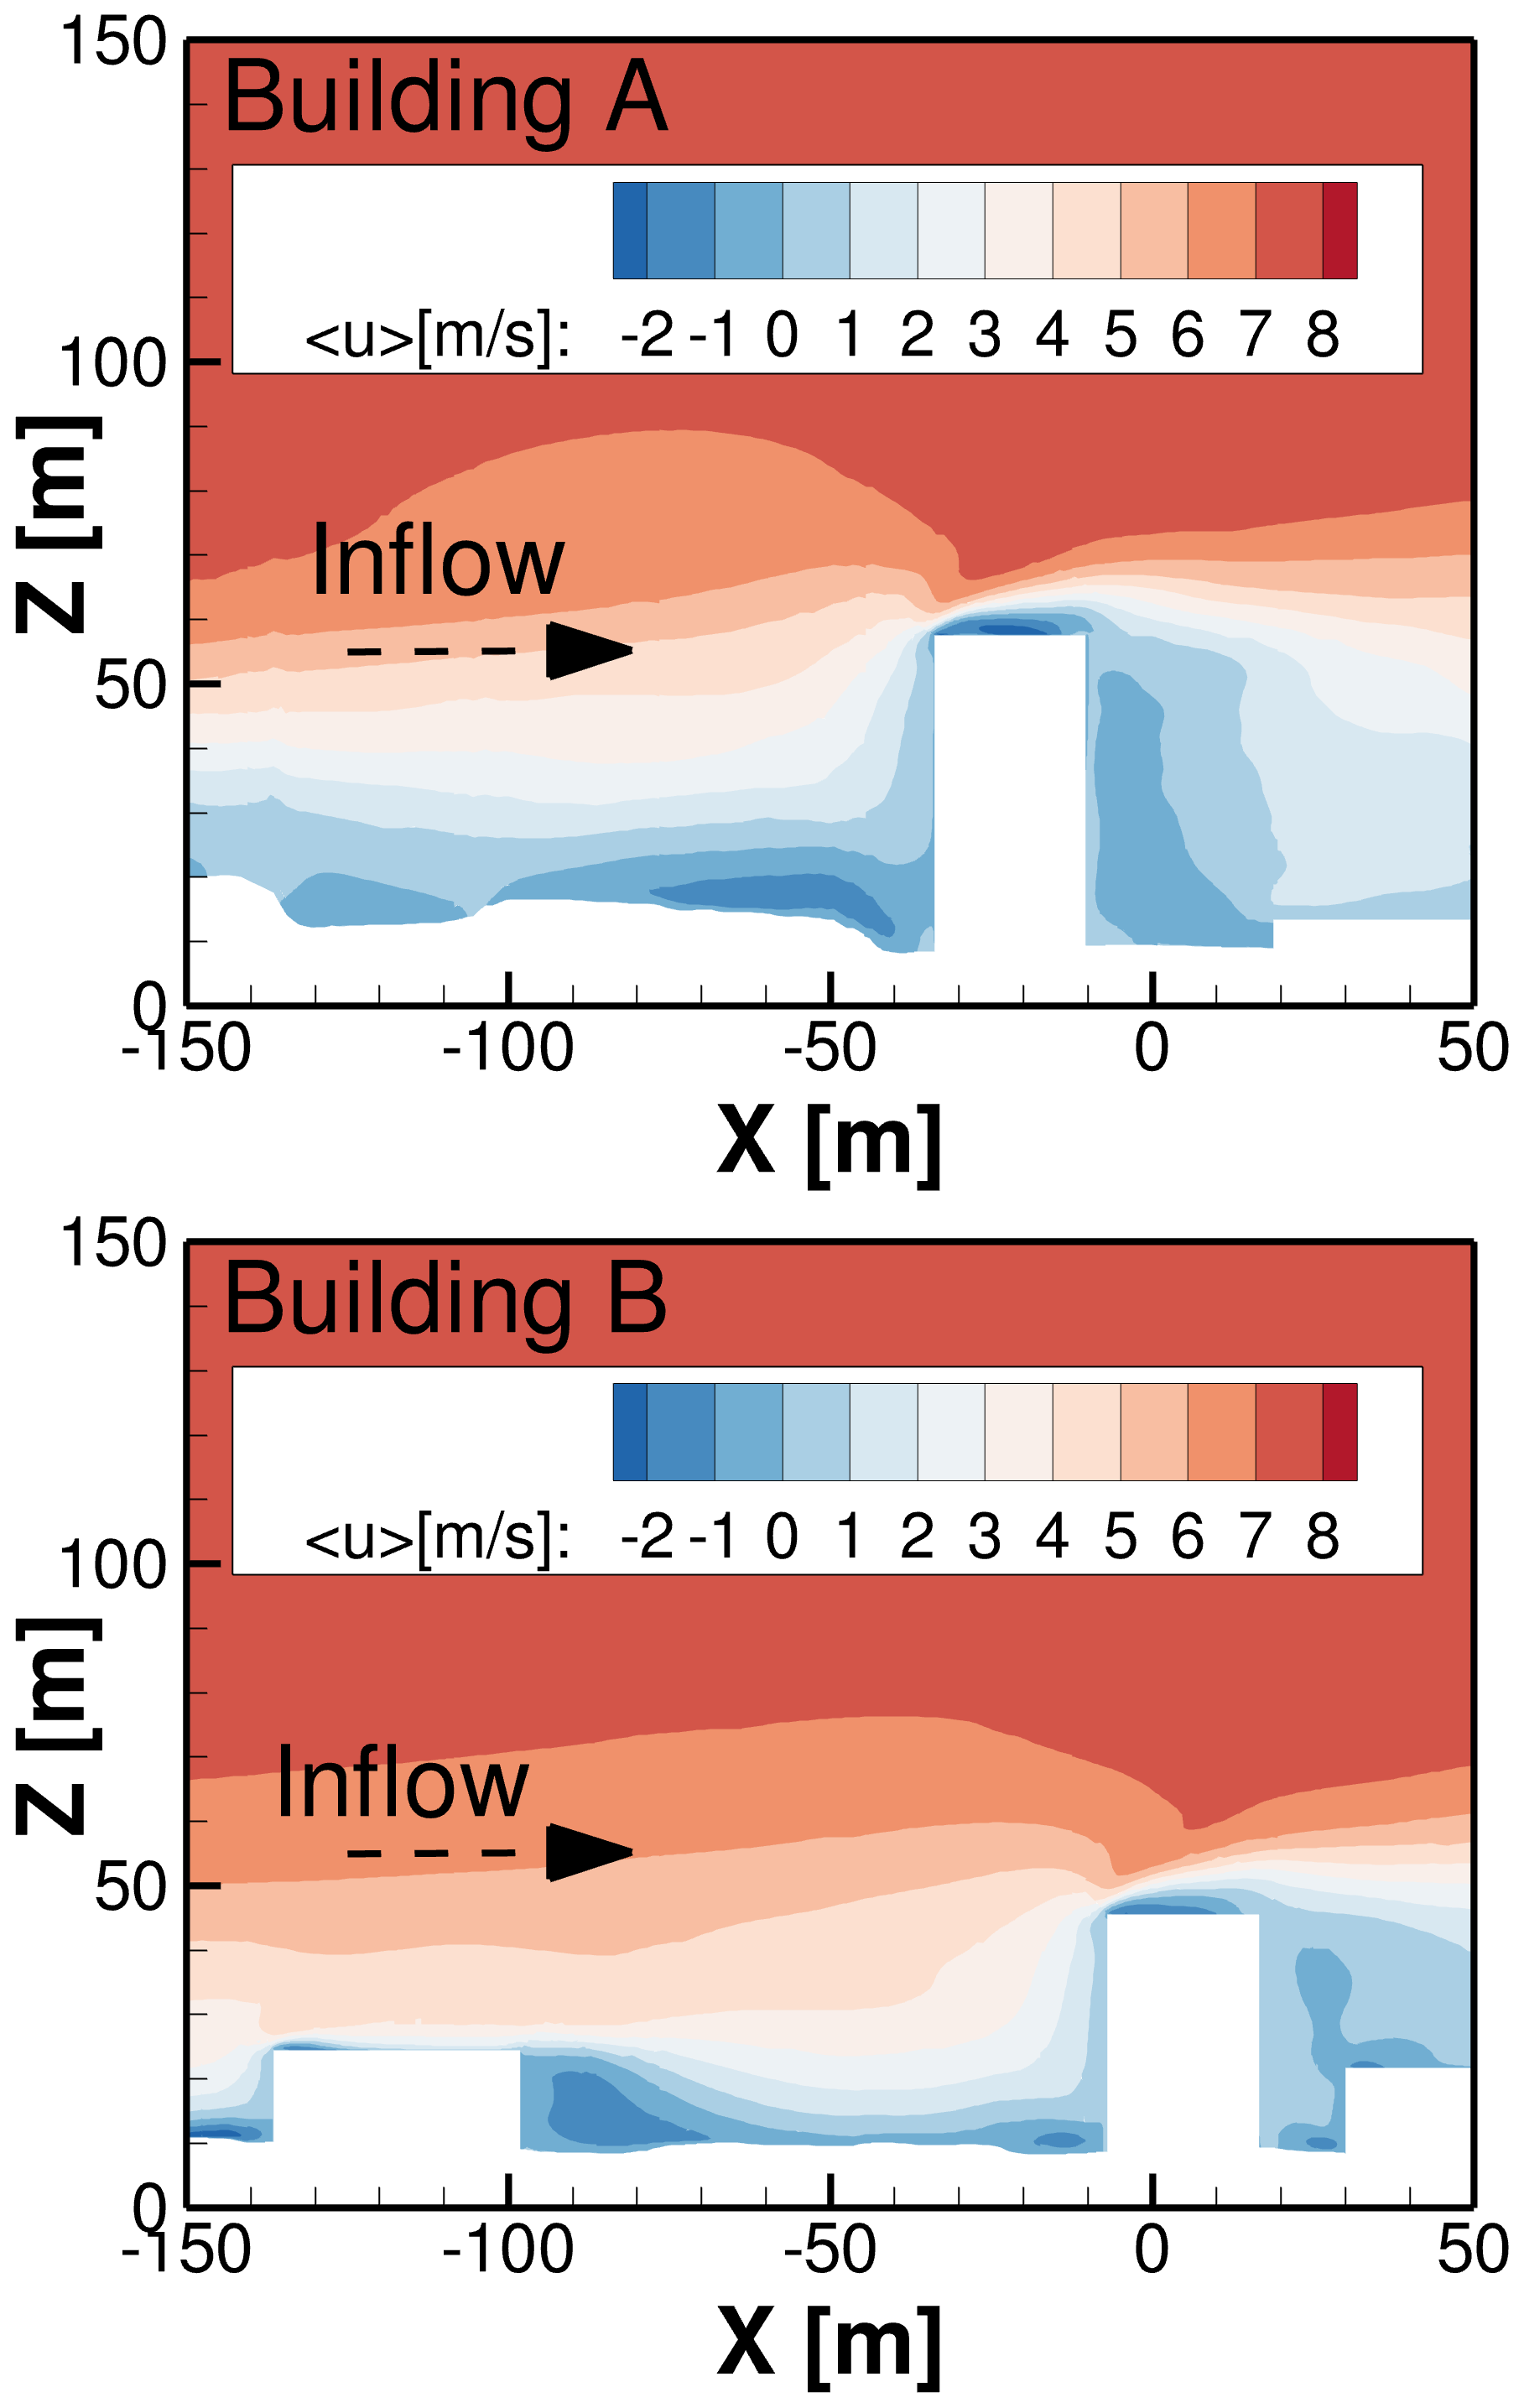
Figure 10Distribution of averaged u component of velocity in the plane Y=0 m and Y=110 m passing through building A and B.
The averaged flow variables are analysed in two different planes along the flow direction at the rooftops of the buildings A and B. The plane Y=0 m passes through approximately the middle of building A, while plane Y=110 m passes through the left part of building B relative to the flow direction, as shown in Fig. 6. The flow field is averaged for approximately 4 min after the turbulence is fully developed and is propagated through the domain. Figure 10 shows the distribution of the averaged flow field at building A and building B. Based on the accelerated velocity region, the locations for the wind turbines are selected as m and X=0 m at the rooftops of A and B, respectively. For the wind turbine investigations later on, 10, 12, and 20 m heights from the rooftop to the centre of the blade heights are chosen, as discussed in Sect. 2.5.
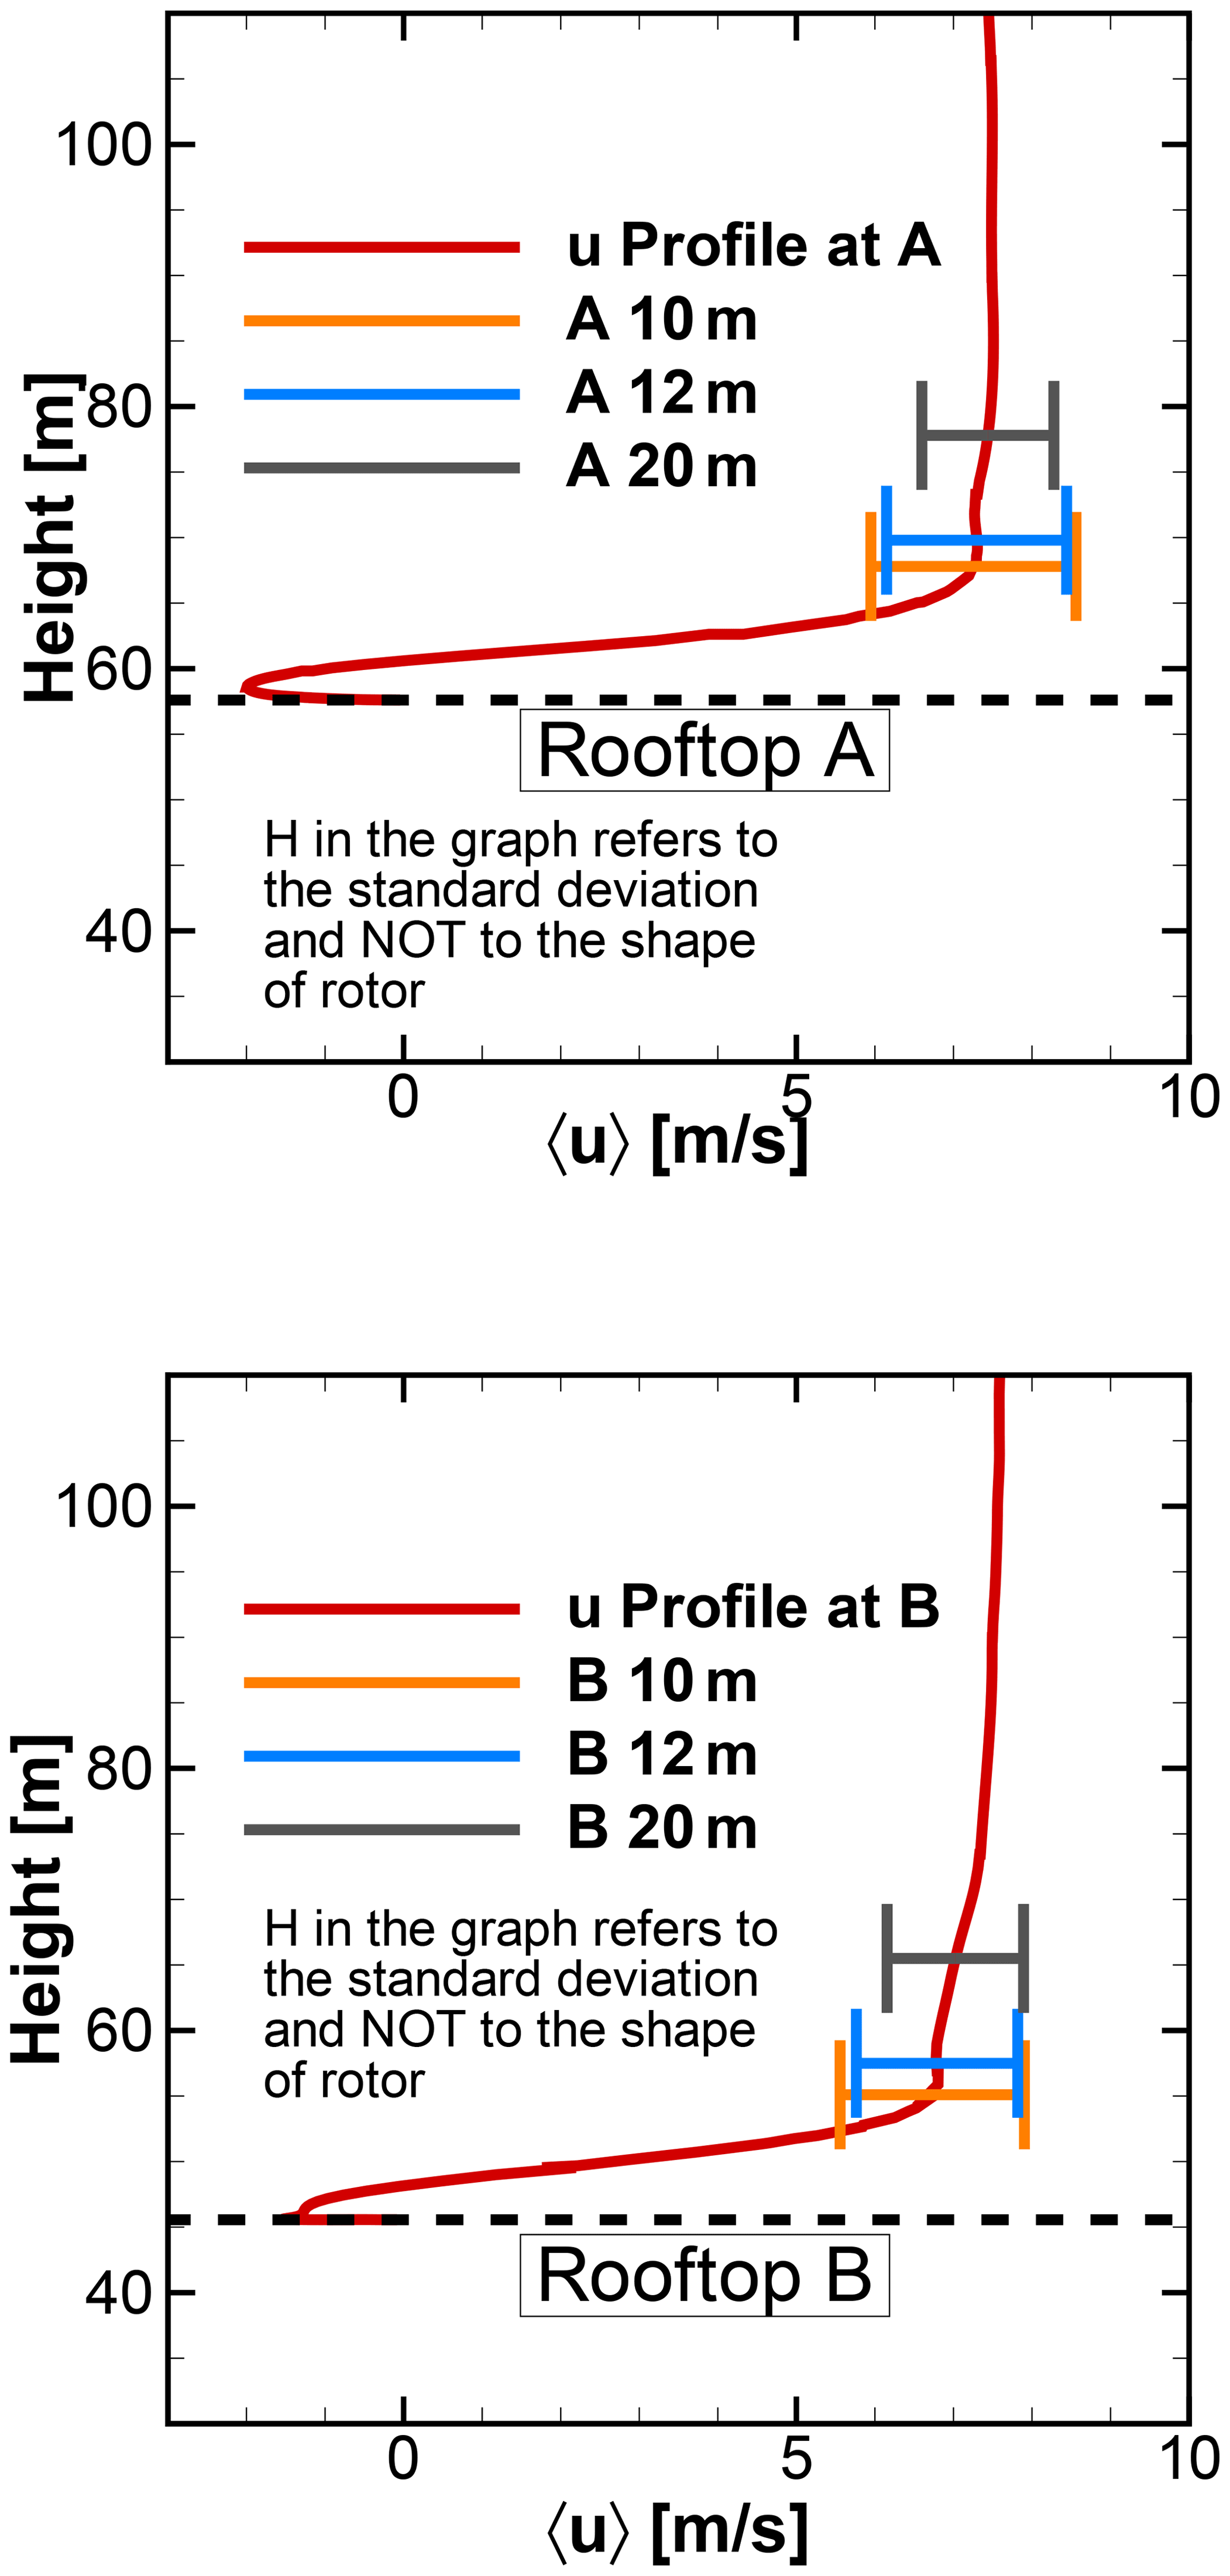
Figure 11Mean velocity profile and standard deviations at positions above rooftops of A and B.
Table 3Mean wind speeds and turbulence intensities at the rooftop.
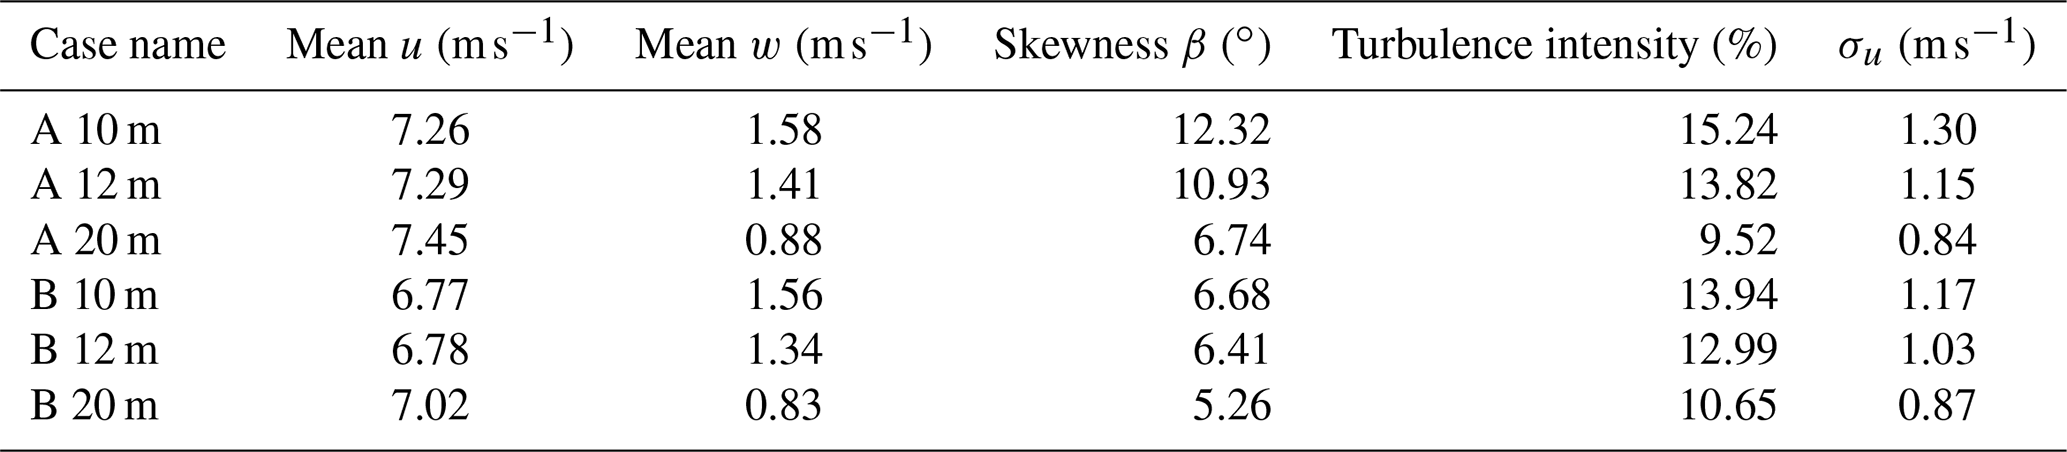
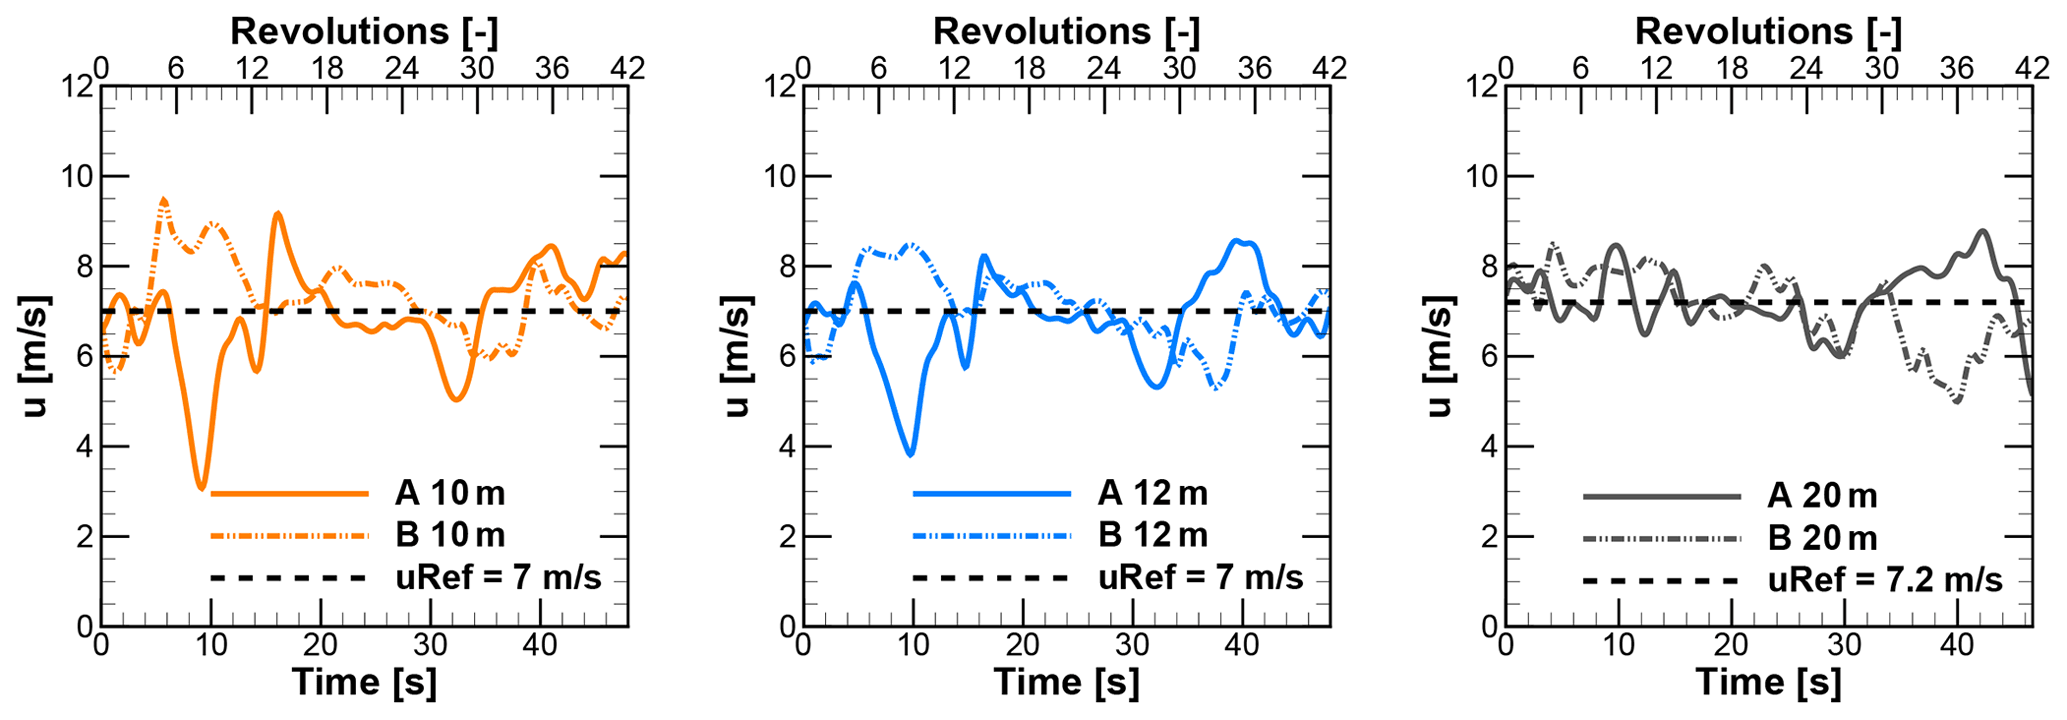
Figure 12Time series of u component of velocities at different rooftop heights above building A and B.

Figure 13Time series of w component of velocities at different rooftop heights above building A and B.
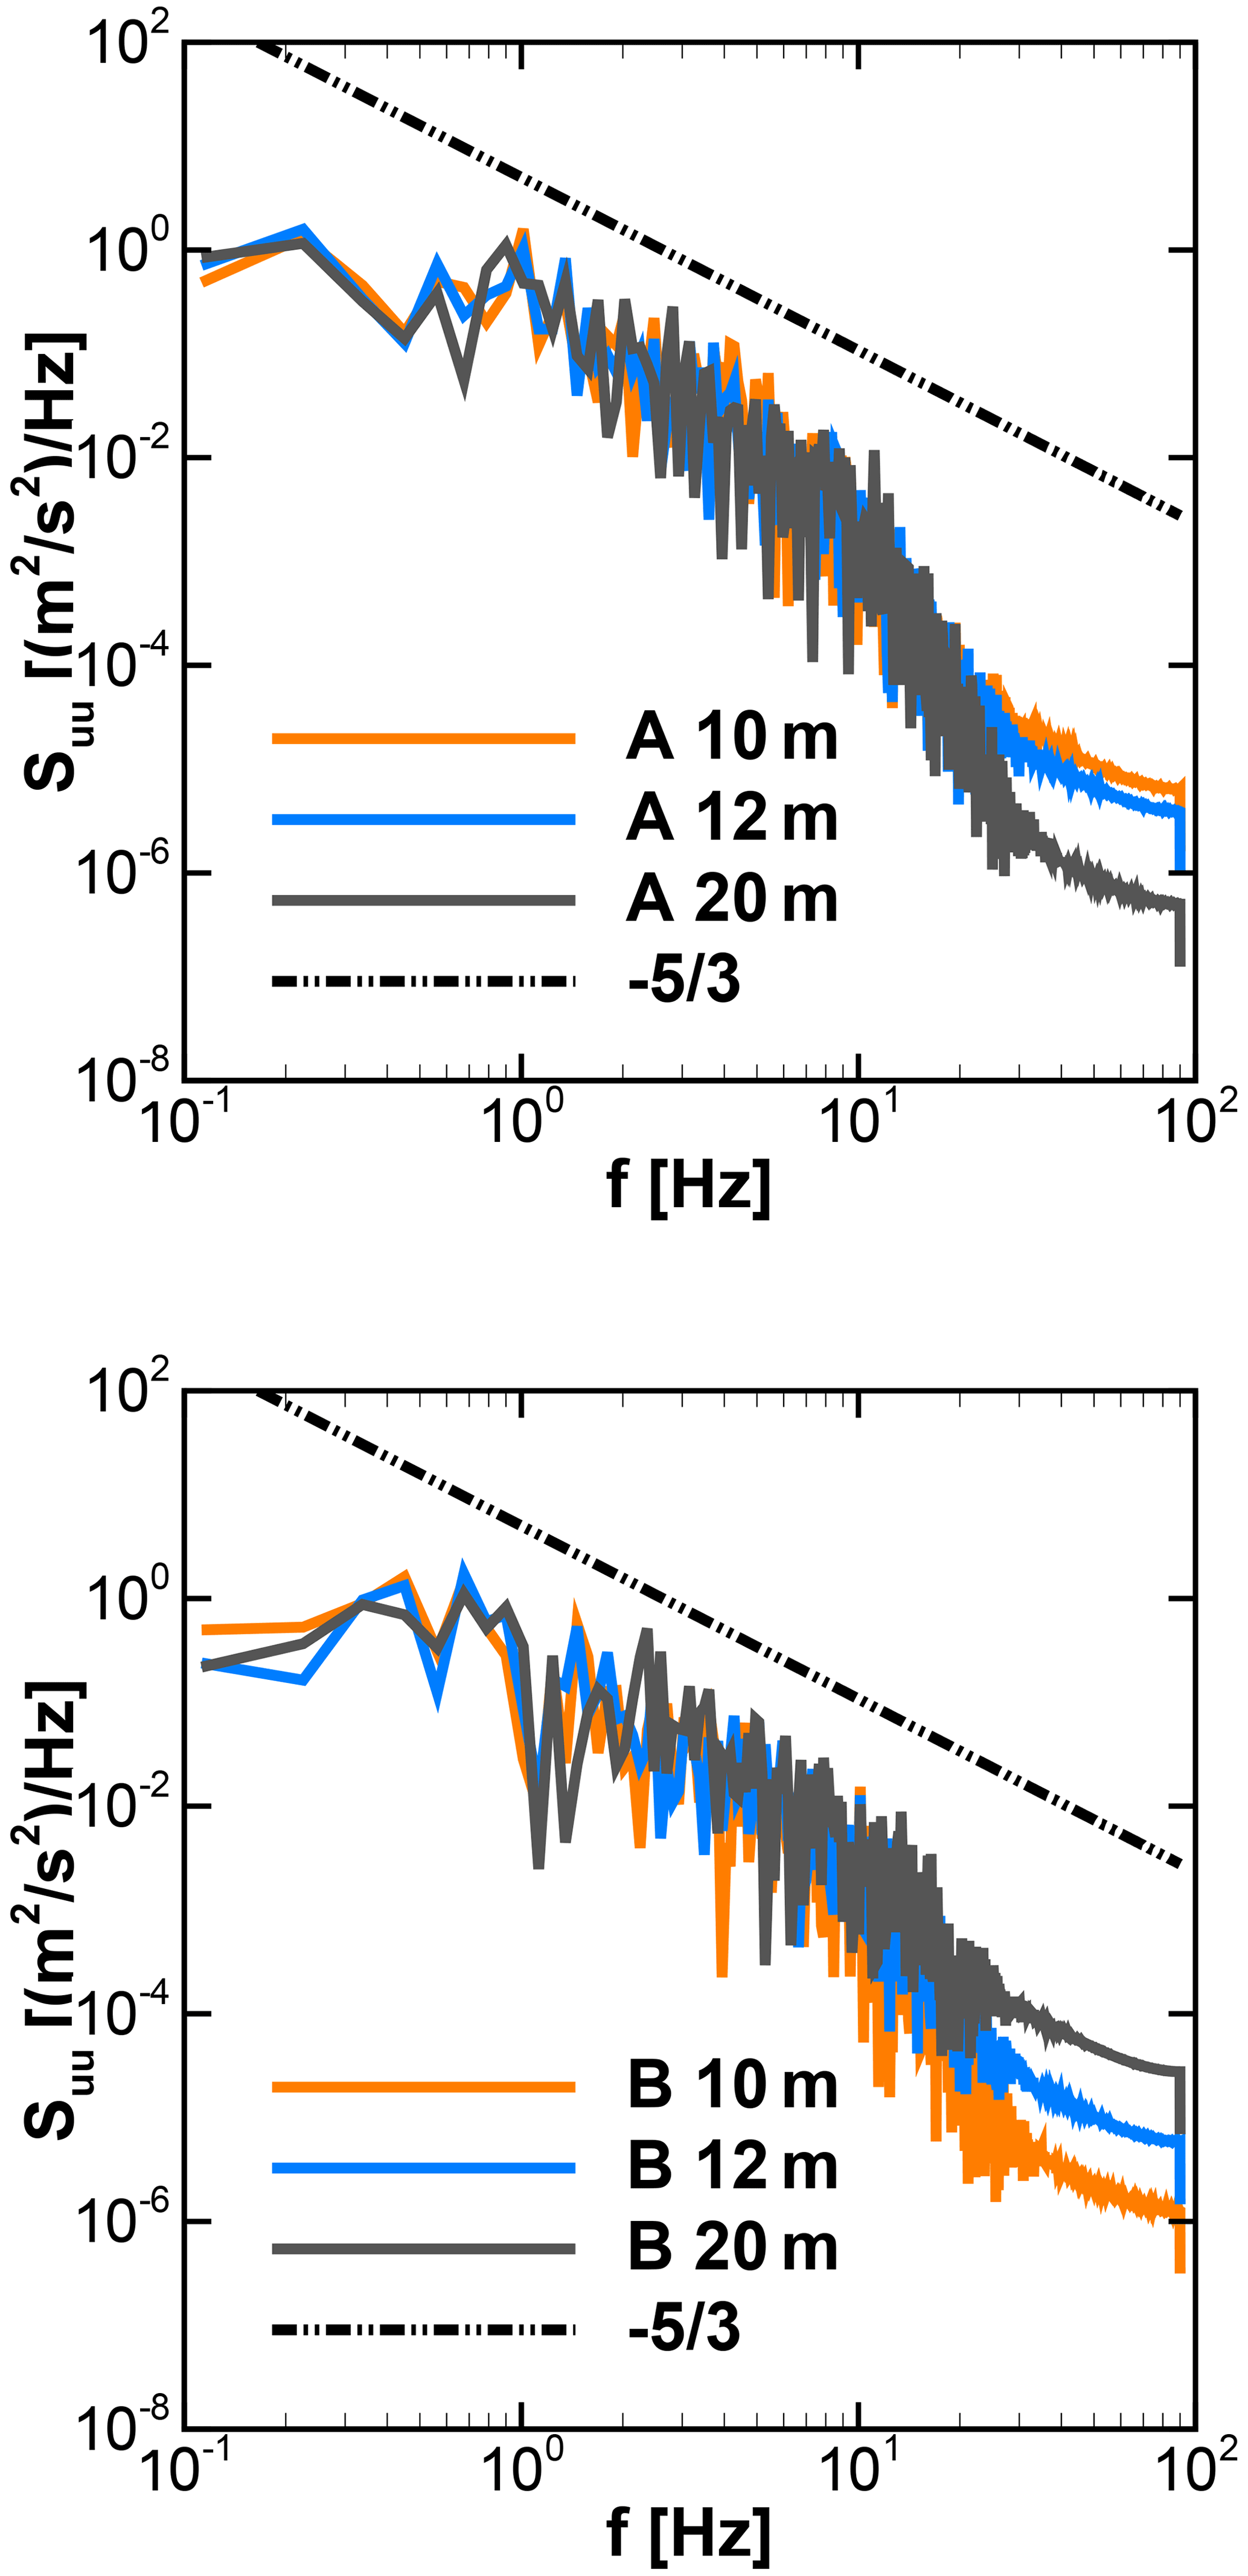
Figure 14Power spectral density Suu of u component of the velocity at wind turbine positions.
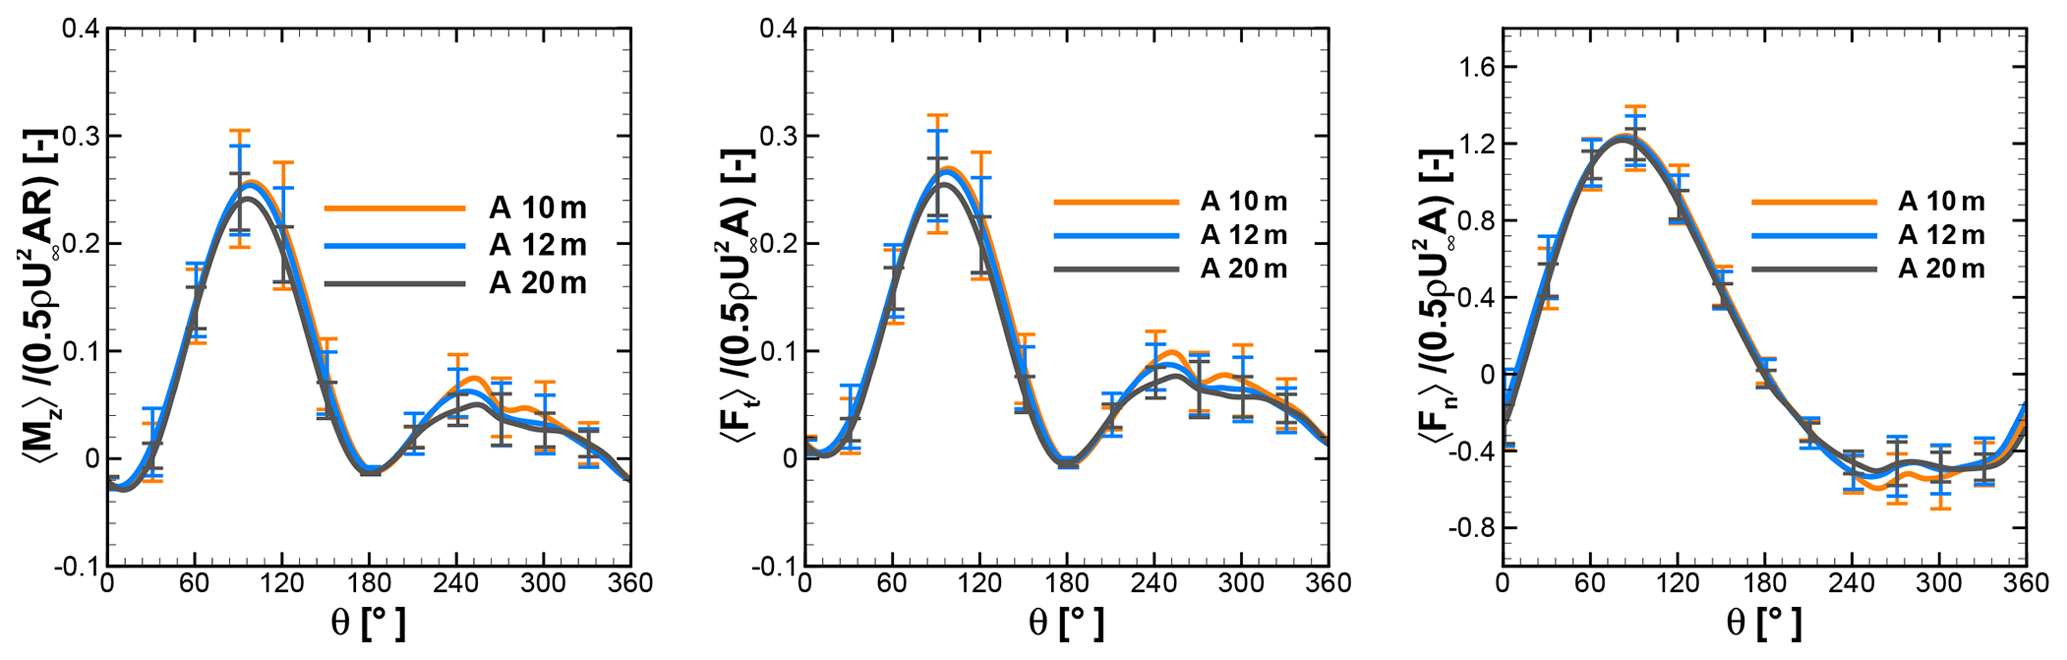
Figure 15Normalized moment and tangential and normal forces of a single blade at λ=2.75 under turbulent inflow at rooftop of A.
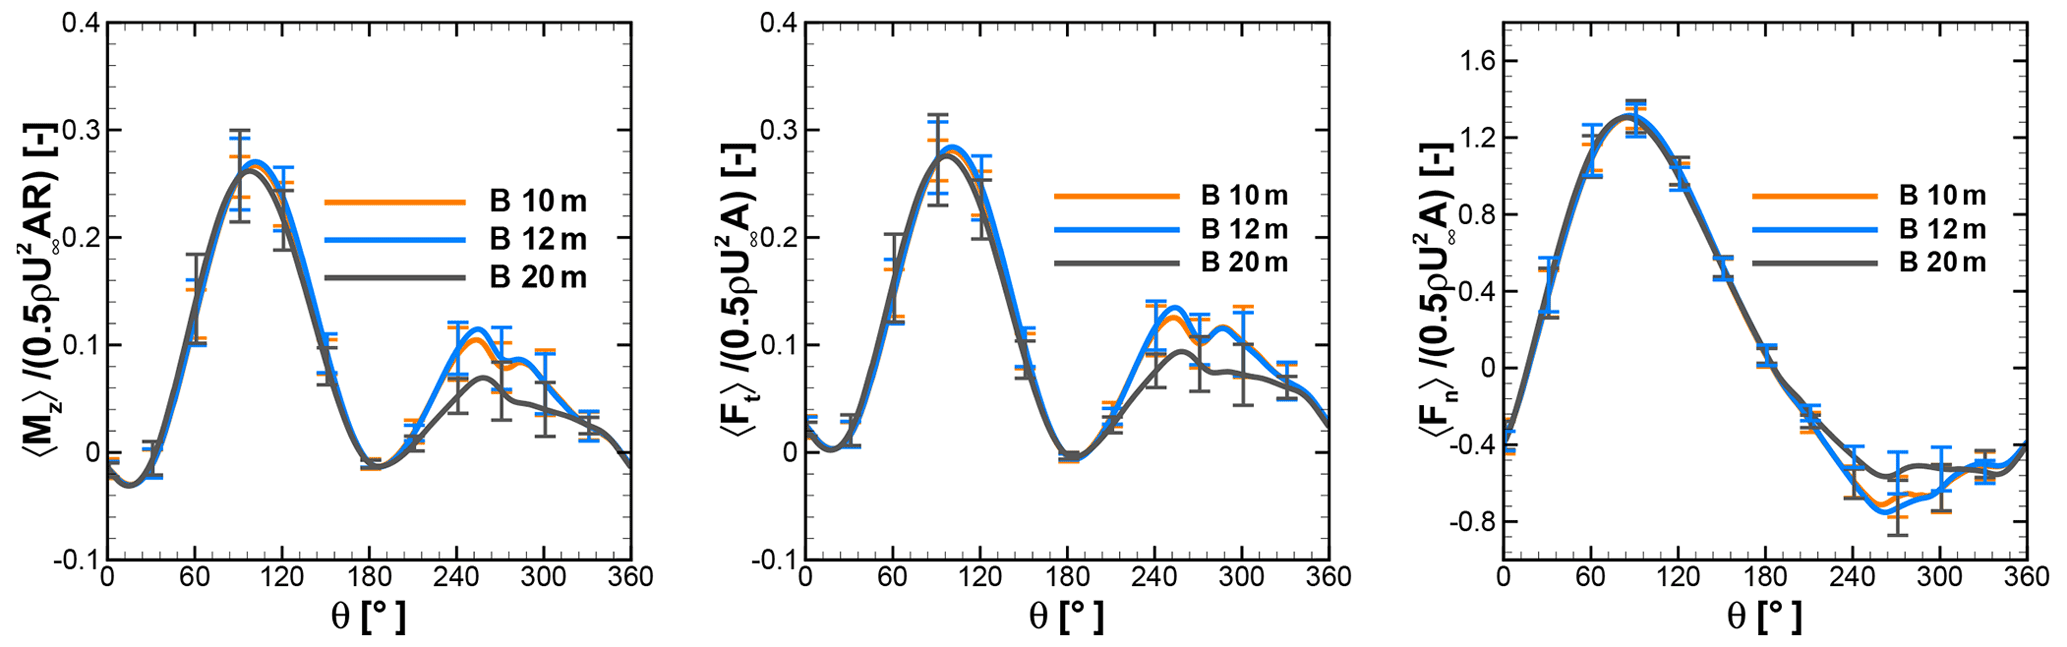
Figure 16Normalized moment and tangential and normal forces of a single blade at λ=2.75 under turbulent inflow at rooftop of B.

Figure 17Normalized moment of a single blade in uniform inflow and in urban terrain at 10 m height from rooftop of A. (Note: in the case of urban terrain, the moment is first averaged before normalized.)
The mean velocity profiles and standard deviations at the selected positions over the rooftop of A and B are shown in Fig. 11. At 10 and 12 m heights, the standard deviations are higher than 20 m height, which is evident as these positions are close to the rooftop. Along with the upstream turbulence originating from vegetation and topography, the separation caused due to the leading edges influences the nearby rooftop region. The mean wind velocity (u and w components), turbulence intensity, skew angle, and standard deviation at different heights from the rooftop are given in Table 3. With increasing distance from the rooftop, the magnitude of mean wind speed increases slightly, while a drop in turbulence intensity is observed. The near-rooftop positions are expected to experience higher skew angles than at 20 m height. The maximum skew angle of approximately 12.5∘ occurs at a height of 10 m over the rooftop of A. The flow over the rooftop of A appears to be more skewed than over the rooftop of B.
For the wind turbine positions above the rooftops of A and B, time series of the u and w components of velocity are shown in Figs. 12 and 13, respectively. The wind turbines are simulated for these time series. The vertical component over different positions varies significantly over the range of −2 to 4 m s−1, with the mean value being positive. It results in skewed flow over rooftops. The power spectral density Suu for the u component for different positions is shown in Fig. 14. The curves at all turbine positions show good agreement in the region of the inertial range of scales with the Kolmogorov spectrum. It indicates that the turbulence is propagated effectively through the domain until it reaches the relevant positions of the wind turbines.
3.3 Wind turbine simulations in urban terrain
This section presents the analysis of the wind turbines at different heights above the rooftops of A and B. As discussed in Sect. 2.5, the wind turbines are initialized in the developed turbulent flow field and simulated further. The objective of these simulations is to investigate the behaviour of the H-Darrieus wind turbine under the turbulent inflow influenced by the vegetation and the topography of the urban terrain.
At the considered heights, averaged wind speeds vary slightly from each other in the range of ±0.5 m s−1, as shown in Table 3. Also, from Fig. 12, instantaneous velocities fluctuate roughly around the respective mean values except for some large deviations in considered time series for wind turbine investigations. Therefore, it was assumed that the wind turbines positioned at 10 and 12 m heights above the rooftops of A and B operate at a mean wind speed of 7 m s−1, and at 20 m heights, they operate at a mean wind speed of 7.2 m s−1. Later, these same mean values of velocity are used for the normalization of the forces and the moments. These mean wind velocities are reasonably close to 8 m s−1, the velocity at which reference cases are simulated. From Fig. 8, λ=2.75 is near the optimum λ. Subsequently, for the investigations of H-VAWTs in urban terrain, the rotational speeds are deduced depending on the selected wind speed and the operating point of λ=2.75. The instantaneous variables like moments and tangential and normal forces are recorded for a total of 42 revolutions under turbulent inflow. However, only the last 30 revolutions are averaged later in post-processing and considered for the analysis. Initially, 12 revolutions are ignored so that the flow field near the wind turbine and wake is well developed.
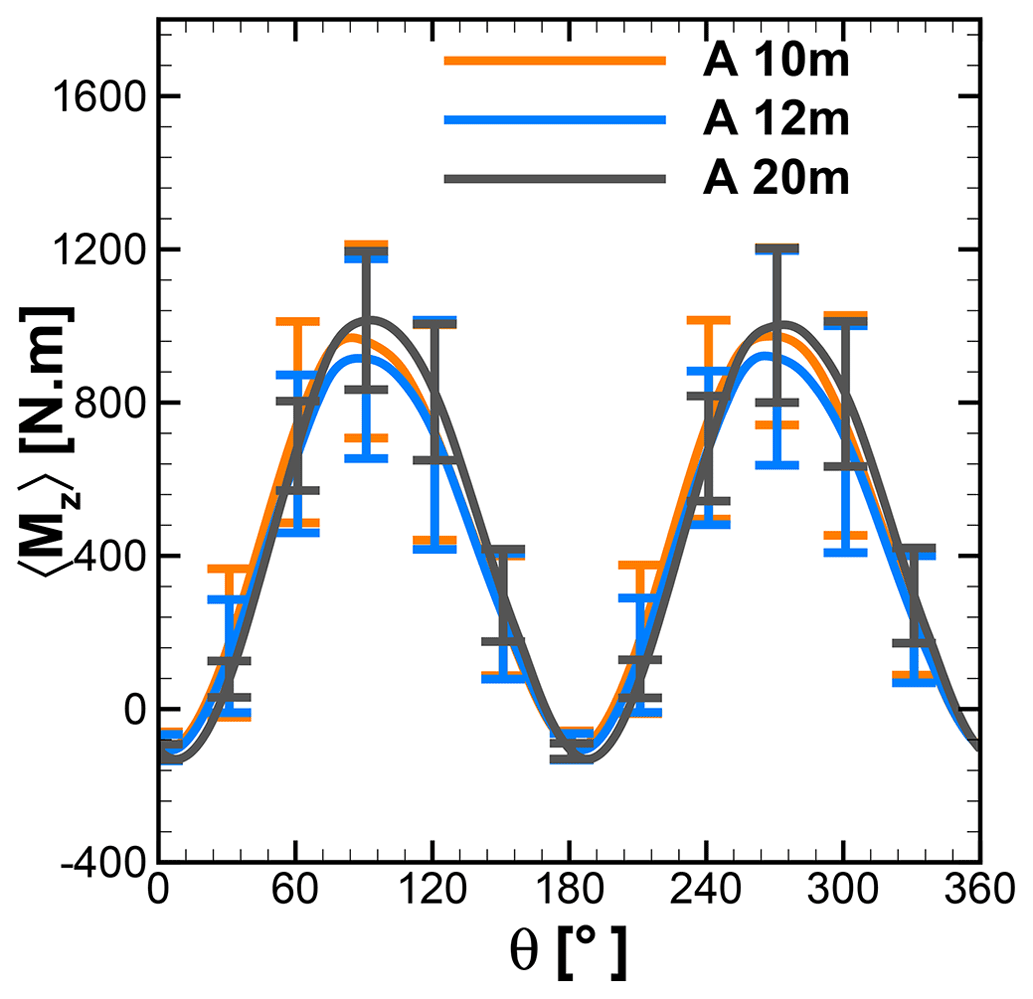
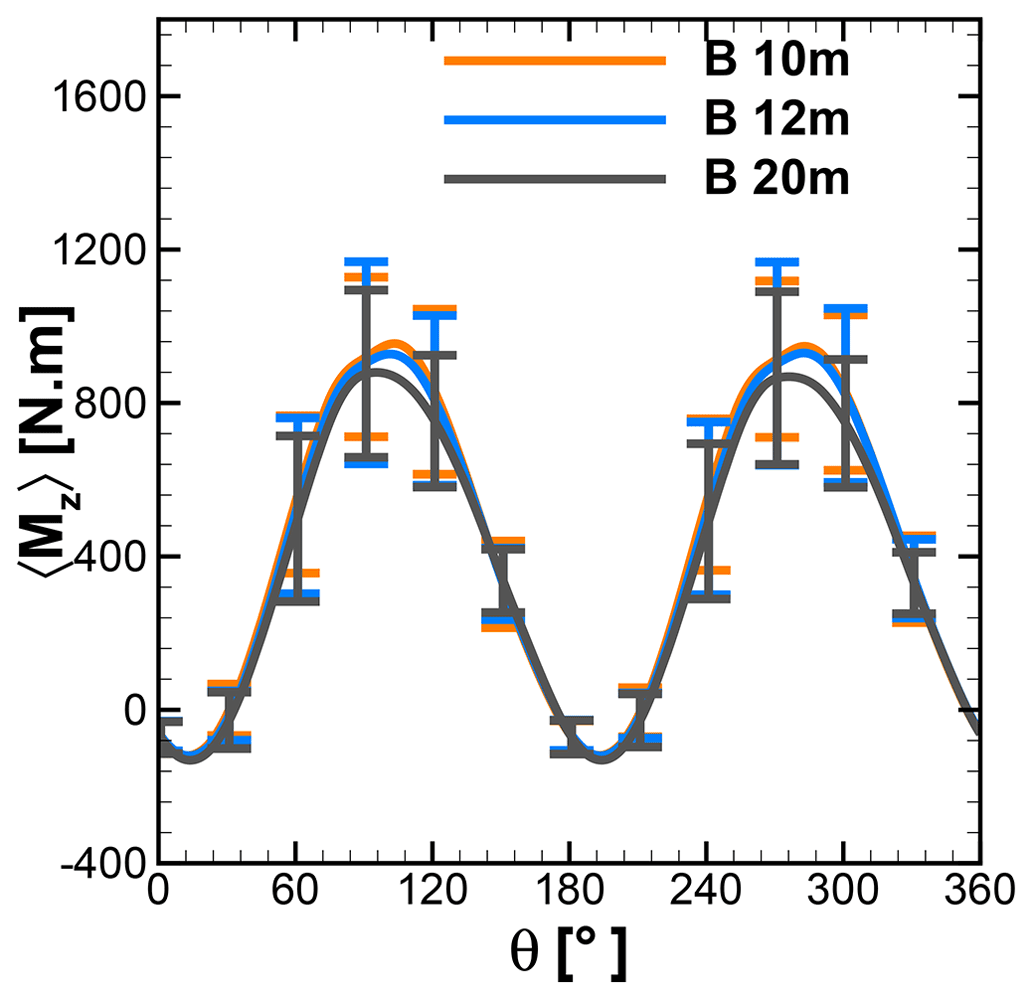
Figures 15 and 16 show the phase-averaged and normalized moment and tangential and normal forces of a single blade and standard deviation at different heights over the rooftop of A and B. As shown in the left panel in Fig. 15, the averaged moments show an identical characteristic over the first half revolution of a wind turbine at 10, 12, and 20 m height above the rooftop of building A. However, the standard deviation contours indicate that the moment deviates significantly between azimuth positions from 60 to 120∘ and 240 to 300∘. The normalized moment from Fig. 15 is compared with the uniform-inflow case at λ=2.75 from Fig. 7. It can be seen that at all considered heights the normalized moment has been increased in the second half revolutions, implying better performance, particularly at azimuth positions between 200 and 270∘. The left panel of Fig. 16 also reveals a consistent trend for a normalized moment over the second half revolution. The normalized moments of single blades at 10 m height over A and B are compared with the reference case in Fig. 17 in order to visualize better performance in the second half revolutions. This improvement is attributed to the combined effect of turbulence and skewness of flow near the rooftop. Due to the skewed flow over rooftops, the bottom part of the blade in the downwind section is less impacted by the wake generated by upwind passage of the other blade. Therefore, the reduced blade wake interaction in the downwind section improves the performance by generating a positive moment. These findings are also in line with the study of Mertens et al. (2003), which concluded that the performance coefficient of an H-Darrieus wind turbine in skewed flow, based on the projected frontal rotor area, can increase to above that of non-skewed flow. Orlandi et al. (2015) investigated an H-rotor with a 3D unsteady RANS (URANS) approach in skewed flow and reported a similar phenomenon in moment and forces.
The middle panels of Figs. 15 and 16 represent normalized tangential force at different heights over the rooftop of A and B. It shows excellent correlation with normalized moments. Showing excellent correlation with the moment, the high standard deviations are seen in the first half revolutions, including at peak position around 90–95∘, implying an influence by the complex inflow conditions. Also, a similar trend can be seen over the second half revolutions. The higher magnitude of the standard deviation indicates that due to turbulence, flow conditions in the downstream part are more random, which result in a “less phase-locked” trend in the forces. The right panels from Figs. 15 and 16 show the normalized normal forces experienced by a single blade at different heights above the rooftop of A and B. The lower magnitudes of standard deviations and overlapping curves for the different heights for the first half revolutions indicate that normal forces are less sensitive to turbulence and skewed inflow. However, in second half revolutions relatively higher values of standard deviations can be seen.
Table 4Power coefficients of wind turbine at different heights over A and B.
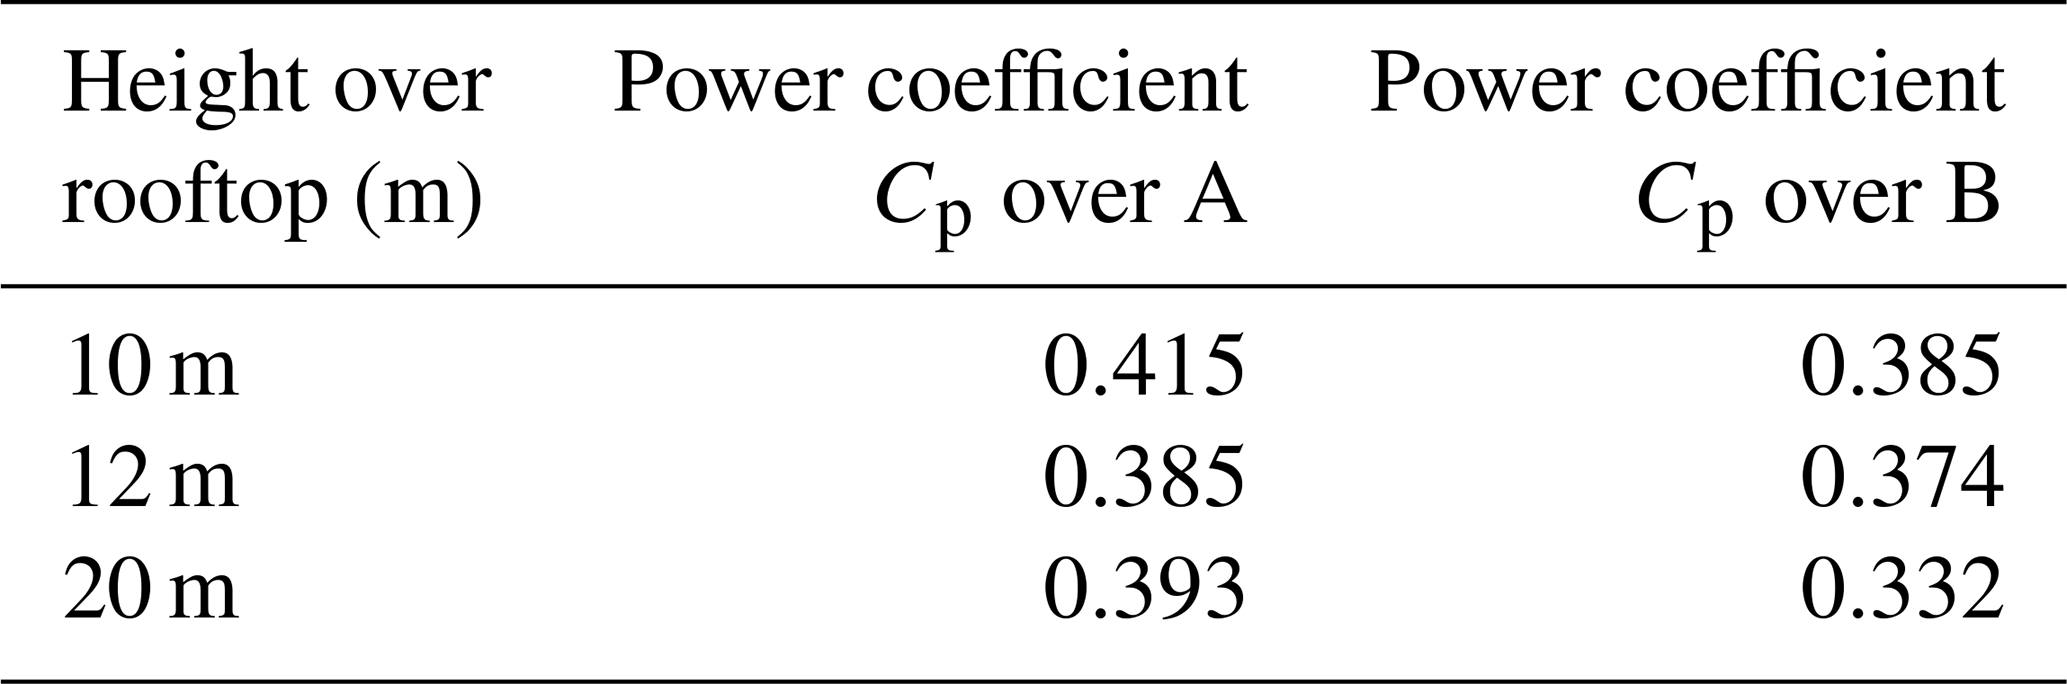
The phase-averaged moment over 30 revolutions for a complete rotor is shown in Figs. 18 and 19 for different heights over the rooftop of A and B, respectively. The higher standard deviations in the moment of the complete rotor over different azimuth positions indicate the influence of complex turbulent-inflow conditions on wind turbine performance. For the peak position around 90 to 95∘ and 270 to 275∘, it can be observed that the upper and lower limits of the moment lie in the range of approximately ±20–25 %. At the azimuth positions of 0±30∘ and 180±30∘, the standard deviation is small. The power coefficients for the considered heights are given in Table 4. The near-rooftop heights show an increase in power coefficient compared to a uniform-inflow case, where the power coefficient for λ=2.75 is 0.33. As the power extracted by the wind turbine is directly proportional to the power of the wind speed, the overall sum of positive and negative deviations in the wind speed leads to a positive increase in power. It can be illustrated by a simple mathematical expression as . It translates that even if the mean wind speed is the same, the higher-turbulence case will contain more energy (Putnam and Koeppl, 1982; Möllerström et al., 2016). In the present study, even though the averaged wind speeds at all considered heights are lower than the uniform-inflow case, the coefficients of power are still higher than that of the uniform case of λ=2.75, shown in Fig. 8. Turbulence and the skewed flow both contribute to positively enhancing performance.
In the present study, a numerical investigation of the influence of the complex and urban terrain on the behaviour of the rooftop-mounted vertical-axis wind turbine (H-VAWT) under turbulent-inflow conditions is performed. The high-fidelity scale-resolving DDES and higher-order numerical scheme are employed to investigate the in-stationary characteristics of the forces and moment of the vertical-axis wind turbine.
In the first part of the study, the behaviour of the scaled-up, two-straight-bladed H-VAWT with an NACA0021 airfoil section is investigated at uniform inflow of 8 m s−1 over different tip speed ratios. The scaled-up wind turbine has a diameter of 7 m, blade length of 4.2 m, and a fixed-pitch angle of 6∘. It is found that the wind turbine shows better performance than the original design due to an increase in the chord-based Reynolds number by scaling up. Based on the tip speed ratio vs. power coefficient curve (CP−λ), an operating point λ=2.75 is selected for investigation of H-VAWT in urban terrain as it is near optimum λ. In the second part of the study, the flow field in the realistic terrain consisting of different buildings, vegetation, and topographical features under turbulent inflow is investigated. The flow variables are averaged after turbulence is well developed and propagated through the computational domain. The mean wind profiles, turbulence levels, and flow skewness are analysed above the rooftops of two distinct buildings. Based on the mean wind velocities and selected operating point λ=2.75, the rotational speed is derived for a H-VAWT investigation in urban terrain.
In the last part of the study, a H-VAWT is investigated at different heights over the rooftops of buildings. The wind turbine meshes are introduced in an instantaneous flow field from the second part by the application of the overlapping grid technique and interpolation. With this simulation strategy, wind turbines are investigated in a turbulent flow field with convenience and a significant reduction in the computation cost. Based on the averaged forces and moments over multiple revolutions, the H-VAWT shows significant improvement in performance at heights of 10 and 12 m from the rooftop of buildings in the considered realistic urban terrain. At these heights, it operates in the flow with a relatively higher level of turbulence and skewed angle than the 20 m height. Due to the skewed flow, the reduced blade wake interaction in the second half revolutions (downwind) increases tangential forces and moment extraction compared to the case of uniform non-skewed flow. Large deviations are observed in the tangential forces and moments due to temporal changes. The improvement in the performance at near-rooftop heights is due to the combined influence of the turbulence and skewed angle of the flow. Also, the H-VAWT placed at the height of 20 m from rooftops shows a better power coefficient than the uniform-inflow conditions. Therefore, it can be concluded that combined turbulence and skewness have a positive impact on the performance of rooftop-mounted H-VAWTs in the considered urban terrain and turbulent-inflow data when operated at a fixed tip speed ratio.
FLOWer is a proprietary software of DLR and is expanded at IAG. Information can be obtained from the corresponding author.
The VAWT specifications and experimental results are available from https://doi.org/10.1016/j.renene.2016.01.002 (Li et al., 2016). The raw data of the simulation results can be provided by contacting the corresponding author.
PZ conducted the CFD investigations and wrote the paper. TL initiated the research, supervised the work, and revised the manuscript.
The contact author has declared that neither of the authors has any competing interests.
Publisher’s note: Copernicus Publications remains neutral with regard to jurisdictional claims in published maps and institutional affiliations.
The authors gratefully acknowledge the High Performance Computing Center Stuttgart for providing computational resources within the project WEALoads. Also, the authors acknowledge Amgad Dessoky for providing the original computation grids of the wind turbine from the validation study.
This research is carried out within the framework of the Joint Graduate Research Training Group Windy Cities, supported by the Baden-Württemberg Ministry of Science, Research and Arts. This open-access publication was funded by the University of Stuttgart.
This paper was edited by Jens Nørkær Sørensen and reviewed by Gerard J.W. van Bussel and two anonymous referees.
Balduzzi, F., Bianchini, A., Carnevale, E. A., Ferrari, L., and Magnani, S.: Feasibility analysis of a Darrieus vertical-axis wind turbine installation in the rooftop of a building, Energy Solutions for a Sustainable World - Proceedings of the Third International Conference on 16–18 May 2011 – Perugia, Italy, Appl. Energ., 97, 921–929, https://doi.org/10.1016/j.apenergy.2011.12.008, 2012. a
Balduzzi, F., Zini, M., Molina, A. C., Bartoli, G., De Troyer, T., Runacres, M. C., Ferrara, G., and Bianchini, A.: Understanding the Aerodynamic Behavior and Energy Conversion Capability of Small Darrieus Vertical Axis Wind Turbines in Turbulent Flows, Energies, 13, 2936, https://doi.org/10.3390/en13112936, 2020. a
Bangga, G., Lutz, T., Dessoky, A., and Kraemer, E.: Unsteady Navier-Stokes studies on loads, wake, and dynamic stall characteristics of a two-bladed vertical axis wind turbine, J. Renew. Sustain. Ener., 9, 053303, https://doi.org/10.1063/1.5003772, 2017. a
Baring-Gould, I., Fields, J., Oteri, F., and Preus, R.: Deployment of Wind Turbines in the Built Environment: Risks, Lessons, and Recommended Practices, May 2017, United States, https://www.osti.gov/biblio/1361457 (last access: 24 July 2022), 2017. a
Benek, J., Buning, P., and Steger, J.: A 3-D chimera grid embedding technique, 7th Computational Physics Conference, 15–17 July 1985, Cincinnati, OH, USA, https://doi.org/10.2514/6.1985-1523, 1985. a
Bertényi, T., Wickins, C., and McIntosh, S.: Enhanced Energy Capture Through Gust-Tracking in the Urban Wind Environment, 48th AIAA Aerospace Sciences Meeting Including the New Horizons Forum and Aerospace Exposition, 4–7 January 2010, Orlando, Florida, USA, https://doi.org/10.2514/6.2010-1376, 2012. a
Bianchi, S., Bianchini, A., Ferrara, G., and Ferrari, L.: Small Wind Turbines in the Built Environment: Influence of Flow Inclination on the Potential Energy Yield, vol. 8: Supercritical CO2 Power Cycles; Wind Energy, Honors and Awards, 3–7 June 2013, San Antonio, Texas, USA, v008T44A021, https://doi.org/10.1115/GT2013-95637, 2013. a
Brahimi, M. T. and Paraschivoiu, I.: Darrieus Rotor Aerodynamics in Turbulent Wind, J. Sol. Energ. Eng., 117, 128–136, https://doi.org/10.1115/1.2870839, 1995. a
Bravo, R., Tullis, S., and Ziada, S.: Performance testing of a small vertical-axis wind turbine, in: Proceedings of the 21st Canadian Congress of Applied Mechanics, 3–7, http://www.wind-works.org/cms/fileadmin/user_upload/Files/Reports/Performance_Testing_of_a_Small_Vertical-Axis_Wind_.pdf (last access: 31 July 2022), 2007. a
Dabiri, J. O.: Potential order-of-magnitude enhancement of wind farm power density via counter-rotating vertical-axis wind turbine arrays, J. Renew. Sustain. Ener., 3, 043104, https://doi.org/10.1063/1.3608170, 2011. a
Dessoky, A., Lutz, T., Bangga, G., and Krämer, E.: Computational studies on Darrieus VAWT noise mechanisms employing a high order DDES model, Renew. Energ., 143, 404–425, https://doi.org/10.1016/j.renene.2019.04.133, 2019. a, b
Ferreira, C. J. S., Bijl, H., van Bussel, G., and van Kuik, G.: Simulating Dynamic Stall in a 2D VAWT: Modeling strategy, verification and validation with Particle Image Velocimetry data, J. Phys. Conf. Ser., 75, 012023, https://doi.org/10.1088/1742-6596/75/1/012023, 2007. a
Gasch, R. and Twele, J.: Wind power plants: fundamentals, design, construction and operation, Springer Science & Business Media, 533–534, https://doi.org/10.1007/978-3-642-22938-1, 2011. a
Hohman, T., Martinelli, L., and Smits, A.: The effects of inflow conditions on vertical axis wind turbine wake structure and performance, J. Wind. Eng. Ind. Aerod., 183, 1–18, https://doi.org/10.1016/j.jweia.2018.10.002, 2018. a
Jameson, A., Schmidt, W., and Turkel, E.: Numerical solution of the Euler equations by finite volume methods using Runge Kutta time stepping schemes, 14th Fluid and Plasma Dynamics Conference, 23–25 June 1981, Palo Alto, CA, USA, https://doi.org/10.2514/6.1981-1259, 1981. a
Karadag, I. and Yuksek, I.: Wind Turbine Integration to Tall Buildings, in: Renew. Energ., edited by: Qubeissi, M. A., El-kharouf, A., and Soyhan, H. S., IntechOpen, Rijeka, chap. 20, https://doi.org/10.5772/intechopen.91650, 2020. a
KC, A., Whale, J., and Urmee, T.: Urban wind conditions and small wind turbines in the built environment: A review, Renew. Energ., 131, 268–283, https://doi.org/10.1016/j.renene.2018.07.050, 2019. a
Kern, L., Seebaß, J. V., and Schlüter, J.: Das Potenzial von vertikalen Windenergieanlagen im Kontext wachsender Flächennutzungskonflikte und Akzeptanzprobleme der Windenergie, Zeitschrift für Energiewirtschaft, 43, 289–302, https://doi.org/10.1007/s12398-019-00264-7, 2019. a
Kinzel, M., Mulligan, Q., and Dabiri, J. O.: Energy exchange in an array of vertical-axis wind turbines, J. Turbul., 13, N38, https://doi.org/10.1080/14685248.2012.712698, 2012. a
Kooiman, S. and Tullis, S.: Response of a Vertical Axis Wind Turbine to Time Varying Wind Conditions Found within the Urban Environment, Wind Engineering, 34, 389–401, https://doi.org/10.1260/0309-524X.34.4.389, 2010. a
Kowarsch, U., Oehrle, C., Hollands, M., Keßler, M., and Krämer, E.: Computation of Helicopter Phenomena Using a Higher Order Method, in: High Performance Computing in Science and Engineering `13, edited by: Nagel, W. E., Kröner, D. H., and Resch, M. M., Springer International Publishing, Cham, 423–438, https://doi.org/10.1007/978-3-319-02165-2, 2013. a
Letzgus, P., Lutz, T., and Krämer, E.: Detached Eddy Simulations of the local Atmospheric Flow Field within a Forested Wind Energy Test Site located in Complex Terrain, J. Phys. Conf. Ser., 1037, 072043, https://doi.org/10.1088/1742-6596/1037/7/072043, 2018. a
Li, Q., Maeda, T., Kamada, Y., Murata, J., Yamamoto, M., Ogasawara, T., Shimizu, K., and Kogaki, T.: Study on power performance for straight-bladed vertical axis wind turbine by field and wind tunnel test, Renew. Energ., 90, 291–300, https://doi.org/10.1016/j.renene.2016.01.002, 2016. a, b, c, d, e, f
Mann, J.: Wind field simulation, Probabilist. Eng. Mech., 13, 269–282, https://doi.org/10.1016/S0266-8920(97)00036-2, 1998. a
Menter, F. R.: Two-equation eddy-viscosity turbulence models for engineering applications, AIAA Journal, 32, 1598–1605, https://doi.org/10.2514/3.12149, 1994. a
Mertens, S., van Kuik, G., and van Bussel, G.: Performance of an H-Darrieus in the Skewed Flow on a Roof, J. Sol. Energ. Eng., 125, 433–440, https://doi.org/10.1115/1.1629309, 2003. a, b, c
Mithraratne, N.: Roof-top wind turbines for microgeneration in urban houses in New Zealand, Energ. Buildings, 41, 1013–1018, https://doi.org/10.1016/j.enbuild.2009.05.003, 2009. a
Möllerström, E., Ottermo, F., Goude, A., Eriksson, S., Hylander, J., and Bernhoff, H.: Turbulence influence on wind energy extraction for a medium size vertical axis wind turbine, Wind Energy, 19, 1963–1973, https://doi.org/10.1002/we.1962, 2016. a, b
Orlandi, A., Collu, M., Zanforlin, S., and Shires, A.: 3D URANS analysis of a vertical axis wind turbine in skewed flows, J. Wind Eng. Ind. Aerod., 147, 77–84, https://doi.org/10.1016/j.jweia.2015.09.010, 2015. a
Pagnini, L. C., Burlando, M., and Repetto, M. P.: Experimental power curve of small-size wind turbines in turbulent urban environment, Appl. Energ., 154, 112–121, https://doi.org/10.1016/j.apenergy.2015.04.117, 2015. a
Putnam, P. and Koeppl, G.: Putnam's Power from the Wind, Van Nostrand Reinhold, https://books.google.de/books?id=wOyyAAAAIAAJ (last access: 24 July 2022), 1982. a
Rezaeiha, A., Montazeri, H., and Blocken, B.: Characterization of aerodynamic performance of vertical axis wind turbines: Impact of operational parameters, Energ. Convers. Manage., 169, 45–77, https://doi.org/10.1016/j.enconman.2018.05.042, 2018. a, b, c
Roh, S.-C. and Kang, S.-H.: Effects of a blade profile, the Reynolds number, and the solidity on the performance of a straight bladed vertical axis wind turbine, J. Mech. Sci. Technol., 27, 3299–3307, https://doi.org/10.1007/s12206-013-0852-x, 2013. a
Rossow, C.-C., Kroll, N., and Schwamborn, D.: The MEGAFLOW Project – Numerical Flow Simulation for Aircraft, in: Progress in Industrial Mathematics at ECMI 2004, Springer, 3–33, https://doi.org/10.1007/3-540-28073-1_1, 2006. a
Shaw, R. H. and Schumann, U.: Large-eddy simulation of turbulent flow above and within a forest, Bound.-Lay. Meteorol., 61, 47–64, 1992. a
Siddiqui, M. S., Rasheed, A., Kvamsdal, T., and Tabib, M.: Effect of Turbulence Intensity on the Performance of an Offshore Vertical Axis Wind Turbine, Deep Sea Offshore Wind R&D Conference, EERA DeepWind'2015, Enrgy Proced., 80, 312–320, https://doi.org/10.1016/j.egypro.2015.11.435, 12th 2015. a
Siddiqui, M. S., Khalid, M. H., Zahoor, R., Butt, F. S., Saeed, M., and Badar, A. W.: A numerical investigation to analyze effect of turbulence and ground clearance on the performance of a roof top vertical–axis wind turbine, Renew. Energ., 164, 978–989, https://doi.org/10.1016/j.renene.2020.10.022, 2021. a
Toja-Silva, F., Colmenar-Santos, A., and Castro-Gil, M.: Urban wind energy exploitation systems: Behaviour under multidirectional flow conditions – Opportunities and challenges, Renewable and Sustainable Energy Reviews, 24, 364–378, https://doi.org/10.1016/j.rser.2013.03.052, 2013. a
Tosatto, A. and Chatzivasileiadis, S.: HVDC loss factors in the Nordic power market, Electr. Pow. Syst. Res., 190, 106710, https://doi.org/10.1016/j.epsr.2020.106710, 2021. a
Troldborg, N., Sørensen, J. N., Mikkelsen, R., and Sørensen, N. N.: A simple atmospheric boundary layer model applied to large eddy simulations of wind turbine wakes, Wind Energy, 17, 657–669, https://doi.org/10.1002/we.1608, 2014. a
van Wijk: Predicting the rooftop wind climate for urban wind energy in the Rotterdam-Delft-Zoetermeer region: new approaches for implementing urban height data in the wind atlas method, master thesis, http://resolver.tudelft.nl/uuid:53b24b47-c13d-4f8a-9cdd-8c39d7d210ee (last access: 24 July 2022), 2011. a
Weihing, P., Letzgus, J., Bangga, G., Lutz, T., and Krämer, E.: Hybrid RANS/LES Capabilities of the Flow Solver FLOWer – Application to Flow Around Wind Turbines, in: Progress in Hybrid RANS-LES Modelling, edited by: Hoarau, Y., Peng, S.-H., Schwamborn, D., and Revell, A., Springer International Publishing, Cham, 369–380, https://doi.org/10.1007/978-3-319-70031-1, 2018. a