the Creative Commons Attribution 4.0 License.
the Creative Commons Attribution 4.0 License.
 | 08 Nov 2022
Large-eddy simulation of a wind-turbine array subjected to active yaw control
Mou Lin
Fernando Porté-Agel
This study validates large-eddy simulation (LES) for predicting the flow through a wind turbine array subjected to active yaw control. The wind turbine array consists of three miniature wind turbines operated in both non-yawed and yawed configurations under full-wake and partial-wake conditions, for which wind tunnel flow measurements are available. The turbine-induced forces are parametrised by three different models: the standard actuator disk model (ADM-std), the blade element actuator disk model (ADM-BE), also referred to as the rotational actuator disk model (ADM-R), and the actuator line model (ALM). The time-averaged turbine power outputs and the profiles of the wake flow statistics (normalised streamwise mean velocity and streamwise turbulence intensity) obtained from the simulations using the ADM-std, the ADM-BE and the ALM are compared with experimental results. We find that simulations using the ADM-BE and ALM yield flow statistics that are in good agreement with the wind-tunnel measurements for all the studied configurations. In contrast, the results from LES with the ADM-std show discrepancies with the measurements obtained under yawed and/or partial-wake conditions. These errors are due to the fact that the ADM-std assumes a uniform thrust force, thus failing to capture the inherently inhomogeneous distribution of the turbine-induced forces under partial wake conditions. In terms of power prediction, we find that LES using the ADM-BE yields better power predictions than the ADM-std and the ALM in the cases considered in this study. As a result, we conclude that LES using the ADM-BE provides a good balance of accuracy and computational cost for simulations of the flow through wind farms subjected to AYC.
- Article
(5664 KB) - Full-text XML
- BibTeX
- EndNote


As an indispensable part of the global transition to carbon neutrality, wind power has experienced rapid in recent decades (GWEC, 2021). The majority of wind power projects are developed in the form of wind farms, i.e. a cluster of wind turbines installed within a designated area, with the generated electricity outputted to centralised substations before being transmitted into the grid. Compared with distributed wind power, which consists of installing stand-alone turbines in different locations, developing wind energy in wind farms has many advantages, such as reducing the construction and maintenance overhead per turbine. On the other hand, wind turbines in wind farms often encounter wake interference, i.e. wind turbines are exposed to the wakes of upwind turbines. This phenomenon can cause significant power losses and increase fatigue loads, and it has become the subject of many studies of wind farm flows (Barthelmie and Jensen, 2010; Archer et al., 2018; Porté-Agel et al., 2020). Active yaw control (AYC), or active wake steering, is a wake-interference mitigation strategy that is drawing increasing interest from the research community. In this strategy, the upwind wind turbines are intentionally yawed to deflect their wakes away from downwind turbines. With a proper yawed configuration, the reduced power outputs from the yawed upwind turbines can be compensated for by the increased power output from the downwind turbines. Therefore, a net power gain for the entire wind farm can be achieved.
Various early studies (Grant et al., 1997; Grant and Parkin, 2000) have revealed that the characteristics of the wake of a yawed turbine are significantly different from those of its non-yawed counterpart. Most notably, the yawed wake is deflected to the downwind-inclined side of the rotor. Medici and Alfredsson (2006) indicated the potential of exploiting this phenomenon to optimise wind farm power using active yaw control, and he validated this concept with wind tunnel experiments. Since then, there has been a push in the wind energy community towards understanding the wake characteristics of yawed turbines. Jiménez et al. (2010) first derived an analytical wake model based on the top-hat velocity profile as an extension to the well-known Jensen wake model (Jensen, 1983) for non-yawed turbines. Bastankhah and Porté-Agel (2016) performed a wind tunnel study of a yawed miniature wind turbine in a turbulent boundary layer flow, and they found that the time-averaged profiles of the velocity deficit and the wake skew angle are Gaussian and self-similar in the far wake region. Exploiting this phenomenon, they developed a closed-form analytical model for the velocity deficit profiles of yawed turbines. Comparing with the top-hat Jimenez model, they found that the Gaussian model results are in better agreement with the measurements. Zong and Porté-Agel (2020a) developed a momentum-conserving method to superpose the wake velocity deficits behind multiple yawed turbines. Qian and Ishihara (2018) developed a bi-Gaussian parametric model for the turbulence intensity distribution in the wake of a yawed turbine. In a follow-up study, Qian and Ishihara (2021) also proposed a superposition model for predicting the turbulence intensity in the wakes of multiple yawed turbines. The Qian and Ishihara model is based on the principle of the linear sum of squares of the added turbulence intensity, and it introduces a parametric correction for partial-wake scenarios.
Another distinctive feature of the wake of a yawed turbine is the formation of a counter-rotating vortex pair (CVP), which is induced by the lateral forces applied by the yawed turbine. Howland et al. (2016) carried out wind tunnel experiments on a yawed permeable disk in laminar inflows. They found that the permeable disk's wake is significantly asymmetrical, or “curled”, in the spanwise direction. The presence of the CVP deforms the curled wake. Bastankhah and Porté-Agel (2016) also observed the CVP in the wind tunnel study of a yawed miniature wind turbine immersed in a turbulent boundary-layer flow. The curled wake pattern can sustain itself beyond the near-wake region and can still be observed at the location where a downwind turbine can be installed. Motivated by these experimental results, researchers made several efforts to incorporate the physics of the CVP into yawed wake modelling. Shapiro et al. (2018) treated the yawed turbine as a surface with an elliptic vorticity distribution and used lifting line theory to model the CVP formation. Based on the vorticity distribution proposed by Shapiro et al. (2018), Martínez-Tossas et al. (2019) developed a curled-wake model by solving the linearised Euler equations. King et al. (2021) derived an analytical approximation of the model of Martínez-Tossas et al. (2019) and formulated a reduced-order curled wake model that is computationally efficient. Zong and Porté-Agel (2020b) investigated the physics of the CVP in wind tunnel experiments and developed a point-vortex transportation model that reproduces the formation mechanism of the top-down asymmetric kidney-shaped wake behind a yawed turbine.
Besides experimental and theoretical approaches, numerical modelling is also a popular approach among researchers studying AYC. Large-eddy simulation (LES), due to its relatively high fidelity, is widely used to investigate wind turbine wakes. In LES, the turbine-induced forces can be represented by three main models. Jiménez et al. (2010) were the first to use a standard actuator disk model (ADM-std), which assumes a uniform distribution of the thrust force on the rotor disk, to parametrise the yawed turbine-induced forces in LES. The ADM-std was also adopted by other researchers studying the wakes of multiple turbines (Munters and Meyers, 2018; Stevens et al., 2018; Boersma et al., 2019). As an improvement to the ADM-std, the blade element actuator disk model (ADM-BE), also referred to as the rotational actuator disk model (ADM-R), was proposed by Wu and Porté-Agel (2011) and Porté-Agel et al. (2011). This uses the blade element theory to parametrise the non-uniform thrust and tangential forces on the turbine rotor in LES. The ADM-BE was later applied by Fleming et al. (2018) to study the large-scale trailing vortices in yawed wind turbine wakes. The actuator line model (ALM), proposed by Sørensen and Shen (2002), is also a widely used method in LES studies of yawed turbines (Fleming et al., 2016; Wang et al., 2017; Stevens et al., 2018; Archer and Vasel-Be-Hagh, 2019). The ALM parametrises the rotor-induced forces on line elements distributed along each blade. Unlike LES using the ADM, LES using the ALM can produce the tip vortices in the near-wake region. However, LES using the ALM also requires higher temporal and spatial resolution than its ADM counterpart (Martínez-Tossas et al., 2017), thus consuming substantially more computational resources.
Lin and Porté-Agel (2019) have previously validated an LES framework using the ADM-BE to simulate the wake of a stand-alone wind turbine subjected to AYC. Since the ultimate goal of AYC is to be applied to wind farms, it is natural to extend the validation to multiple turbines. This study compares the results of LES using different turbine parametrisations (ADM-std, ADM-BE and ALM) with wind tunnel measurements of a three-turbine array (Zong and Porté-Agel, 2021) in different turbine layouts and yawed configurations.
The rest of the paper is structured as follows: Section 2 discusses the numerical configurations used in the simulations and the methodology for evaluating the power output. Section 3 presents the simulation results obtained from LES using different turbine parametrisations and compares them with wind tunnel measurements. Section 4 presents the conclusions drawn from these results and discusses the possible extension of this work.
2.1 Governing equations
A GPU-accelerated version of the WiRE-LES code is used in this study. The code was developed at the Wind Engineering and Renewable Energy Laboratory (WiRE) of the École Polytechnique Fédérale de Lausanne (EPFL), and it has been used and validated in previous studies of wind turbine wakes, e.g. in Wu and Porté-Agel (2011), Porté-Agel et al. (2011), Abkar and Porté-Agel (2015) and Lin and Porté-Agel (2019).
The WiRE-LES solves the spatially filtered incompressible Navier–Stokes (N-S) equations:
in which is the spatially filtered velocity (, representing the streamwise, spanwise and vertical directions, respectively); is the modified kinematic pressure; fi is the body force exerted by the wind turbine on the flow; and Fp is the pressure gradient imposed to drive the flow. is the kinematic sub-grid scale (SGS) stress, which is parametrised using the modulated gradient model (MGM) proposed by Lu and Porté-Agel (2010):
in which is defined as follows:
and ksgs is the zero-clipped SGS kinetic energy:
in which is an indicator function that takes a value of 1 if and 0 if . is the filtered strain rate. is defined as , in which , and are the filter widths in the streamwise, spanwise and vertical directions. Cϵ=1.6 is the model coefficient obtained from the simulations of the ABL flow using dynamic procedures (Lu and Porté-Agel, 2014).
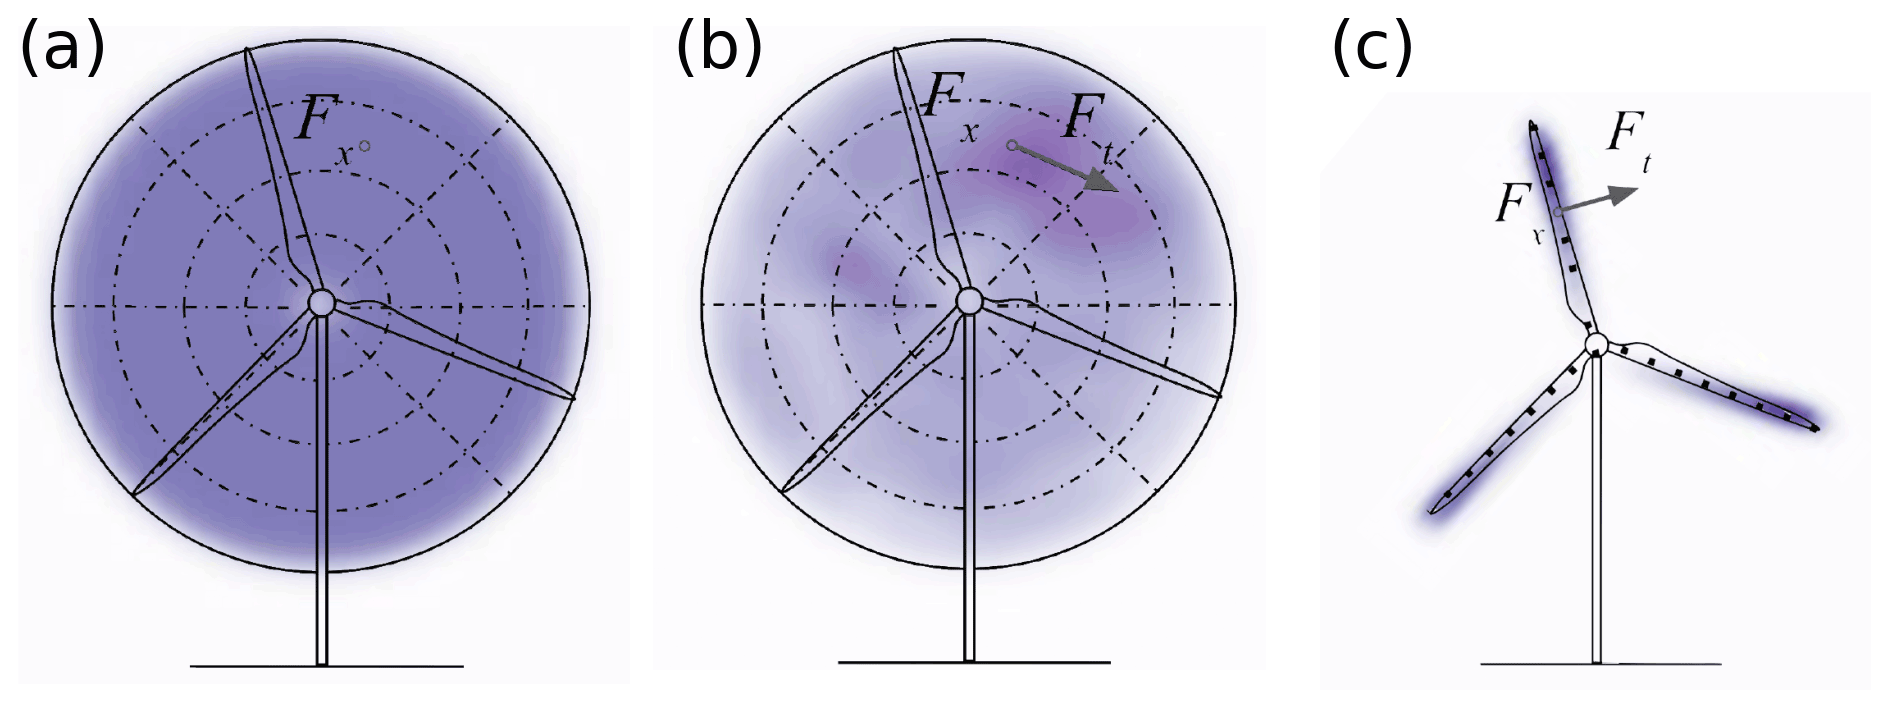
Figure 1 Schematic representation of the three wind turbine parametrisations used in WiRE-LES: (a) the ADM-std; (b) the ADM-BE; (c) the ALM. To illustrate the differences in the distribution of the forces computed using the three models, the normalised contours of the instantaneous force distribution (normalised by the respective maximum value) induced by each model are plotted.
2.2 Wind turbine parametrisation
In the WiRE-LES, three different types of wind turbine parametrisation are implemented (Fig. 1): the ADM-std, the ADM-BE and the ALM. In the ADM-std, a wind turbine is modelled as a permeable disk with thrust forces uniformly distributed within the rotor diameter. The magnitude of the thrust force is computed as
in which ρ is the air density; A is the sweeping area of the rotor disk; CT is the thrust coefficient of the wind turbine; and Uin is the incoming wind speed. Since the turbines in wind farms often operate in the wakes of upwind turbines, their incoming velocities are retrieved as follows:
in which Uloc is the local disk-averaged velocity at the rotor, and a is the induction factor estimated from the thrust coefficient:
Using the reconstructed inflow velocity, we update the thrust coefficient and the power coefficient of the turbine by interpolating the thrust and power curves of the WiRE-01 miniature wind turbine (Bastankhah and Porté-Agel, 2016).
In the ADM-BE, the turbine-induced forces are parametrised using the blade element theory. In contrast with the ADM-std, the forces in the ADM-BE are computed from the local velocity information and the aerodynamic properties of each blade element. As a result, the forces are non-uniform across the rotor. Furthermore, the ADM-BE takes the thrust forces into account and models the tangential forces on the rotor. As a result, the ADM-BE introduces wake rotation in the wake of a turbine. After subdividing the rotor into an axisymmetric grid, the ADM-BE computes the local thrust force Fx and the local tangential force Ft as follows:
in which Uref is the resultant inflow velocity at a given blade section; c is the chord length; σ is the solidity of the blade section; Φ is the Prantl tip-loss correction factor; ϕ is the angle between the relative axial and tangential velocity components at the blade element; and CL and CD are the lift and drag coefficients interpolated from a 2D tabular dataset (Revaz et al., 2020) using the angle of attack (AoA) at a given blade element. A more detailed description of the ADM-BE and its application in yawed turbines can be found in Wu and Porté-Agel (2011) and Lin and Porté-Agel (2019).
The ALM computes the turbine-induced forces on line elements distributed on the moving turbine blades. The normal and the tangential forces on each source point are also computed from the blade element theory:
Notice that the solidity σ in the ADM-BE equations is replaced by the width of the blade sections w in the ALM equations.
2.3 Case configuration
In this study, four simulation cases are set up to reproduce the boundary-layer wind tunnel experiments of a wind turbine array subjected to active yaw control described by Zong and Porté-Agel (2021). The wind turbine array consists of three WiRE-01 miniature wind turbines. The diameter of the turbine D=0.15 m, and the hub height Zhub=0.125 m. Each turbine is separated from the closest neighbouring turbines by a constant distance Sx=5D in the streamwise direction.
Table 1Case configurations of the wind tunnel experiments, with the specifications of the lateral offset Sy, the yaw angles and the rotational speeds .
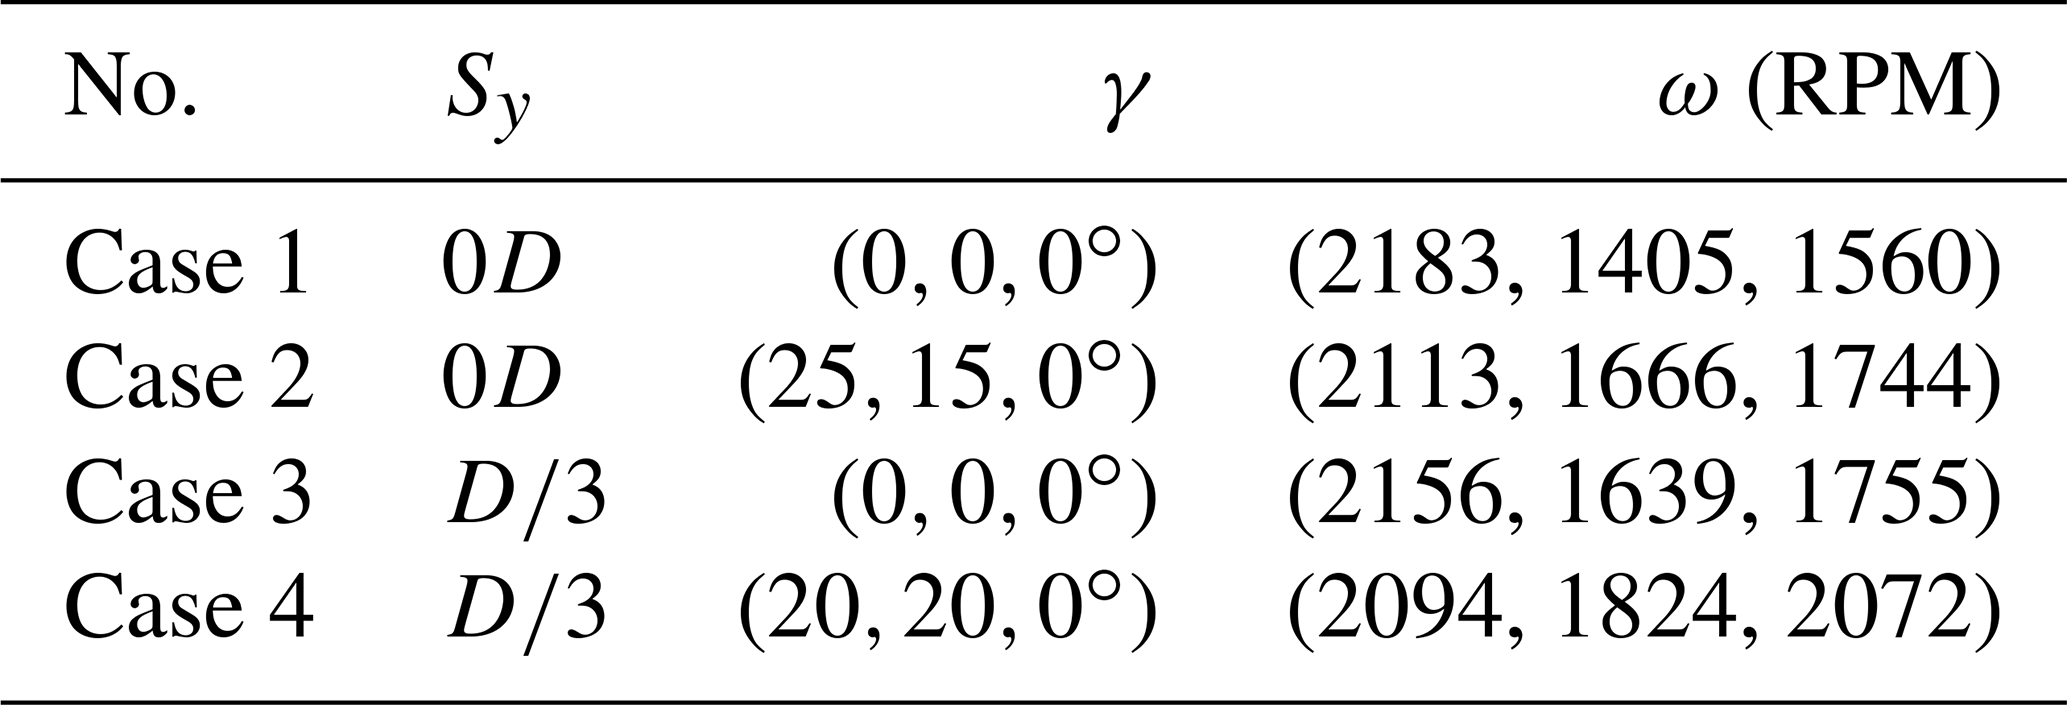
The configurations of the cases are summarised in Table 1. In Cases 1 and 2, the turbine rotor locations are aligned in the streamwise direction (i.e. lateral offset Sy=0D), while a lateral offset is applied in Cases 3 and 4. In Cases 1 and 3, no active yaw control is applied (i.e. zero yaw angle for all turbines), while yawing configurations of and are applied in Cases 2 and 4, respectively. These were found to be the optimal yawing strategies that maximised the overall power output from the experiments (Zong and Porté-Agel, 2021). The wind turbine rotational speeds ω are also chosen to match those of the experiments.
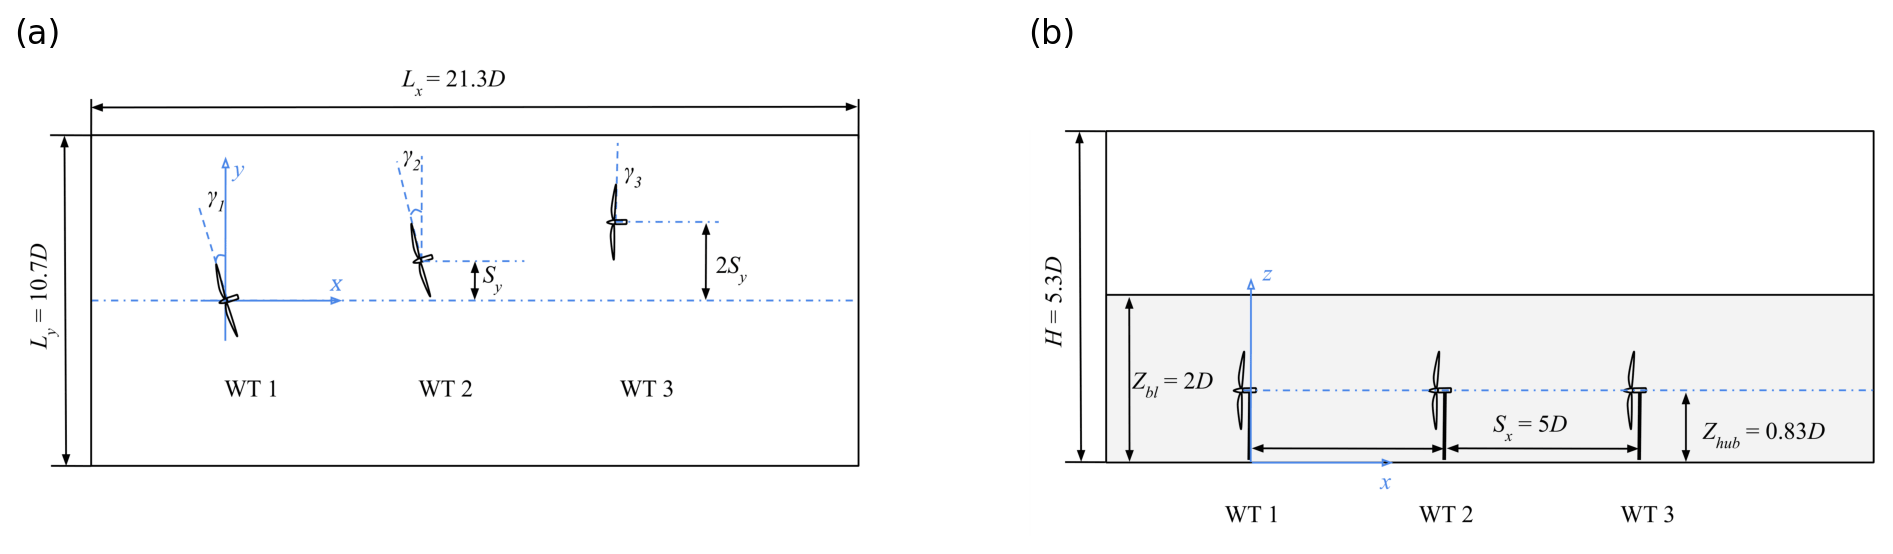
Figure 2 Schematic plots of the simulation domain (not to scale): (a) top view; (b) side view.
Schematics of the simulation domain are shown in Fig. 2. The size of the domain in the streamwise direction is 21.3D. To minimise the blockage effect, the size of the simulation domain is 10.7D in the spanwise direction and 5.3D in the vertical direction. The pressure gradient is imposed up to the height Zbl=0.3 m to create a boundary layer with the same height as in the experiments. The friction velocity m s−1 and the roughness length m in the LES cases are chosen so that the streamwise mean inflow velocity and the streamwise turbulence intensity at the hub height match the wind tunnel measurements (Fig. 3).

Figure 3 Vertical profiles of the streamwise mean velocity and the streamwise turbulence intensity Iu. Solid blue lines represent the LES results and red dots represent the corresponding measurement data at the hub height.
2.4 Numerical configuration
In the WiRE-LES, the spatially filtered N-S equations are solved by the pseudospectral method in the horizontal directions and by the second-order finite-difference method in the vertical direction. Explicit time integration is carried out using the Adams–Bashforth method. Such a choice of numerical schemes has also been applied and validated in previous wind turbine wake flow studies (Wu and Porté-Agel, 2011; Lin and Porté-Agel, 2019).
The simulation domain is discretised into a uniform grid with cell numbers of in the streamwise, spanwise and vertical directions, respectively. Since the rule is applied in the spectral filter in the horizontal directions for the de-aliasing, the ratio between the filter size and the grid size (Δ) in the horizontal directions is . In the vertical direction, the ratio is . Therefore, the aspect ratio of the grid is and the aspect ratio of the filter is . In the spanwise direction, the ratio of the rotor diameter to the filter size is , and the ratio to the grid size is . In the vertical direction, the ratios of the rotor diameter to the filter size and the grid size are . The time step is chosen such that the Courant number is kept around 0.1. The total simulated physical time is 15 min, and the last 10 min of the simulation are used to obtain flow statistics and power outputs.
Periodic boundary conditions are used at the lateral boundaries in the horizontal directions (x and y). In the vertical direction (z), a slip-wall condition is imposed at the top boundary, and a no-penetration wall is applied at the bottom boundary with a specified stress based on the logarithmic law of the wall. A precursor method is used to generate the turbulent inflow for the simulation (Wu and Porté-Agel, 2011; Porté-Agel et al., 2013; Abkar and Porté-Agel, 2015), and a shifting boundary method is applied (Munters et al., 2016) at the inflow to mitigate the formation of spurious locked-in streak-like structure (Fang and Porté-Agel, 2015).
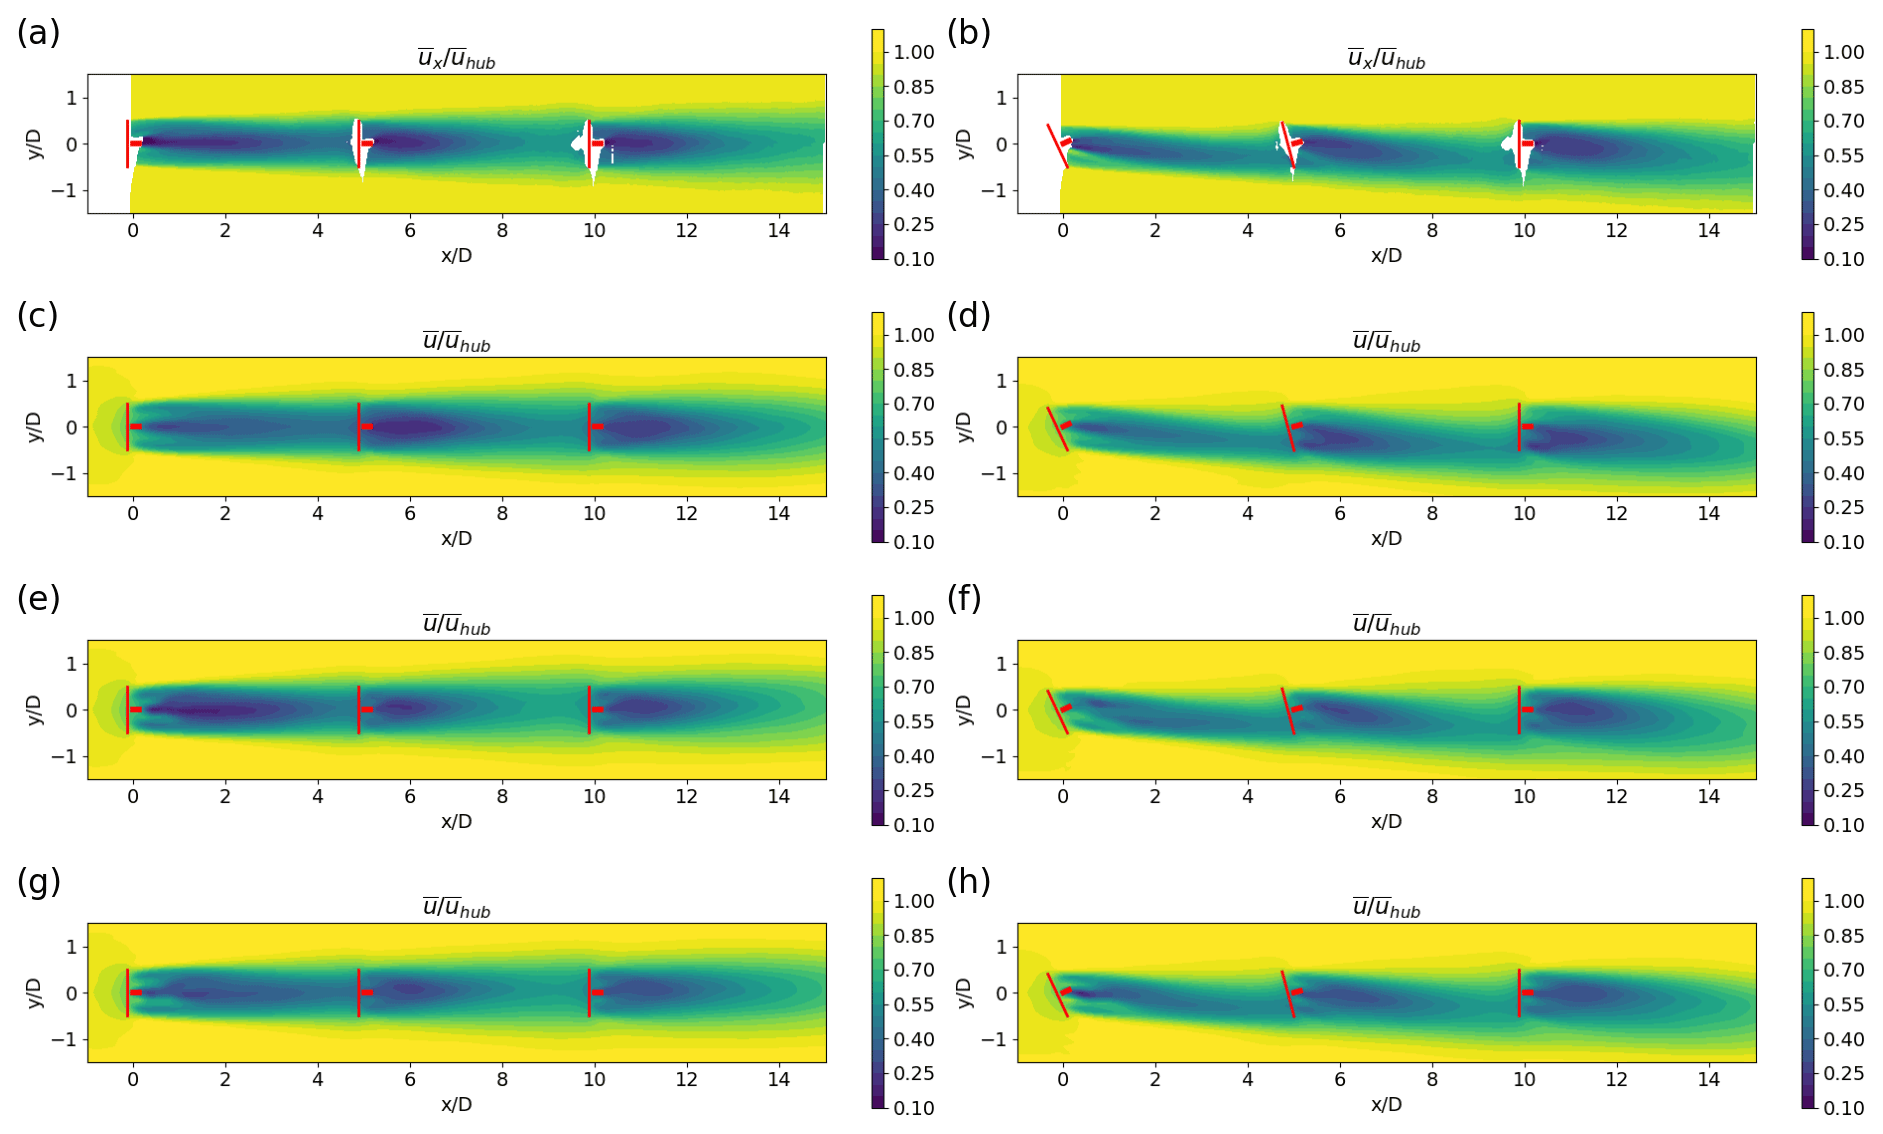
Figure 4Contours of the normalised streamwise mean velocity in the x−y plane at hub height obtained from the wind-tunnel experiments and LES using the ADM-std, ADM-BE and ALM. The lateral offset of the turbines is zero (Cases 1 and 2). (a) Experiment, ; (b) experiment, ; (c) the ADM-std, ; (d) the ADM-std, ; (e) the ADM-BE, ; (f) the ADM-BE, ; (g) the ALM, ; (h) the ALM, .
3.1 Mean velocity
For the cases with zero lateral offset (Cases 1 and 2), contours of the normalised streamwise mean velocity in the x−y plane at hub height are shown in Fig. 4. In Case 1, the turbines are not yawed, and the turbine array is aligned with the inflow direction. The second and the third turbines are fully exposed to the wakes of their upwind turbines. In Case 2, with the yaw angles , the wakes of the yawed turbines are redirected to the side where the turbine rotor plane is inclined into the downwind direction. As a result, the second and the third turbines in Case 2 are partially exposed to the wakes of their respective upwind turbines.
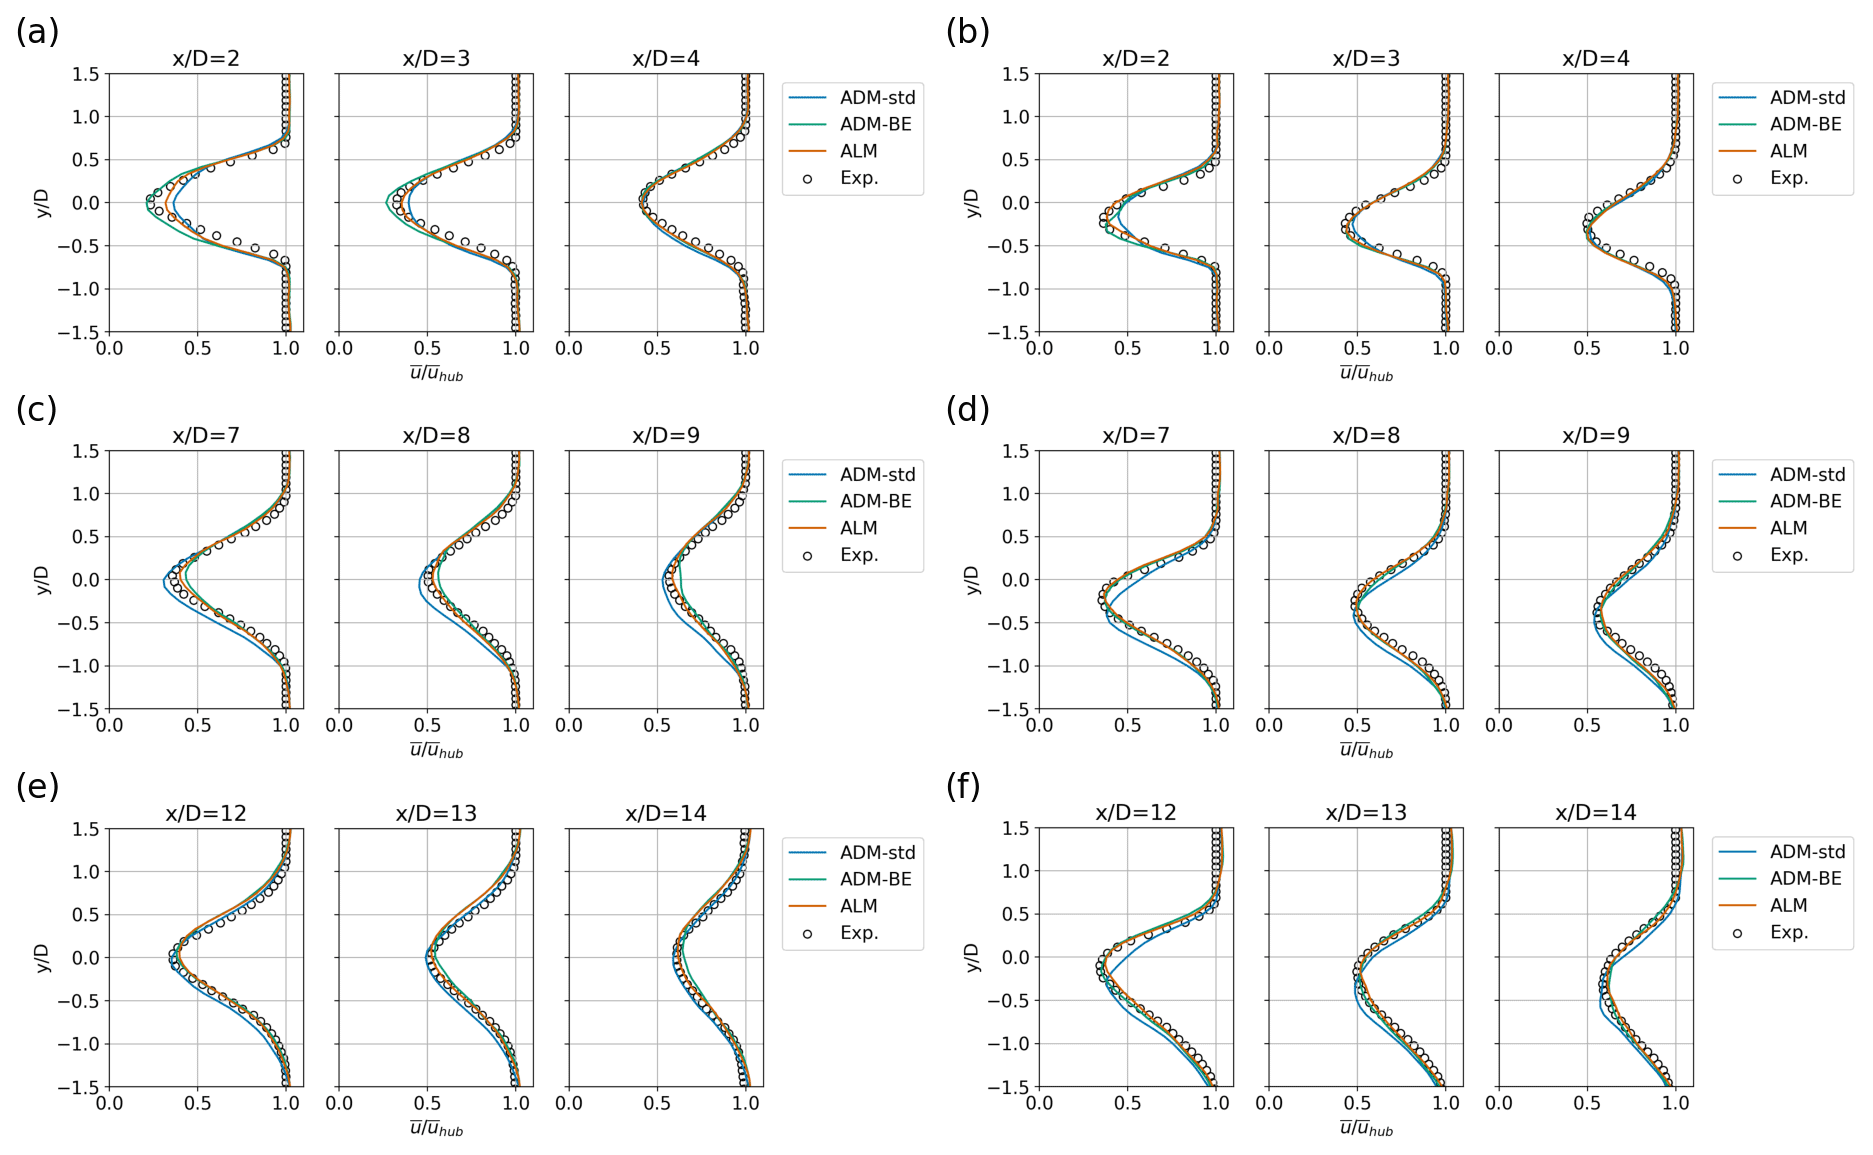
Figure 5Spanwise profiles of the normalised streamwise mean velocity in the x−y plane at hub height obtained from the wind-tunnel experiments and LES using the ADM-std, ADM-BE and ALM. The lateral offset of the turbines is zero (Cases 1 and 2). (a) WT 1, ; (b) WT 1, ; (c) WT 2, ; (d) WT 2, ; (e) WT 3, ; (f) WT 3, .
Spanwise profiles of the normalised streamwise mean velocity at hub height are shown in Fig. 5. Behind the first turbine, we find that the maximum velocity deficits are slightly underestimated by LES using the ADM-std in the near wake for both non-yawed (Fig. 5a) and yawed configurations (Fig. 5b). As the wake develops further downstream, the results of the three models converge to the measurements. Behind the second turbine, the wakes of the turbine parametrised by the ADM-std have slightly larger velocity deficits and wake widths compared to the measurements in the non-yawed configuration (Fig. 5c). In the yawed configuration (Fig. 5d), the velocity deficits obtained from LES using the ADM-std are overestimated on the side where the turbine rotor is inclined downwind and are underestimated on the upwind-inclined side. As a result, the velocity profiles are further shifted to the negative spanwise (y) direction than the measurements. Behind the third turbine, the three models yield reasonable predictions of the mean velocity in the non-yawed configuration (Fig. 5e), while the ADM-std again produces an unrealistic shift in the velocity profiles in the yawed configuration (Fig. 5f).
.

Figure 6Top-view contours of the normalised streamwise mean velocity in the x−y plane at hub height obtained from the wind-tunnel experiments and LES using the ADM-std, ADM-BE and ALM. The wind turbines are offset in the spanwise direction with a distance of (Cases 3 and 4). (a) Experiment, ; (b) experiment, ; (c) the ADM-std, ; (d) the ADM-std, ; (e) the ADM-BE, ; (f) the ADM-BE, ; (g) the ALM, ; (h) the ALM, .
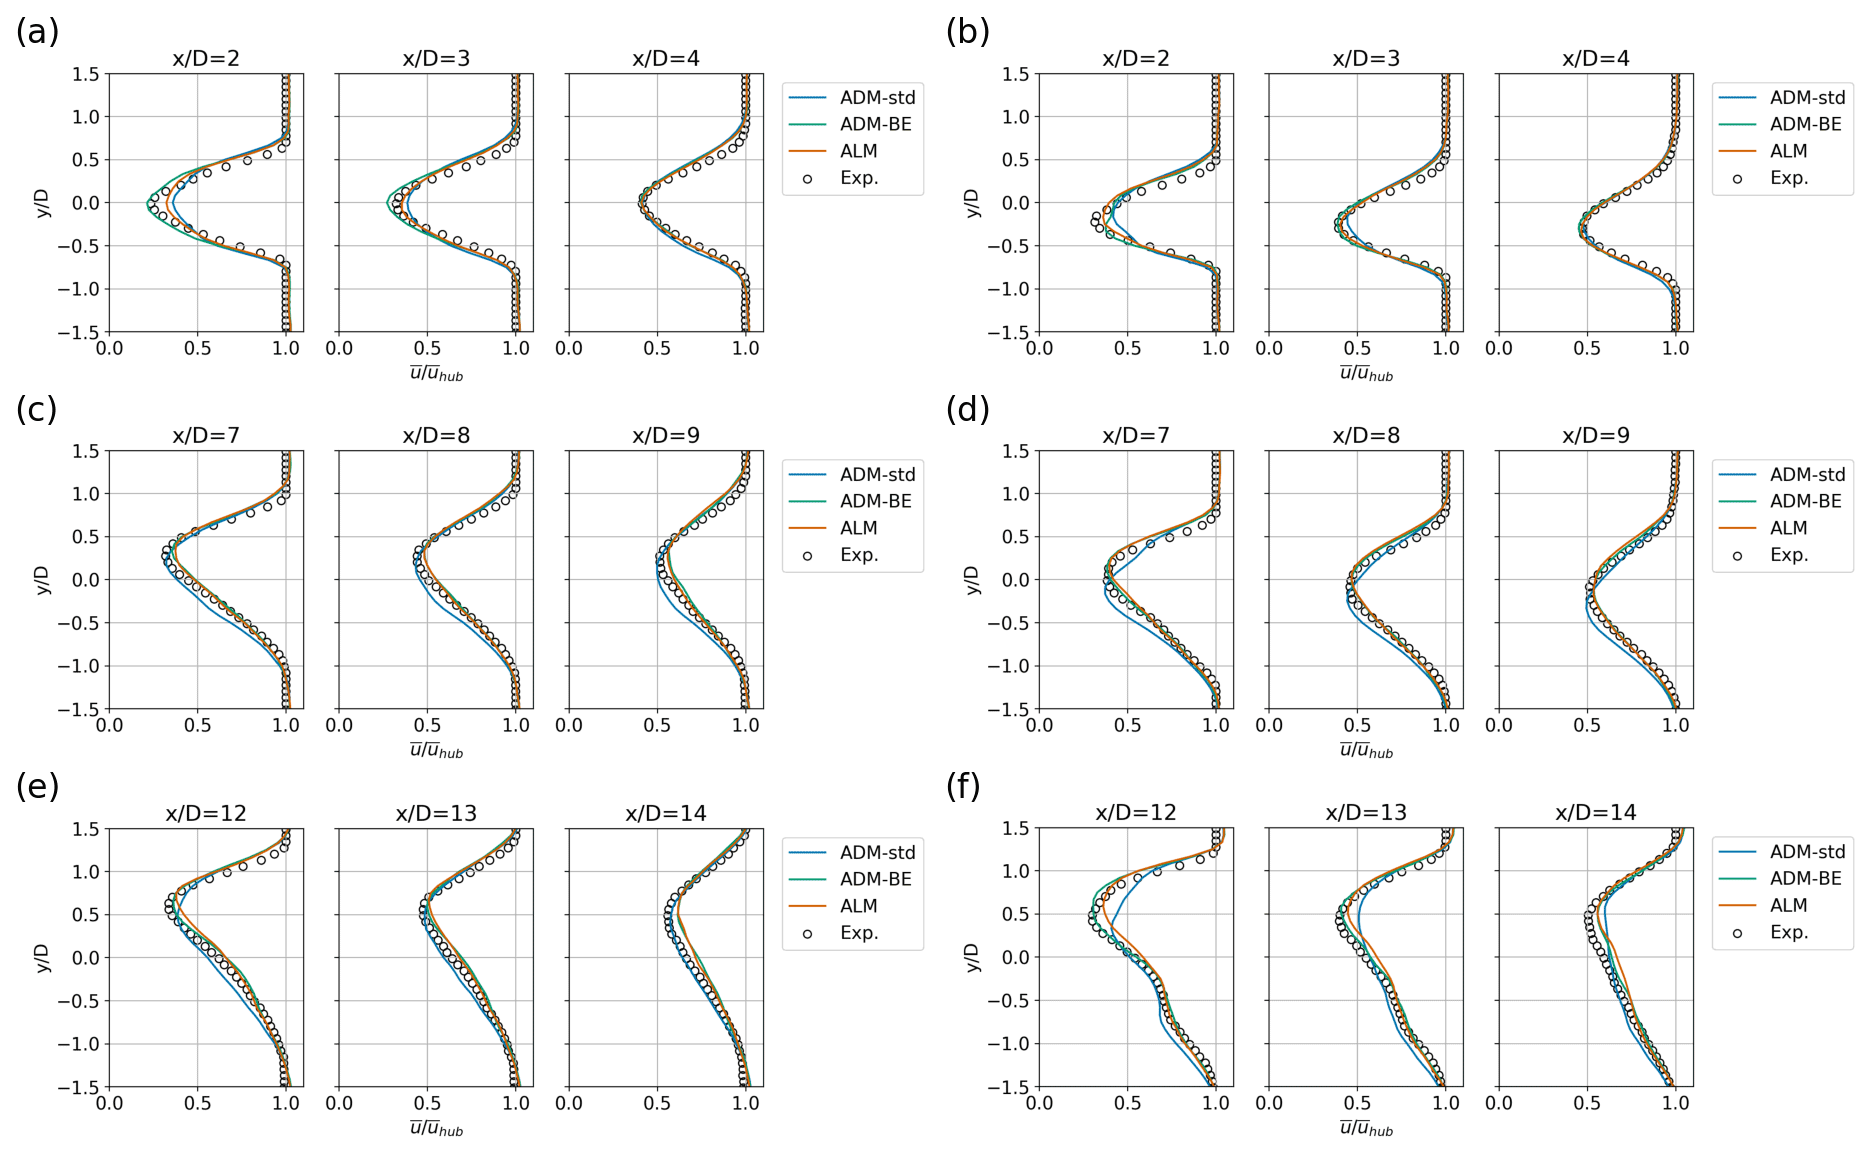
Figure 7Profiles of the normalised streamwise mean velocity in the x−y plane at hub height obtained from the wind-tunnel experiments and LES using the ADM-std, ADM-BE and ALM. The wind turbines are offset in the spanwise direction with a distance of (Cases 3 and 4). (a) WT 1, ; (b) WT 1, ; (c) WT 2, ; (d) WT 2, ; (e) WT 3, ; (f) WT 3, .
Figures 6 and 7 compare measured and simulated contours and spanwise profiles of the mean velocity, respectively, for the partial-wake cases under consideration. Due to the lateral offset of the turbines, the second and the third turbines are partially exposed to the incoming wakes in both non-yawed and yawed configurations. In Cases 3 and 4, where the partial-wake condition occurs, shifted velocity profiles with respect to the measurements are observed in the wakes of the second and the third turbines parametrised by the ADM-std. Furthermore, an underestimation of the velocity deficits is also observed in the wake of the third turbine parametrised by the ADM-std in Case 4.
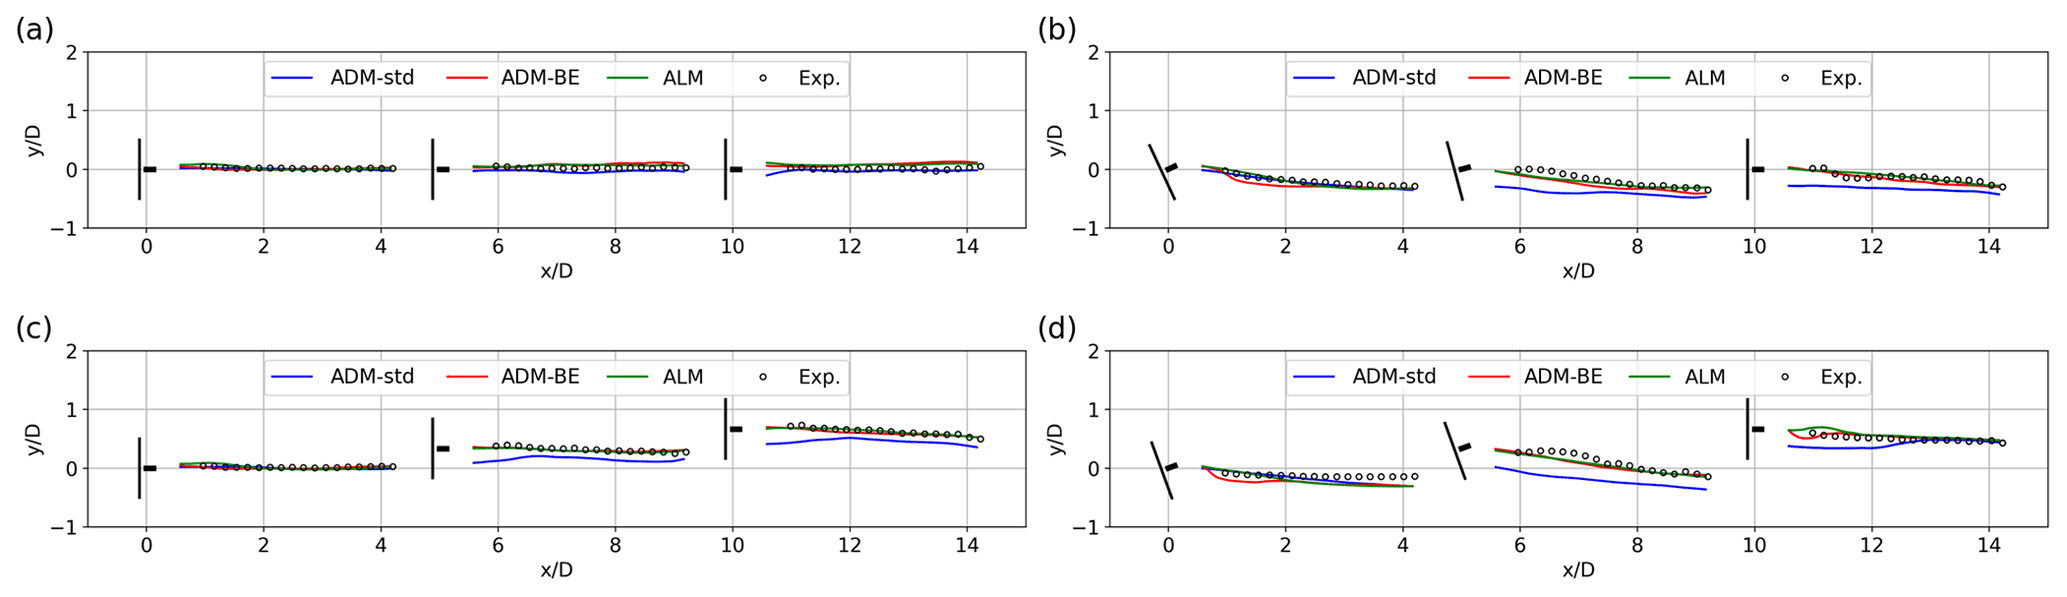
Figure 8Trajectories of maximum velocity deficit location obtained from the wind-tunnel experiments and LES using the ADM-std, ADM-BE and ALM. (a) Case 1: , zero offset; (b) Case 2: , zero offset; (c) Case 3: , offset; (d) Case 4: , offset.
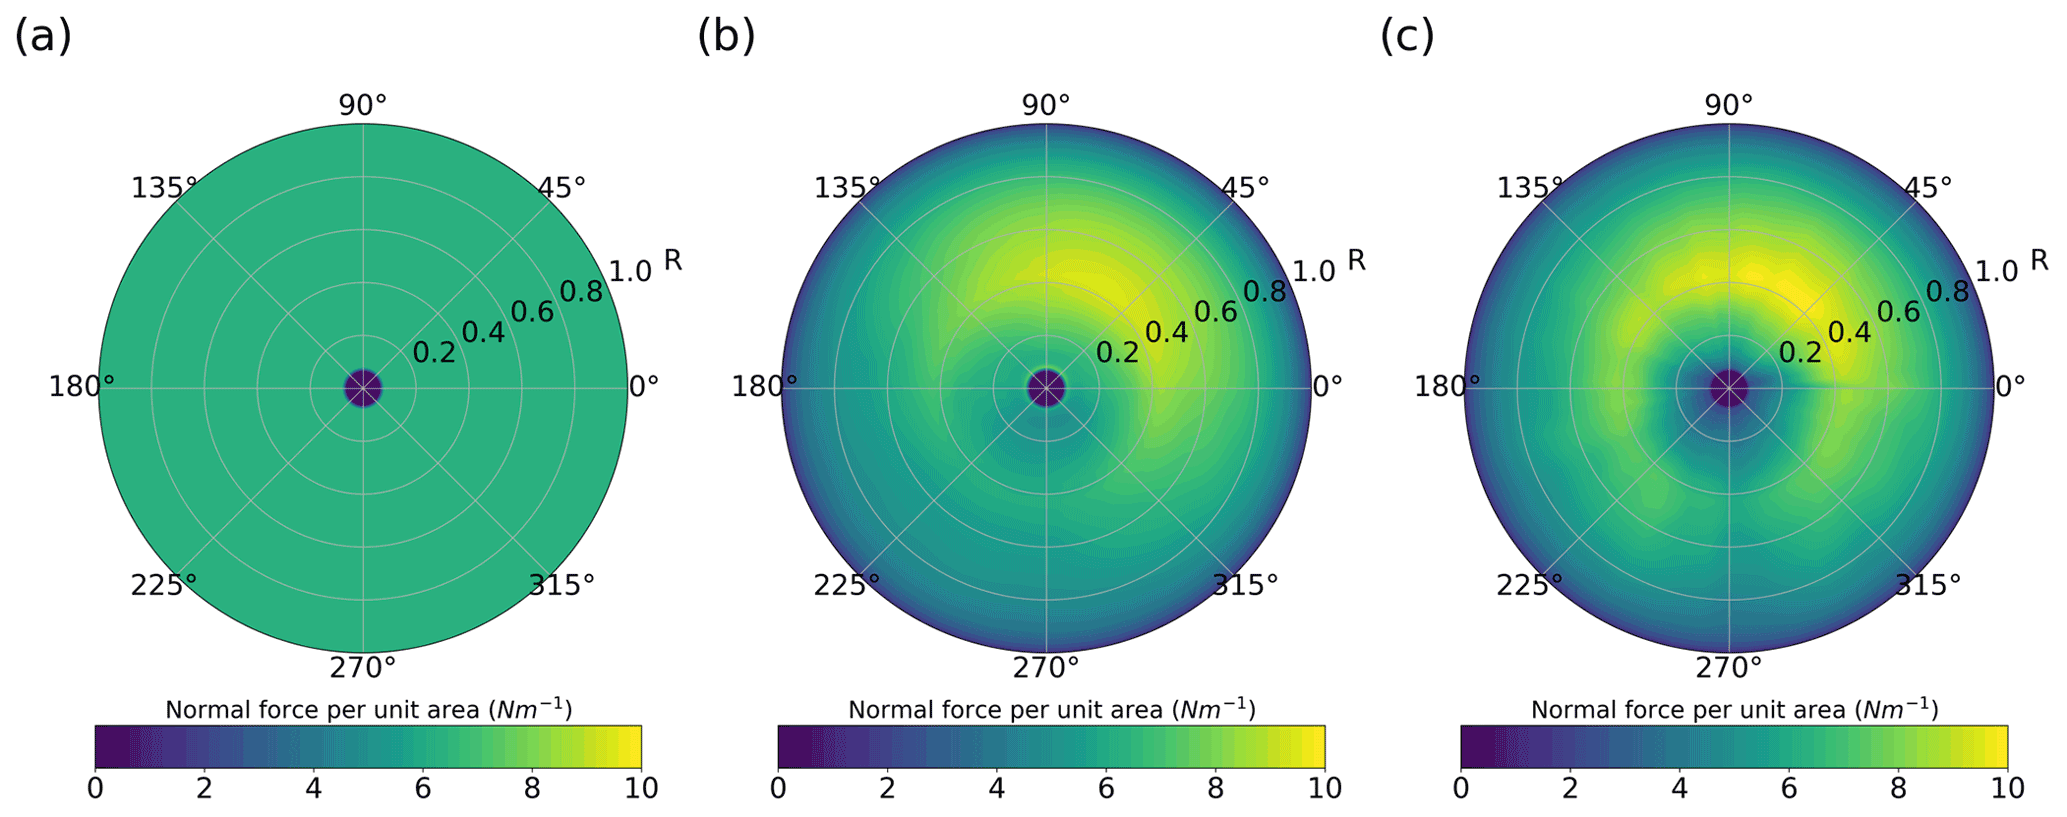
Figure 9Back-view contours of the time-averaged normal force per unit area on the rotor disk of WT 3 in Case 2. The turbine forces are parametrised by (a) the ADM-std; (b) the ADM-BE; (c) the ALM.
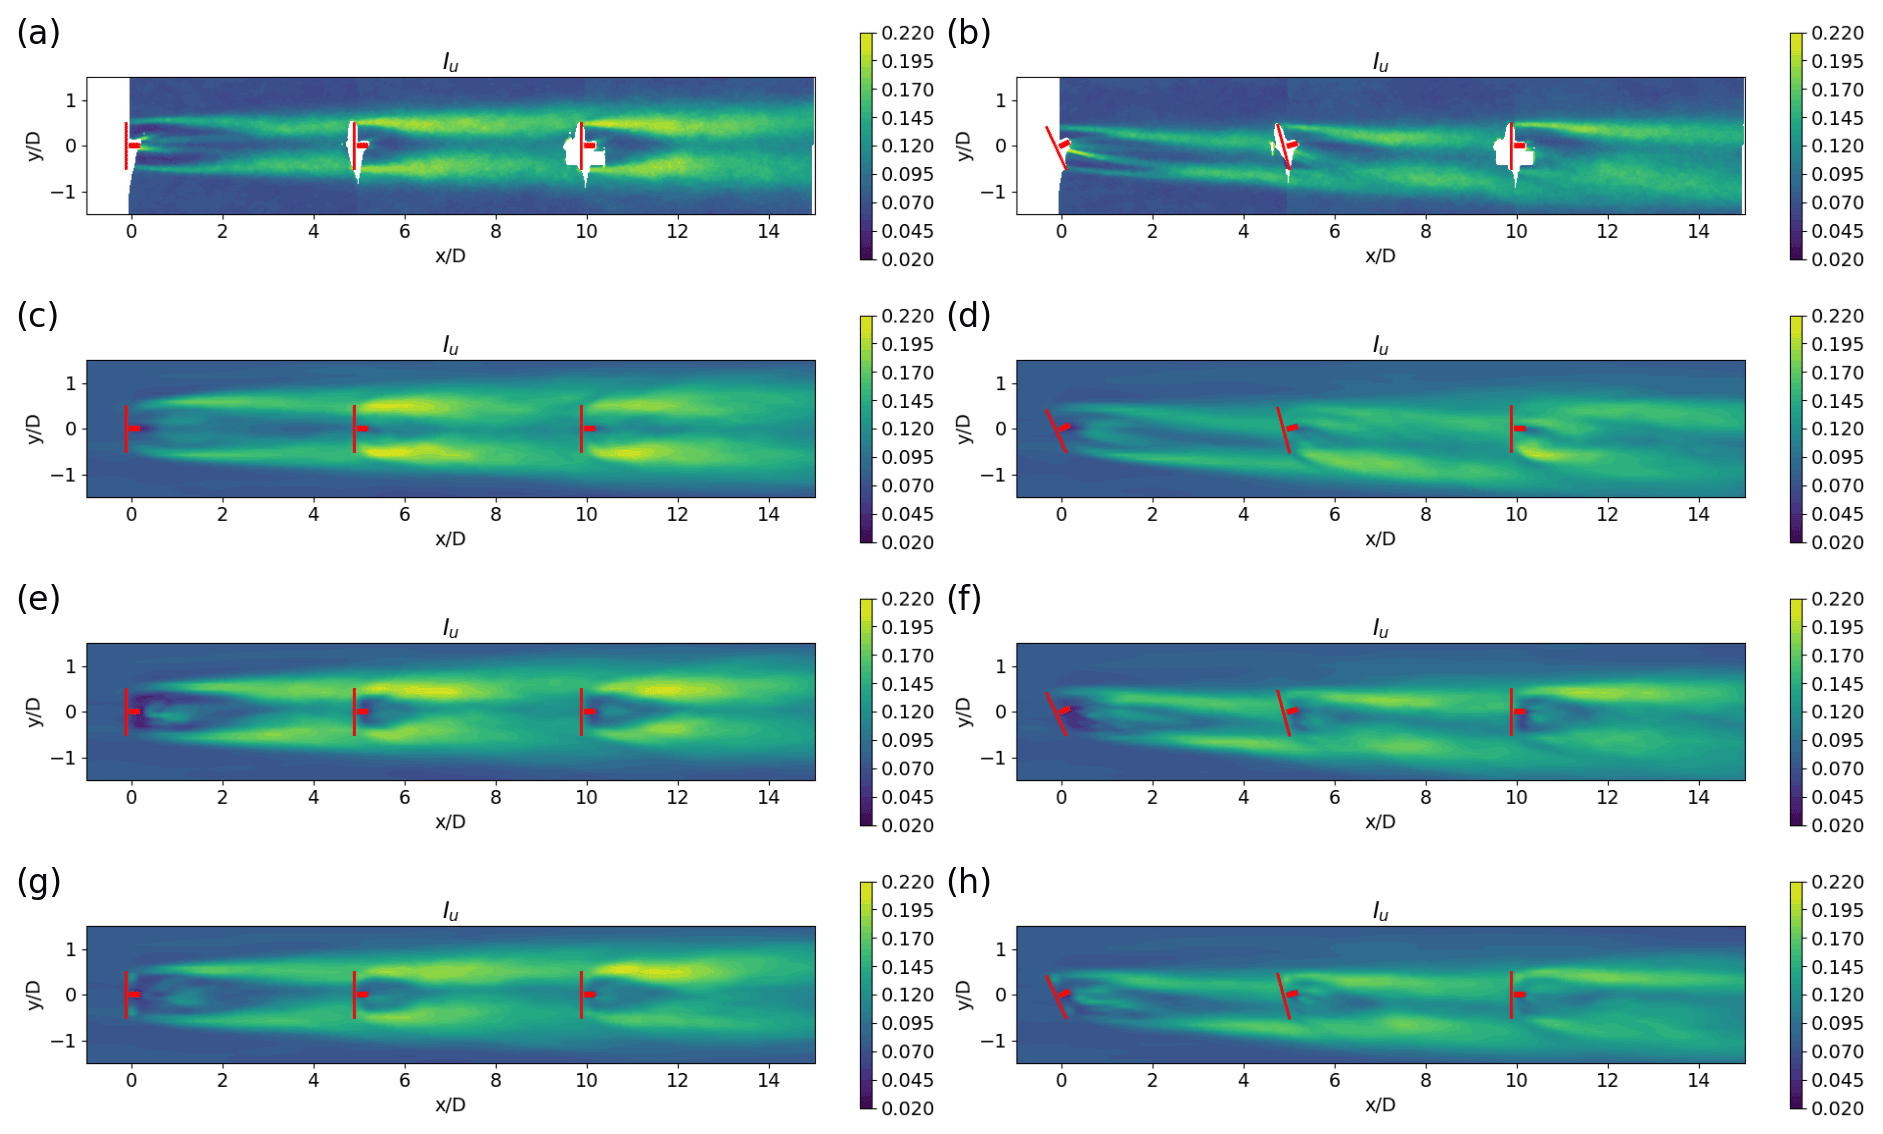
Figure 10Top-view contours of the turbulence intensity Iu in the x−y plane at hub height obtained from the wind-tunnel experiments and LES using the ADM-std, ADM-BE and ALM. The lateral offset of the turbines is zero (Cases 1 and 2). (a) Experiment, ; (b) experiment, ; (c) the ADM-std, ; (d) the ADM-std, ; (e) the ADM-BE, ; (f) the ADM-BE, ; (g) the ALM, ; (h) the ALM, .
Figure 8 shows the trajectories of the location of the maximum velocity deficit in the wake in different configurations. The trajectories obtained from LES using the ADM-BE and the ALM are in good agreement with the measurements. On the other hand, the trajectories obtained from LES using the ADM-std are shifted from the measurements behind the turbines in partial wake conditions. This is consistent with the shifted pattern observed in the velocity profiles (Figs. 5 and 7). This observation can be explained by a key model assumption of the ADM-std: the turbine-induced forces are modelled as thrust forces uniformly distributed on the rotor disk. To illustrate this point, we plot the time-averaged thrust forces per unit area on the rotor disk of WT 3 in Case 2, which is a turbine partially exposed to the wake of its upstream turbine (Fig. 9). We can see that the normal thrust force parametrised by the ADM-std (Fig. 9a) is uniform on the rotor. By contrast, the forces parametrised by the ADM-BE (Fig. 9b) and the ALM (Fig. 9c) have non-uniform distributions on the rotor: specifically, larger thrust forces are found on the right side of the contours. The differences in the thrust force distribution lead to a shift from the measurements in the maximum velocity deficit trajectories in the cases using the ADM-std.
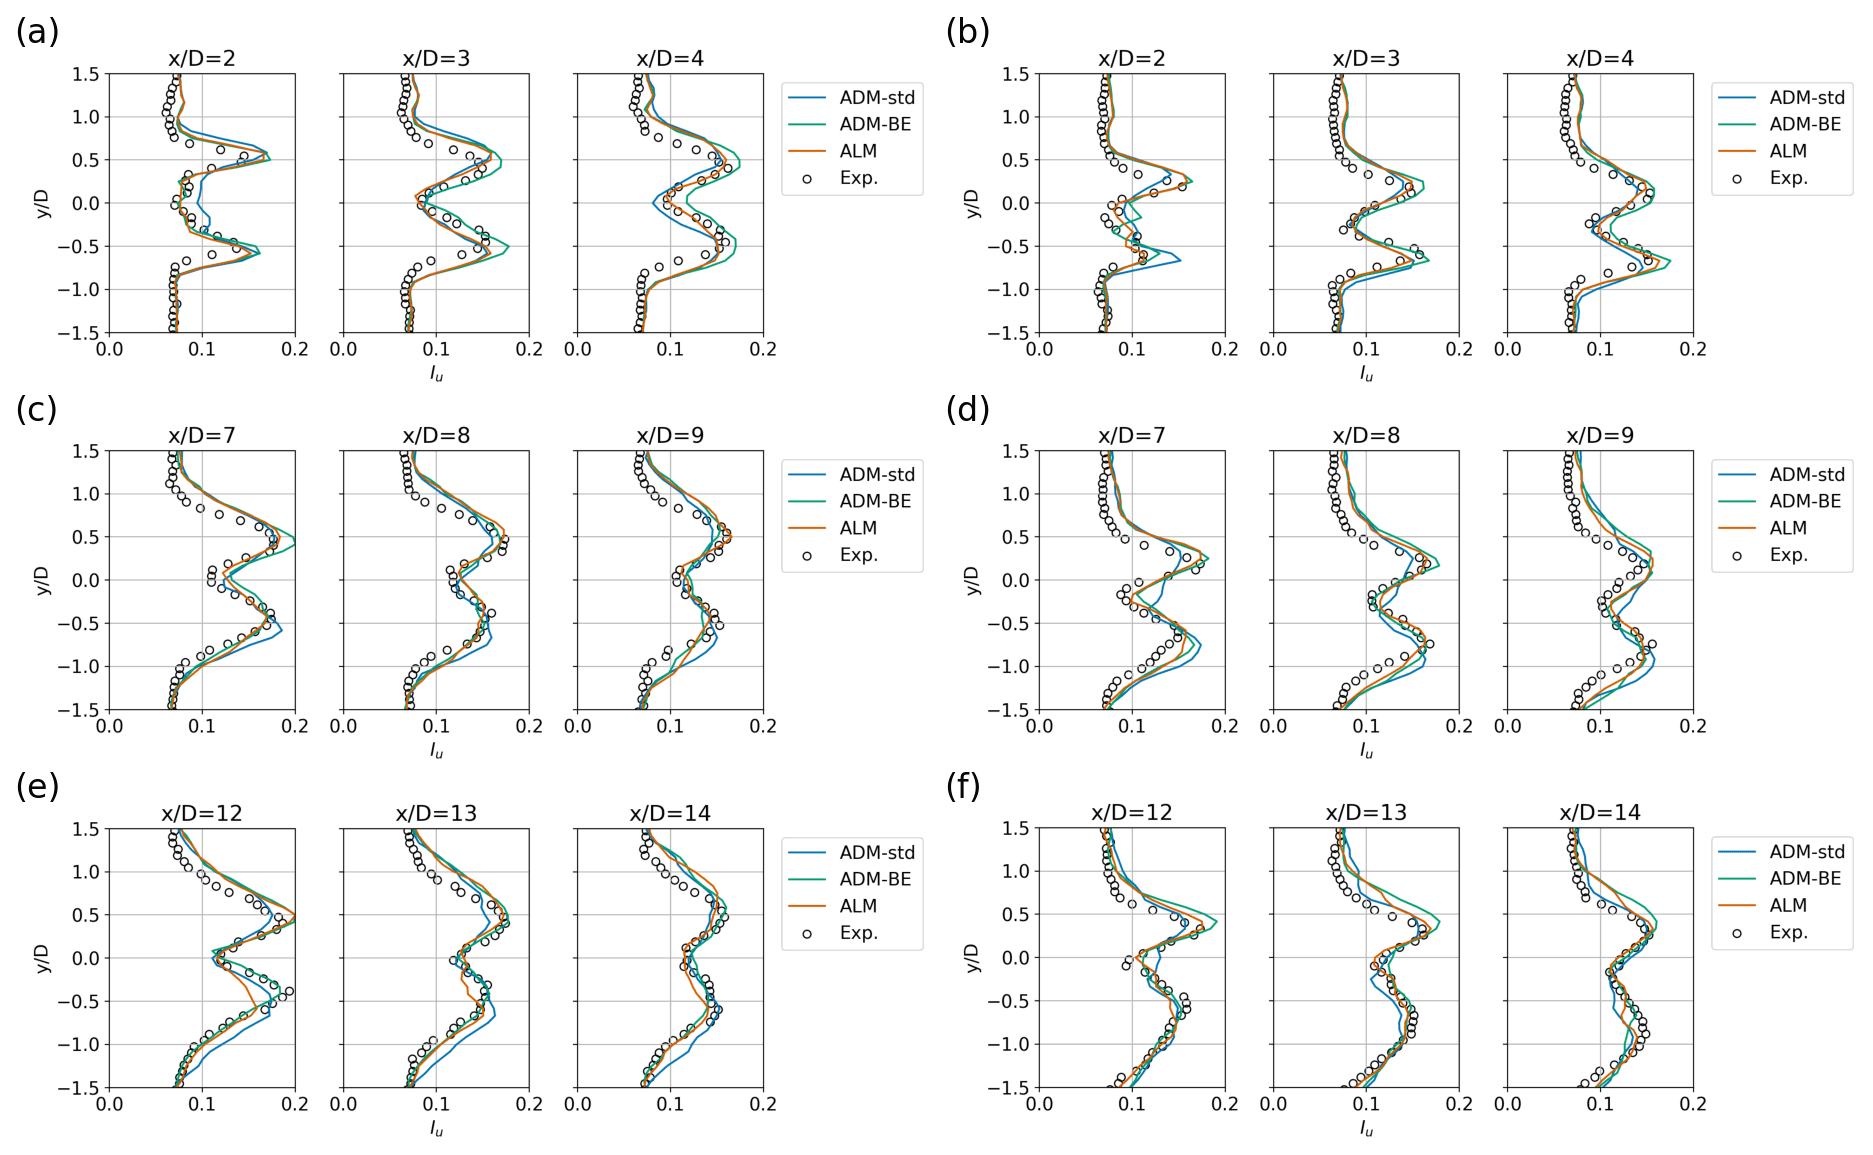
Figure 11Profiles of the streamwise turbulence intensity Iu in the x−y plane at hub height obtained from the wind-tunnel experiments and LES using the ADM-std, ADM-BE and ALM. (a) WT 1, ; (b) WT 1, ; (c) WT 2, ; (d) WT 2, ; (e) WT 3, ; (f) WT 3, .
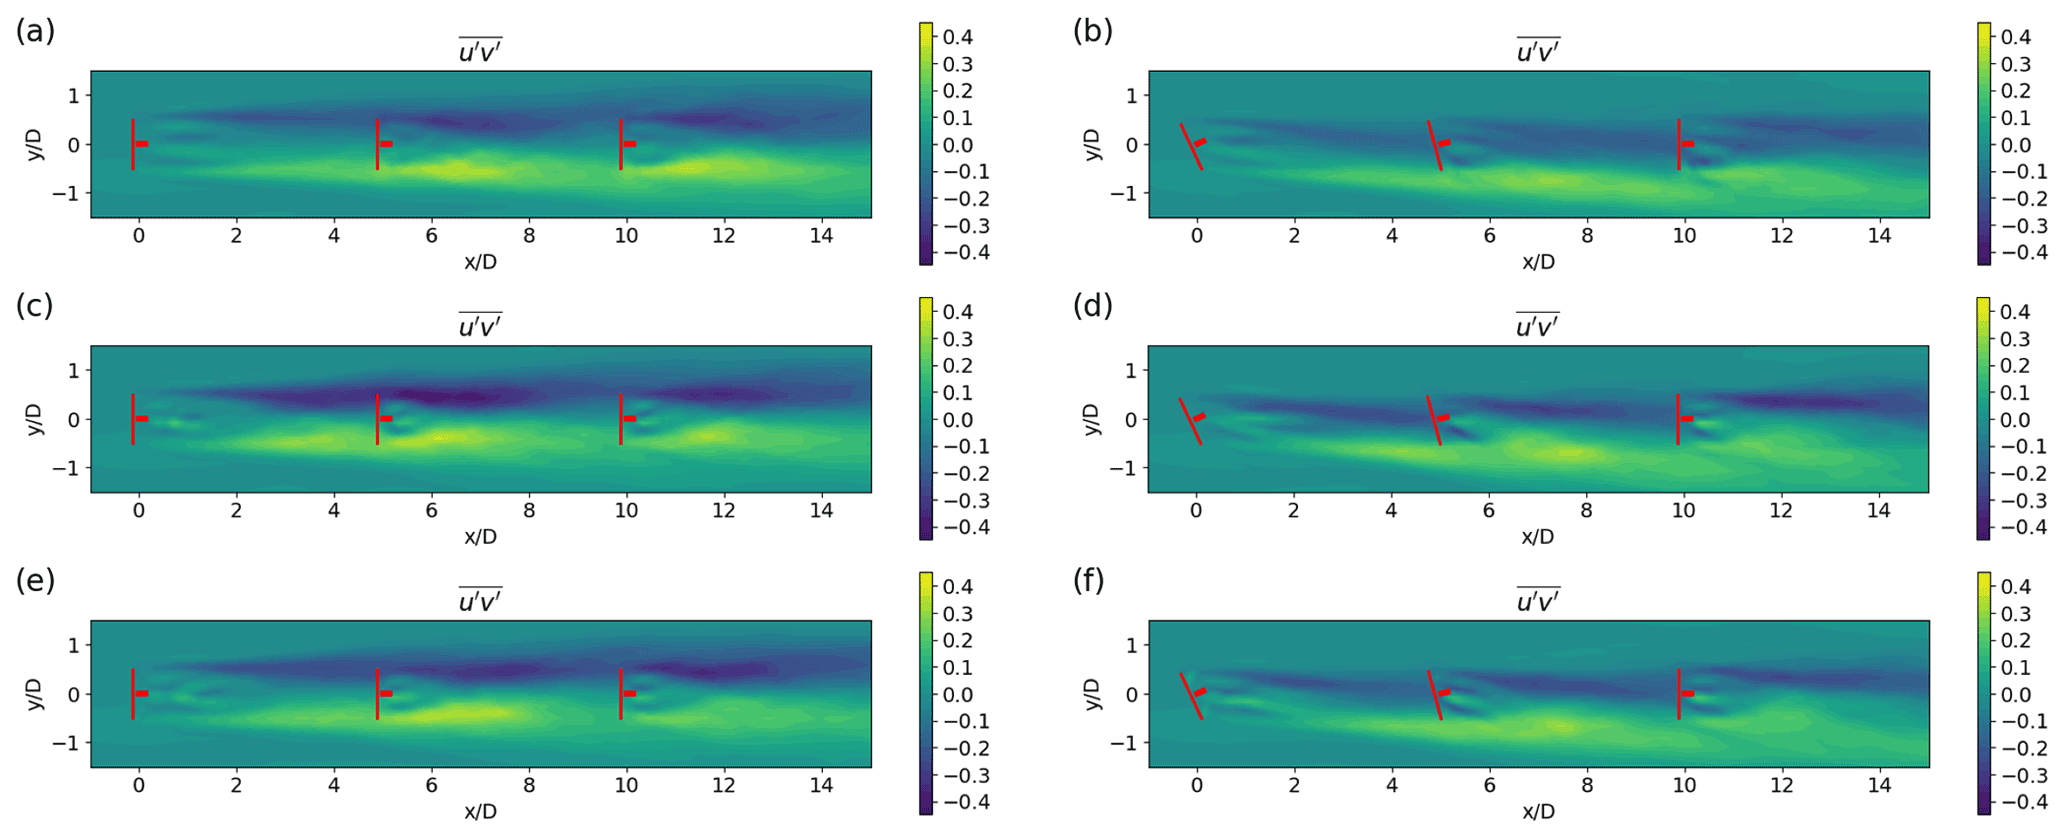
Figure 12Top-view contours of the turbulence flux (m2 s−2) in the x−y plane at hub height obtained from LES using the ADM-std, ADM-BE and ALM. The lateral offset of the turbines is zero (Cases 1 and 2). (a) The ADM-std, ; (b) the ADM-std, ; (c) the ADM-BE, ; (d) the ADM-BE, ; (e) the ALM, ; (f) the ALM.
3.2 Turbulence statistics
Contours and profiles of the streamwise turbulence intensity in the x−y plane at hub height are shown in Figs. 10 and 11, respectively. The experimental results for the non-yawed and yawed configurations are compared with the corresponding LES results obtained using the ADM-std, the ADM-BE and the ALM. Since wind tunnel measurements of the turbulence intensity are not available for Case 3 and Case 4, we only analyse Case 1 and Case 2 with zero offset.
In the measurement contours shown in Fig. 10a and b, large turbulence intensity magnitudes are observed at the edges of the wake due to the strong shear in these regions. In the non-yawed case (Fig. 10a), the turbulence intensity in the wakes is largely symmetric with respect to the wake centre line. In the yawed case (Fig. 10b), the turbulence intensity on the positive y side of the wake is larger than the turbulence intensity on the negative y side.
By comparing the LES results with the measurements in the turbulence intensity contours (Fig. 10), we find that the results of LES using the ADM-std show discrepancies with the measurements in the yawed case with the partial-wake condition. In the wakes behind the second and the third turbines, LES using the ADM-std overestimates the turbulence intensity with respect to the measurements on the negative-y side of the wake. This is consistent with the overestimation of the mean velocity gradient in LES using the ADM-std on the positive-y side of the skewed wake (Fig. 5). Furthermore, in comparison with LES using the ADM-BE and the ALM, we find that LES using the ADM-std underestimates the magnitude of the turbulence flux on the positive-y side of the wake (Fig. 12). Since the turbulence production term is defined by taking the product of the velocity gradient and the turbulence flux, such differences in LES using the ADM-std lead to an incorrect turbulence intensity distribution in the partial-wake scenario. Comparisons of the turbulence intensity profiles in Fig. 11 also show that LES using the ADM-std, the ADM-BE and the ALM slightly overspread the turbulence in the wakes: the turbulence intensity profiles of the LES results are wider than the measurements in both the non-yawed and yawed cases. This phenomenon is caused by the fact that the turbine forces in the LES are smeared by smoothing kernels in the turbine parametrisations. As a result, the shear layer produced at the wake's edges is wider than the measurements, causing the wider turbulence intensity profiles in the LES results.
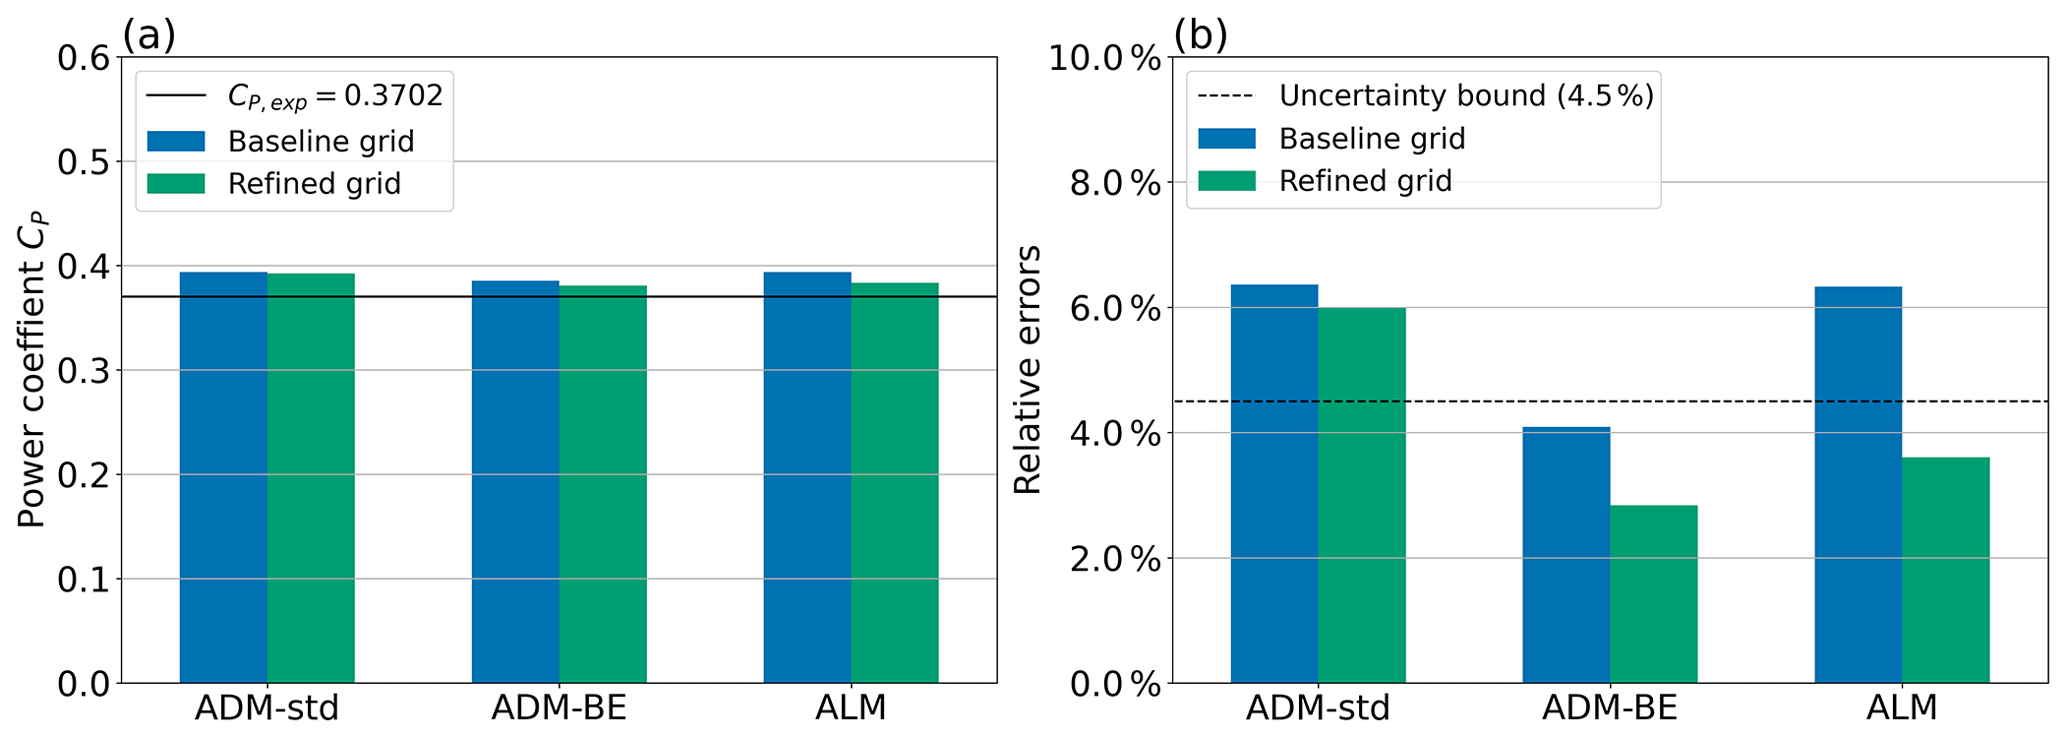
Figure 13(a) Power coefficients of the first turbine in the turbine array in zero yaw. The solid black line marks the measured power coefficient. (b) Relative errors of the power coefficient compared to the power measurement. The dashed black line marks the uncertainty bound of the power measurement.
3.3 Power prediction
Finally, we compare the power prediction obtained from LES using the ADM-std, the ADM-BE and the ALM with the power measured in the wind tunnel experiments performed by Zong and Porté-Agel (2021). Figure 13 shows the simulated power coefficients of a zero-yawed stand-alone turbine and their errors relative to the measurements. The power coefficients are obtained from the simulations using a baseline grid (specified in Sect. 2.4) and a refined grid (×2 refinement in the x, y and z directions from the baseline grid). We find that the ADM-BE yields the best predictions in the baseline and refined grid cases. Moreover, the errors in the predictions of the ADM-BE are within the measurement uncertainty (±4.5 %) in both cases. By contrast, in the baseline grid case, the power coefficients predicted by the ADM-std and the ALM have errors that are larger than the uncertainty upper bound. When the grid is refined, the error in the power coefficients predicted by the ALM is halved to a level below the uncertainty bound. On the other hand, the prediction of the ADM-std only changes marginally with the grid refinement and still overestimates the power coefficient to a level beyond the measurement uncertainty.
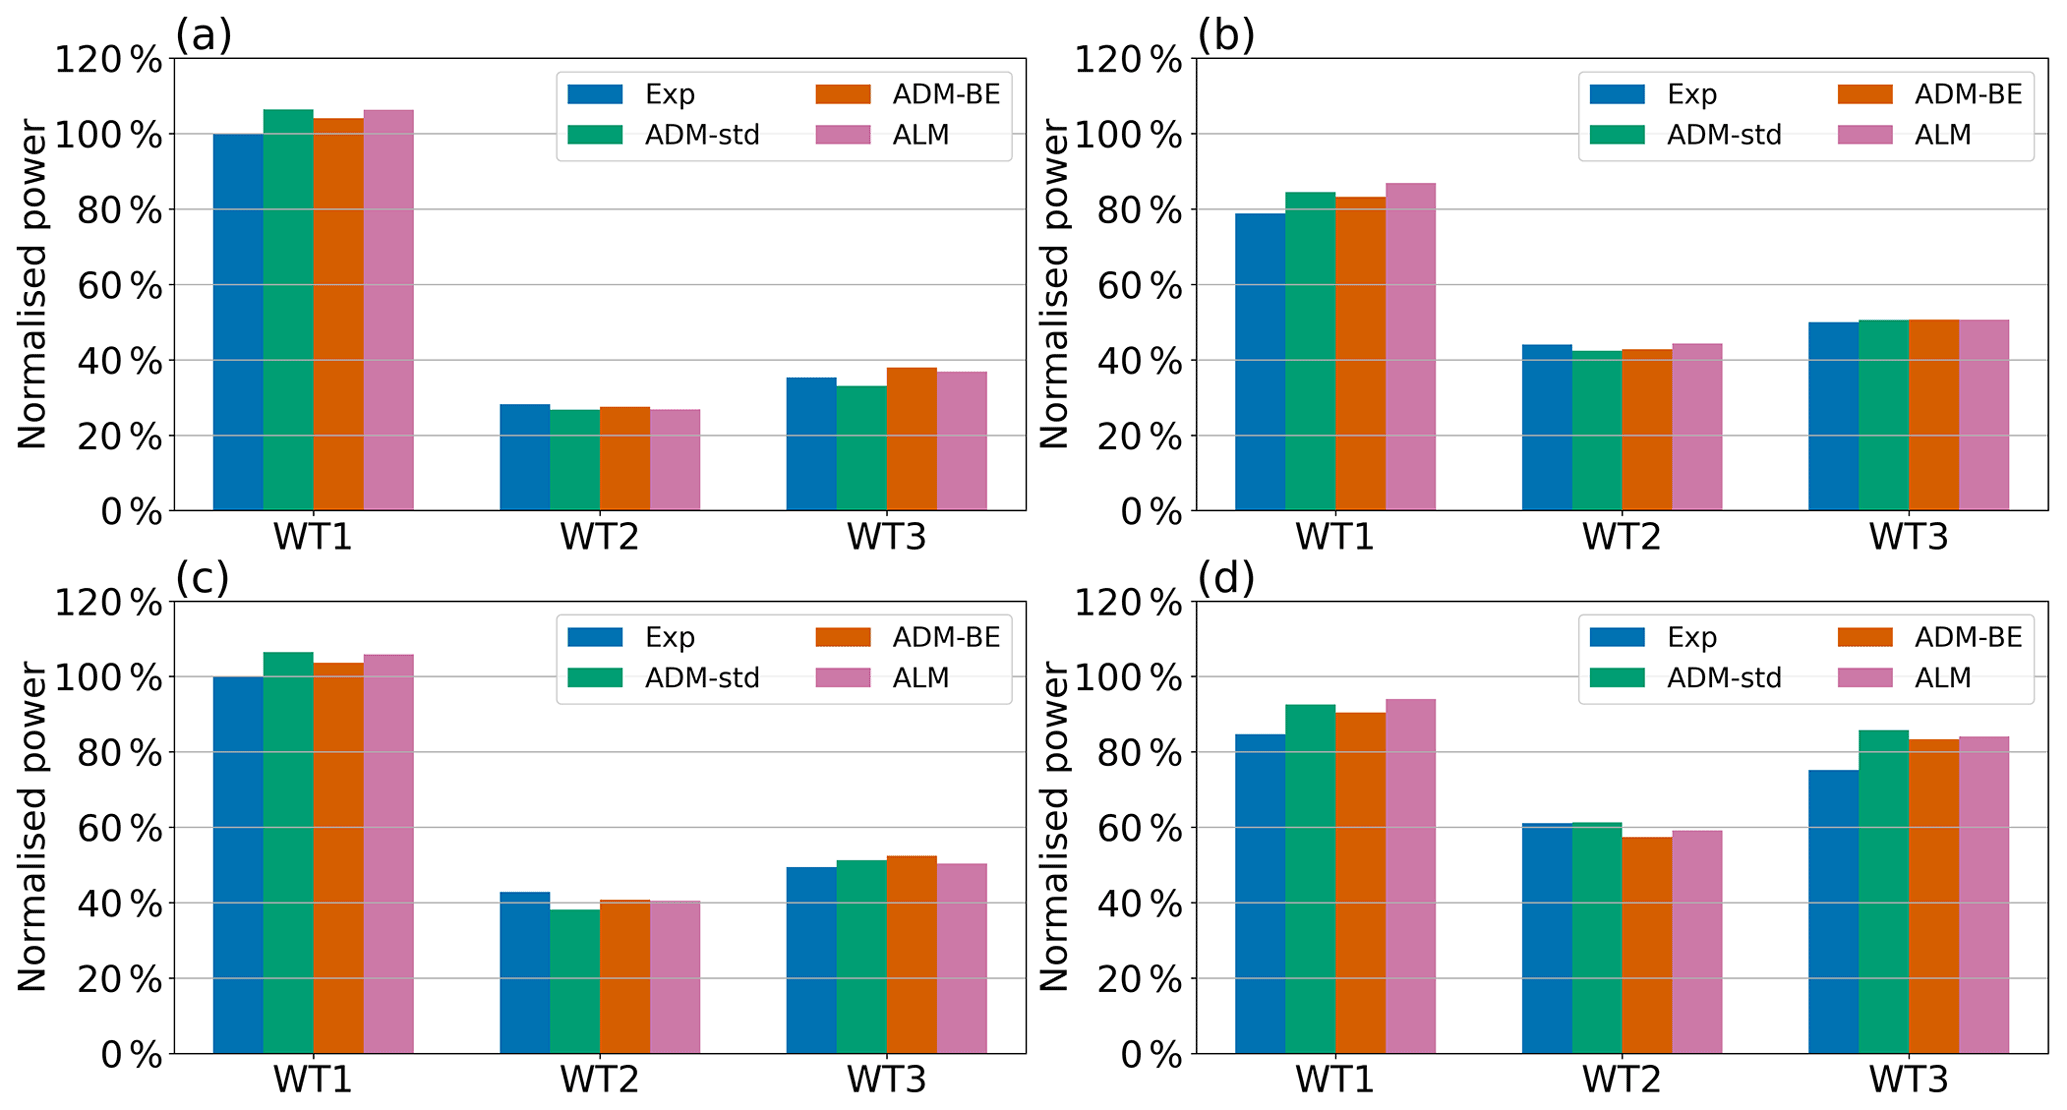
Figure 14Normalised power outputs in (a) Case 1: , zero offset; (b) Case 2: , zero offset; (c) Case 3: , offset; (d) Case 4: , offset. The power outputs are normalised by the measured power of the zero-yawed first turbine of the turbine array.
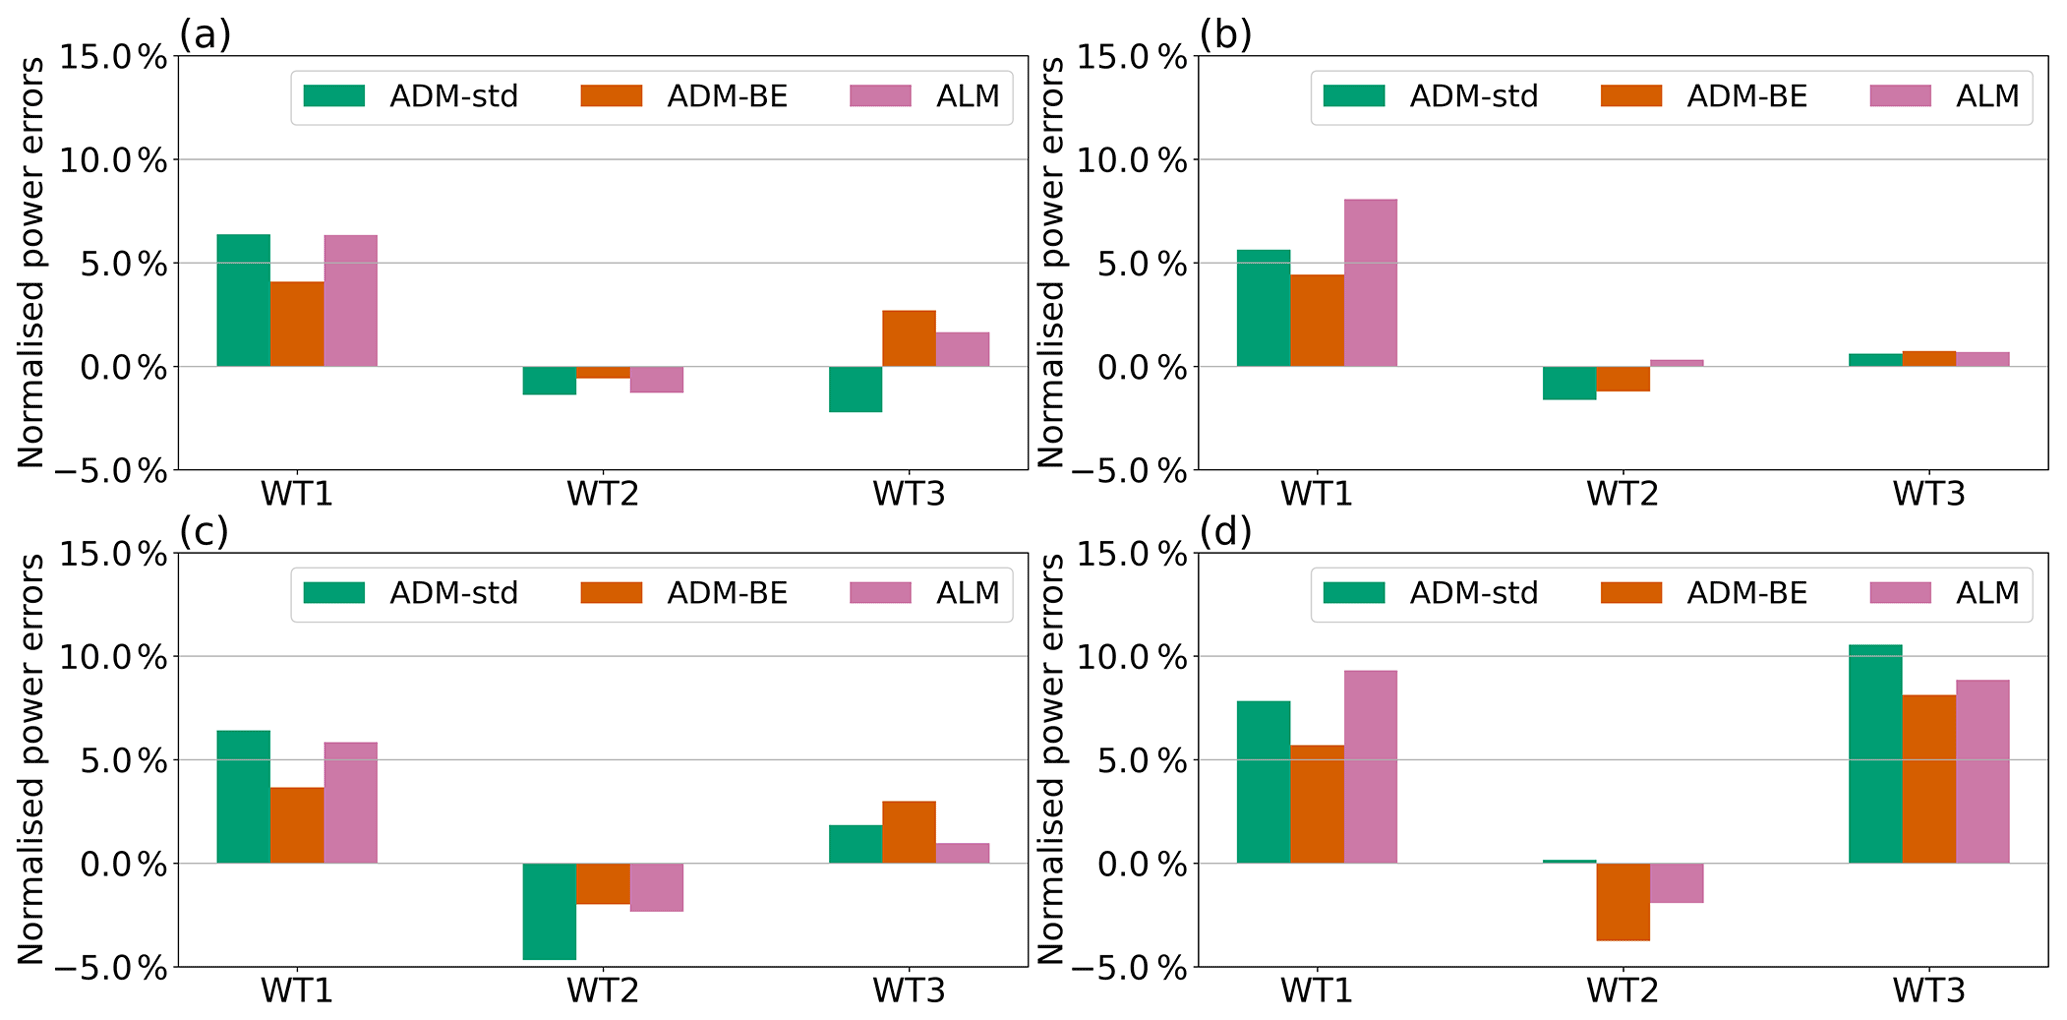
Figure 15Normalised power errors in (a) Case 1: , zero offset; (b) Case 2: , zero offset; (c) Case 3: , offset; (d) Case 4: , offset. The power outputs are normalised by the measured power of the zero-yawed first turbine of the turbine array.
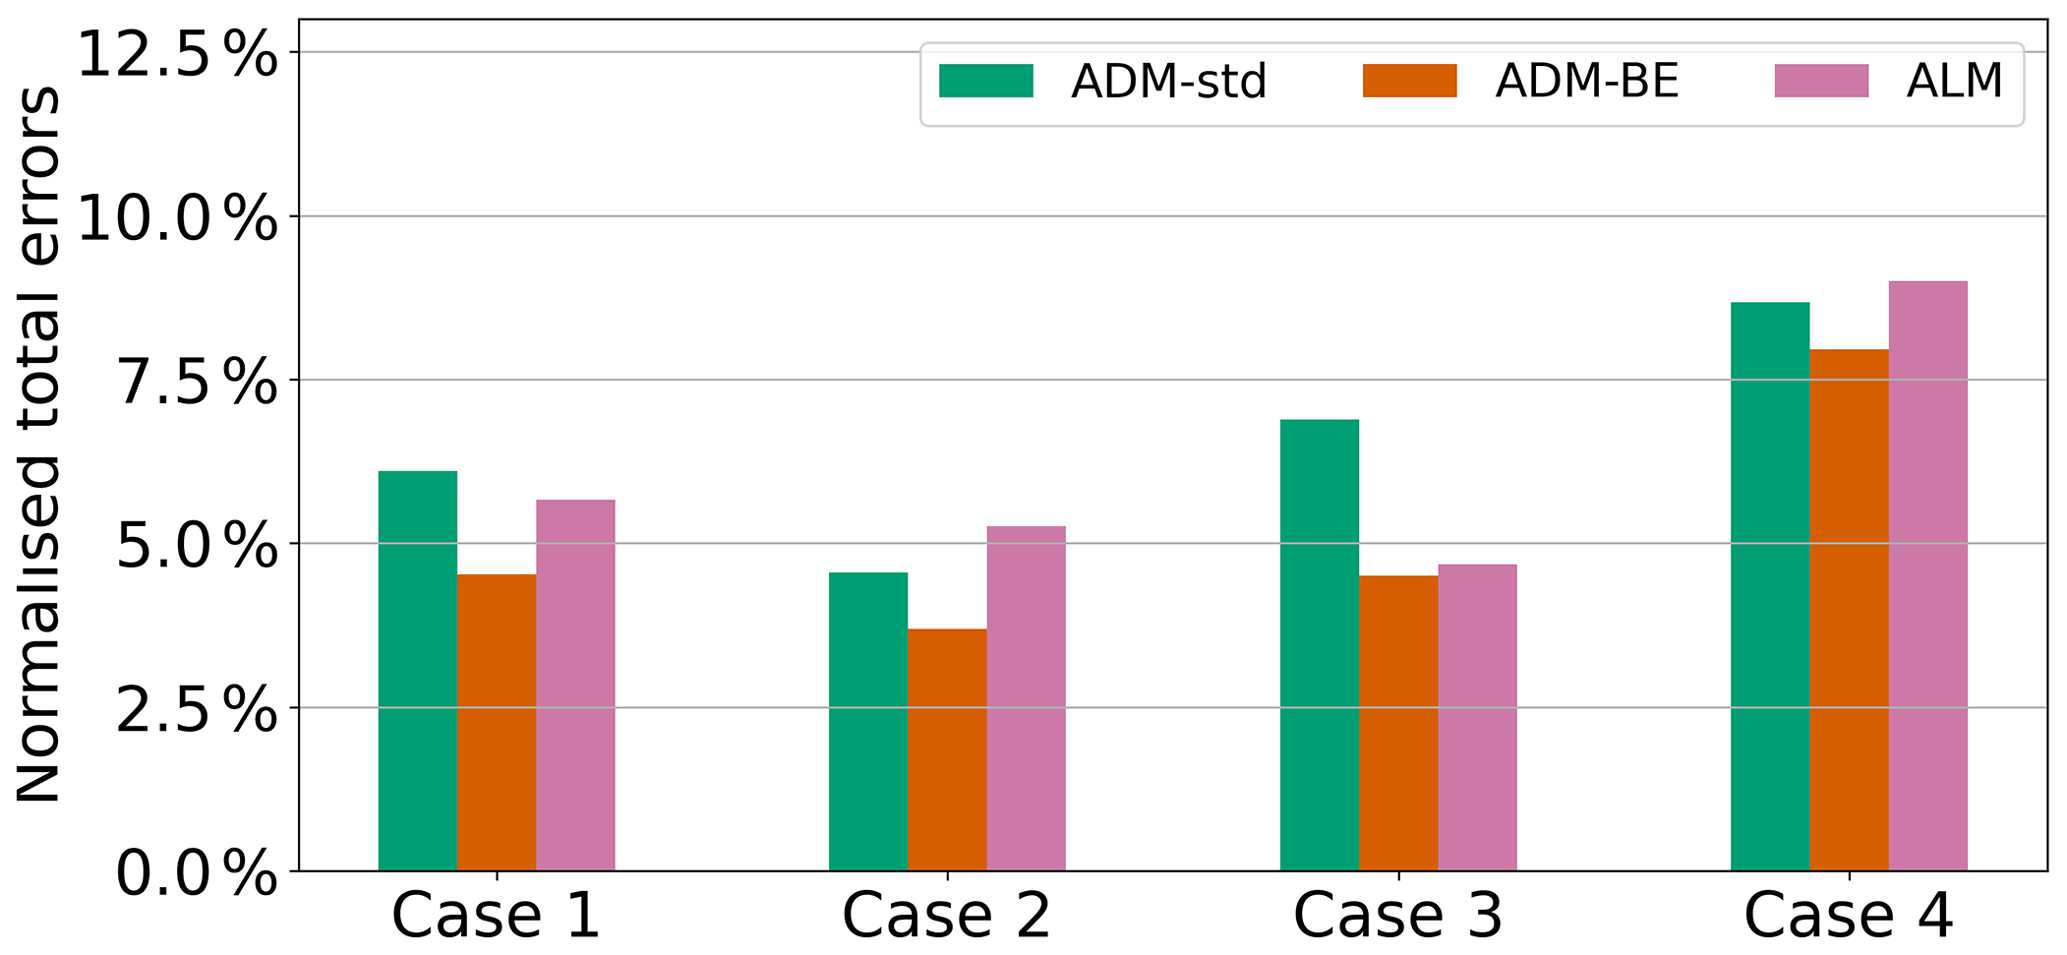
Figure 16Normalised total power errors of the three-turbine array. The errors are normalised by the total measured power of the wind turbine array in each case. Case 1: , zero offset; Case 2: , zero offset; Case 3: , offset; Case 4: , offset.
Figure 14 shows the simulated and measured power of the three-turbine array in Cases 1 to 4 specified in Table 1. Figure 15 shows the corresponding errors of the simulated power with respect to the measured power for each turbine. The power outputs and the errors are normalised by the measured power of the first turbine of the array in zero yaw. Using the data shown in Figs. 14 and 15, we further compute the normalised total power error of the three-turbine array in Cases 1 to 4 (Fig. 16) and use it as the metric to evaluate the predictions of different parametrisations. This metric is defined as the L1 norm (the summation of absolute values) of the power error of each turbine in the array normalised by the total measured power in each case:
We find that the ADM-BE, which explicitly resolves the torque and therefore the power, yields more accurate power predictions than the ADM-std. The errors in the ADM-std results can be attributed to the basic formulation of the model. Firstly, the model assumes a uniform thrust force distribution on the rotor. As we have shown in Figs. 8 and 9, due to the inaccuracy of the uniform force assumption, the ADM-std yields shifted maximum velocity deficit trajectories compared to the measurements. Such errors in the wake velocity distribution affect the power prediction. Secondly, the ADM-std computes the power indirectly using an estimated inflow velocity reconstructed from the local disk-averaged velocity based on 1D momentum theory (Eqs. 6 and 7) and a pre-determined power curve. Since the power curve is obtained from the measurements of a turbine facing an undisturbed inflow, it is expected to be less accurate for turbines in yawed and waked conditions. Moreover, the difference between the inflow velocity reconstructed from the local disk-averaged velocity and the hub-height velocity used to normalise the power curve also introduces some errors into the power prediction. In certain scenarios, the errors originating from the aforementioned factors can cancel with each other, but overall we observe larger total errors in the power predictions of the ADM-std than the ADM-BE.
We also find that, in general, the ADM-BE outperforms the ALM, even though both of them are torque-resolving parametrisations. This is consistent with previous studies (Martinez et al., 2012; Martínez-Tossas et al., 2015) showing that the power prediction from the ALM is more sensitive to the mesh resolution than the ADM-BE. As a result, the ALM usually fails to yield satisfactory power prediction in the simulation employing a grid resolution with less than 30 grid points along the rotor diameter (Draper and Usera, 2015; Martínez-Tossas et al., 2015; Stevens et al., 2018).
In this study, we validate an LES framework with different wind turbine force parametrisations (the ADM-std, ADM-BE and ALM) to predict the flow through a three-turbine array. The simulations are set to match existing wind tunnel experiments for which flow and power measurements are available for different turbine lateral offsets (with respect to the wind direction) and different active yaw control strategies.
Comparisons with wind tunnel measurements show that LES with wind turbine models that capture the local distribution of the turbine-induced forces (the ADM-BE and ALM) provide reasonably accurate predictions of the streamwise mean velocity and the streamwise turbulence intensity in the wakes of the three wind turbines for all the considered conditions of lateral offset and yaw control. In contrast, the wake flows simulated with the standard actuator disk model (the ADM-std) show a lateral shift with respect to the measurements when the turbines are exposed to partial wake conditions produced by either lateral offset of the turbines or/and active yaw control. This is due to the fact that the assumption of uniform thrust force made by the ADM-std hinders the model from capturing the non-uniform force distribution experienced by the rotor and, consequently, the correct wake velocity distribution under partial wake conditions. Moreover, we find that LES using the ADM-BE yields overall better power predictions than the ADM-std and the ALM in the cases considered in this study. The ADM-BE is found to be better suited for the conditions of turbine yawing and partial wake overlapping than the ADM-std due to the fact that the ADM-BE computes the power from the torque that is explicitly resolved on the rotor. The ADM-BE is also found to be more computationally efficient than the ALM, as the ALM requires finer grid resolution to produce satisfactory power predictions.
From the results mentioned above, we conclude that the ADM-BE provides a good balance between accuracy and computational cost for the simulation of wind farm flows. In our future research, we plan to apply the validated LES framework to investigate optimal AYC strategies under different atmospheric conditions, e.g. turbulence intensity and atmospheric stability. Furthermore, since the ADM-BE and ALM explicitly resolve the turbine forces, the LES framework could also be applied to study structural loads in wind farms subjected to AYC.
Here we present results from a grid sensitivity analysis carried out to investigate the influence of grid resolution on the results obtained with LES. Figure A1 shows the hub-height profiles of the mean velocity and turbulence intensity in the wake behind a yawed turbine () obtained from the measurements and the simulations using the ADM-std, the ADM-BE and the ALM. The simulations are carried out on the baseline grid specified in Sect. 4.2 and a refined grid (×2 refinement in the x, y and z directions from the baseline grid). Overall, we find that simulation results converge and agree reasonably well with the measurements when the grid is refined.
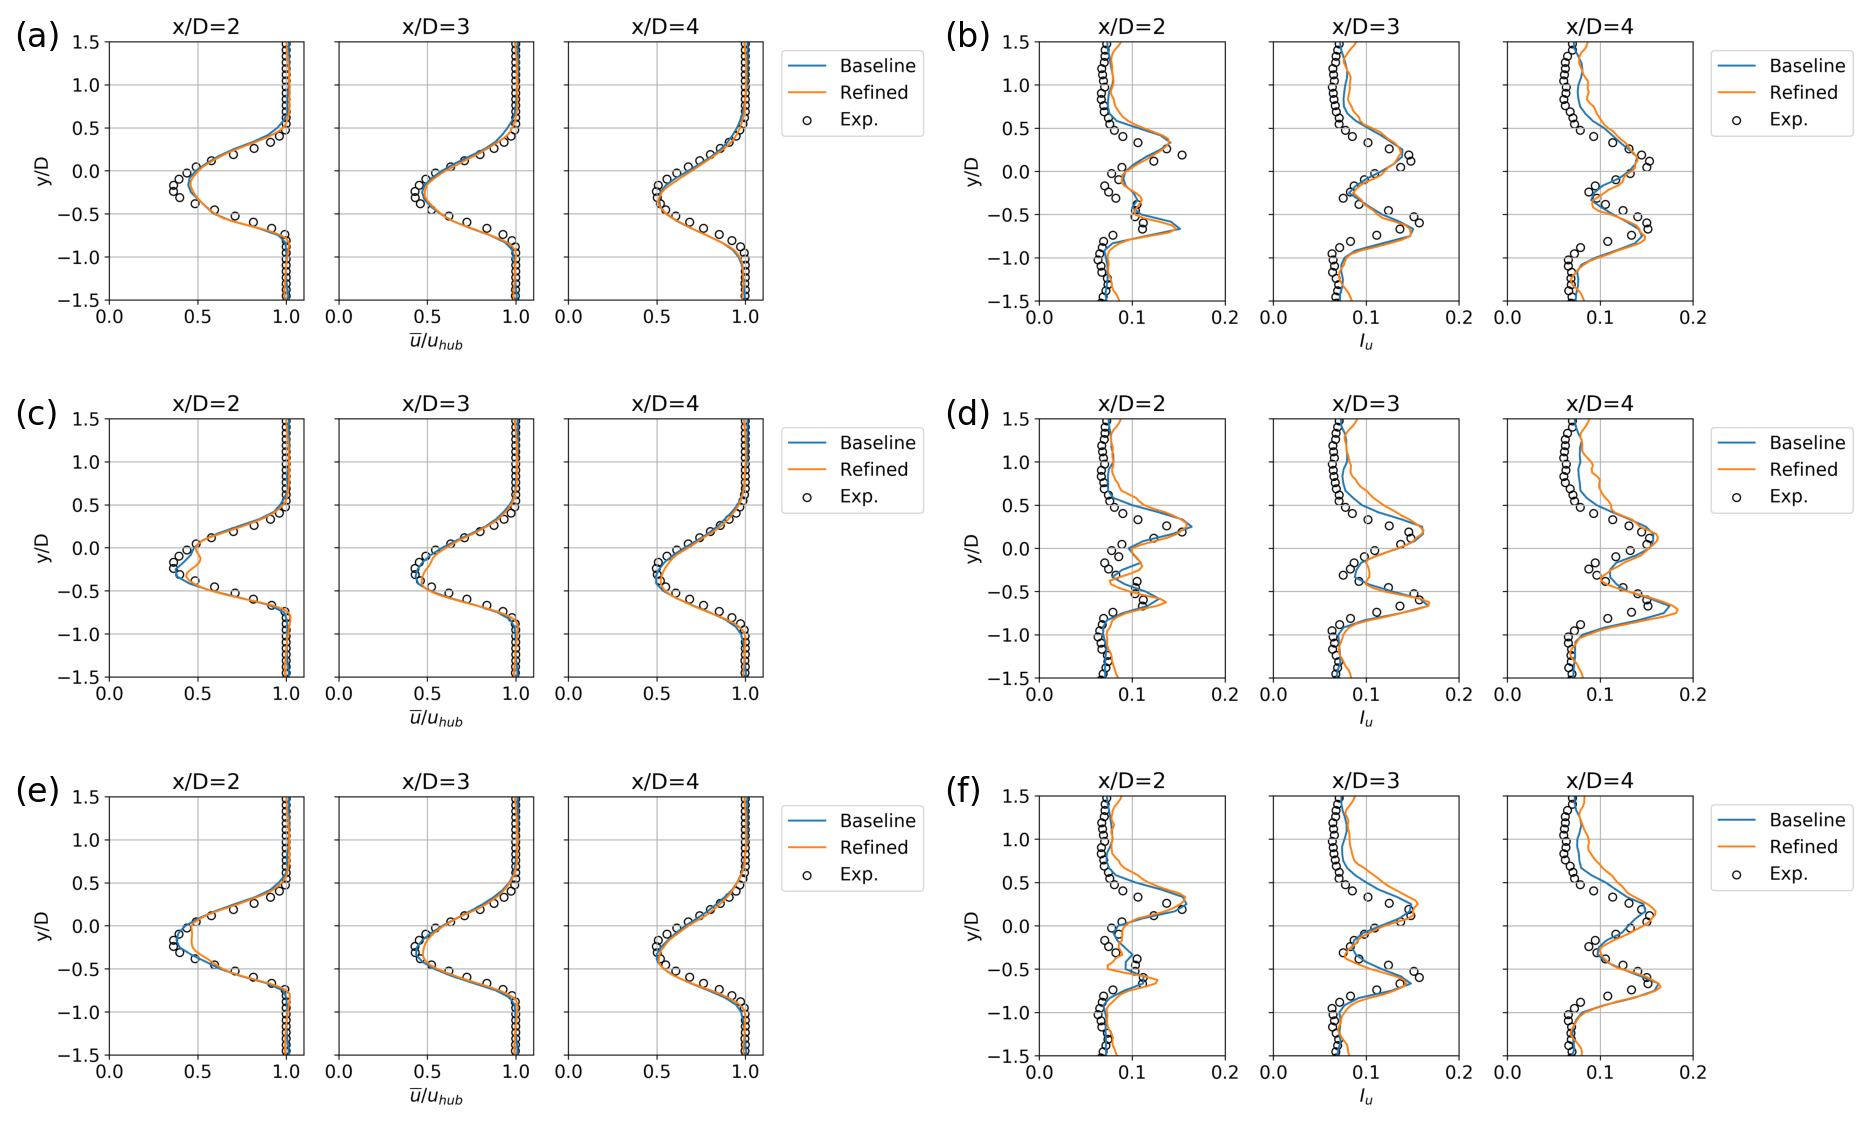
Figure A1Profiles of the normalised streamwise mean velocity (a, c, e) and turbulence intensity (b, d, f) in the x−y plane at the hub height, obtained from the wind-tunnel experiments and the LES at different grid resolutions. (a) and (b): the ADM-std; (c) and (d): the ADM-BE; (e) and (f): the ALM. The yaw angle of the wind turbine is 25∘.
The dataset is available on Zenodo at https://doi.org/10.5281/zenodo.5838648 (Lin and Porté-Agel, 2022).
ML contributed to the conceptualisation, curation, formal analysis, investigation, methodology, software, visualisation and writing (original draft). FPA contributed to the conceptualisation, supervision, software, funding acquisition, project administration and writing (review & editing).
The contact author has declared that neither of the authors has any competing interests.
Publisher’s note: Copernicus Publications remains neutral with regard to jurisdictional claims in published maps and institutional affiliations.
Computing resources were provided by EPFL through the use of the facilities of Scientific IT and Application Support Center (SCITAS). The authors also would like to thank Haohua Zong for providing helpful information on the wind tunnel measurements used in this study.
This research has been supported by the Bundesamt für Energie (grant no. SI/501337-01) and the Schweizerischer Nationalfonds zur Förderung der Wissenschaftlichen Forschung (grant no. 200021_172538).
This paper was edited by Paul Fleming and reviewed by Luis Martinez and one anonymous referee.
Abkar, M. and Porté-Agel, F.: Influence of atmospheric stability on wind-turbine wakes: A large-eddy simulation study, Phys. Fluids, 27, 035104, https://doi.org/10.1063/1.4913695, 2015. a, b
Archer, C. L. and Vasel-Be-Hagh, A.: Wake steering via yaw control in multi-turbine wind farms: Recommendations based on large-eddy simulation, Sustain. En. Tech. Assess., 33, 34, https://doi.org/10.1016/j.seta.2019.03.002, 2019. a
Archer, C. L., Vasel-Be-Hagh, A., Yan, C., Wu, S., Pan, Y., Brodie, J. F., and Maguire, A. E.: Review and evaluation of wake loss models for wind energy applications, Appl. Energ., 226, 1187, https://doi.org/10.1016/j.apenergy.2018.05.085, 2018. a
Barthelmie, R. J. and Jensen, L. E.: Evaluation of wind farm efficiency and wind turbine wakes at the Nysted offshore wind farm, Wind Energy, 13, 573, https://doi.org/10.1002/we.408, 2010. a
Bastankhah, M. and Porté-Agel, F.: Experimental and theoretical study of wind-turbine wakes in yawed conditions, J. Fluid Mech., 806, 506–541, https://doi.org/10.1017/jfm.2016.595, 2016. a, b, c
Boersma, S., Doekemeijer, B., Siniscalchi-Minna, S., and van Wingerden, J.: A constrained wind farm controller providing secondary frequency regulation: An LES study, Renew. Energ., 134, 639–652, https://doi.org/10.1016/j.renene.2018.11.031, 2019. a
Draper, M. and Usera, G.: Evaluation of the Actuator Line Model with coarse resolutions, in: Journal of Physics: Conference Series, 625, 012021, https://doi.org/10.1088/1742-6596/625/1/012021, 2015. a
Fang, J. and Porté-Agel, F.: Large-Eddy Simulation of Very-Large-Scale Motions in the Neutrally Stratified Atmospheric Boundary Layer, Bound-Lay. Meteo., 155, 397, https://doi.org/10.1007/s10546-015-0006-z, 2015. a
Fleming, P., Annoni, J., Churchfield, M., Martinez-Tossas, L. A., Gruchalla, K., Lawson, M., and Moriarty, P.: A simulation study demonstrating the importance of large-scale trailing vortices in wake steering, Wind Energ. Sci., 3, 243–255, https://doi.org/10.5194/wes-3-243-2018, 2018. a
Fleming, P. A., Ning, A., Gebraad, P. M., and Dykes, K.: Wind plant system engineering through optimization of layout and yaw control, Wind Energy, 19, 329, https://doi.org/10.1002/we.1836, 2016. a
Grant, I. and Parkin, P.: A DPIV study of the trailing vortex elements from the blades of a horizontal axis wind turbine in yaw, Exp. Fluids, 28, 368, https://doi.org/10.1007/s003480050396, 2000. a
Grant, I., Parkin, P., and Wang, X.: Optical vortex tracking studies of a horizontal axis wind turbine in yaw using laser-sheet, flow visualisation, Exp. Fluids, 23, 513, https://doi.org/10.1007/s003480050142, 1997. a
GWEC: Global Wind Report 2021, https://gwec.net/wp-content/uploads/2021/03/GWEC-Global-Wind-Report-2021.pdf (last access: 1 November 2022), 2021. a
Howland, M. F., Bossuyt, J., Martínez-Tossas, L. A., Meyers, J., and Meneveau, C.: Wake structure in actuator disk models of wind turbines in yaw under uniform inflow conditions, J. Renew. Sustain Ener., 8, 043301, https://doi.org/10.1063/1.4955091, 2016. a
Jensen, N.: A note on wind generator interaction, no. 2411 in Risø-M, Risø National Laboratory, ISBN 87-550-0971-9, 1983. a
Jiménez, A., Crespo, A., and Migoya, E.: Application of a LES technique to characterize the wake deflection of a wind turbine in yaw, Wind Energy, 13, 559–572, https://doi.org/10.1002/we.380, 2010. a, b
King, J., Fleming, P., King, R., Martínez-Tossas, L. A., Bay, C. J., Mudafort, R., and Simley, E.: Control-oriented model for secondary effects of wake steering, Wind Energ. Sci., 6, 701–714, https://doi.org/10.5194/wes-6-701-2021, 2021. a
Lin, M. and Porté-Agel, F.: Large-eddy simulation of yawed wind-turbine wakes: comparisons with wind tunnel measurements and analytical wake models, Energies, 12, 4574, https://doi.org/10.3390/en12234574, 2019. a, b, c, d
Lin, M. and Porté-Agel, F.: Wake statistics of wind turbines array subjected to active yaw control, Zenodo [data set], https://doi.org/10.5281/zenodo.5838648, 2022. a
Lu, H. and Porté-Agel, F.: A modulated gradient model for large-eddy simulation: Application to a neutral atmospheric boundary layer, Phys. Fluids, 22, 015109, https://doi.org/10.1063/1.3291073, 2010. a
Lu, H. and Porté-Agel, F.: On the development of a dynamic non-linear closure for large-eddy simulation of the atmospheric boundary layer, Bound-Lay. Meteorol., 151, 429–451, https://doi.org/10.1007/s10546-013-9906-y, 2014. a
Martinez, L., Leonardi, S., Churchfield, M., and Moriarty, P.: A comparison of actuator disk and actuator line wind turbine models and best practices for their use, in: 50th AIAA Aerospace Sciences Meeting including the New Horizons Forum and Aerospace Exposition, 9–12 January 2012, Nashville, Tennessee, USA, p. 900, https://doi.org/10.2514/6.2012-900, 2012. a
Martínez-Tossas, L. A., Churchfield, M. J., and Leonardi, S.: Large eddy simulations of the flow past wind turbines: actuator line and disk modeling, Wind Energy, 18, 1047–1060, https://doi.org/10.1002/we.1747, 2015. a, b
Martínez-Tossas, L. A., Churchfield, M. J., and Meneveau, C.: Optimal smoothing length scale for actuator line models of wind turbine blades based on Gaussian body force distribution, Wind Energy, 20, 1083, https://doi.org/10.1002/we.2081, 2017. a
Martínez-Tossas, L. A., Annoni, J., Fleming, P. A., and Churchfield, M. J.: The aerodynamics of the curled wake: a simplified model in view of flow control, Wind Energ. Sci., 4, 127–138, https://doi.org/10.5194/wes-4-127-2019, 2019. a, b
Medici, D. and Alfredsson, P.: Measurements on a wind turbine wake: 3D effects and bluff body vortex shedding, Wind Energy, 9, 219–236, https://doi.org/10.1002/we.156, 2006. a
Munters, W. and Meyers, J.: Dynamic strategies for yaw and induction control of wind farms based on large-eddy simulation and optimization, Energies, 11, 177, https://doi.org/10.3390/en11010177, 2018. a
Munters, W., Meneveau, C., and Meyers, J.: Shifted periodic boundary conditions for simulations of wall-bounded turbulent flows, Phys. Fluids, 28, 025112, https://doi.org/10.1063/1.4941912, 2016. a
Porté-Agel, F., Wu, Y.-T., Lu, H., and Conzemius, R. J.: Large-eddy simulation of atmospheric boundary layer flow through wind turbines and wind farms, J. Wind Eng. Ind. Aerod., 99, 154–168, https://doi.org/10.1016/j.jweia.2011.01.011, 2011. a, b
Porté-Agel, F., Wu, Y. T., and Chen, C. H.: A numerical study of the effects of wind direction on turbine wakes and power losses in a large wind farm, Energies, 6, 5297, https://doi.org/10.3390/en6105297, 2013. a
Porté-Agel, F., Bastankhah, M., and Shamsoddin, S.: Wind-turbine and wind-farm flows: a review, Bound-Lay. Meteorol., 174, 1–59, https://doi.org/10.1007/s10546-019-00473-0, 2020. a
Qian, G.-W. and Ishihara, T.: A new analytical wake model for yawed wind turbines, Energies, 11, 665, https://doi.org/10.3390/en11030665, 2018. a
Qian, G.-W. and Ishihara, T.: Wind farm power maximization through wake steering with a new multiple wake model for prediction of turbulence intensity, Energy, 220, 119680, https://doi.org/10.1016/j.energy.2020.119680, 2021. a
Revaz, T., Lin, M., and Porté-Agel, F.: Numerical framework for aerodynamic characterization of wind turbine airfoils: Application to miniature wind turbine WiRE-01, Energies, 13, 5612, https://doi.org/10.3390/en13215612, 2020. a
Shapiro, C. R., Gayme, D. F., and Meneveau, C.: Modelling yawed wind turbine wakes: a lifting line approach, J. Fluid Mech., 841, R1, https://doi.org/10.1017/jfm.2018.75, 2018. a, b
Stevens, R. J., Martínez-Tossas, L. A., and Meneveau, C.: Comparison of wind farm large eddy simulations using actuator disk and actuator line models with wind tunnel experiments, Renew. Energ., 116, 470, https://doi.org/10.1016/j.renene.2017.08.072, 2018. a, b, c
Sørensen, J. N. and Shen, W. Z.: Numerical modeling of wind turbine wakes, J. Fluids Eng., 124, 393–399, https://doi.org/10.1115/1.1471361, 2002. a
Wang, J., Foley, S., Nanos, E. M., Yu, T., Campagnolo, F., Bottasso, C. L., Zanotti, A., and Croce, A.: Numerical and experimental study of wake redirection techniques in a boundary layer wind tunnel, in: J. Phy. Conf. Seri., 854, p. 012048, https://doi.org/10.1088/1742-6596/854/1/012048, 2017. a
Wu, Y. T. and Porté-Agel, F.: Large-eddy simulation of wind-turbine wakes: evaluation of turbine parametrisations, Bound-Lay. Meteorol., 138, 345, https://doi.org/10.1007/s10546-010-9569-x, 2011. a, b, c, d, e
Zong, H. and Porté-Agel, F.: A momentum-conserving wake superposition method for wind farm power prediction, J. Fluid Mech., 889, A8, https://doi.org/10.1017/jfm.2020.77, 2020a. a
Zong, H. and Porté-Agel, F.: A point vortex transportation model for yawed wind turbine wakes, J. Fluid Mech., 890, A8, https://doi.org/10.1017/jfm.2020.123, 2020b. a
Zong, H. and Porté-Agel, F.: Experimental investigation and analytical modelling of active yaw control for wind farm power optimization, Renew. Energ., 170, 1228–1244, https://doi.org/10.1016/j.renene.2021.02.059, 2021. a, b, c, d