the Creative Commons Attribution 4.0 License.
the Creative Commons Attribution 4.0 License.
 | 23 Mar 2022
High-Reynolds-number wind turbine blade equipped with root spoilers – Part 1: Unsteady aerodynamic analysis using URANS simulations
Thomas Potentier
Emmanuel Guilmineau
Arthur Finez
Colin Le Bourdat
Caroline Braud
A commercial wind turbine blade equipped with root spoilers is analysed using 2D URANS computational fluid dynamics (CFD) to assess the unsteady impact of passive devices. In this work, we present the 2D CFD unsteady results from a non-rotating single thick section located at the root end of the blade with and without spoiler. Computations were performed at the chord-based Reynolds number . The analysed spoiler is of commercial size with a height of approximately 33 % of the local chord. Comparing to existing literature, it is at least 1 order of magnitude larger than the size of the well-known Gurney flaps. The analysis is first performed in the steady state at a single angle of attack using global aerodynamic forces, the local pressure distributions, and flow field analysis. Analyses are then continued accounting for the flow unsteadiness. The spoiler induces an important wake behaviour linked to the apparition of global load fluctuations. Using the wall pressure distributions and the associated spatio-temporal organisation of the flow field, those fluctuations are well characterised. Globally, in terms of lift gain, adding a spoiler is found to be detrimental for the negative angles of attack while of high interest for higher angles of attack. Another drawback of the spoiler addition is the unsteady effects. A dominant peak frequency is emerging in the aerodynamic polar coefficients, when adding a spoiler, which corresponds to a vortex shedding organisation.
- Article
(6872 KB) - Full-text XML
- BibTeX
- EndNote


Wind energy, over the last decades, increased its market share thanks to longer blades and a continuous increase in rated power. Nevertheless, to keep lowering the levelised cost of energy (LCoE), onshore turbines need to produce more energy within the same swept area. Indeed, the blade size is restricted to avoid (or limit), among other things, acoustic emission, aeronautical interference, and local population rejection. The blade design imposes high blade thickness at the root end of the blade for structural reasons, which leads to significant loss of aerodynamic performance. It is detrimental to the energy extraction; therefore solutions were developed to improve this blade region, among them, the passive aerodynamic add-ons (AAOs).
AAOs are devices attached to the blade surface to either increase the power extraction locally or reduce the acoustic emission of the turbine and thereby allow the exploiting party to use the full turbine's capacity. The current paper will focus on passive AAO installed in the root blade area to improve the aerodynamic performances of the thick aerofoil profile types. The AAO solution has been explored by many authors before (see Pechlivanoglou, 2013; Saleem, 2019; Bach, 2016). It should be noted that in opposition to passive devices, some active solutions exist in the research state (such as solutions described in Jaunet and Braud, 2018; Boeije et al., 2009; McWilliam et al., 2018) but are not yet available to the market.
The flow behind two well-known AAO devices, the vortex generators (VGs) and the Gurney flaps (GFs), has been largely investigated in order to understand its mechanism and control benefit, which is summarised hereafter. VGs are small fins (thin plates of usually triangular or rectangular shapes attached to a base plate) attached on the aerofoil suction side to delay stall by re-energising the boundary layer (see Taylor, 1947; Godard and Stanislas, 2006; Cathalifaud et al., 2009; De Tavernier et al., 2021; Gao et al., 2014; Lin, 2002; Skrzypiński et al., 2014; Perivolaris and Voutsinas, 2001). The vortices, aligned with the inflow leaving the device, increase the mixing between high speed flow (free stream) and low speed flow (boundary layer), thus delaying the flow separation (see Schubauer and Spangenberg, 1960). GFs are devices installed at the aerofoil trailing edge on the pressure side. They aim to create an artificial camber seen by the flow. This will decrease the lower pressure on the suction side and therefore increase the pressure difference between both sides of the aerofoil, thus increasing the generated lift (see Liebeck, 1978; Cole et al., 2013; Giguere et al., 1995; Wang et al., 2008; Jang et al., 1998; Sørensen et al., 2014; Mohammadi et al., 2012; Li et al., 2002; Alber et al., 2020; Meena et al., 2017). The main difficulty in AAO design is the correct sizing: if GFs are too small the gain is nonexistent, while if they are too large the drag penalty cannot be compensated for by the lift gain. Similarly for VGs, geometrical parameters of the device affect the control efficiency. The combined effect of both VG and GF solutions seems to be additive according to Storms and Jang (1994).
Megawatt-sized wind turbines experience high Reynolds number (Re>106) for high relative aerofoil thicknesses at the blade root (relative thickness >36%), whereas most of the literature available targets either thin aerofoils at generally low to moderate Reynolds number or small AAO sizes generally within the boundary layer thickness. Interesting outputs from Meena et al. (2017) could be drawn, such as a detailed characterisation of the shedding vortex types occurring behind aerofoils equipped with different GF heights using unsteady Reynolds-averaged Navier–Stokes (URANS) equations and large-eddy simulations. However, the simulations were limited to thin profiles and low Reynolds numbers. The present study will contribute to extend such work towards thick profiles and higher Reynolds numbers. Also, there exists a gap between the AAO size (usually ≥5 % of blade chord) used by manufacturers and the one available in the literature (up to 1 % of blade chord). Another objective of the present paper is to contribute to reduce this gap. The AAO solution presented in this paper is the spoiler; it is a passive obstacle installed on the aerofoil pressure side to increase the aerofoil camber perceived by the flow. Despite a lift-enhancing mechanism similar to the large GF one, there is a main difference, which lies in its position. The spoiler is installed between 60 % and 80 % of the local chord and is a long single aerodynamically designed part, while the GF is installed perpendicularly to the local chord at the trailing edge and is usually comprised of several smaller parts butted up together.
The European AVATAR project (see Schepers, 2017) studied thick sections at realistic Reynolds numbers (Re>106). According to the authors' knowledge, it is the only literature about wind turbine blade root spoilers at realistic operating conditions. The 2D CFD simulations were performed on the blade root with and without spoiler using Reynolds-average Navier–Stokes (RANS) equations, thereby smoothing out the possible unsteady effects.
The present paper is therefore dedicated to the analysis of high-Reynolds-number unsteady simulation, , using a scanned blade shape from an operating 2 MW turbine. Two configurations will be analysed: bare blade (no AAO) and a large spoiler existing on an ENGIE Green turbine. The methodology to post-process the scanned blade with the spoiler is explained in Sect. 2, the CFD set-up and mesh independence study are described in Sect. 3, and finally, analysis of the AAO impacts in terms of steady and unsteady aerodynamics properties is presented in detail in the results Sect. 4.
2.1 Blade root section with and without spoiler
The wind turbine geometry used in the present study was acquired during a scanning campaign on an operating 2 MW turbine (see Dambrine, 2010). Scanned cross sections were created by extracting thin slices of 5 cm wide of the entire point cloud. Then, we post-treated each cross section by ordering the point cloud coordinates and fitted splines. Several interpolation techniques were tried. The Bézier curves gave the best outcome, resulting in a smooth and continuous geometry despite missing scan data due to the scanner position not being able to capture some areas of the blade (see Fig. 1). Nevertheless, small discrepancies (peaks) are present at % and % due to residual panelisation, negligible on the lift evaluation however.
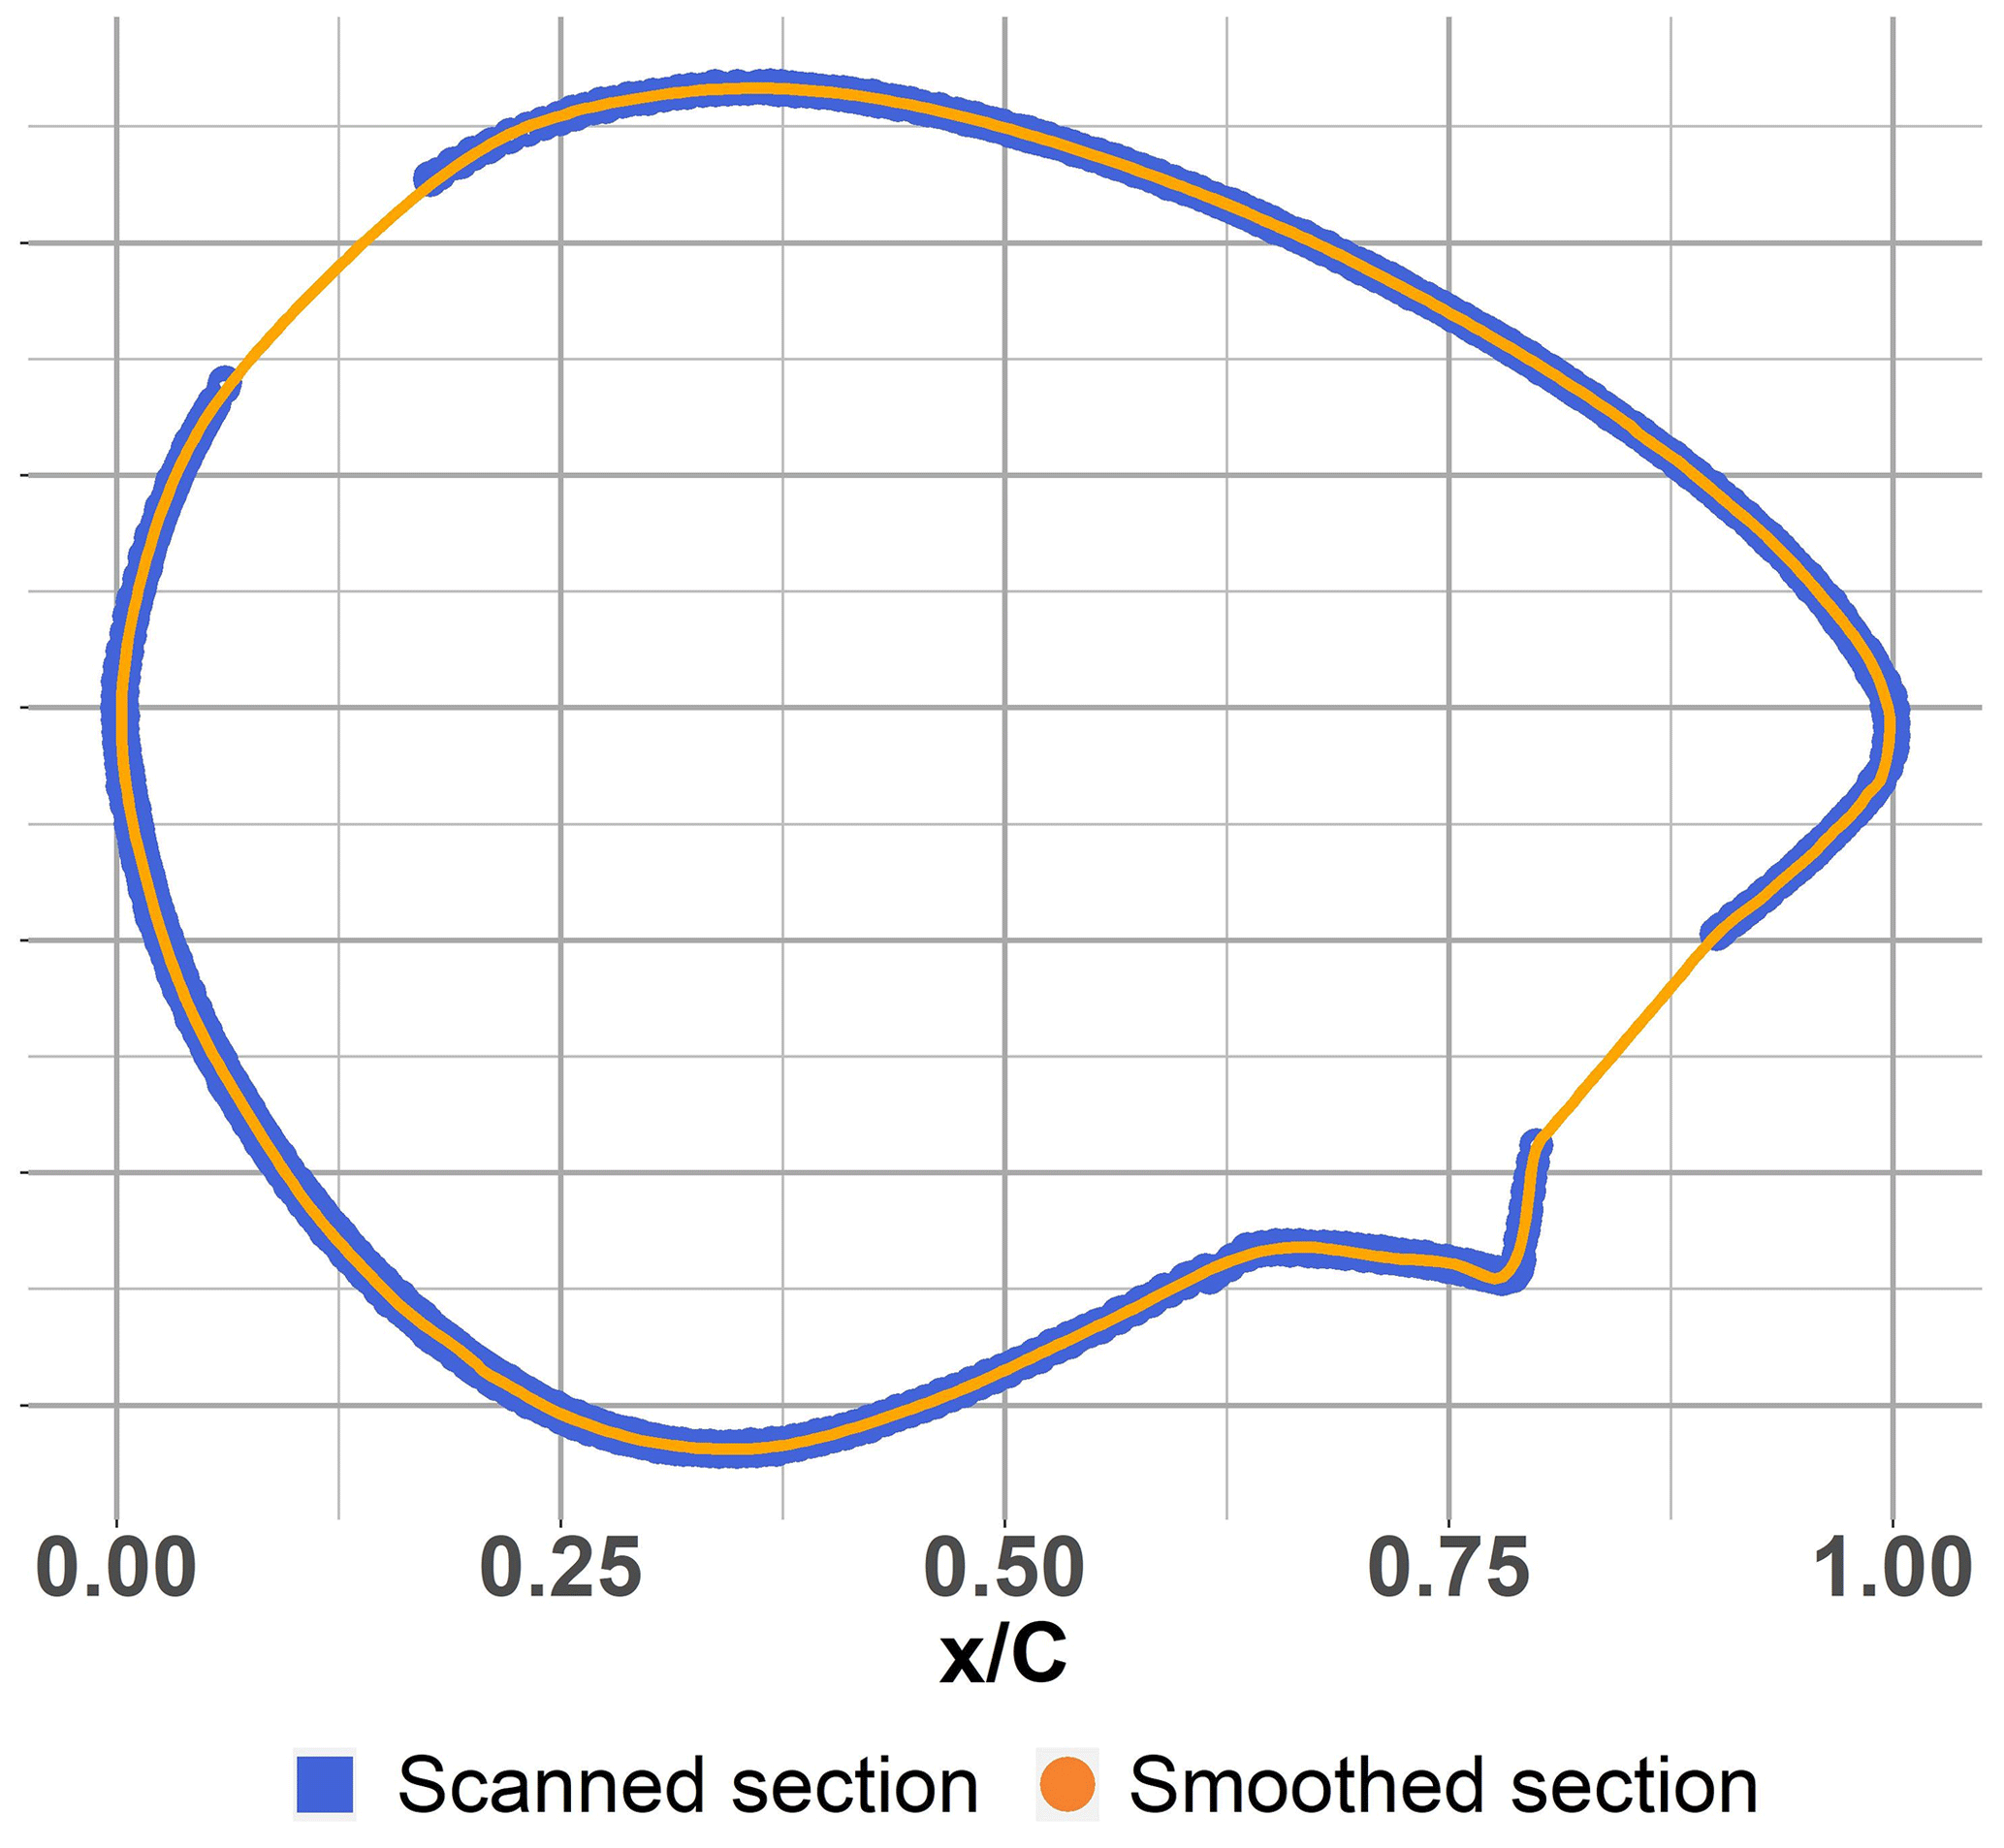
Figure 1Scanned section and smoothed section at radial position R6 ( %). The blue square (blue ▪) shows the scanned point cloud, while the orange dot (orange •) shows the smoothed section.
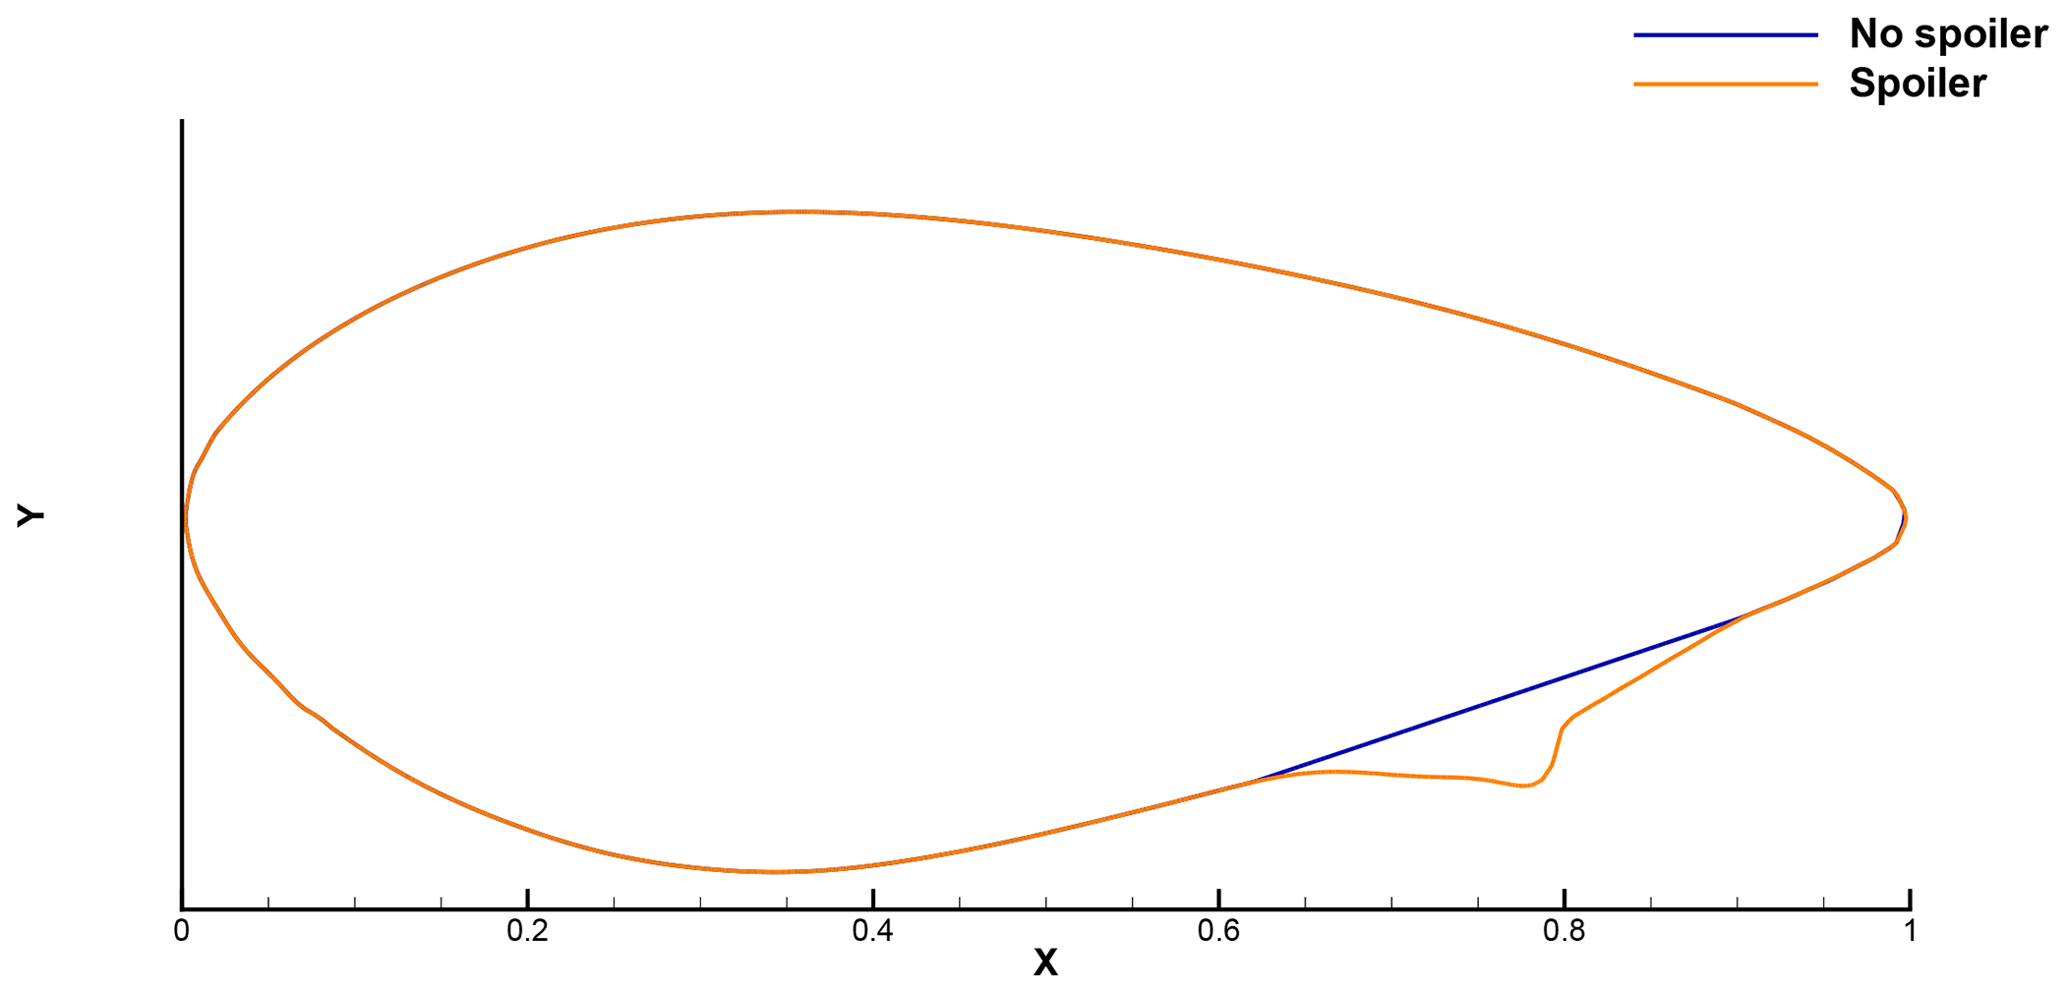
The scanned blade was originally equipped with root spoilers. The blade without spoiler was generated by manually removing parts of the cloud points corresponding to the spoiler location (see Fig. 2), consequently wherever the spoiler is not present both geometries are identical. The unsteady analysis will focus on a single radius at the radial position 6 m from the blade root: %, r is the local radius and R is the blade length, located in the middle of the spoiler. This location was chosen to minimise 3D effects from the spoiler ends, thus ensuring a closer representation of reality when simulated in 2D.
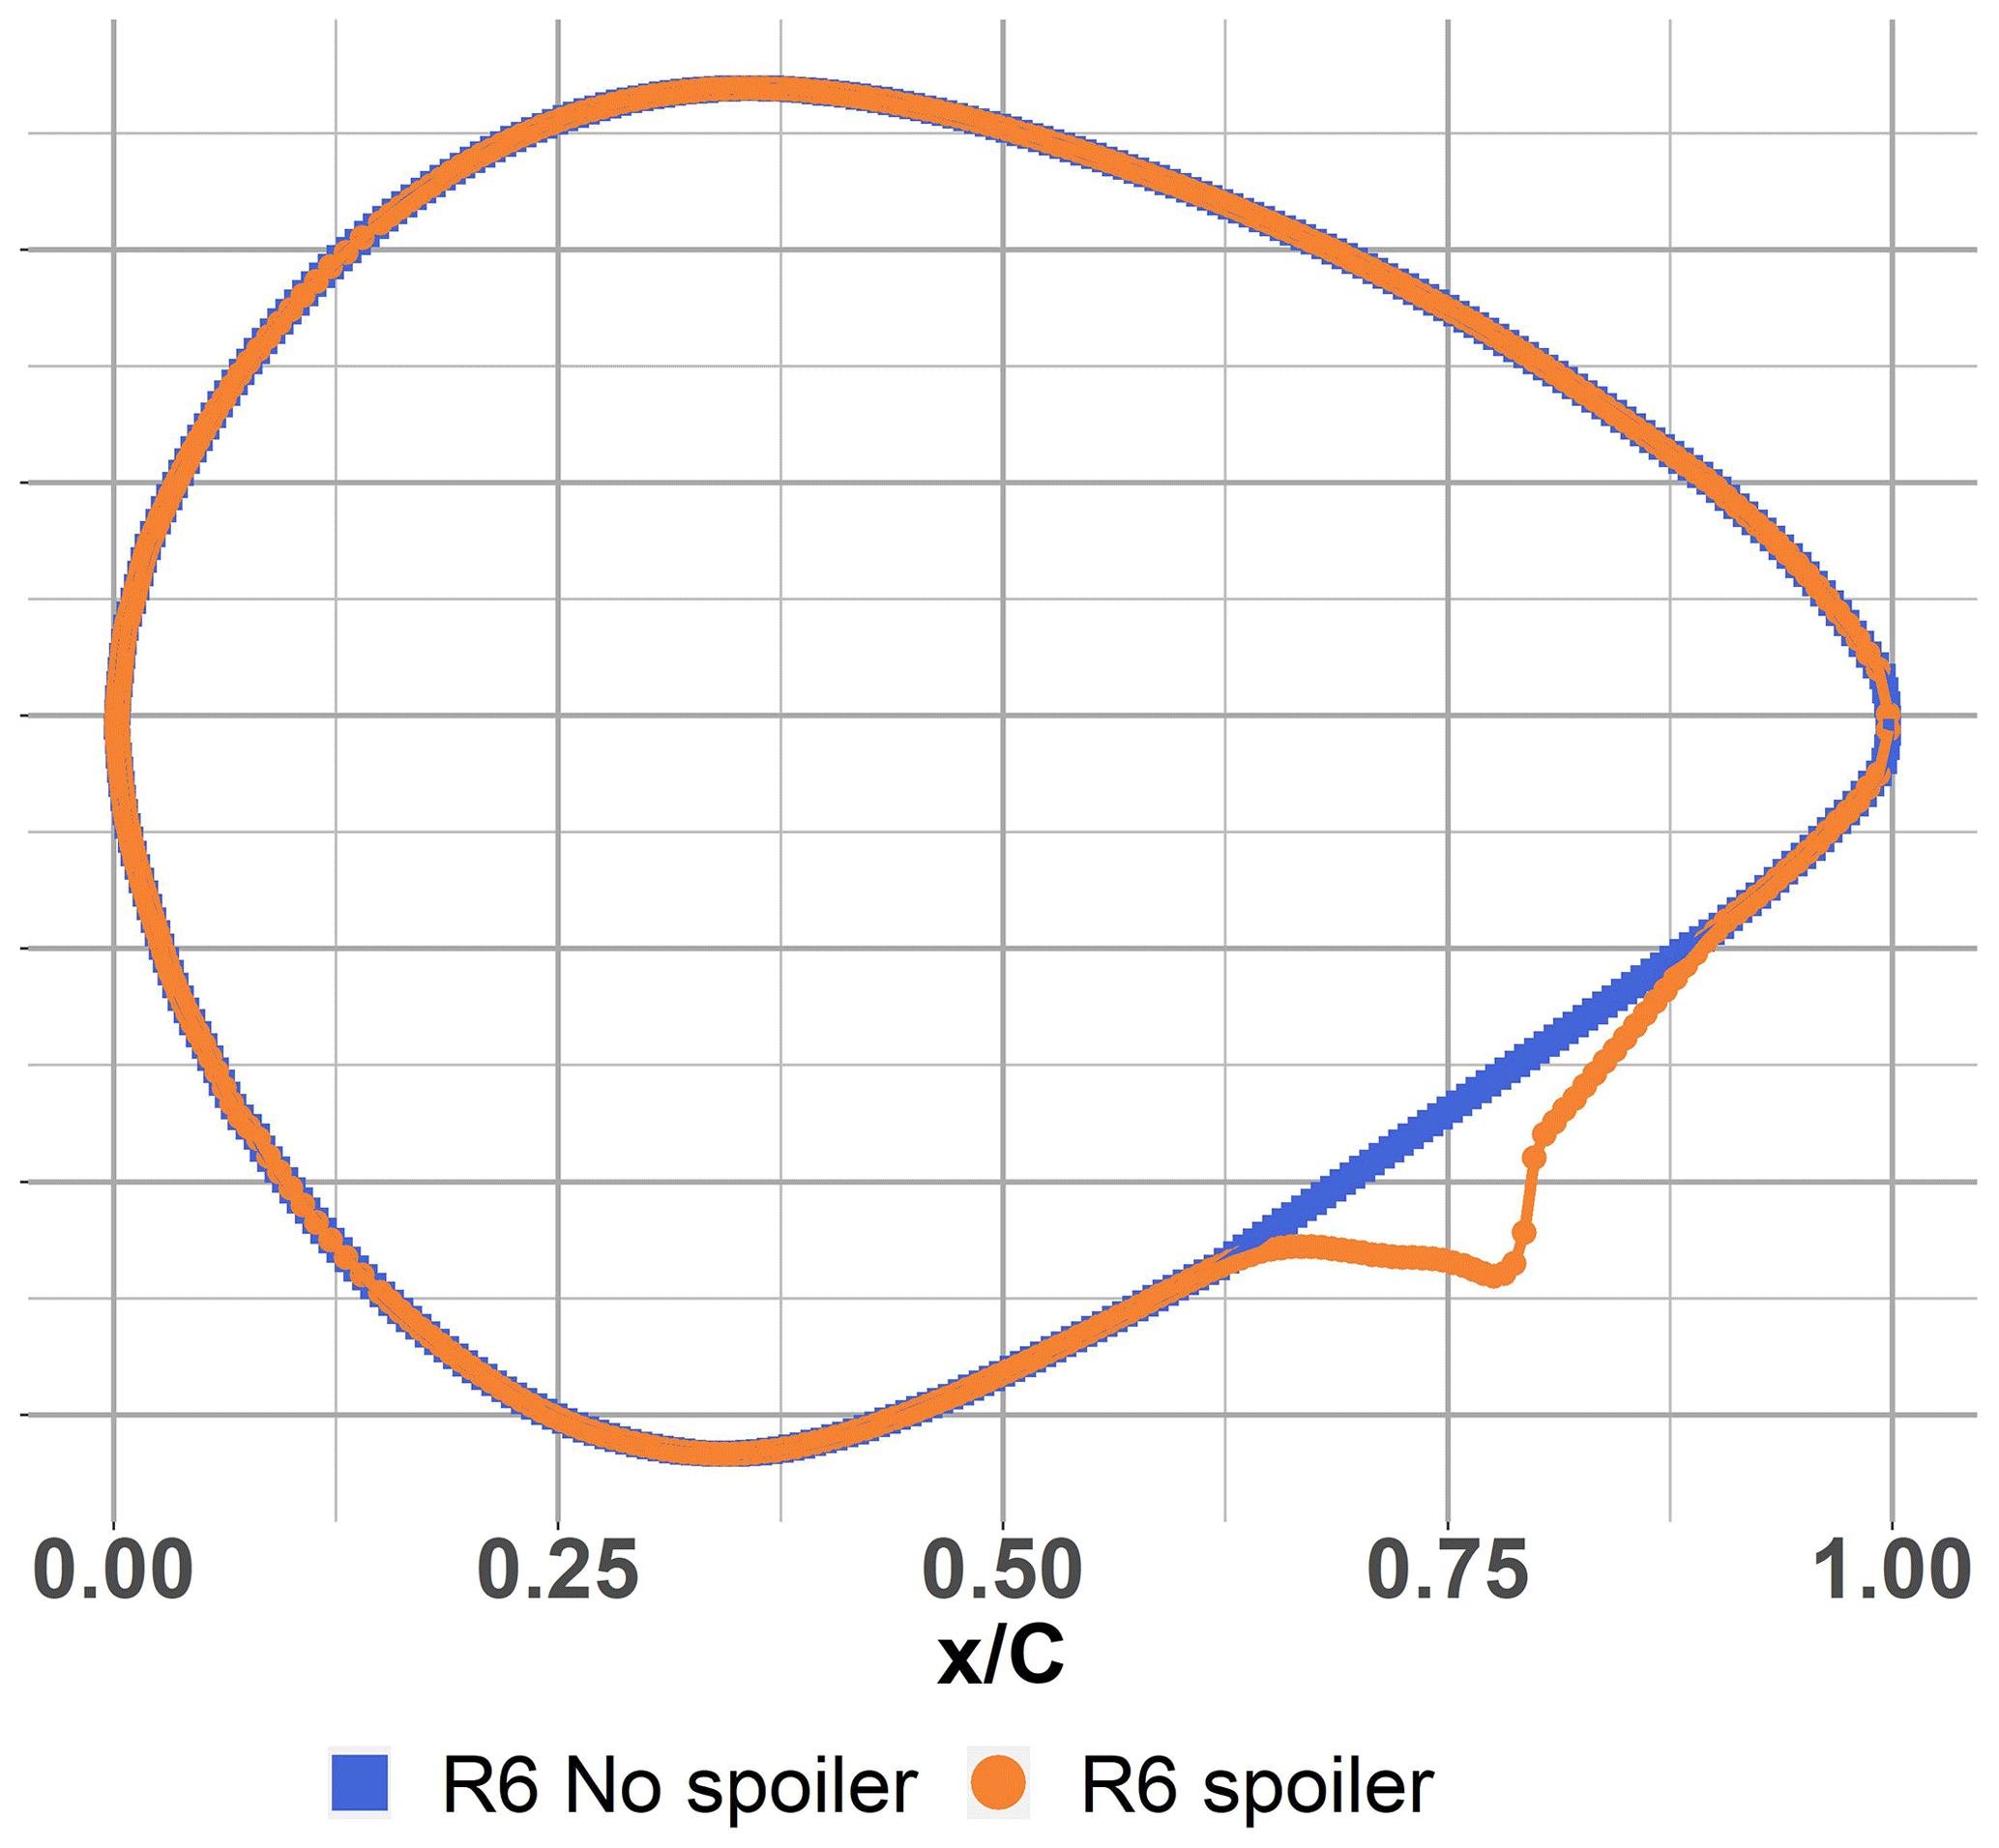
Figure 2Overimposed aerofoil shapes at radial position R6 ( %): the blue square (blue ▪) shows the no spoiler coordinates, while the orange dot (orange •) shows the spoiler coordinates.
3.1 CFD solver
ISIS-CFD, developed by Centrale Nantes and CNRS and available as a part of the FINETM/Marine computing suite, is used in the present study to solve the incompressible unsteady Reynolds-averaged Navier–Stokes (URANS) equations. It is based on the finite-volume method to build the spatial discretisation of the transport equations. The unstructured discretisation is face-based, which means that cells with an arbitrary number of arbitrarily shaped faces are accepted (unstructured mesh). A second-order backward difference scheme is used to discretise time. The solver can simulate both steady and unsteady flows. In the case of turbulent flows, transport equations for the variables in the turbulence model are added to the discretisation.
All flow variables are stored at the geometric centre of arbitrarily shaped cells. Volume and surface integrals are evaluated with second-order accurate approximations. The method is face-based, which means that the net fluxes in the cells are computed face by face. Thus, the cells with an arbitrary number of arbitrarily shaped faces are accepted. Numerical fluxes are reconstructed on the mesh faces by linear extrapolation of the integrand from the neighbouring cell centres. A centred scheme is used for the diffusion terms, whereas for the convective fluxes, a blended scheme with 80 % central and 20 % upwind is used.
The velocity field is obtained from the momentum conservation equations, and the pressure field is extracted from the mass equation constraint, or continuity equation, transformed into a pressure equation. The pressure equation is obtained by the Rhie and Chow interpolation (Rhie and Chow, 1983). The momentum and pressure equations are solved in a segregated manner as in the SIMPLE coupling procedure (Issa, 1986). A detailed description of the discretisation is given by Queutey and Visonneau (2007).
The turbulence model used is shear stress tensor (SST) k–ω (see Menter, 1993). The flow characteristics represent the air at sea level at a temperature of 15 ∘C, i.e. kg m−1 s−1 (dynamic viscosity) and ρ=1.225 kg m−3 (air density). A uniform inflow of 45 m s−1 is set, which induces a chord Reynolds number of for the presented section of %.
3.2 Boundary conditions and mesh independence
A comparison between the existing DANAERO literature both experimental and numerical and ISIS-CFD was performed (see Potentier et al., 2020). The outcome showed the good agreement between the 2D wind tunnel experiment and the 2D URANS ISIS CFD simulations, thus validating the use of ISIS-CFD for 2D external aerodynamic applications. The domain size study has also been performed, and the recommended square domain of 80 chords in length was used. The aerofoil-related surface boundary conditions were described as “no slip wall”. The free-stream velocity condition was imposed on the inlet and upper and lower boundaries, and the outlet boundary used the “prescribed pressure” condition. Finally, was imposed on the aerofoil surfaces, and the automatic grid refinement feature was activated so as to track more accurately the wake vortices (see Wackers et al., 2014, 2017). The “no spoiler” aerofoil is originally described with 362 pairs of [X; Y] coordinates and the “spoiler” with 503. The leading edges are both positioned at [0; 0]. A convergence study was carried out using the lift and drag coefficients, and during the mesh refinement the number of faces defining the aerofoil geometry changed as described in Tables 1 and 2. FINETM/Marine provides the time series for the lift (L) and drag (D) evolution, and the respective coefficients are calculated by Eq. (1).
where U∞ is the relative velocity of 45 m s−1 and c the aerofoil chord. Four meshes were tested to assess the grid independence: coarse, medium, fine, and very fine. Both cases used the same input conditions for the viscous layer insertion and automatic grid refinement for each mesh. Because the calculations were performed using the automatic grid refinement, the Richardson extrapolation is calculated using the final mesh configuration.
Table 1Grid independence study for the scanned blade without spoiler at α=0∘ and .
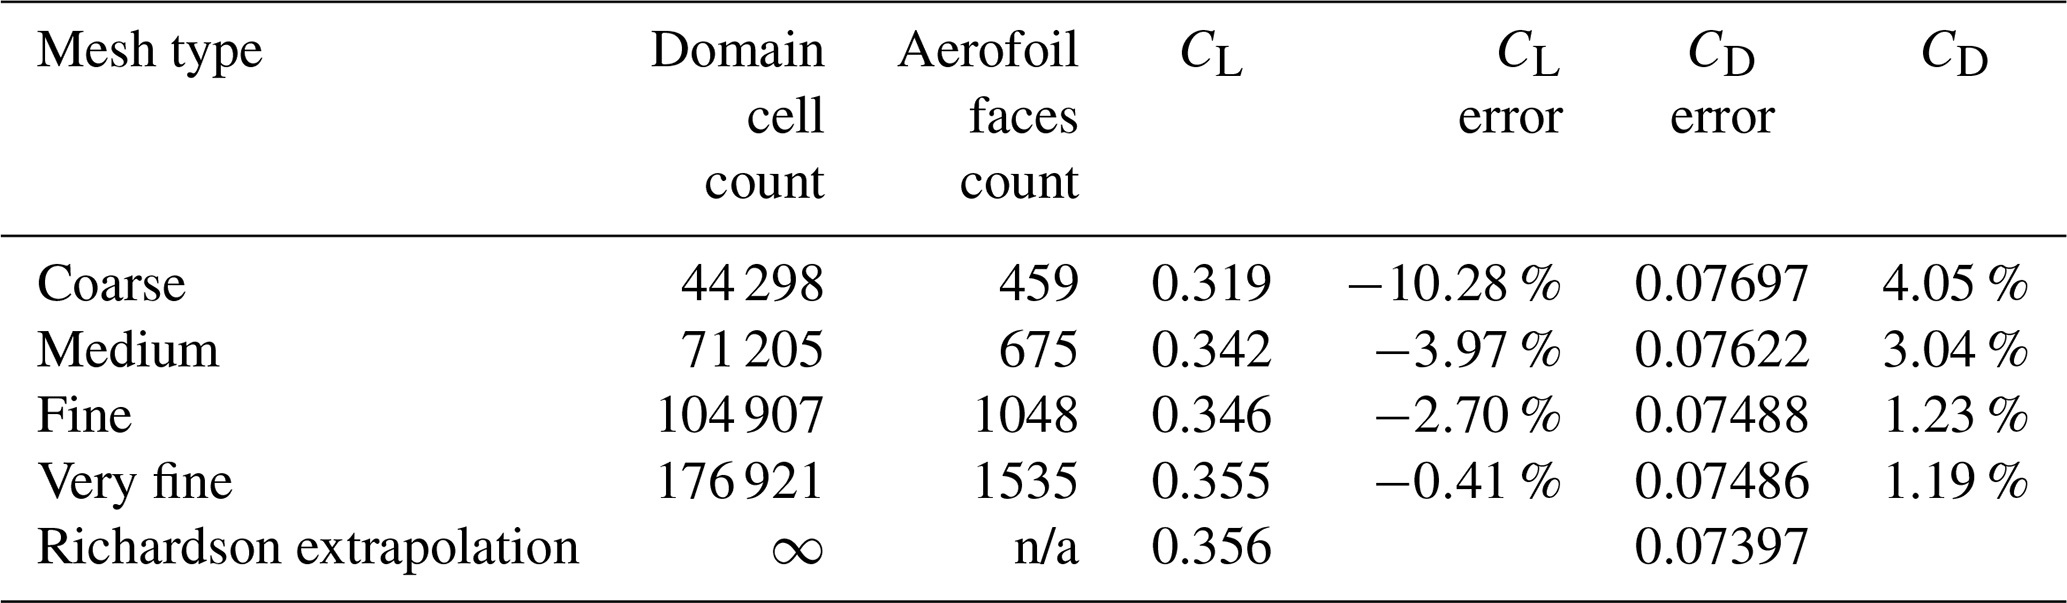
n/a stands for not applicable.
Table 2Grid independence study for the scanned blade with spoiler at α=0∘ and .
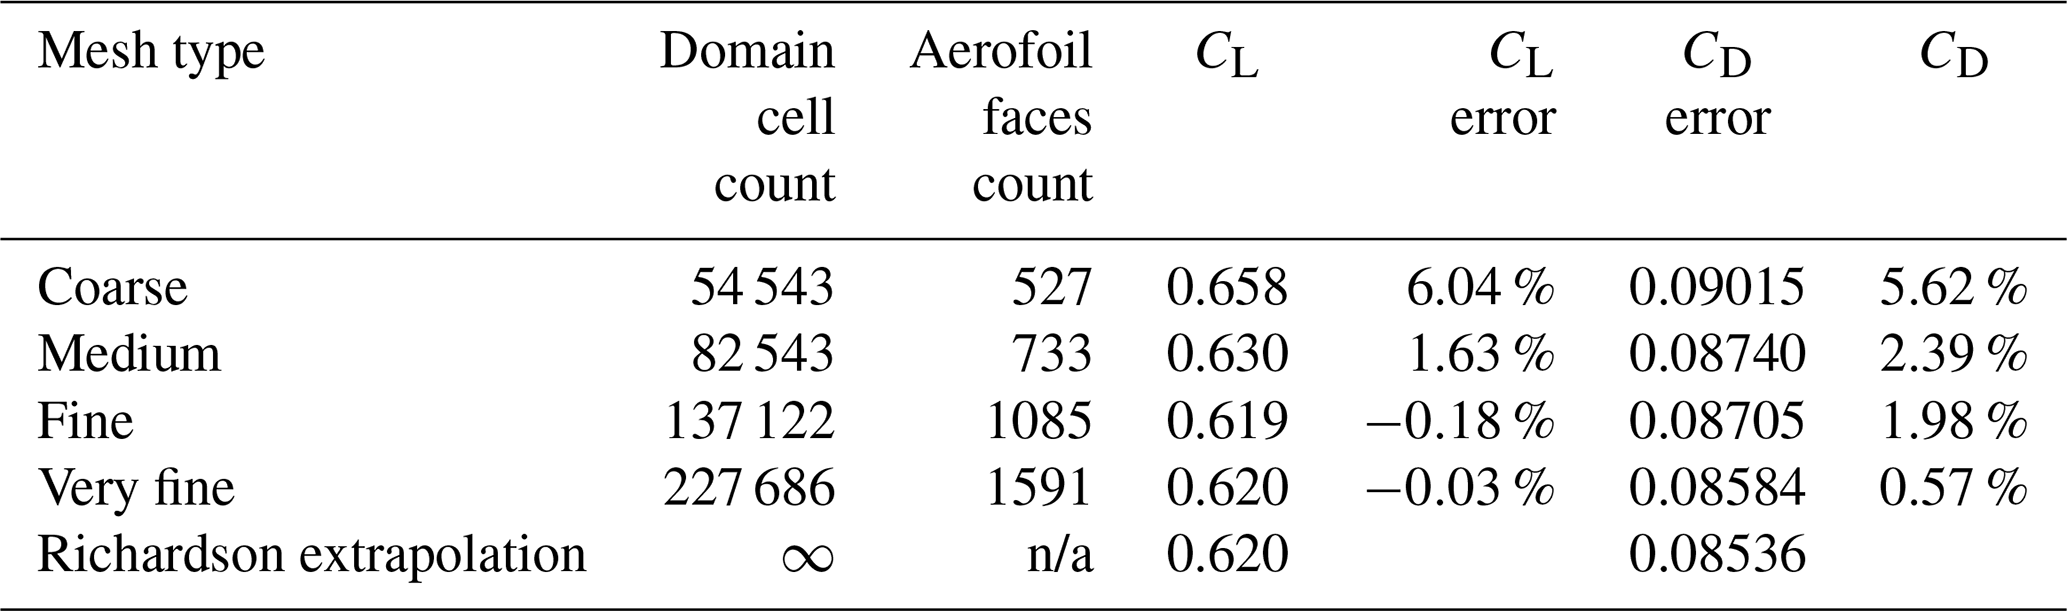
n/a stands for not applicable.
The results in Tables 1 and 2 show that the grid is independent in both CL and CD. The error between the “very fine” and “fine” mesh is small enough to be acceptable. For the rest of the study, the fine mesh will be used.
A time step convergence study using the “fine grid” has also been performed and summarised in Table 3. The chosen time step for the rest of the study is s because of the good balance between result accuracy and rapidity to achieve convergence.
Table 3Time step independence study for the scanned blade with spoiler at α=0∘ and .
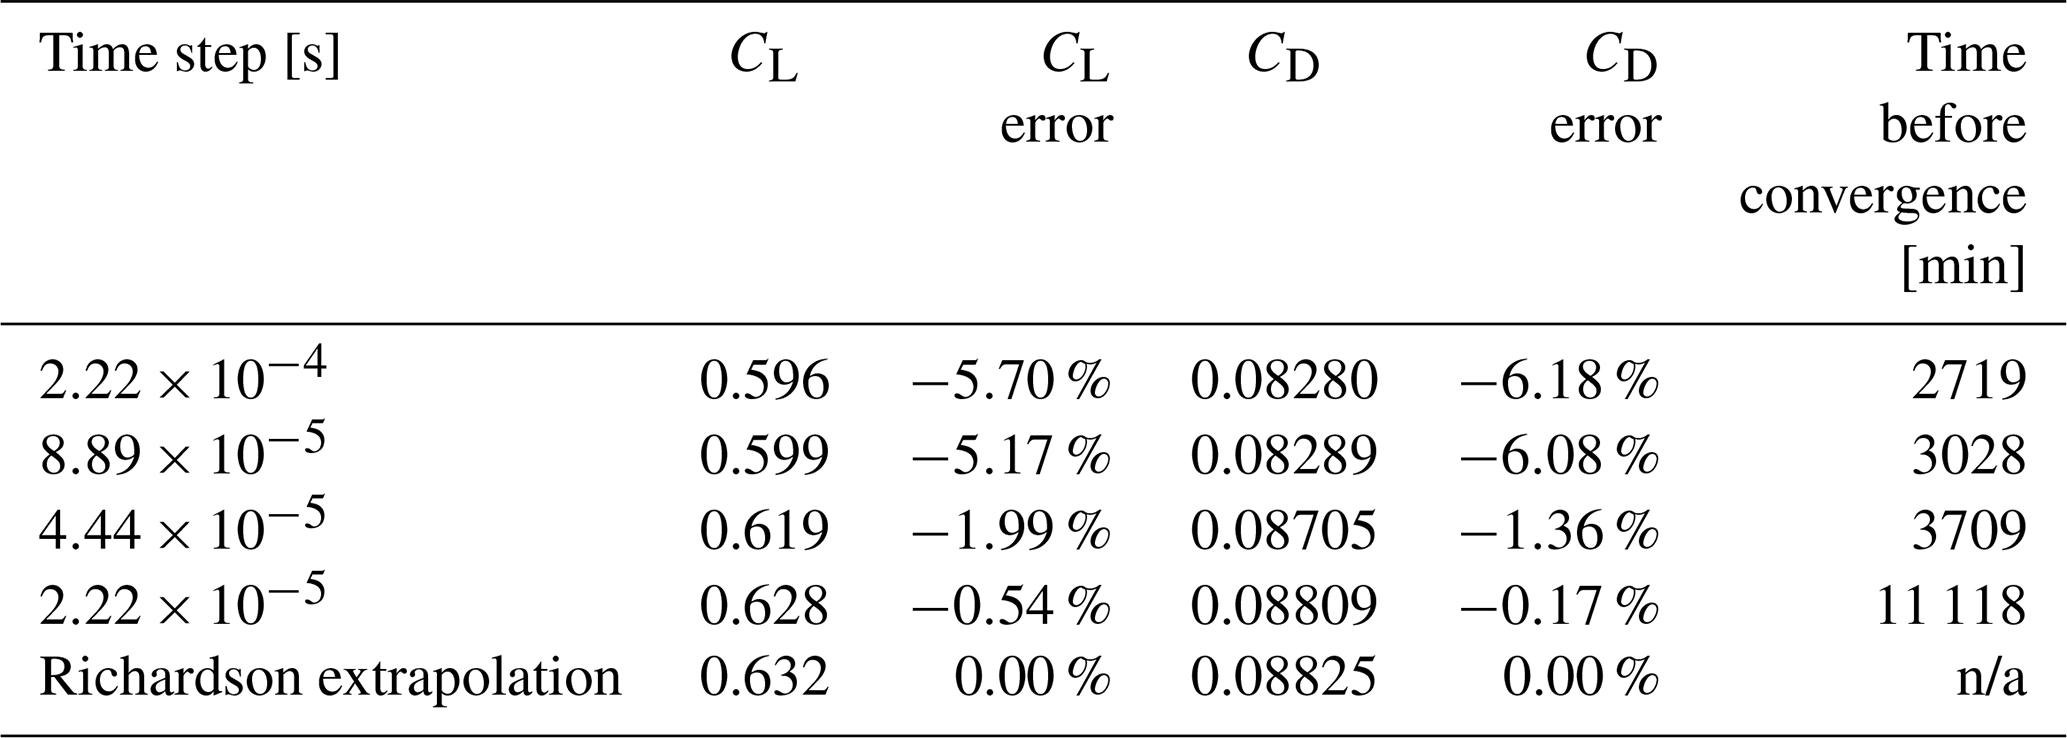
n/a stands for not applicable.
The impact of the spoiler previously described (see Sect. 2.1) is analysed in this section at the blade location, %. It will be done using URANS simulations from the ISIS-CFD solver described in Sect. 3. The steady and unsteady simulation outcomes with and without spoiler are compared in terms of aerodynamic forces, local pressure, velocity distribution, power spectral density, and instantaneous spatial vortex organisation in Sect. 4.1 and 4.2.
4.1 Steady aerodynamics
A comprehension of averaged phenomena is necessary before analysing the unsteady behaviour. We will first focus on the angle of attack α=6∘, in the linear part of the lift curve, where aerofoils usually operate on a megawatt-sized turbine. Also, it illustrates the first noticeable unsteadiness in the flow, which will be detailed later.
4.1.1 Mean flow reorganisation
The high-velocity region on the upper side (Fig. 3), associated with a low field pressure level (Fig. 4), exhibits a longer overspeed area over the upper side for the spoiler case than for the no spoiler case. It induces a longer and stronger negative pressure (see Fig. 4), in good qualitative agreement with the steady results from Gonzalez-Salcedo (2016). On the contrary, on the lower side, the high velocity region (Fig. 3) is more important for the no spoiler case than for the spoiler case, inducing a larger negative pressure region on the lower side of the aerofoil.
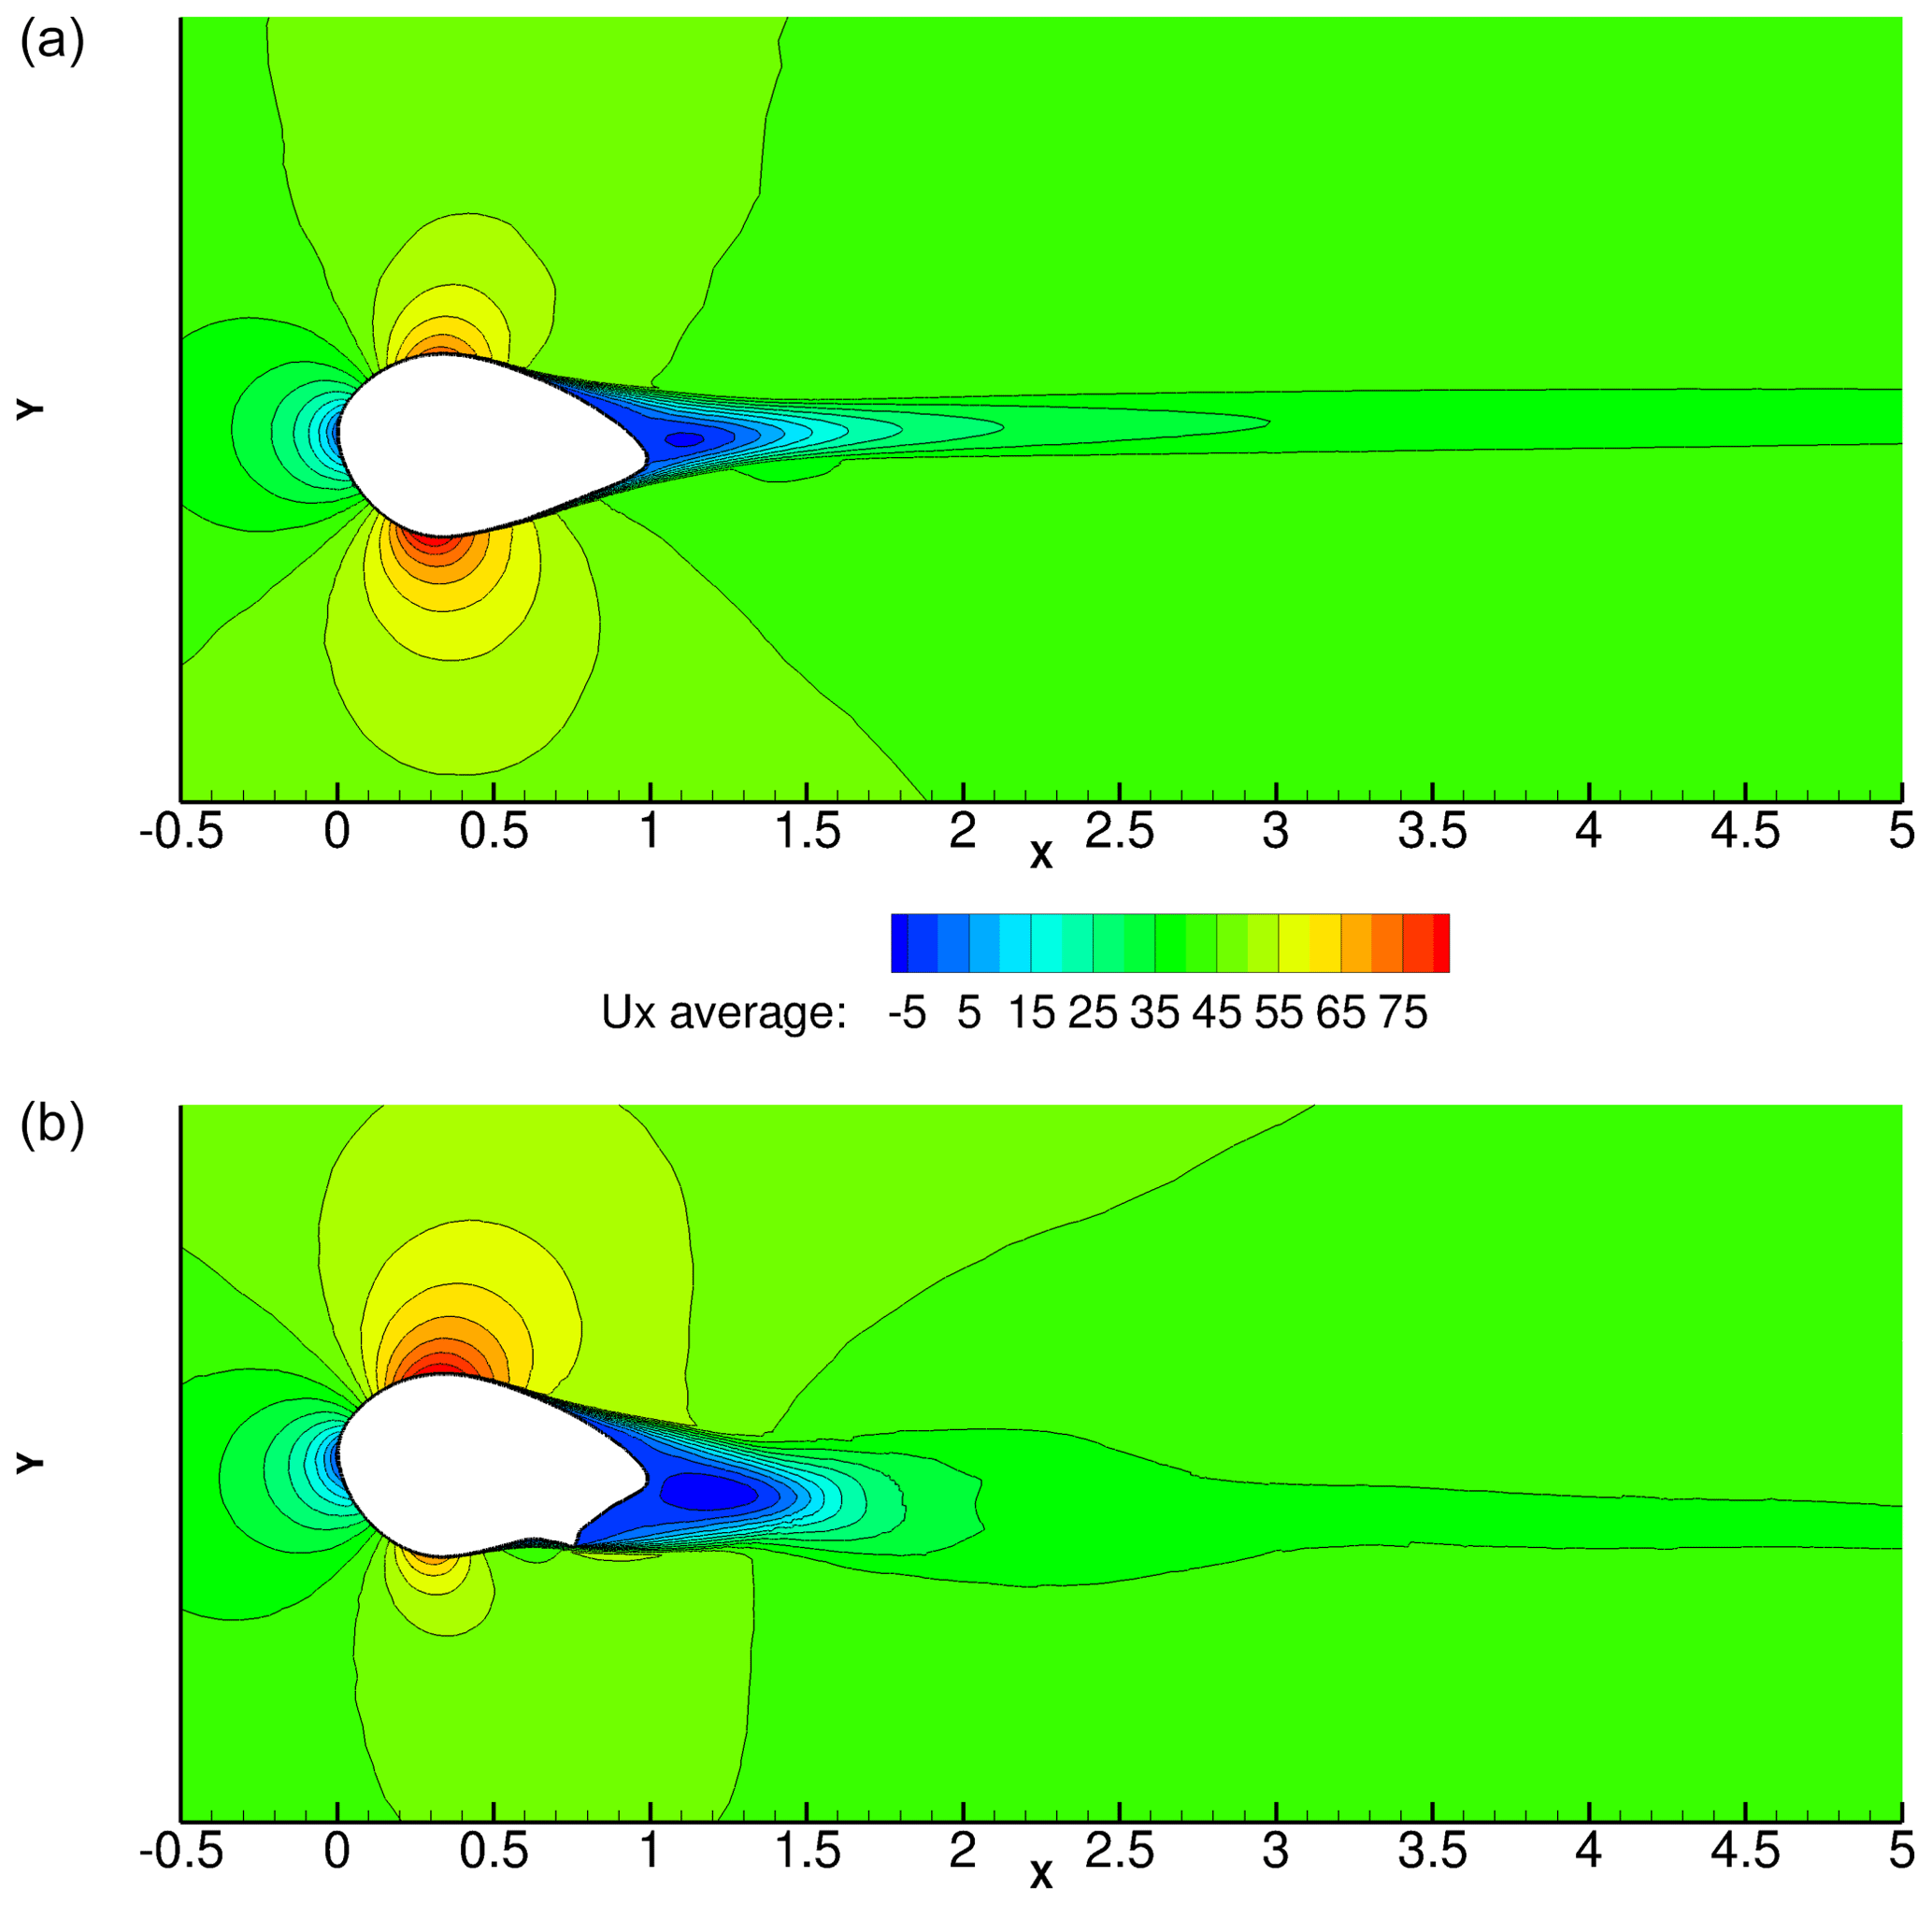
Figure 3Average horizontal wind speed contour plot for α=6∘ and : (a) no spoiler case and (b) spoiler case.
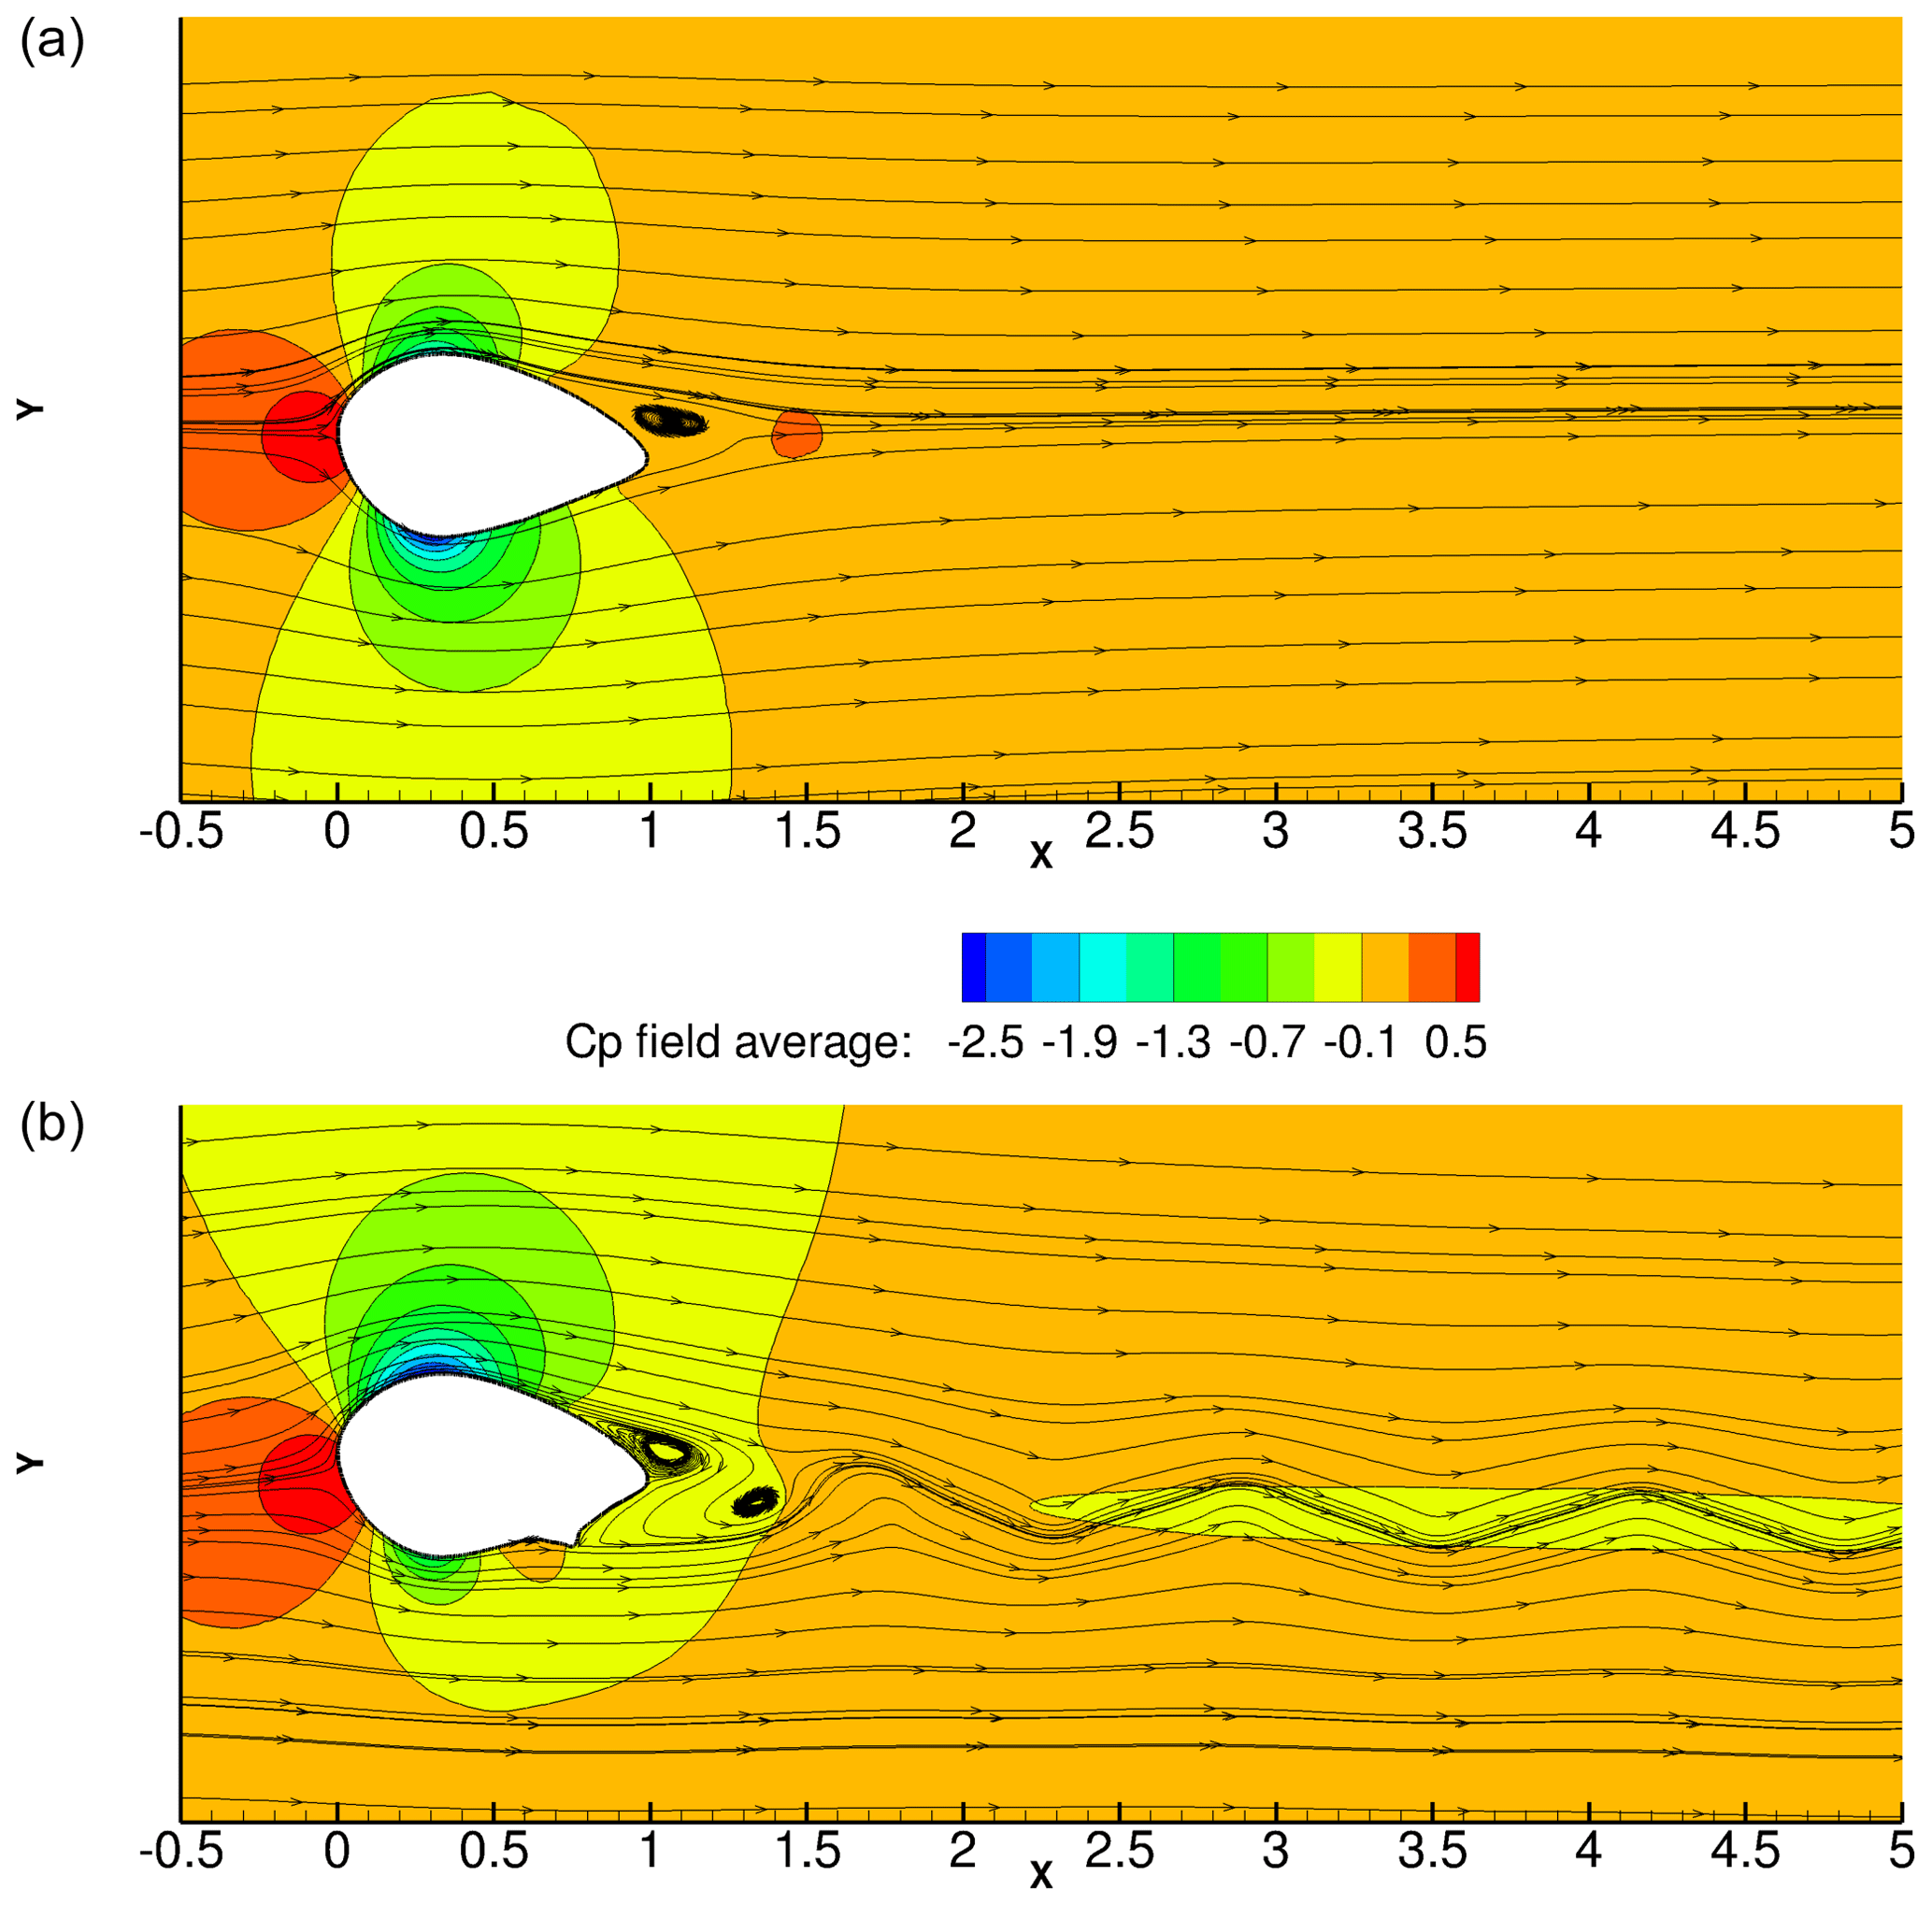
Figure 4Average pressure field contour plot and instantaneous velocity streamlines for α=6∘ and : (a) no spoiler case and (b) spoiler case.
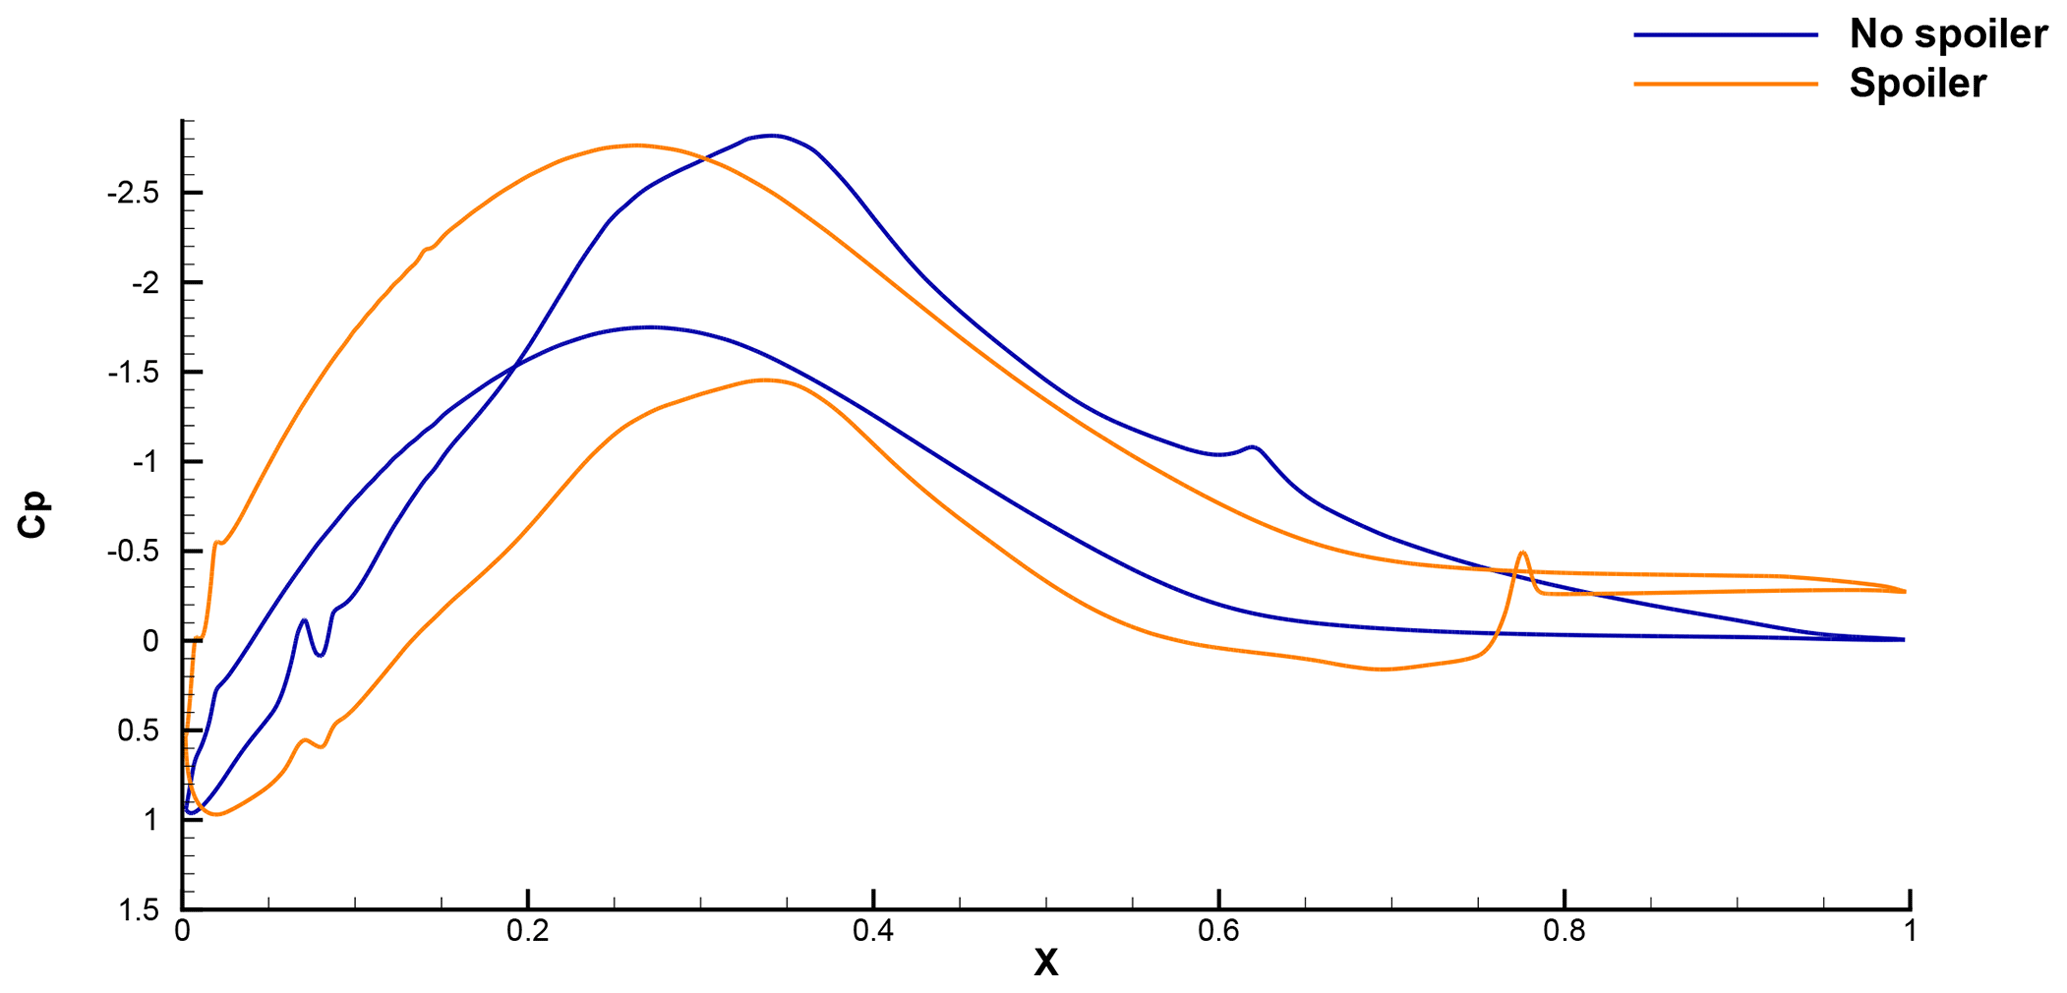
At the wall, the associated pressure coefficient (Cp) clearly shows that the aerofoil with spoiler has a distribution closer to thinner aerofoils, with a much larger net area between the upper and lower curves and thus a much larger lift than the reference case (see Fig. 6).
4.1.2 Steady aerodynamic polar
For α=6∘, the lift gain when adding a spoiler is ΔCL=1.34. This gain however varies with the angle of attack, as can be seen in Fig. 7. For the no spoiler case, between −4 and 10∘, the CL decreasing in the linear region to reach negative values. This phenomena has been reported by Schaffarczyk and Arakawa (2020), where they analysed a symmetrical thick profile without spoiler at a higher Reynolds number (). Between 10 and 14∘ the CL increases along with the CD. Beyond 14∘ both aerodynamic coefficients exhibit a bluff-body behaviour. Whereas, for the spoiler case, the lift behaviour is more usual for such Reynolds numbers, a clear negative stall in the vicinity of −4∘ can be seen and a positive stall around 8∘ can be seen despite the constant CL increase.
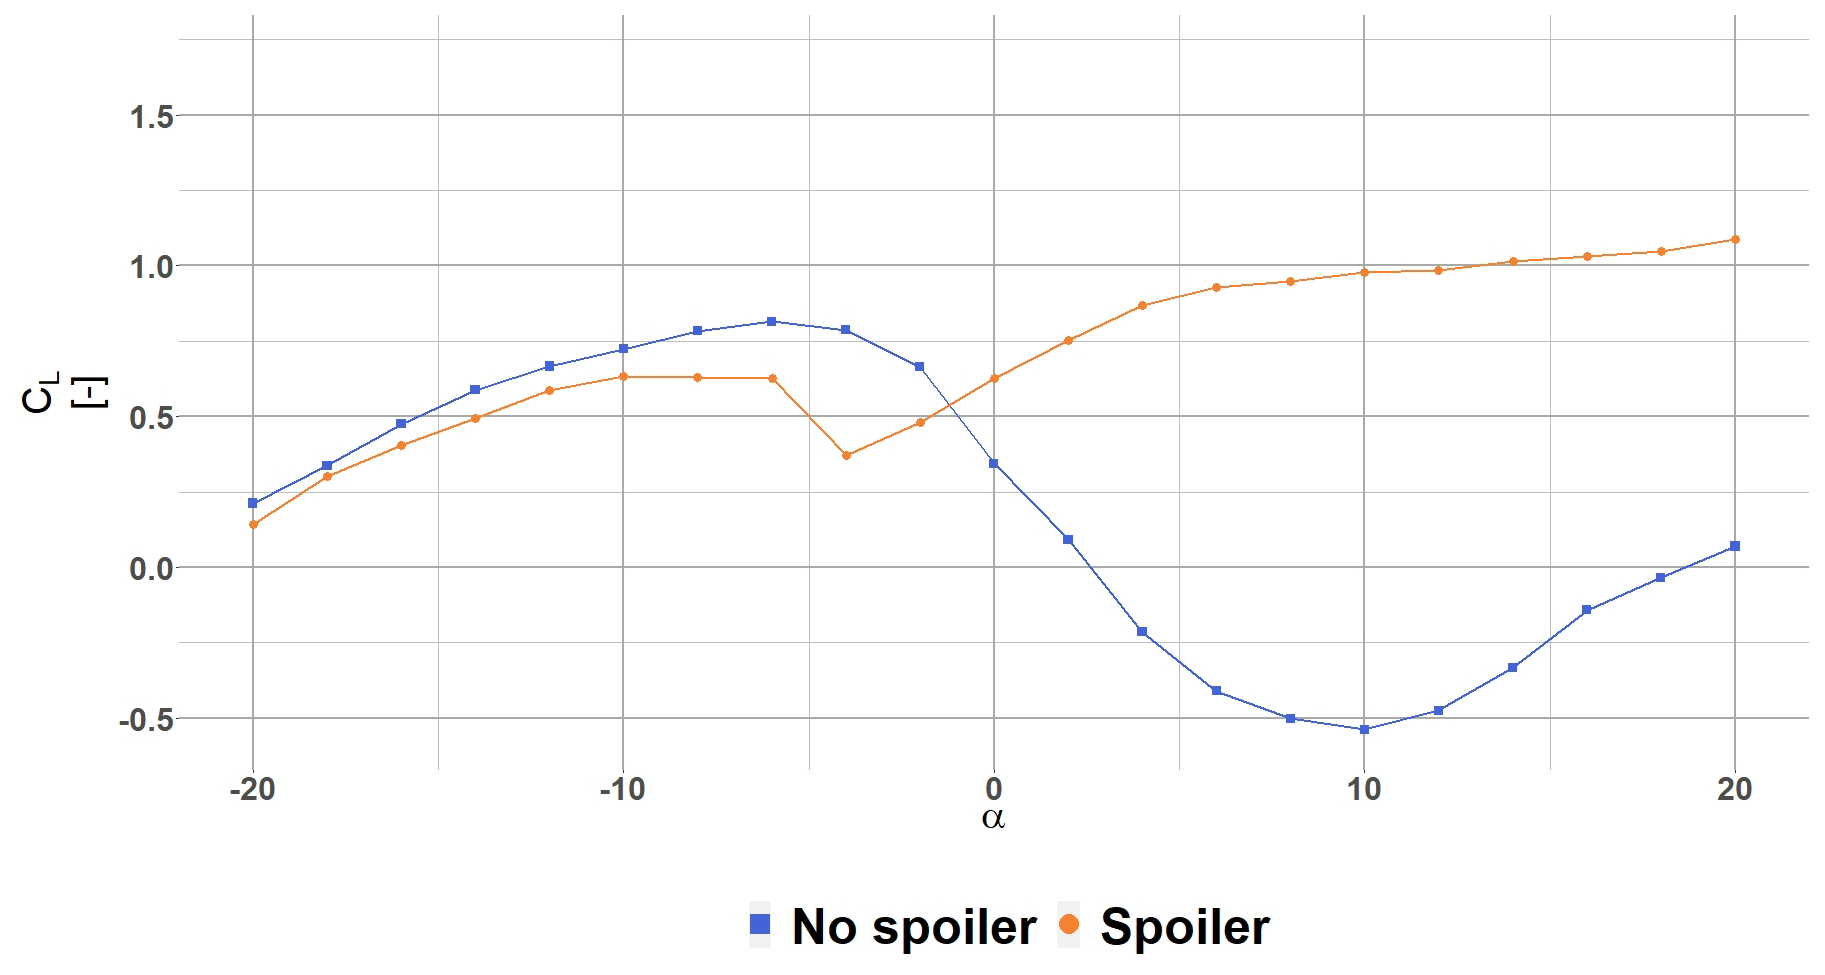
Figure 7Lift coefficient polar for the radial position R6 ( %). The blue square (blue ▪) shows the CL for the no spoiler case, and the orange dot (orange •) shows the CL for the spoiler case.
In the wake region, the mean streamwise velocity component, Ux, shows that the mean recirculating area (negative streamwise velocity) behind the aerofoil with spoiler is wider and extends further downstream (see Fig. 3) compared to the no spoiler case. This larger wake reflects a drag penalty generated by the spoiler addition that is found to be of the order of ΔCD=0.0825 for α=6∘. Again, the penalty is highly dependent on the angle of attack (see Fig. 8). There is almost no drag penalty at low angles of attack, up to α=0∘. Beyond, the spoiler operates at a significantly higher CD than the no spoiler case.
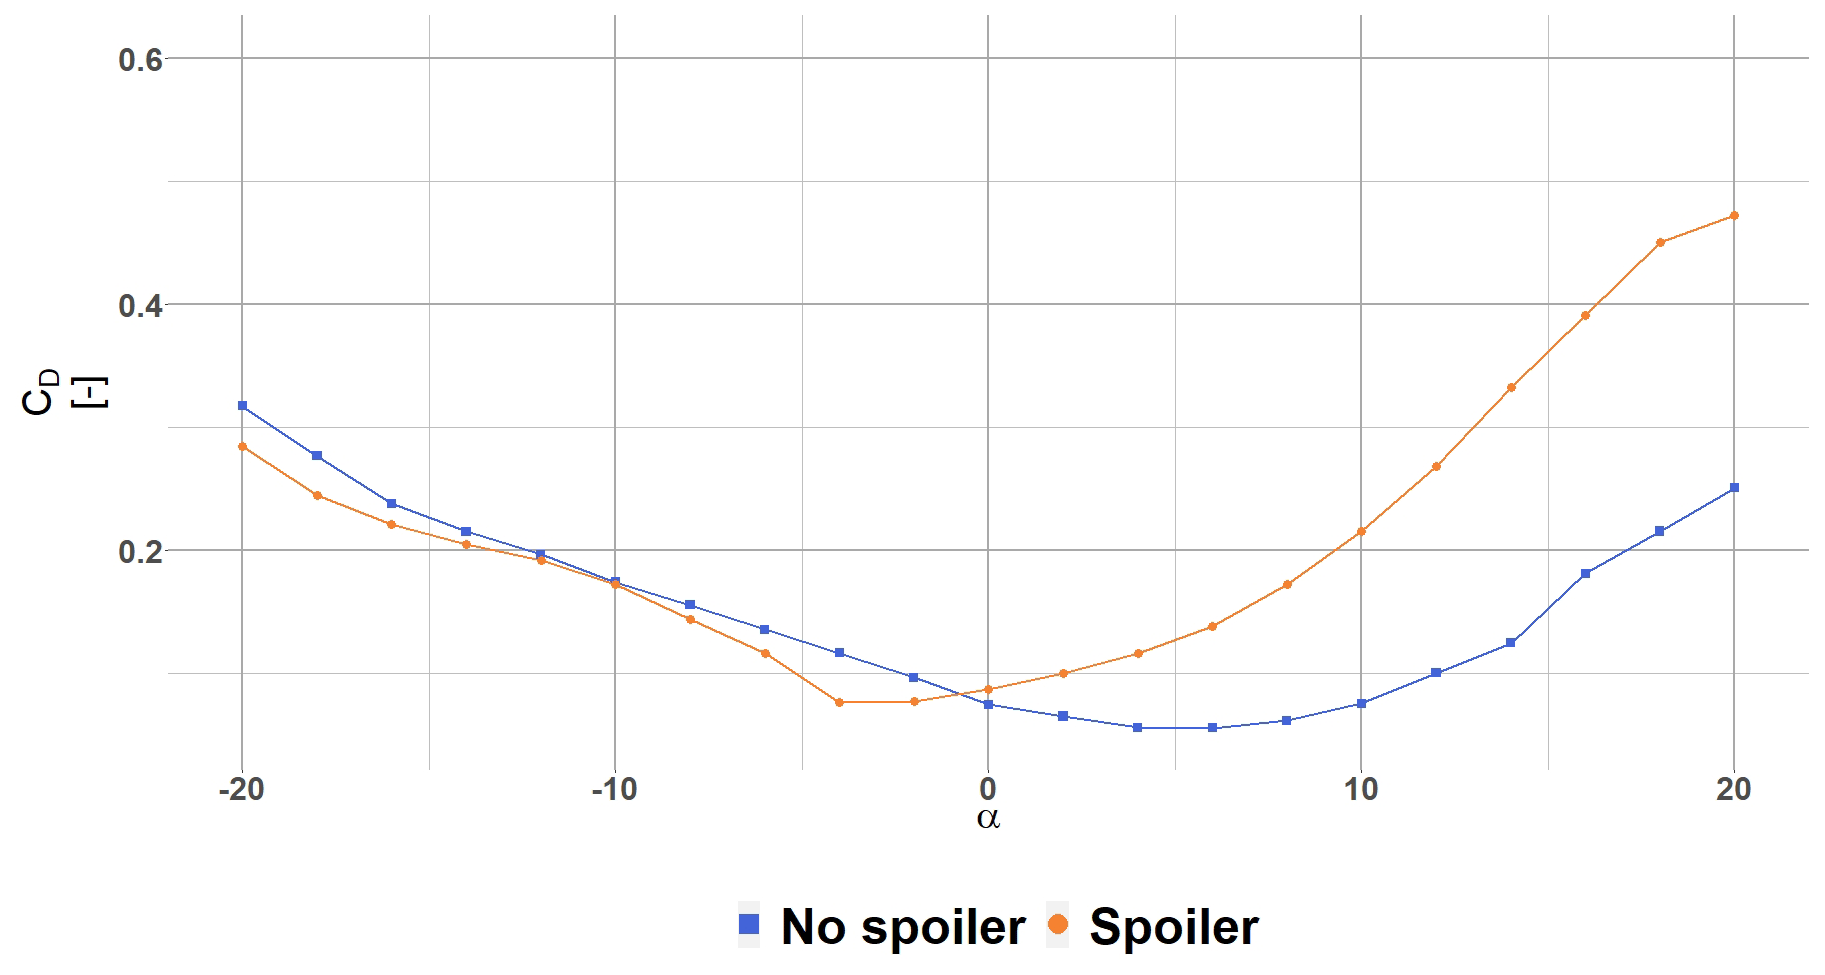
Figure 8Drag coefficient polar for the radial position R6 ( %). The blue square (blue ▪) shows the CD for the no spoiler case, and the orange dot (orange •) shows the CD for the spoiler case.
In summary, the impact of the spoiler is to redistribute global forces so that the thick root sections become more efficient in terms of lift force at the cost of drag penalty. This known conclusion is in good agreement with the literature of sub-boundary layer GF, except that the lift gain and the drag penalty are much more important and quantified here (ΔCL=1.34 and ΔCD=0.0825 for α=6∘). Globally, in terms of lift gain, adding a spoiler is found to be detrimental for the negative angles of attack while of high interest for higher angles of attack. Another drawback of the spoiler addition is the unsteady effects such as shown by the waviness in the instantaneous streamlines behind the spoiler case (see Fig. 4) and will be detailed in the following section. To the authors' knowledge, the unsteadiness behind large devices at high Reynolds numbers has not been evaluated. Unsteady Reynolds-averaged Navier–Stokes results of such phenomena are detailed in Sect. 4.2.
4.2 Unsteady aerodynamics
The unsteady flow organisation behind thick aerofoil profiles with or without AAOs at high Reynolds numbers is studied here. The flow analysis focuses on such a configuration for one angle of attack first (α=6∘), and then the aerodynamic polar ranging from will be presented. Unsteady impacts of AAO mostly focus on the wake region, which will be analysed further in terms of instantaneous vorticity, Q criteria, local (wall pressure) and global forces, and power spectral density (PSD) analysis.
4.2.1 Wake region
The wake can be separated into a near-wake region, from , and a far-wake region, which extends to half of the computing domain (20 chords in length). This far wake is shown in a truncated illustration in Figs. 3 and 4 until .
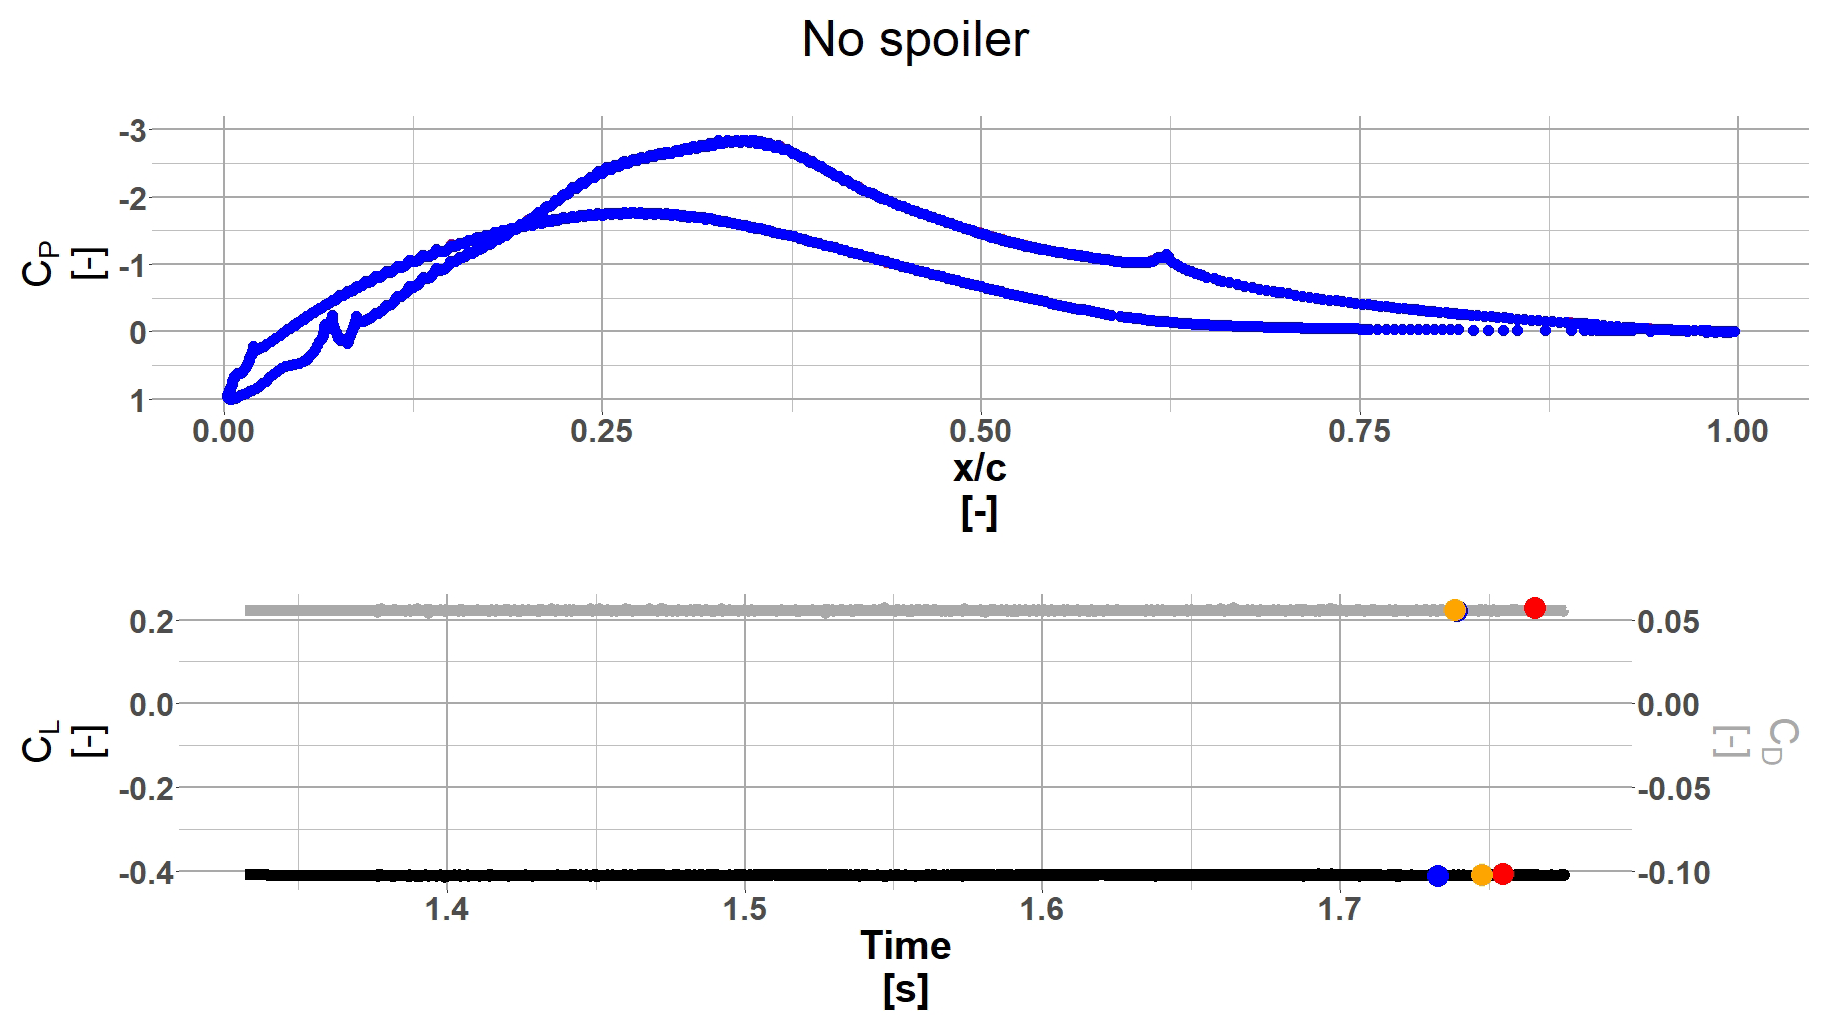
Figure 9No spoiler case Cp and aerodynamic coefficient evolution in time α=6∘ and . For both the Cp and plot, the blue dot (blue •) corresponds to the minimum CL, and the red dot (red •) corresponds to the maximum CL. In the plot the orange dot (orange •) corresponds to the mean CL.
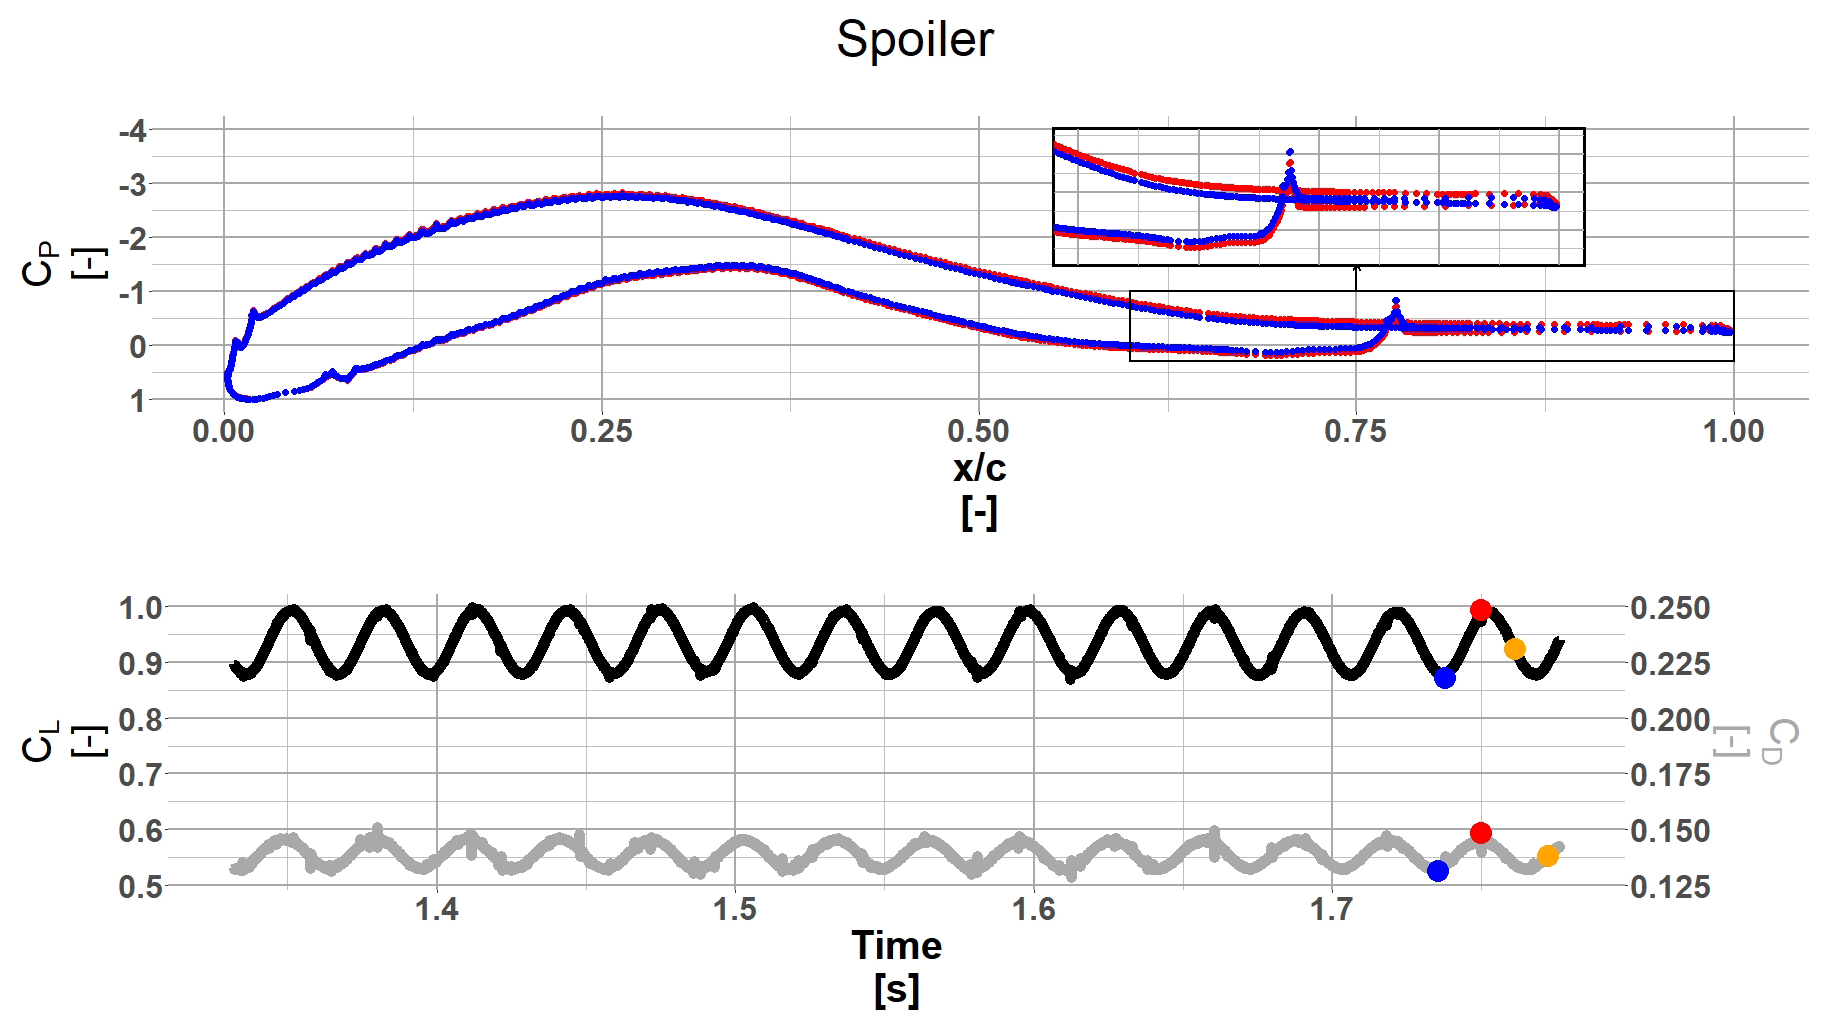
Figure 10Spoiler case Cp and aerodynamic coefficient evolution in time α=6∘ and . For both the Cp and plot, the blue dot (blue •) corresponds to the minimum CL, and the red dot (red •) corresponds to the maximum CL. In the plot the orange dot (orange •) corresponds to the mean CL.
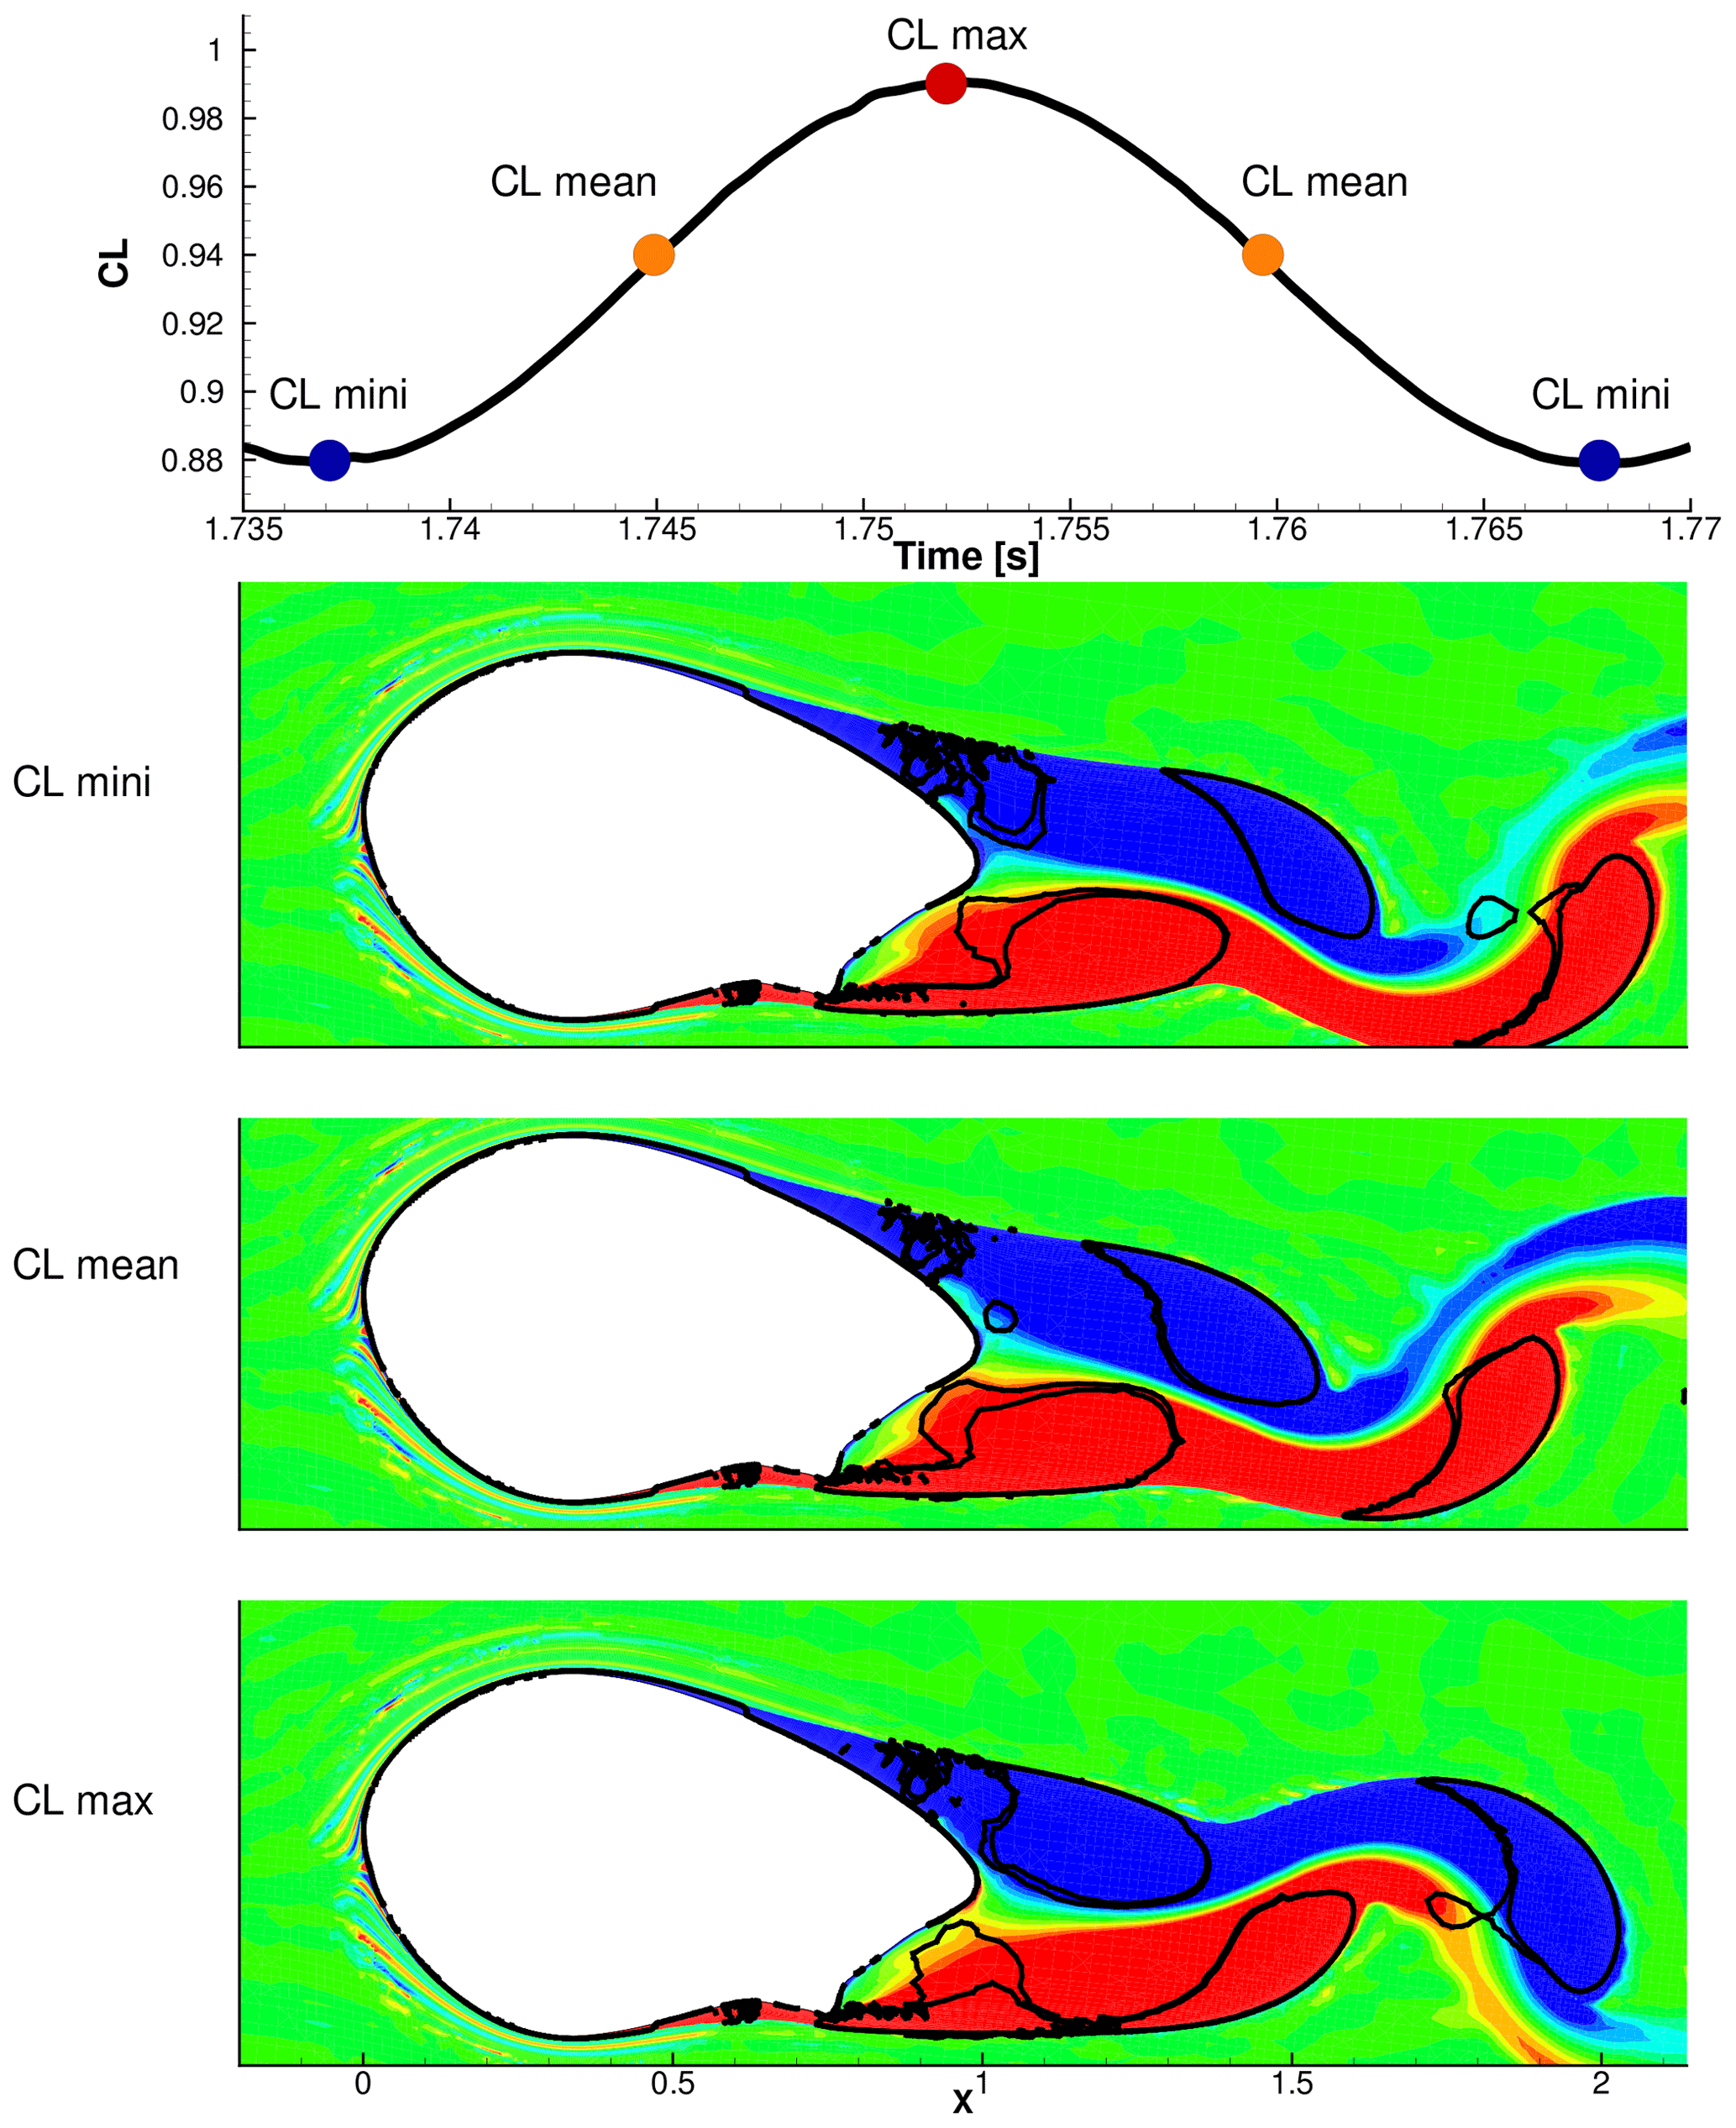
Figure 11Spoiler case illustration of vortices in the vicinity of the trailing edge in relation with the lift coefficient evolution for α=6∘ and . The contour plots depict instantaneous vorticity contour with Q-criteria lines.
Near-wake region
After the convergence is reached, the spoiler case shows a periodic CL and CD behaviour, whereas the no spoiler case does not vary in time (see Fig. 9), as expected. For the spoiler case, the net area between the Cp curves varies progressively in synchronicity with the CL extrema (the red dot illustrates and the blue dot corresponds to in Fig. 10), leading to a progressive increase and decrease in the lift and drag, as illustrated in Fig. 11.
The near-wake region is zoomed in Fig. 12. It is illustrated by co-plotting a snapshot of the vorticity sign with the Q criteria. Both instantaneous snapshots show vortices formed in the near-wake region due to the roll-up of the separated shear layers from both, the upper and lower sides of the aerofoil. For the no spoiler case, the black lines (isolines of clearly show that vortices are symmetric with the wake centre line. For the spoiler case, the separation of the shear layer clearly starts on the lower side of the aerofoil while the black lines are no longer symmetric with the wake centre line. The time evolution of this near-wake organisation exhibits periodic interaction of vortices from each side of the aerofoil. The vortex from the pressure side is rolling up onto the suction side, thereby forcing the upper side separation periodically (see attached movie).

Figure 12Vorticity contour plot with Q-criteria lines for α=6∘ and : (a) no spoiler case and (b) spoiler case. Red is anticlockwise flow rotation, and blue is clockwise flow rotation.
In terms of energy production, it is interesting to extract the snapshot of the near-wake organisation at the optimal lift-to-drag ratio, which also occurs at . For that purpose, the different CL can be analysed together with the spatial vortex organisation (see Fig. 11). The lift is at its minimum (blue dots) when the top vortex is “far” from the trailing edge and the lower side vortex is rolling up toward the upper side. The mean CL (orange dots) is characterised by having both vortices close to the trailing edge: the top side vortex already separated from the surface and the lower one still attached to the spoiler's tip. Finally, the maximum lift (red dot) is seen when the lower side vortex is about to separate from the spoiler's tip and the upper side vortex is at its maximum size (it just left the aerofoil's surface). Consequently, it indicates that the pressure is at its lowest on the upper side. Therefore, in terms of energy production, having shed vortices at their maximum size and the closest to the trailing edge is the best flow organisation.
Far-wake region
In the far-wake region, a single peak frequency emerges, with its harmonics, that can be extracted at using PSD analysis (see Fig. 13). The energy content for the no spoiler case is several orders of magnitude lower than the spoiler case as expected.
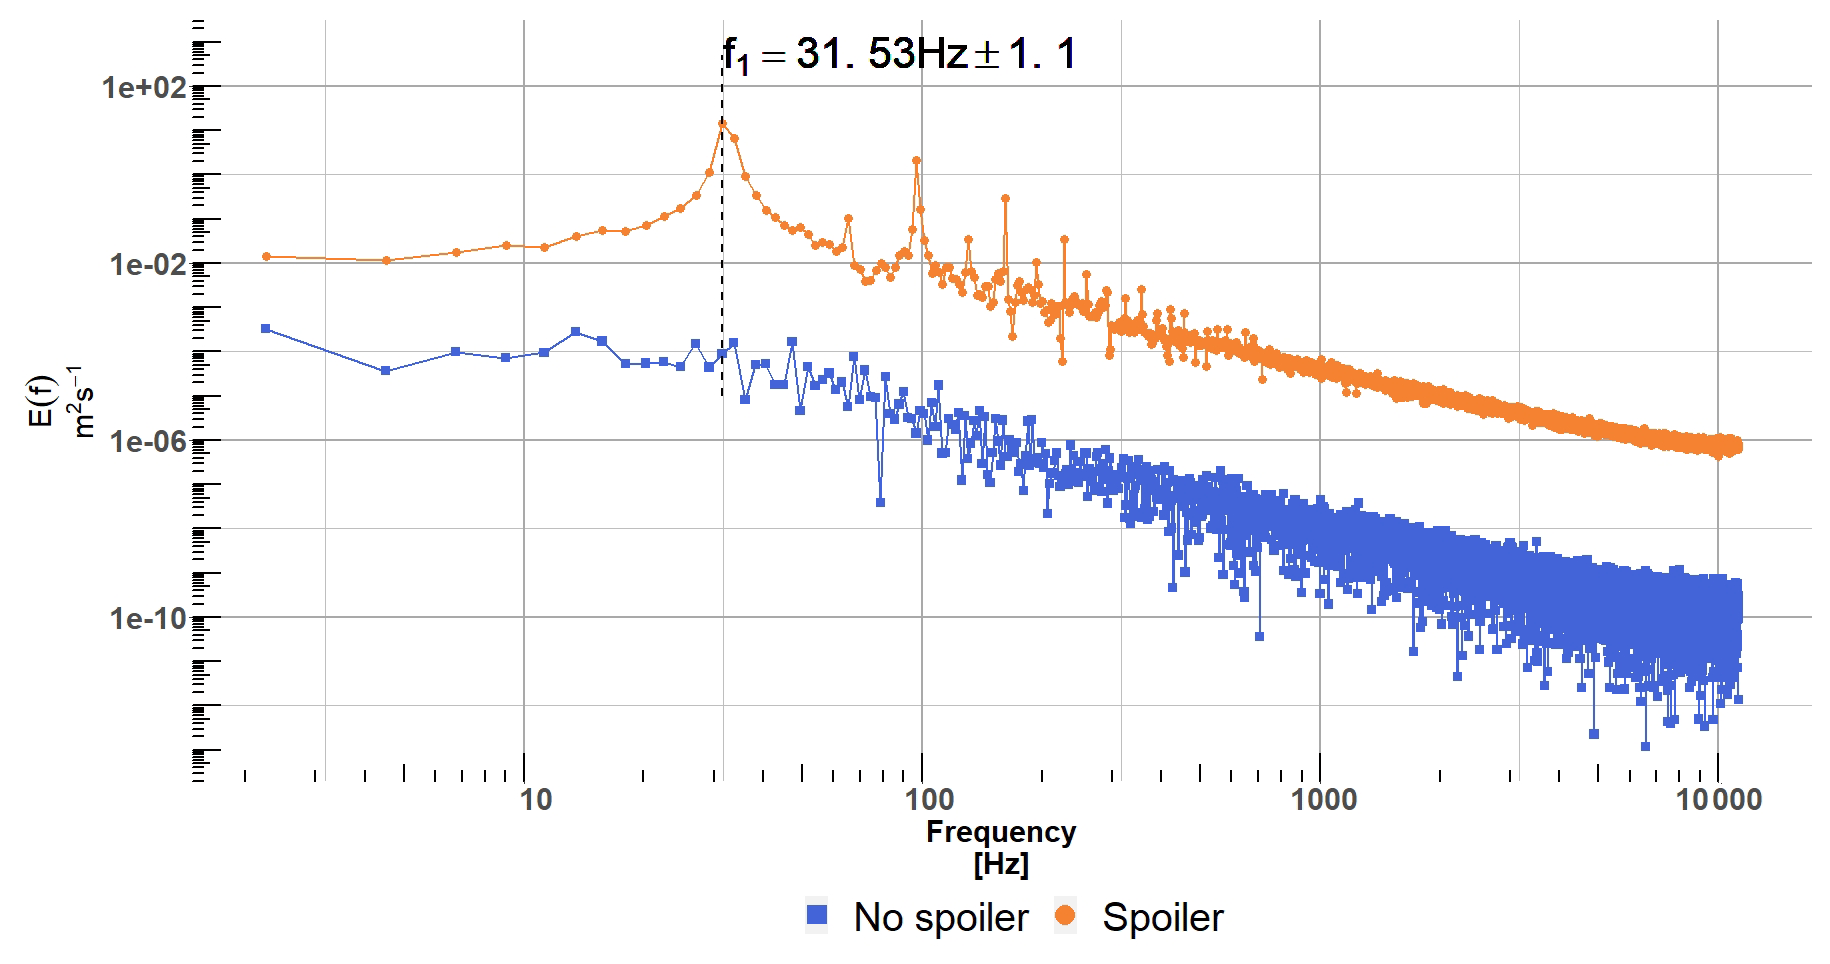
Figure 13Horizontal velocity PSD, in the wake, at . The blue square (blue ▪) shows the no spoiler case while the orange dot (orange •) shows the spoiler case.
At last, following the definition of Yarusevych et al. (2009), a Strouhal number of is found. In this definition, the velocity used is the mean free stream velocity, and the characteristic length (L) is the distance between two mean horizontal velocity root mean square extrema at . The rms peaks represents the aerofoil upper side vortex centre and aerofoil lower side vortex centre. Therefore the vertical distance can be viewed as a representation of the wake width. As seen in Fig. 14, the no spoiler case does not present two distinct peaks, only a single bell-type curve representing the velocity deficit in the wake. The spoiler case also shows a larger velocity deficit accompanied by a pair of rms peaks showing the presence of the vortex centres.
where f is the main vortex shedding frequency, L is the characteristic length, and U is the incoming velocity.
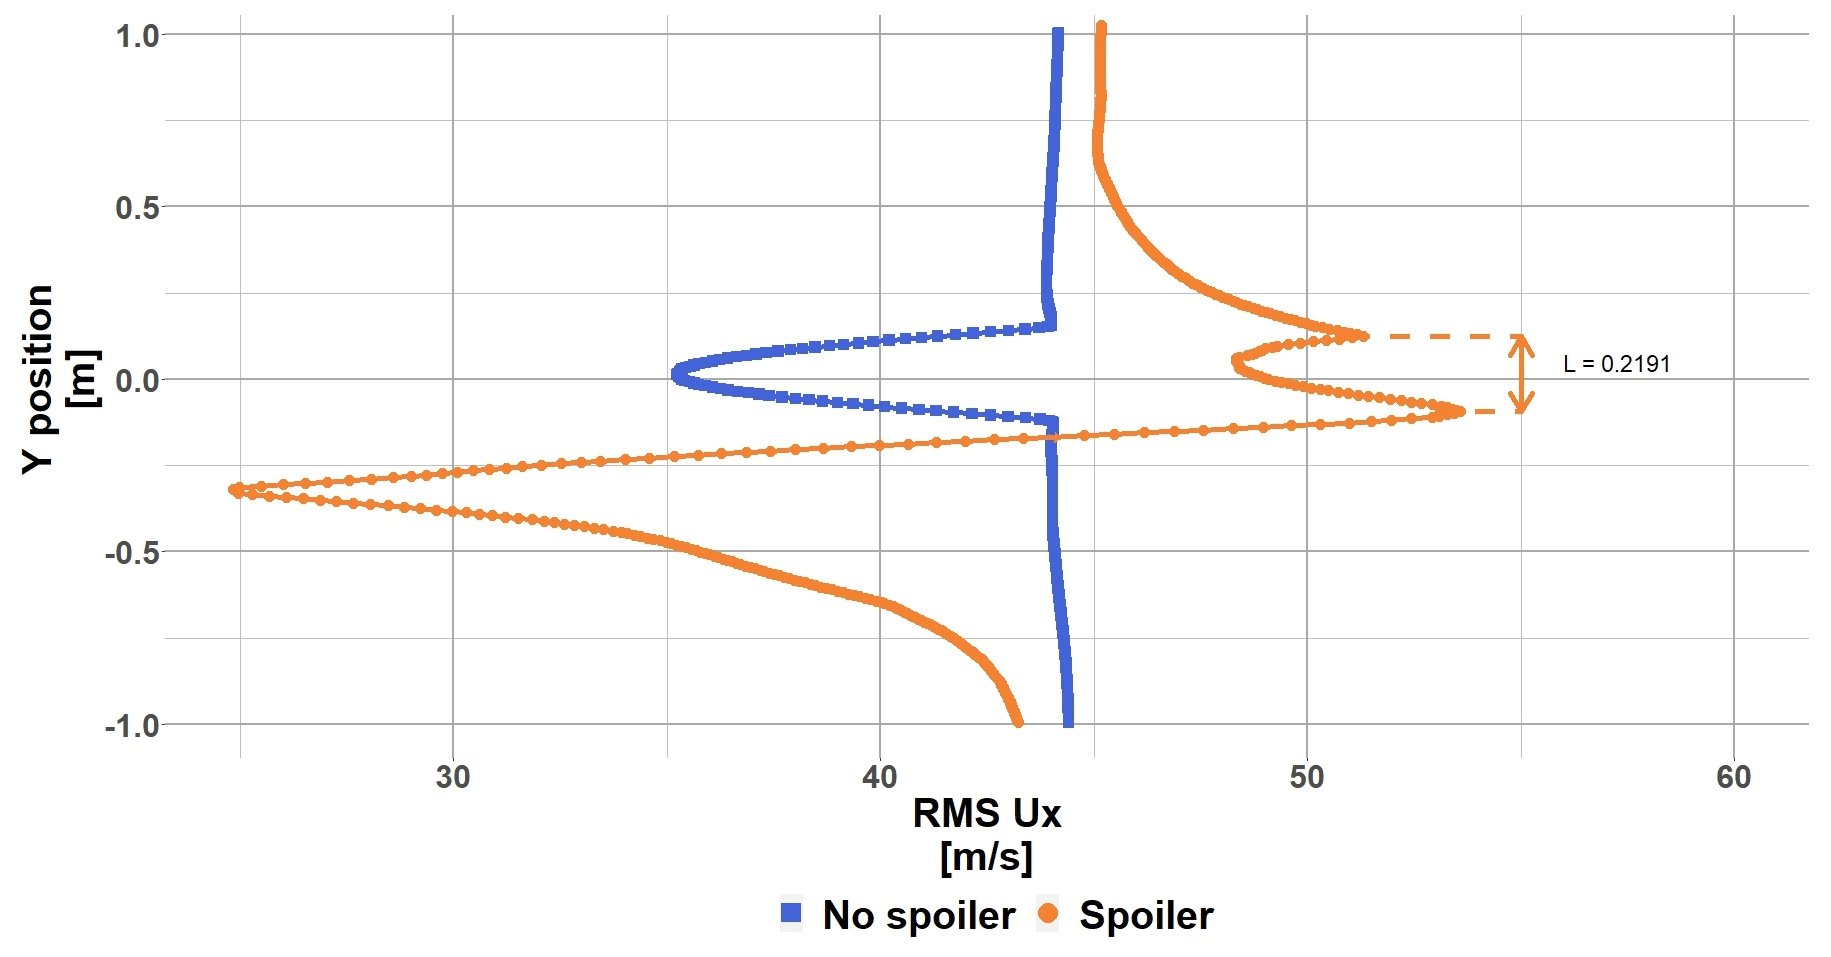
Figure 14Mean horizontal velocity root mean square value for the radial position R6 at α=6∘ ( %) and at . The blue square (blue ▪) shows the rms for the no spoiler case, and the orange dot (orange •) shows the rms for the spoiler case.
This result falls in line with their study, where was found, albeit in our case at a much higher Reynolds number and for a much thicker aerofoil and equipped with spoiler.
4.2.2 Unsteady aerodynamic polar
This unsteady analysis for the α=6∘ case is extended towards all other angles of attack. The vortex shedding organisation previously described induces oscillations on the surface pressure and thereby the aerodynamic coefficients CL and CD.
The behaviour described for the angle of attack α=6∘ is present throughout the polar for both cases with varying amplitude of the oscillations. The same analysis was carried out for α=10∘ (not presented in this paper). The vortex shedding frequency remains similar; only the amplitude changes. Overall, as long as the angle of attack is in the linear region, the vortex shedding frequency remains similar, and when approaching stall or in the stall region the frequency drops by half the attached flow region value. The maximum and minimum of these oscillations are reported in Figs. 15 and 16. The no spoiler case shows a decreasing variation in lift and drag coefficients from . The variation remains constant until the higher angles of attack (α>10∘). The variation in aerodynamic coefficients for the spoiler case is similar for the negative angle of attack and in the linear region. It increases drastically after 10∘, showing a possible stall behaviour, as highlighted by the coloured areas. Beyond 14∘ for the CL, the variation amplitude is similar to the actual mean aerodynamic value. Overall, the spoiler case adds a lot more variation in the aerodynamic loads when it becomes efficient (i.e. the lift is increased).
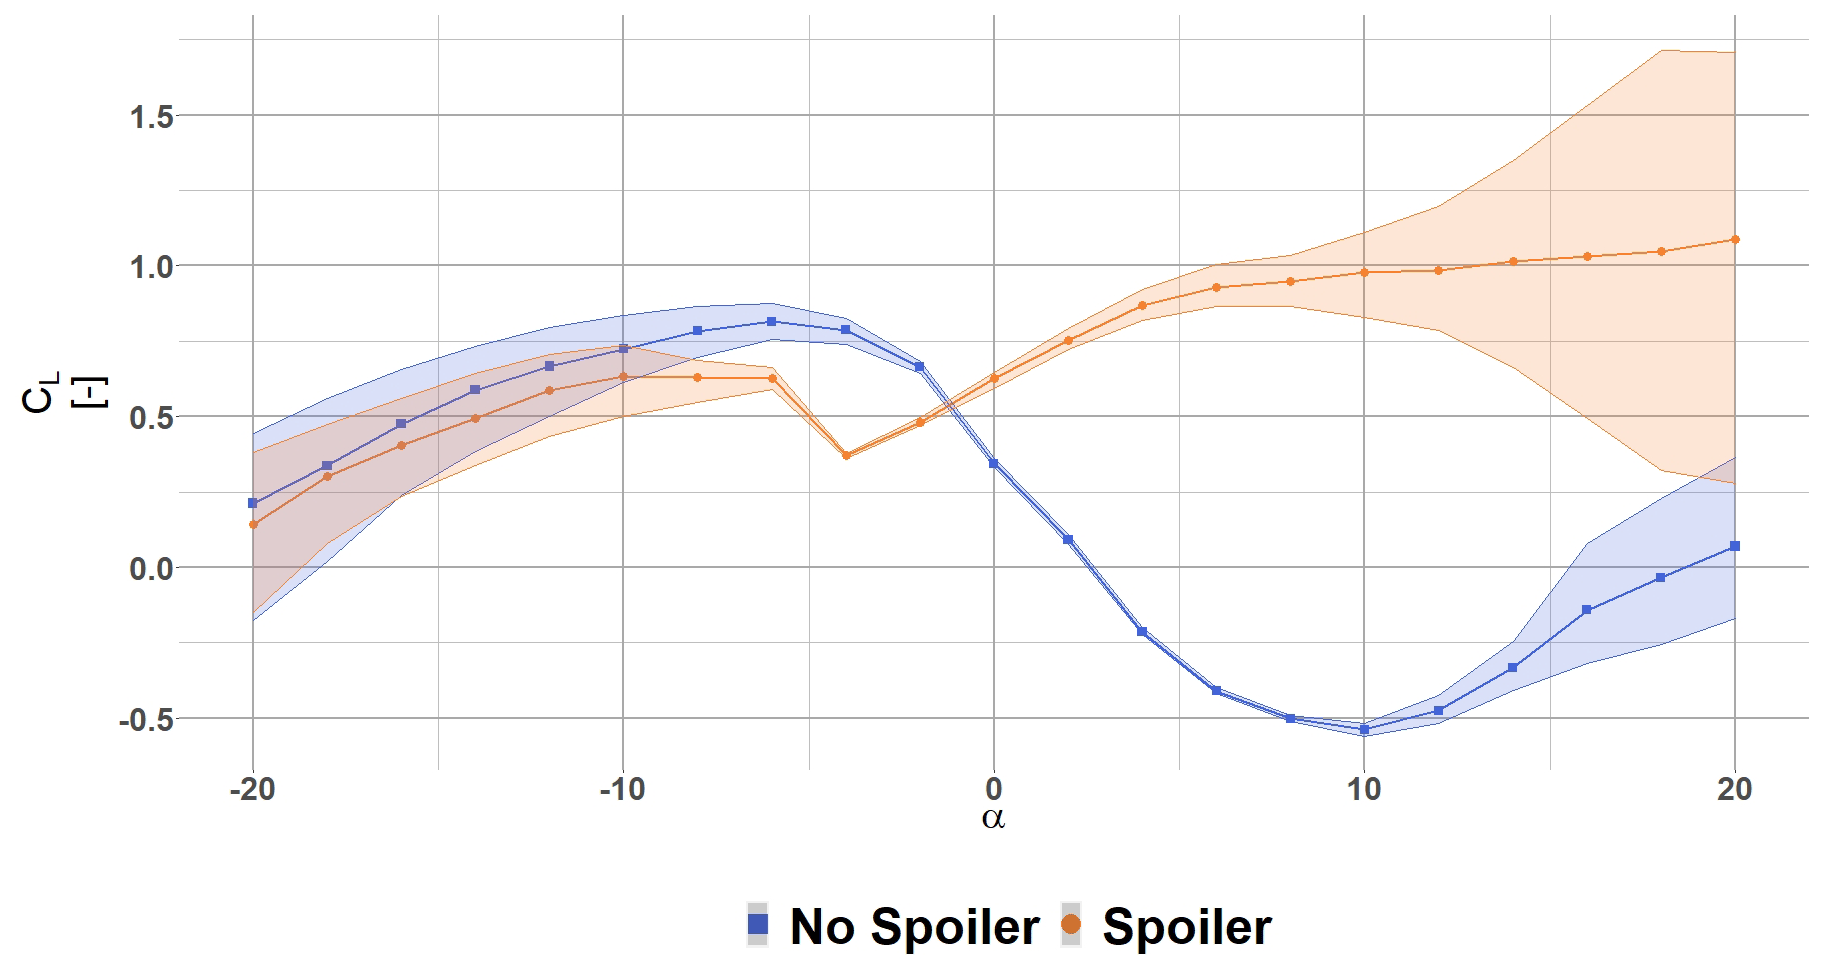
Figure 15Lift coefficient polar for the radial position R6 ( %). The blue square (blue ▪) shows the CL for the no spoiler case, and the orange dot (orange •) shows the CL for the spoiler case.
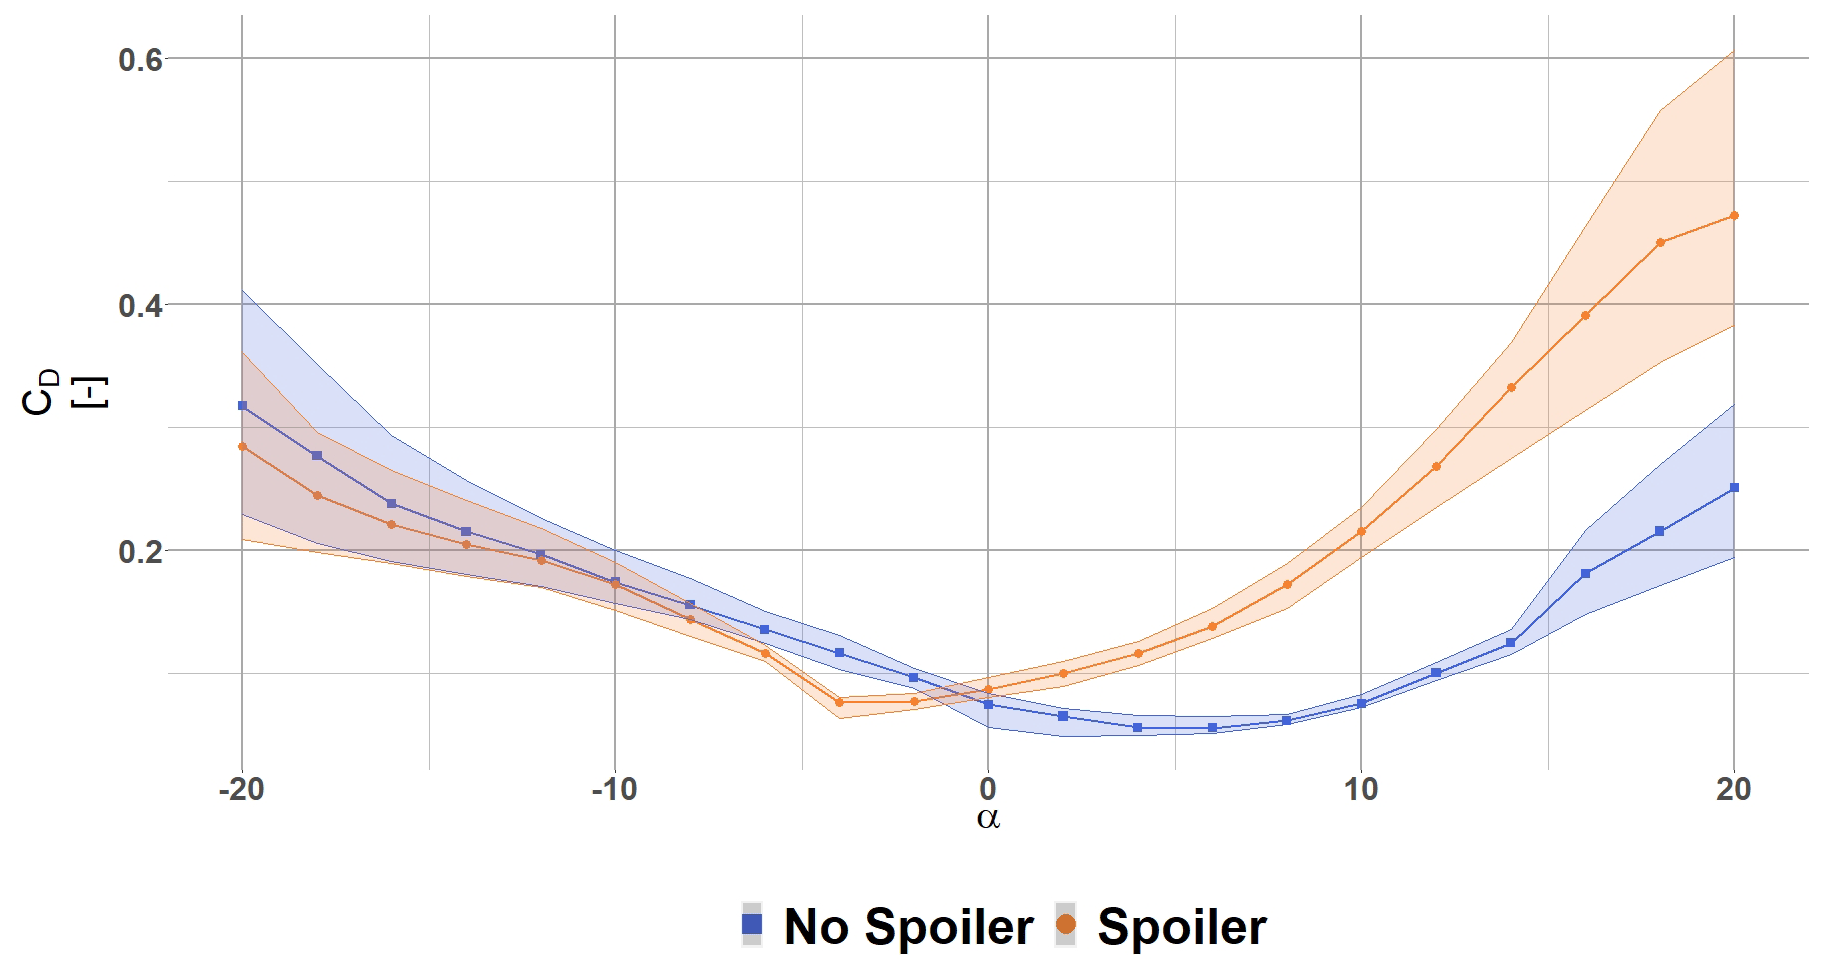
Figure 16Drag coefficient polar for the radial position R6 ( %). The blue square (blue ▪) shows the CD for the no spoiler case, and the orange dot (orange •) shows the CD for the spoiler case.
The present study proposes an original 2D URANS description of the unsteady flow behind thick aerofoil (59 %) from an operating 2 MW wind turbine equipped with spoilers at high Reynolds numbers. The particularity of this configuration stands on the size of the aerodynamic add-on: it is the real dimension of today's operating wind turbine rather than the sub-boundary layer device sizes usually studied in the literature. This aerodynamic add-on is found to efficiently rearrange the mean flow, adding lift throughout the positive angles of attack. However, the drawback is a high drag penalty coupled with high unsteadiness of the aerodynamic forces. Without spoiler, the aerofoil wake is erratic and not organised. With spoiler, a peak frequency is dominant in the aerodynamic lift and drag coefficients, which corresponds to a vortex shedding organisation. The associated Strouhal number is almost constant despite the aerodynamic coefficient variation amplitude changing with the angle of attack. The wake energy content is increased by several orders of magnitude compared to the aerofoil without spoiler. This flow reorganisation is present throughout the polar range and is accompanied by larger variation in aerodynamic forces than without spoiler. The impact of this type of excitation will be quantified further in terms of energy production and fatigue in future work.
The code is available on demand.
A short movie depicting the vortex shedding for the spoiler case is available (https://doi.org/10.5446/55443, Potentier, 2021).
TP performed the scan post-processing, CFD pre-processing and post-processing, and writing of the paper. EG performed CFD verification and helped set up the CFD model. CLB and AF provided feedback from the industrial point of view, and CB helped with the proofreading of a previous version of the paper and physical analysis of the results.
The contact author has declared that neither they nor their co-authors have any competing interests.
Publisher's note: Copernicus Publications remains neutral with regard to jurisdictional claims in published maps and institutional affiliations.
The authors would like to acknowledge the ANRT (Association Nationale de Recherche Technologique) for their financial support.
This research has been supported by CIFRE (grant no. 2019/1426).
This paper was edited by Alessandro Bianchini and reviewed by two anonymous referees.
Alber, J., Soto-Valle, R., Manolesos, M., Bartholomay, S., Nayeri, C. N., Schönlau, M., Menzel, C., Paschereit, C. O., Twele, J., and Fortmann, J.: Aerodynamic effects of Gurney flaps on the rotor blades of a research wind turbine, Wind Energ. Sci., 5, 1645–1662, https://doi.org/10.5194/wes-5-1645-2020, 2020. a
Bach, A. B.: Gurney flaps and micro-tabs for load control on wind turbines, PhD thesis, Technischen Universität Berlin, Berlin, https://doi.org/10.14279/depositonce-5127, 2016. a
Boeije, C., de Vries, H., Cleine, I., van Emden, E., Zwart, G., Stobbe, H., Hirschberg, A., and Hoeijmakers, H.: Fluidic load control for wind turbines blades, in: Proceedings of the 47th AIAA Aerospace Sciences Meeting, 5–8 January, 2009, Orlando, Florida, USA, edited by: Hand, M., AIAA – American Institute of Aeronautics and Astronautics Inc., 1–8, https://doi.org/10.2514/6.2009-684, 2009. a
Cathalifaud, P., Godard, G., Braud, C., and Stanislas, M.: The flow structure behind vortex generators embedded in a decelerating turbulent boundary layer, J. Turbulence, 10, N42, https://doi.org/10.1080/14685240903273881, 2009. a
Cole, J. A., Vieira, B. A. O., Coder, J. G., Premi, A., and Maughmer, M. D.: Experimental Investigation into the Effect of Gurney Flaps on Various Airfoils, J. Aircraft, 50, 1287–1294, https://doi.org/10.2514/1.C032203, 2013. a
Dambrine, G.: Impact of Blade Aging on Wind Turbine Production, MS thesis, European Master in Renewable Energy, EUREC Agency, 2010. a
De Tavernier, D., Ferreira, C., Viré, A., LeBlanc, B., and Bernardy, S.: Controlling dynamic stall using vortex generators on a wind turbine airfoil, Renew. Energy, 172, S0960148121003736, https://doi.org/10.1016/j.renene.2021.03.019, 2021. a
Gao, L., Zhang, H., Liu, Y., and Han, S.: Effects of vortex generators on a blunt trailing-edge airfoil for wind turbines, Renew. Energy, 76, 303–311, https://doi.org/10.1016/j.renene.2014.11.043, 2014. a
Giguere, P., Lemay, J., and Dumas, G.: Gurney flap effects and scaling for low-speed airfoils, in: 13th Applied Aerodynamics Conference, American Institute of Aeronautics and Astronautics, San Diego, CA, USA, https://doi.org/10.2514/6.1995-1881, 1995. a
Godard, G. and Stanislas, M.: Control of a decelerating boundary layer. Part 1: Optimization of passive vortex generators, Aerosp. Sci. Technol., 10, 181–191, https://doi.org/10.1016/j.ast.2005.11.007, 2006. a
Gonzalez-Salcedo, A.: Aerodynamic flow control final report, in: AdVanced Aerodynamic Tool for lArge Rotors, European project AVATAR, p. 86, https://www.eera-avatar.eu/fileadmin/avatar/user/D35_draft_v9-_voor_website.pdf (last access: 21 March 2022), 2016. a
Issa, R.: Solution of the implicitly discretised fluid flow equations by operator-splitting, J. Comput. Phys., 62, 40–65, https://doi.org/10.1016/0021-9991(86)90099-9, 1986. a
Jang, C. S., Ross, J. C., and Cummings, R. M.: Numerical investigation of an airfoil with a Gurney flap, Aircraft Design, 1, 75–88, https://doi.org/10.1016/S1369-8869(98)00010-X, 1998. a
Jaunet, V. and Braud, C.: Experiments on lift dynamics and feedback control of a wind turbine blade section, Renew. Energy, 126, 65–78, https://doi.org/10.1016/j.renene.2018.03.017, 2018. a
Li, Y., Wang, J., and Zhang, P.: Effects of Gurney Flaps on a NACA0012 Airfoil, in: Flow, Turbulence and Combustion, Springer, p. 13, https://doi.org/10.1023/A:1015679408150, 2002. a
Liebeck, R. H.: Design of Subsonic Airfoils for High Lift, J. Aircraft, 15, 547–561, https://doi.org/10.2514/3.58406, 1978. a
Lin, J. C.: Review of research on low-profile vortex generators to control boundary-layer separation, Progr. Aerosp. Sci., 38, 389–420, https://doi.org/10.1016/S0376-0421(02)00010-6, 2002. a
McWilliam, M. K., Barlas, T. K., Madsen, H. A., and Zahle, F.: Aero-elastic wind turbine design with active flaps for AEP maximization, Wind Energ. Sci., 3, 231–241, https://doi.org/10.5194/wes-3-231-2018, 2018. a
Meena, M. G., Taira, K., and Asai, K.: Airfoil-Wake Modification with Gurney Flap at Low Reynolds Number, AIAA J., 56, 4, https://doi.org/10.2514/1.J056260, 2017. a, b
Menter, F.: Zonal Two Equation k–w Turbulence Models For Aerodynamic Flows, in: 23rd Fluid Dynamics, Plasmadynamics, and Lasers Conference, Fluid Dynamics and Co-located Conferences, American Institute of Aeronautics and Astronautics, https://doi.org/10.2514/6.1993-2906, 1993. a
Mohammadi, M., Doosttalab, A., and Doosttalab, M.: The effect of various gurney flaps shapes on the performace of wind turbine airfoils, in: Proceedings of the ASME Early Career Technical Conference, Atlanta, GA, USA, 2–3, https://doi.org/10.13140/RG.2.1.3460.6800, 2012. a
Pechlivanoglou, G.: Passive and Active Flow Control Solutions for Wind Turbine Blades, PhD thesis, Technischen Universität Berlin, Berlin, https://doi.org/10.14279/depositonce-3487, 2013. a
Perivolaris, Y. and Voutsinas, S.: A cfd performance analysis of vortex generators used for boundary layer control on wind turbine blades, in: Proceedings of the European Wind Energy Conference, Copenhagen, Denmark, https://doi.org/10.13140/2.1.4626.6247, 2001. a
Potentier, T.: Vorticity and Q-criteria at high Reynolds number, TIB AV-PORTAL [video supplement], https://doi.org/10.5446/55443, 2021. a
Potentier, T., Guilmineau, E., and Braud, C.: CFD solver and meshing techniques verification using the DANAERO database, 19th PhD Seminar, Porto, online, p. 8, https://phd2020.eawe.eu/site-phd2020/assets/files/Book_of_Proceedings.pdf (last access: 21 March 2022), 2020. a
Queutey, P. and Visonneau, M.: An Interface Capturing Method for Free-Surface Hydrodynamic Flows, Comput. Fluids, 36, 1481–1510, https://doi.org/10.1016/j.compfluid.2006.11.007, 2007. a
Rhie, C. M. and Chow, W. L.: A Numerical Study of the Turbulent Flow Past an Airfoil with Trailing Edge Separation, AIAA J., 21, 1525–1532, https://doi.org/10.2514/6.1982-998, 1983. a
Saleem, Z.: Investigation of passive root flaps on HAWT, MS thesis, TU Delft, Delft, http://resolver.tudelft.nl/uuid:e7f81742-9783-40f0-b7b2-40ae14801e62 (last access: 21 March 2022), 2019. a
Schaffarczyk, P. and Arakawa, C.: A thick aerodynamic profile with regions of negative lift slope and possible implications on profiles for wind turbine blades, Wind Energy, 24, we.2565, https://doi.org/10.1002/we.2565, 2020. a
Schepers, J.: Advanced aerodynamic modelling, design and testing for large rotor blades, Final report FP7-ENERGY-2013.2.3.1/no. 608396, European Comission, https://www.eera-avatar.eu/fileadmin/avatar/user/AVATAR_final_report_v26_2_2018.pdf (last access: 21 March 2022), 2017. a
Schubauer, G. B. and Spangenberg, W. G.: Forced mixing in boundary layers, J. Fluid Mech., 8, 10–32, https://doi.org/10.1017/S0022112060000372, 1960. a
Skrzypiński, W., Gaunaa, M., and Bak, C.: The Effect of Mounting Vortex Generators on the DTU 10 MW Reference Wind Turbine Blade, J. Phys.: Conf. Ser., 524, 012034, https://doi.org/10.1088/1742-6596/524/1/012034, 2014. a
Sørensen, N. N., Zahle, F., Bak, C., and Vronsky, T.: Prediction of the Effect of Vortex Generators on Airfoil Performance, J. Phys.: Conf. Ser., 524, 012019, https://doi.org/10.1088/1742-6596/524/1/012019, 2014. a
Storms, B. L. and Jang, C. S.: Lift enhancement of an airfoil using a Gurney flap and vortex generators, J. Aircraft, 31, 542–547, https://doi.org/10.2514/3.46528, 1994. a
Taylor, H. D.: The elimination of diffuser separation by vortex generators, Research department report no. R-4012-3, United Aircraft Corporation, East Hartford, Connecticut, p. 103 pp., 1947. a
Wackers, J., Deng, G., Guilmineau, E., Leroyer, A., Queutey, P., and Visonneau, M.: Combined refinement criteria for anisotropic grid refinement in free-surface flow simulation, Comput. Fluids, 92, 209–222, https://doi.org/10.1016/j.compfluid.2013.12.019, 2014. a
Wackers, J., Deng, G., Guilmineau, E., Leroyer, A., Queutey, P., Visonneau, M., Palmieri, A., and Liverani, A.: Can adaptive grid refinement produce grid-independent solutions for incompressible flows?, J. Comput. Phys., 344, 364–380, https://doi.org/10.1016/j.jcp.2017.04.077, 2017. a
Wang, J., Li, Y., and Choi, K.-S.: Gurney flap – Lift enhancement, mechanisms and applications, Progr. Aerosp. Sci., 44, 22–47, https://doi.org/10.1016/j.paerosci.2007.10.001, 2008. a
Yarusevych, S., Sullivan, P. E., and Kawall, J. G.: On vortex shedding from an airfoil in low-Reynolds-number flows, J. Fluid Mech., 632, 245–271, https://doi.org/10.1017/S0022112009007058, 2009. a