the Creative Commons Attribution 4.0 License.
the Creative Commons Attribution 4.0 License.
 | 24 Mar 2022
Parked and operating load analysis in the aerodynamic design of multi-megawatt-scale floating vertical-axis wind turbines
Mohammad Sadman Sakib
A good understanding of aerodynamic loading is essential in the design of vertical-axis wind turbines (VAWTs) to properly capture design loads and to estimate the power production. This paper presents a comprehensive aerodynamic design study for a 5 MW Darrieus offshore VAWT in the context of multi-megawatt floating VAWTs. This study systematically analyzes the effect of different, important design variables including the number of blades, aspect ratio and blade tapering in a comprehensive load analysis of both the parked and operating aerodynamic loads including turbine power performance analysis. The number of blades is studied for two- and three-bladed turbines, aspect ratio is defined as ratio of rotor height and rotor diameter and studied for values from 0.5 to 1.5, and blade tapering is applied by means of adding solidity to the blades towards blade root ends, which affects aerodynamic and structural performance. Analyses were carried out using a three-dimensional vortex model named CACTUS (Code for Axial and Cross-flow TUrbine Simulation) to evaluate both instantaneous azimuthal parameters as well as integral parameters, such as loads (thrust force, lateral force and torque loading) and power. Parked loading is a major concern for VAWTs; thus, this work presents a broad evaluation of parked loads for the design variables noted above. This study also illustrates that during the operation of a turbine, lateral loads are on par with thrust loads, which will significantly affect the structural sizing of rotor and platform and mooring components.
- Article
(5103 KB) - Full-text XML
- BibTeX
- EndNote


In order to improve the current situation of global climate change, there is a push for more environmentally sustainable sources of energy in the power grid. As wind energy costs have come down, the opportunity to fill this need by advancing the potential of wind turbine technology is at an all-time high as a part of the initiative to reduce greenhouse gas emissions and provide greater generation by renewable sources. The wind energy community has been mostly focused on horizontal-axis wind turbines (HAWTs), but recently another type of turbine named vertical-axis wind turbines (VAWTs) (Bhutta et al., 2012; Sutherland et al., 2012) has garnered interest especially in offshore locations (Borg et al., 2012; Paulsen et al., 2013; Gao et al., 2022). VAWTs have some distinct advantages over HAWTs because of their low center of gravity, absence of pitch and yaw mechanism, directional independence to wind, low sound emission (due to low operational tip speed ratio, TSR), proximity of generator to ground level, suitability for small-scale installations, and better turbulent performance (Balduzzi et al., 2012; Möllerström et al., 2016; Griffith et al., 2018; Molina et al., 2019).
VAWTs received a significant amount of attention during the 1970s and 1980s in the USA and Canada (Paraschivoiu, 2002). Some commercial VAWTs were developed, but they suffered from several problems (namely, fatigue and low efficiency). In the meantime, HAWT research gained momentum, and it became the industry standard for multi-megawatt-scale wind energy conversion systems. Despite these issues, interest in VAWTs has resurfaced especially in offshore deep-water conditions, and it has been discovered that VAWTs might challenge HAWTs in terms of efficiency and cost-effectiveness (Simão Ferreira, 2009; Ennis and Griffith, 2018).
As wind energy is moving to deployments in deeper waters offshore, maintenance and installation procedures as well as cost trends are changing. It has also been shown that floating VAWTs have the potential to achieve a significant reduction in the cost of energy (COE) compared to floating HAWTs (Shelley et al., 2018; Griffith et al., 2016) and mitigate aero-elastic effects like flutter (Ahsan et al., 2022). In addition, floating VAWTs are much more suitable in wind farm conditions due to quicker dissipation of wakes when placed in counter-rotating pairs (Kinzel et al., 2012). Comparative studies of HAWTs and VAWTs have been performed in detail to identify the advantages and disadvantages of each design concept in offshore and onshore conditions (Islam et al., 2013; Henderson and Patel, 2003). As a result, interest in floating VAWTs is re-surging, and various floating VAWT concepts have been proposed, including the DeepWind concept (Paulsen et al., 2012), VertiWind concept (Tjiu et al., 2015), OWLWIND project (Achard et al., 2017) and the Sandia floating offshore VAWT project (Griffith et al., 2018; Ennis, 2019).
In order to make VAWTs a viable candidate as a replacement for HAWTs, one must have reliable aerodynamic models and reliable predictions of aerodynamic design loads and power production. Some well-established aerodynamic models include the momentum models (single stream tube (SST) model, multiple stream tube (MST) model, double multiple stream tube (DMST) model) and vortex models (Islam et al., 2008). In the momentum models Bernoulli's equation is used for each stream tube to calculate flow velocity and forces. The vortex models are essentially potential flow models with free vortex line elements. Rotor blades are modeled using the lifting line approximation, with each blade discretized into a number of blade elements containing a bound vortex and whose strength is obtained utilizing airfoil coefficients (i.e., airfoil polars). More details on aerodynamic modeling and their fidelity can be found in (Ferreira et al., 2014; Cheng et al., 2016; De Tavernier et al., 2020).
A major concern for VAWTs is cyclic aerodynamic loading throughout one revolution, which gives rise to serious issues like high root blade bending moments and fatigue (Galinos et al., 2016). One of the major reasons for limited deployment of commercial VAWTs is that the fatigue loading in VAWTs has been a challenge for component reliability under these cyclic loads; however, it has been discovered that those issues were exacerbated primarily due to early VAWTs using aluminum blade materials (Möllerström et al., 2019) rather than high-fatigue-resistant composites. Another major concern for VAWTs is the loading on blades during standstill (parked) conditions. As VAWTs are omnidirectional and typically do not have a pitching mechanism, they are subjected to high loads for a long period of time. Parked load studies for VAWTs have been reported to a very limited extent, especially for Darrieus-type VAWTs. For this reason, we place a particular emphasis in this work on the parked load calculations.
The aim of this work is to establish and better understand the aerodynamic design process of a floating 5 MW Darrieus VAWT and how the selection of various design variables affects this design process without necessarily going into the detailed explanation of how these design variables affect the flow physics. This study includes blade and tower design loads, rotor power performance, and the loads that are imparted to the floating platform and mooring system. In order to find an efficient design, we perform a comprehensive aerodynamic performance and load analysis by studying trade-offs between different, important design variables. These variables include the number of rotor blades (B), blade chord tapering (β) and the aspect ratio (AR). Attention has been brought to the analysis of parked loads and the lateral load issue, which are typically not studied during the design process.
Simulations are carried out using a 3D vortex-based code named CACTUS (Murray and Barone, 2011) to check both instantaneous azimuthal parameters and integral parameters, such as thrust coefficient and power coefficient. Several studies have been performed where the accuracy for vortex model has been assessed by comparing with a high-order model (computational fluid dynamics, CFD) and experimental data. Bangga et al. (2020) performed a comprehensive analysis using multiple engineering models for multiple solidity and TSR values and finally compared with experimental data where the vortex model showed very promising results. Balduzzi et al. (2018) studied a single blade rotor at a single TSR value, which showed good agreement between the results where the free vortex wake model computational cost is more than 6 orders of magnitude lower than CFD simulation. As a result, in this work we consider CACTUS as a mid-fidelity tool, which provides a good balance between accuracy and computational cost, which is of great importance to efficiently sweep through large design spaces. The results of this tool will provide a clear picture of the design space and the importance of making appropriate choices of design variables for designing a realistic VAWT.
In summary, the research objective is twofold:
-
Studying the impact of important design variables like the number of rotor blades (B), blade tapering (β) and the aspect ratio (AR).
-
Providing an understanding of the VAWT's cyclic loads as well as the parked loads, which are typically not investigated.
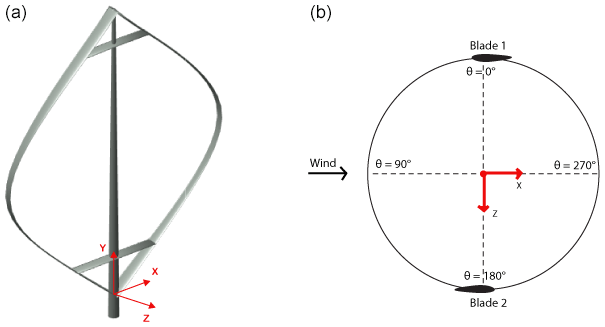
CACTUS is a 3D aerodynamic design code capable of performing an analysis of arbitrary turbine configurations (Murray and Barone, 2011). The code was based on VDART3, a free vortex wake simulation of the Darrieus wind turbine, developed by Strickland et al. (1979). The rotor blades are represented by the lifting line approximation. The blades are discretized into several elements, and two-dimensional lift-and-drag data are assigned to each element for any desired airfoil. At each point in time, the vortex line structure is composed of trailing and spanwise wake vorticity, as well as a bound vortex system attached to the blade elements. The bound vorticity on each element is related to the element lift coefficient through the Kutta–Joukowski theorem (Anderson, 2010), and the trailing and spanwise wake vorticity are recovered through the application of the Helmholtz theorem (Katz and Plotkin, 2001). The wake convection velocity is either calculated based on the induced velocity at every time step (free wake) or kept constant in time (fixed wake). A vortex core model is included to avoid instabilities near the vortices. As the aerodynamics of cross-flow turbines is inherently unsteady, the blades are subjected to dynamic loading and often operate at angles of attack beyond their steady-state stall limits for long period of time. This transient behavior is called the dynamic stall effect and is incorporated in CACTUS by two dynamic stall models: the modified Boeing Vertol method by Gormont (1973) and the Leishman–Beddoes model by Leishman and Beddoes (1989). The coordinate frame used in this study is presented in Fig. 1. More details on CACTUS and validation against experimental turbines can be found in Murray and Barone (2011); Michelen et al. (2014); Wosnik et al. (2016); Lu (2020).
Following the results of convergence studies, each blade in the model for a 5 MW Darrieus VAWT is represented by 10 elements, and 30 time steps are used per rotor revolution. Calculations are run for 10 rotor revolutions with free wake and with no dynamic stall model, which leads to a maximum of 0.75 % difference between the power coefficient of the last two revolutions at high tip speed ratios (TSR) and a maximum of 0.005 % difference at low tip speed ratios (TSR).
2.1 Test cases
The present work presents a design study aiming to reveal the impact of different important design variables on the aerodynamic performance of VAWTs and subsequently how it affects the design of other major components of the turbine or floating system. Therefore, the parameters are systematically studied, which will provide a comprehensive picture of the influence of design parameters under various operational conditions.
In order to evaluate the relative cost of candidate rotor designs, annual energy production (AEP) must be estimated. Further, aerodynamic loads are required for iterative design of the turbine blades and platform design. As mentioned previously, CACTUS is used to perform all the necessary analysis.
For the purpose of this study, the VAWT machines are assumed to be stall-regulated, with no active power or loads control. They are also assumed to operate with a simple variable-speed controller to optimize energy capture in below-rated wind speed (region 2) of the power curve. A cut-in, cut-out and rated wind speed of 5, 25 and 15 m s−1 respectively are imposed. The performance data presented here are generated assuming zero wind shear; only small quantitative differences are expected when shear is introduced, and these are not expected to impact the resulting trends in performance with design changes. For aerodynamic modeling purposes, all rotor designs employ NACA-0021 airfoils at all blade sections and will be simulated for the following operational conditions (Density (ρ)=1.225 kg m−3, (), Temperature (T)=293 K). Finally the revolution-averaged performance data for the power coefficient (CP) and torque coefficient (CQ) at both low and high TSR are shown in Fig. 2 to show required convergence of results.

Figure 2Revolution-averaged performance for 10 revolutions at TSR=3 (a, c) and TSR=6 (b, d).
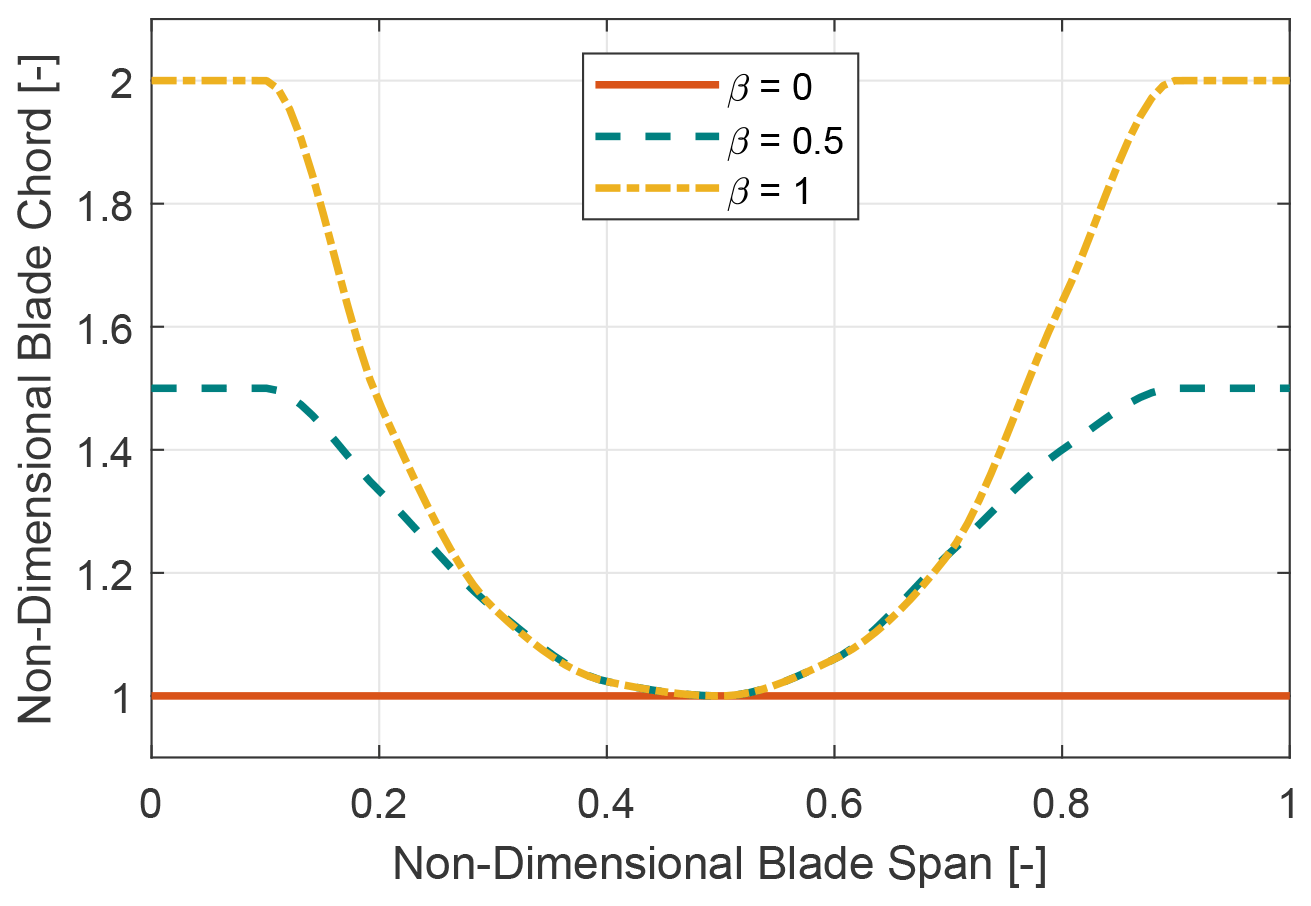
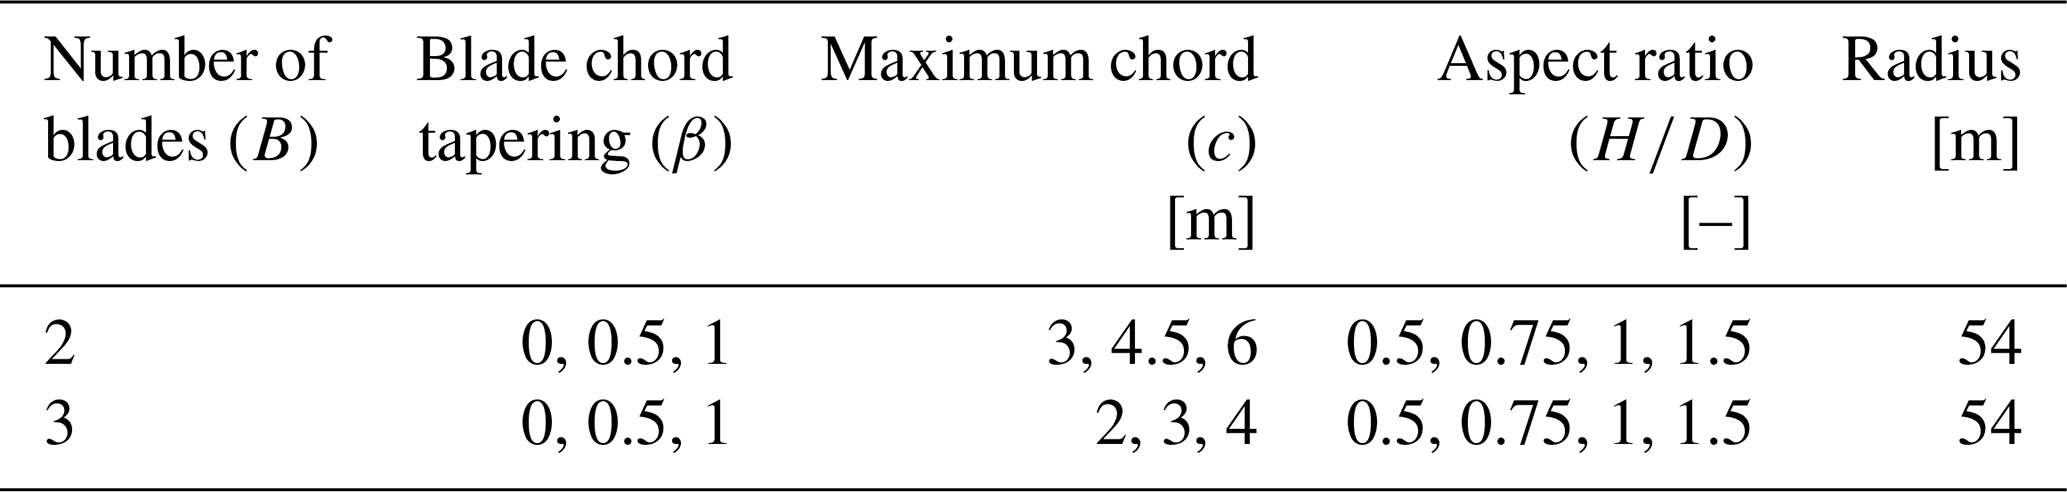
Six Darrieus rotor designs were analyzed for the blade tapering and number of blades study, with each design incorporating a unique combination number of blades (two and three) and choice of blade tapering (β=0, 0.5 and 1). These six-rotor designs have a fixed blade radius of 54 m, a rotor frontal area of 9513.15 m2 and a fixed aspect ratio (AR) of 1.22. The degree of tapering is denoted by a non-dimensional parameter called β ranging from 0–1. A β value of 0 means no tapering (i.e., constant blade chord), and a value of 1 indicates the highest degree of tapering has been applied to the blades with increasing chord toward the blade root connection to the tower. Tapering is applied by adding solidity to the blades, which means that the design configurations with lower β values have a lower overall solidity. A visual representation of the tapering scheme is shown in Fig. 3. The geometry has been generated in such a way that the solidity remains the same for the two-bladed (2B) and three-bladed (3B) configuration with the same β value. In this study the aspect ratio is defined as the ratio between rotor height (H) and diameter (D). For the aspect ratio study four different values have been selected ranging from (0.5–1.5) for a particular blade number and blade tapering scheme while keeping the rotor radius same. The ratio between rotor height (H) and diameter (D) is being changed in such a manner that the rotor diameter remains constant. A summary of the rotor design candidates is presented in Table 1.
2.2 Operational strategy development
The first step of the aerodynamic analysis is the development of the operational strategy as a function of wind speed. To generate the power curve, operating thrust and lateral loads of each design case, a (wind speed (WS)–RPM) schedule must be defined that is assumed to be the operational condition of the turbine. As a first step, a power coefficient CP–TSR curve is generated as shown in Fig. 4a. During this step a reasonable estimation of the rated RPM value is made. From this CP–TSR curve, the maximum CP and the TSR at which the turbine stalls are extracted as shown in Fig. 4b. These two values are used in the second stage of the operational strategy development.

Figure 4(a) Examples of a CP vs. tip speed ratio curve used for stage 1 of the analysis. (b) Example of power vs. TSR curve for stage 1. The maximum CP and the stall point are indicated by red markers.
In the second stage, an RPM sweep is performed at the stall TSR to find the required RPM to produce the desired rated aerodynamic power of 5 MW at the selected rated wind speed of 15 m s−1. An example curve is shown in Fig. 5a, where the rated RPM is 7.8.

Figure 5Stage 2 and 3 of the operational strategy development. (a) RPM sweep at stall TSR (stage 2). (b) Rotor speed schedule example (stage 3).
In the third stage, the rotor RPM schedule is completely defined as a function of wind speed. The RPM is set to the minimum of the RPM giving the optimal tip speed ratio (TSR) for a given wind speed and the RPM for rated power at stall. This defines a simple variable speed control schedule that provides for optimal energy capture under the constraint that the required RPM to maintain rated power is never exceeded. An example of an RPM schedule and resulting operating TSR range is shown in Fig. 5b.
This operational strategy is used to generate all the operational loads and power information including power curves and the cyclic thrust, lateral and torque loads vs. wind speed for all the rotor design candidates. As a result the AEP can be calculated from the power curve, whereas the thrust, lateral and torque loads provide the maximum design loads and the cyclic fatigue loads used to design the turbine, the platform and the mooring system.
The impact of blade tapering, number of blades, and the aspect ratio on the performance of a turbine and their impact on the design process is discussed in detail in this section.
3.1 Case 1: impact of blade chord tapering
In this study tapering is applied to blades by adding solidity, as shown in Fig. 3. Solidity is an important parameter in the design of a VAWT as it has a massive impact on the aerodynamic performance. Solidity is defined as
where B is the number of blades, c is the blade chord and R is rotor radius. The effect of solidity on turbine performance has been studied extensively in both numerical and experimental studies. Rezaeiha et al. (2018) studied the effect of solidity on turbine performance (power coefficient, CP; thrust coefficient, CT) and optimum TSR using 2D CFD simulations. This study showed that an increase in solidity caused an increase in the power coefficient (due to an increase in Reynolds number), and the optimum TSR value decreases while the thrust coefficient (CT) grows asymptotically. Miller et al. (2018) studied the effect of solidity on VAWT performance at high Reynolds number experimentally. Their study concluded that with an increase in Reynolds number the power coefficient increases and shows asymptotic behavior above a 1.5 million Reynolds number. More work on the effect of solidity both experimentally and numerically can be found in (Maeda et al., 2016, 2017; Delafin et al., 2016; Jafari et al., 2018).
Tapering provided various advantages and disadvantages over conventional non-tapered blades. As tapering adds solidity to the blades it will have a higher performance coefficient (CP) compared to non-tapered blades while keeping the blade mass increase under acceptable levels. In addition to that, tapered blades with variable chord along the span should be more structurally sound than non-tapered blades due to a larger chord towards the blade roots. VAWTs experience very high blade root moments (Galinos et al., 2016); therefore, placement of more stiffness towards the blade root ends via larger root chords will result in better strength and fatigue life while having an acceptable blade mass increase. But adding tapering also leads to higher parked loads – a major concern in VAWTs – and this is studied further in this work. Also increasing solidity or adding tapering will also reduce maximum RPM as an increase in solidity also increases the aerodynamic torque, which increases the cost of the drivetrain.
3.1.1 Turbine performance
Figure 6 shows the power coefficient versus tip speed ratio for two-bladed (2B) and three-bladed (3B) VAWTs with three different tapering schemes (β=0, 0.5 and 1). Each of these rotors has a radius of 54 m and an aspect ratio (AR) of 1.22. It can be seen that the power coefficient increases with β value due to the increase in solidity. The trend of optimum TSR value can also be seen, where for a higher degree of tapering the optimum TSR decreases and vice versa. It is to be noted that two- and three-bladed configurations with the same β value have similar solidity for the whole blade span. A rotor can be considered well designed if the power coefficient is relatively high for a longer range of TSR rather than having a very high value for only a fraction of the same range of TSR. As VAWTs in this study and in general are stall controlled, during the majority of their operation they will be operating at sub-optimal TSR values so it is important to have a good power coefficient (CP) value for a larger range of TSR.
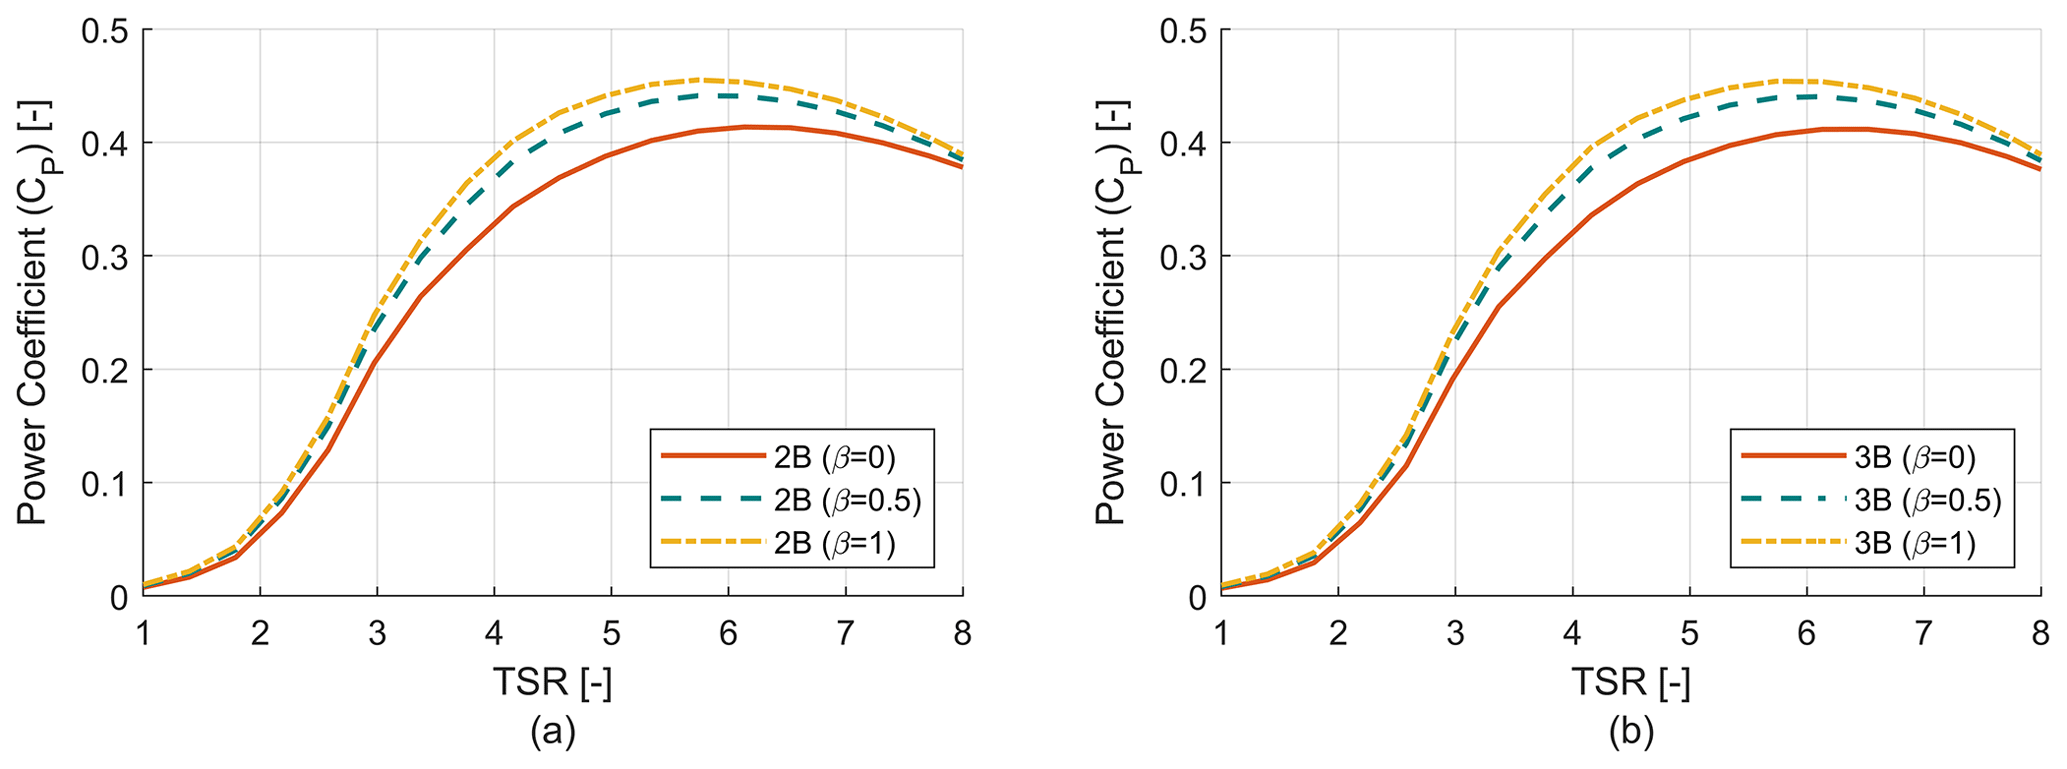
Figure 6Rotor power coefficient (CP) analysis. (a) Power coefficient (CP) vs. TSR curve for two-bladed (2B) rotors. (b) Power coefficient (CP) vs. TSR curve for three-bladed (3B) rotors.
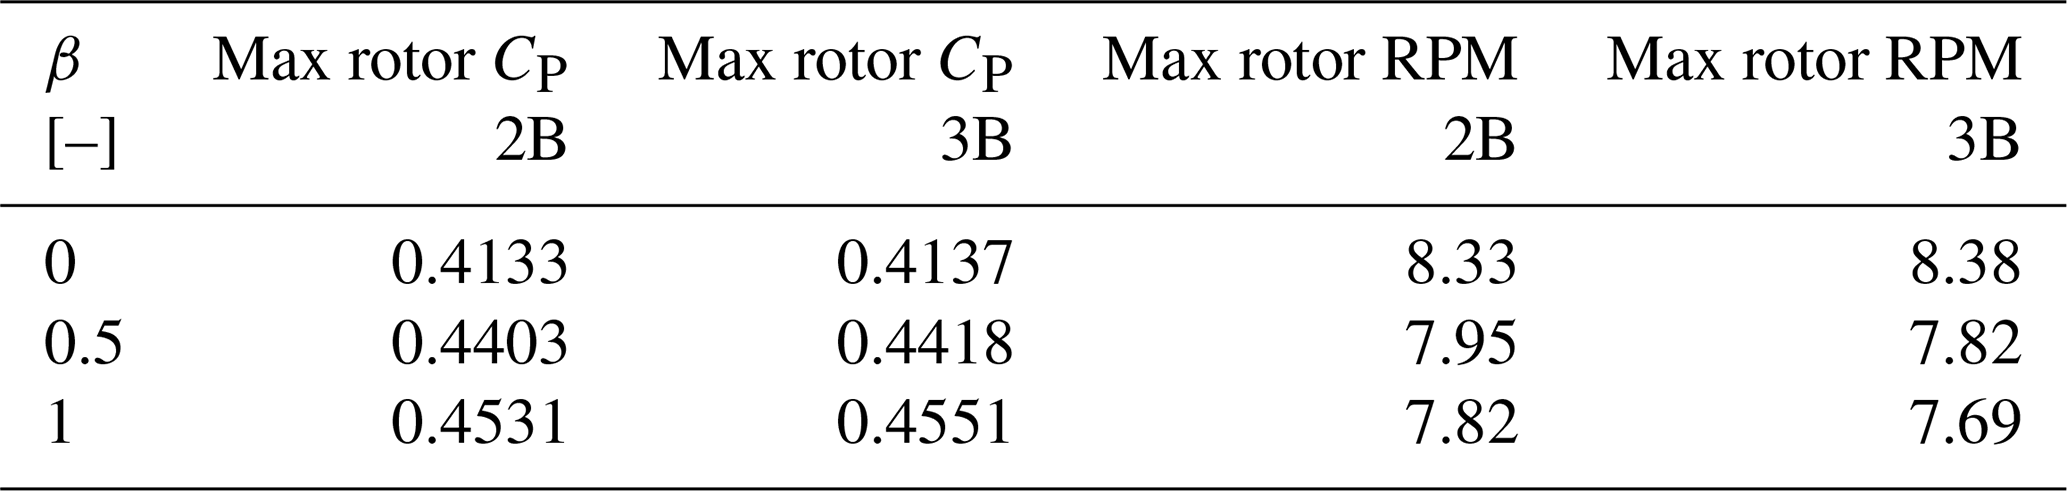
Figure 7 shows the power curves for the six design candidates, and the maximum CP and maximum design RPM for each candidate are provided in Table 2. Increasing the tapering comes at the price of lowering the maximum RPM, which results in higher torque that increases the cost of the drivetrain. The power curves were generated according to the operational strategy development as discussed earlier. As the two- and three-bladed configurations with the same β value have similar solidity, then as a result the power curves for those corresponding designs are almost similar prior to stall, but they differ drastically post stall. That is because rotors with higher beta value (larger tapering) will have higher tip losses post stall, which results in lower power production. As a result low β rotors have higher power production compared to high β rotors in the post-stall region.
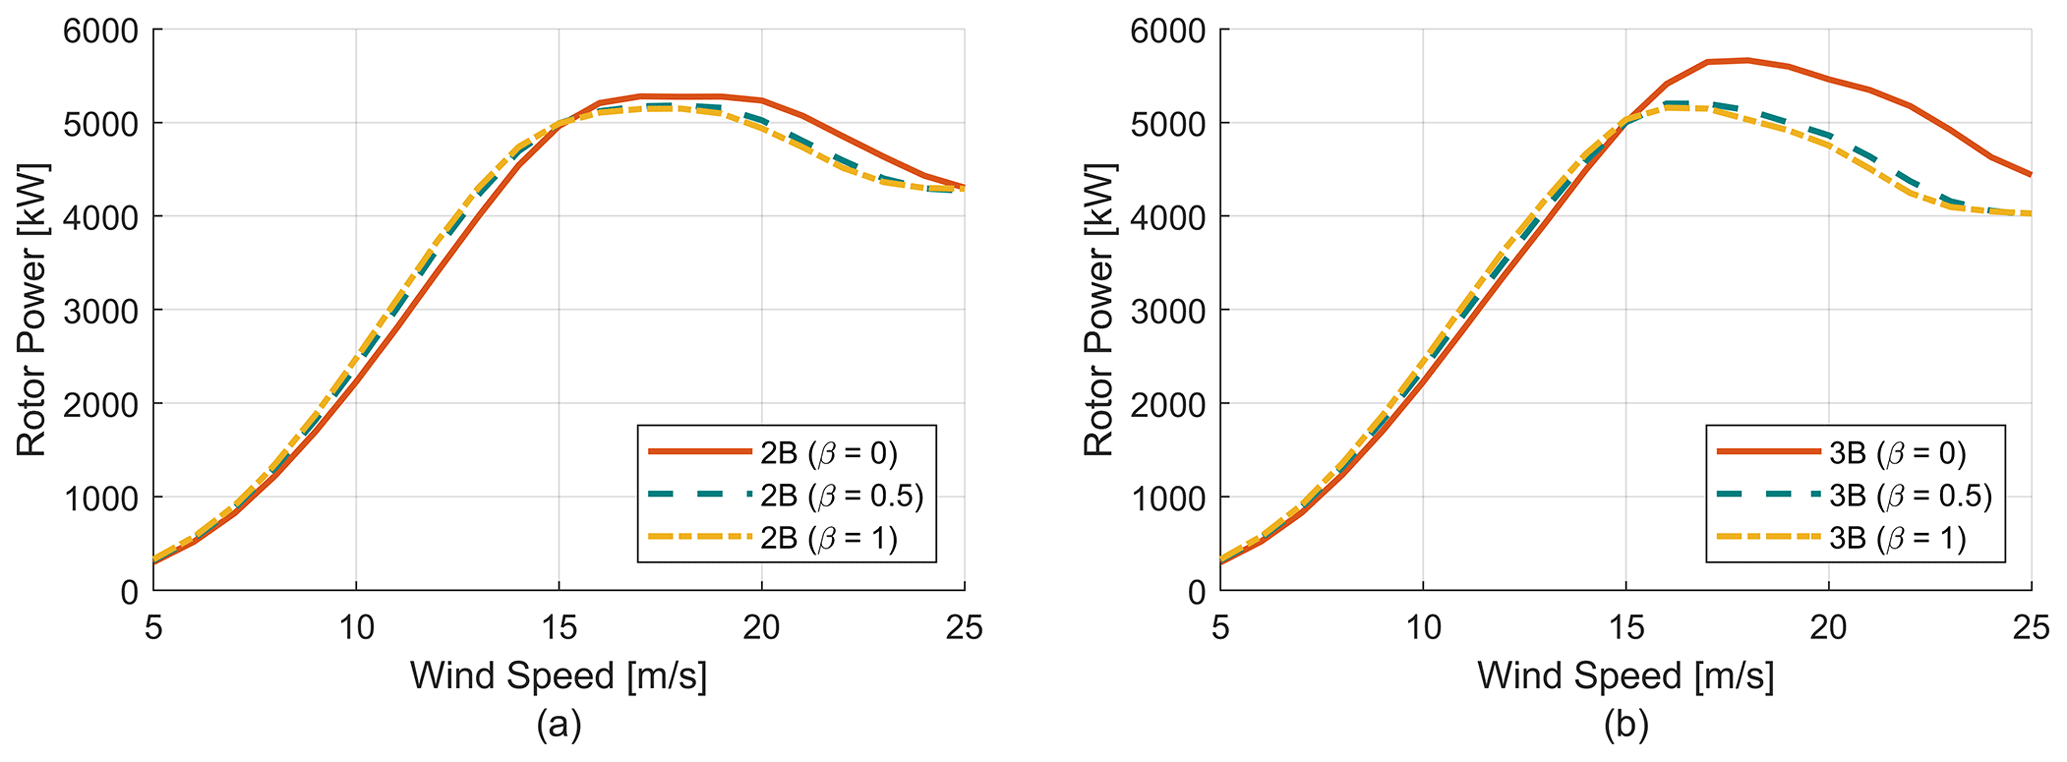
Figure 7Rotor power performance analysis. (a) Power vs. wind speed curve for two-bladed (2B) rotors. (b) Power vs. wind speed curve for three-bladed (3B) rotors.
3.1.2 Turbine loads
The thrust (FX) and lateral force (FZ) are important design considerations for the structural design of the platform, blades and tower of a floating wind turbine. Fluctuations of these forces generate fatigue loads and may therefore increase the capital cost. This section presents the thrust and lateral force coefficient trends for the design candidates. In the existing literature there is a lack of investigation of the lateral loads and how they behave with changing TSR. The thrust (FX) or lateral force (FZ) is dimensionalized as
Where ρ is the air density, U∞ is the freestream velocity, AT is the frontal area, Cx is the required thrust load coefficient and Cz is the lateral load coefficient. With an increase in blade tapering and TSR, the value of the mean thrust coefficient (Cx) over a single revolution increases as shown in Fig. 8. But turbines with a similar solidity (for example 2B (β=0), 3B (β=0)) show similar profiles for the thrust coefficient (Cx). With an increase in blade tapering, the chord value of the blades increases, which creates larger loads on the turbine. A similar study has been performed for the lateral load coefficient (Cz). The mean, maximum and minimum of the lateral load coefficient (Cz) at each TSR have been plotted in terms of bar plots for each design configuration in Fig. 9. It can be seen that the mean lateral loads coefficient is independent of blade tapering or solidity and values are close to zero. However, the lateral loads are almost symmetric in nature and have very high amplitudes ranging from almost equal negative values to positive values. An increase in solidity or blade tapering causes the absolute value of maximum and minimum lateral load coefficients to increase as well. With increasing TSR the lateral loads continue to increase in a uniform manner for the two-bladed turbine, while for the three-bladed turbine at low TSR we see an initial increase in lateral load amplitude followed by a decrease. Once low TSR operation ends the loading trend starts following the two-bladed turbine. It is to be noted that there is also a significant cyclic variation in loading for the thrust coefficient (Cx) too. But Fig. 8 only reports the mean thrust coefficient (Cx) over a single revolution, and the bars have been omitted to reduce complexity of the plot. The cyclic variation in both thrust and lateral loading has been discussed in detail in Sect. 3.2.
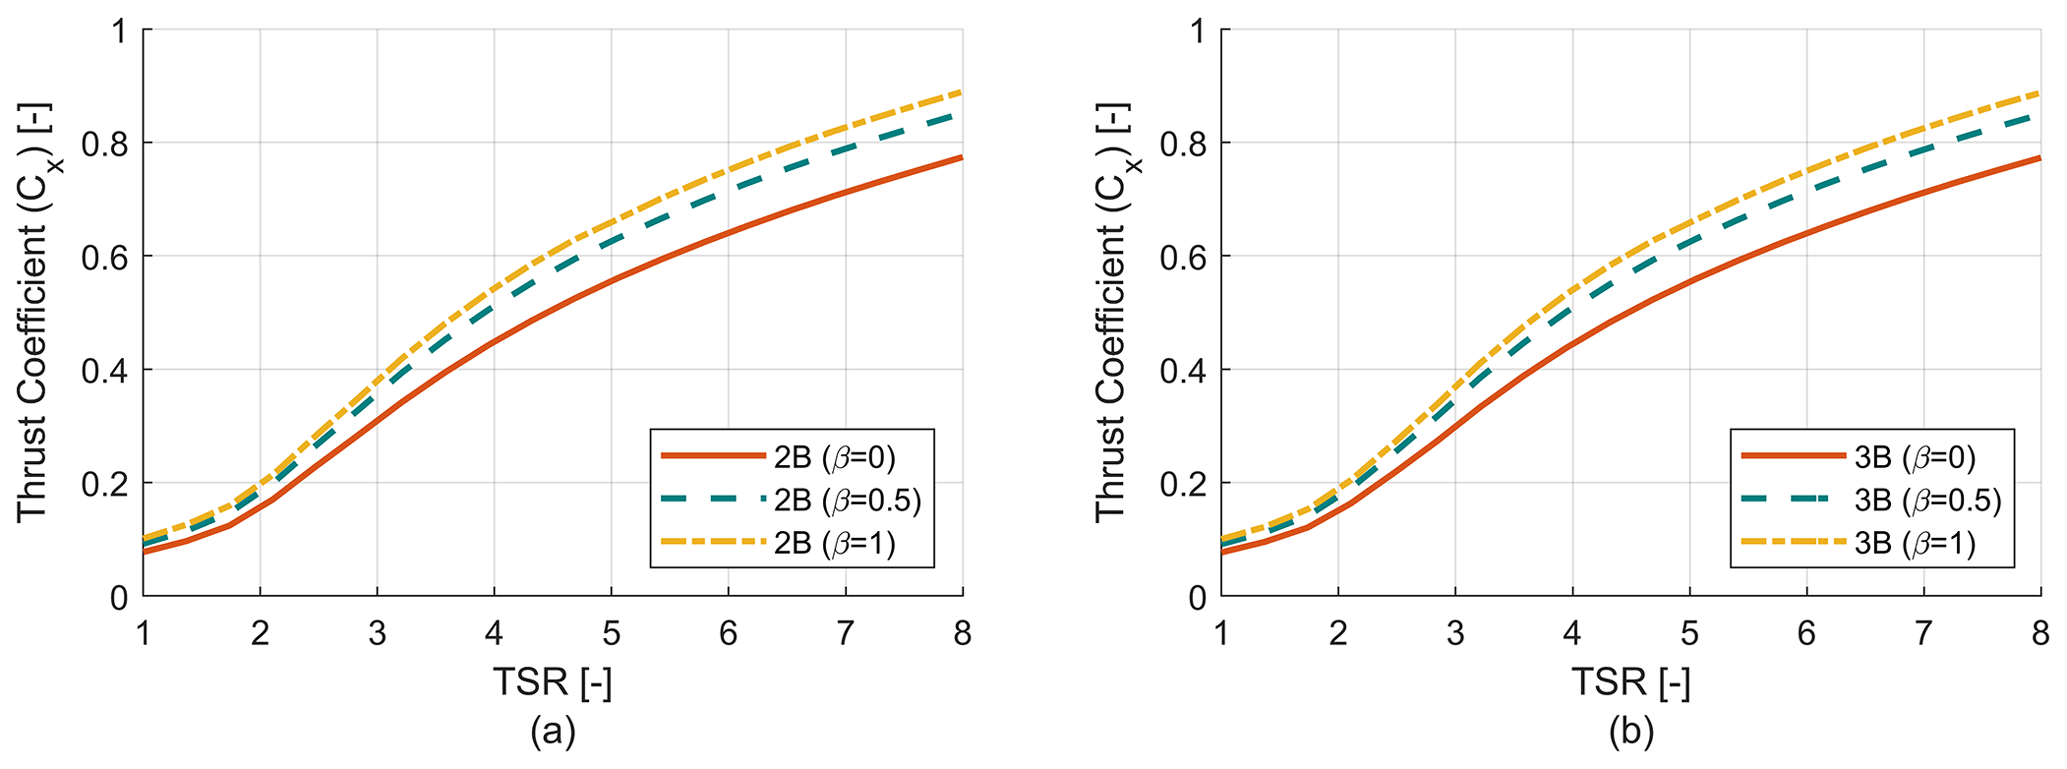
Figure 8Rotor thrust coefficient (Cx) analysis. (a) Thrust coefficient (Cx) vs. TSR curve for two-bladed (2B) rotors. (b) Thrust coefficient (Cx) vs. TSR curve for three-bladed (3B) rotors.
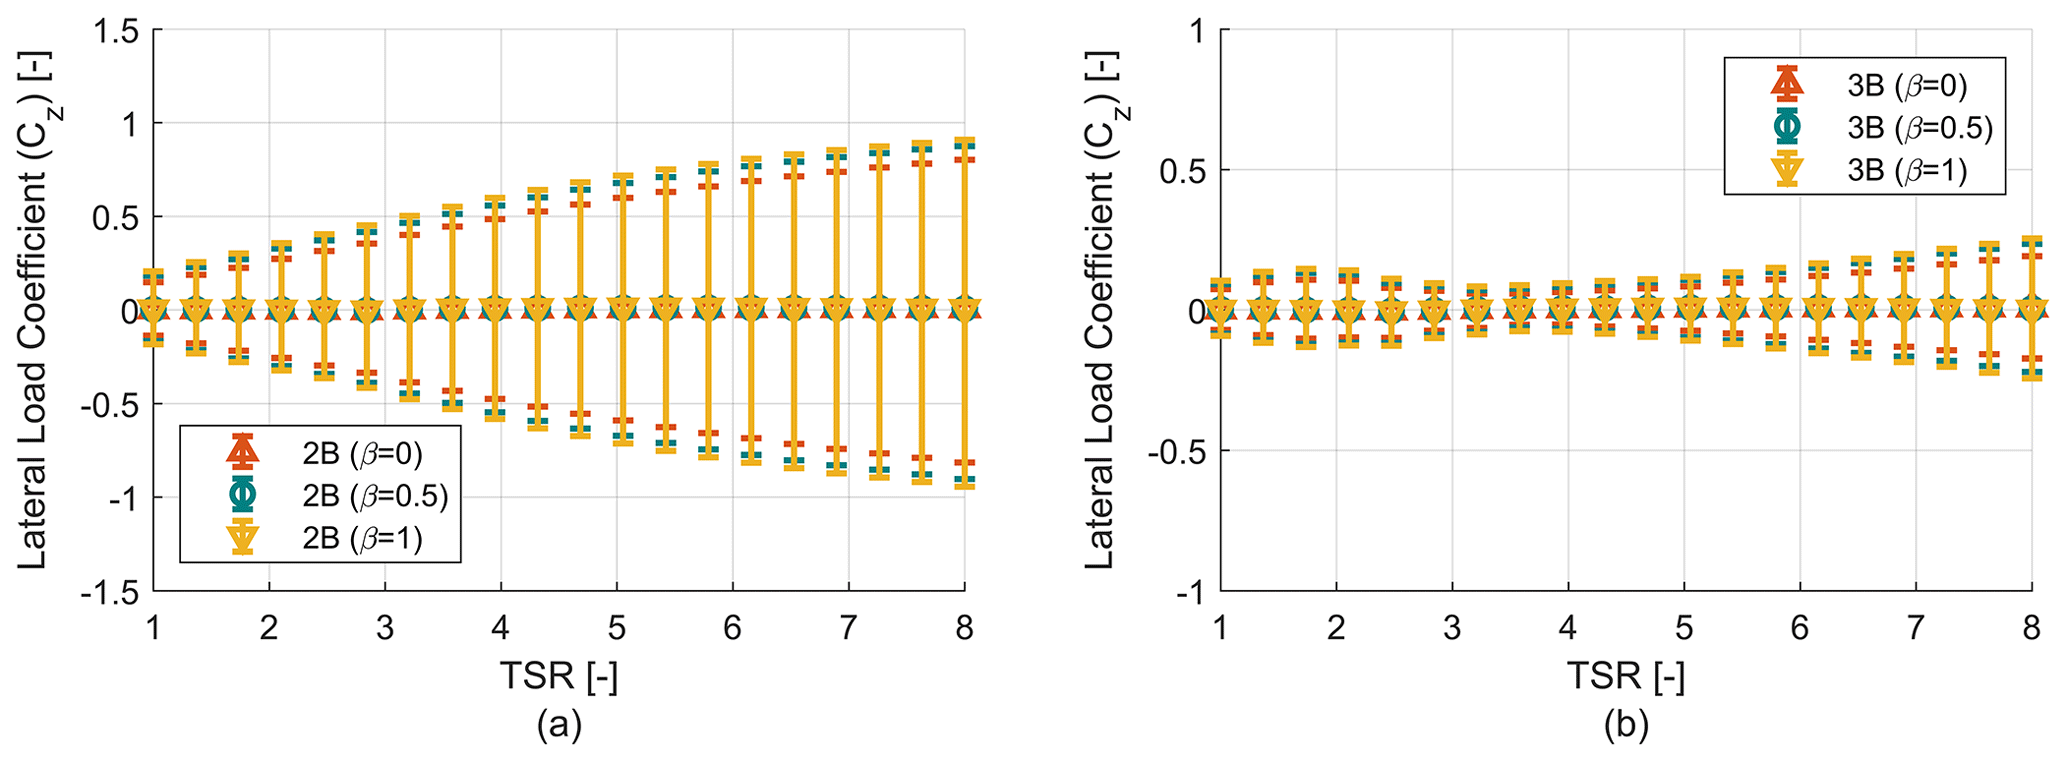
Figure 9Rotor lateral load coefficient (Cz) analysis. (a) Lateral load coefficient (Cz) vs. TSR curve for two-bladed (2B) rotors. (b) Lateral load coefficient (Cz) vs. TSR curve for three-bladed (3B) rotors.
3.1.3 Parked loads
The forces on a turbine during parked conditions at extreme wind speeds are a major load case to investigate, to ensure safe operation of the turbine. Parked loads are of increasing concern because VAWT design loads tend to be maximum for the cut-out wind speed, and the loads increase with wind speed (wind force relation) due to the absence of a pitching mechanism (Griffith et al., 2018).
Despite the importance of parked loads in VAWTs, very few studies have been conducted on the parked load calculations of VAWTs; thus, in this section we present parked loads for various levels of blade chord tapering, and in subsequent sections we examine the impact of other parameters on parked loads. Ottermo et al. (2012) used analytical expressions to estimate storm/extreme loads at parked conditions to find an optimal parking strategy. Experimental measurements of parked loads on blades were conducted on a 12 kW VAWT by Goude and Rossander (2017). Finally some computational fluid dynamics (CFD) on operating loads and parked loads were done by Paulsen et al. (2013) for the DeepWind concept.
In this section, parked loads for the six design candidates will be studied to understand the effects of design variables starting with blade tapering on the parked loads. As methods like CFD will be very computationally intensive to predict parked loads, a simplified analytical method has been developed. Some of the assumptions of this study are that blade loads are calculated from measured 180∘ lift-and-drag data for the NACA-0021 profile provided with CACTUS. As the turbine is parked, static airfoil data have been used. No wake effects have been considered; one blade does not affect another. In addition, shadow effects (blade, tower), strut effects and finite aspect ratio corrections have not been considered. Since in the initial stages of turbine design a lot of design iterations have to be completed, this model proves very efficient and useful while serving as a good numerical tool for rotor parameter optimization too.
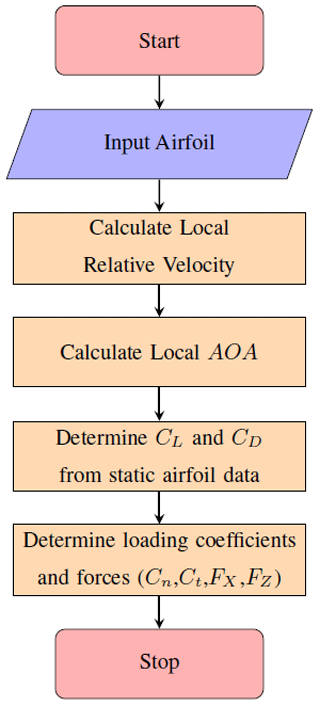
The numerical model computes the solution for a 3D Darrieus rotor, for a set of specified azimuthal positions, horizontal planes and blade elements similar to CACTUS. As a first step, the relative velocity encountered by the blade is determined assuming that the rotational component and the disturbance velocity induced by wake and bound vorticity are zero. Once the relative velocity is found, the instantaneous angle of attack (AOA) can be determined. It is to be noted that the normal and tangential vectors attached to each blade element are considered while calculating the local blade element angle of attack, and thus it is essential to include the blade curvature effects for a 3D Darrieus rotor. Once the angle of attack (AOA) at each azimuthal position for each blade element at specific horizontal planes is known, one can find the instantaneous lift-and-drag forces on the blade elements from static airfoil data. These lift-and-drag forces are resolved into normal (Cn) and tangential (Ct) components of forces. Once the element normal and element tangential components are known, the forces in wind direction (thrust load, FX) and perpendicular to wind direction (lateral load, FZ) on a turbine scale can be calculated. A flowchart detailing the steps involved in parked load calculation is shown in Fig. 10.
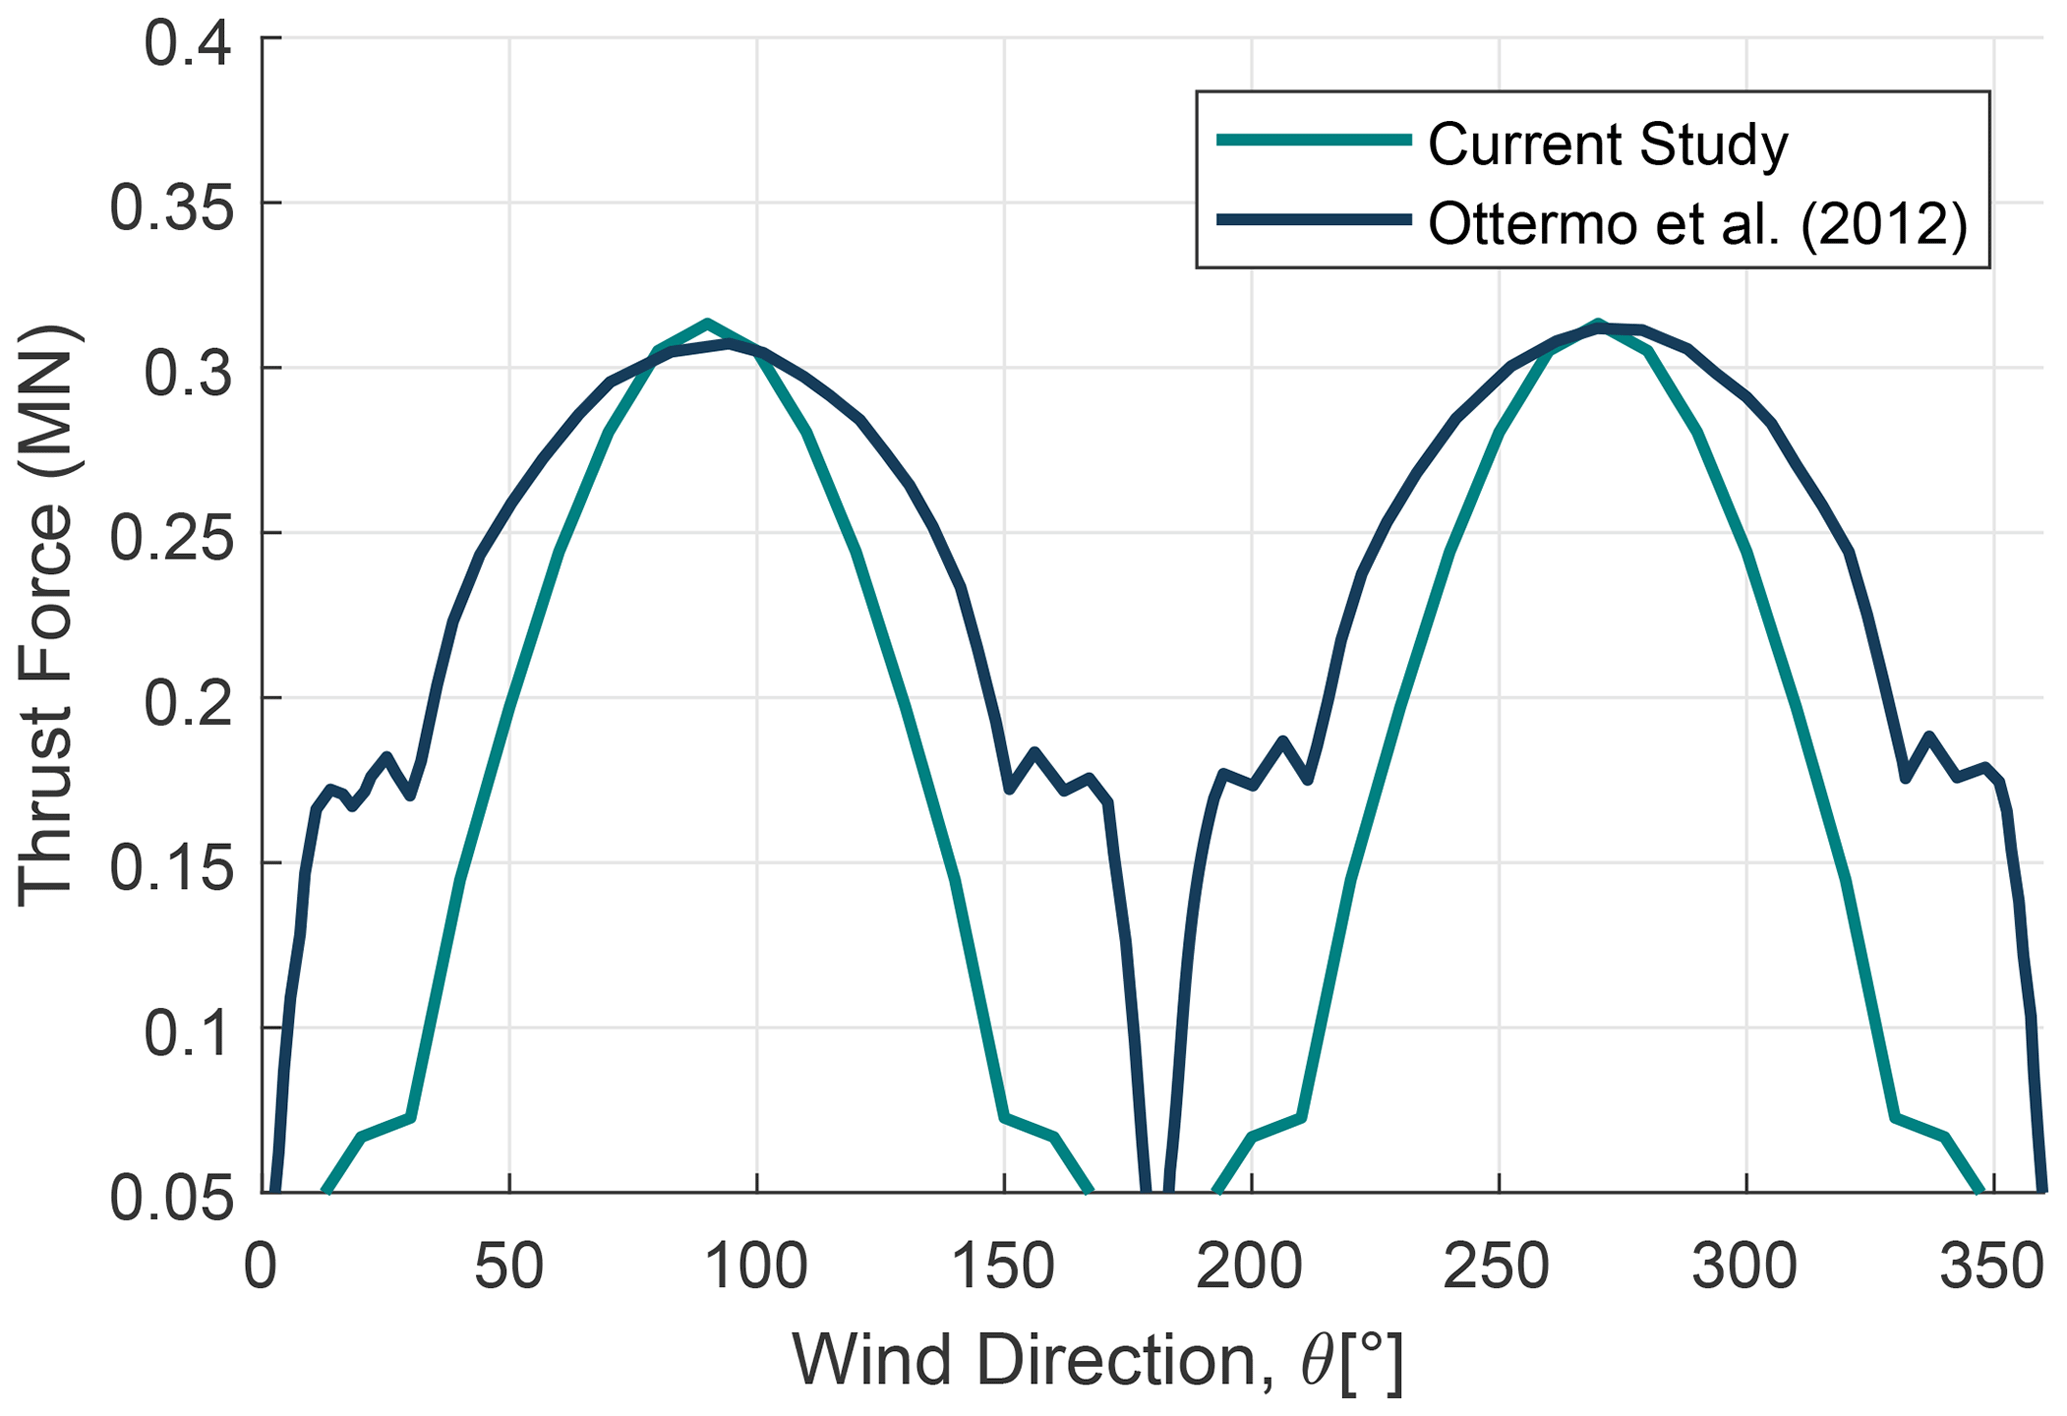
A comparison of the numerical simulation has been performed where the results are compared with Ottermo et al. (2012) as shown in Fig. 11. The peak values match very well, but there are some differences in the overall shape of the profiles. This arises due to the difference in overall theory behind calculation of parked loads for both studies. It is observed that Ottermo et al. (2012) uses simplified standstill thrust load and torque relations where thrust loading is only a function of the drag coefficient and azimuth and does not take into account the lift coefficient.
There are applicable standards in extreme meta-ocean condition like the 50- and 100-year return periods. As International Electrotechnical Commission (IEC) prefers 50-year return periods for extreme design conditions; in this work the parked loads are calculated using a site-specific 50-year return period having a 10 min average wind speed of 30.94 m s−1 with a shear exponent of 0.11 (Sirnivas et al., 2014).
We now examine the rotor thrust and lateral parked loads for different blade chord tapering with results shown in Fig. 12 for parked thrust-direction loads and in Fig. 13 for parked lateral-direction loads. In both Fig. 12 and Fig. 13 the results for two-bladed rotors are plotted on the left and compared with results for three-bladed rotors on the right. As expected, with the increase in tapering, the maximum value of the thrust loads increases for both 2B and 3B configurations. This trend is also observed for lateral parked loads where the absolute value of the maximum load also increases with tapering.
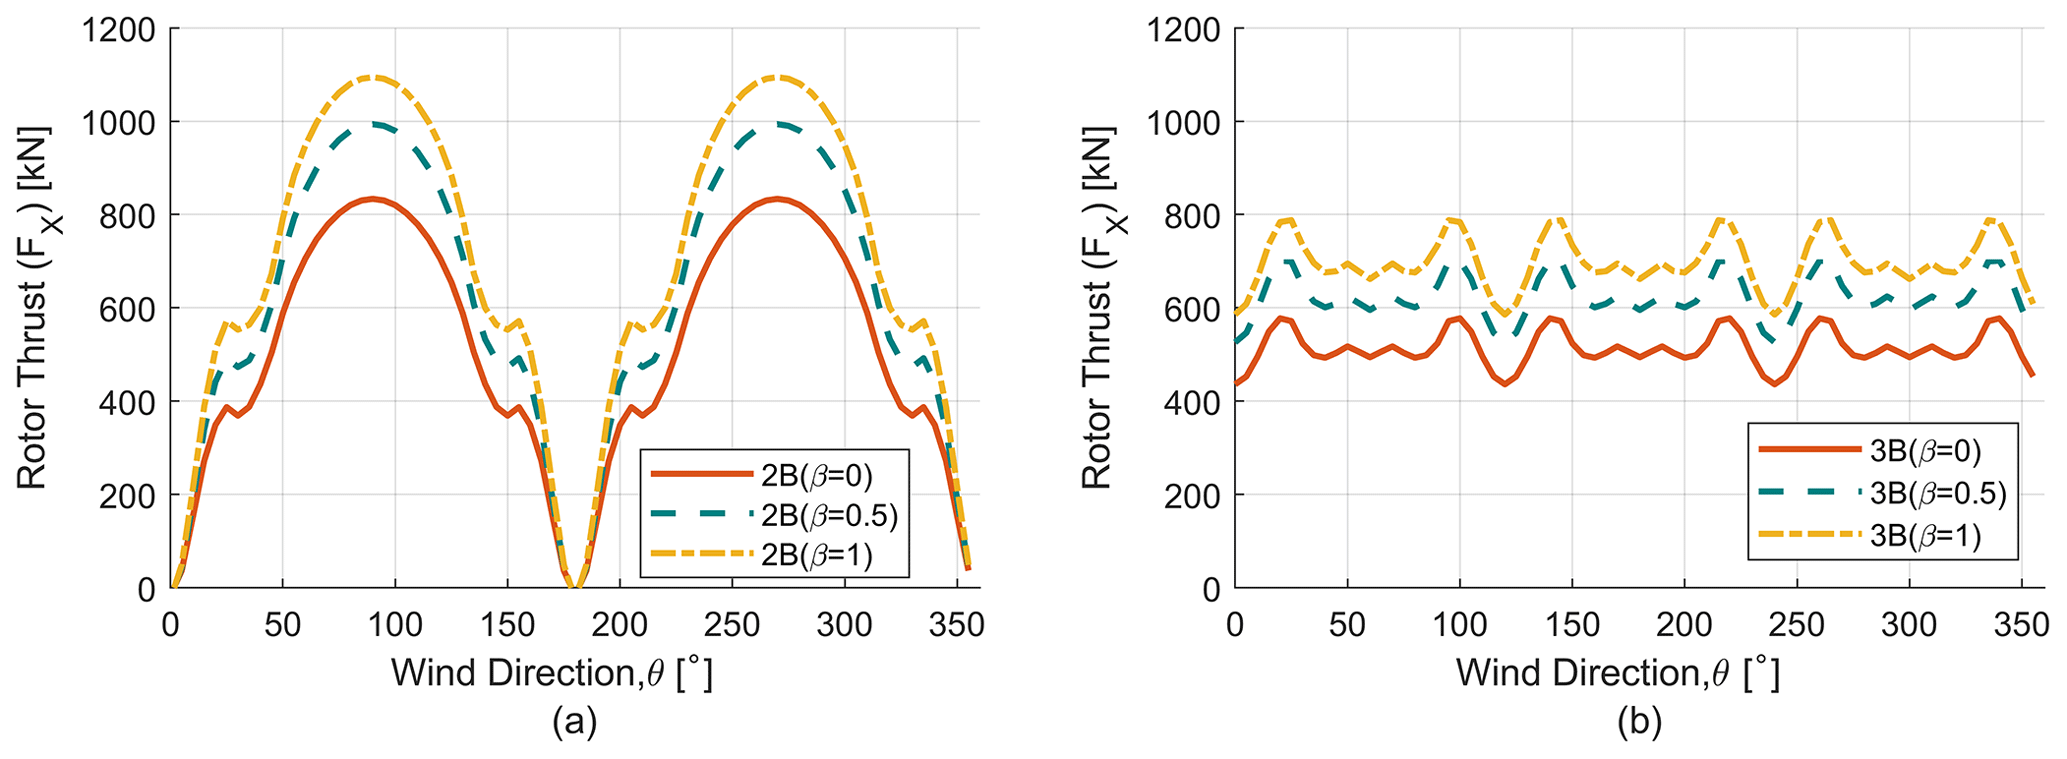
Figure 12Parked thrust load (FX) analysis. (a) Parked thrust load (FX) for two-bladed (2B) rotors. (b) Parked thrust load (FX) for three-bladed (3B) rotors.

Figure 13Parked lateral load (FZ) analysis. (a) Parked lateral load (FZ) for two-bladed (2B) rotors. (b) Parked lateral load (FZ) for three-bladed (3B) rotors.
Increasing the solidity or tapering(β) comes at the cost of higher operating and parked loads despite having higher power production. Higher solidity designs should be structurally more efficient due to higher blade stiffness; however, the combination of high torque and low-RPM operation for higher solidity turbines will lead to a larger drivetrain. Tapering also introduces manufacturing complexity, which will increase the rotor cost. Since parked loads have a significant impact on the floating platform and tower design, adding tapering to the blades will impact the tower and platform design in terms of fatigue and extreme load case performance, which has been studied by Gao et al. (2022).
3.2 Case 2: impact of the number of blades
The number of blades is an important design consideration, which significantly affects the aerodynamic performance of a VAWT because a change in the number of blades will significantly affect the forcing frequency of the cyclic aerodynamic loads. Further, the number of blades may cause a change in solidity, Reynolds number, blade wake interaction, stall behavior, etc. The effect of changing the number of blades on aerodynamic forces generated in VAWTs and the performance coefficients will be discussed in this section. This work investigates the impact of the number of blades on the steady and cyclic turbine loads including thrust loads, lateral loads, parked loads and power ripple effects of Darrieus turbines.
The influence of the number of blades on VAWT aerodynamics has been studied previously in detail; however, most studies have focused primarily on VAWTs with straight blades, which are known as H-VAWTs. Rezaeiha et al. (2018) studied the optimal aerodynamic design of H-VAWTs through a systematic study of solidity and number of blades with the help of 2D CFD simulations. The study indicates that increasing the number of blades has no effect on the averaged power coefficient, while it does impact the uniformity of the power output and loading. Castelli et al. (2012) also studied the effect of the number of blades on H-VAWTs using 2D CFD simulations. The study reveals that with increasing number of blades the power coefficient decreases, but the study was set up in such a way that the solidity is not maintained for all design considerations. As solidity has not been kept constant across all designs, this might lead to erroneous observation and cannot truly isolate the effect of the number of blades on performance. Delafin et al. (2016) studied the effect of the number of blades on Darrieus rotors using a free-wake vortex model similar to this study. The study concludes that with an increase in the number of blades the torque, the thrust and the lateral ripple effects are significantly reduced. Some experimental work also has been done regarding blade number effects. Maeda et al. (2015) studied the effect of the number of blades (ranging from two to five) of a H-VAWT in wind tunnel. Power coefficient, torque coefficient and thrust coefficient against TSR were compared for the range of blade numbers (two to five). The study shows that with an increase in blade number the power coefficient decreases and torque coefficient increases. The measurements also show that as blade number increases the thrust coefficient increases as well, but this is due to the fact the solidity increases with the addition of a blade.
3.2.1 Turbine performance
To demonstrate the impact of the number of blades on turbine performance, the power coefficient (CP) versus TSR and solidity for the six-rotor configurations is studied (similar to Fig. 6) for both low-wind-speed and high-wind-speed conditions. It is seen from Fig. 14 that for low wind speed (5 m s−1) the two-bladed rotors have slightly better aerodynamic performance than three-bladed rotors. This is primarily due to Reynolds number effect, which is dependent on blade chord value and relative blade velocity. As the two-bladed turbines have higher chord values than three-bladed turbines, they are subjected to a higher Reynolds number, which leads to slightly better aerodynamic performance. The noticeable difference mainly arises in the low-TSR region where the blade is operating in dynamic stall conditions and operating Reynolds number is lower compared to high-TSR regions as seen from Fig. 14b, which is a zoomed-in plot of Fig. 14a. And as the TSR increases, the two-bladed and three-bladed performance becomes almost identical as the Reynolds number is sufficiently high for both turbines. A similar study has been performed at high wind speed (14.5 m s−1), where the Reynolds number is considerably higher for all TSR values, and this study is similar to the one done in Sect. 3.1. As for this case, the power coefficient (CP) is mostly invariable to change in the number of blades for all TSR values. So it can be considered that the power coefficient (CP) is insensitive to the change in the number of blades, which confirms that selection of the number of blades should be done based on performance of other design variables rather than the CP.
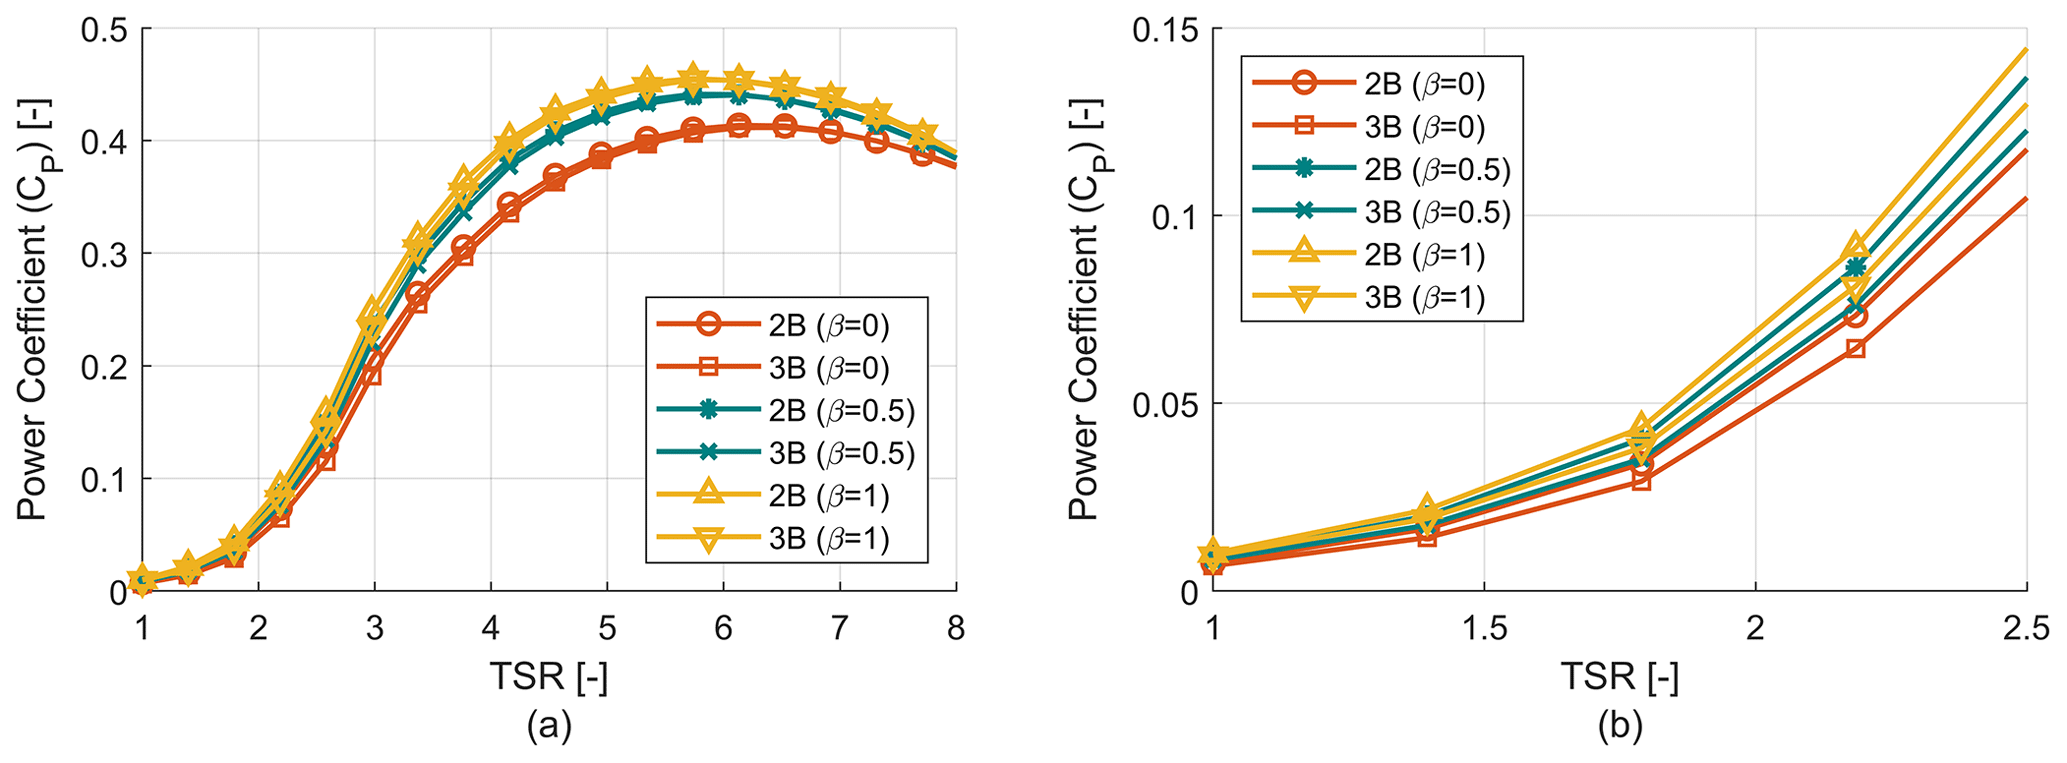
Figure 14Power coefficients (CP) versus TSR for two-bladed (2B) and three-bladed (3B) rotor at low wind speed (5 m s−1).
3.2.2 Turbine loads
Figure 15 shows the trend of the thrust coefficient (Cx) for the six-rotor configurations in the same figure to observe the impact of the number of blades. This study is similar to Fig. 8 of Sect. 3.1.3, where the rotor thrust coefficient (Cx) versus TSR was plotted separately for two-bladed and three-bladed rotors. There are minor differences in thrust coefficient (Cx) at low-TSR regions, and these differences are even smaller at high TSR where the Reynolds numbers for both two-bladed and three-bladed turbines are very high. It can be concluded that the rotor thrust coefficient (Cx) is insensitive to the change in number of blades provided that the solidity is kept constant across rotor configurations with different blade number.
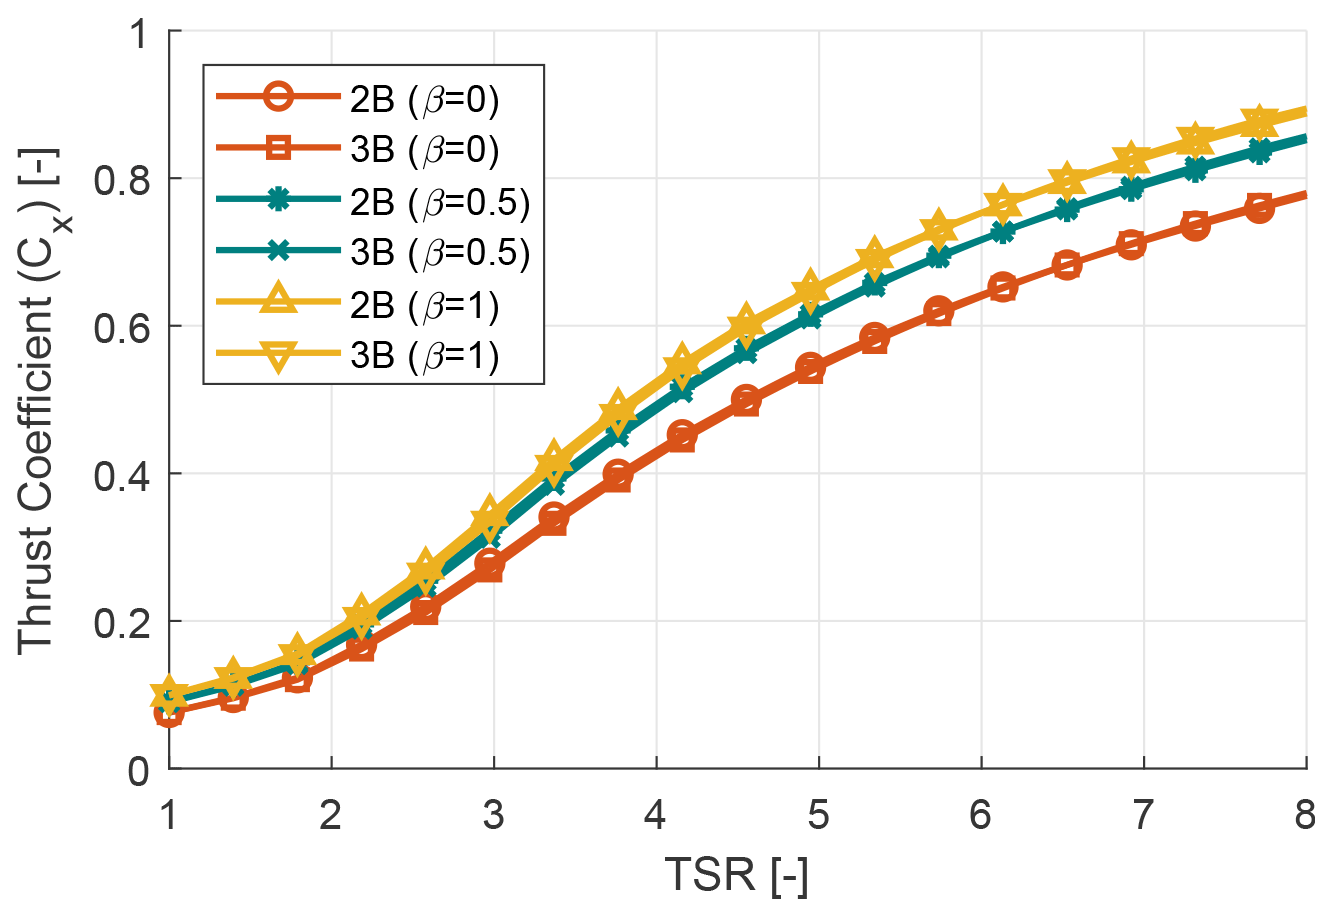
Figure 15Rotor thrust coefficient (CX) analysis for two-bladed (2B) and three-bladed (3B) rotors.
We now turn our attention to cyclic aerodynamic load variations, where the thrust and lateral load profiles for two- and three-bladed turbines are shown in Fig. 16. To quantify the change in cyclic load, the amplitude range of the load profiles is computed similar to the study by Delafin et al. (2016). Adding another blade to a two-bladed turbine reduces the cyclic load amplitude by 85.2 %. Similarly, for the lateral load profiles the cyclic load amplitude decreases by 83.8 %. For similar solidity turbines the average value of the load profiles is very similar, and the 2B (β=0) and 3B (β=0) rotors have a mean thrust value of 449.9 and 428.9 kN respectively. For lateral loads the mean values of the 2B (β=0) and 3B (β=0) rotors are 3.615 and 3.572 kN. Increasing the blade number from 2B to 3B changes the phase of the load profiles and also adds a 3P component to the load profiles. These changes have significant impact on the selection of other design elements like the turbine generator and tower design, blade mass, and fatigue life of the rotor and floating system. Next comes the question of what the mean, maximum and minimum value trend for the full operating range of wind speeds (5–25 m s−1) looks like. The profile of thrust and lateral loads for the full operating range of wind speeds is shown in Fig. 17, where a significant reduction in cyclic load amplitude for the three-bladed rotor is evident for both thrust and lateral loads across all wind speeds. Further, it can be noted that the maximum (peak) operating loads for the three-bladed rotor are also significantly lower than for the two-bladed rotor.
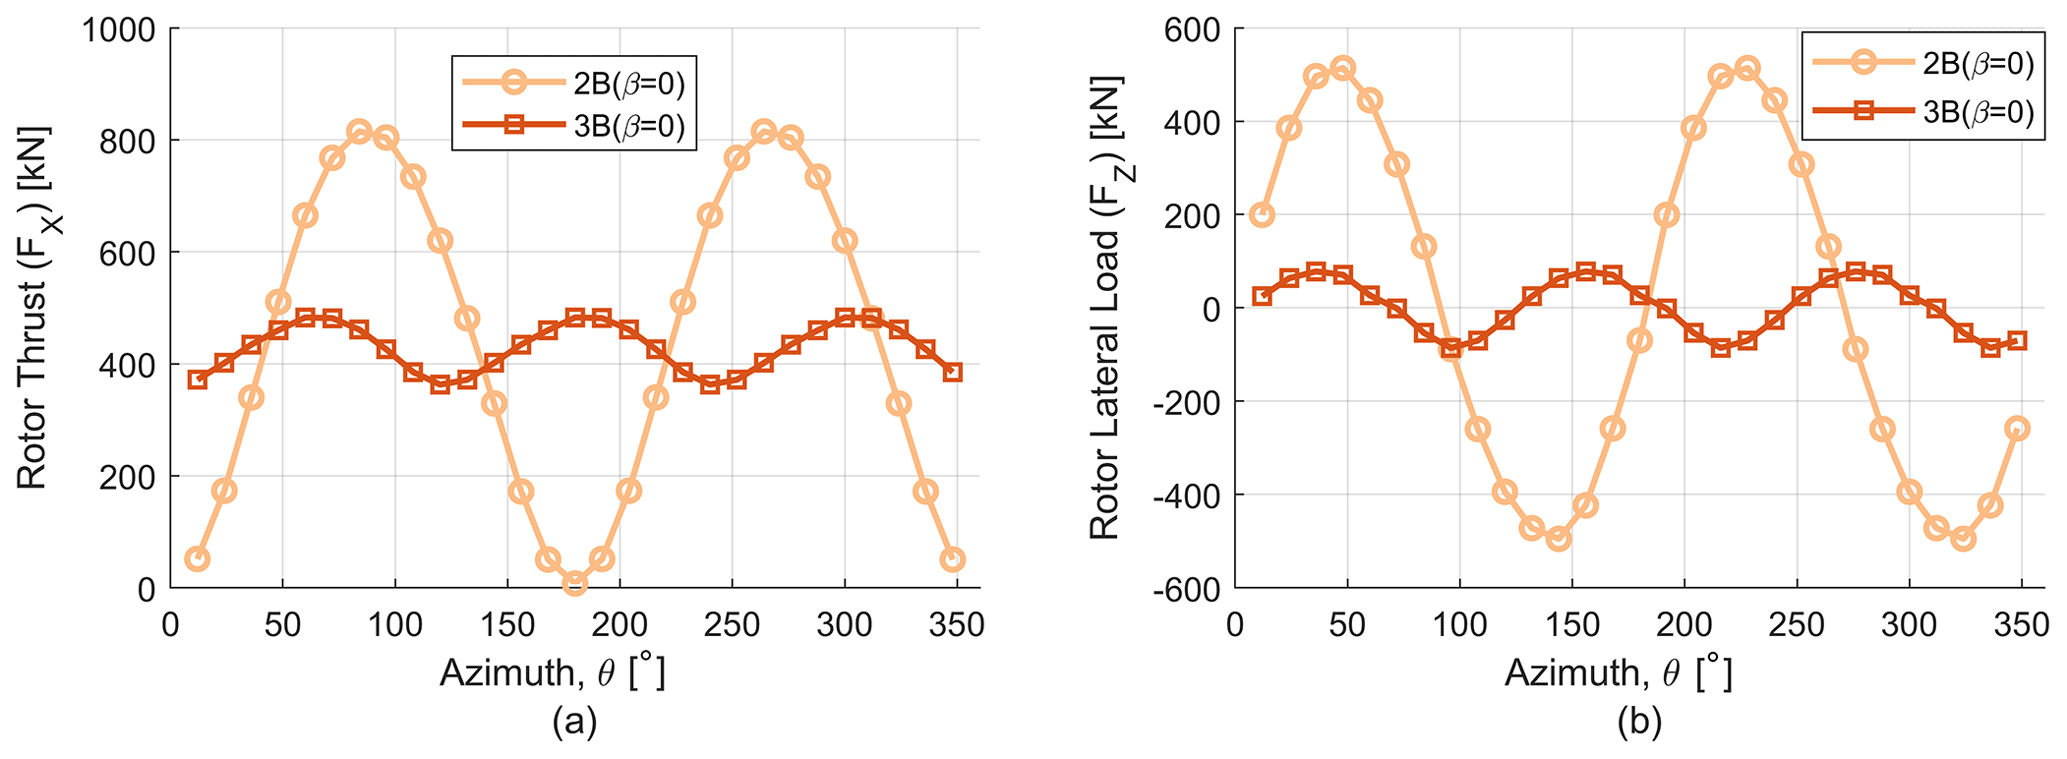
Figure 16(a) Thrust load (FX) for one revolution for two-bladed (2B) and three-bladed (3B) rotors. (b) Lateral load (FZ) for one revolution for two-bladed (2B) and three-bladed (3B) rotors.
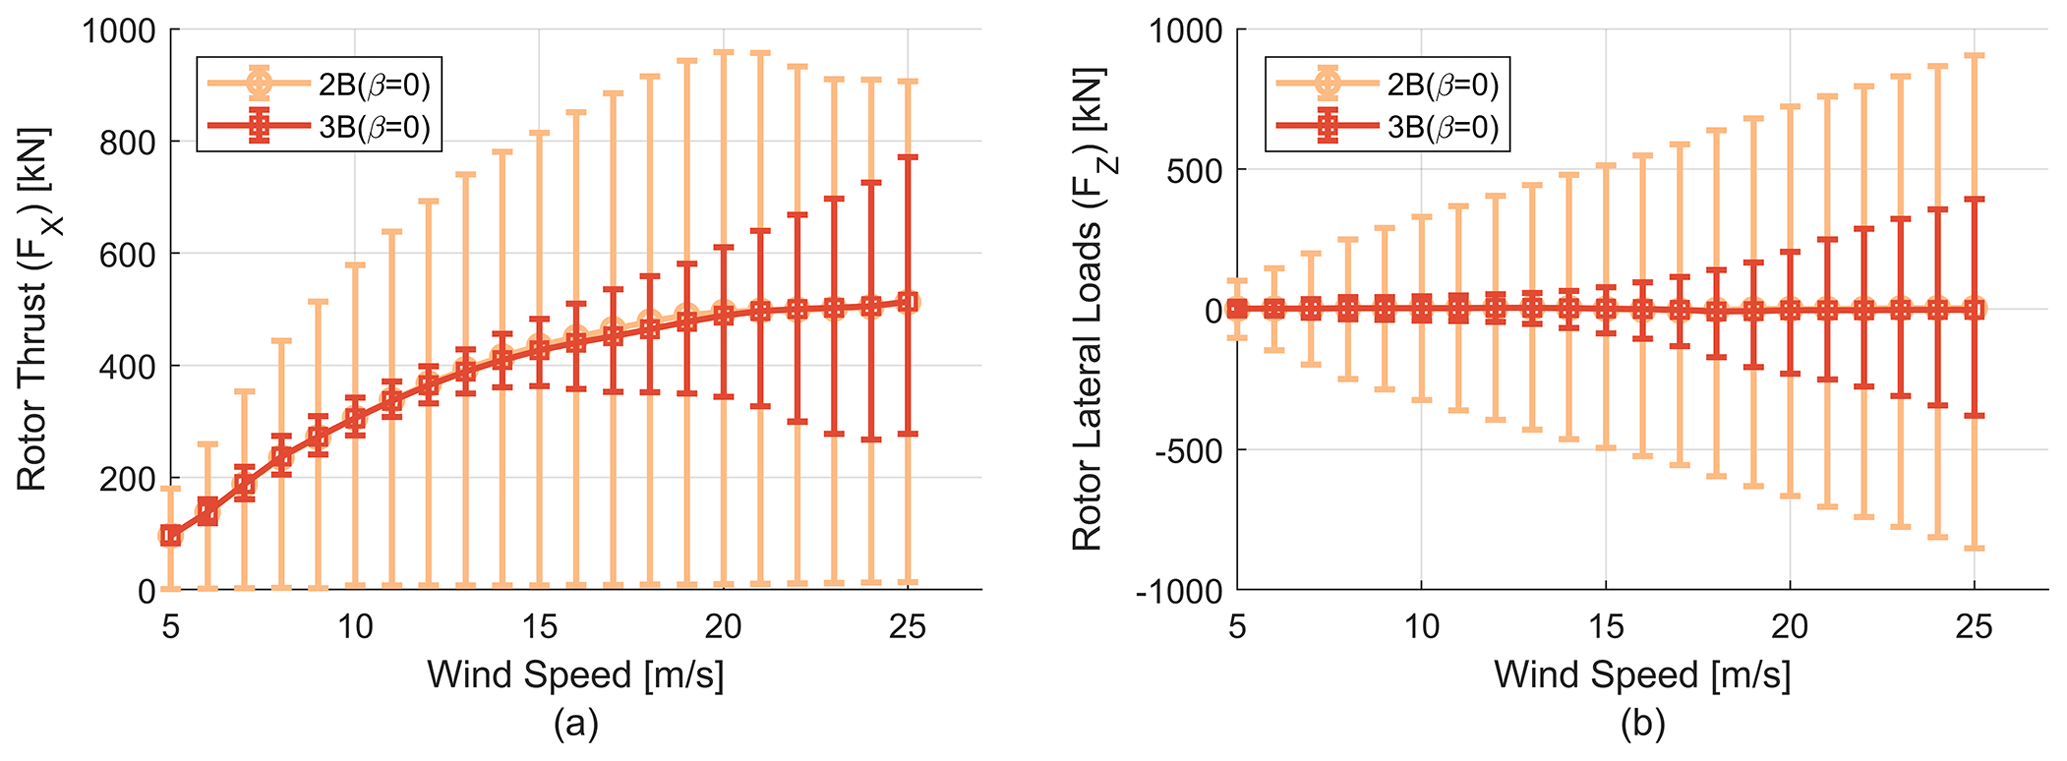
Figure 17Thrust load (FX) and lateral load (FZ) during operating conditions. (a) Thrust load (FX) vs. wind speed. (b) Lateral load (FZ) vs. wind speed.
3.2.3 Parked loads
To demonstrate the effect of the number of blades on parked loads, it is important to show the orientation of loads to wind direction. The dependence of parked (thrust and lateral) loads on number of blades is demonstrated in Figs. 12 and 13. Wind direction is plotted in the x axis, whereas the respective loads (thrust and lateral) are plotted on the y axis, and these trends have been shown for the six design iterations as mentioned previously. It is clear that the parked loads (thrust and lateral) are heavily dependent on wind direction for the two-bladed rotor, which is in direct contrast to three-bladed case where the force is almost constant with wind direction. This is consistent with the findings from Ottermo et al. (2012). A reduction in these parked ripple effects due to the addition of a third blade is similar to the results found in turbine load change due to the addition of a blade. The maximum and minimum of parked thrust and lateral loads have been quantified in Table 3.
Table 3Maximum and minimum of parked thrust (FX) and lateral (FZ) loads.
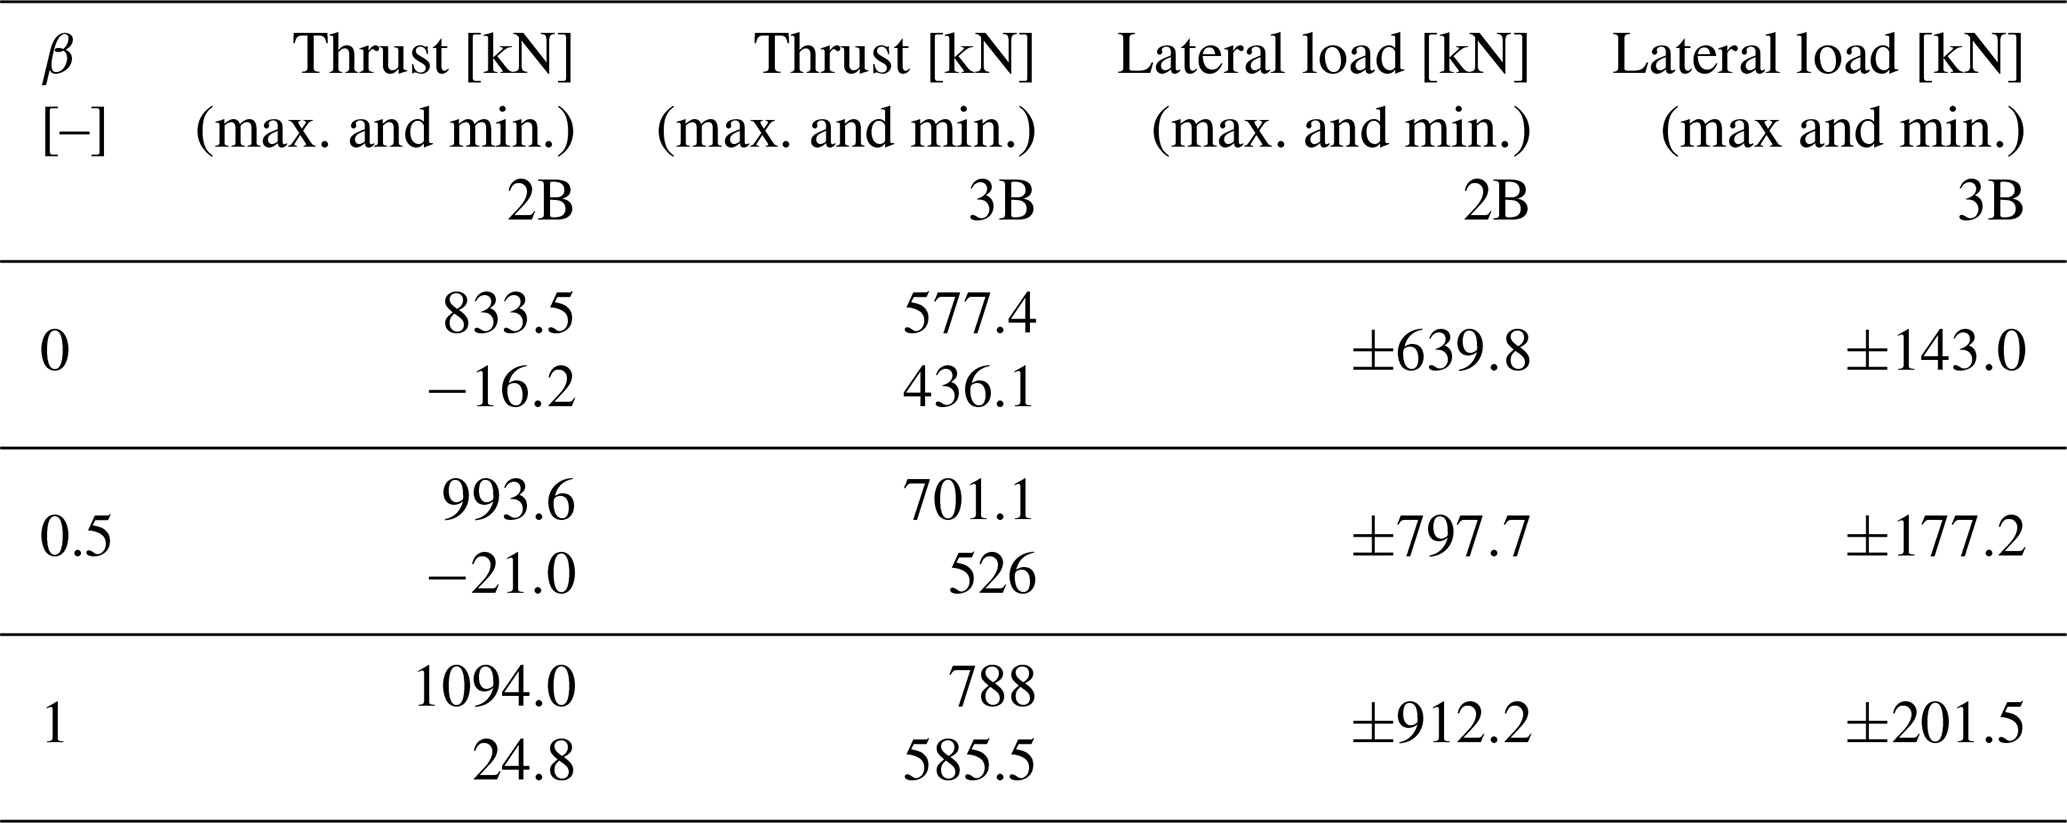
The change in cyclic load amplitude has been quantified according to previous sections. For β=0, 0.5 and 1 the thrust ripple effect decreases by 83.37 %, 82.75 % and 81.9 % respectively. Similarly, for lateral loads the ripple effect decreases by 77.66 %, 77.78 % and 77.9 % respectively.
As the solidity is kept constant for the number of blades study, the chord value along the blade span decreases for three-bladed rotors, which causes a reduction of the blade structural stiffness. This reduction in stiffness might lead to deflection and fatigue issues, which can be counteracted by a structural redesign of the blade. This structural redesign usually results in a heavier blade to due increased spar cap thickness or adding more carbon to the blade composite layup (Sakib et al., 2020). As a result, the total blade cost may significantly increase for more slender (smaller chord) three-bladed rotors compared to two-bladed rotors due to this necessary structural redesign to maintain stiffness. However as the operating and parked loads for three-bladed rotors have a significantly lower cyclic load amplitude range, the platform and tower design will be less impacted compared to two-bladed rotors and should result in greater system level benefits due to overall lower loads across all major components of the turbine (Gao et al., 2022).
3.3 Case 3: impact of aspect ratio
As noted, there are multiple parameters affecting the performance of a VAWT. Thus far, we have examined solidity including solidity changes through variable chord tapering and the impact of the number of blades. We now turn our attention to the impact of aspect ratio (AR) and its effect on aerodynamic performance and loading. The effect of the changing rotor aspect ratio (AR) on the aerodynamic forces generated by a VAWT and the performance coefficients will be discussed in this section. As changes in aspect ratio (AR) affect the aerodynamics of a VAWT especially for Darrieus configurations, it is important to study the change in performance and loads. For this study, aspect ratio is defined as the ratio between the rotor height (H) and rotor diameter (D).
The effect of aspect ratio on VAWT performance has been investigated previously through both experiments and numerical simulation and mostly for H-type VAWT rotors. The effect of changing the aspect ratio on H-type VAWTs has been studied by Brusca et al. (2014), where a multiple stream tube model was used. The authors investigated the Reynolds number relation with changing aspect ratio and concluded that a decrease in aspect ratio increases efficiency. However, this increase in performance can be ascribed to mainly two factors. First, as the designed turbine under consideration is a small-scale turbine (1 kW), all the simulations are in a low Reynolds number regime where the power coefficient is heavily dependent on the operating Reynolds number (Miller et al., 2018; Armstrong et al., 2012). Secondly, since the aspect ratio was varied by changing the rotor radius, this causes a change in the solidity or chord-to-radius ratio () of the turbine and thus results in an increased turbine performance coefficient. As a result it would be erroneous to link an increase in performance to lower aspect ratio as other parameters (radius, solidity) are not being kept constant through the study.
The effect of aspect ratio on H-type VAWTs also has been studied using a 3D panel method by Maeda et al. (2017). In this study, analysis was done for a range of changing ratios (0.4 to 1.2) of the diameter (D) and blade span length (H) at a fixed solidity. The outcome of this study is that with an increasing ratio of diameter and blade span length there is an increase in the turbine power coefficient (CP), and this was attributed to lower tip losses with a growing ratio and decreased circulation amount ratio for a wide range of blade spans for small values of .
Hunt et al. (2020) experimentally examined the performance of H-type VAWTs with blade end struts by varying the aspect ratio (ratio of blade span to rotor diameter) in the range of (0.95 to 1.63) and keeping all the other parameters constant. By keeping other non-dimensional parameters constant, they were able to isolate the true effect of aspect ratio on turbine performance. The conclusion of the study is that if blade support structure (struts) losses are accounted for, the rotor performance is invariant to a change in aspect ratio.
Despite these studies of AR for H-type VAWT rotors, no similar studies of aspect ratio impacts on aerodynamic loads and power performance have been performed for Darrieus-type VAWT rotors. In the following sections, we employ the CACTUS code in a 3D analysis of these aerodynamic effects for a change in aspect ratio similar to the prior studies for variable blade chord tapering and number of blades shown in prior sections.
3.3.1 Turbine performance
It can be seen from the literature that different non-dimensional parameters can give us erroneous perceptions regarding the effect of aspect ratio on rotor performance; therefore, in this study the aspect ratio has been varied in such a manner that the rotor diameter (D) and solidity remain constant so that only the rotor height (H) is changed. The aspect ratio (AR) study has been conducted for both two-bladed (2B) and three-bladed (3B) turbines; for β=0, 0.5 and 1; and for AR=0.5, 0.75, 1 and 1.5 as listed in Table 1.
Figure 18 shows the change in power coefficient (CP) and TSR for different AR values and β=0. On the x axis we have TSR and on y axis we have the power coefficient (CP), and they have been plotted for both 2B and 3B turbines. β=0.5 and 1 are intentionally left out, as similar trends are observed as for β=0.

As seen from the figure, the peak of the power coefficient increases with the increase in aspect ratio (). But the optimum TSR also increases with the increase in . The maximum values of the power coefficient (CP) for both 2B (β=0) and 3B (β=0) turbines have been noted in Table 4.
Table 4Maximum power coefficient (CP) for different aspect ratio (AR) rotors.
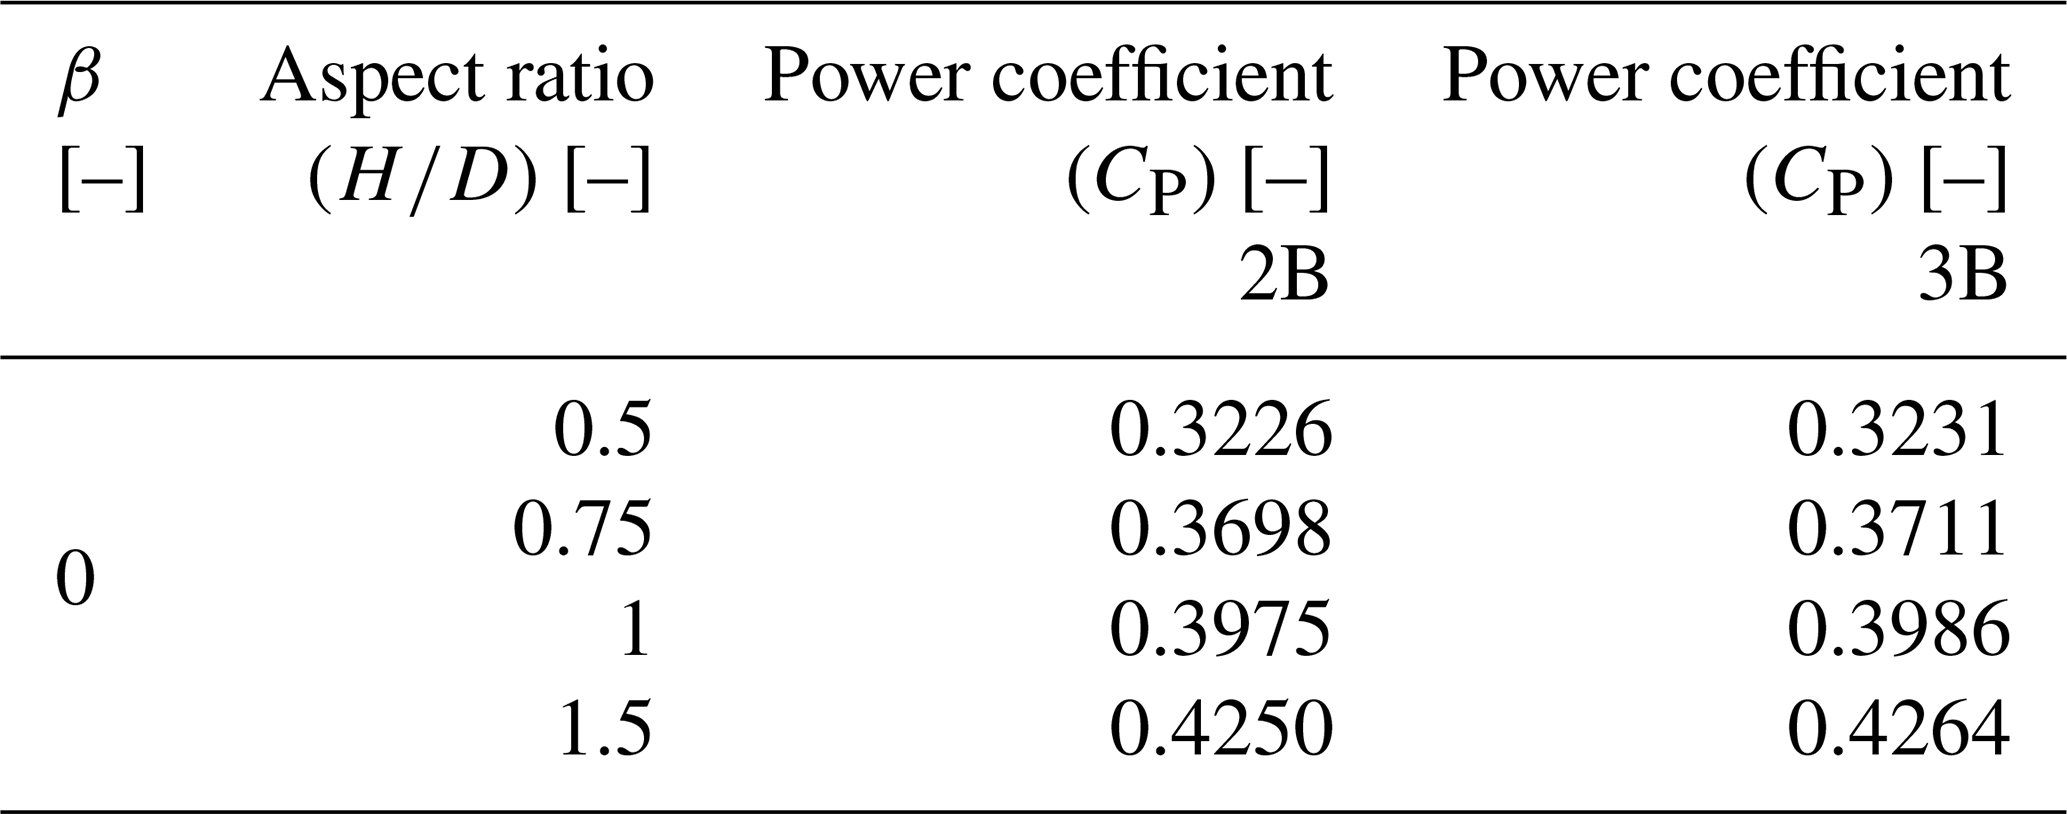
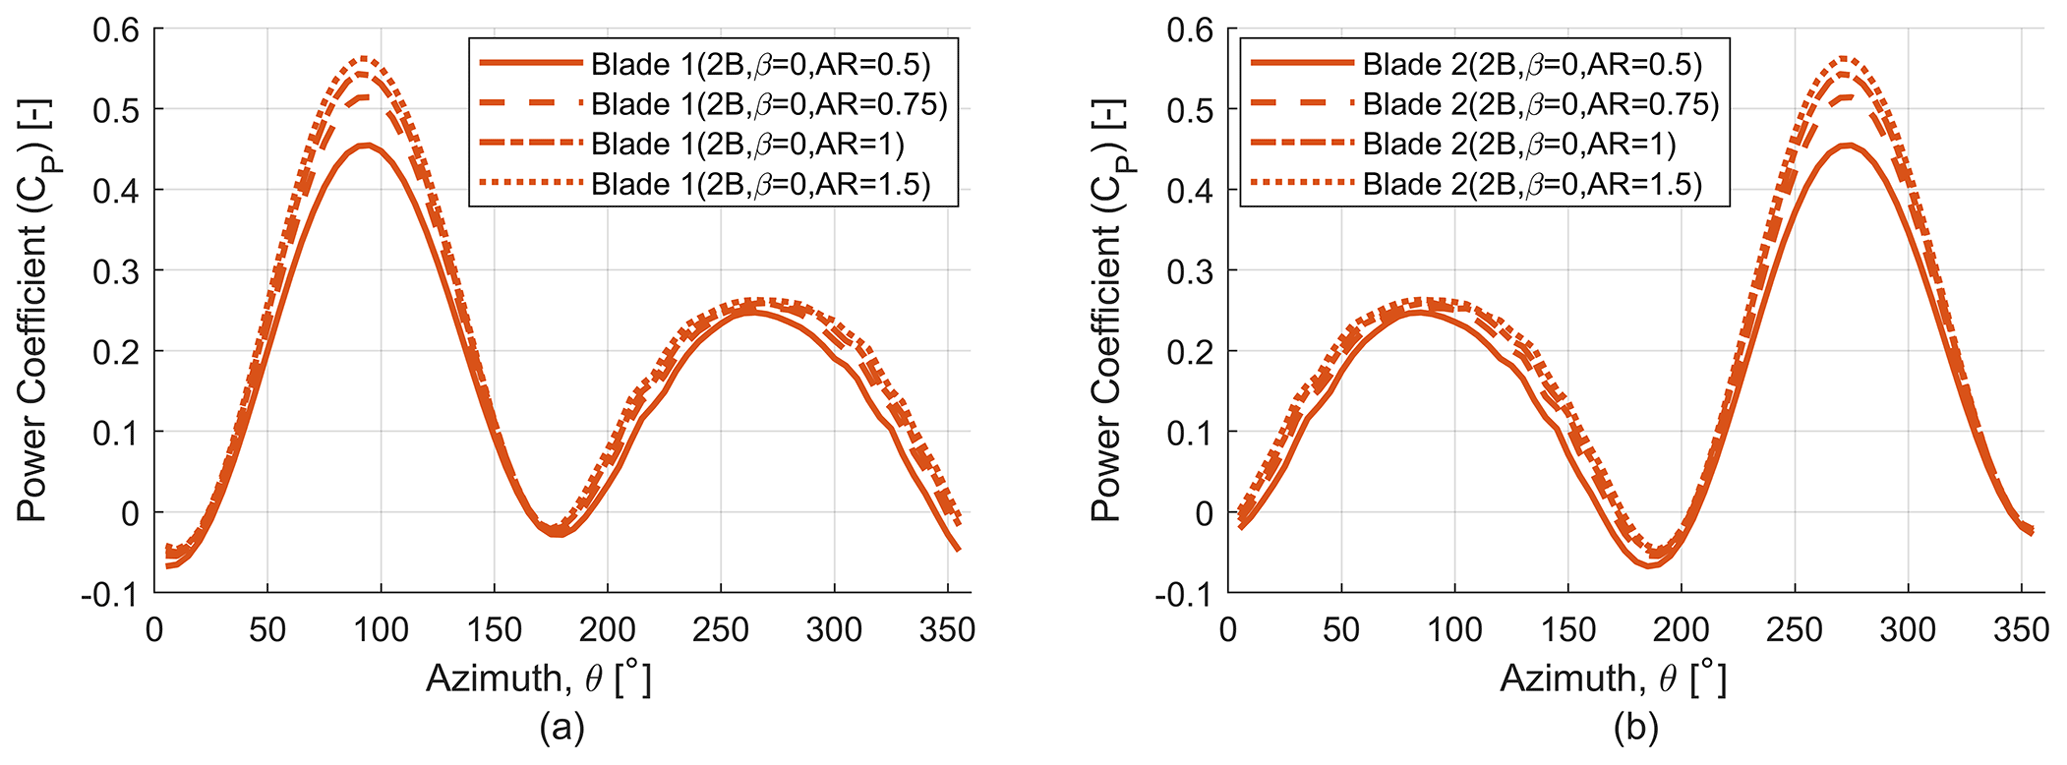
This increase in power coefficient with aspect ratio (AR) can be attributed to blade curvature effects. As a low--ratio turbine has more blade curvature compared to a high--ratio turbine, this limits the region of blade span producing high torque for a low--ratio turbine. To demonstrate this effect, the power coefficient (CP) of the individual blades for the two-bladed (2B, β=0) rotor for all aspect ratio (AR) values under consideration has been plotted against the rotor azimuth angle (Fig. 19). We can see that with increasing aspect ratio each blade has a greater contribution to the rotor power coefficient, and this due to the fact that a higher aspect ratio rotor has a greater blade span producing higher torque values.
3.3.2 Turbine loads
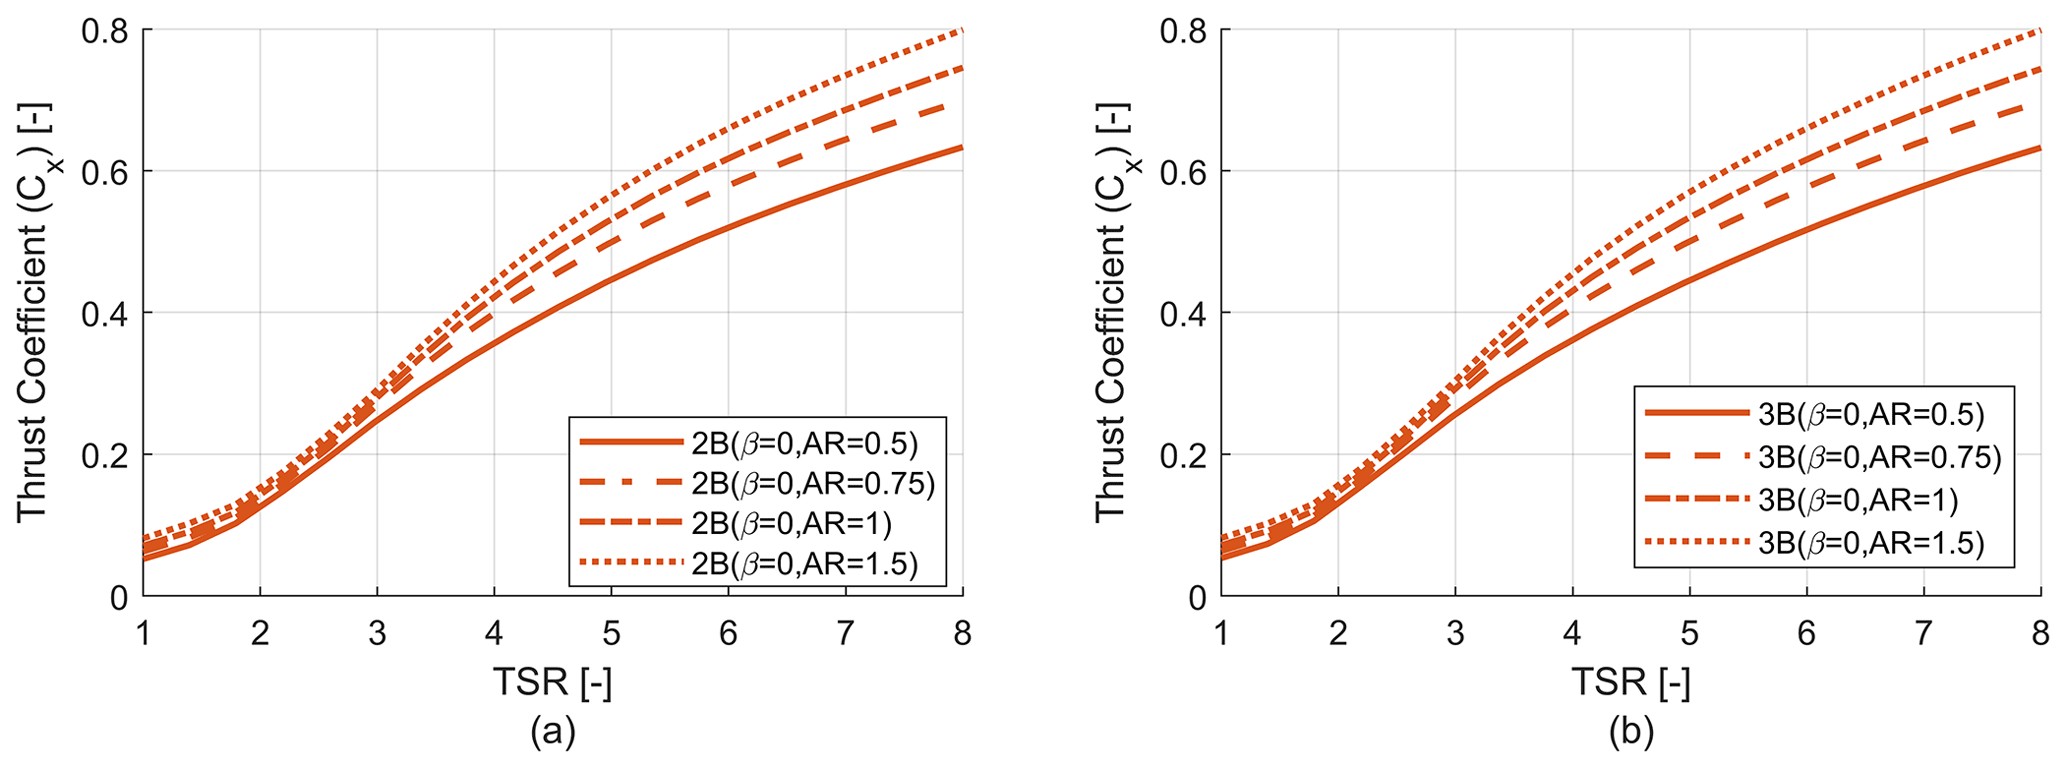
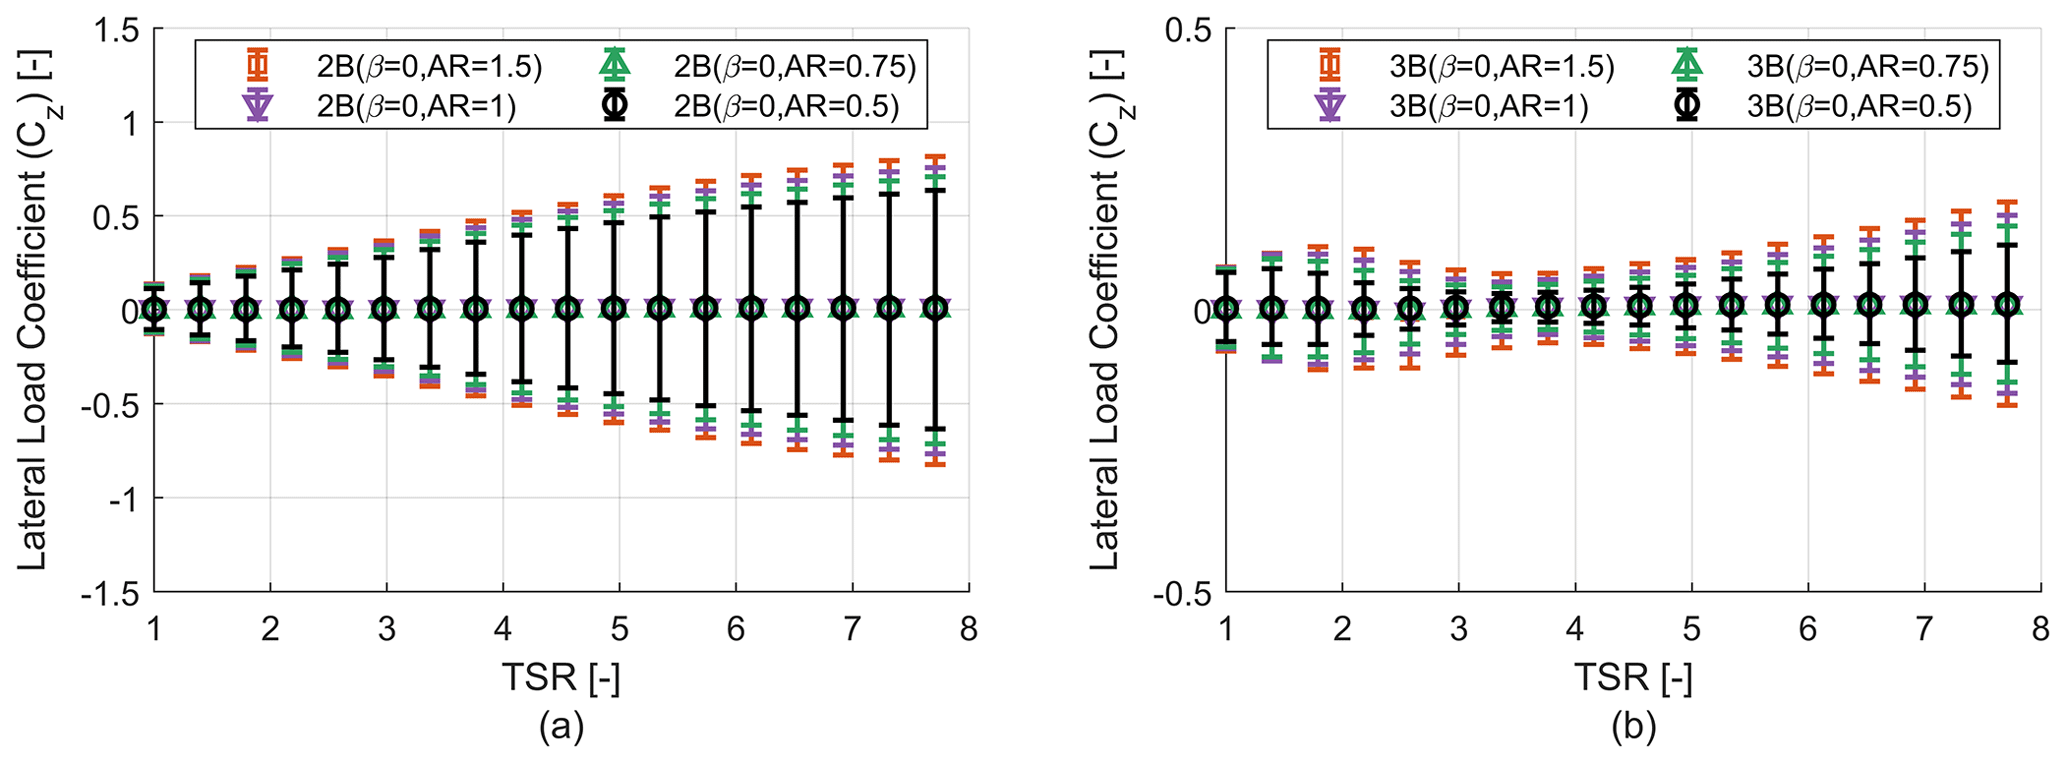
The effect of increasing the aspect ratio (AR) on the thrust and lateral loads is studied in this section. Figure 20 shows the effect of changing the aspect ratio on the thrust coefficient (Cx), and Fig. 21 shows the effect of changing the aspect ratio on the lateral load coefficient (Cz). As expected, it can be seen from Fig. 20 that with increasing aspect ratio (AR) and TSR the turbine thrust coefficient (Cx) goes up too. The trends remain same for three-bladed (3B) turbines too as solidity is kept constant across two-bladed (2B) and three-bladed (3B) designs. For lateral loads the mean value is not affected by a change in aspect ratio (AR), but the absolute value of the maximum and minimum lateral loads increases with AR and TSR (Fig. 21). Again we see similar behavior of lateral loads for three-bladed (3B) turbines, where adding another blade significantly reduces the range of the loads.
3.3.3 Parked loads
Because parked loads are a major load case in designing VAWTs (Griffith et al., 2018), it is important to understand the relation between change in aspect ratio (AR) and parked loads. Figures 22 and 23 show the variation of parked (thrust and lateral) loads for different aspect ratios for two-bladed (2B) and three-bladed (3B) turbines. Plots have been shown only for the β=0 case as the trends remain similar for the other β values. It is observed that with an increase in aspect ratio the thrust and lateral loads increase, which is consistent with the findings of the effect of aspect ratio on turbine loads (previous section). Adding another blade significantly reduces the ripple effect and makes the loads independent of wind direction.
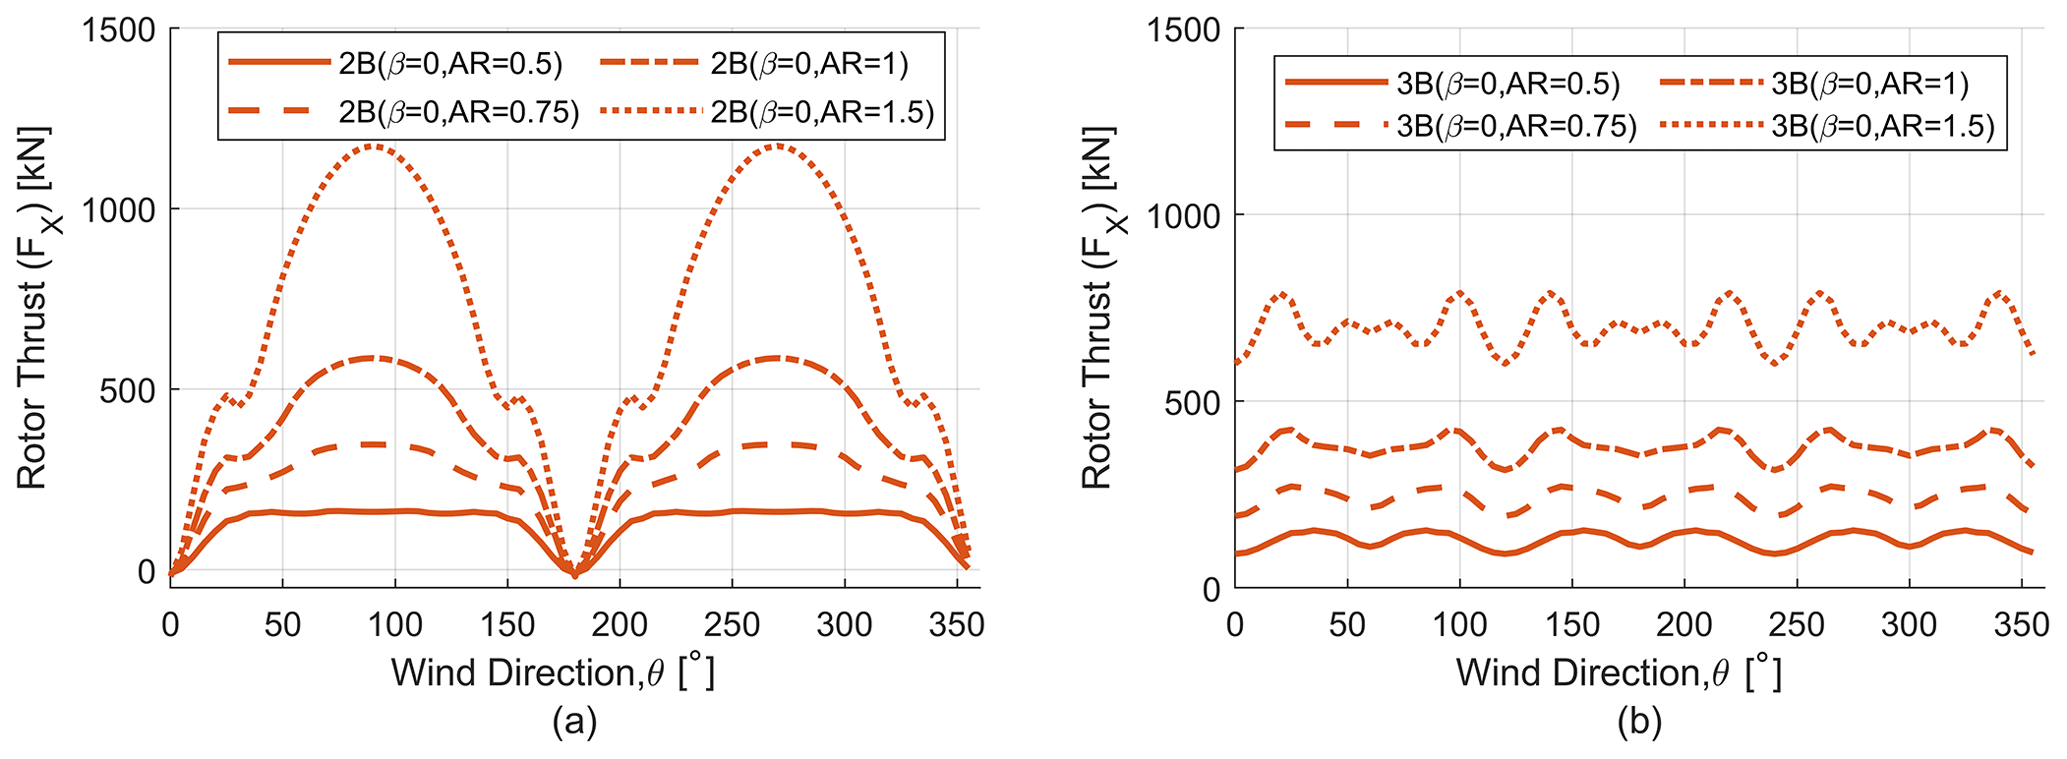
Figure 22Parked rotor thrust load (FX) analysis for different aspect ratio (AR) rotors. (a) Parked thrust load (FX) for two-bladed (2B) rotors. (b) Parked thrust load (FX) for three-bladed (3B) rotors.
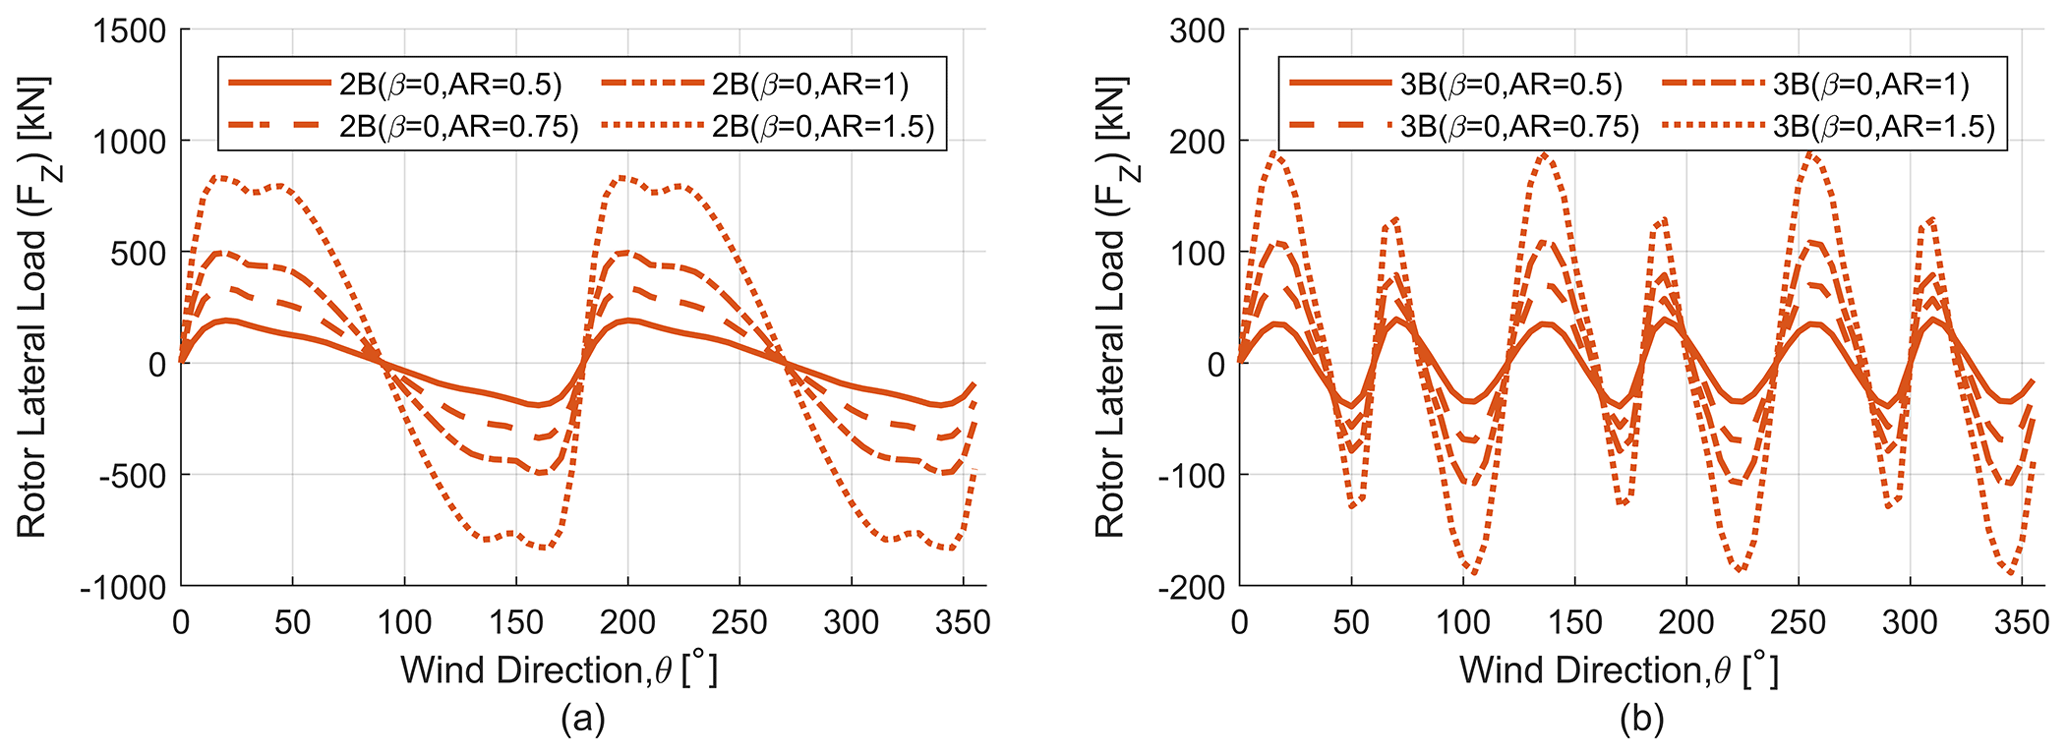
Figure 23Parked rotor lateral load (FZ) analysis for different aspect ratio (AR) rotors. (a) Parked lateral load (FZ) for two-bladed (2B) rotors. (b) Parked lateral load (FZ) for three-bladed (3B) rotors.
As seen in this section, increasing the turbine aspect ratio significantly affects the power and loads of a turbine. It is important to carefully select the design aspect ratio of the turbine as a high aspect ratio value will lead to greater power production but will also result in significantly higher parked and operating loads. Aspect ratio will also affect the rotor center of gravity, which in turn affects the floating platform stability.
In order to generate modern and efficient VAWT rotor designs, one needs to understand the design space and the variables affecting the aerodynamic design space of a VAWT. However, to capture the effect of one design variable on the turbine performance, it is important to isolate the effect of that particular design variable so we can reach proper conclusions. In this work a comprehensive and systematic study of the effect of blade tapering (β), number of blades (N) and aspect ratio (AR) on Darrieus-type VAWT aerodynamic performance has been conducted using a vortex model named CACTUS to evaluate the integral parameters like power and load coefficient, as well as the instantaneous azimuthal thrust and lateral forces. As mentioned previously, parked loads are an important load case for VAWTs due to the lack of a pitching mechanism and the omnidirectional nature of VAWTs. So a comprehensive analysis of parked loading on VAWTs has been studied too. In order to get representative power curves and operating loads of a turbine, an operational strategy development procedure for stall-controlled turbines was discussed too.
In this study, a mid-fidelity 3D vortex model named CACTUS (which has been validated with experimental data) has been used to carry out all the analysis. Both two- and three-bladed turbines have been studied for different blade chord tapering schemes () and different aspect ratios (). It is important to note that for a particular β value, 2B and 3B turbines have the exact same solidity. This study also covers a range of tip speed ratios () and full operational wind speeds (5–25) m s−1.
Some of the highlights of the present study are listed as follows.
- 1.
Blade chord tapering impacts
- a.
As tapering has been applied to the blades by adding solidity, the power coefficient (CP) increases with increasing tapering, but the optimum TSR decreases.
- b.
With an increase in tapering, the maximum operating RPM to produce a rated power of 5 MW also decreases, and the lower RPM leads to higher torque, which will increase the cost of the drivetrain.
- c.
As for turbine loads, there is an increase in thrust coefficient with increasing β value, and for the lateral load coefficient the mean remains almost unaffected by the β value. However, due to the symmetric nature of lateral loads, the peak (max. and min.) during a single revolution increases due to the increase in β and TSR values.
- d.
We also see similar trends for parked loading too. With an increase in β, the peak of rotor thrust and lateral parked loads increases as well.
- a.
- 2.
Number of blades impacts
- a.
The effect of the number of blades on the power coefficient has been studied both at low and high wind speeds to observe the effect of Reynolds number on trends since changing the number of blades directly affects the chord-to-radius ratio () of the rotor. At low wind speeds the 2B rotors slightly outperform the 3B rotors, especially in low-TSR regions, and at sufficiently high wind speeds the power coefficient becomes insensitive to changes in the number of blades.
- b.
As the solidity is kept constant for both two-bladed and three-bladed rotors for a particular β value, the revolution-averaged thrust coefficient is also insensitive to the number of blades.
- c.
Adding one blade to 2B turbines significantly affects the range of the load profiles or the ripple effect. For example, when one blade is added to a 2B (β=0) turbine in such a way that solidity is kept constant, the range of the thrust and lateral loads reduces by 85.16 % and 83.76 % respectively at a single wind speed. These reductions can also be observed for the whole range of operating wind speed (5–25) m s−1.
- d.
Similar trends are also seen for parked load variation. There is a massive reduction in the range of both thrust and lateral parked loads for the three-bladed rotor in comparison to the two-bladed rotor. It is important to note that the magnitude of parked loading on a three-bladed turbine is independent of the incoming wind direction, which is in direct contrast to a two-bladed turbine. So parked loading on a two-bladed turbine can be significantly reduced through an optimal parking operational strategy.
- a.
- 3.
Aspect ratio impacts
- a.
The effect of changing aspect ratio (AR) has been quantified for AR=0.5, 0.75, 1, and 1.5 and is defined by the ratio of rotor height (H) to rotor diameter (D). The aspect ratio was changed in such a way that the rotor diameter remains constant while the rotor height keeps changing.
- b.
With an increase in aspect ratio, the power coefficient, thrust coefficient and peaks of lateral load coefficient increase.
- c.
A similar trend is observed for parked loads too, where the peak of thrust and lateral loads increases with an increase in aspect ratio.
- a.
The findings in this work provide a better understanding of the effect of blade chord tapering, rotor aspect ratio, and number of blades on the power, thrust, lateral, and parked loads and shed light on some important load conditions which are usually overlooked, namely VAWT parked loads and the cyclic lateral (side-to-side) loading components. In future studies, to better quantify the effects of these design variables, the analysis should be coupled with a levelized cost of energy (LCOE) analysis. This can be really insightful as a small change in a single parameter will change the cost of energy as other variables are also affected – for example, to see if the cost of adding an extra blade is lower than the savings it would lead to or if opting for a turbine with higher β will lead to cost savings or added expenditure due to a larger drivetrain. In addition, as the analysis has been carried out for a single airfoil, a more comprehensive analysis can be performed using modern airfoils tailored specifically for VAWTs. In addition, dynamic stall is a major concern for VAWTs; a more detailed analysis can be carried out with dynamic stall models tuned for a particular rotor case that can give one a more realistic picture of VAWT operating loads and performance.
The code is available in the public CACTUS GitHub repository (https://github.com/SNL-WaterPower/CACTUS, SNL-WaterPower, 2022).
The data that support the findings of this study are available on reasonable request from the corresponding author (D. Todd Griffith).
This work was performed during the MS of MSS under the supervision of DTG as part of an Advanced Research Projects Agency–Energy (ARPA-E)-funded project named A Low-cost Floating Offshore Vertical Axis Wind System. MSS and DTG contributed to the analysis and interpretation of the data, and the manuscript was prepared by MSS with the help of DTG.
The contact author has declared that neither they nor their co-author has any competing interests.
Publisher's note: Copernicus Publications remains neutral with regard to jurisdictional claims in published maps and institutional affiliations.
The research presented herein was funded by the US Department of Energy Advanced Research Projects Agency–Energy (ARPA-E) under the ATLANTIS program with the project title A Low-cost Floating Offshore Vertical Axis Wind System and with award no. DE-AR0001179. Any opinions, findings, and conclusions or recommendations expressed in this material are those of the authors and do not necessarily reflect the views of ARPA-E. The authors are grateful for the support of the ARPA-E program and staff, as well as the project team.
This work was funded by the US Department of Energy Advanced Research Projects Agency–Energy (ARPA-E) (grant no. DE-AR0001179).
This paper was edited by Gerard J. W. van Bussel and reviewed by Claudio Balzani and one anonymous referee.
Achard, J.-L., Maurice, G., Balarac, G., and Barre, S.: Floating vertical axis wind turbine–OWLWIND project, in: 2017 International Conference on Energy and Environment (CIEM), IEEE, Bucharest, Romania, 19–20 October 2017, 216–220, https://doi.org/10.1109/CIEM.2017.8120794, 2017. a
Ahsan, F., Griffith, D. T., and Gao, J.: Modal dynamics and flutter analysis of floating offshore vertical axis wind turbines, Renew. Energ., 185, 1284–1300, 2022. a
Anderson Jr., J. D.: Fundamentals of aerodynamics, Tata McGraw-Hill Education, ISBN 978-007-128908-5, 2010. a
Armstrong, S., Fiedler, A., and Tullis, S.: Flow separation on a high Reynolds number, high solidity vertical axis wind turbine with straight and canted blades and canted blades with fences, Renew. Energ., 41, 13–22, 2012. a
Balduzzi, F., Bianchini, A., Carnevale, E. A., Ferrari, L., and Magnani, S.: Feasibility analysis of a Darrieus vertical-axis wind turbine installation in the rooftop of a building, Appl. Energ., 97, 921–929, 2012. a
Balduzzi, F., Marten, D., Bianchini, A., Drofelnik, J., Ferrari, L., Campobasso, M. S., Pechlivanoglou, G., Nayeri, C. N., Ferrara, G., and Paschereit, C. O.: Three-dimensional aerodynamic analysis of a Darrieus wind turbine blade using computational fluid dynamics and lifting line theory, J. Eng. Gas Turb. Power, 140, 022602, https://doi.org/10.1115/1.4037750, 2018. a
Bangga, G., Dessoky, A., Wu, Z., Rogowski, K., and Hansen, M. O.: Accuracy and consistency of CFD and engineering models for simulating vertical axis wind turbine loads, Energy, 206, 118087, https://doi.org/10.1016/j.energy.2020.118087, 2020. a
Bhutta, M. M. A., Hayat, N., Farooq, A. U., Ali, Z., Jamil, S. R., and Hussain, Z.: Vertical axis wind turbine – A review of various configurations and design techniques, Renew. Sust. Energ. Rev., 16, 1926–1939, 2012. a
Borg, M., Collu, M., and Brennan, F.: Offshore floating vertical axis wind turbines: advantages, disadvantages, and dynamics modelling state of the art, International Conference on Marine and Offshore Renewable Energy 2012 United Kingdom, London, 26–27 September 2012, 26–27, ISBN 9781909024045, 2012. a
Brusca, S., Lanzafame, R., and Messina, M.: Design of a vertical-axis wind turbine: how the aspect ratio affects the turbine's performance, International Journal of Energy and Environmental Engineering, 5, 333–340, 2014. a
Castelli, M. R., De Betta, S., and Benini, E.: Effect of blade number on a straight-bladed vertical-axis Darreius wind turbine, World Academy of Science, Engineering and Technology, 61, 305–3011, 2012. a
Cheng, Z., Madsen, H. A., Gao, Z., and Moan, T.: Aerodynamic modeling of offshore vertical axis wind turbines using the actuator cylinder method, Energy Procedia, 94, 531–543, https://doi.org/10.1016/j.egypro.2016.09.232, 2016. a
De Tavernier, D., Sakib, M., Griffith, T., Pirrung, G., Paulsen, U., Madsen, H., Keijer, W., and Ferreira, C.: Comparison of 3D aerodynamic models for vertical-axis wind turbines: H-rotor and Φ-rotor, J. Phys. Conf. Ser., 1618, 052041, https://doi.org/10.1088/1742-6596/1618/5/052041, 2020. a
Delafin, P.-L., Nishino, T., Wang, L., and Kolios, A.: Effect of the number of blades and solidity on the performance of a vertical axis wind turbine, J. Phys. Conf. Ser., 753, 022033, https://doi.org/10.1088/1742-6596/753/2/022033, 2016. a, b, c
Ennis, B. L.: An Engineering Judgment and Systems Engineering Perspective from Sandia's Floating Offshore VAWT Project, Tech. rep., Sandia National Lab.(SNL-NM), Albuquerque, NM (United States), https://www.osti.gov/servlets/purl/1646053 (last access: 16 March 2022), 2019. a
Ennis, B. L. and Griffith, D. T.: System Levelized Cost of Energy Analysis for Floating Offshore Vertical-Axis Wind Turbines, Tech. rep., Sandia National Lab.(SNL-NM), Albuquerque, NM (United States), https://doi.org/10.2172/1466530, 2018. a
Ferreira, C. S., Madsen, H. A., Barone, M., Roscher, B., Deglaire, P., and Arduin, I.: Comparison of aerodynamic models for vertical axis wind turbines, J. Phys. Conf. Ser., 524, 012125, https://doi.org/10.1088/1742-6596/524/1/012125, 2014. a
Galinos, C., Larsen, T. J., Madsen, H. A., and Paulsen, U. S.: Vertical axis wind turbine design load cases investigation and comparison with horizontal axis wind turbine, Enrgy. Proced., 94, 319–328, 2016. a, b
Gao, J., Griffith, D. T., Sakib, M. S., and Boo, S. Y.: A semi-coupled aero-servo-hydro numerical model for floating vertical axis wind turbines operating on TLPs, Renew. Energ., 181, 692–713, 2022. a, b, c
Gormont, R. E.: A mathematical model of unsteady aerodynamics and radial flow for application to helicopter rotors, Tech. rep., Boeing Vertol Co Philadelphia Pa, https://apps.dtic.mil/sti/citations/AD0767240 (last access: 16 March 2022), 1973. a
Goude, A. and Rossander, M.: Force measurements on a VAWT blade in parked conditions, Energies, 10, 1954, 2017. a
Griffith, D. T., Paquette, J., Barone, M., Goupee, A. J., Fowler, M. J., Bull, D., and Owens, B.: A study of rotor and platform design trade-offs for large-scale floating vertical axis wind turbines, J. Phys. Conf. Ser., 753, 102003, https://doi.org/10.1088/1742-6596/753/10/102003, 2016. a
Griffith, D. T., Barone, M. F., Paquette, J., Owens, B. C., Bull, D. L., Simao-Ferriera, C., Goupee, A., and Fowler, M.: Design Studies for Deep-Water Floating Offshore Vertical Axis Wind Turbines, Tech. rep., Sandia National Lab.(SNL-NM), Albuquerque, NM (United States), https://doi.org/10.2172/1459118, 2018. a, b, c, d
Henderson, A. R. and Patel, M. H.: On the modelling of a floating offshore wind turbine, Wind Energy, 6, 53–86, 2003. a
Hunt, A., Stringer, C., and Polagye, B.: Effect of aspect ratio on cross-flow turbine performance, J. Renew. Sustain. Ener., 12, 054501, https://doi.org/10.1063/5.0016753, 2020. a
Islam, M., Ting, D. S.-K., and Fartaj, A.: Aerodynamic models for Darrieus-type straight-bladed vertical axis wind turbines, Renew. Sust. Energ. Rev., 12, 1087–1109, 2008. a
Islam, M. R., Mekhilef, S., and Saidur, R.: Progress and recent trends of wind energy technology, Renew. Sust. Energ. Rev., 21, 456–468, 2013. a
Jafari, M., Razavi, A., and Mirhosseini, M.: Effect of airfoil profile on aerodynamic performance and economic assessment of H-rotor vertical axis wind turbines, Energy, 165, 792–810, 2018. a
Katz, J. and Plotkin, A.: Low-speed aerodynamics, vol. 13, Cambridge University Press, https://doi.org/10.1017/CBO9780511810329, 2001. a
Kinzel, M., Mulligan, Q., and Dabiri, J. O.: Energy exchange in an array of vertical-axis wind turbines, J. Turbul., 13, N38, https://doi.org/10.1080/14685248.2012.712698, 2012. a
Leishman, J. G. and Beddoes, T.: A Semi-Empirical model for dynamic stall, J. Am. Helicopter Soc., 34, 3–17, 1989. a
Lu, W.: Aerodynamic modelling of vertical axis wind turbine struts: Using the lifting line method CACTUS, Masters Thesis, Delft University Press http://resolver.tudelft.nl/uuid:89411fc9-e31f-44cf-a62c-70268d1af2ad (last access: 16 March 2022), 2020. a
Maeda, T., Kamada, Y., Murata, J., Furukawa, K., and Yamamoto, M.: Effect of number of blades on aerodynamic forces on a straight-bladed Vertical Axis Wind Turbine, Energy, 90, 784–795, 2015. a
Maeda, T., Kamada, Y., Murata, J., Shimizu, K., Ogasawara, T., Nakai, A., and Kasuya, T.: Effect of solidity on aerodynamic forces around straight-bladed vertical axis wind turbine by wind tunnel experiments (depending on number of blades), Renew. Energ., 96, 928–939, 2016. a
Maeda, T., Kamada, Y., Shimizu, K., Ogasawara, T., Nakai, A., and Kasuya, T.: Effect of rotor aspect ratio and solidity on a straight-bladed vertical axis wind turbine in three-dimensional analysis by the panel method, Energy, 121, 1–9, 2017. a, b
Michelen, C., Neary, V. S., Murray, J., and Barone, M. F.: Cactus Open Source Code for Hydrokinetic Turbine Design and Analysis: Model Performance Evaluation and Public Dissemination as Open Source Design Tool, Tech. rep., Sandia National Lab.(SNL-NM), Albuquerque, NM (United States), https://www.osti.gov/servlets/purl/1142941 (last access: 16 March 2022), 2014. a
Miller, M. A., Duvvuri, S., Brownstein, I., Lee, M., Dabiri, J. O., and Hultmark, M.: Vertical-axis wind turbine experiments at full dynamic similarity, J. Fluid Mech., 844, 707–720, 2018. a, b
Molina, A. C., De Troyer, T., Massai, T., Vergaerde, A., Runacres, M. C., and Bartoli, G.: Effect of turbulence on the performance of VAWTs: An experimental study in two different wind tunnels, J. Wind Eng. Ind. Aerod., 193, 103969, https://doi.org/10.1016/j.jweia.2019.103969, 2019. a
Möllerström, E., Ottermo, F., Hylander, J., and Bernhoff, H.: Noise emission of a 200 kW vertical axis wind turbine, Energies, 9, 19, 2016. a
Möllerström, E., Gipe, P., Beurskens, J., and Ottermo, F.: A historical review of vertical axis wind turbines rated 100 kW and above, Renew. Sust. Energ. Rev., 105, 1–13, 2019. a
Murray, J. and Barone, M.: The development of cactus, a wind and marine turbine performance simulation code, in: 49th AIAA Aerospace Sciences Meeting including the New Horizons Forum and Aerospace Exposition, Orlando, Florida, 4–7 January 2011, 147, https://doi.org/10.2514/6.2011-147 2011. a, b, c
Ottermo, F., Eriksson, S., and Bernhoff, H.: Parking strategies for vertical axis wind turbines, International Scholarly Research Notices, Hindawi, https://doi.org/10.5402/2012/904269, 2012. a, b, c, d
Paraschivoiu, I.: Wind turbine design: with emphasis on Darrieus concept, Presses inter Polytechnique, ISBN 9782553009310, 2002. a
Paulsen, U. S., Vita, L., Madsen, H. A., Hattel, J., Ritchie, E., Leban, K. M., Berthelsen, P. A., and Carstensen, S.: 1st DeepWind 5 MW baseline design, Enrgy. Proced., 24, 27–35, 2012. a
Paulsen, U. S., Madsen, H. A., Hattel, J. H., Baran, I., and Nielsen, P. H.: Design optimization of a 5 MW floating offshore vertical-axis wind turbine, Enrgy. Proced., 35, 22–32, 2013. a, b
Rezaeiha, A., Montazeri, H., and Blocken, B.: Towards optimal aerodynamic design of vertical axis wind turbines: Impact of solidity and number of blades, Energy, 165, 1129–1148, 2018. a, b
Sakib, M. S., Chetan, M., and Griffith, D. T.: Aero-Structural Design For a 3.4 MW Wind Turbine Using Plasma Actuator Based Load Control, in: AIAA Aviation 2020 Forum, 3148, 15–19 June 2020, https://doi.org/10.2514/6.2020-3148, 2020. a
Shelley, S., Boo, S. Y., Kim, D., and Luyties, W. H.: Comparing Levelized Cost of Energy for a 200 MW Floating Wind Farm using Vertical and Horizontal Axis Turbines in the Northeast USA, in: Offshore Technology Conference, Offshore Technology Conference, Houston, Texas, USA, 30 April–3 May 2018, https://doi.org/10.4043/28700-MS, 2018. a
Simão Ferreira, C.: The near wake of the VAWT: 2D and 3D views of the VAWT aerodynamics, Delft University Press, http://resolver.tudelft.nl/uuid:ff6eaf63-ac57-492e-a680-c7a50cf5c1cf (last access: 16 March 2022), 2009. a
Sirnivas, S., Musial, W., Bailey, B., and Filippelli, M.: Assessment of offshore wind system design, safety, and operation standards, Tech. rep., National Renewable Energy Lab.(NREL), Golden, CO (United States), https://doi.org/10.2172/1122306, 2014. a
SNL-WaterPower: CACTUS, Github [code], https://github.com/SNL-WaterPower/CACTUS, last access: 16 March 2022. a
Strickland, J. H., Webster, B., and Nguyen, T.: A vortex model of the Darrieus turbine: an analytical and experimental study, J. Fluids Eng., 101, 500–505, https://doi.org/10.1115/1.3449018, 1979. a
Sutherland, H. J., Berg, D. E., and Ashwill, T. D.: A retrospective of VAWT technology, Sandia National Laboratories, https://energy.sandia.gov/wp-content/gallery/uploads/SAND2012-0304.pdf (last access: 16 March 2022), 2012. a
Tjiu, W., Marnoto, T., Mat, S., Ruslan, M. H., and Sopian, K.: Darrieus vertical axis wind turbine for power generation II: Challenges in HAWT and the opportunity of multi-megawatt Darrieus VAWT development, Renew. Energ., 75, 560–571, 2015. a
Wosnik, M., Bachant, P., Neary, V. S., and Murphy, A. W.: Evaluation of Design and Analysis Code, CACTUS, for Predicting Cross-Flow Hydrokinetic Turbine Performance, Sandia Report SAND2016-9787, https://doi.org/10.2172/1431494, 2016. a