the Creative Commons Attribution 4.0 License.
the Creative Commons Attribution 4.0 License.
 | 03 May 2022
Experimental investigation of mini Gurney flaps in combination with vortex generators for improved wind turbine blade performance
Jörg Alber
Marinos Manolesos
Guido Weinzierl-Dlugosch
Johannes Fischer
Alexander Schönmeier
Christian Navid Nayeri
Christian Oliver Paschereit
Joachim Twele
Jens Fortmann
Pier Francesco Melani
Alessandro Bianchini
This wind tunnel study investigates the aerodynamic effects of mini Gurney flaps (MGFs) and their combination with vortex generators (VGs) on the performance of airfoils and wind turbine rotor blades. VGs are installed on the suction side aiming at stall delay and increased maximum lift. MGFs are thin angle profiles that are attached at the trailing edge in order to increase lift at pre-stall operation. The implementation of both these passive flow control devices is accompanied by a certain drag penalty. The wind tunnel tests are conducted at the Hermann-Föttinger Institut of the Technische Universität Berlin based on two airfoils that are characteristic of different sections of large rotor blades. Lift and drag are determined using a force balance and a wake rake, respectively, for static angles of attack between −5 and 17∘ at a Reynolds number of 1.5 million. The impact of different MGF heights including 0.25 %, 0.5 % and 1.0 % and a VG height of 1.1 % of the chord length is tested and evaluated. Furthermore, the clean and the tripped baseline cases are considered. In the latter, leading-edge transition is forced with Zig Zag (ZZ) turbulator tape. The preferred configurations are the smallest MGF on the NACA63(3)618 and the medium-sized MGF combined with VGs on the DU97W300. Next, the experimental lift and drag polar data are imported into the software QBlade in order to design a generic rotor blade. The blade performance is simulated with and without the add-ons by means of two case studies. In the first case, the retrofit application on an existing blade mitigates the adverse effects of the ZZ tape. Stall is delayed and the aerodynamic efficiency is partly recovered leading to an improvement of the power curve. In the second case, the new design application allows for the design of a more slender blade while maintaining the rotor power. This alternative blade appears to be more resistant against the adverse effects of forced leading-edge transition.
- Article
(7850 KB) - Full-text XML
- BibTeX
- EndNote


1.1 General outline
This report is divided into the following sections.
-
Introduction. The concepts, mechanisms and applications of Gurney flaps (GFs), Zig Zag (ZZ) tape and VGs are introduced. The literature review is focused on very small GF heights, so-called mini Gurney flaps (MGFs), and their combination with VGs.
-
Airfoil simulations. The simulation software XFOIL (Drela, 1989) is used to determine the appropriate size of each passive flow control (PFC) device in relation to the local boundary layer thickness of the NACA63(3)618 (tip region) and the DU97W300 (root region).
-
Experimental setup. The wind tunnel test section, the measurement methods and the data reduction process are specified including the force balance for the lift, and the wake rake for the drag measurements at a constant Reynolds number of .
-
Experimental results. The lift and drag polars, cl(α) and cd(α), are presented. Different combinations of MGFs and VGs are evaluated according to characteristic parameters, i.e., the lift performance, the stall behavior and the aerodynamic efficiency.
-
Rotor blade performance. The experimental data are imported into the software QBlade (Marten, 2020) in order to create a generic rotor blade. The blade performance is simulated by means of two case studies, the retrofit application on an existing rotor blade and the new design application on an alternative rotor blade.
1.2 Gurney flaps
This aerodynamic device is named after the US race-car driver Dan Gurney. In the early 1970s, he applied it to the rear spoilers achieving significant improvements in the downforce and thus the traction of his Formula One vehicles, see Liebeck (1978). Passive GFs are categorized as static miniflaps or miniature trailing-edge devices (MiniTEDs), as described by González-Salcedo et al. (2020). They are different from the concept of flexible trailing-edge (TE) flaps that are integrated into the very TE section (see Barlas and van Kuik, 2010). The first reference to miniflaps dates back to the early 20th century and was probably developed by Gruschwitz and Schrenk (1933). Zaparka (1935) registered the first patent on active miniflaps for use on airplane wings. Various patents of passive miniflaps followed, particularly in aviation. Boyd (1985) and later am Brink (2002) claimed the rights on different versions of wedge-shaped TE flaps. Henne and Gregg (1989) patented the shape of a diverging trailing edge (DTE) of a transonic airfoil generating similar aerodynamic effects as the GF. Bechert et al. (2001) registered a patent on so-called three-dimensional (3D) GFs, i.e., profiles with slits, serrations, holes, as well as tiny vortex generators attached to the miniflap itself to stabilize the unsteady wake field. Wang et al. (2008) published a comprehensive review of GFs for use on rotor blades of helicopters and wind turbines. In contrast to the large number of patents and publications, there are only few examples of standardized or commercialized GF applications on rotor blades of horizontal-axis wind turbines (HAWTs). For instance, Vestas (2019) offers GFs in combination with VGs as aerodynamic upgrades of operating wind turbines predicting the average energy production (AEP) to increase by 1.7 %. Another example is the blade design of the 10 MW reference wind turbine of the Danish Technical University (DTU) with a total rotor radius of R=89.2 m. The inner blade part alongside the local rotor radius of 5 % 40 % R was equipped with wedge-shaped GFs including heights of 3.5 %, 2.5 % and 1.3 %, respectively, in relation to the local chord length, c. Bak et al. (2013) claim significant improvements in aerodynamic performance, especially on relatively thick airfoils with a maximum thickness greater than 30 % c.
Figure 1a displays the typical GF shapes, i.e., the rectangular, or L-shaped, and the triangular, or wedge-shaped, profiles. Typically, they are installed at the TE and normal to the pressure side of wings and rotor blades. In both cases, the effective GF height, hGF, is expressed in % c, without taking the original TE thickness into account. For identical hGF, the aerodynamic effect of both GF profiles is considered to be very similar, as discussed in Appendix B2. It is noted that GFs are also used at a certain distance from the TE. These mini tabs (see Bach et al., 2014), are out of the scope of this study.
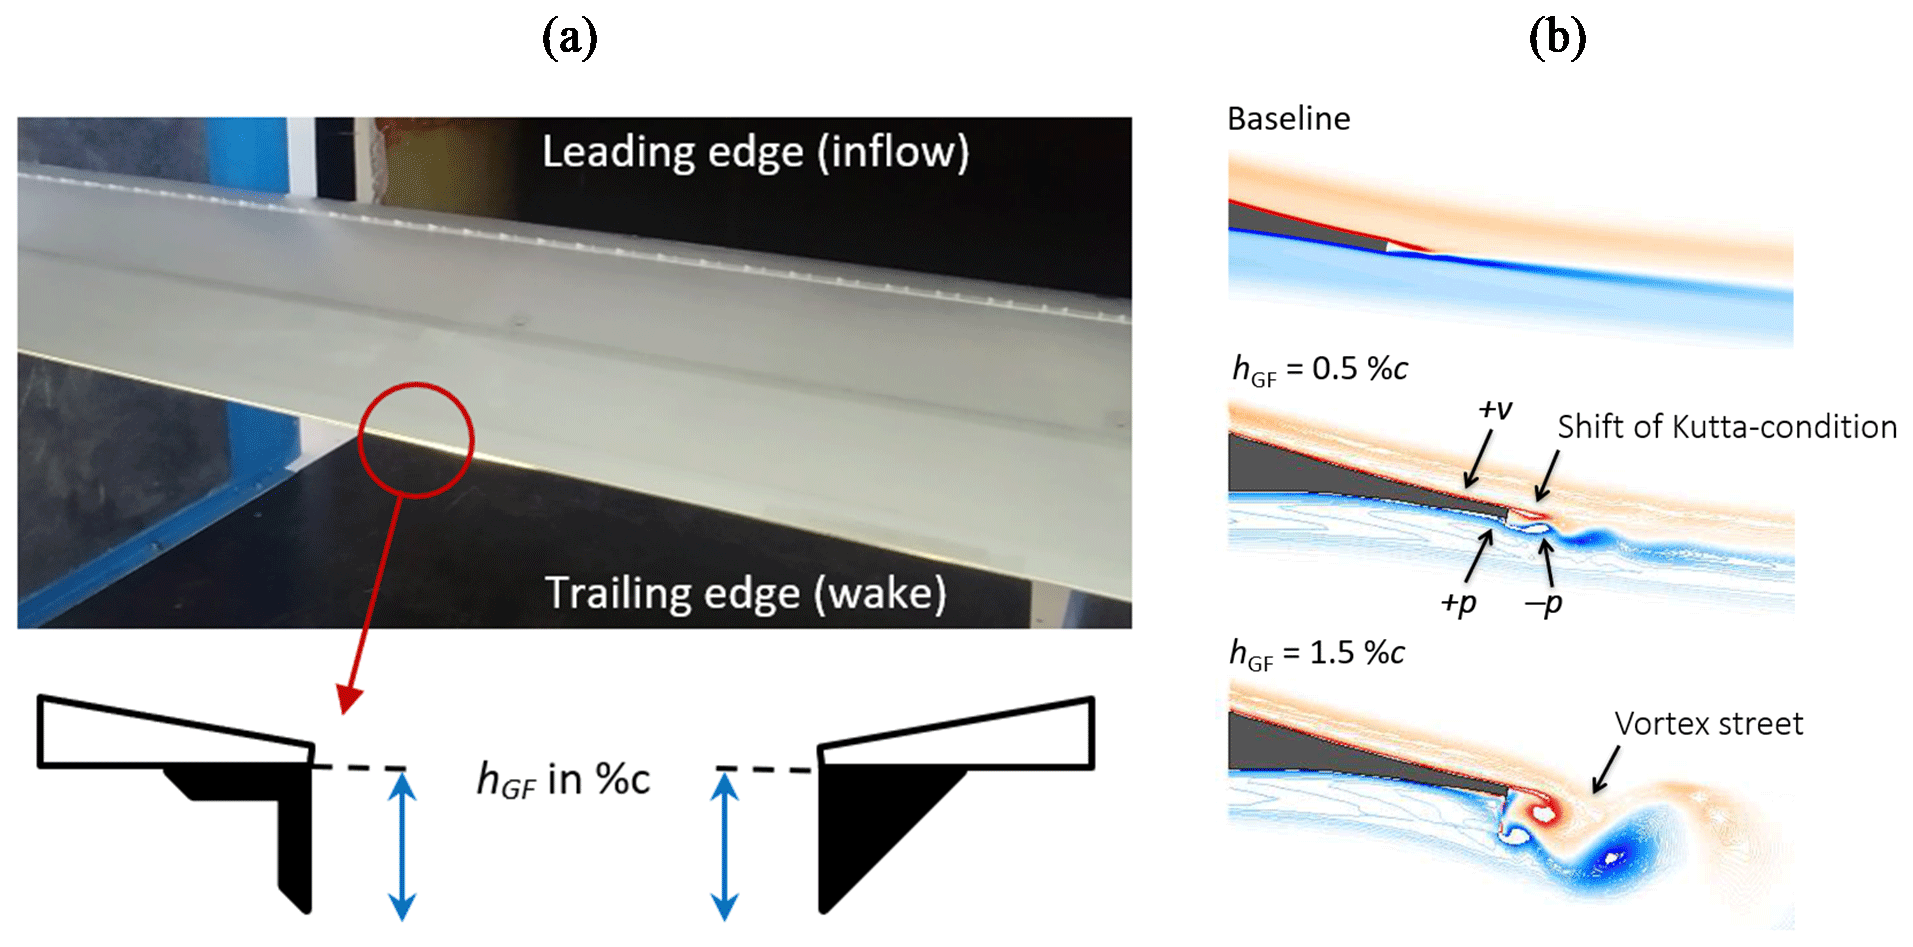
Figure 1(a) NACA63(3)618 during wind tunnel tests. Vortex generator array and Gurney flap. Definition of Gurney flap height of rectangular and triangular profiles in side view. (b) CFD simulations of the HQ17. Wake structures at α=0∘ and for different Gurney flap heights (reproduced and modified from Schatz et al. 2004a).
Figure 1b illustrates the principal changes of the flow field for two different GF heights, as first reported by Liebeck (1978). Adjacent to the TE modification, a highly efficient vortex system is formed consisting of one vortex upstream and two counter-rotating vortices immediately downstream. Bechert et al. (2000) and Schatz et al. (2004b) showed by means of experimental and numerical investigations that the wake structures are quasi two-dimensional (2D) at pre-stall operation. The recirculation region changes the Kutta condition, so that the rear stagnation point is shifted downstream and deflected downward; see also Jeffrey et al. (2000) and Cole et al. (2013). The modifications of the flow field lead to the following set of simultaneous effects.
Lift performance. The suction peak is higher and coupled with a positive pressure built up right in front of the GF, as such increasing the pressure difference between the suction and the pressure side. As a result, the effective camber is enhanced, so that the same lift coefficient, cl, is already reached at a lower angle of attack (AoA), α. Furthermore, the adverse pressure gradient on the suction side becomes milder generating a higher maximum lift coefficient, cl,max.
Drag behavior. The recirculation or low-pressure region in the immediate wake leads to an increased momentum loss and thus higher drag coefficient, cd(α). In addition, the intensity of the wake unsteadiness is stronger, especially if vortex shedding is initiated in the form of an absolute instability, as illustrated for hGF=1.5 % c in Fig. 1b.
Overall, the impact of GFs is quantifiable as an increase in both lift and drag. Bechert et al. (2000) and later Schatz et al. (2004b) showed that the drag increase is related to both the intensity and the frequency of the wake unsteadiness. As a consequence, the drag penalty was less severe for small GF heights comparing hGF=0.5 % c to 1.5 % c (see Fig. 1b).
1.3 Zig Zag tape
ZZ turbulator tape is implemented to initiate the boundary layer (BL) transition at a fixed chord position (see Fig. 3a). Its height, hZZ, should be smaller than the local BL thickness in order to trigger transition while avoiding a disproportionate drag increase or even turbulent separation. Next to trip wire or carborundum paper, ZZ tape facilitates the comparability between different measurement methods. Moreover, it is applied to evaluate the sensitivity of airfoils to the adverse effects of leading-edge roughness (LER), as discussed by van Rooij and Timmer (2003), Timmer and Schaffarczyk (2004) and in greater detail by Wilcox et al. (2017). Another example is Oerlemans et al. (2009), who implemented ZZ tape on the rotor blades of a commercial multi-MW wind turbine. In fact, LER due to erosion and the accumulation of sediments are major challenges for rotor blade manufacturers and wind turbine operators (see Fig. 2b). Over time, LER is practically inevitable. According to Maniaci et al. (2020), it mainly affects the mid to tip region, where the rotor blade is exposed to the highest relative velocities. Depending on the degree of roughness, the AEP decrease of multi-MW HAWTs is between 2 % and 5 %.
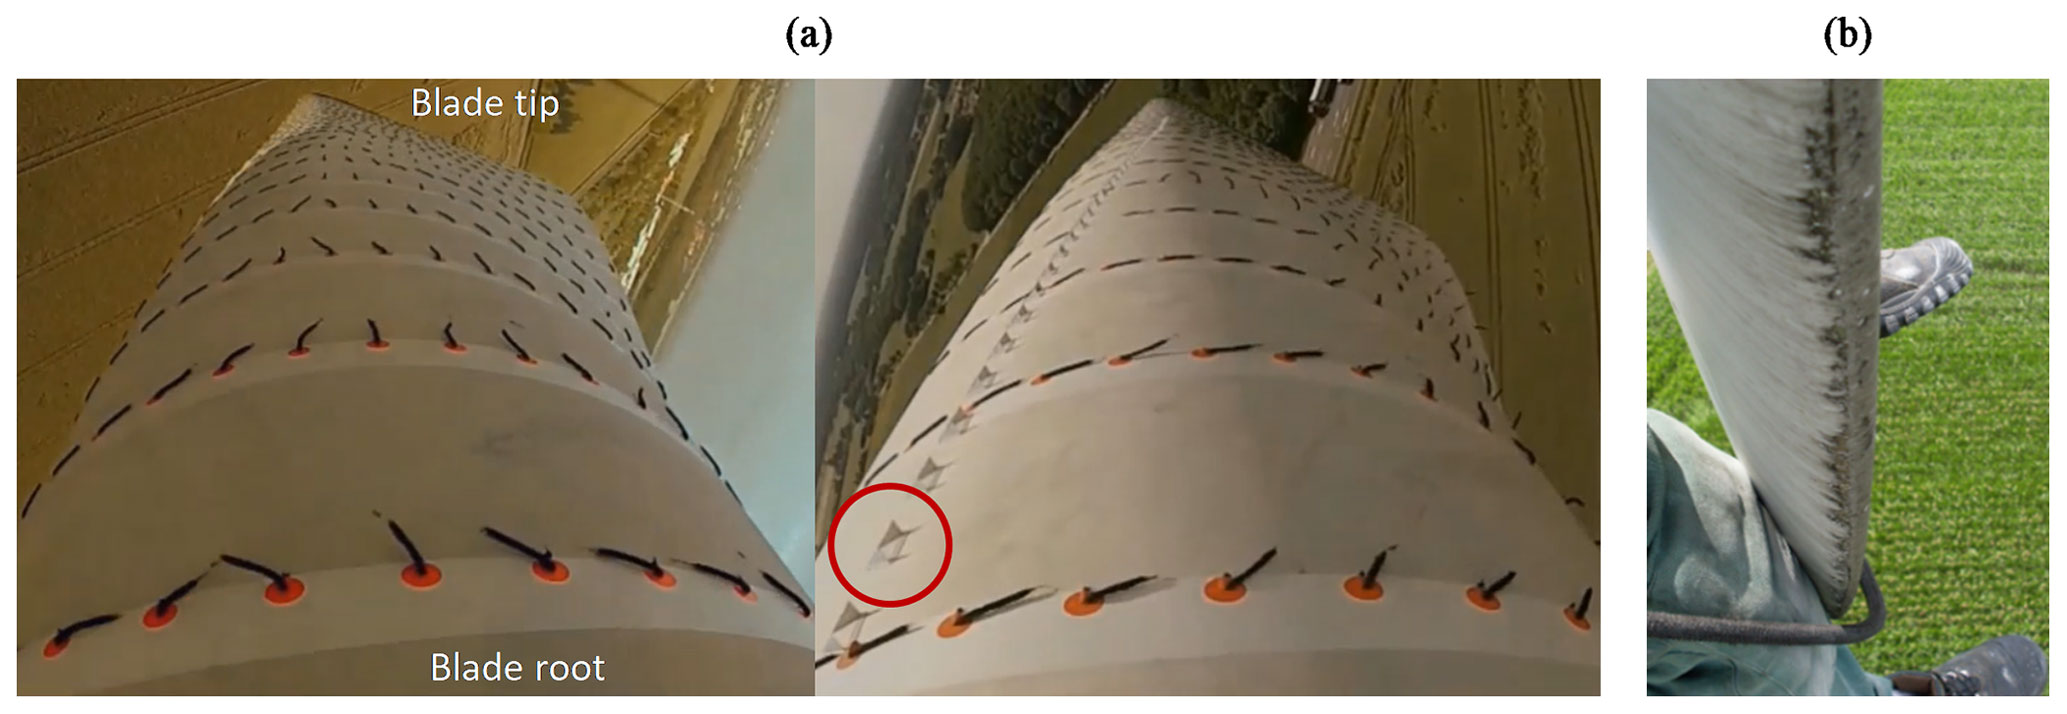
Figure 2Utility scale wind turbines. (a) Simultaneous flow tuft measurements (baseline versus VG configuration) on the same rotor (with permission from SMART BLADE GmbH). (b) Leading-edge erosion at the blade tip (with permission from Seilpartner GmbH).
1.4 Vortex generators
As opposed to GFs, VGs have been commercialized by various wind energy companies for almost two decades. Usually, the suboptimal or declining AEP motivates blade manufacturers and wind park operators to investigate possible causes, such as early separation or LER. One possible solution is the installation of VGs to alleviate the flow separation in the root to mid region of rotor blades. More recent studies have also investigated the potential of relatively small VG sizes toward the tip region (see Bak et al., 2018). Typically, VGs are commercialized as retrofit solutions, i.e., add-ons that are installed on the surface of already running rotor blades, as depicted in Fig. 2a. In this way, SMART BLADE (2021) predict an AEP growth of approximately 2 %. A more detailed review of VGs for use on rotor blades is provided by Bak et al. (2016) and González-Salcedo et al. (2020).
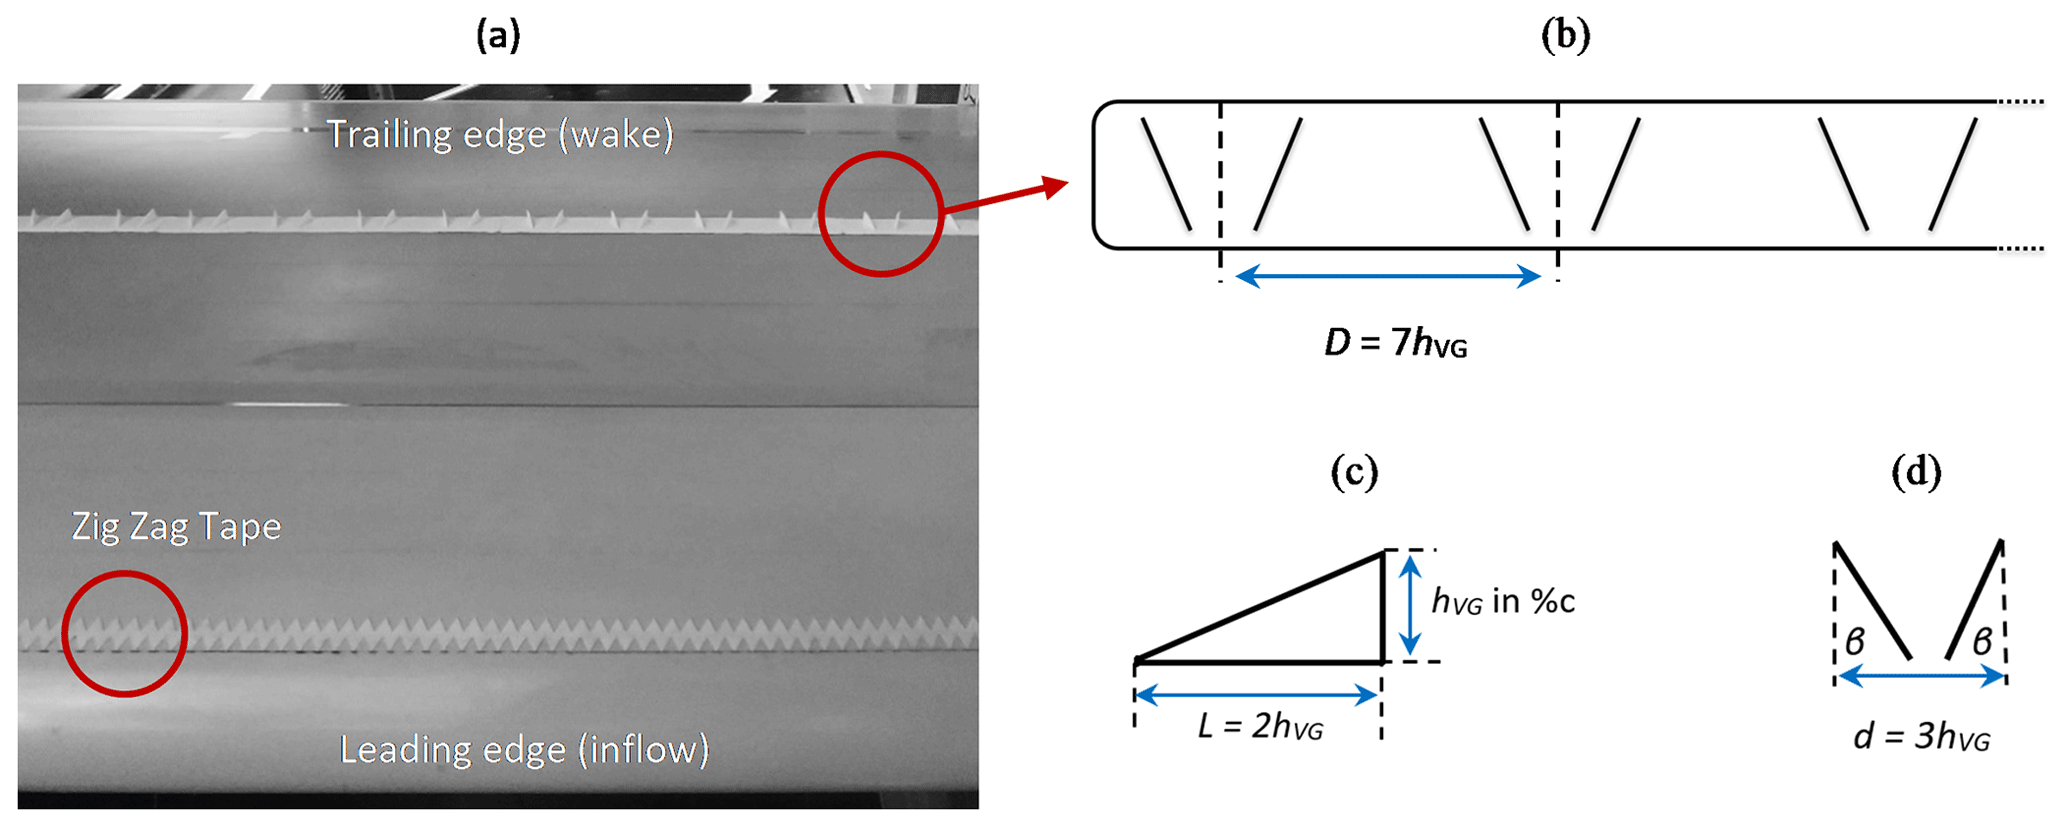
Figure 3NACA63(3)618 during wind tunnel tests. (a) Top view on suction side with ZZ tape and VG array. (b) VG panel including spacing between VGs (with permission from SMART BLADE GmbH). (c) Side view of single vane. (d) Top view of single VG.
The purpose of VGs is to delay the BL stagnation and thus separation (see Fig. 2a). As such, the flow tufts are attached to the blade surface, as compared to the stalling baseline blade. The thin vanes shed a pair of vortices transporting momentum from the more energetic flow into the viscous layers close to the surface. The vortex system spreads out toward the TE, where it is released into the wake. More detailed research on the mechanism of VGs is provided by Manolesos and Voutsinas (2015). Overall, the VG effect is quantifiable as a substantial increase in both maximum lift and the AoA where stall is initiated, . At the same time, drag is increased significantly at low and moderate AoA. The impact on the aerodynamic efficiency, , depends on the design parameters that are summarized in Fig. 3.
Figure 3a and b depict an array of VG panels, as installed on the suction side of the airfoil model. Following Baldacchino et al. (2018), the design parameters generate a counter-rotating, common downflow VG system. The spacing between the center points of two VGs is defined as D=7hVG (see Fig. 3b). Figure 3c shows that each VG consists of a delta-shaped pair of vanes with a length, L=2hVG, and the VG height, hVG, given in % c. According to Fig. 3d, the distance between the two vanes, d=3hVG, results in ∘.
1.5 Combining vortex generators and Gurney flaps
Despite the large body of literature on each device, the simultaneous use of GFs and VGs is less deeply researched. Storms and Jang (1994) investigated one such configuration in the NASA Ames Research Center using a NACA4412 profile. Stall was delayed by around 5∘ and cl,max was increased by 36 % improving at elevated AoA. However, at low and moderate AoA, the combined drag penalty led to decreased aerodynamic efficiency. Fuglsang et al. (2003) conducted experiments in the VELUX wind tunnel of the DTU based on the Risø-B1-24. To the authors' knowledge, this is the only experimental study applying VGs and GFs on a dedicated wind turbine airfoil. Stall was delayed by approximately 3∘, coupled with an increase in cl,max of 34 %. Similar results were achieved installing ZZ tape on the suction side. Following from this, Fuglsang et al. (2004) concluded that, despite the small decrease, the combination of both devices “(…) could provide an attractive choice for the root part of a wind turbine blade where reduction of solidity is a key issue to reduce blade costs.” In a more recent study, Li-shu et al. (2013) performed wind tunnel tests on a WA251A airfoil at the Northwestern Polytechnical University of Xi'an. Maximum lift was increased by 18.6 % delaying stall by approximately 2∘. The authors report “remarkable improvements” implementing both PFC devices simultaneously. For clarity, the design parameters of the aforementioned references are summarized in Table 1.
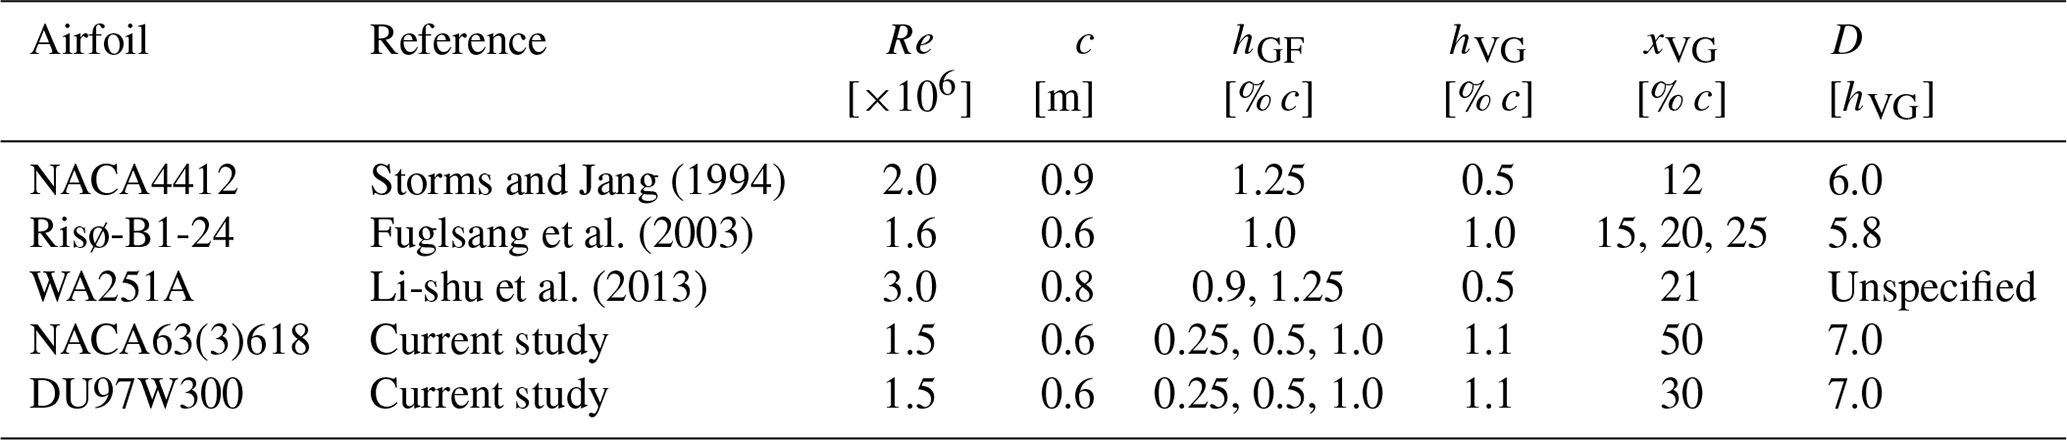
The literature review shows that GFs, ZZ tape and VGs are well-studied PFC devices. However, to the authors' knowledge, there are no scientific reports investigating MGF heights smaller than 0.5 % c and their combination with VGs for use on dedicated wind turbine airfoils. The current study aims at closing these research gaps.
In preparation for the wind tunnel tests, the simulation software XFOIL is used to determine the appropriate size of each PFC device in relation to the local boundary layer thickness of the corresponding airfoil.
2.1 Airfoils
Figure 4a displays the two airfoils that are tested during the wind tunnel experiments, the NACA63(3)618 and the DU97W300. They are applied at different sections of large rotor blades (see Fig. 4b). The main specifications are summarized in Table 2.
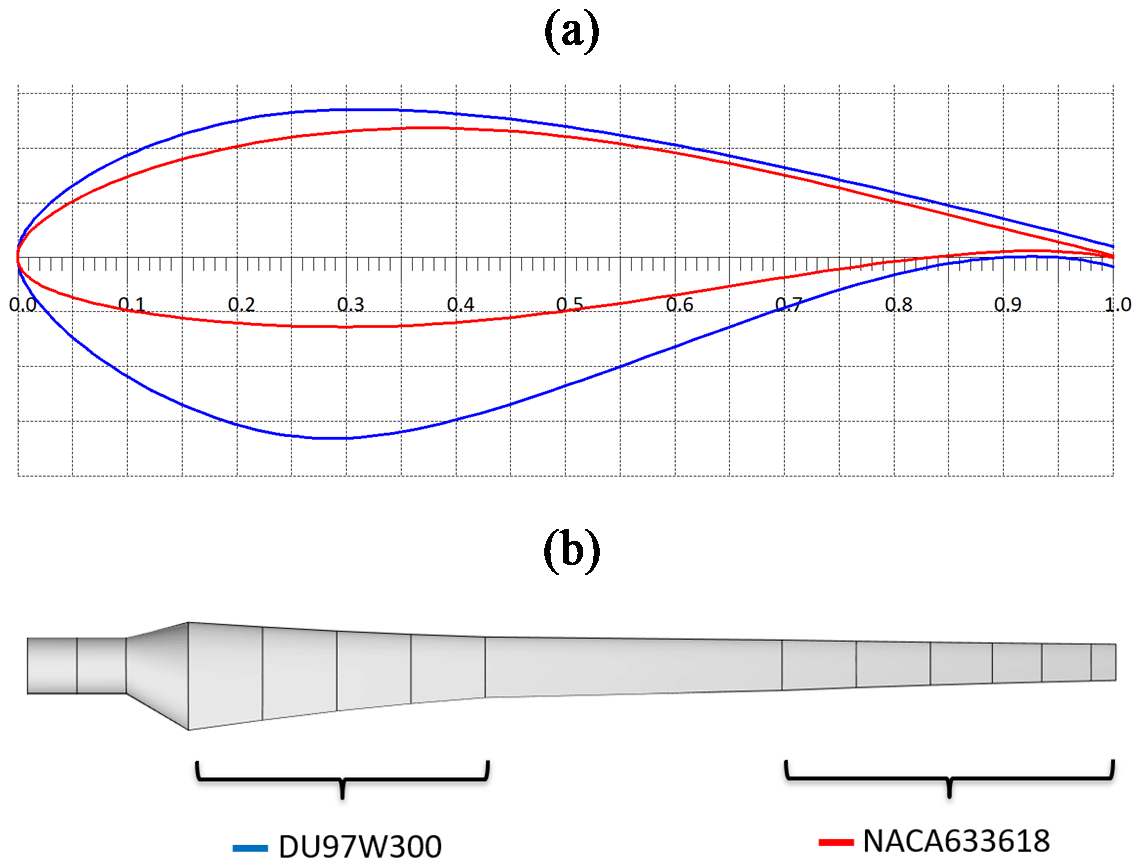
Figure 4NACA63(3)618 and DU97W300. (a) Airfoil coordinates normalized by the chord length. (b) Airfoil position on a generic rotor blade.
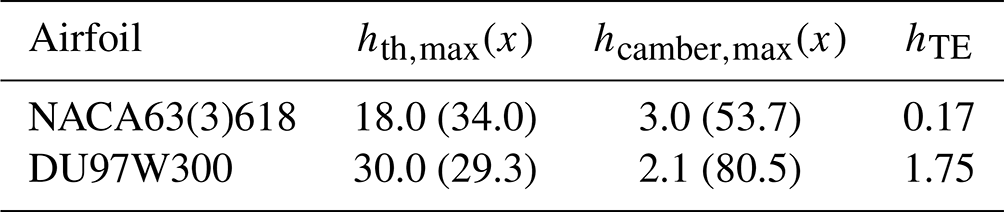
Table 2Maximum thickness, maximum camber and trailing-edge thickness. Chord position in brackets. All values in % c.
The NACA63(3)618 is part of the six-digit wing sections developed by the National Advisory Committee for Aeronautics (NACA) for use on high-speed aircrafts (see Abbott and von Doenhoff, 1959). The NACA 63 and 64 families are still popular for the design of large rotor blades (see Timmer, 2009). The DU97W300 was designed by Delft University (DU) as a dedicated wind turbine airfoil (see Timmer and van Rooij, 2003).
2.2 XFOIL simulations
The 2D airfoil performance is simulated with the panel code XFOIL. The freely available and widely recognized software is based on a viscid–inviscid interaction scheme, which was validated, for instance, by Timmer and Schaffarczyk (2004). Apart from the airfoil coordinates, including the finite TE thickness, the software requires the chord-based Reynolds number and the AoA range as input parameters, here and . The location of the free BL transition is modeled by means of the eN method. The amplification factor, or N criterion, describes the level of both the surface roughness and the inflow turbulence intensity. The default value, N=9, refers to clean conditions, i.e., assuming a completely smooth surface and laminar inflow conditions that are found in low-turbulence wind tunnels. In this study, N=5 is chosen to account for the measured turbulence intensity of the current wind tunnel facility. In the so-called tripped case, the transition location is fixed at a static chordwise position, xZZ, on both the suction and the pressure side.
The appropriate height of each PFC device is determined in relation to the local BL thickness, δ, which is defined as the normal distance between the solid surface and the first streamline reaching 99 % of the axial free-flow velocity. XFOIL calculates the BL displacement thickness, δ*, describing the distance by which the free-flowing streamlines are displaced from the solid surface due to the existence of the BL. According to Schlichting and Gersten (2000), the laminar BL thickness on a flat plate at zero incidence is approximately three times the BL displacement thickness,
Equation (1) is also valid for thin airfoil shapes. According to Baldacchino et al. (2018), the turbulent BL thickness is related to δ* and the momentum thickness θ,
2.3 Zig Zag tape
The baseline configurations include both the free and the forced BL transition. In the tripped case, ZZ tape is applied alongside the complete airfoil span on both the suction side (SuS) at xZZ=5 % c and at the pressure side (PS) at xZZ=10 % c, as illustrated in Fig. 3a. The ZZ tape height is selected in relation to the laminar BL thickness (see Eq. 1), the corresponding chord positions, xZZ, and the design AoA, ,
Based on Table 3 and Eq. (3), the NACA63(3)618 is equipped with hZZ=0.4 mm and the DU97W300 with hZZ=0.3 mm. As such, the ZZ tape penetrates the upper layers of the BL without increasing drag excessively. The width of the turbulator tape is 12 mm and the angle between its serrations is 60∘. These characteristics are in close agreement with comparable wind tunnel tests at the DU and the DTU; see Timmer and van Rooij (2003) and Fuglsang et al. (2004).
Table 3XFOIL simulations of the boundary layer thickness according to Eq. (1).

2.4 Mini Gurney flaps
Giguère et al. (1995), Kentfield (1996) and Bechert et al. (2000) postulated that the GF needed to be covered by the local BL in order to avoid an excessive drag, in relation to the lift increase. Following from this, Alber et al. (2017) evaluated wind tunnel data of nine different DU and NACA airfoils at . It was concluded that could only be maintained or improved using very small GFs in the range of 0.2 % c ≤ hGF ≤ 0.5 % c, i.e., GFs that were submerged deeply into the local BL. However, the BL thickness depends on the interaction of multiple factors, such as the Reynolds number, the AoA and the transition location. Hence, the definition of an MGF hereby refers to a height of between 1 and 2 times the local BL displacement thickness at the design AoA,
Within the range given by Eq. (4), the MGF effect on the airfoil performance is assumed to be beneficial throughout the pre-stall region, as further investigated by means of the wind tunnel measurements (see Sect. 4). Moreover, combining Eqs. (2) and (4), an appropriate MGF height may also be estimated as approximately one quarter of the turbulent BL thickness,
Table 4 shows that hMGF is case dependent on the airfoil itself and on whether transition is free or fixed. In the latter case, δ* is increased significantly due to the early expansion of the turbulent BL. For the purpose of the current wind tunnel tests, the following flap heights are installed: 0.25 % c, 0.5 % c and 1 % c, as such covering both the clean and the tripped cases. Even though it is not considered a MGF as per Eq. (4), hGF=1 % c is included as a common literature reference. Unless specified otherwise, the GFs consist of rectangular, i.e., equilateral, angle profiles made of brass.
Table 4XFOIL simulations of the boundary layer displacement thickness and the resulting MGF heights according to Eq. (4).

2.5 Vortex generators
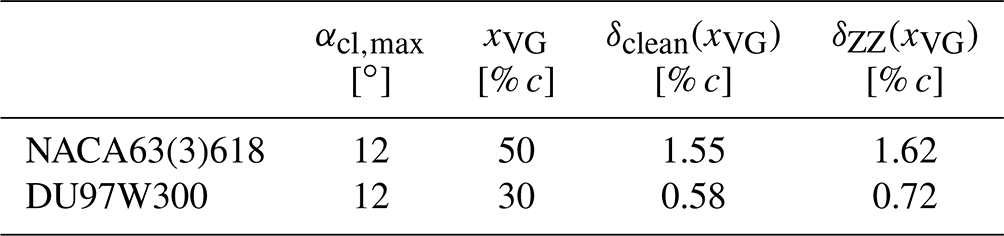
The chord position of the VG array, xVG, is located upstream of the mean separation line to delay stall, x(αcl,max), and downstream of the BL transition location to limit drag at pre-stall operation, x(αopt). The VG height is determined as a function, f, of the turbulent BL thickness at maximum lift,
It is noted that XFOIL simulations are of low order, especially for AoA close to stall. Nonetheless, the estimation of the BL thickness is considered to be sufficiently accurate for the purpose of the current VG design.
Table 5 shows that δ(xVG) is similar in both the clean and the tripped cases at maximum lift, i.e., as stall is initiated. Based on Eq. (6), the VG height, hVG=1.1 % c is selected. In the case of the DU97W300, resembles a standard VG array in the root to mid region of a rotor blade. Regarding the NACA63(3)618, a sub-boundary layer VG configuration is investigated using , as discussed by Lin (2002) and Bak et al. (2018). In the mid to tip blade region, the objective is to reduce drag and to maintain on a high level.
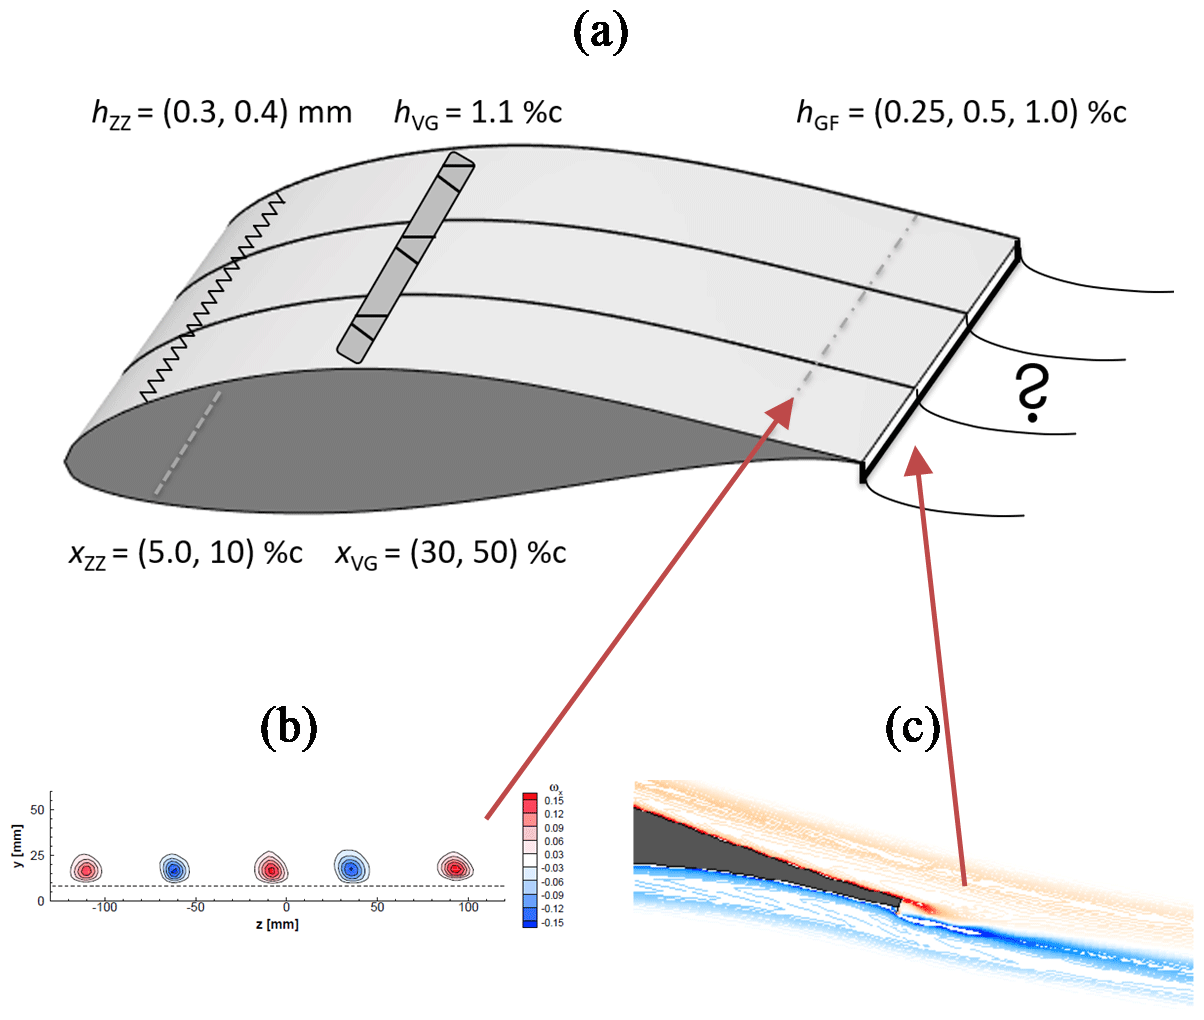
Figure 5(a) Height and location of passive flow control devices. (b) Particle image velocimetry (PIV) measurements of VG vortices on the NACA63(3)618 in spanwise view (hVG=1.7 % c at xPIV=80 % c and ) (reproduced from Mueller-Vahl et al., 2012). (c) CFD simulations of a MGF on the HQ17 in side view (hGF=0.5 % c at α=4∘ and ) (reproduced from Schatz et al., 2004a).
Table 5XFOIL simulations of the boundary layer thickness according to Eq. (2).
2.6 Summary
Figure 5a displays both the height and the chordwise location of each PFC device investigated in this section. According to previous research efforts at the TU Berlin, Fig. 5b and c depict the vorticity caused by either VGs or MGFs. The wake interaction of the flow control mechanisms and its effects on the lift and drag performance are presented as part of the wind tunnel tests in Sect. 4.
The wind tunnel test section, the measurement methods and the data reduction process are specified including the force balance for the lift and the wake rake for the drag measurements at a Reynolds number of .
3.1 Test section
The experiments are conducted in the large closed-loop wind tunnel of the HFI at the TU Berlin. The airfoil test section is 2 m in width and 1.44 m in height. It consists of a 2.5 m long removable structure that is attached to the duct outlet (see Fig. 6a). The contraction ratio is 6.25:1 and the complete length of the test section is 5 m. It was designed, constructed and integrated into the wind tunnel by Meyer (2000).
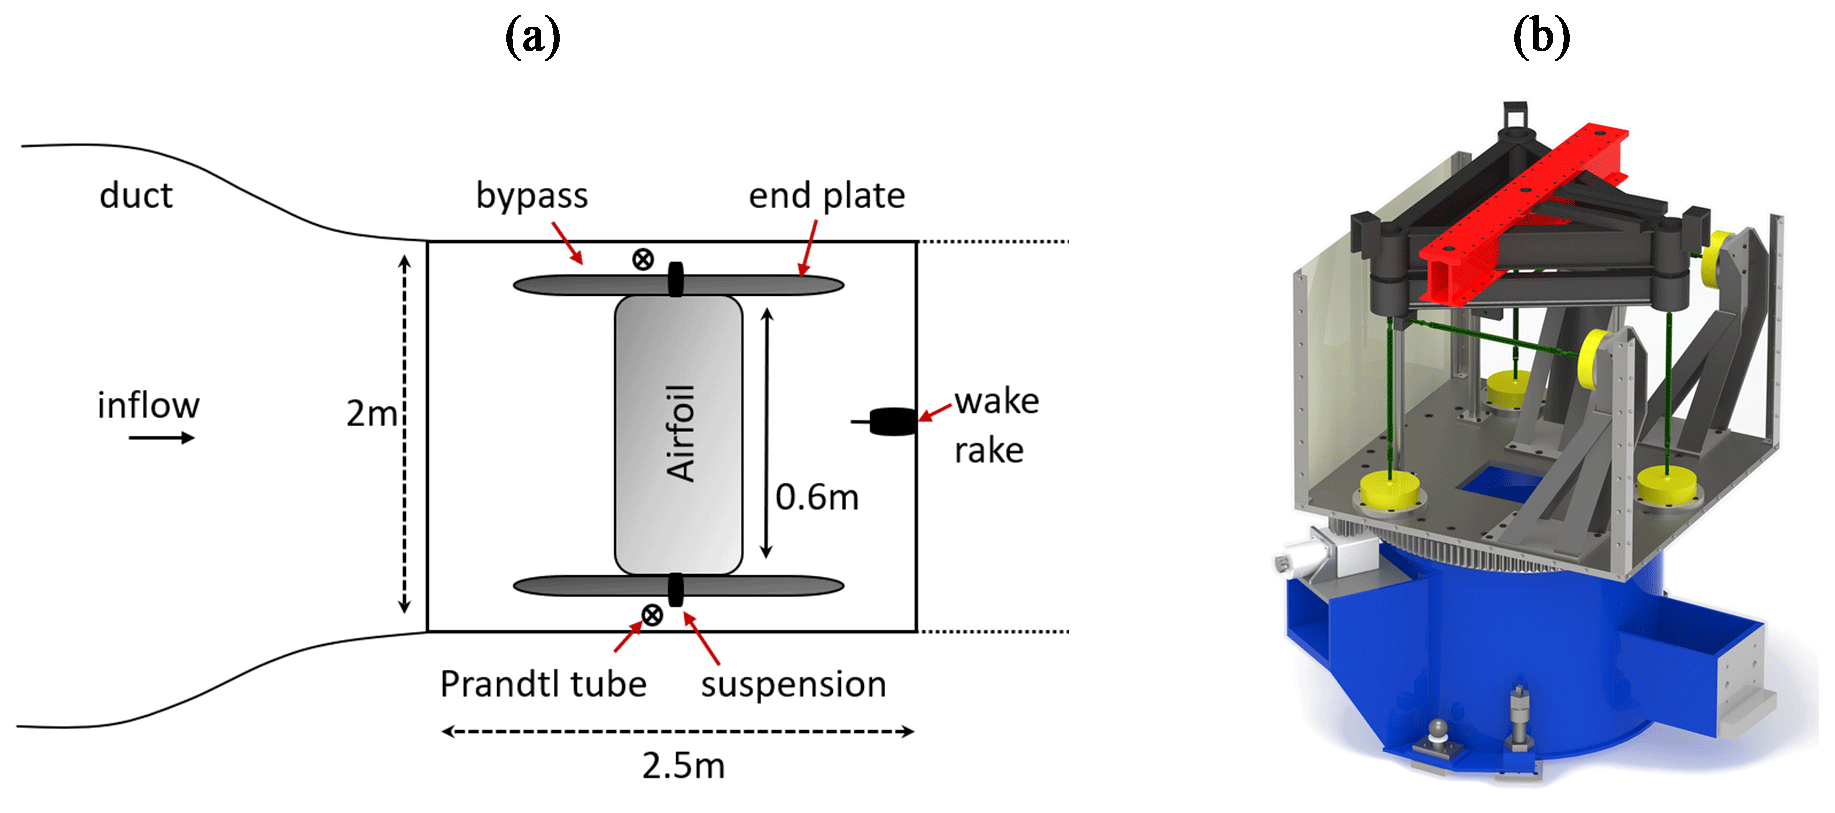
Figure 6(a) Airfoil test section in top view. (b) Force balance underneath the test section in side view; load cells in yellow, support for attaching the frame of the wing model in red.
The inlet and the outlet of the duct walls are equipped with a ring line of pressure taps. The inflow velocity is determined from the contraction ratio and the static pressure difference. The airfoil model, or wing, is positioned in the center of the test section, as displayed in Fig. 6a. It is enclosed by two 1.5 m long end plates that are parallel to the tunnel, as such reducing the influence of the wall BL. The velocities inside the 0.25 m wide bypass channels are measured via two separate Prandtl tubes to obtain the effective inflow velocity. The wing is directly clamped to the platform of the permanently installed force balance underneath the test section (see Fig. 6b). Hence, the suspension is decoupled from the end plates and the tunnel walls. The AoA is controlled by means of a stepping motor with an accuracy of 0.1∘, which is directly attached to the suspension. The wing models were CNC milled from a solid block of ObomodulanTM, as described by Pechlivanoglou (2013). The chord length is 0.6 m and the span is 1.54 m resulting in an aspect ratio of 2.56.
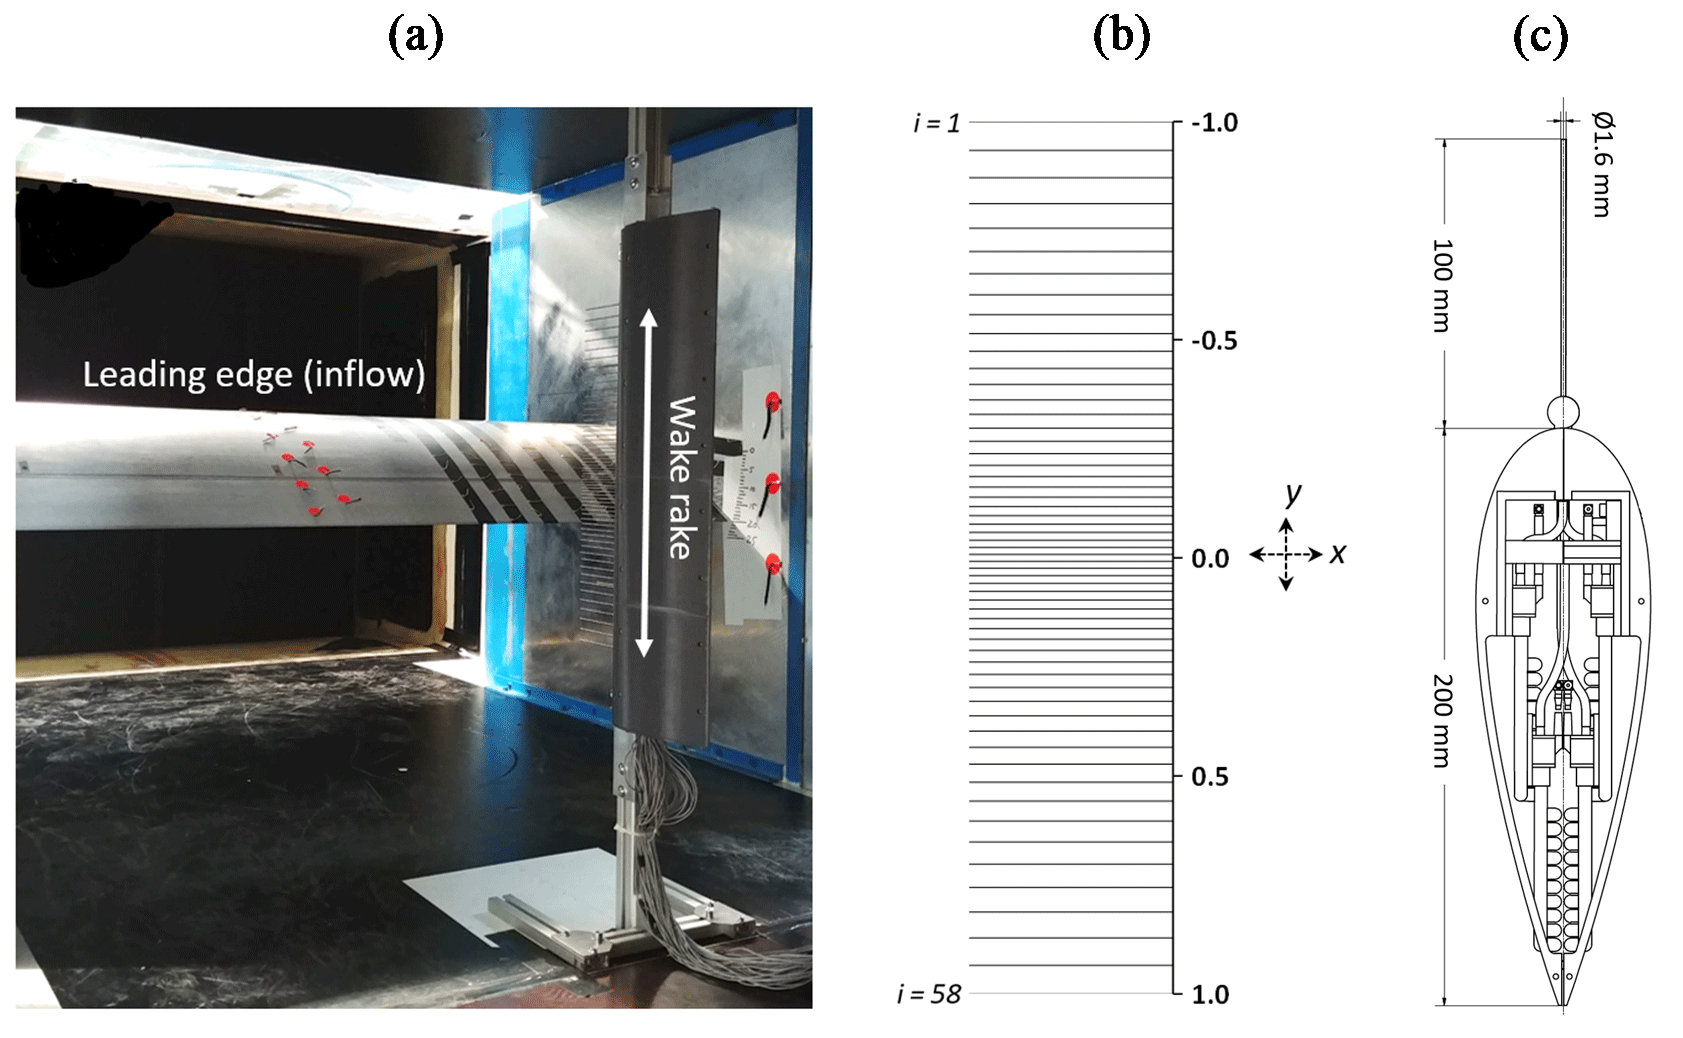
Figure 7(a) Test section during wind tunnel measurements including airfoil model, one of the end plates and the wake rake. (b) Normalized vertical rake tube positions, y, and numbering, i, in side view. (c) Cross section of wake rake casing and pressure tube in top view.
3.2 Measurement methods
3.2.1 Force balance
The lift forces are directly transferred to the six-component force balance (see Fig. 6b). The load cells consist of strain gauges generating voltage signals that are proportional to the incoming forces. Each signal is digitalized by a CompactDAQ System of National Instruments with a sampling rate of 5 kHz. The data are recorded with a LabVIEW user interface including forces, velocities and environmental conditions, i.e., air density and kinematic viscosity, all of which are automatically converted to average results at each AoA. The LabVIEW interface also contains the AoA control in terms of range, steps and measurement duration. According to Meyer et al. (2006), the uncertainty of the measured lift coefficient is 0.2 %. As such, the cl(α) results show good agreement with the literature data, as shown in Appendix C1. However, since its implementation in the wind tunnel, the setup has been characterized by elevated drag results. The reasons are the small gaps between the wing and the end plates leading to suction effects. Moreover, a turbulent BL is formed on the end plates triggering separation on the outer parts of the airfoil model. Both effects are 3D and therefore detected in the form of increased total drag values (see Meyer et al., 2006). For the purpose of this study, a wake rake is designed, constructed and implemented into the test section aiming at 2D drag measurements.
3.2.2 Wake rake
The wake rake method is widely recognized for determining 2D drag coefficients at pre-stall conditions (see, for instance, Fuglsang et al., 2004).
Figure 7a displays the wake rake, which is positioned at a distance of one chord length, i.e., 0.6 m, downstream of the airfoil trailing edge. According to Barlow et al. (1999), a distance of at least 70 % c is necessary for the flow to return to the static pressure level inside the wind tunnel. Figure 7b illustrates that the rake consists of a straight vertical line of 58 pitot tubes, each measuring the total pressure, ptotal. The normalized vertical positions are defined as y=0.0 for the center, mm for the uppermost tube and mm for the lowest tube. The total rake span is 0.5 m. The spacing between the tubes is smallest toward the center with Δymin=4 mm, and widest toward the top and the bottom with Δymax=16.5 mm. The casing consists of a symmetrical NACA0030 profile (see Fig. 7c). The distance between the LE and the orifice of each pitot tube is 100 mm, where the impact of the casing on the flow is considered negligible. The static pressure, pstatic, is determined by means of the static pressure lines of two Prandtl tubes that are installed inside the downstream plane of the wake rake. The differential pressure at each rake tube, Δp(yi) (see Eq. 8), is measured with single pressure sensors that are installed inside the casing. They are connected with flexible silicon tubes, each shorter than 200 mm in order to avoid dynamic feedback effects. The accuracy of each sensor is given with 0.1 % of the full scale range of 1000 Pa under nominal conditions. The voltage signal is digitalized by a separate CompactDAQ system at a sampling rate of 10 kHz and recorded by a Labview user interface. After installing each airfoil model, the vertical center of the rake, y=0.0, is aligned with the maximum pressure loss at the corresponding design AoA. In this way, the static rake span covers the complete AoA range, , as such avoiding the installation of a vertical traversing system.
The uncorrected total drag coefficient is determined at each static AoA over an interval of 5 s by determining the momentum loss in the wake. According to Barlow et al. (1999),
where Δpi is the mean differential pressure value in Pa at each rake tube,
and Δpref is the reference pressure in Pa of the free flow, as taken from the two uppermost and the two lowest rake tubes,
The pressure coefficient, , is defined as
Based on Eq. (7), the uncorrected drag contribution of each rake tube, , becomes
The uncorrected total drag coefficient is then numerically integrated over the spacing between the rake tubes using the trapezoid rule,
where c is the airfoil chord length and yi the normalized position of each rake tube, as illustrated in Fig. 7b.
The measured lift and drag polars, cl,raw(α) and cd,raw(α), are affected by the wind tunnel walls. The reasons are, first, that the solid blockage effect leads to the constriction of the curved streamlines around the airfoil model. Second, the wake blockage effect causes the constriction of the curved streamlines in the wake. For the results to be comparable to equivalent open flow conditions, it is necessary to apply wind tunnel corrections, as detailed in Appendix A. In the remainder of this report, the polar data refer to the corrected lift and drag coefficients, cl(α) and cd(α).
3.3 Test matrix
The inflow velocity, u=40 m s−1, corresponds to a Reynolds number of approximately 1.5×10⁶. The free stream turbulence intensity of the empty wind tunnel is estimated by means of a Prandtl tube and is less than 0.3 %. The AoA ranges from in steps of 1∘. At each static AoA, there is a buffer of 4 s for the flow to settle, after which data are recorded for another 5 s. Hence, the total number of samples is for each rake sensor and for the load cells of the force balance. Before each test run, all sensors are subjected to a zero-offset measurement at standstill in order to reduce experimental errors. The sequence of measurements starts with the clean baseline followed by the three GF configurations, GF025, GF05 and GF1, which refer to the GF heights of 0.25 % c, 0.5 % c and 1 % c, respectively. Next, GF1 is removed and the VG array is installed, followed by the combined configurations, VG + GF025, VG + GF05 and VG + GF1. In the next round, ZZ tape is attached and the test matrix is repeated. Each complete cycle, clean and tripped, is measured within less than 24 h for the environmental conditions to remain as constant as possible.
The presentation of the wind tunnel measurements is focused on the NACA63(3)618 with GFs and the DU97W300 including VGs plus GFs. All results refer to the clean and the tripped cases. They are presented in the form of both the polar curves and the wake pressure fields.
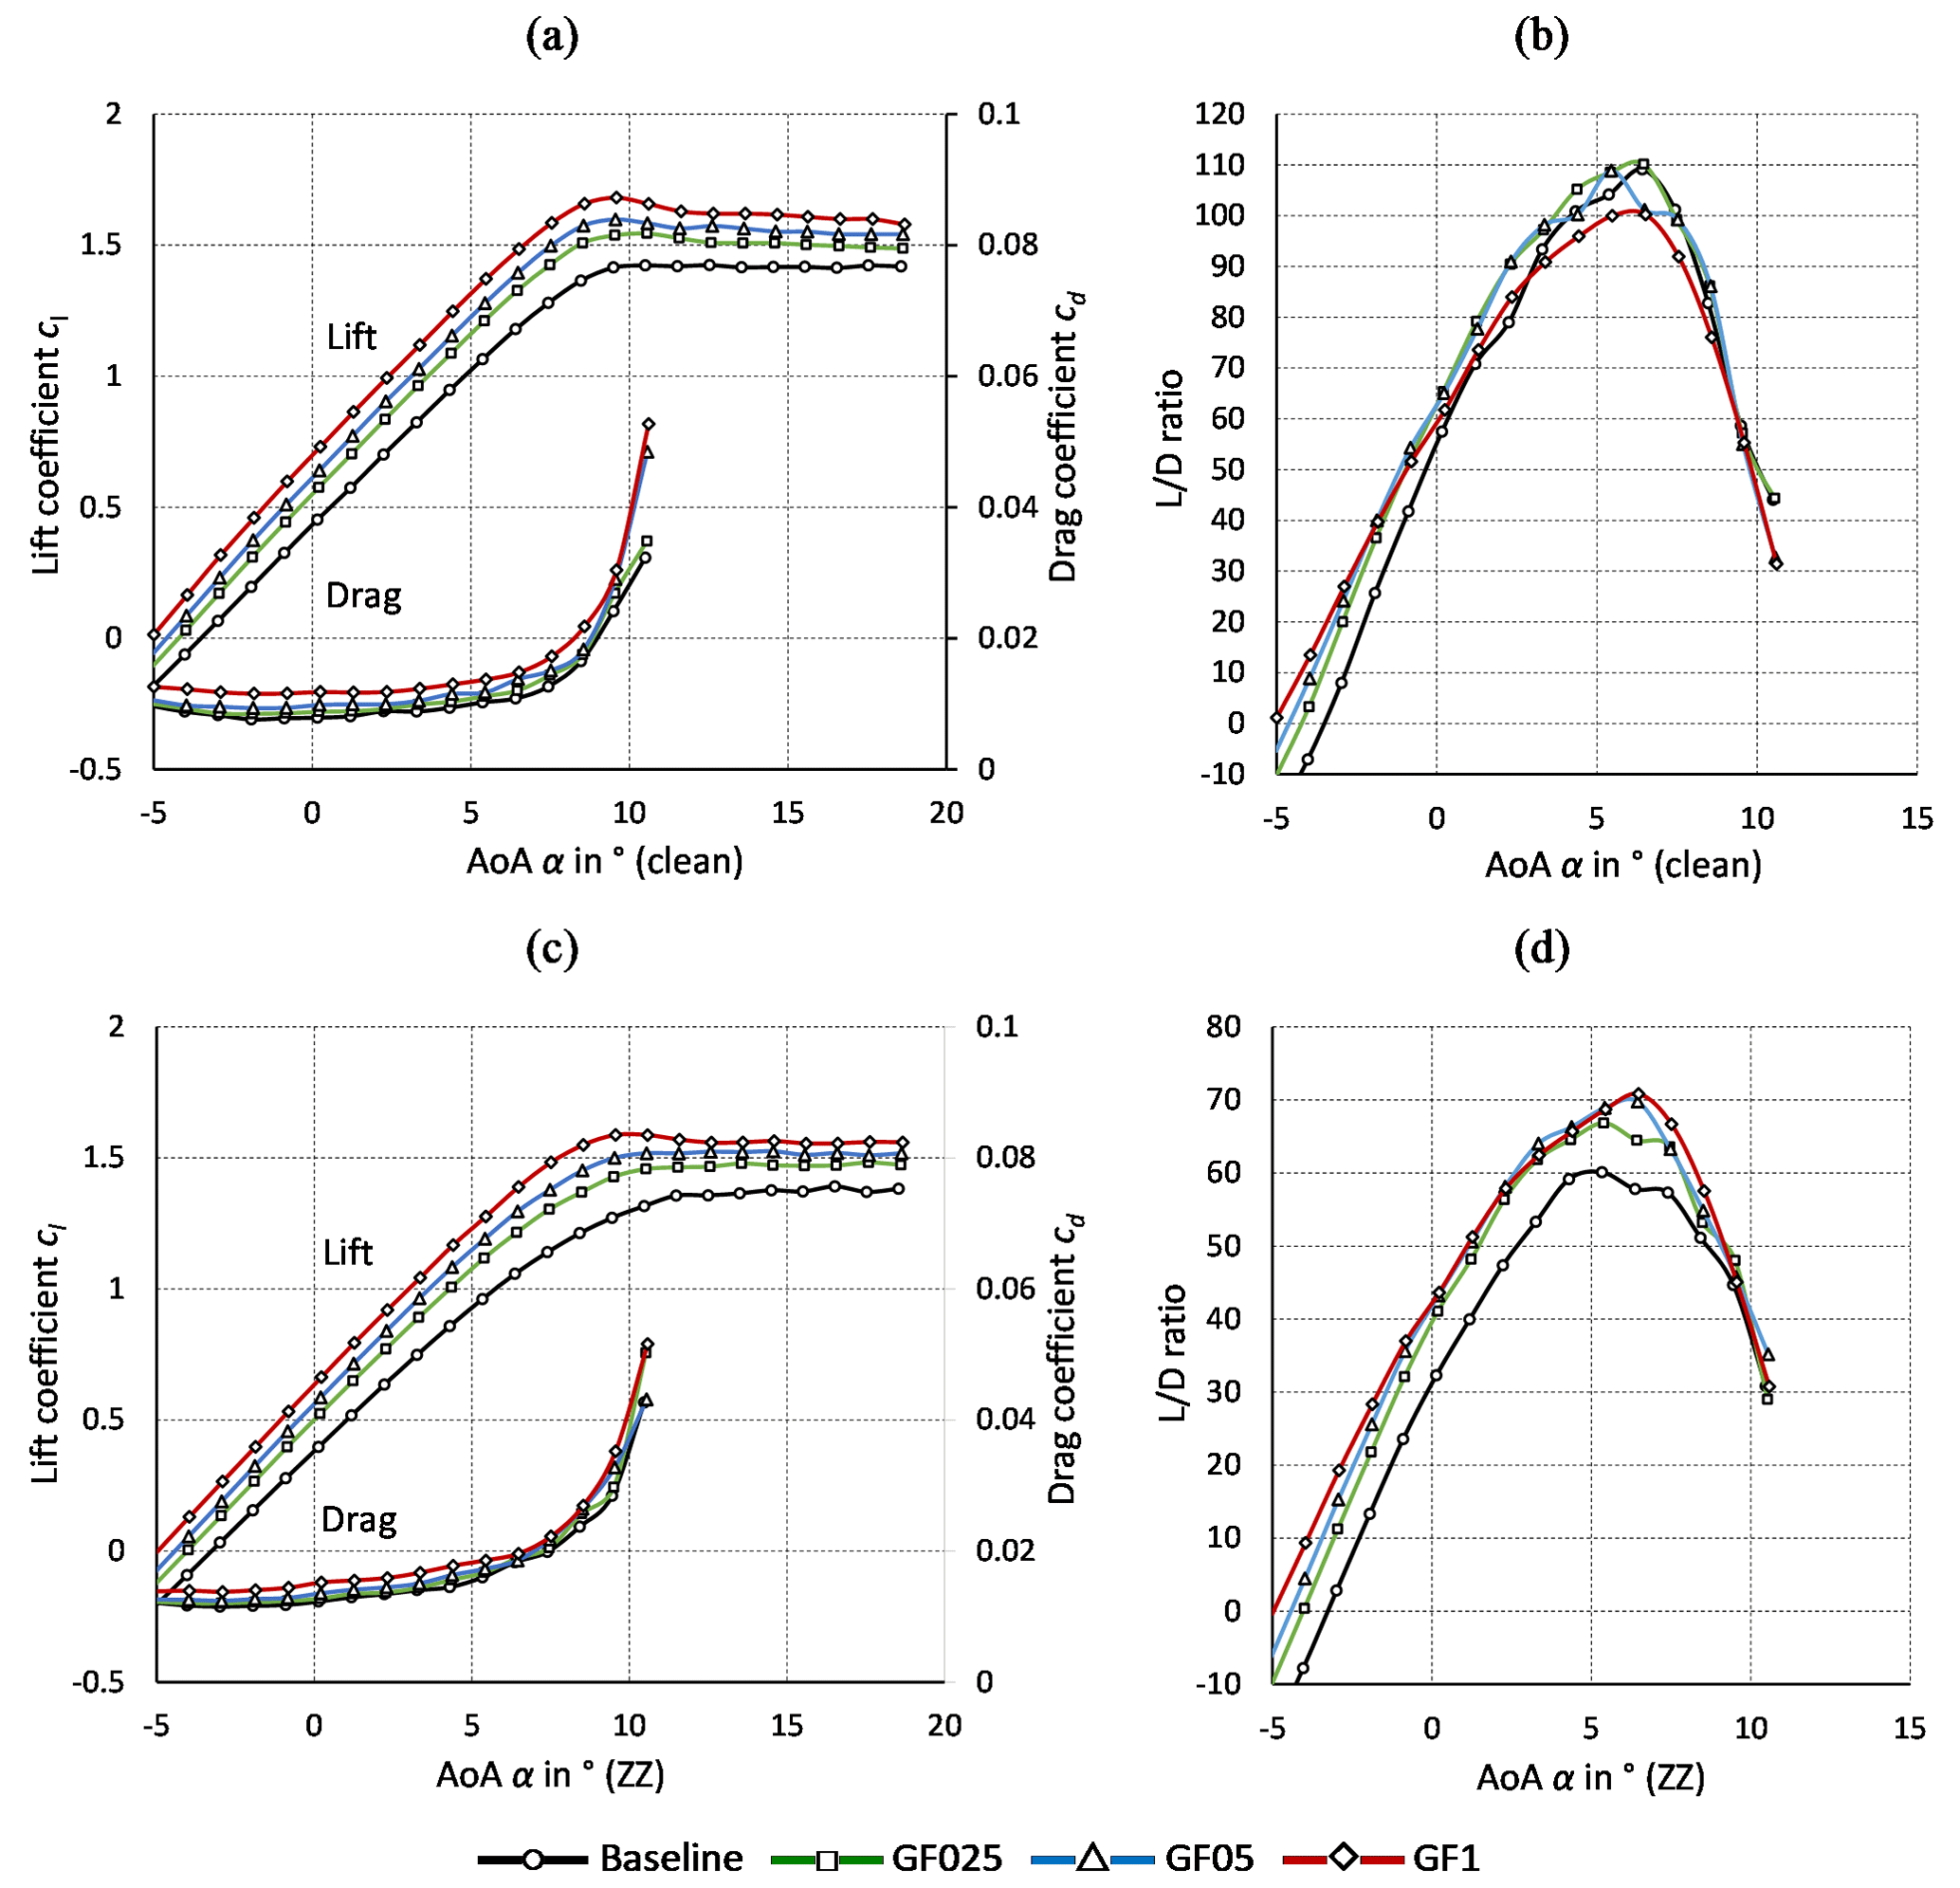
Figure 8NACA63(3)618. Gurney flaps. (a) Lift and drag coefficients (clean). (b) ratio (clean). (c) Lift and drag coefficients (ZZ). (d) ratio (ZZ).
4.1 NACA63(3)618: Gurney flaps
4.1.1 Polar curves
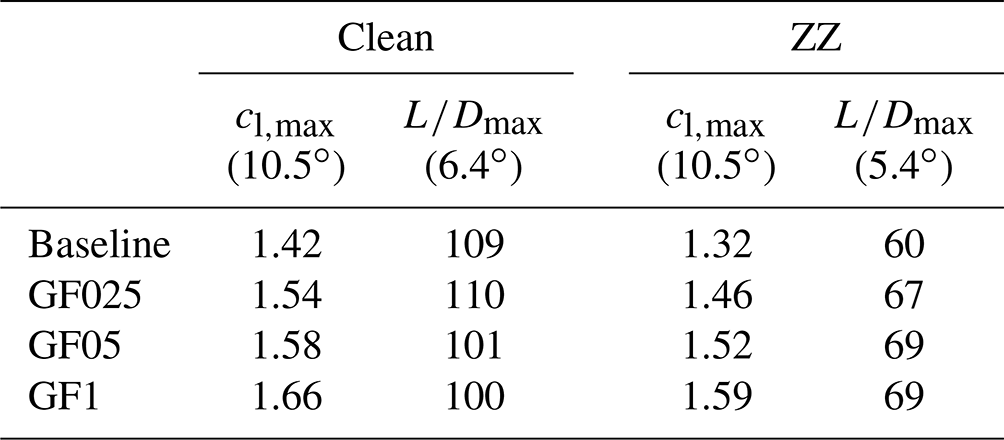
Figure 8 shows the clean and the tripped polar curves of the NACA63(3)618. For clarity, characteristic lift and values are summarized in Table 6. In the baseline cases, the drag results are valid until stall at ∘ and the lift curves are measured until the post-stall AoA of 18.5∘ (see Fig. 8a and c). As expected, ZZ tape with hZZ=0.4 mm manifests itself in a lift decrease, coupled with a significant drag increase. The design point declines from ∘ to ∘ and the corresponding aerodynamic efficiency drops from to (see Fig. 8b and d). The clean and the tripped GF configurations are characterized by an increase in both lift and drag throughout the complete pre-stall region. Furthermore, the shape of the polar curves and the stall behavior is maintained. In the clean cases, is only marginally improved by GF025 and GF05. Nonetheless, the significant lift increase is expected to be beneficial in terms of the rotor blade performance, as long as is maintained. As such, GF025 yields the preferred results, while GF1 leads to an overall decrease. In the tripped cases, the aerodynamic efficiency is improved independently of the GF height. The reason is the significant expansion of the BL due to forced LE transition, so that larger GFs appear to be more beneficial.
4.1.2 Wake pressure field
To deepen our understanding of the aerodynamic mechanisms, the wake rake data are further evaluated. Figure 9 displays the momentum loss in the wake of the clean and the tripped GF configurations. At αopt=6.4∘, the pressure coefficients, , correspond to attached flow. The pressure deficit and thus drag is increased in relation to the GF height. Moreover, the vertical position of the wake dent is characteristic of the downwash angle, which is proportional to lift. Hence, the minima of the curves descend toward the wind tunnel floor as the GF heights increase. In the tripped case, the pressure deficit and thus drag is more pronounced and the downwash angle is smoother due to lower lift values.

Figure 9NACA63(3)618 at α=6.4∘. Gurney flaps. Pressure coefficients over vertical wake rake positions. (a) Clean case. (b) Tripped case.
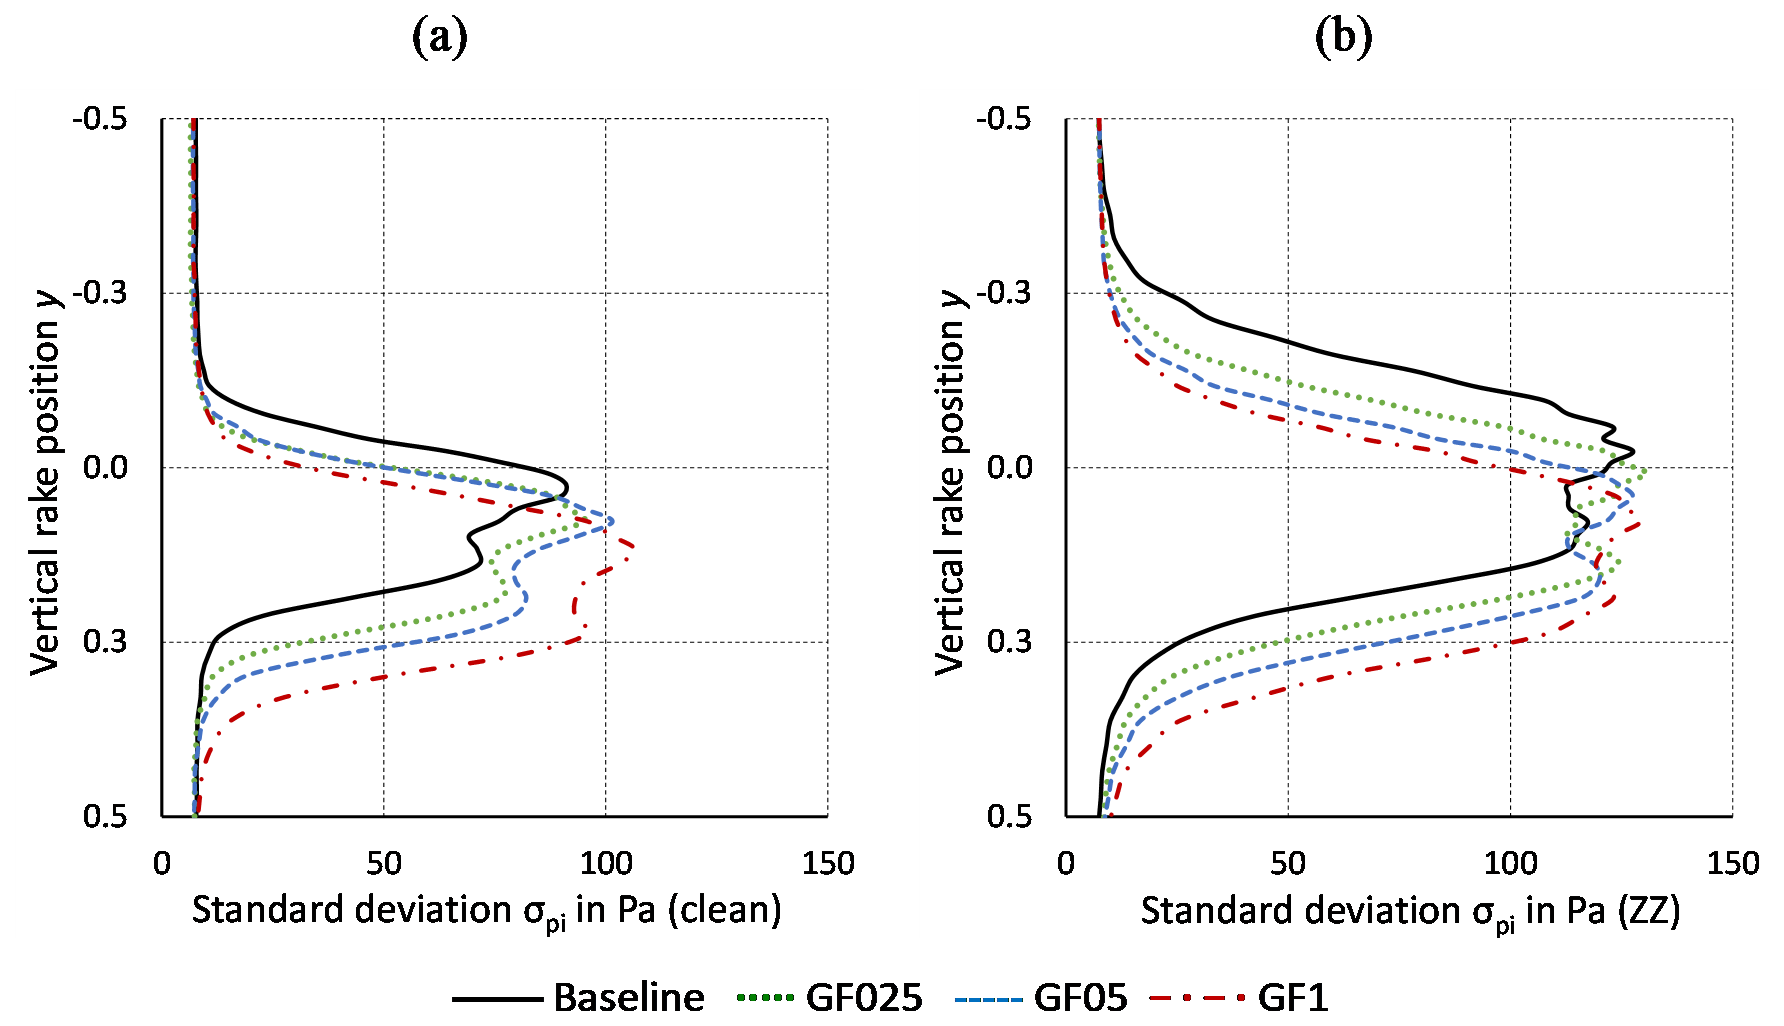
Figure 10NACA63(3)618 at α=6.4∘. Gurney flaps. Standard deviation of raw pressure data over vertical wake rake positions. (a) Clean case. (b) Tripped case.
Next, the fluctuations of the pressure measurements indicate the intensity of the wake unsteadiness, which is an important contributor to the total drag value. These fluctuations are determined via the standard deviation of the differential pressure data in Pa at each rake tube and each AoA,
where is the number of samples of each pressure sensor, Δpi(t) the time-resolved differential pressure values in Pa and Δpi the average differential pressure in Pa (see Eq. 8).
Figure 10a shows that, in the clean case, the intensity of the wake unsteadiness is dependent on the GF height. Despite the offset due to the steeper downwash angle, the minima of the curves are similar between the clean baseline and the MGF configurations, as predicted by Bechert et al. (2000) and Schatz et al. (2004b) (see Sect. 1.2). In the tripped cases, Fig. 10b illustrates that is more pronounced due to the thicker and more turbulent BL, whereas the relative σpi(α) contribution of the GFs appears to be minor.
For completeness, additional NACA63(3)618 results are presented in Appendix B. The polar curves that refer to the combination of VGs plus GFs are included in Appendix B1. Appendix B2 presents the investigation of the different GF shapes, i.e., the triangular versus the rectangular profiles.
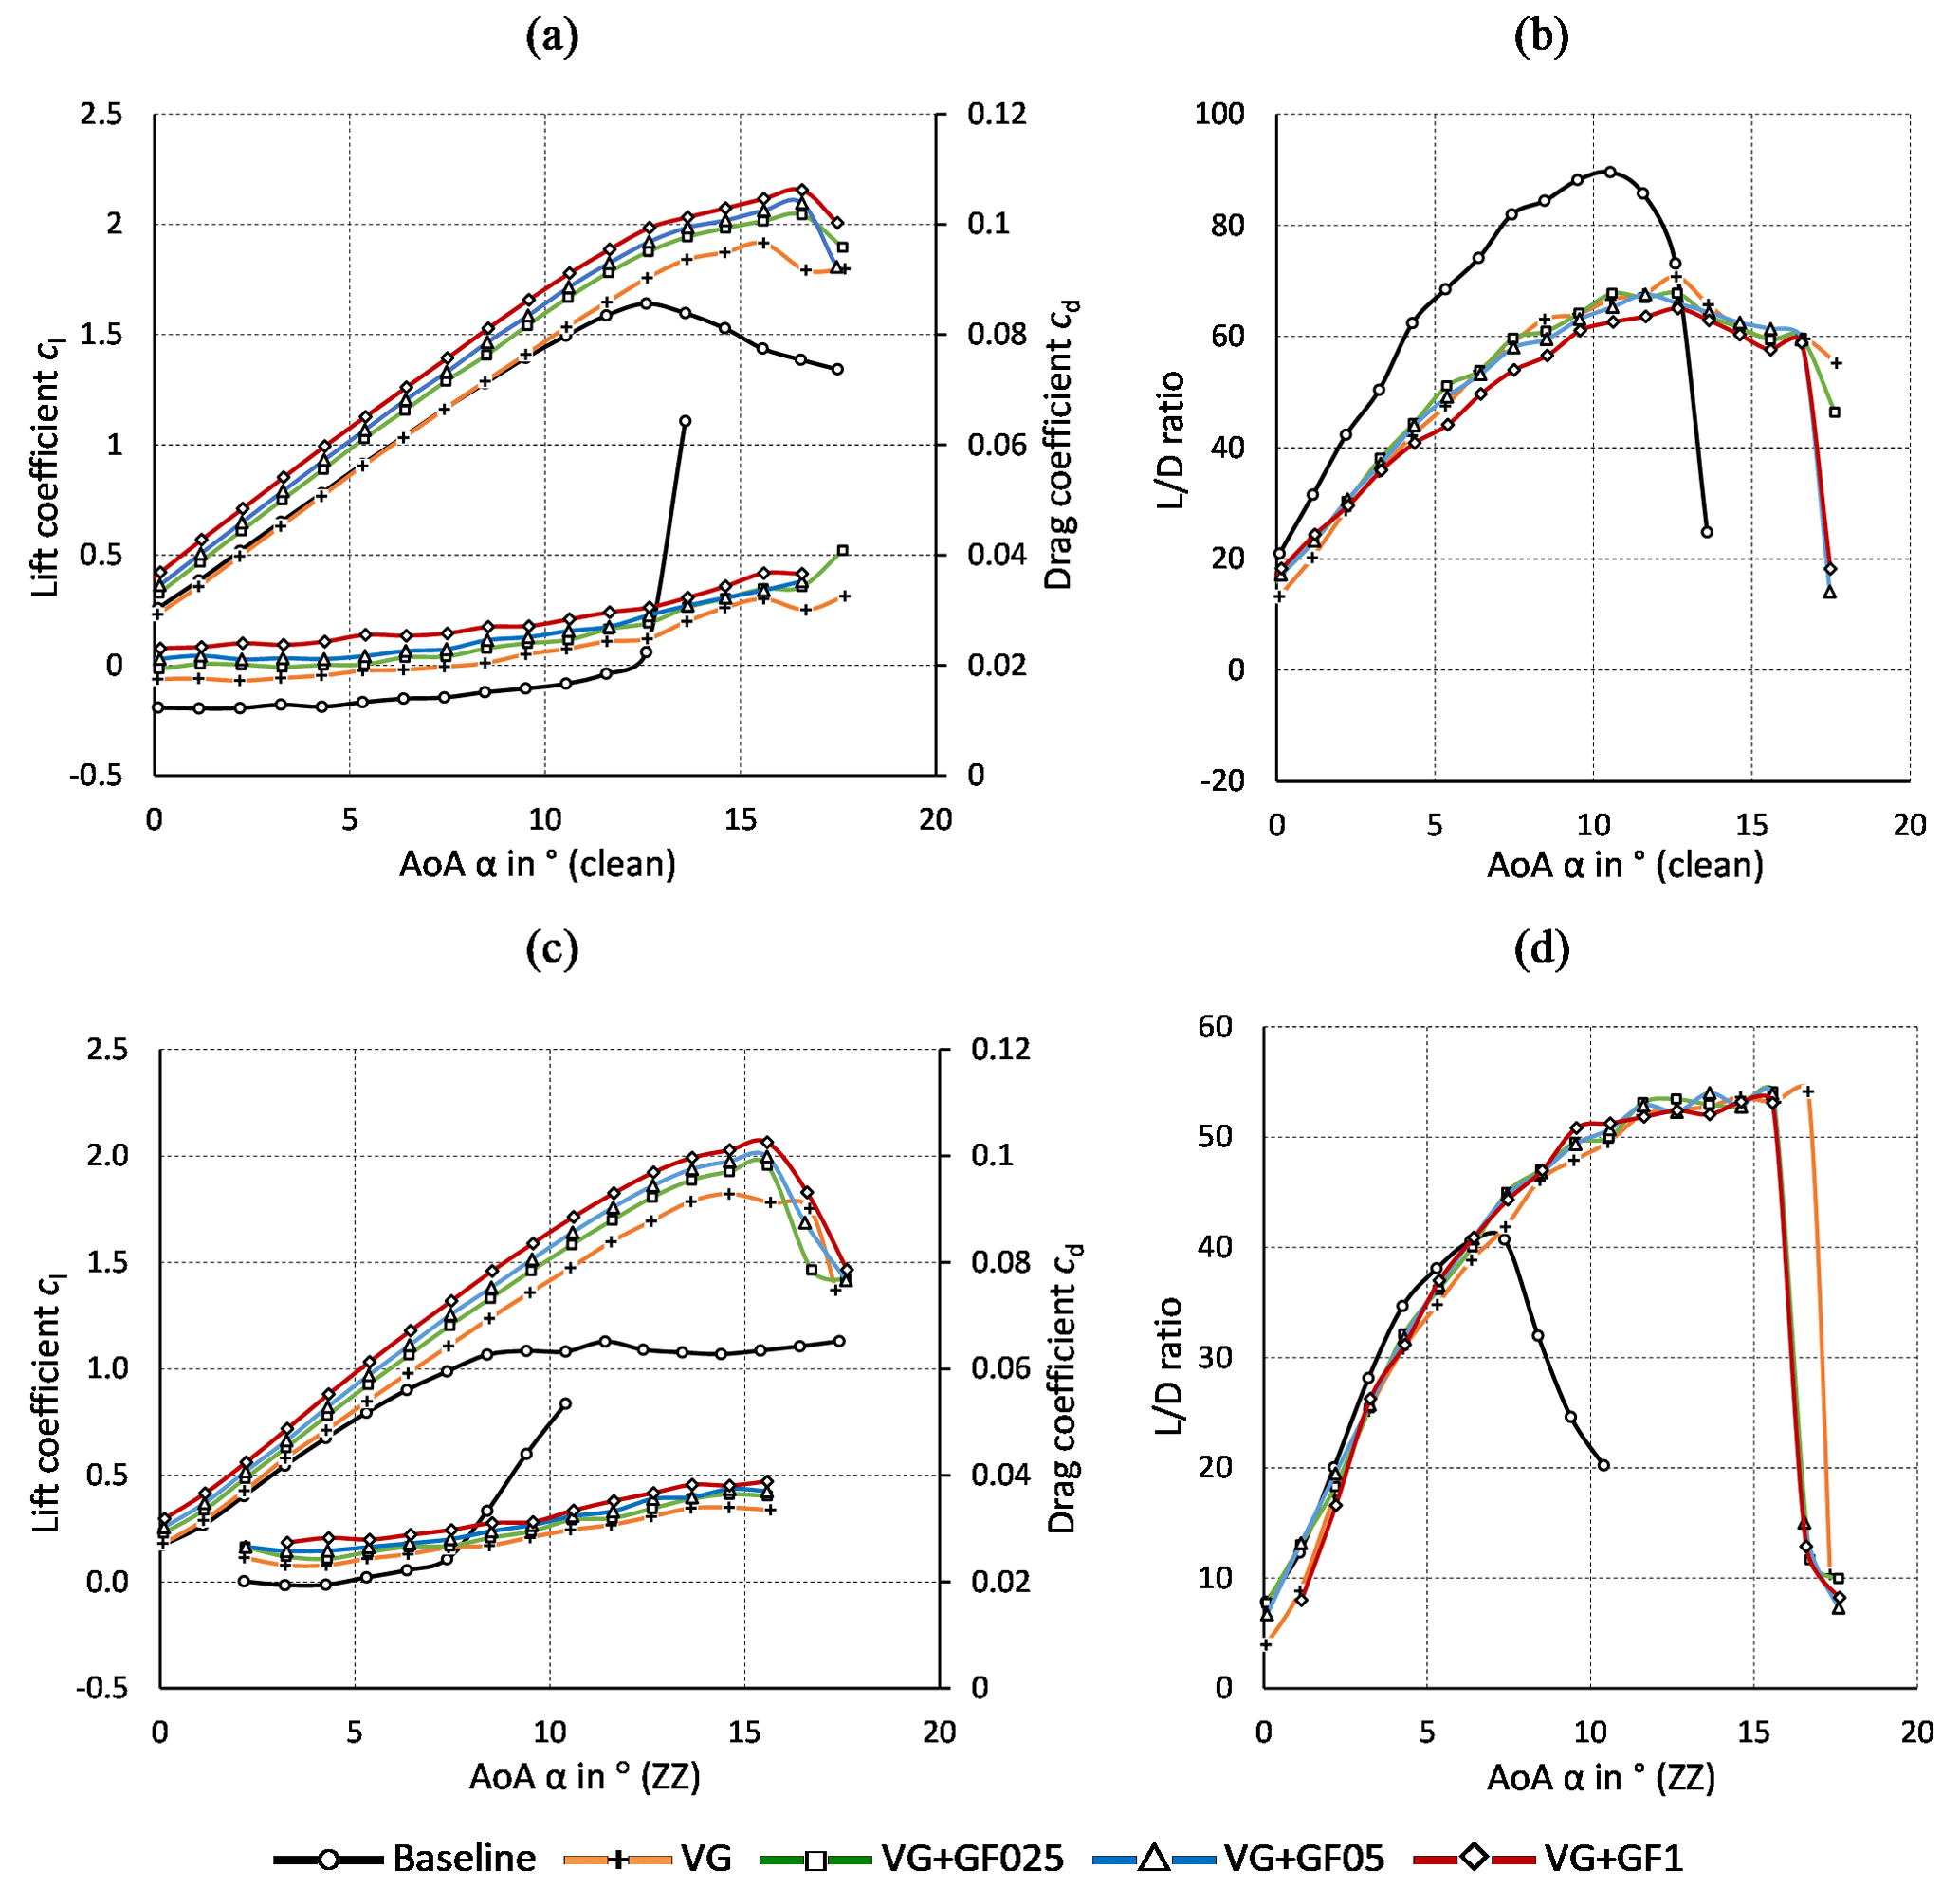
Figure 11DU97W300. Vortex generators and Gurney flaps. (a) Lift and drag coefficients (clean). (b) ratio (clean). (c) Lift and drag coefficients (ZZ). (d) ratio (ZZ).
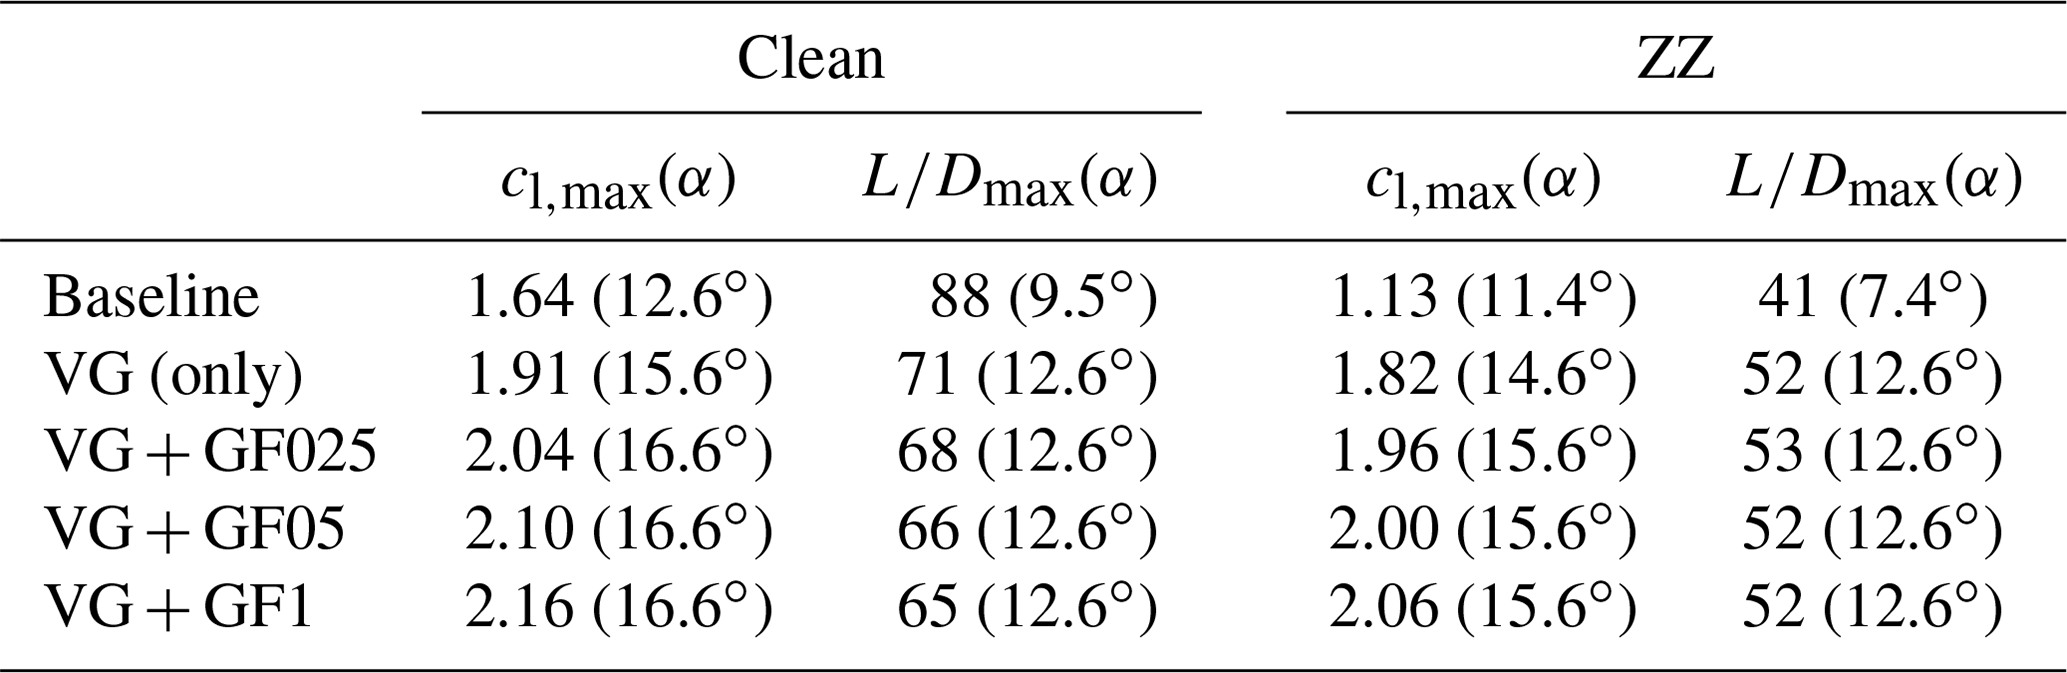
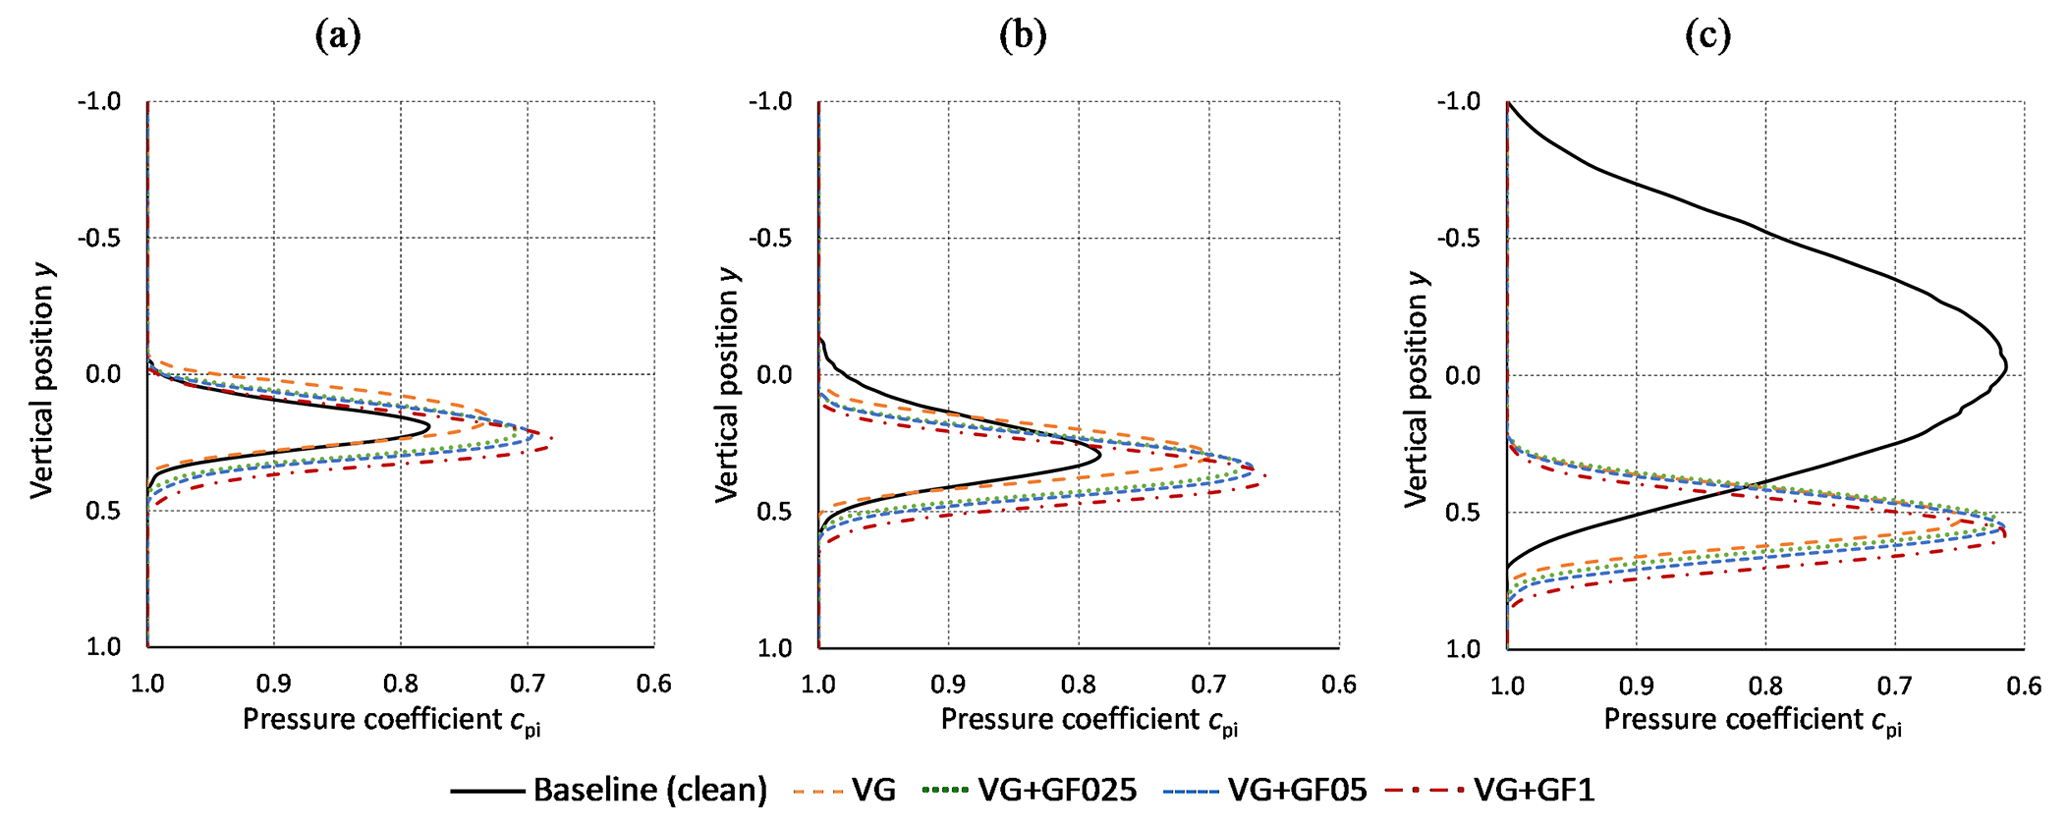
Figure 12DU97W300. Pressure coefficients over vertical wake rake positions in the clean case. Vortex generators and Gurney flaps. (a) αopt=9.5∘. (b) ∘. (c) α=16.5∘.
4.2 DU97W300: vortex generators plus Gurney flaps
4.2.1 Polar curves
Figure 11 displays the clean and the tripped polar curves of the DU97W300. In the baseline cases, the design AoA is decreased from ∘ to ∘ and the stall angle is declined from ∘ to ∘ (see Fig. 11a and c). Hence, by using ZZ tape with hZZ=0.3 mm, separation is initiated early, in fact only 1∘ below αopt,clean. As a result, the aerodynamic efficiency drops from to (see Fig. 11b and d). For clarity, characteristic lift and values are summarized in Table 7. Looking at the VG (only) cases, stall is delayed by approximately 3∘ coupled with a substantial increase in maximum lift. However, the VGs lead to a more abrupt stall behavior and thus adverse load excursions, as reported by Mueller-Vahl et al. (2012). Despite the improved drag behavior at elevated AoA, the drag penalty causes to decrease at low and moderate AoA. Under tripped conditions, the aerodynamic efficiency is only slightly decreased in the lower AoA range. Furthermore, is significantly increased, as it is shifted by almost 5∘ recovering a large area of otherwise separated flow between , as illustrated in Fig. 11d. In the combined cases, the VG is superposed by the GF effect leading to both stall delay and the pre-stall lift increase. Compared to the VG (only) configurations, is therefore maintained in the clean and slightly improved in the tripped cases.
4.2.2 Wake pressure field
To deepen our understanding of the aerodynamic mechanisms, the wake rake data are further evaluated. Figure 12a displays the pressure loss in the wake of the clean VG + GF configurations. At ∘, the pressure coefficients, , correspond to attached flow. At α=12.6∘, the wake deficit of the baseline curve extends toward the upper side of the rake indicating the formation of the TE separation bubble on the suction side and thus the initiation of stall (see Fig. 12b). The curves of the VG + GF configurations, on the other hand, show that the flow remains attached.
At α=16.5∘, the baseline airfoil is clearly stalling (see Fig. 12c). At this point, the wake consists of separated flow, i.e., 3D structures that cannot be determined by means of the wake rake. By contrast, the VG configurations delay the formation of stall cells, so that the flow remains attached, as described by Manolesos and Voutsinas (2015). Finally, at α=17.5∘, which is not displayed here, the flow separates abruptly leading to a steep decline of the lift curves. These load excursions are perceptible in the form of strong mechanical vibrations of the setup as well as a deep roaring sound inside the wind tunnel. The wake deficit remains similar in shape and amount comparing the VG (only) with the combined configurations, again pointing toward a favorable wake interaction between VGs and MGFs.
For completeness, additional DU97W300 results are presented in Appendix C. The validation of the experimental setup is compared with wind tunnel measurements of the DU in Appendix C1. The polar curves that refer to the GF (only) configurations are included in Appendix C2.
The preferred configurations of VGs and GFs are selected based on the wind tunnel measurement results. The experimental polar data are imported into the software QBlade in order to create a generic rotor blade. The blade performance is simulated by means of two case studies, the retrofit application on an existing rotor blade and the new design application on an alternative rotor blade design.
5.1 Blade configurations
Table 8 summarizes the qualitative effect of the preferred MGF (only) and the VG + MGF configurations including hMGF=0.25 % c and hMGF=0.5 % c. It is noted that hGF=1.0 % c is not considered relevant for this section due to the elevated drag penalty and thus decrease.
Table 8Performance evaluation of MGFs and VGs based on the wind tunnel tests of the NACA63(3)618 and the DU97W300. ↑ for increase, ≈ for similar and ↓ for decrease.
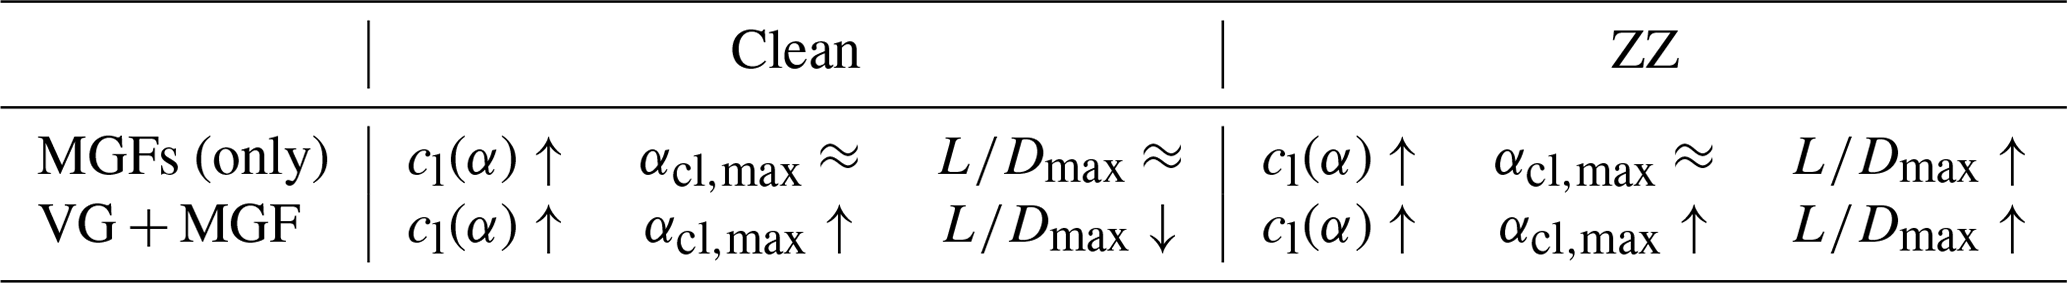
First, the effect of both PFC devices is case dependent, as illustrated in Table 8. Apart from that, it is difficult to measure and to foresee the degree of LER, as described by Papi et al. (2021). Hence, the principal objective of this study is to improve the airfoil performance based on forced LE transition without jeopardizing the aerodynamic efficiency of the clean airfoil. Looking at the MGF (only) configurations, lift is increased at the design point and the stall behavior is consistent. The decambering effect of the ZZ tape is partly recovered, as such improving the aerodynamic efficiency, while is maintained. Next, VG + MGF lead to significant improvements in both the lift increase and the stall delay. In the clean case, is decreased due to the combined drag penalty. In the tripped case, however, the combined configurations achieve a triple improvement in terms of lift increase, stall delay and aerodynamic efficiency.

Figure 13(a) Design of the generic rotor blade based on the NREL 5 MW reference wind turbine. (b) Geometry of the generic blade over the rotor radius.
In summary, GF025 is selected over GF05 because it is the more conservative option, especially in the clean case of the NACA63(3)618. Regarding the DU97W300, VG + GF05 is the preferred option due to both the significant stall delay and the pre-stall lift increase. It is noted that either of the MGF configurations, GF025 and GF05, lead to similar results indicating a certain tolerance in choosing the optimum MGF height in accordance with Eq. (4).
5.2 Blade design
The experimental lift and drag polars are imported into the open source software QBlade. Figure 13 illustrates the rotor blade of the NREL 5 MW reference wind turbine, as specified by Jonkman et al. (2009). The total rotor radius is R=63 m, the average wind speed at hub height is u=8 m s−1. The design tip speed ratio (TSR), is defined by
where f is the rotational frequency in Hz. The NREL blade is used as a template for the so-called generic rotor blade design, which is scaled down to R=20 m, u=7 m s−1 and λopt=7. The resulting Reynolds numbers are closer to those of the wind tunnel tests, i.e., in the range of1.5×106 to 2×10⁶ rather than 3×10⁶ to 9×10⁶.
Figure 13a illustrates that the DU97W300 is placed from blade position 6 to 8 and the NACA63(3)618 between position 9 and 15. The mid span region, see position 8 to 9, is simply interpolated for the purpose of this numerical part. Figure 13b shows the chord length c(r) and the twist angle θ(r) at each blade position, which are determined by means of the blade optimization procedure of Betz and Schmitz (1956/1956), as described by Gasch and Twele (2012),
where B is the number of blades and φ the inflow angle in ∘.
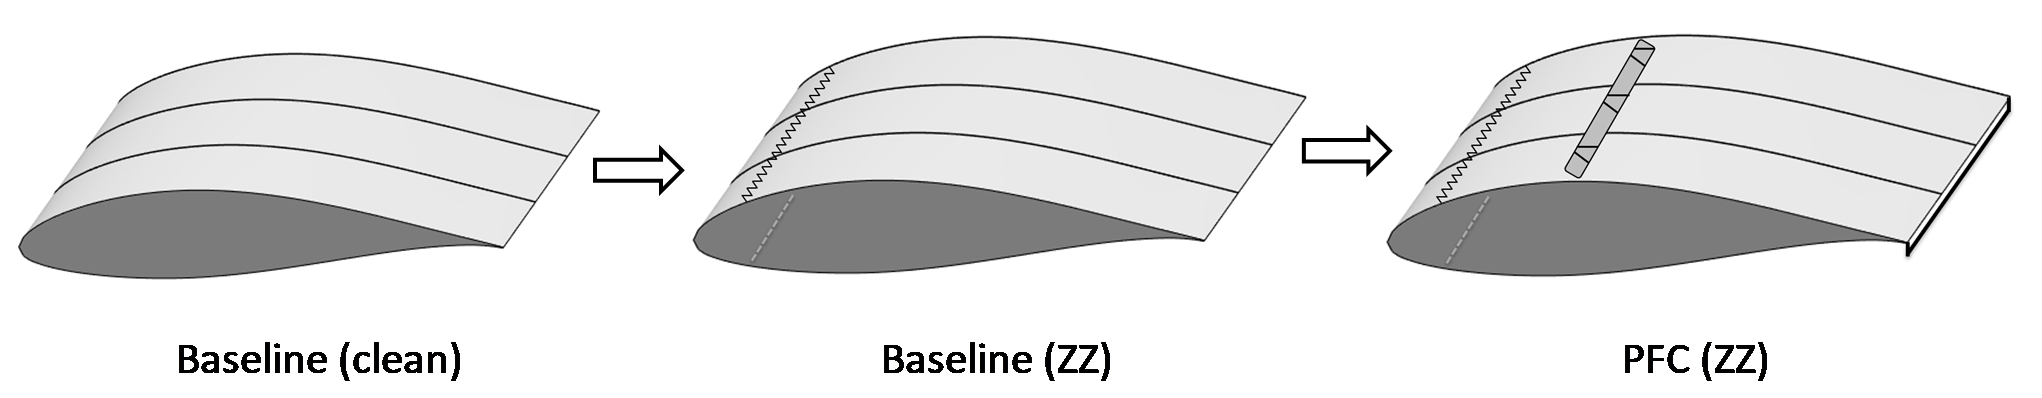
Figure 14Retrofit application of passive flow control devices on a generic rotor blade section.
The Schmitz design leads to elevated chord lengths and twist angles in the root region due to the decreasing rotational speed and thus λ(r) toward the blade root. For practical and logistical reasons, c(r<30 % R) is usually designed separately in order to limit the volume and the weight of large rotor blades. Hence, the numerical results of the generic blade are only feasible between position 6 at r=31.7 % R and the tip. Besides, no specific tip design is implemented. Next, two case studies are defined and presented using Eqs. (15) and (16). The first one is the retrofit application, i.e., the PFC devices are installed on an existing rotor blade, for instance, during regular maintenance activities. The original blade design is based on the smooth surface, i.e., the clean airfoil polars. Over time, LER occurs and the data files of the clean baseline are replaced by the tripped baseline. As a consequence, the aerodynamic efficiency and therefore the AEP is decreased. During the third step, the polar data of both VGs and MGFs are imported in order to recover some of the power output, as illustrated in Fig. 14.
The second case study is the new design application. The PFC devices are installed as part of the blade manufacturing process on the ground. The performance of the clean and the tripped baseline blade, as previously depicted in Fig. 14, is compared with an alternative configuration that includes the PFC devices as part of the design process itself. Hence, the blade geometry, c(r) and θ(r), is calculated separately for the alternative blade, PFC* (clean) and PFC* (ZZ) (see Fig. 15).
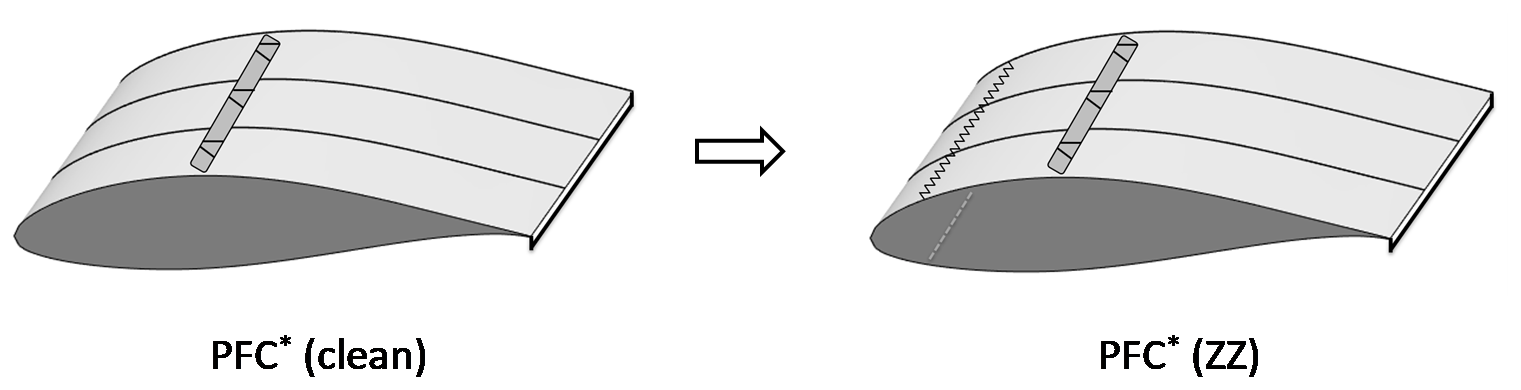
Figure 15New design application of passive flow control devices on a generic rotor blade section.
5.3 Blade simulations
The rotor blade simulations are performed using the steady blade element momentum (BEM) method based on Hansen (2015), which is embedded in the corresponding QBlade module. The BEM simulations entirely depend on the quality of the imported polar data at each blade section. Furthermore, empirical correction algorithms are activated including root and tip loss calculations, thrust forces of heavily loaded rotors (Glauert correction) and spanwise crossflow effects, as described by Marten et al. (2013). The power curves are determined with respect to the rated power output of Pmax=600 kW at u=12 m s−1. The basic pitch and rpm controller settings are optimized for reaching maximum power output.
5.3.1 Retrofit application
The BEM simulations of the retrofit application are presented. Figure 16 shows the AoA along the local rotor radius, r. The clean baseline coincides with ∘ of the DU97W300 in the root region and with ∘ of the NACA63(3)618 in the tip region. Replacing the clean by the tripped polar data, the AoAs are significantly increased (see Fig. 16a). In fact, the root region already stalls for α>10.5∘, so that the local drops dramatically (see Fig. 16b). This adverse effect of forced LE transition is partly compensated for by the PFC devices. Hence, the AoAs are closer to αopt,clean and the is partly recovered. Figure 16c shows the power coefficients over the complete operational range of the rotor. In the tripped case, the power curve is shifted toward higher TSR leading to rather than λopt=7. As a result, is decreased by 13 % to . After the retrofit application, the cp curve is closer to the design point with , reducing the relative power loss to 5.7 %. In this generic case study, the power reduction due to forced LE transition is approximately halved by the retrofit application of MGFs and VGs.
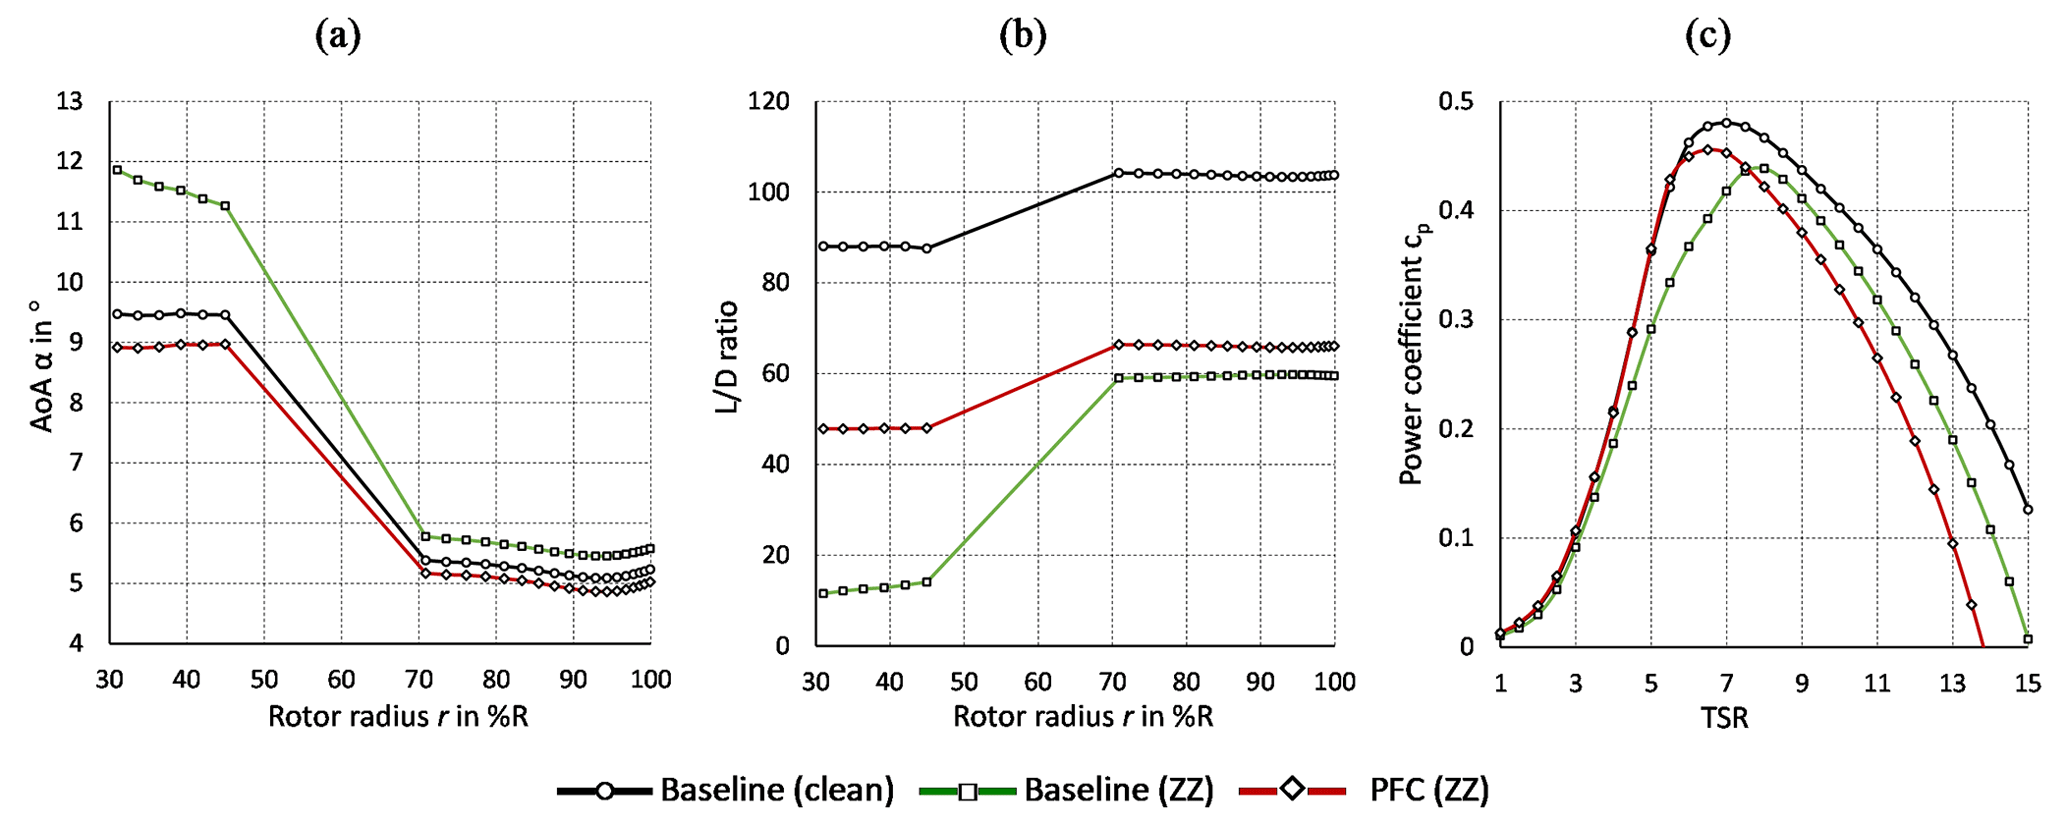
Figure 16Rotor blade performance simulation of the baseline and the retrofit application. (a) AoA over rotor radius at λopt=7. (b) over rotor radius at λopt=7. (c) Power coefficients over TSR.
5.3.2 New design application
The BEM results of the new design application are presented. According to Eq. (15), the lift increase caused by the MGFs (see Fig. 17a) leads to a significant chord length reduction. Comparing the baseline cases, the optimum chord length is reduced by 23.4 % in the root and by 12 % in the tip region, as illustrated in Fig. 17b. Regardless of any structural–dynamic considerations, this approach might contribute to the development of more slender blades, thereby saving material costs, as previously suggested by Fuglsang et al. (2004) (see Sect. 1.5). Moreover, periodic gravitational load alternations as well as fatigue loads are potentially mitigated by reducing the blade weight.
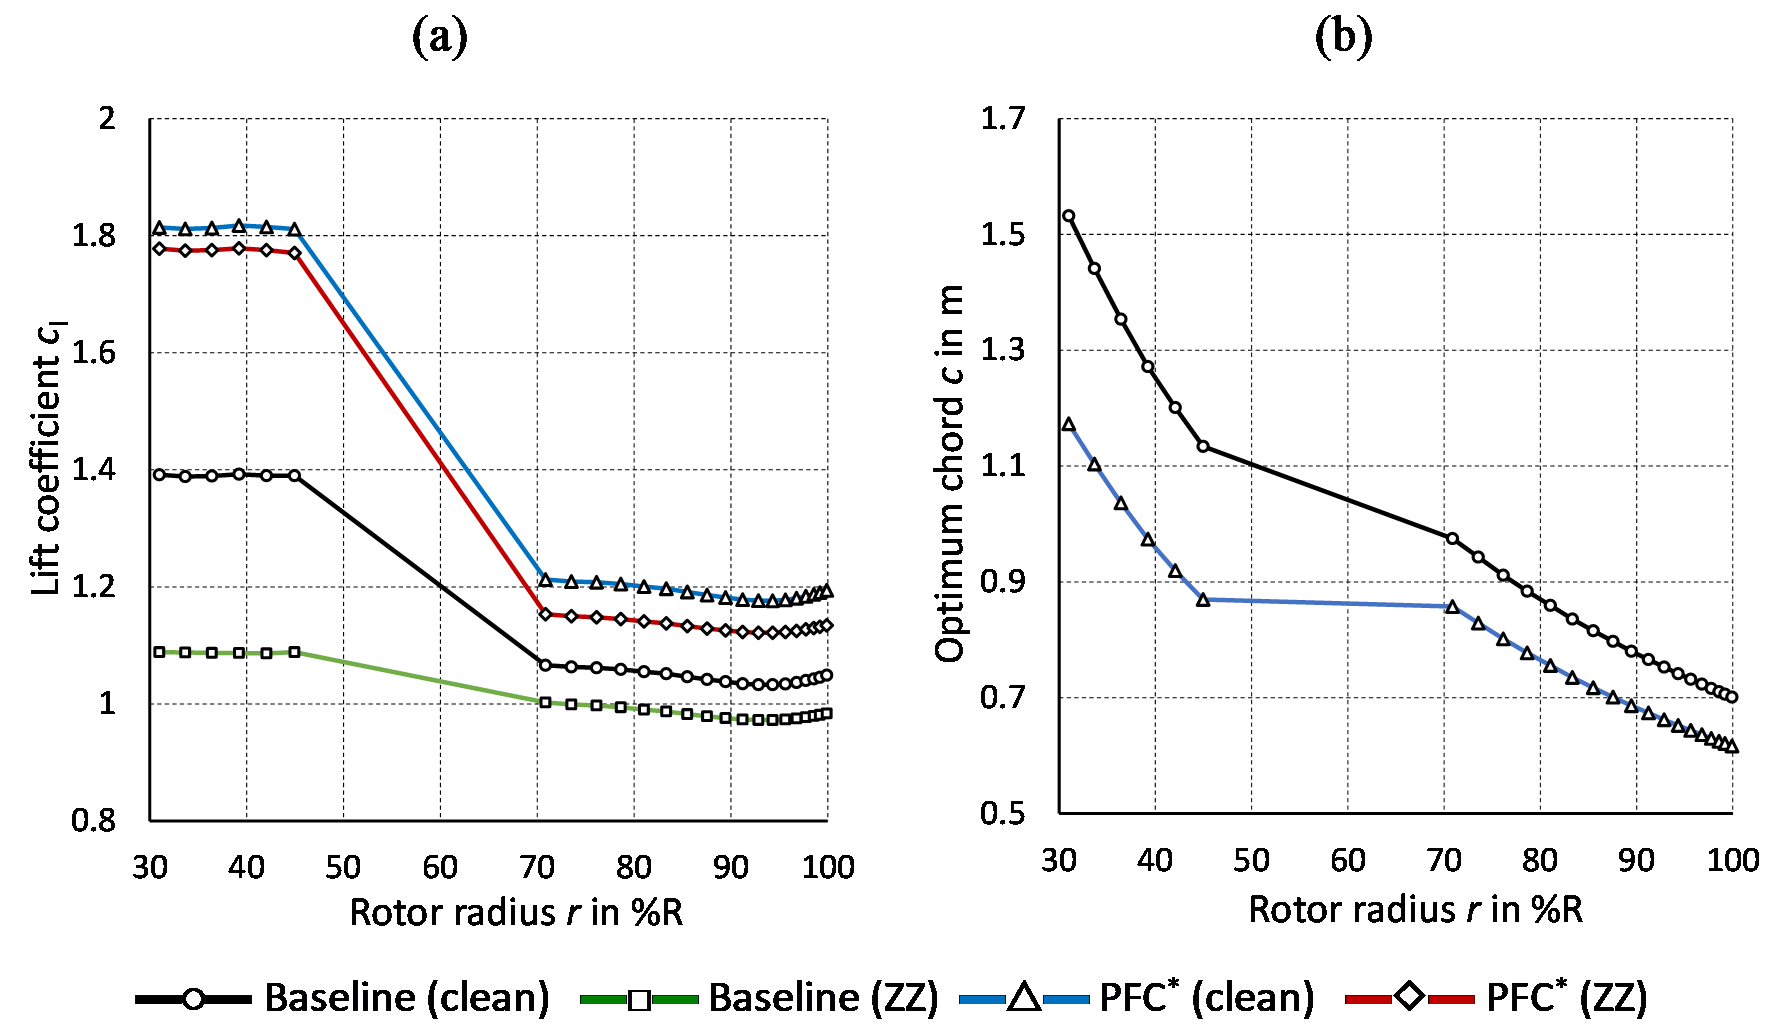
Figure 17Blade geometry of the baseline and the new design application at λopt=7. (a) Lift coefficients over rotor radius. (b) Optimum chord length over rotor radius.
Next, Fig. 18 shows the BEM simulation of the new design application. It is noted that the clean and tripped baseline curves – baseline (clean) and baseline (ZZ) – are identical to Fig. 16. The alternative blade design – PFC* (clean) and PFC* (ZZ) – leads to similarly high design AoA, ∘ toward the root (see Fig. 18a). Apart from that, stall is delayed by the VGs until approximately 16∘, which is not shown here. In the tip region, the MGF only leads to a marginal increase regarding α(λopt). Figure 18b illustrates that, in the clean case, the aerodynamic efficiency is decreased toward the root region due to the drag penalty of the PFC devices, whereas the MGF achieves a slight improvement toward the tip. By contrast, the PFC* (ZZ) improves the aerodynamic efficiency significantly throughout the complete blade length, as compared to baseline (ZZ). Hence, the PFC* configuration appears to be less sensitive to forced LE transition. Next, Fig. 18c shows the corresponding power curves. In both PFC* (clean) and PFC* (ZZ), cp,max remains at λopt=7. As a consequence, is almost identical compared to baseline (clean), despite moderate differences at elevated TSR for λ>λopt. In the tripped cases, is reduced by only 4.6 % relating PFC* (ZZ) to PFC* (clean) rather than by 13 % with regard to the baseline cases. Again, the power loss due to forced LE transition is at least halved and the rotor blades are significantly more slender due to the new design application of MGFs and VGs.
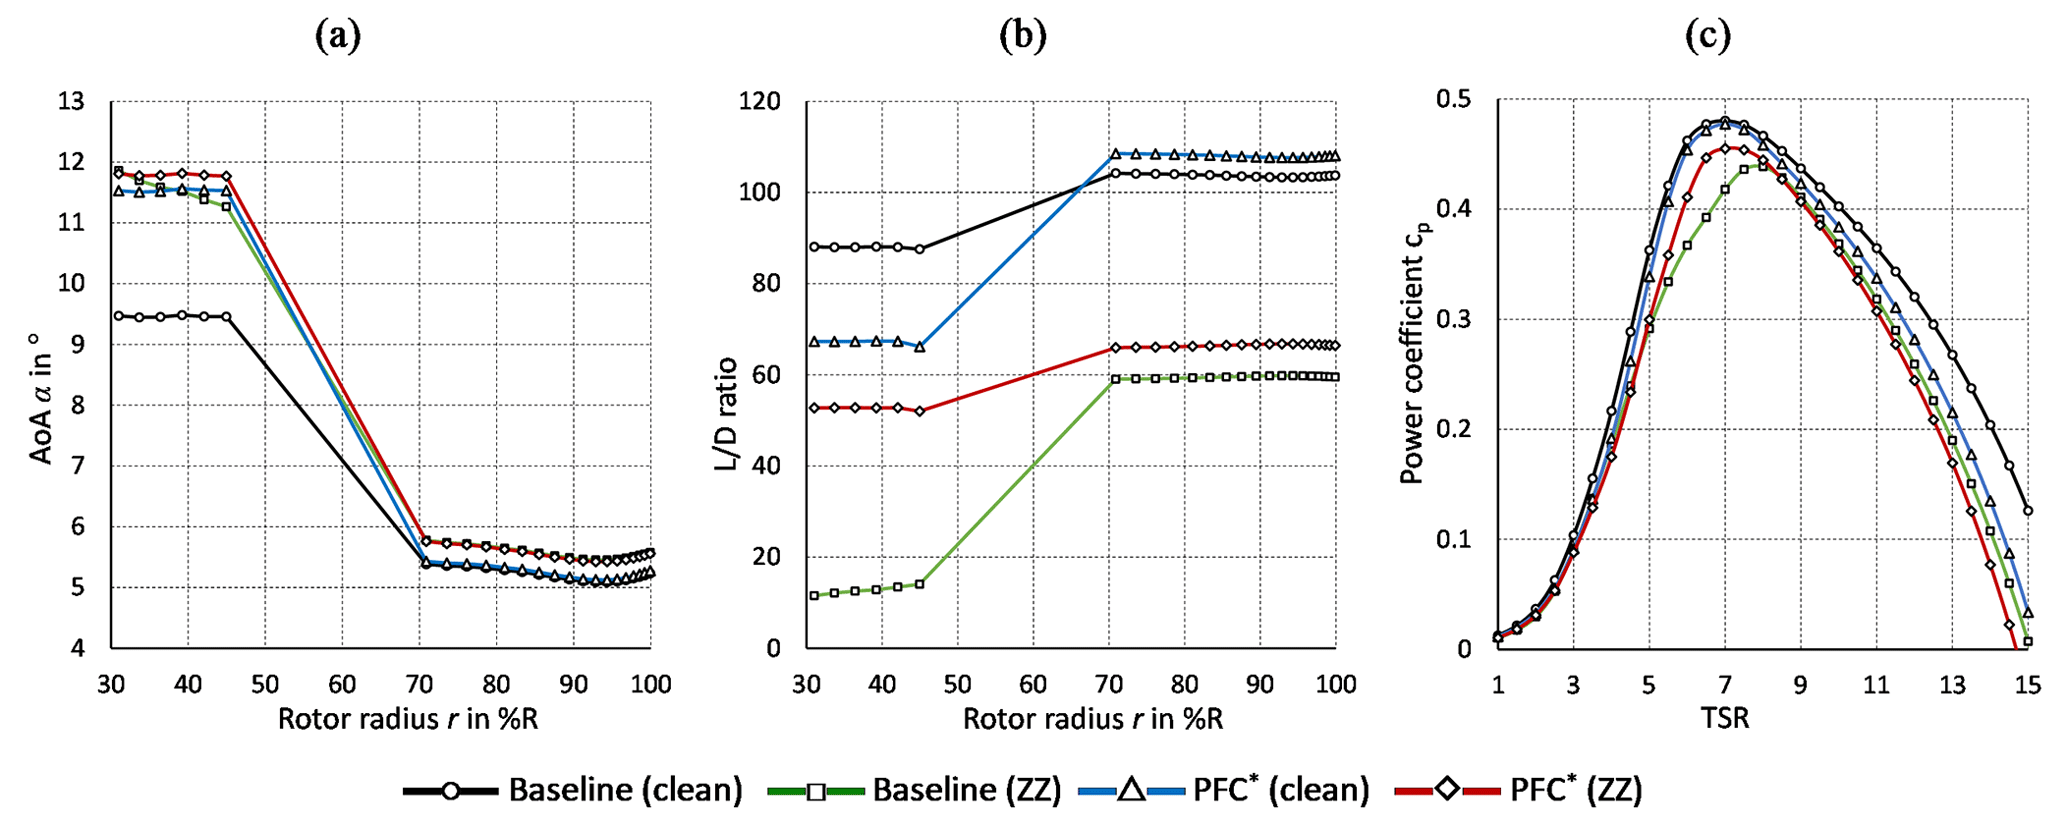
Figure 18Rotor blade performance simulation of the baseline and the new design application. (a) AoA over rotor radius at λopt=7. (b) over rotor radius at λopt=7. (c) Power coefficients over TSR.
This study investigates the use of mini Gurney flaps and their combination with VGs for improved rotor blade performance of wind turbines. GFs and VGs are well-studied PFC devices. However, to the authors' knowledge, there are no scientific reports investigating MGF heights smaller than 0.5 % c and their combination with VGs on dedicated wind turbine airfoils. This study contributes toward closing these research gaps.
To this end, wind tunnel tests are conducted using both the NACA63(3)618 and the DU97W300 airfoil. Lift and drag are measured by means of a force balance and a wake rake, respectively. The baseline results are successfully validated against the literature data. The impact of MGFs and VGs on the polar curves depends on whether transition is free or fixed on the airfoils. The configurations with just the MGFs increase the lift performance under pre-stall conditions. Furthermore, the aerodynamic efficiency is maintained in the clean case and is improved in the tripped case. Looking at the combined configurations, the VG effect is superposed by the MGF effect, leading to both stall delay and the pre-stall lift increase. In the clean case, the aerodynamic efficiency is decreased due to the combined drag penalty, whereas in the tripped case, it is significantly improved. Overall, VGs coupled with MGFs are preferred over the VG (only) configuration due to the additional pre-stall lift increase.
The experimental polar data are imported into the software QBlade in order to design and to simulate a generic rotor blade. The NACA63(3)618 is equipped with the smallest MGF height of 0.25 % c in the tip region. The medium size MGF of 0.5 % c and the VG height of 1.1 % c are both attached to the DU97W300 in the root region. The BEM simulations are based on two case studies, the retrofit application on an existing blade configuration and the new design application on an alternative blade configuration. The retrofit application alleviates the adverse effects of forced leading-edge transition. As such, separation is delayed toward the root and the aerodynamic efficiency and thus power output is recovered toward the tip region. The new design application leads to a more slender blade while maintaining the rotor power. Again, the alternative blade appears to be more resistant against LER effects.
Further research on MGFs and their interaction with VGs is recommended, especially considering LER effects and erosion. The next steps involve the design of sub-boundary layer VGs in conjunction with MGFs to further reduce the drag penalty. Moreover, a complete aeroelastic simulation is required, especially with a view to open field tests of MGFs in combination with VGs on large wind turbine rotor blades.
Following from the experimental setup (see Sect. 3.2) the calculation of the wind tunnel wall effects on the uncorrected lift and drag polars, cl,raw(α) and cd,raw(α), is summarized. According to Barlow et al. (1999), the wind tunnel blockage, ε, is the sum of the solid and the wake blockage factors,
where Λ refers to the so-called body shape factor, which is a function of the maximum airfoil thickness, and hwt is the height of the wind tunnel. For clarity, is introduced as an auxiliary constant.
Based on Eq. (A1), the solid and the wake blockage correction is applied to the following parameters at each static AoA:
where cm refers to the moment coefficient at 0.25 c.
Equations (18) to (22) are embedded into the data post-processing script.
B1 Vortex generators plus Gurney flaps
Figure B1 shows the polar curves of the VG + GF configurations based on the NACA63(3)618. As presented in Sect. 4.2, the VG is superposed by the GF effect, leading to both stall delay and pre-stall lift increase. Compared to the corresponding VG (only) configurations, is maintained in the clean cases and slightly improved in the tripped cases. For clarity, characteristic lift and L/D values are summarized in Table B1.
B2 Rectangular versus triangular Gurney flaps
Timmer and van Rooij (2003) as well as Fuglsang et al. (2003) reported that rectangular and triangular GFs of identical height generate very similar aerodynamic effects, apart from minor differences in drag. In order to verify this observation, the NACA63(3)618 is equipped with angle sections made of brass versus isosceles triangles made of thermoplastic material (see Fig. 1a). In Fig. B2, the lift over the drag coefficients are compared in both the clean and the tripped cases looking at each GF configuration separately. It is noted that the smallest triangular size, % c, is larger than the corresponding rectangular profile, % c. In all cases, the triangular or wedge-shaped profiles show a slight decrease in both lift and drag (see Fig. B2b and c). Apart from this, the effect on the airfoil polars is very similar between both GF profiles.
Table B1NACA63(3)618. Vortex generators plus Gurney flaps. Characteristic values.
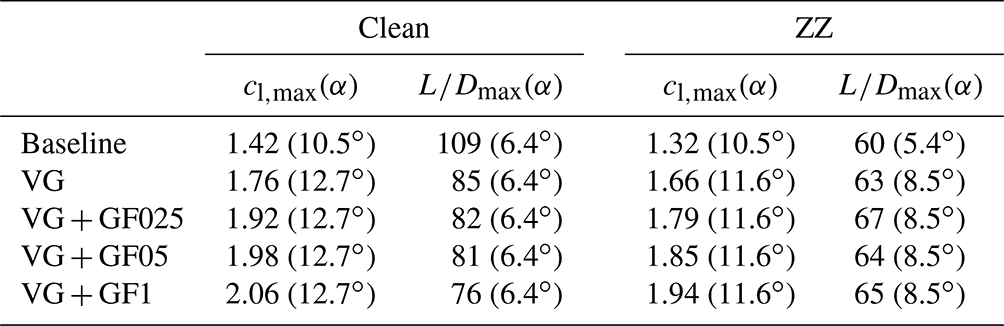
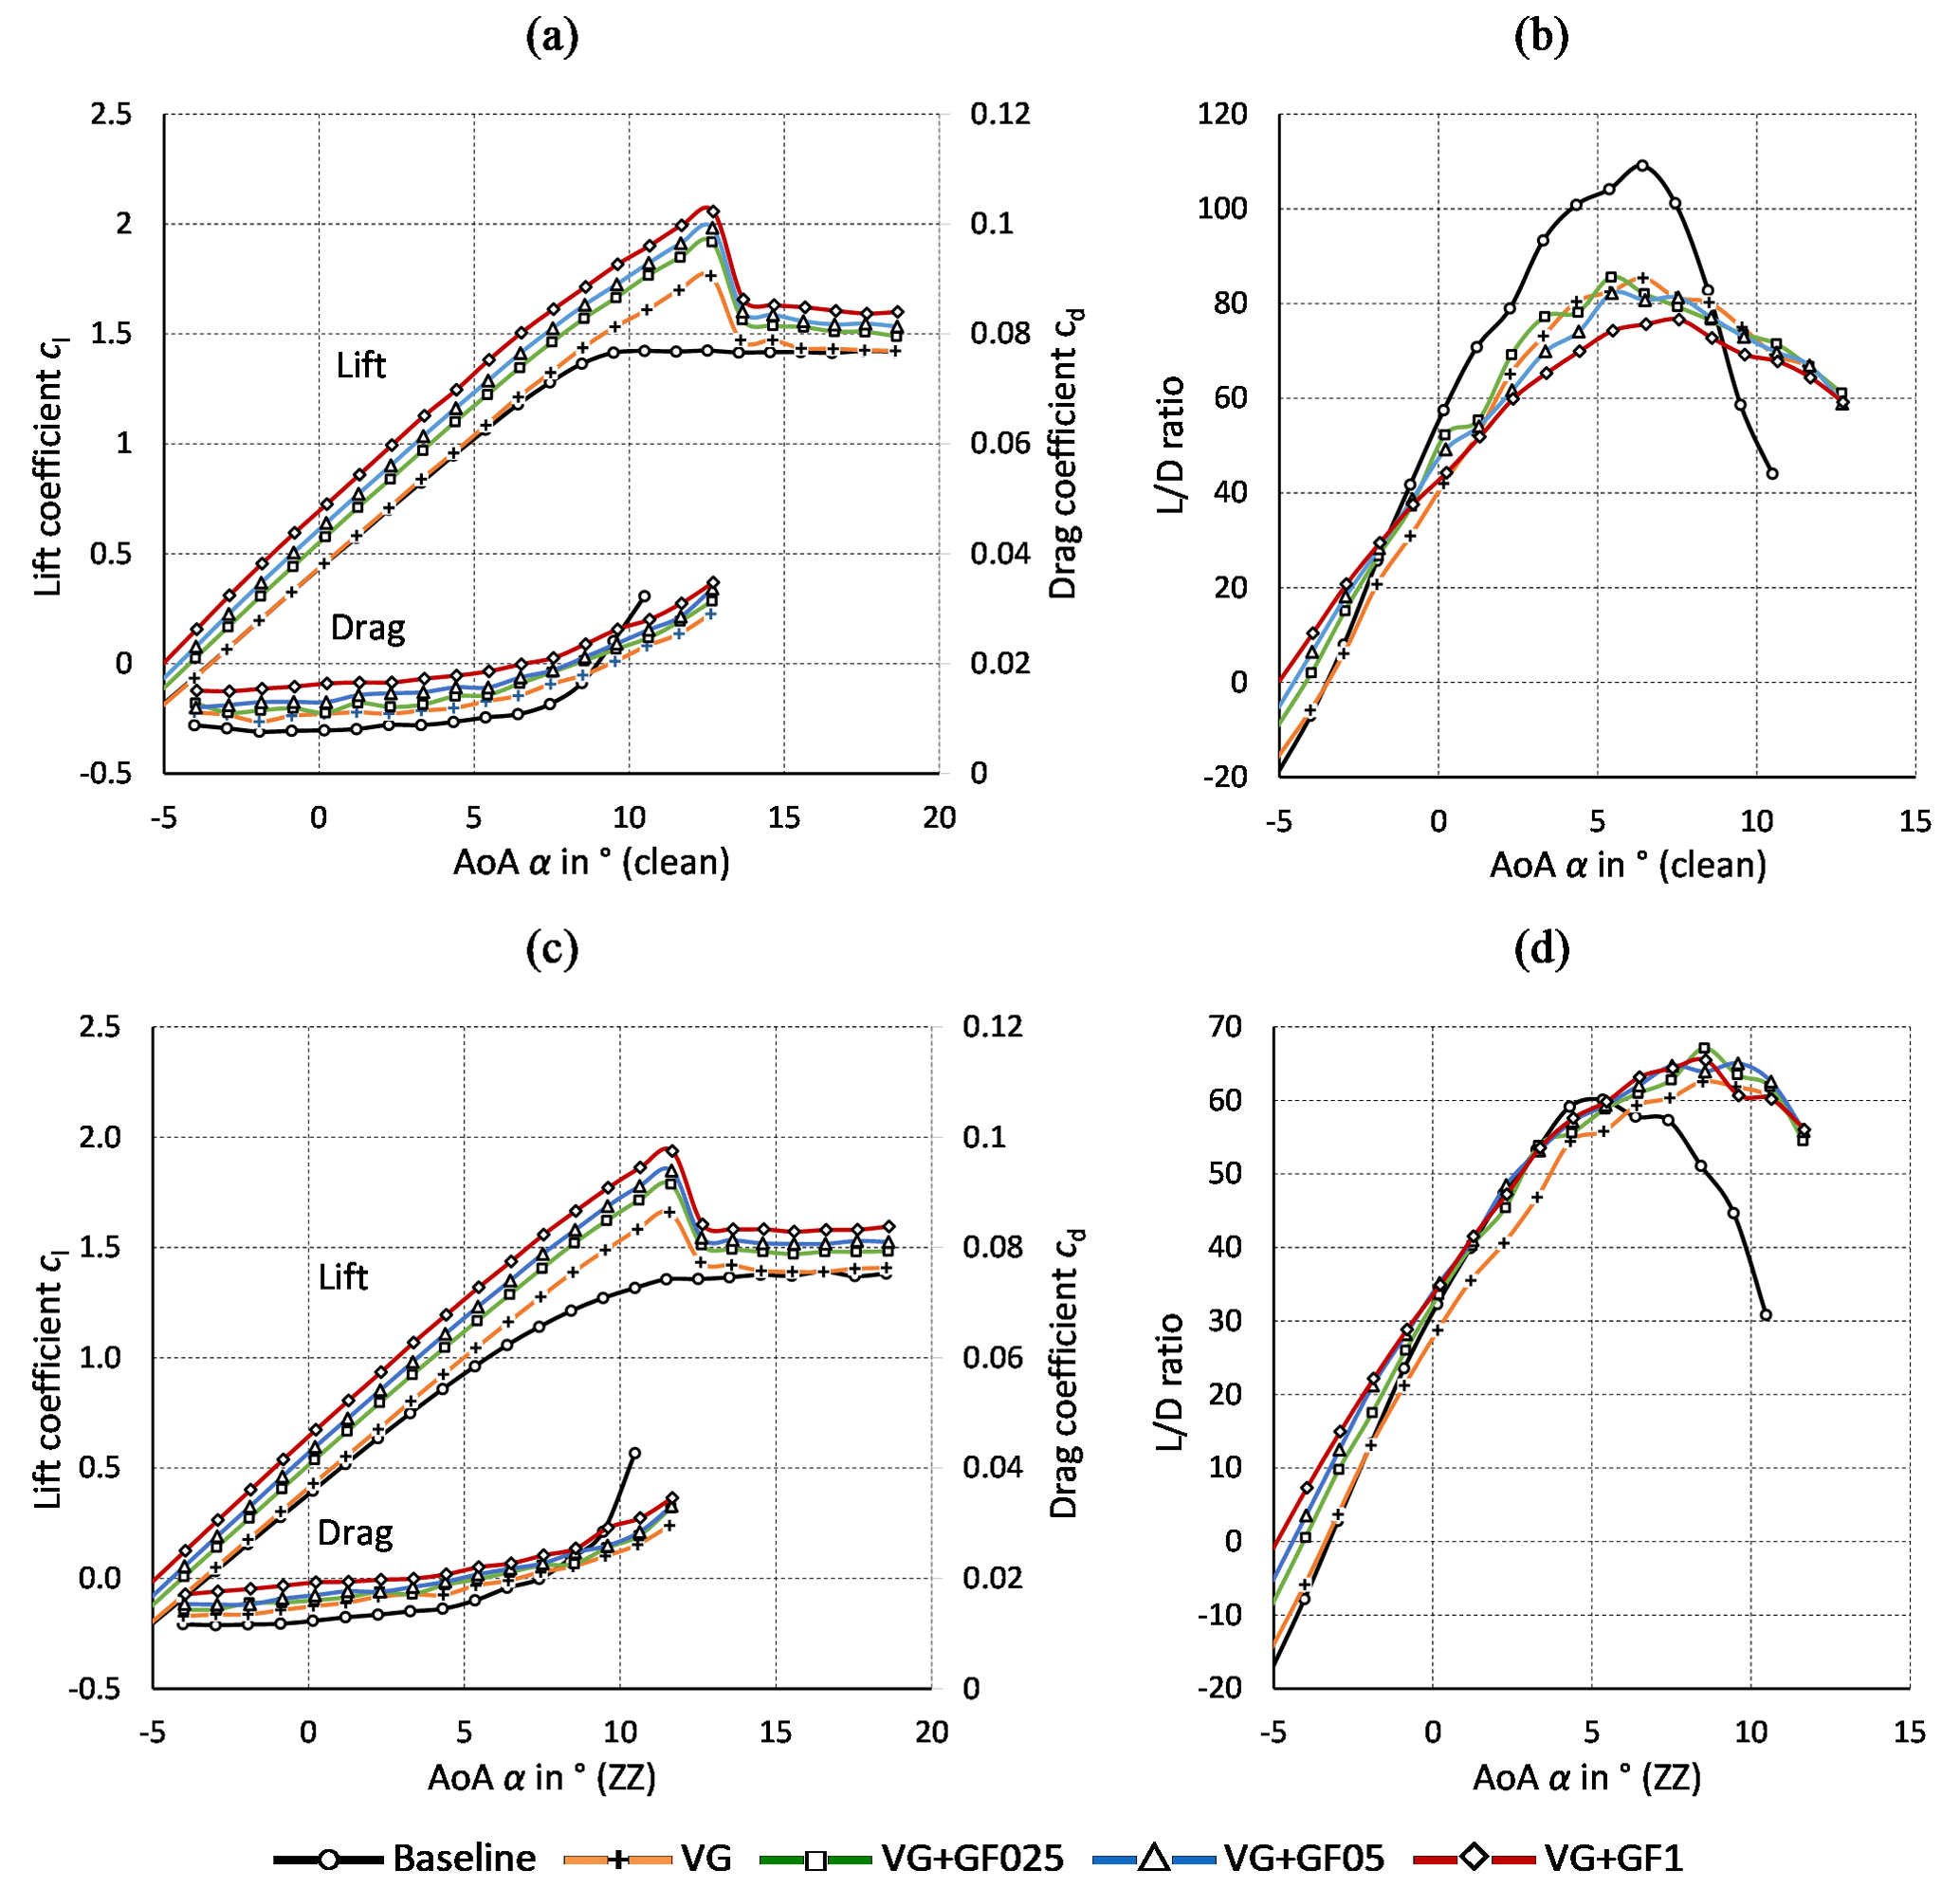
Figure B1NACA63(3)618. Vortex generators and Gurney flaps. (a) Lift and drag coefficients (clean). (b) ratio (clean). (c) Lift and drag coefficients (ZZ). (d) ratio (ZZ).
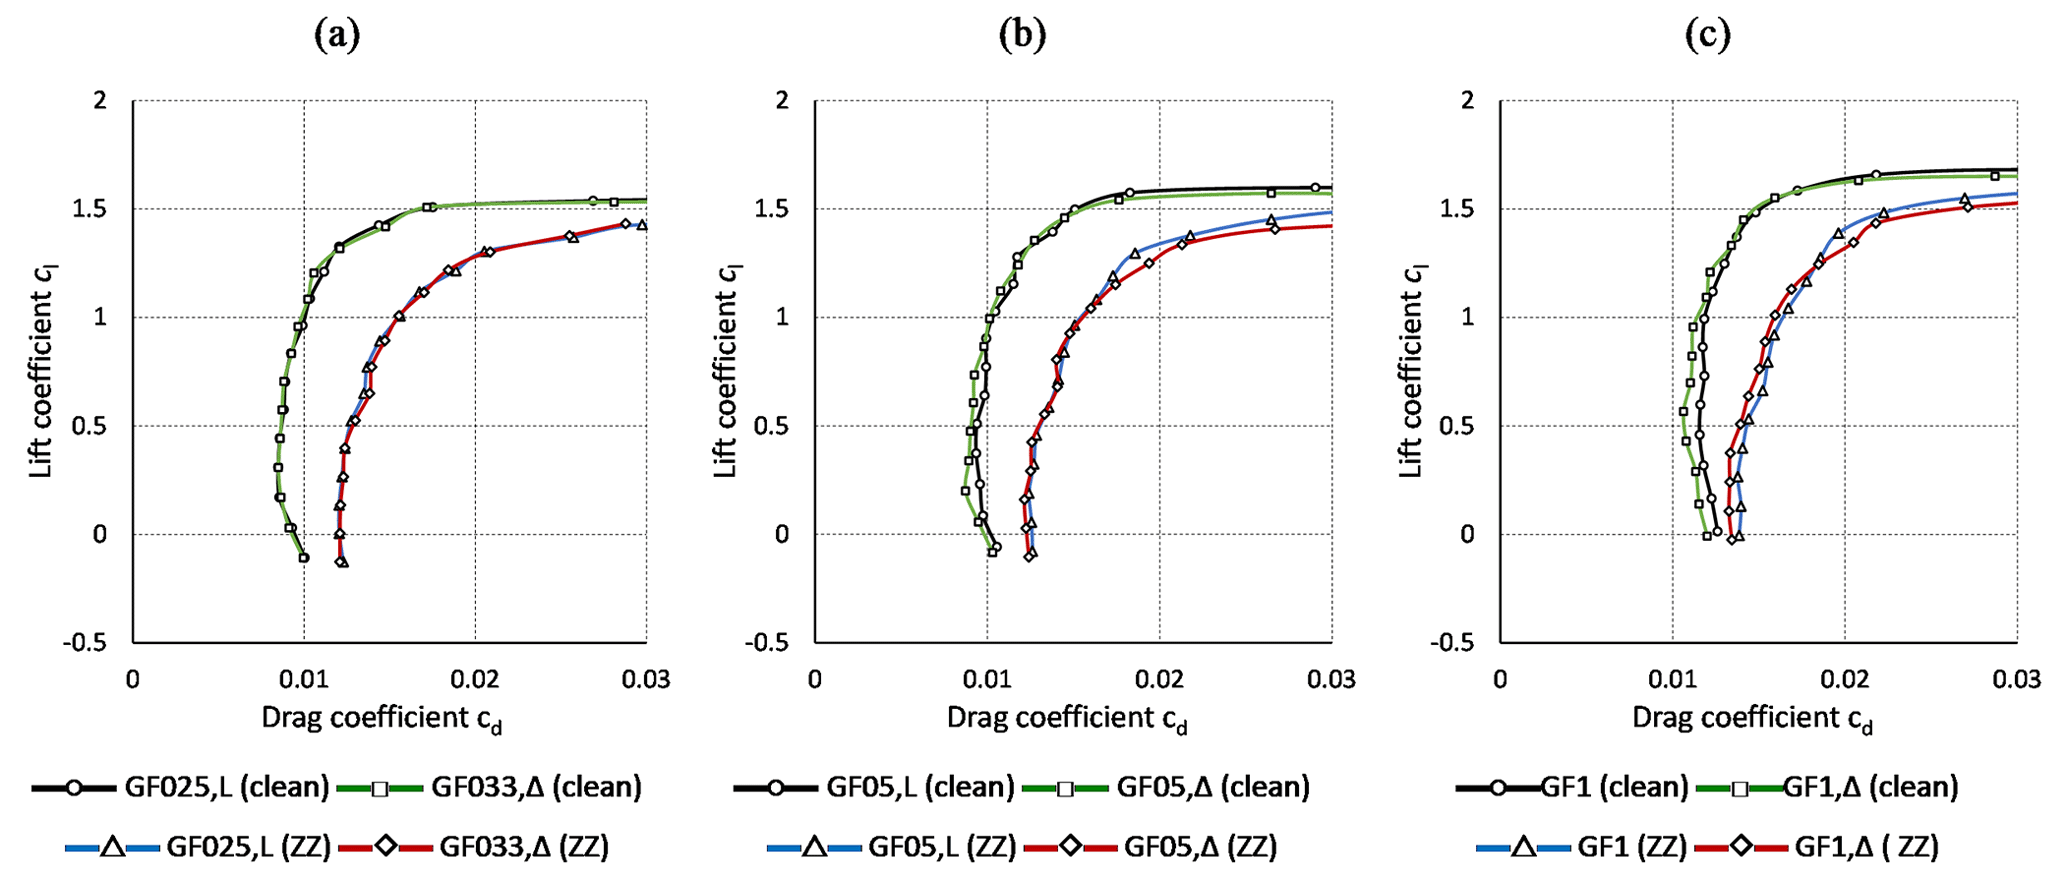
Figure B2NACA63(3)618. Rectangular (L) versus triangular (Δ) Gurney flap profiles. Lift over drag curves in clean and tripped cases (a) % c and % c. (b) hMGF=0.5 % c. (c) hGF=1 % c.
C1 Data validation
The baseline and the VG measurements of the DU97W300 are compared with reference data in order to validate the experimental setup. Baldacchino et al. (2018) performed similar experiments in the low-turbulence wind tunnel of the DU. The airfoil chord length was c=0.65 m (here: 0.6 m) and (here: ) with a free stream turbulence intensity of below 0.1 % (here: 0.3 %). Lift was determined from surface pressure measurements and drag by means of a wake rake, which was positioned at a distance of 60 % c (here: 100 % c) from the airfoil TE. Forced LE transition was triggered by means of ZZ tape with hZZ=0.17 mm at xZZ=5 % c on the suction side, as opposed to the more aggressive tripping of the current setup with hZZ=0.3 mm on both the suction and the pressure sides. The VG configurations included hVG=0.77 % c and D=7hVG at xVG=30 % c, as compared to the current setup with hVG=1.1 % c. Figure C1 shows the direct comparison between the polar data. For clarity, characteristic lift and values are summarized in Table C1.
The lift curves of both the baseline and the VG configurations are in good agreement. However, the stall behavior is smoother in the current measurements. In the clean case, drag is elevated compared to the reference data leading to slightly decreased curves. The main reasons are the differences in the Reynolds number and the inflow turbulence intensity. Furthermore, due to the larger VG height, drag is slightly higher in the pre-stall region, as compared to the DU measurements. In the tripped case, the more pronounced differences in both cd(α) and thus are due to the more aggressive tripping of the current setup. Overall, the results are in very good agreement with the reference data, as highlighted in Table C1.
C2 Gurney flaps
Figure C2 shows the polar curves of the GF configurations based on the DU97W300. As presented in Sect. 4.1, the increase in both lift and drag depends on the GF height and the shape of the polar curves is basically maintained. Furthermore, the beneficial GF effect on the aerodynamic efficiency is more pronounced in the tripped case. Figure C2b shows that, in the clean case, is maintained applying either of the MGFs, whereas it is decreased using the GF1. According to Fig. C2d, the performance deterioration due to forced LE transition is alleviated by all GFs, with GF05 achieving the preferred results in terms of . For clarity, characteristic lift and values are summarized in Table C2.
Table C1DU97W300. Characteristic values. Reference data are adopted from Baldacchino et al. (2018).
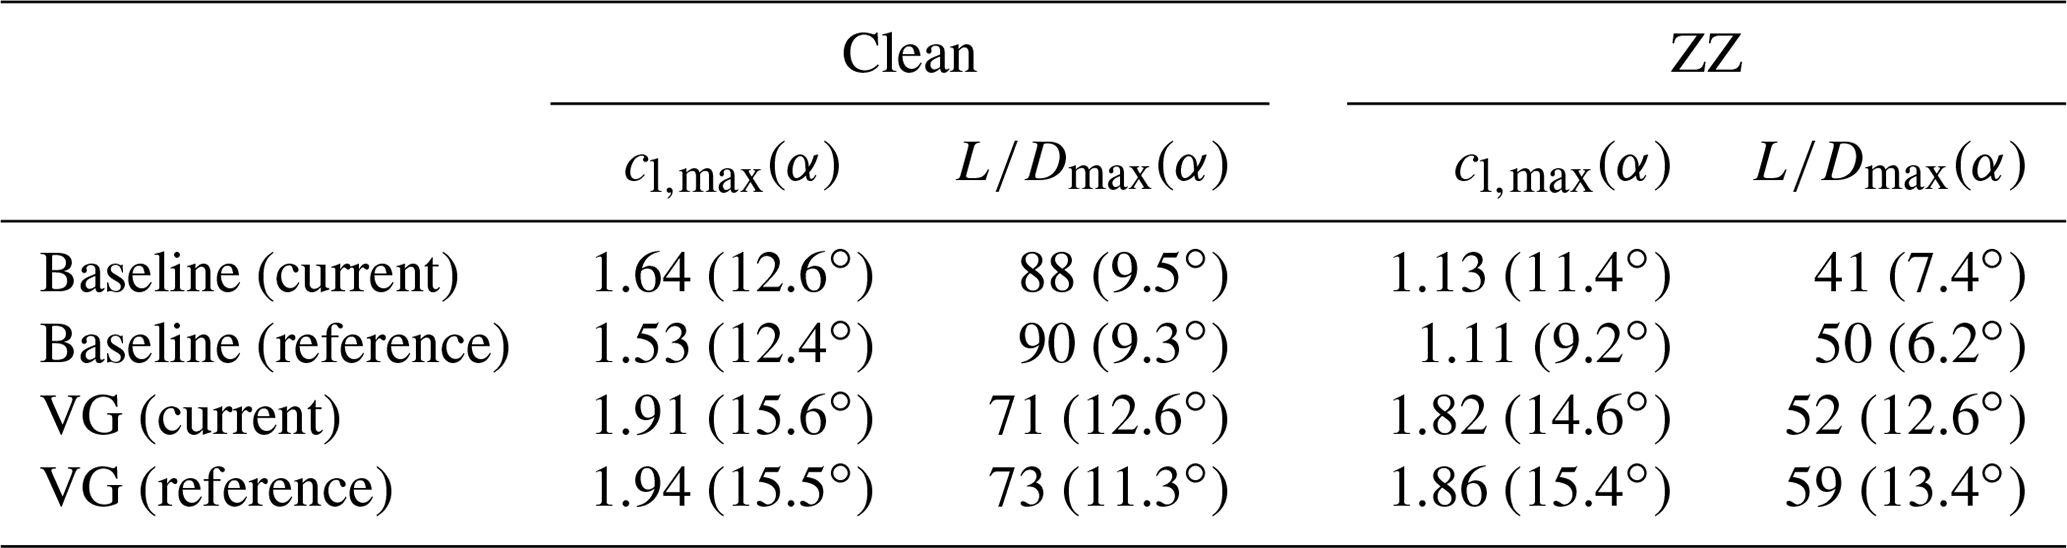
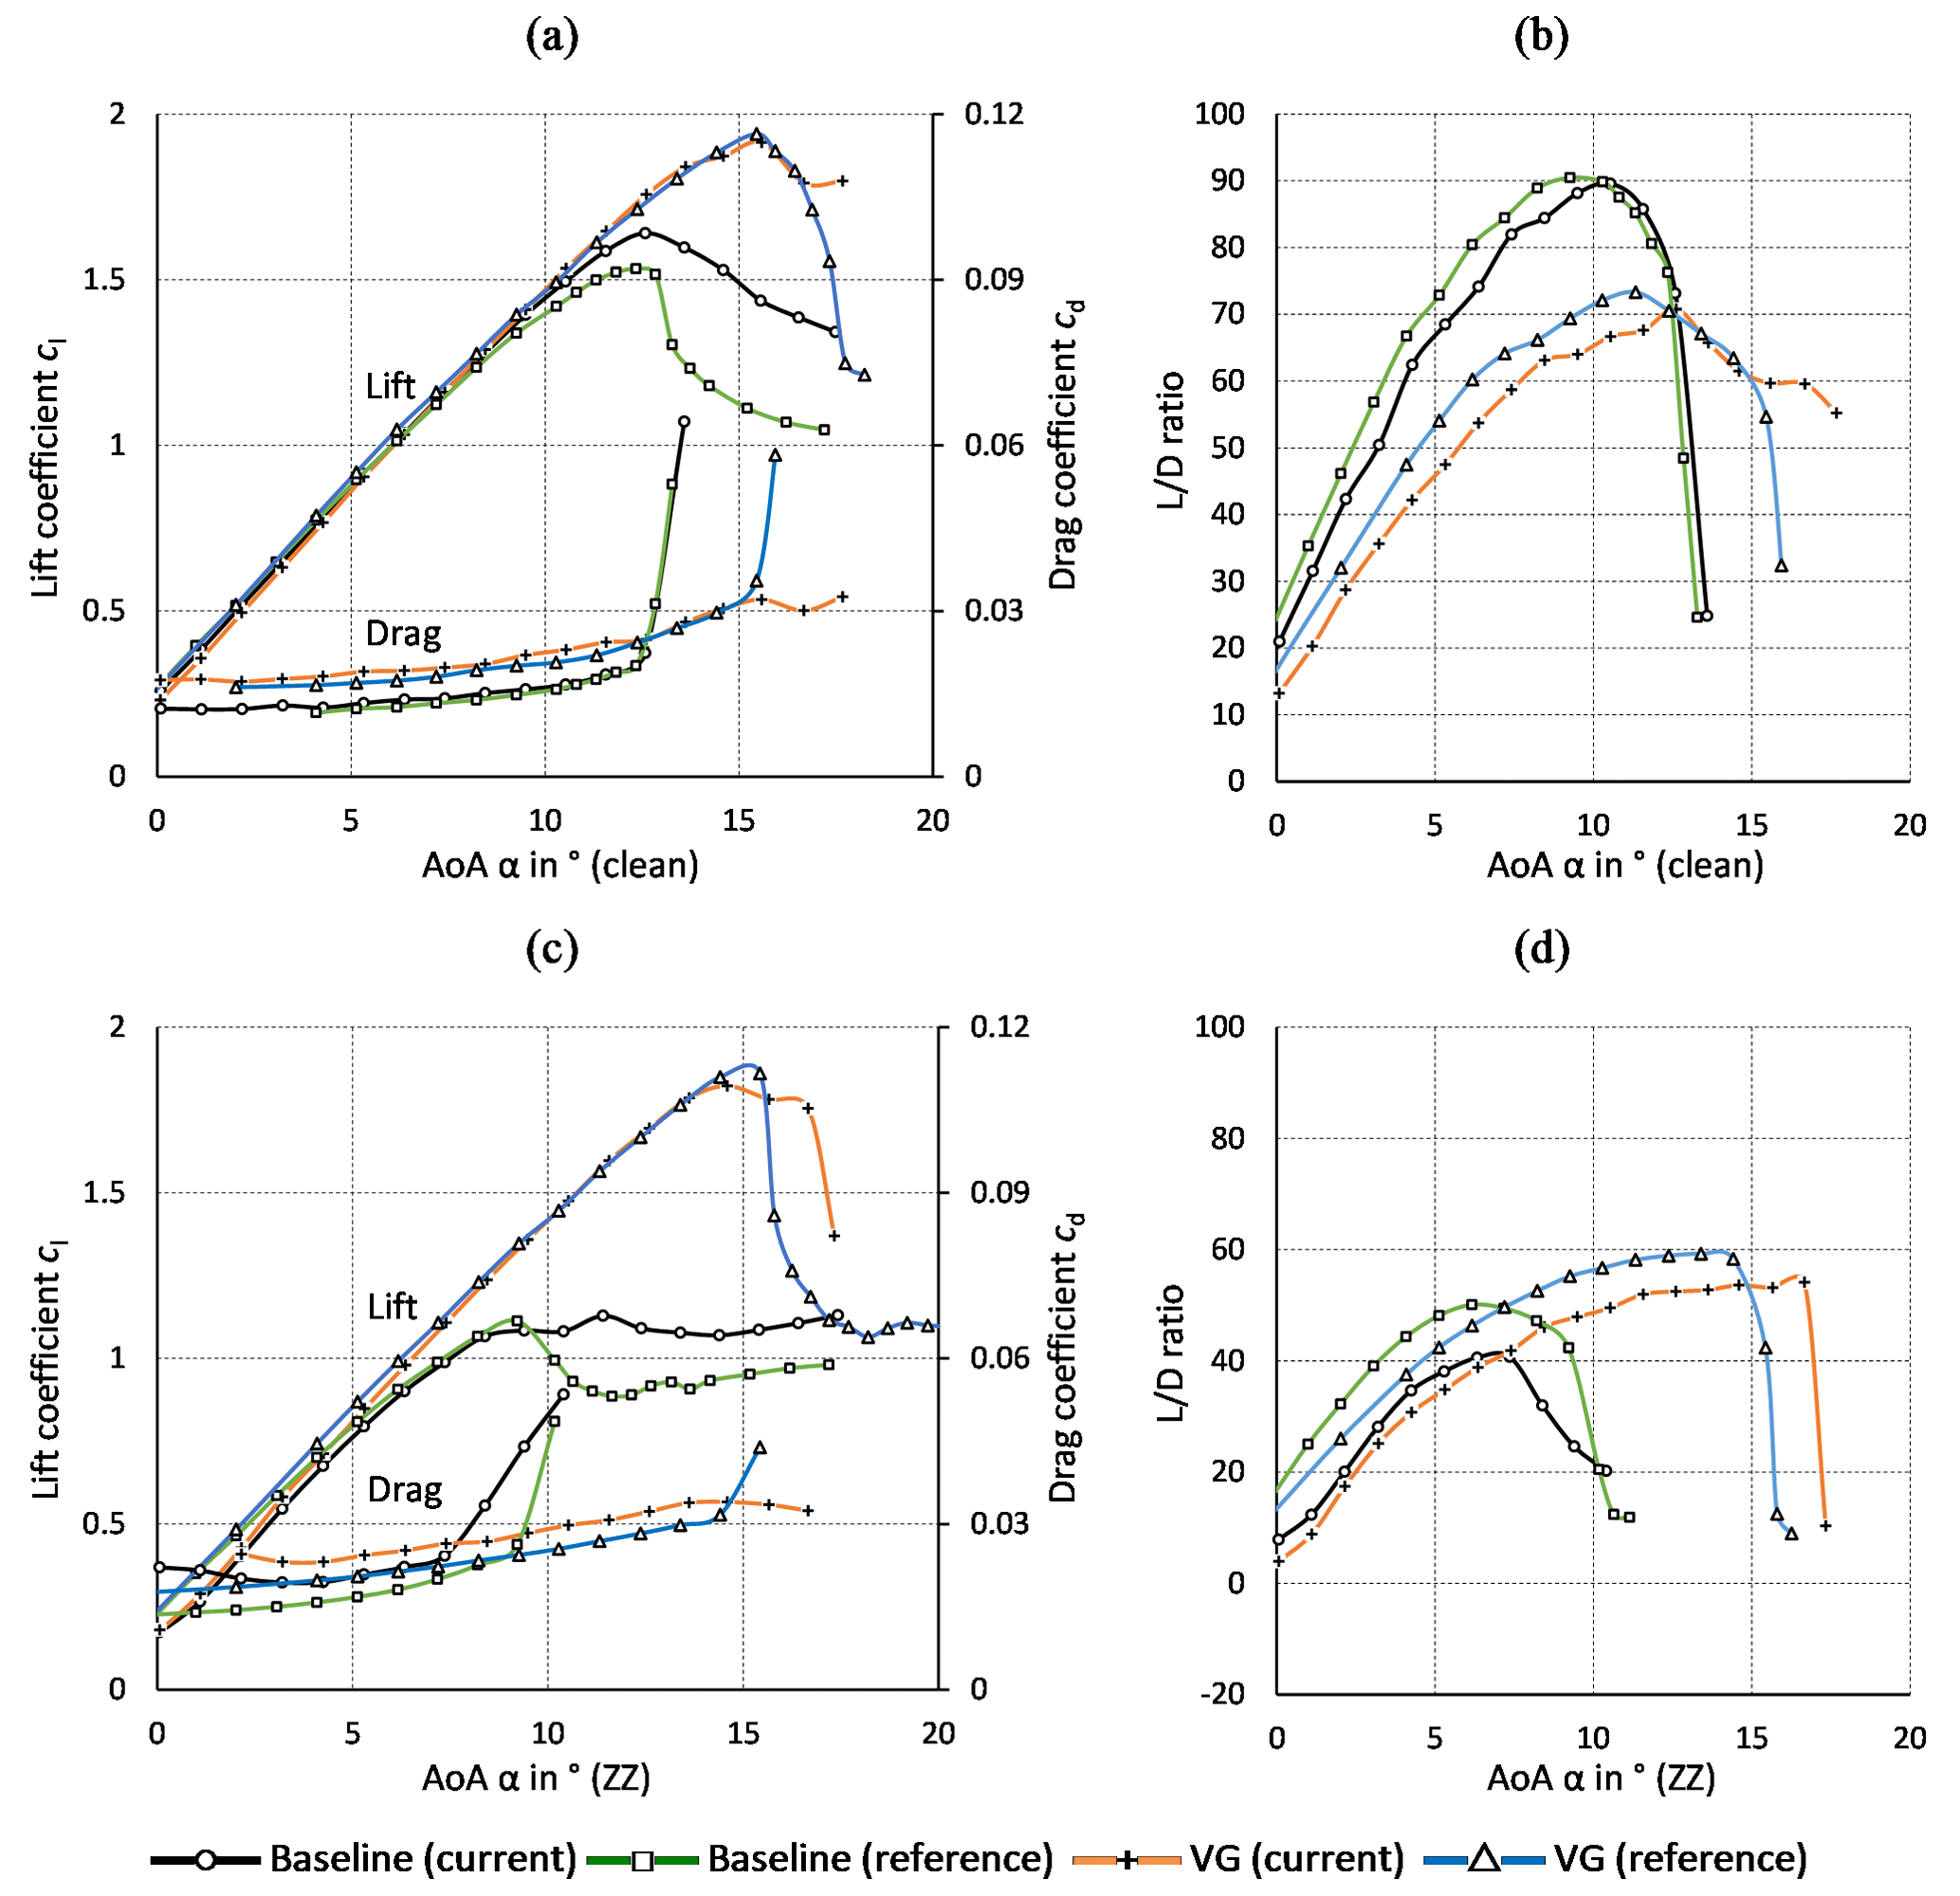
Figure C1DU97W300. Clean and tripped cases. Baseline and VG configurations at compared to reference data from Baldacchino et al. (2018) at . (a) Lift and drag coefficients. (b) Lift to drag ratio.
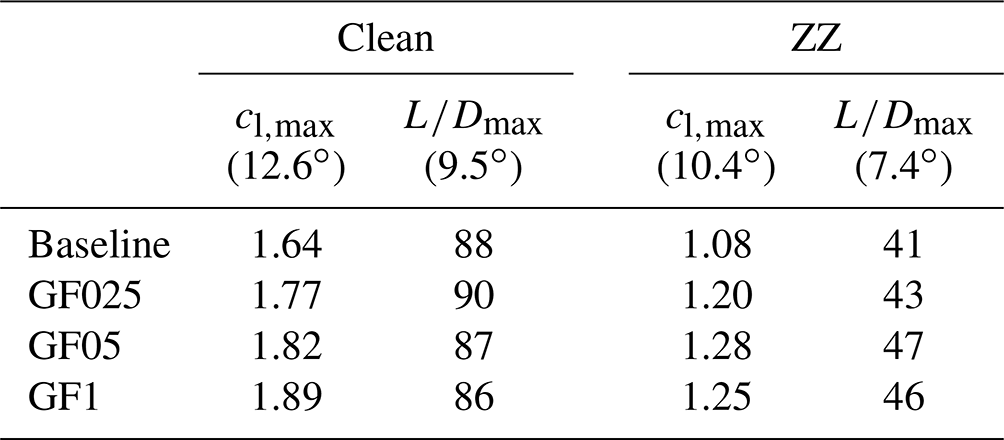

Figure C2DU97W300. Gurney flaps. (a) Lift and drag coefficients (clean). (b) ratio (clean). (c) Lift and drag coefficients (ZZ). (d) ratio (ZZ).
Measurement data and results can be provided by contacting the corresponding author.
JF designed and constructed the wake rake and the vortex generators. JA validated the wake rake measurements and designed the Gurney flaps. JA, MM, GWD, JF and AS prepared and conducted the wind tunnel experiments. JA performed the airfoil and rotor blade simulations. JA and AS processed the experimental and numerical data. JA wrote the manuscript and managed the review process, with the support of all co-authors.
The contact author has declared that neither they nor their co-authors have any competing interests.
Publisher's note: Copernicus Publications remains neutral with regard to jurisdictional claims in published maps and institutional affiliations.
The authors would also like to acknowledge the constant support of the technicians of the Hermann-Föttinger Institut at the Technische Universität Berlin.
This paper was edited by Mingming Zhang and reviewed by Mohammad Mahfouz and one anonymous referee.
Abbott, I. H. and von Doenhoff, A. E.: Theory of Wing Sections, Dover publications, Inc., New York, ISBN 100486605868, 1959.
Alber, J., Pechlivanoglou, G., Paschereit, C. O., Twele, J., and Weinzierl, G.: Parametric Investigation of Gurney Flaps for the Use on Wind Turbine Blades, in: Proceedings of the ASME Turbo Expo 2017, Volume 9, Wind Energy, June 2017, Charlotte, North Carolina, USA, Paper GT2017-64475, https://doi.org/10.1115/GT2017-64475, 2017.
am Brink, B. K.: Trailing edge wedge for an aircraft wing, United States Patent, Patent Number: US 6,382,561 B1, 7 May 2002.
Bach, A. B., Lennie, M., Pechlivanoglou, G., Nayeri, C. N., and Paschereit, C. O.: Finite micro-tab system for load control on a wind turbine, J. Phys.: Conf. Ser., 524, 012082, https://doi.org/10.1088/1742-6596/524/1/012082, 2014.
Bak, C., Zahle, F., Bitsche, R., Kim, T., Yde, A., Henriksen, L. C., Natarajan, A., and Hansen, M.: Description of the DTU 10 MW Reference Wind Turbine, DTU Wind Energy Report-I-0092, Technical University of Denmark, DTU, June 2013.
Bak, C., Skrzypiński, W., Gaunaa, M., Villanueva, H., Brønnum, N. F., and Kruse, E. K.: Full scale wind turbine test of vortex generators mounted on the entire blade, J. Phys.: Conf. Ser., 753, 022001, https://doi.org/10.1088/1742-6596/753/2/022001, 2016.
Bak, C., Skrzypiński, W., Fischer, A., Gaunaa, M., Brønnum, N. F., and Kruse, E. K.: Wind tunnel tests of an airfoil with 18 % relative thickness equipped with vortex generators, J. Phys.: Conf. Ser., 1037, 022044, https://doi.org/10.1088/1742-6596/1037/2/022044, 2018.
Baldacchino, D., Ferreira, C., de Tavernier, D., Timmer, W. A., and van Bussel, G. J. W.: Experimental parameter study for passive vortex generators on a 30 % thick airfoil, Wind Energy, 21, 745–765, https://doi.org/10.1002/we.2191, 2018.
Barlas, T. K. and van Kuik, G. A. M.: Review of state of the art in smart rotor control research for wind turbines, Prog. Aerosp. Sci.,46, 1–27, https://doi.org/10.1016/j.paerosci.2009.08.002, 2010.
Barlow, J. B., Rae, W. H., and Pope, A.: Low-Speed Wind Tunnel Testing, 3rd Edn., John Wiley & Sons, USA, https://doi.org/10.2514/2.633, 1999.
Bechert, D., Meyer, R., and Hage, W.: Airfoil with performance enhancing trailing edge, Europäische Patentschrift, Patent Number: 01250001.3, 2 January 2001.
Bechert, D. W., Meyer, R., and Hage, W.: Drag reduction of airfoils with miniflaps – Can we learn from dragonflies?, in: AIAA Fluids 2000 Conference and Exhibit, Paper 2000-2315, June 2000, Denver, USA, https://doi.org/10.2514/6.2000-2315, 2000.
Boyd, J. A.: Trailing edge device for an airfoil, United States Patent, Patent Number: 4,542,868, 24 September 1985.
Cole, J. A., Vieira, B. A. O., Coder, J. G., Premi, A., and Maughmer, M. D.: Experimental Investigation into the Effect of Gurney Flaps on Various Airfoils, J. Aircraft, 50, 1287–1294, https://doi.org/10.2514/1.C032203, 2013.
Drela, M.: XFOIL: An Analysis and Design System for Low Reynolds Number Airfoils, in: Low Reynolds Number Aerodynamics, Vol. 54, edited by: Mueller, T. J., Springer, Berlin, Heidelberg, https://doi.org/10.1007/978-3-642-84010-4_1, 1989.
Fuglsang, P., Bak, C., Gaunaa, M., and Antoniou, I.: Wind tunnel tests of Risø-B1-18 and Risø-B1-24, Risoe-R-1375(EN), Forskningscenter Risoe, https://orbit.dtu.dk/en/publications/wind-tunnel-tests-of-risø-b1-18-and-risø-b1-24 (last access: 29 April 2022), 2003.
Fuglsang, P., Bak, C., Gaunaa, M., and Antoniou, I.: Design and Verification of the Risø-B1 Airfoil Family for Wind Turbines, ASME, J. Sol. Energ. Eng., 126, 1002–1010, https://doi.org/10.1115/1.1766024, 2004.
Gasch, R. and Twele, J.: Wind Power Plants – Fundamentals, Design, Construction and Operation, Springer-Verlag, Berlin, Heidelberg, https://doi.org/10.1007/978-3-642-22938-1, 2012.
Giguère, P., Lemayt, J., and Dumas, G.: Gurney flap effects and scaling for low-speed airfoils, in: 13th AIAA Applied Aerodynamics Conference, June 1995, San Diego, USA, Paper 1995-1881-CP, https://doi.org/10.2514/6.1995-1881, 1995.
González-Salcedo, Á., Croce, A., León, C. A., Nayeri, C. N., Baldacchino, D., Vimalakanthan K., and Barlas, T.: Blade Design with Passive Flow Control Technologies, in: Handbook of Wind Energy Aerodynamics, edited by: Stoevesandt, B., Schepers, G., Fuglsang, P., and Yuping, S., Springer, Cham, 11–16, https://doi.org/10.1007/978-3-030-05455-7_6-1, 2020.
Gruschwitz, E. and Schrenk, O.: A simple method for increasing the lift of airplane wings by means of flaps, N.A.C.A. Technical Memorandum No. 714, National Advisory Committee for Aeronautics, Washington, https://ntrs.nasa.gov/citations/19930094703 (last access: 29 April 2022), 1933.
Hansen, M. O. L.: Aerodynamics of Wind Turbines, 3rd Edn., Earthscan from Routledge, Taylor & Francis Group, London, UK, https://doi.org/10.4324/9781315769981, 2015.
Henne, P. A. and Gregg, R. D.: Divergent trailing-edge airfoil, United States Patent, Patent Number: 4,858,852, 22 August 1989.
Jeffrey, D., Zhan, X., and Hurst, D. W.: Aerodynamics of Gurney Flaps on a Single-Element High-Lift Wing, J. Aircraft, 37, 295–301, https://doi.org/10.2514/2.2593, 2000.
Jonkman, J., Butterfield, S., Musial, W. and Scott, G.: Definition of a 5-MW Reference Wind Turbine for Offshore System Development, Technical Report NREL/TP-500-38060, NREL – National Renewable Energy Lab., https://doi.org/10.2172/947422, 2009.
Kentfield, J.: The Influence of Free-Stream Turbulence Intensity on the Performance of Gurney-Flap Equipped Wind-Turbine Blades, Wind Engineering, https://www.jstor.org/stable/43749607 (last access: 27 Ocotber 2015), 1996.
Liebeck, R. H.: Design of Subsonic Airfoils for High Lift, in: 9th AIAA Fluid and Plasma Dynamics Conference, Vol. 15, San Diego, USA, Paper 76-406, https://doi.org/10.2514/3.58406, 1978.
Lin, J. C.: Review of research on low-profile vortex generators to control boundary-layer separation, Prog. Aerosp. Sci., 38, 389–420, https://doi.org/10.1016/S0376-0421(02)00010-6, 2002.
Li-shu, H., Chao, G., Wen-Ping, S., and Ke, S.: Airfoil flow control using vortex generators and a Gurney flap, J. Mech. Eng. Sci., 227, 2701–2706, https://doi.org/10.1177/0954406213478533, 2013.
Maniaci, D. C., Westergaard, C., Hsieh, A., and Paquette, J. A.: Uncertainty Quantification of Leading Edge Erosion Impacts on Wind Turbine Performance, J. Phys.: Conf. Ser., 1618, 052082, https://doi.org/10.1088/1742-6596/1618/5/052082, 2020.
Manolesos, M. and Voutsinas, S. G.: Experimental investigation of the flow past passive vortex generators on an airfoil experiencing three-dimensional separation, J. Wind Eng. Indust. Aerodynam., 142, 130–148, https://doi.org/10.1016/j.jweia.2015.03.020, 2015.
Marten, D.: QBlade: A Modern Tool for the Aeroelastic Simulation of Wind Turbines, Doctoral Thesis, Technische Universität Berlin, Berlin, https://doi.org/10.14279/depositonce-10646, 2020.
Marten, D., Wendler, J., Pechlivanoglou, G., Nayeri, C. N., and Paschereit, C. O.: Development and Application of a Simulation Tool for Vertical and Horizontal Axis Wind Turbines, in: ASME Turbo Expo 2013, Volume 8, San Antonio, Texas, USA, Paper GT2013-94979, https://doi.org/10.1115/GT2013-94979, 2013.
Meyer, R., K., J.: Experimentelle Untersuchungen von Rückstromklappen auf Tragflügeln zur Beeinflussung von Strömungsablösungen, PhD Thesis, Hermann-Föttinger-Institut für Strömungsmechanik, Technische Universität Berlin, Berlin, https://www.dlr.de/at/PortalData/2/Resources/dokumente/at/promotion_meyer.pdf (last access: 29 April 2022), 2000.
Meyer, R., Hage, W., Bechert, D. W., Schatz, M., and Thiele, F.: Drag Reduction on Gurney Flaps by Three-Dimensional Modifications, J. Aircraft, 43, 132–140, https://doi.org/10.2514/1.14294, 2006.
Mueller-Vahl, H., Pechlivanoglou, G., Nayeri, C. N., and Paschereit, C. O.: Vortex Generators for Wind Turbine Blades: A combined Wind Tunnel and Wind Turbine Parametric Study, in: ASME Turbo Expo, GT2012-69197, https://doi.org/10.1115/GT2012-69197, 2012.
Oerlemans S., Fisher, M., Maeder, T., and Kögler, K.: Reduction of Wind Turbine Noise Using Optimized Airfoils and Trailing-Edge Serrations, AIAA J., 47, 1470–1481, https://doi.org/10.2514/1.38888, 2009.
Papi, F., Balduzzi, F., Ferrara, G., and Bianchini, A.: Uncertainty quantification on the effects of rain-induced erosion on annual energy production and performance of a Multi-MW wind turbine, Renew. Energy, 165, 701–715, https://doi.org/10.1016/j.renene.2020.11.071, 2021.
Pechlivanoglou, G.: Passive and active flow control solutions for wind turbine blades, PhD Thesis, Fakultät V – Verkehrs- und Maschinensysteme, Technische Universität Berlin, Berlin, https://doi.org/10.14279/DEPOSITONCE-3487, 2013.
Schatz, M., Günther, B., and Thiele, F.: Numerical Simulation of the Unsteady Wake behind Gurney-Flaps, https://www.cfd.tu-berlin.de/research/flowcontrol/gurneys_en/ (last access: 17 October 2020), 2004a.
Schatz, M., Günther, B., and Thiele, F.: Computational modelling of the unsteady wake behind Gurney-flaps, in: 2nd AIAA Flow Control Conference, June 2004, Portland, Oregon, USA, Paper 2004-2417, https://doi.org/10.2514/6.2004-2417, 2004b.
Schlichting, H. and Gersten, K.: Boundary-Layer Theory, Edition Number 9, Springer-Verlag, Berlin, Heidelberg, https://doi.org/10.1007/978-3-662-52919-5, 2000.
Schmitz, G.: Theorie und Entwurf von Windrädern optimaler Leistung (Theory and design of windwheels with an optimum performance), 5. Jahrgang, Wiss. Zeitschrift der Universität Rostock, Rostock, 1955/1956.
SMART BLADE: Vortex Generators, https://www.smart-blade.com/vortex-generators, last access: 17 October 2021.
Storms, B. L. and Jang, C. S.: Lift Enhancement of an Airfoil Using a Gurney Flap and Vortex Generators, in: 31st AIAA Aerospace Sciences Meeting, May 1994, Reno, Nevada, USA, Paper 93-0647, https://doi.org/10.2514/3.46528, 1994.
Timmer, W. A.: An overview of NACA 6-digit airfoil series characteristics with reference to airfoils for large wind turbine blades, in: 47th AIAA Aerospace Sciences Meeting, January 2009, Orlando, Florida, AIAA 2009-268, https://doi.org/10.2514/6.2009-268, 2009.
Timmer, W. A. and Schaffarczyk, A. P.: The effect of roughness at high Reynolds numbers on the performance of aerofoil DU 97-W-300Mod, Wind Energy, 7, 295–307, https://doi.org/10.1002/we.136, 2004.
Timmer, W. A. and van Rooij, R. P. J. O. M.: Summary of the Delft University Wind Turbine Dedicated Airfoils, ASME, J. Sol. Energ. Eng., 125, 488–496, https://doi.org/10.1115/1.1626129, 2003.
van Rooij, R. P. J. O. M. and Timmer, W. A.: Roughness Sensitivity Considerations for Thick Rotor Blade Airfoils, in: 41st Aerospace Science Meeting and Exhibit, January 2003, Reno, Nevada, USA, AIAA Paper 2003-0350, https://doi.org/10.2514/6.2003-350, 2003.
Vestas: Aerodynamic upgrades, PowerPlusTM case study, https://nozebra.ipapercms.dk/Vestas/Communication/Productbrochure/ProductImprovements/aerodynamic-upgrades-case-study/ (last access: 17 March 2022), 2019.
Wang, J. J., Li, Y. C., and Choi, K.-S.: Gurney flap – Lift enhancement, mechanisms and applications, Prog. Aerosp. Sci., 44, 22–47, https://doi.org/10.1016/j.paerosci.2007.10.001, 2008.
Wilcox, B. J., White, E. B., and Maniaci, D. C.: Roughness Sensitivity Comparisons of Wind Turbine Blade Sections, Sandia Report, SAND2017-11288, https://doi.org/10.2172/1404826, 2017.
Zaparka, E. F.: Aircraft and control thereof, United States Patent, Re. 19,412, Original No. 1,893,065, 1 January 1935.
- Abstract
- Introduction
- Airfoil simulations
- Experimental setup
- Experimental results
- Rotor blade performance
- Conclusions
- Appendix A: Wind tunnel corrections
- Appendix B: NACA63(3)618
- Appendix C: DU97W300
- Data availability
- Author contributions
- Competing interests
- Disclaimer
- Acknowledgements
- Review statement
- References