the Creative Commons Attribution 4.0 License.
the Creative Commons Attribution 4.0 License.
 | 23 Nov 2023
Wind vane correction during yaw misalignment for horizontal-axis wind turbines
Leo Höning
Paul Hulsman
Laura J. Lukassen
Christof Moldenhauer
Martin Kühn
This paper investigates the accuracy of wind direction measurements for horizontal-axis wind turbines and their impact on yaw control. The yaw controller is crucial for aligning the rotor with the wind direction and optimizing energy extraction. Wind direction is conventionally measured by one or two wind vanes located on the nacelle, but the proximity of the rotor can interfere with these measurements. The authors show that the conventional corrections, including low-pass filters and calibrated offset correction, are inadequate to correct a systematic overestimation of the wind direction deviation caused by the rotor misalignment. This measurement error can lead to an overcorrection of the yaw controller and, thus, to an oscillating yaw behaviour, even if the wind direction is relatively steady. The authors present a theoretical basis and methods for quantifying the wind vane measurement error and validate their findings using computational fluid dynamics simulations and operational data from two commercial wind turbines. Additionally, the authors propose a correction function that improves the wind vane measurements and demonstrate its effectiveness in two free-field experiments. Overall, the paper provides new insights into the accuracy of wind direction measurements and proposes solutions to improve the yaw control for horizontal-axis wind turbines.
- Article
(3341 KB) - Full-text XML
- BibTeX
- EndNote


Wind turbines are becoming an increasingly important renewable energy source, and their widespread adoption depends on their performance and efficiency. One crucial factor affecting the performance of horizontal-axis wind turbines is the alignment of the rotor with the incoming wind direction. The turbine can only achieve its highest possible power coefficient when facing the wind directly. Even minor misalignment can impair its ability to convert the wind's kinetic energy into electricity and can result in uneven forces on the blades, leading to increased fatigue loads. In certain circumstances, the turbine's intentional misalignment can manipulate the wake to reduce the impact on downstream turbines. This approach is called active wake deflection, and we discuss it briefly below. However, even for this specific mode of operation, accurately estimating the wind turbine's alignment is crucial. The standard procedure to determine the alignment involves using one or two wind vanes to detect deviations from the wind direction and adjust the yaw angle of the turbine accordingly through an active yaw manoeuvre. During commissioning, the wind vanes are oriented along the rotor axis, followed by offset correction calibration to account for wake rotation over the nacelle, thereby achieving the most precise alignment of the wind turbine in the flow direction for a wind direction deviation of 0∘. The IEC 61400-12-3 standard for measurement-based site calibration (International Electrotechnical Commission, 2022) provides guidelines for measuring, analysing, and reporting site calibration in power performance testing for wind turbines. However, due to the intricate flow field surrounding the turbine and associated wake effects, this still poses a significant challenge. The question arises as to whether it is possible to reduce uncertainties and calibrate the wind vane to achieve better wind turbine alignment without resorting to additional or external measuring systems. In this way, on the one hand, a higher power yield could be achieved, and, on the other hand, the yaw activity could be reduced, which would protect the yaw motors and brakes and, thus, increase their lifetime.
In Kragh and Fleming (2012), an amplification of the wind direction deviation behind the rotor of a test turbine was pointed out, which is correlated to the rotor speed. A linear correction function depending on the rotor speed was presented, which was used to improve the measured wind direction deviation of the test turbine. Mittelmeier and Kühn (2018) presented a three-step method based on supervisory control and data acquisition (SCADA) data to detect changes in the wind turbine alignment during the operational lifetime and to improve the alignment.
Additional temporary or permanent measurement devices, such as spinner anemometry by ultrasonic sensors (Pedersen et al., 2014), nacelle-based lidars (Held and Mann, 2019), or monitoring of cyclic blade root bending moments (Bertelè et al., 2017; Schreiber et al., 2020) have been proposed to improve the alignment.
A subject of extensive scientific research for several years has been the active wake deflection (Gebraad et al., 2016; Rott et al., 2018; Bromm et al., 2018). Especially for this kind of control, a well-calibrated wind vane is essential, as this method, in particular, requires specific misalignments to be maintained.
Recently Simley et al. (2021) have reported that during experiments on a Senvion MM82 wind turbine, it was observed that the wind vane overestimated the wind direction deviation compared to nacelle-based lidar measurements. A linear wind-speed-dependent transfer function was proposed to correct the wind vane. Simley et al. have suggested that more complex functions may be more appropriate for future yaw controllers, and more research is needed in this area.
Nevertheless, many questions remain unanswered, such as the occurrence and causes of deterministic errors in the wind vane and how the wind vane could be calibrated or corrected to achieve better performance for regular operation or specific control techniques such as active wake deflection.
Our study investigates the yaw behaviour of two commercial wind turbine types. We observe the wind vane signal before and after a yaw manoeuvre and compare the obtained wind direction with a reference signal from a nearby measuring mast. In addition, we conduct a multi-stage experiment with the wind turbine, in which we investigate different correction functions for the wind vane. With this publication, we would like to find answers to the following questions:
-
Is there a systematic error in wind vane readings when utility-scale wind turbines are not aligned with the wind direction, and how can this error be described?
-
Can wind vane measurements be corrected using operational data, both with and without external reference measurements?
-
How does correcting the wind vane during yaw misalignment affect a wind turbine's performance?
In this section, we first give a brief overview of the operation of a conventional wind turbine yaw controller (Sect. 2.1). Then, we outline our hypothesis about the causes leading to a measurement error in a wind vane behind the rotor of a wind turbine and create a model for the error estimation (Sect. 2.2). Next, we detail the computational fluid dynamics (CFD) simulation we performed to confirm our assumption (Sect. 2.3). In Sect. 2.4, we describe the free-field data we used and our experiments with two commercial wind turbines.
2.1 General yaw control
Active yaw control is commonly applied to ensure a wind turbine aligns with the wind direction. As described in the Wind Energy Handbook (Burton et al., 2011), from the yaw error measured by the wind vane on the nacelle, a demand signal for the yaw actuator is calculated. To avoid the yaw control being influenced by small fluctuations, the measurement of the wind vane is averaged (e.g. moving averages with a window size of 30, 60, or even 180 s are commonly used). A deadband controller is typically used for the control, where a yaw manoeuvre is initiated if the yaw error exceeds a predefined threshold. We refer to this threshold as the yaw trigger. With a standard yaw control, the magnitude of the yaw rotation corresponds to the determined yaw error. However, this value may differ from the measured deviation for particular yaw strategies. An example is the active wake deflection (Gebraad et al., 2016; Rott et al., 2018) mentioned above, in which a specific yaw misalignment is applied to certain wind direction sectors in a wind farm. Since the target value of the yaw manoeuvre is also adjusted in this study, we refer to this value as the yaw target.
2.2 Wake deflection
As a motivation for the investigation carried out in this study, we look at an example time series of the wind direction measurement by a wind vane on the nacelle of a commercial wind turbine. The wind vane measures the wind direction deviation from the nacelle's orientation, which we denote by , where t∈ℝ represents the time. The measured wind direction in the global frame of reference is the sum of the wind direction deviation φwt(t) and the orientation of the nacelle (yaw angle) :
For the sake of better readability, we omit the modulo notation in the following and imply that angle specifications always lie in the value range for angular deviations and in the value range for absolute angles. Figure 1 shows γwt(t), ωwt(t), and the wind direction with a centred 60 s moving average:
We used the arithmetic mean for the directional values here and in the following rather than the directional mean calculated over the vectorial components, even though this is not technically correct. We chose to use the arithmetic mean because this is more widely used for such calculations when dealing with supervisory control and data acquisition (SCADA) data and because the difference is negligible for the relatively small directional values around 0∘, as is the case here.
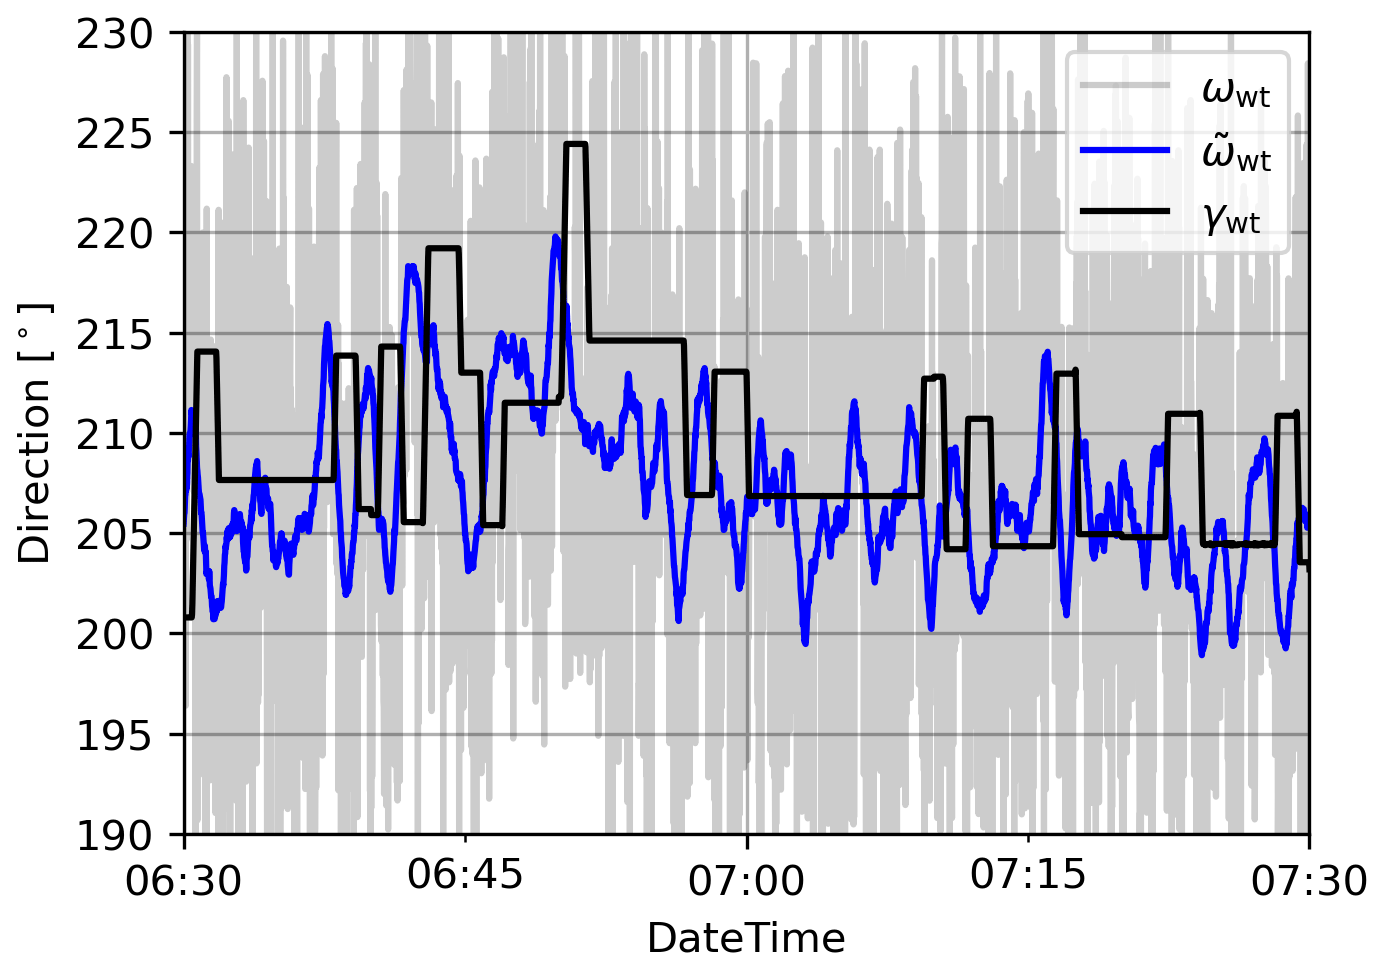
Figure 1Example of a 60 min time series from a Bard 5.0 wind turbine of the nacelle orientation γwt (black) and the wind direction measured by the wind vane ωwt in 1 Hz resolution (grey). In addition, the wind direction was averaged with a centred 60 s moving window (blue).
In Fig. 1, it is noticeable that the Bard 5.0 wind turbine makes a relatively large number of yaw manoeuvres in the 60 min time series, even though the measured averaged wind direction changes relatively little in the period shown. In most cases, the directions of the yaw manoeuvre alternate; i.e. a clockwise rotation (yaw angle increases) is followed by an anticlockwise rotation of the nacelle (yaw angle decreases). Furthermore, although the wind direction looks like a highly noisy stochastic process, i.e. it undergoes random and unpredictable changes, it seems that the moving average of the wind direction turns in the opposite direction precisely in situations where the wind turbine performs a yaw manoeuvre. In layperson's terms, it is almost as if the wind is trying to avoid the wind turbine. It should be noted, however, that the time series shown here has deliberately been chosen so that these features can be easily identified. Nevertheless, we could observe this behaviour often when examining measurement data from different wind turbines. Therefore, we presume a causality exists between the measured wind direction changes and the turbine, which motivated the present investigation.
We hypothesize that the exact mechanism that causes the deflection of the intermediate to far wake during yaw misalignment (Jiménez et al., 2010; Bastankhah and Porté-Agel, 2016), i.e. the thrust component perpendicular to the inflow direction, is also affecting the wind direction measured a few metres behind the rotor plan on top of the nacelle. Such a deflection, though, would explain an overestimation of the wind direction deviation by a wind vane on the nacelle. Due to an overestimation of the wind direction deviation, a yaw manoeuvre is triggered in the yaw algorithm earlier than intended and the orientation to which the rotor adjusts overshoots the actual target. This increases the probability that the wind turbine has an opposite yaw misalignment. If the wind turbine again overestimates this resulting misalignment, this can result in an alternating yaw pattern, where the wind turbine tries to follow the wind direction but repeatedly overshoots.
In order to model the overestimation of the wind vane, we use a simple linear transfer function that approximates the relationship between the wind direction measured by the wind vane and an estimate (represented by the hat ) of the “true” or reference wind direction deviation :
where c and b∈ℝ are the parameters describing the slope and the offset, respectively. The offset b is attributed to the wind vane's mounting error and the wake's rotation. It is usually determined during the calibration of the wind vane or by more elaborate analyses of the power performance (Mittelmeier and Kühn, 2018). As a result, wind vane data typically incorporate an adjustment to account for this deviation. Consequently, our subsequent analysis focuses on the correction factor c, with the offset facto b being set to 0∘.
In the following sections, we will provide an overview of the data that the analyses are based on. These are data from CFD simulations (Sect. 2.3) and free field measurements (Sect. 2.4). In Sect. 2.4 we will also describe how the correction factor c can be estimated by firstly comparing the turbine's wind vane with a met mast (Sect. 2.4.1) and secondly by being based solely on SCADA signal measurements (Sect. 2.4.2).
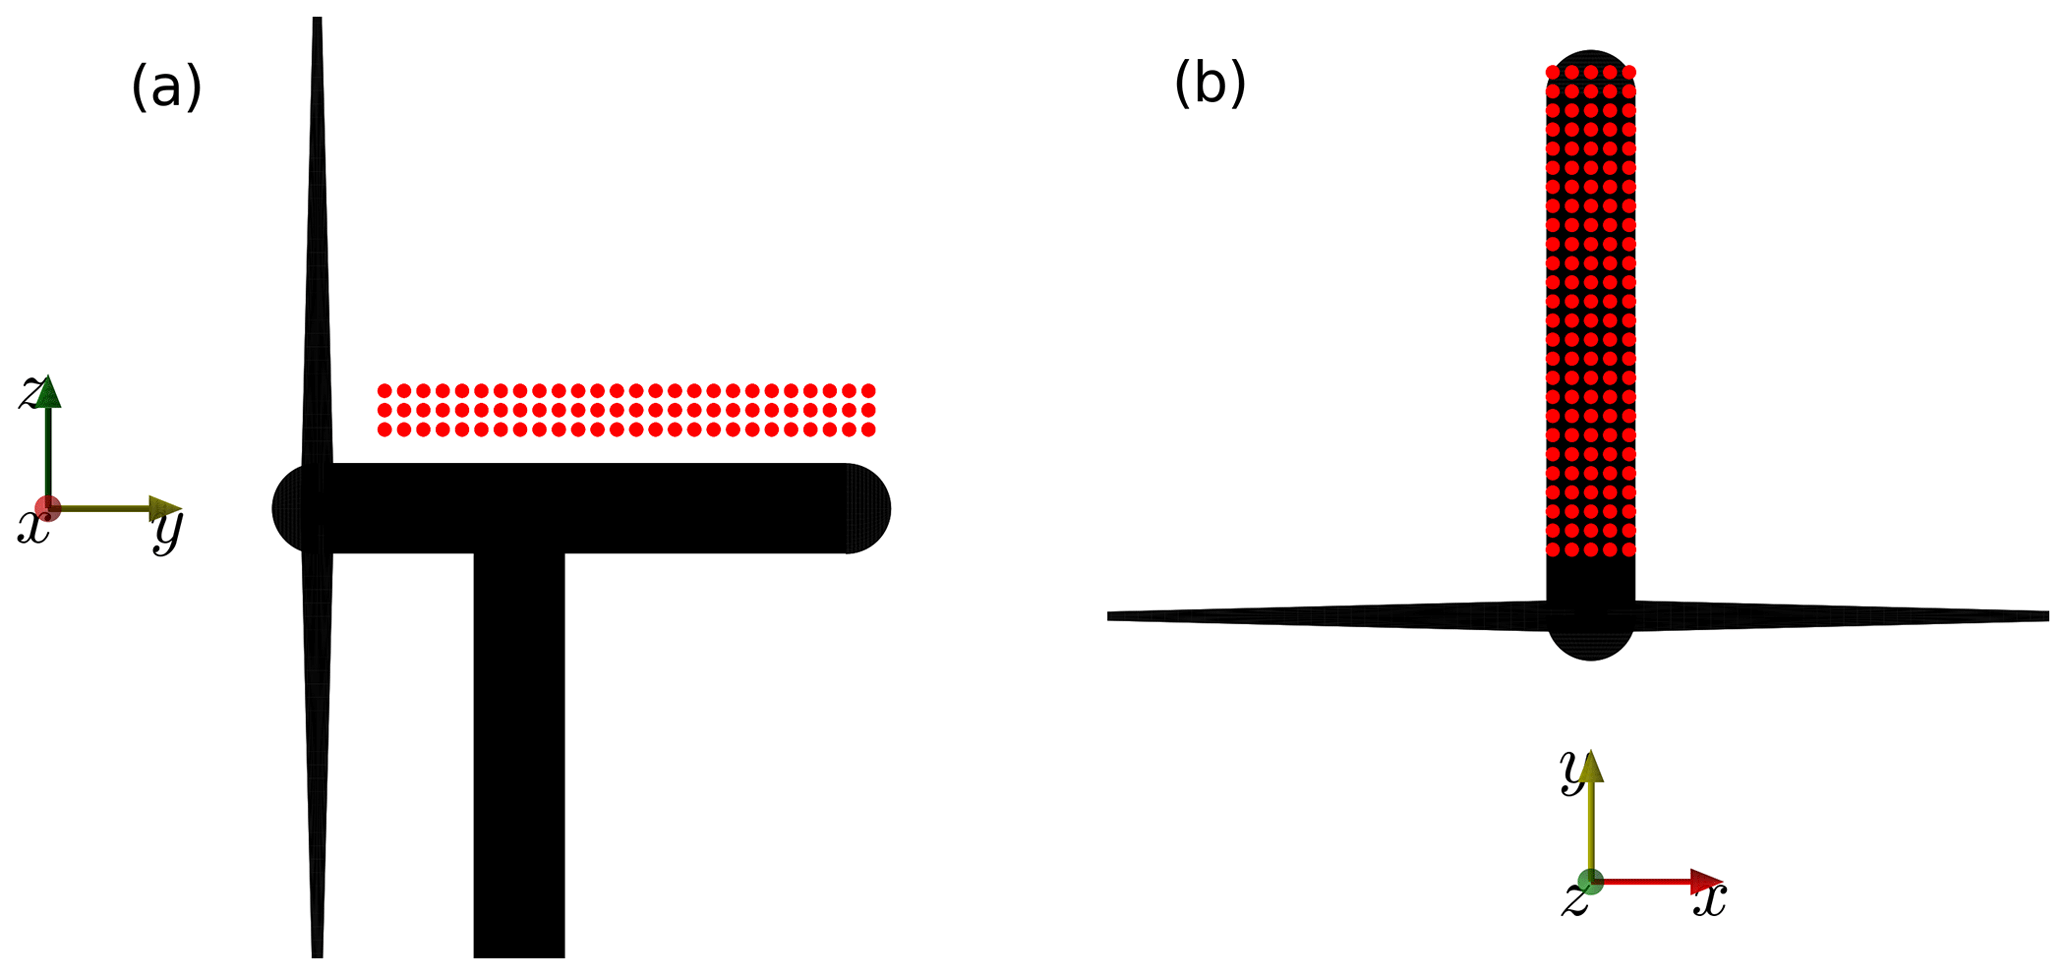
Figure 2Diagram of the setup of the 390 probe positions (in red) from the side view (a) and the top view (b). The axis origin is located directly in the rotor centre and has been moved in front of the rotor for better visibility.
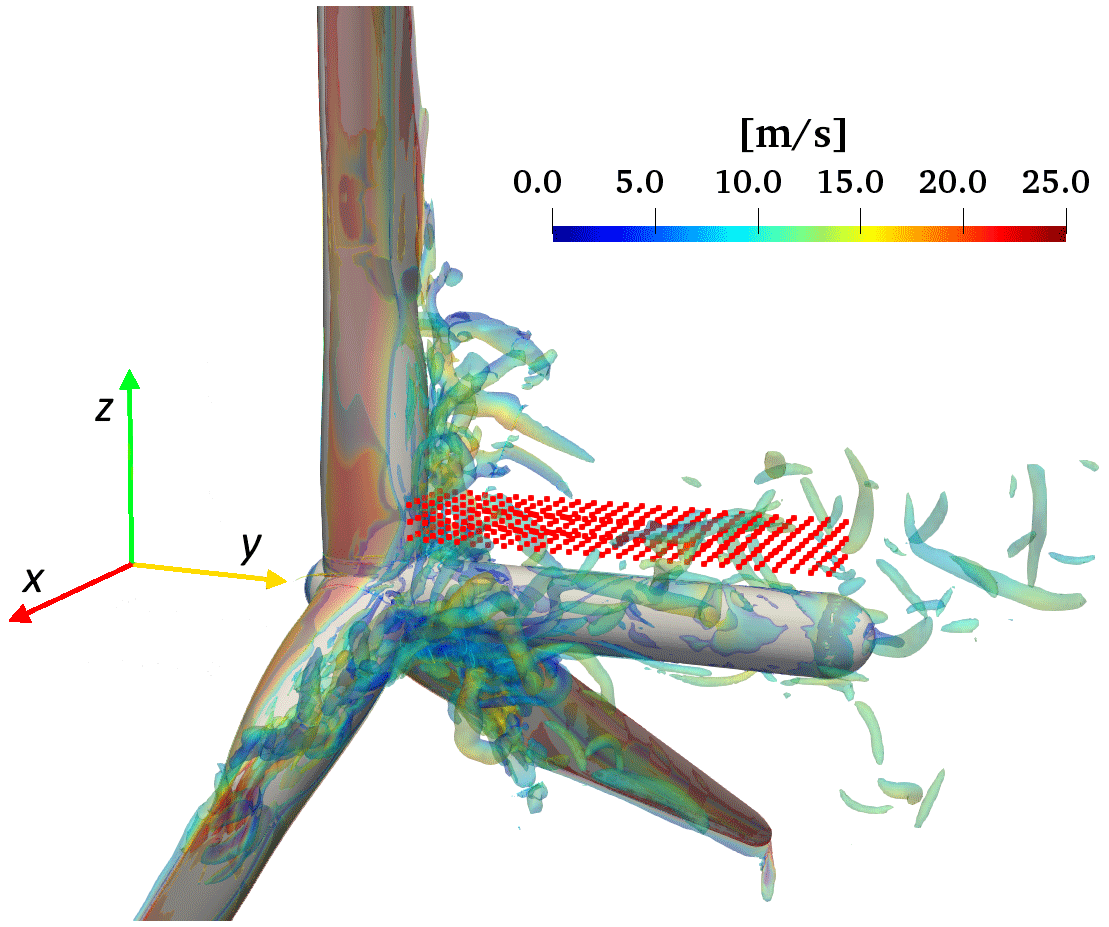
Figure 3Nacelle region of the simulated rotor with the 390 probe locations marked in red. The instantaneous root vortices that influence the probe region are described using an isosurface of the λ2 criterion of Jeong and Hussain (1995) for a value of λ2=100 s−2 and are coloured by the velocity magnitude.
2.3 CFD simulation setup
For verification, CFD simulations of the NREL 5 MW reference turbine were performed (Jonkman et al., 2009) using the open-source CFD software OpenFOAM (OpenFOAM, 2021). The numerical grid was generated using the two in-house tools bladeBlockMesher and windTurbineMesher (Rahimi et al., 2016) and consists of 26.4 million cells. The rectangular meshes contain the yawed rotor with a diameter of 126 m and a cylindrical, non-rotating nacelle geometry, neglecting the influence of the tower. The length of the nacelle was chosen to be 16 m with a radius of 1.35 m. The rotor is located 5D from the inlet and 15D from the outlet, with a distance of 3.5D towards all sides. Extra mesh refinement was made in the vicinity of the nacelle and blade roots, ensuring that the flow at the probe locations is resolved reasonably well. The rotation of the rigid blades is accounted for using sliding mesh interfaces between the rotor and the far-field grids. Five yaw angles were investigated, namely −20, −10, 0, 10, and 20∘, with an inflow wind velocity of 11.4 m s−1 and a constant rotational speed of 12.1 rpm.
The incompressible, transient flow was simulated using the hybrid Spalart–Allmaras delayed detached eddy simulation type (Spalart et al., 2006). A second-order implicit backward method was used to advance the solution in time. Temporal discretization made use of a second-order accurate Gauss linear scheme.
On top of the nacelle, a total of 390 probes were placed at three different heights (2.35, 2.93, and 3.50 m) above the axis of rotation, representing possible wind vane positions. Figure 2 provides a schematic view of the turbine and probe positions from both the top and the side, and Fig. 3 displays a view from the simulation. In both figures, the axis origin is shifted from the centre of the rotor in front of the turbine to make it visible.
2.4 Free-field data
Our second approach to verify our hypothesis and find the parameters for our linear model (Eq. 3) is to examine measurements from commercial turbines and conduct experiments in the free field. For this, we used two sets of data. Firstly, measurement data of the Bard 5.0 wind turbine, located at the prototype site in northwest Germany at Rysumer Nacken consisting of two wind turbines of this type, were analysed. The turbine has a rotor diameter of 122 m, a hub height of 90 m, and a rated power of 5 MW. More details on the Bard 5.0 wind turbine can be found in Wiesen et al. (2013). Secondly, data from the eno114 wind turbine from the Kirch Mulsow test field in north Germany were analysed. For more information regarding the eno114 wind turbine and Kirch Mulsow test field, see Hulsman et al. (2022).
At both locations, the measurements of the wind vane could be compared with a mast set up at a distance of approx. 300 m in each case. At eno114, however, we were able to analyse situations within the scope of an investigation into wake deflection, in which the rotor was intentionally misaligned with the wind direction by up to 20∘.
2.4.1 Comparison between wind vane and met mast
To identify an error in or an overestimation of the wind vane, we compare the turbine's wind vane measurements with the wind direction measurements of the meteorological mast (met mast) as a reference.
At the Rysumer Nacken test site, there are two wind vanes installed on the Bard 5.0 wind turbine at a height of 91 m, approximately 8 m behind the rotor plane at a lateral distance of 2 m for the rotor axis and 1.5 m above the nacelle, namely the wind direction sensor INDUSTRY (00.14567.110040) from Lambrecht Meteo GmbH and the Ultrasonic Anemometer 2D compact (4.387x.xx.xxx) from Thies Clima. The two-system setup serves to increase availability. When both devices are operational, the yaw control uses the mean value of both wind vanes, which is also the measurement we are investigating. The met mast is equipped with a wind vane at a height of 90 m.
At the wind farm in Kirch Mulsow, one ultrasonic wind vane, the Ultrasonic Anemometer 2D compact (4.387x.xx.xxx) by Thies Clima, is installed on the eno114 wind turbine at 120 m height, approximately 12 m behind the rotor and 1.5 m above the nacelle. The met mast uses the Wind Direction Transmitter First Class (4.3151.00.x1x) wind vane from Thies Clima at a height of 112 m.
Analogous to the above, we refer to the wind direction deviation measured by the turbine as . To compensate for small-scale fluctuations, we resample the measurements to 60 s averages. We denote the wind direction measured by the met mast with ; from this we calculate the wind direction deviation of the wind turbine determined by the met mast as and also resample the data to 60 s averages.
To determine the influence of the rotor's thrust on the wind vane of the wind turbine, only situations in which the wind turbine was operated in in the partial-load range and without curtailment were considered to compare the measured values.
We use an orthogonal distance regression (ODR) (Boggs and Rogers, 1990) to quantify the relationship between the two measured values. This regression method works similarly to an ordinary linear regression (OLR). In both methods, the measured values are transferred as tuples into a coordinate system (scatterplot), in our case (φwt(t), φmm(t))t. In an ordinary least squares (OLS), an affine linear function is determined that minimizes the squared distance of the function values to the dependent variable of the data points, which is the second component of the tuple and which is usually plotted on the vertical axis (y axis) of a graph. This is reasonable if the first component of the tuple, which is generally called the predictor variable or independent variable and is usually plotted on the horizontal axis (x axis) of a graph, does not depend on other factors and has no uncertainty. One of the most common examples is if the independent variable is the timestamp. However, if the predictor has uncertainties, the regression slope will be biased towards zero. This phenomenon is referred to as “regression dilution” and is extensively discussed in Frost and Thompson (2000). Another drawback of the ordinary least squares (OLS) technique is its lack of invertibility. This implies that if you interchange the x and y data and implement OLS on the transformed tuples, the resultant linear function will not be the inverse of the initial linear function. In contrast, an ODR minimizes the squared orthogonal distances from a regression function to the tuples. The regression line obtained by this method accounts for uncertainties in the data points' first and second components. With an ODR, the variables can be swapped, thereby inverting the regression line. It should be noted, however, that the uncertainties in both measured values are weighted equally. It is possible to obtain a different weighting for the uncertainties of both measured values by stretching or compressing the data on one of the axes of the coordinate system. However, we assume that the 60 s mean values considered have similar uncertainties. The gradient of the ODR line gives us an estimate for the correction factor c. The results of this investigation are presented in Sect. 3.2.1.
2.4.2 Yaw manoeuvre analysis
This section introduces a method for estimating the wind vane's correction factor without needing external measurements, such as a measuring mast. Similar to the step response analysis for time-invariant linear systems, we compare the wind vane measurements immediately before a yaw manoeuvre with those after.
First, we filter the SCADA data to exclude situations where the wind turbine is not generating electricity or is operating at reduced output. Then, we identify all yaw manoeuvres in the SCADA data and divide them into clockwise (cw) and anticlockwise (acw) yaw manoeuvres. On the one hand, the distinction between the two directions of rotation is essential for data processing since the different signs for both directions of rotation must be considered in the statistical evaluations. Furthermore, a correction factor for both directions of rotation can be determined through the differentiation. Thus, a possible asymmetry can be detected, which may be caused e.g. by an offset error which was not sufficiently eliminated during the calibration of the wind vane. Regular yaw manoeuvres usually take less than 30 s. In some cases, however, a yaw manoeuvre can take longer. This indicates that the wind turbine is realigning itself after a shutdown, a cable de-twist is taking place, or the wind direction is abruptly changing very strongly. We only consider yaw manoeuvres that lasted less than 30 s to exclude these cases from our investigations. In the following, we restrict ourselves to describing the methods for the cw yaw manoeuvres since the techniques are used analogously for evaluating the acw yaw manoeuvres.
The time at which the ith cw yaw manoeuvre (i∈ℕ) starts is denoted as and the time at which it ends (ys and ye denote yaw start and yaw end, respectively). The number of all cw yaw manoeuvres obtained in this way is denoted as ncw. For empirical data analysis, we consider the measurements over a period of the size T∈ℝ before the start of the cw yaw manoeuvre and after the end of the yaw manoeuvre . The length of the time interval T must be selected to be sufficiently small, depending on the configuration of the yaw controller, so that no further yaw manoeuvres within the time interval interfere with the measurements and that the yaw angle is constant before and after the yaw manoeuvre. T must be selected to be large enough to suppress turbulence-related measurement noise as far as possible. For our investigations, we therefore chose T=60 s. The measurements during the yaw manoeuvres [tys,i, tye,i] are not considered in the analysis because the duration of the yaw manoeuvres varies, and there are additional uncertainties during the nacelle rotation. For the selected periods, we now consider the wind direction measurements of the wind turbines. For aggregating the data, we centre the measurements around the yaw angle at the end of the respective yaw manoeuvre and thus obtain the following expression:
Similarly, we also average the yaw angles centred around the yaw angle at the end of the respective yaw manoeuvre:
As already mentioned, the yaw angle is constant before the yaw manoeuvre for τ≤0 s, only transitions during the yaw manoeuvre, and is constant again after the yaw manoeuvre ∘ for τ>0 s. The wind direction deviations are aggregated without centring according to
From this, we can calculate the time-averaged deviation of the mean wind direction before the yaw manoeuvre,
and after the yaw manoeuvre,
Figure 4 gives a schematic illustration of these aggregated measurements. The wind direction is shown in light red together with the average yaw angle in blue. The bold red line represents the time-averaged measured wind direction before the yaw manoeuvre. Therefore, the difference between the bold red line and the yaw angle is , as shown in the figure. Analogously, the bold magenta line represents the time-averaged measured wind direction after the yaw manoeuvre, which means the difference between this value and the yaw angle is . The centred “true” reference wind direction is shown in green. The reference wind direction cannot be measured directly and is unknown, but we can state the following two assumptions.
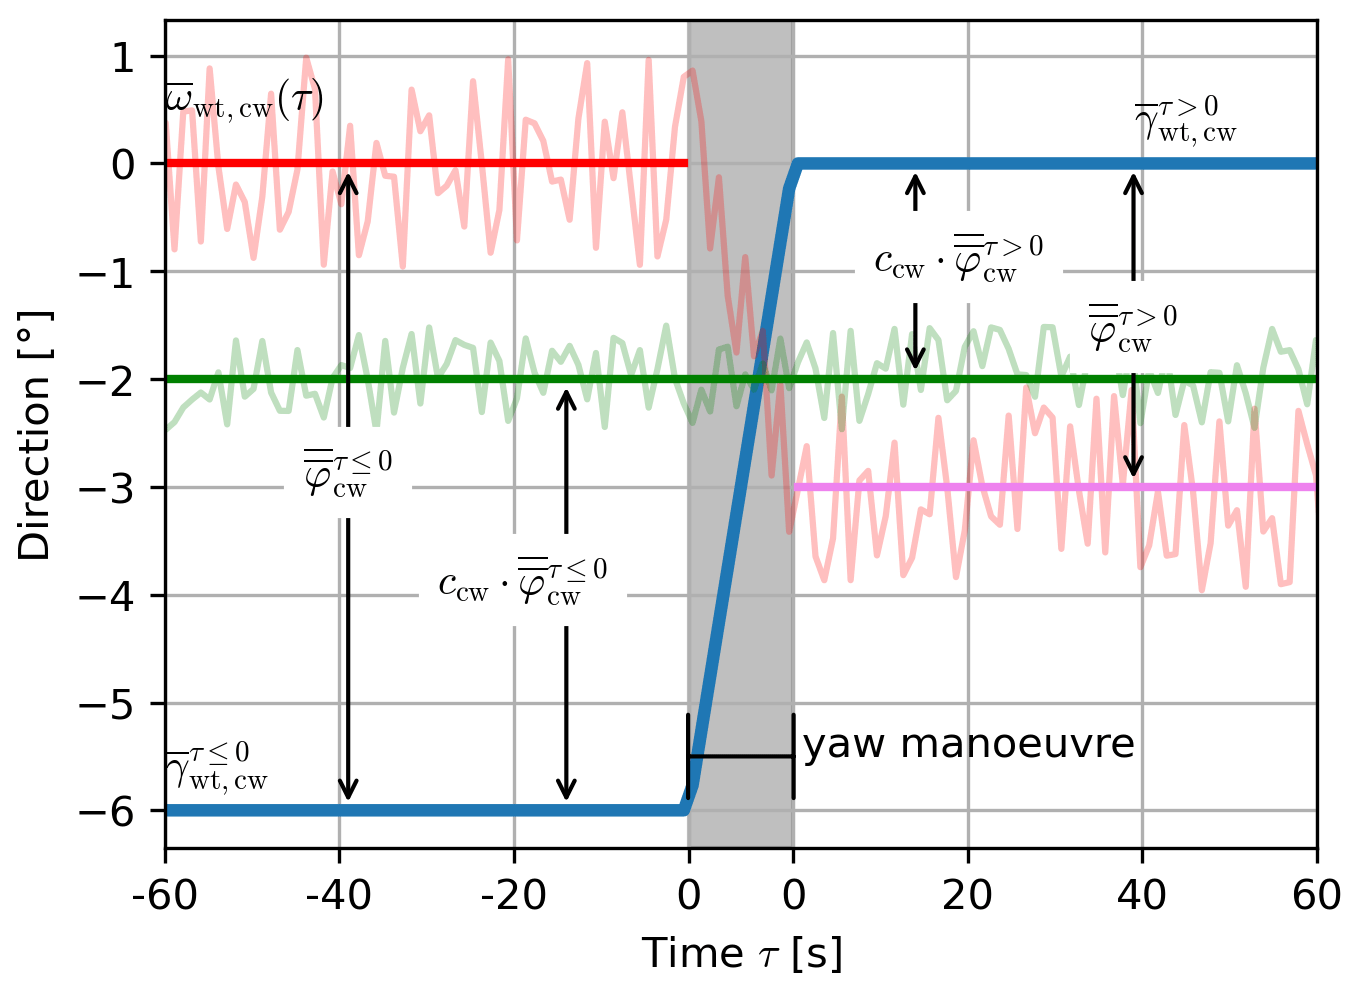
Figure 4Schematic illustration of the average measured wind direction (in light red) before and after a yaw manoeuvre, the average yaw angle (blue), and the average true wind direction ωref(τ) (green) all centred at the respective yaw angle after the yaw manoeuvre.
First, the measured and the true wind direction deviation can be expressed by the linear function from Eq. (3). The correction c is denoted as ccw, since, in this case, we only analyse clockwise yaw manoeuvres. The figure shows this relation by the difference between the green line and the yaw angle before and the green line and the yaw angle after the yaw manoeuvre. Second, the wind direction is a stationary random process for the duration . Now we can postulate the following relationship:
Solving for ccw gives us
The yaw control ensures that the yaw angle after the yaw manoeuvre corresponds to the measured wind direction before the yaw (see Eq. 1). This holds especially for the aggregated averages considered here; therefore . The correction factor can thus be estimated only by the wind vane measurements:
We proceed analogously for acw yaw manoeuvres.
This section presents the results of the methods described in the previous section. Since multiple different datasets have been analysed for these studies, a short overview is given here:
-
In Sect. 3.1, the data from the CFD simulation are analysed as described in Sect. 2.3.
-
In Sect. 3.2, the methods described in Section 2.4 are applied to measured data from the free field.
-
In Sect. 3.2.1, the wind wane measurements from the Bard 5.0 at Rysumer Nacken and the eno114 wind turbines at Kirch Mulsow are compared to wind direction measurements from the met mast at their respective locations as described in Sect. 2.4.1.
-
In Sect. 3.2.2, the yaw step analysis described in Sect. 2.4.2 is applied to the Bard 5.0 wind turbine at Rysumer Nacken.
-
And finally, Sect. 3.3.1 shows results from a free-field experiment where the correction factor was applied to the yaw controller of the Bard 5.0 wind turbine at Rysumer Nacken.
-
3.1 CFD simulation
From the data generated by the CFD simulation, we omitted the first 10 s of the simulation in our evaluation, in which the wake develops directly behind the rotor. In addition, we only consider measuring points at a minimum distance of 5 m behind the rotor plane, meaning 300 of the 390 probes were used for the evaluation. The measured values were averaged over the three different measurement heights since observing the individual measurement heights did not reveal any special features. Figure 5a–e shows the time-averaged wind directions for the different measurement points behind the rotor in colour.
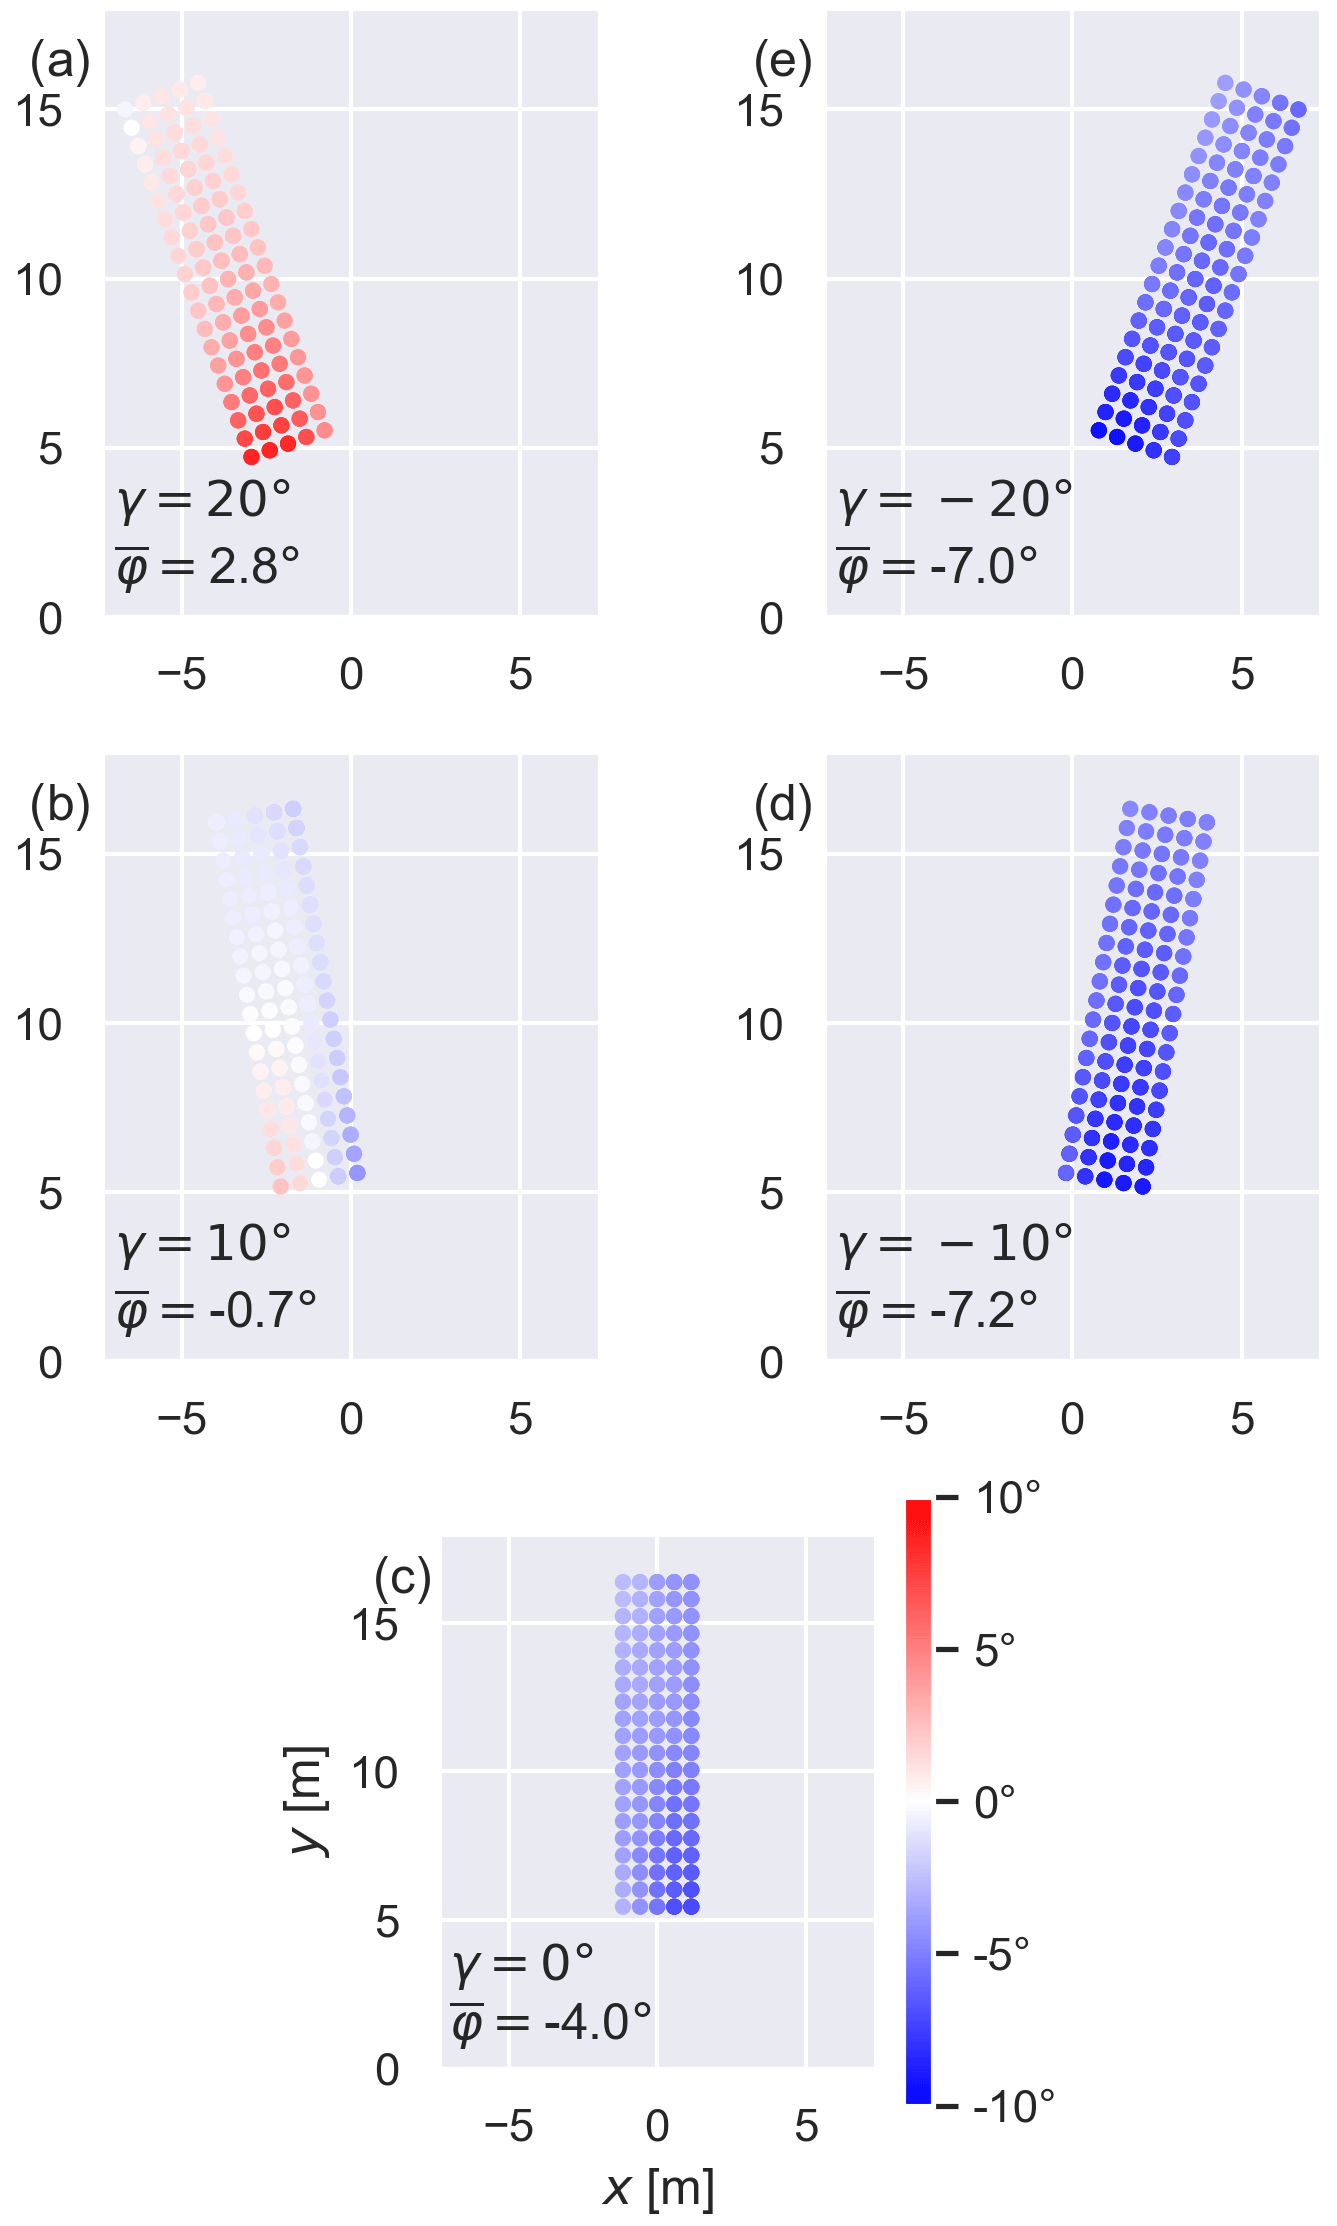
Figure 5Coloured representation of the averaged wind direction above the nacelle for five different misalignments , −10, 0, 10, 20∘}. The red colouring represents a deflection to the right (positive) and the blue colouring a deflection to the left (negative). The mean wind direction of all measurement points over the whole simulation time is given as .
The plots display the deviations of the wind directions from the incoming wind direction coming from the south. The red colour indicates a deflection to the right (positive) and the blue colour to the left (negative). In Fig. 5a the wind turbine is yawed by 20∘ (anticlockwise) relative to the inflow. The flow at the measurement locations is relatively homogeneous, with a more substantial deviation closer to the rotor plane. The average flow at the measurement locations has a direction of ∘. Therefore, the total average misalignment a virtual wind vane would experience is 22.8∘. Figure 5b depicts the wind turbine yawed by 10∘ (anticlockwise) relative to the inflow. The flow at the measurement locations shows minimal deviation from the inflow. A slight positive trend on the right-hand side of the figure close to the rotor plane and a negative trend on the left-hand side of the figure can be observed. The overall flow average at the measurement locations is ∘, so the total misalignment the virtual wind vane would measure is 9.3∘. In Fig. 5c the wind turbine is aligned with the inflow. A deviation to the left with an average of ∘ can be seen at the measurement locations. This shows the deviation mentioned above due to the rotation of the blades, which causes a counter-rotation of the flow behind the rotor plane. In Fig. 5d, where the wind turbine is misaligned by −10∘ (i.e. 10∘ in a clockwise direction), this deflection becomes even more potent with an average flow direction of ∘. A virtual wind vane would experience a misalignment of −17.2∘ on average. Similarly, in Fig. 5e the misalignment is comparable to the case before, with an average misalignment of ∘. A virtual wind vane would experience a misalignment of −27.0∘.
Figure 6 summarizes the average virtual measured misalignments (blue dots); additionally an ordinary least square (OLS) regression was fitted to the measurements (red line), which shows a very strong linear trend with a correlation coefficient of R=0.998. Here, it can be observed that at the measuring points, an amplification of the actual misalignment is measured in the magnitude of 26 % (the slope is m=1.26). To compensate for this amplification factor by a correction factor, this factor must be .
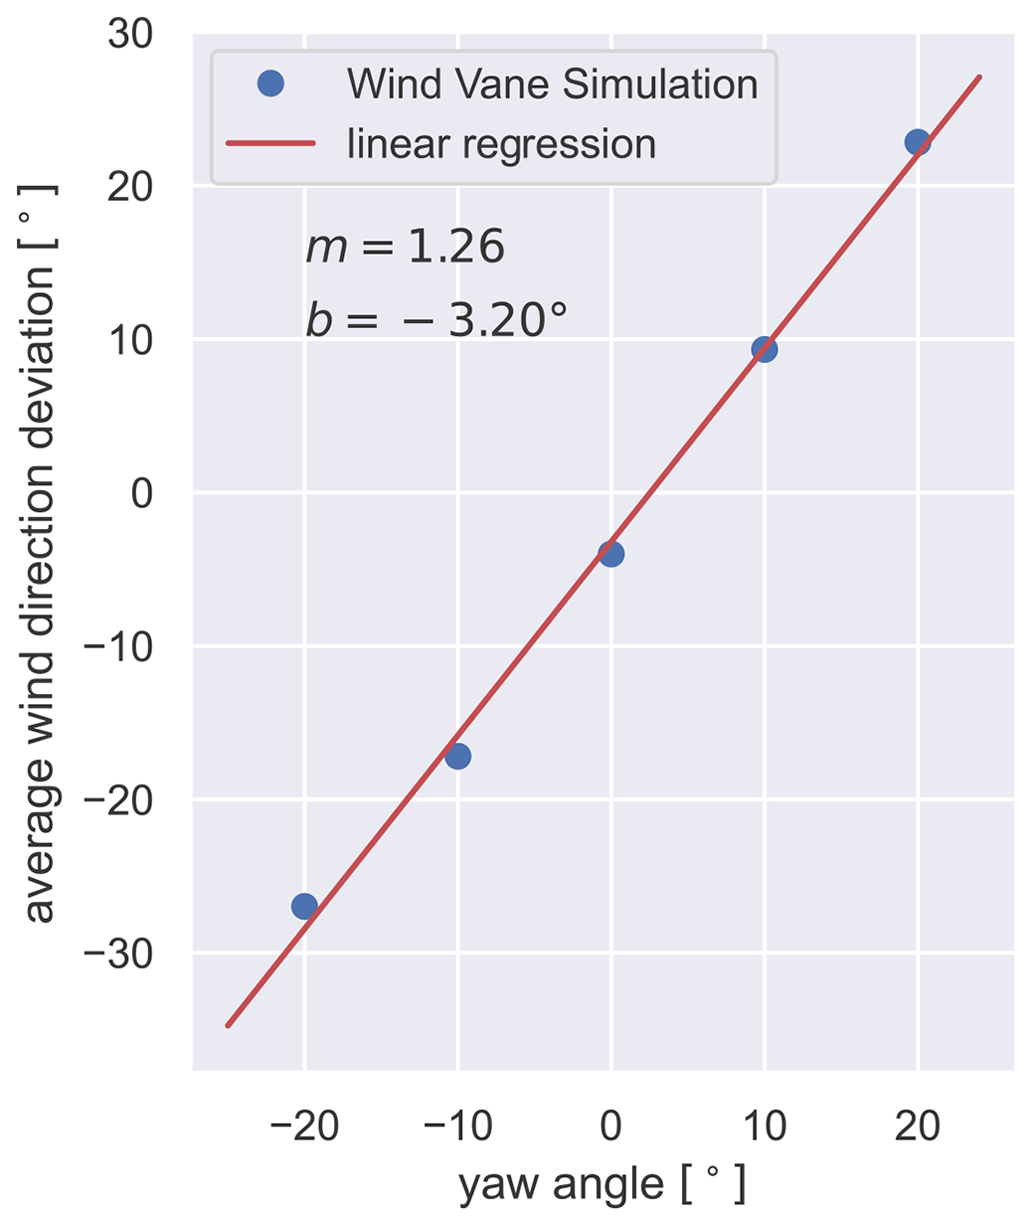
Figure 6The blue dots represent the average deflection above the nacelle for the five different misalignments that were simulated in the CFD from the perspective of the nacelle longitudinal axis. In red, a linear regression line was fitted through the points. The slope m and the axis intercept point b are stated.
The offset of the regression is b=3.20∘. Note that we mention in Sect. 2.2 that the offset for the correction is assumed to be zero when using real measured data, since the calibration of the wind vane should account for such an offset. For the data from the simulation, there is neither an actual wind vane nor a calibration, and therefore we also get the offset in the numerical simulation results.
3.2 Free-field measurements
3.2.1 Comparison wind vane versus met mast
To evaluate the measurements in the free field, we compare the wind direction measurements on the wind turbine nacelle with the measurements at the met mast, as described in Sect. 2.4.1. First, we present the results from the Rysumer Nacken test field introduced in Sect. 2.4.1. Here, we only considered wind directions between 180 and 360∘, as the met mast is in free flow in this wind direction range and is not disturbed by wakes. The measurements were recorded during the period from 12 September to 8 October 2020. After filtering, the number of viable 60 s measurements is n=8013. Figure 7 shows a 2D histogram of the yaw offset measured by the wind vane at the Bard 5.0 wind turbine compared to the yaw offset calculated by the met mast.
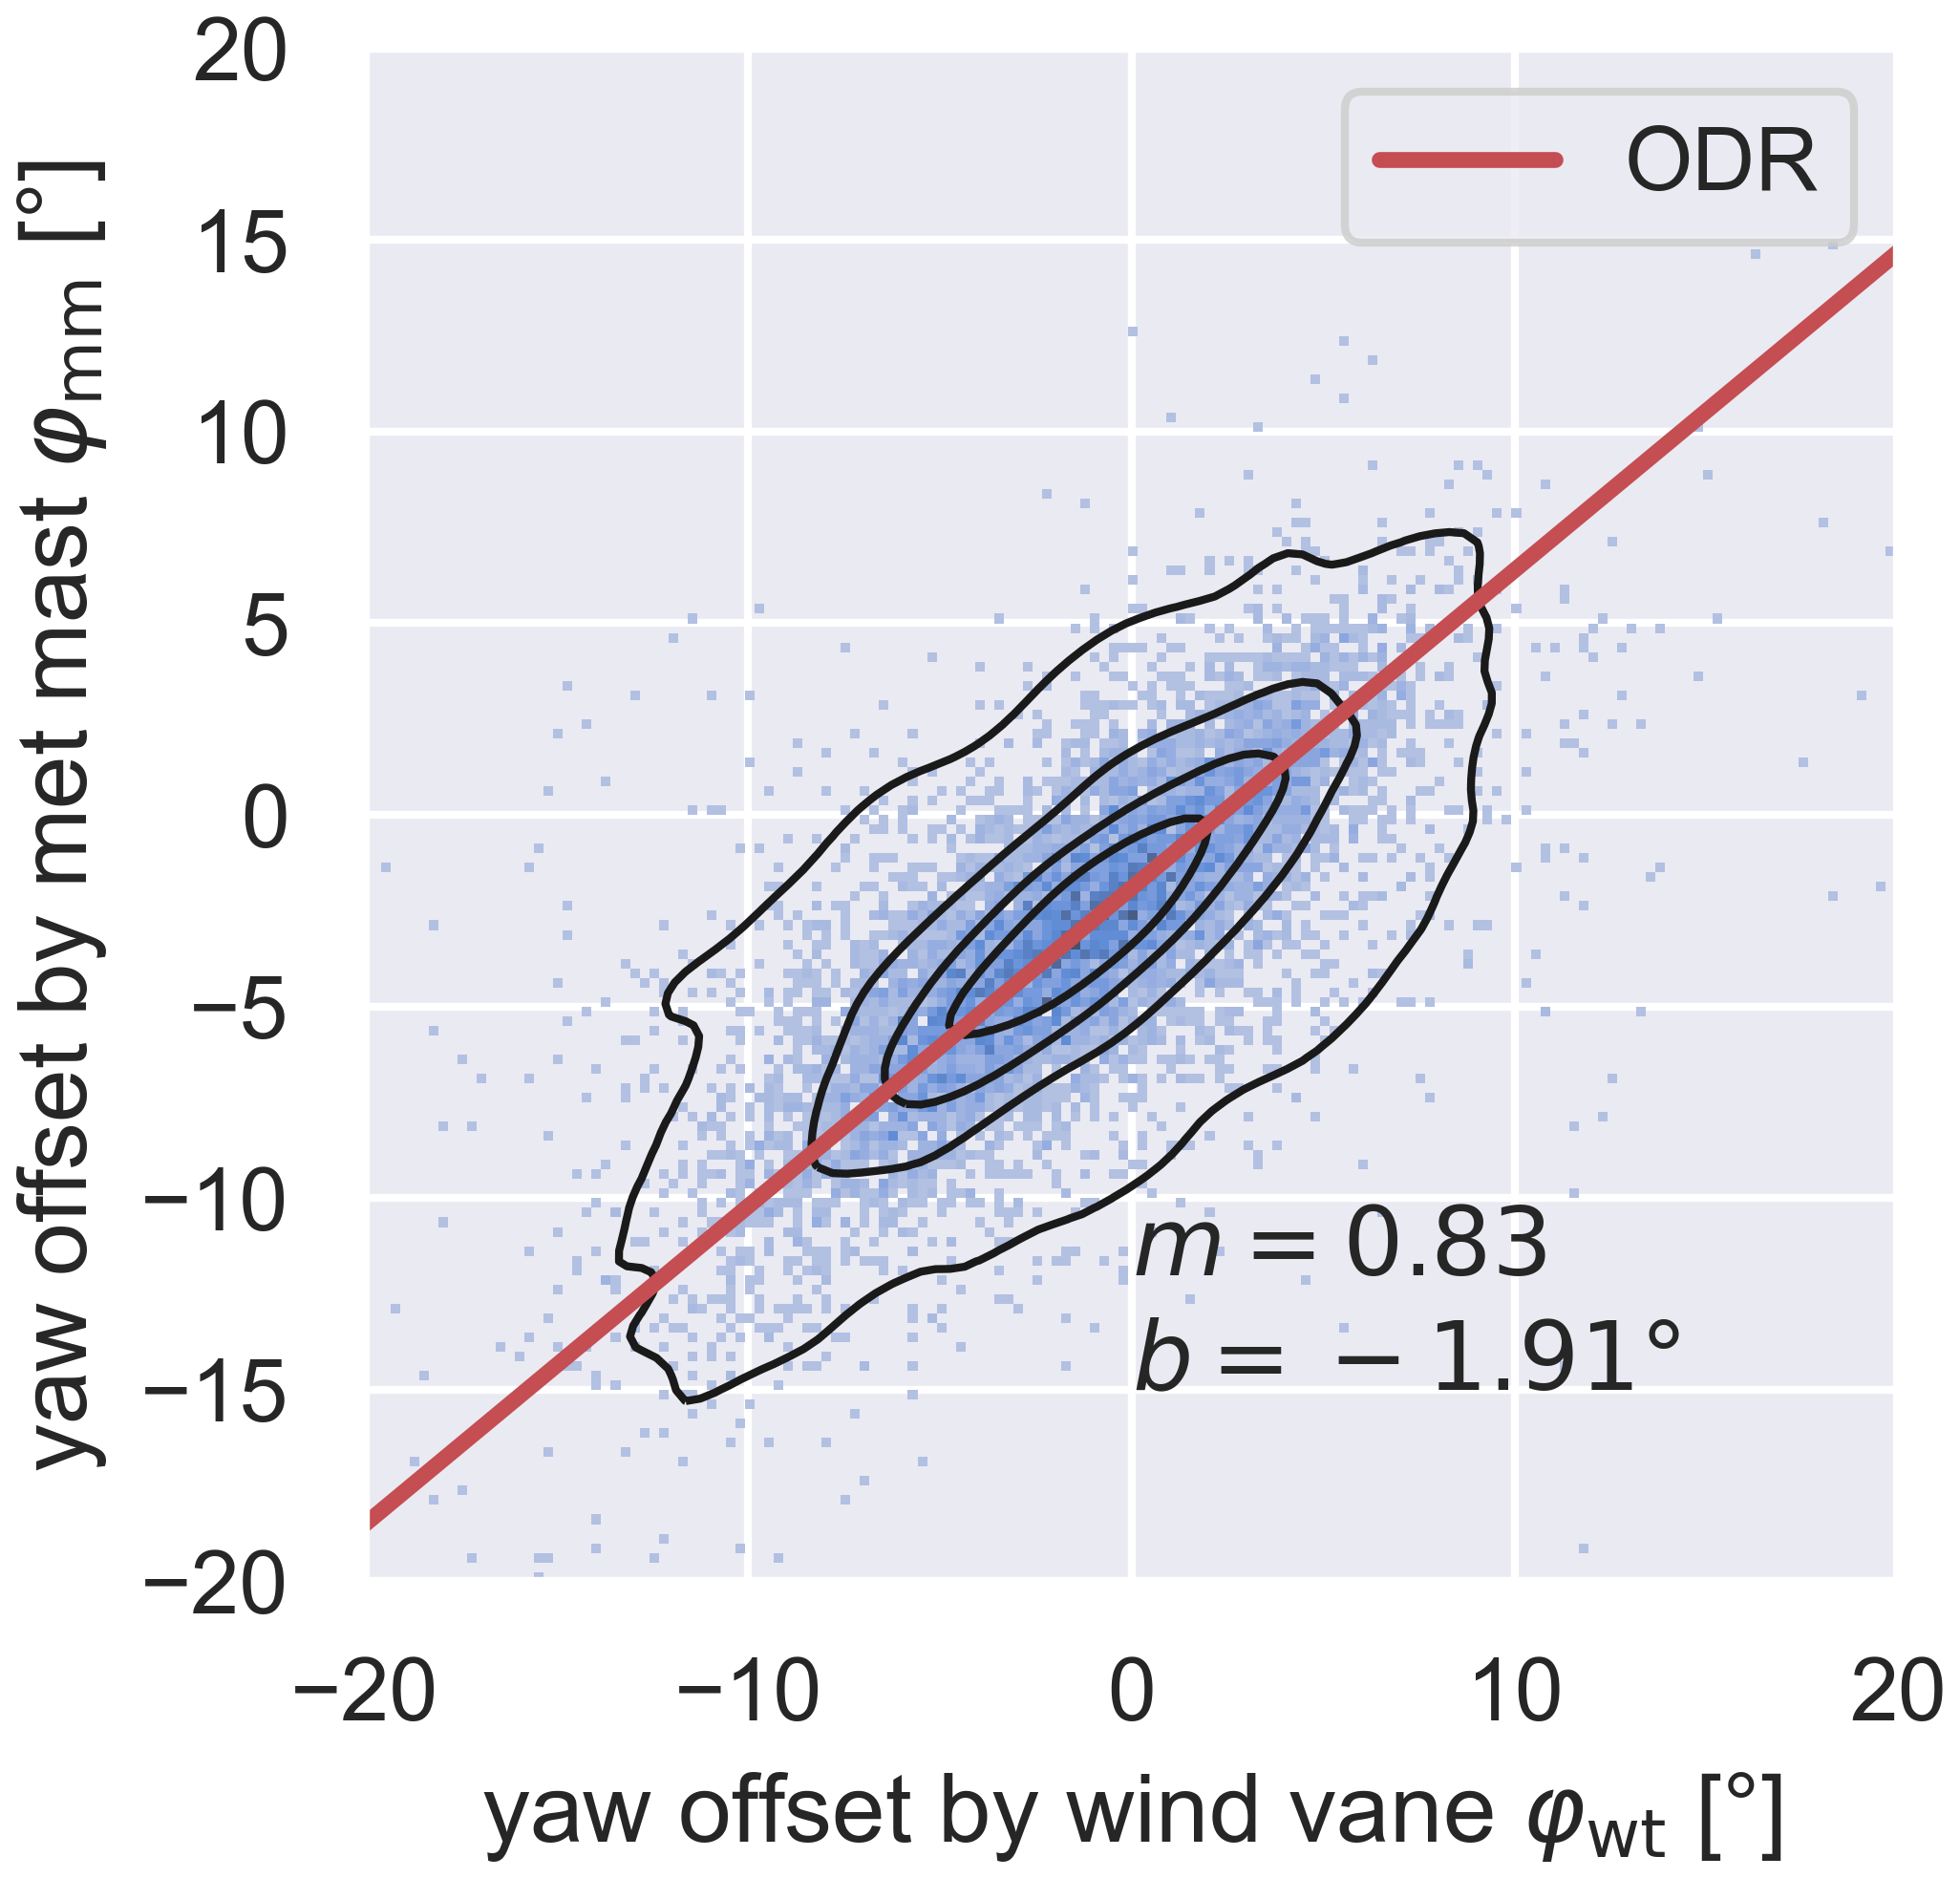
Figure 7A 2D histogram of the yaw misalignment determined by the wind vane of the Bard 5.0 φwt (x axis) and the met mast φmm (y axis) at Rysumer Nacken. Kernel density estimation is shown with black contour lines, and the ODR is displayed in red.
The black contour lines show a kernel density estimate, and the red line results from the ODR (see Sect. 2.4.1). The slope of the regression, which also provides the correction factor, is . The offset is ∘. This offset can result from slightly different northings between the wind turbine and the met mast.
Next, we show the results from the Kirch Mulsow test field. In this small wind farm, we only considered wind directions from 215 to 300∘, the sector with free inflow for the met mast, for this evaluation. The measurements were recorded during the period from 19 January to 3 July 2021. The number of viable measurements after filtering is n=45042. Figure 8 compares the measured values of the met mast at the Kirch Mulsow site with those of the wind vane at the eno114 wind turbine in the same way as before. The ODR, in this case, results in a correction factor of , and the offset is b=0.49.
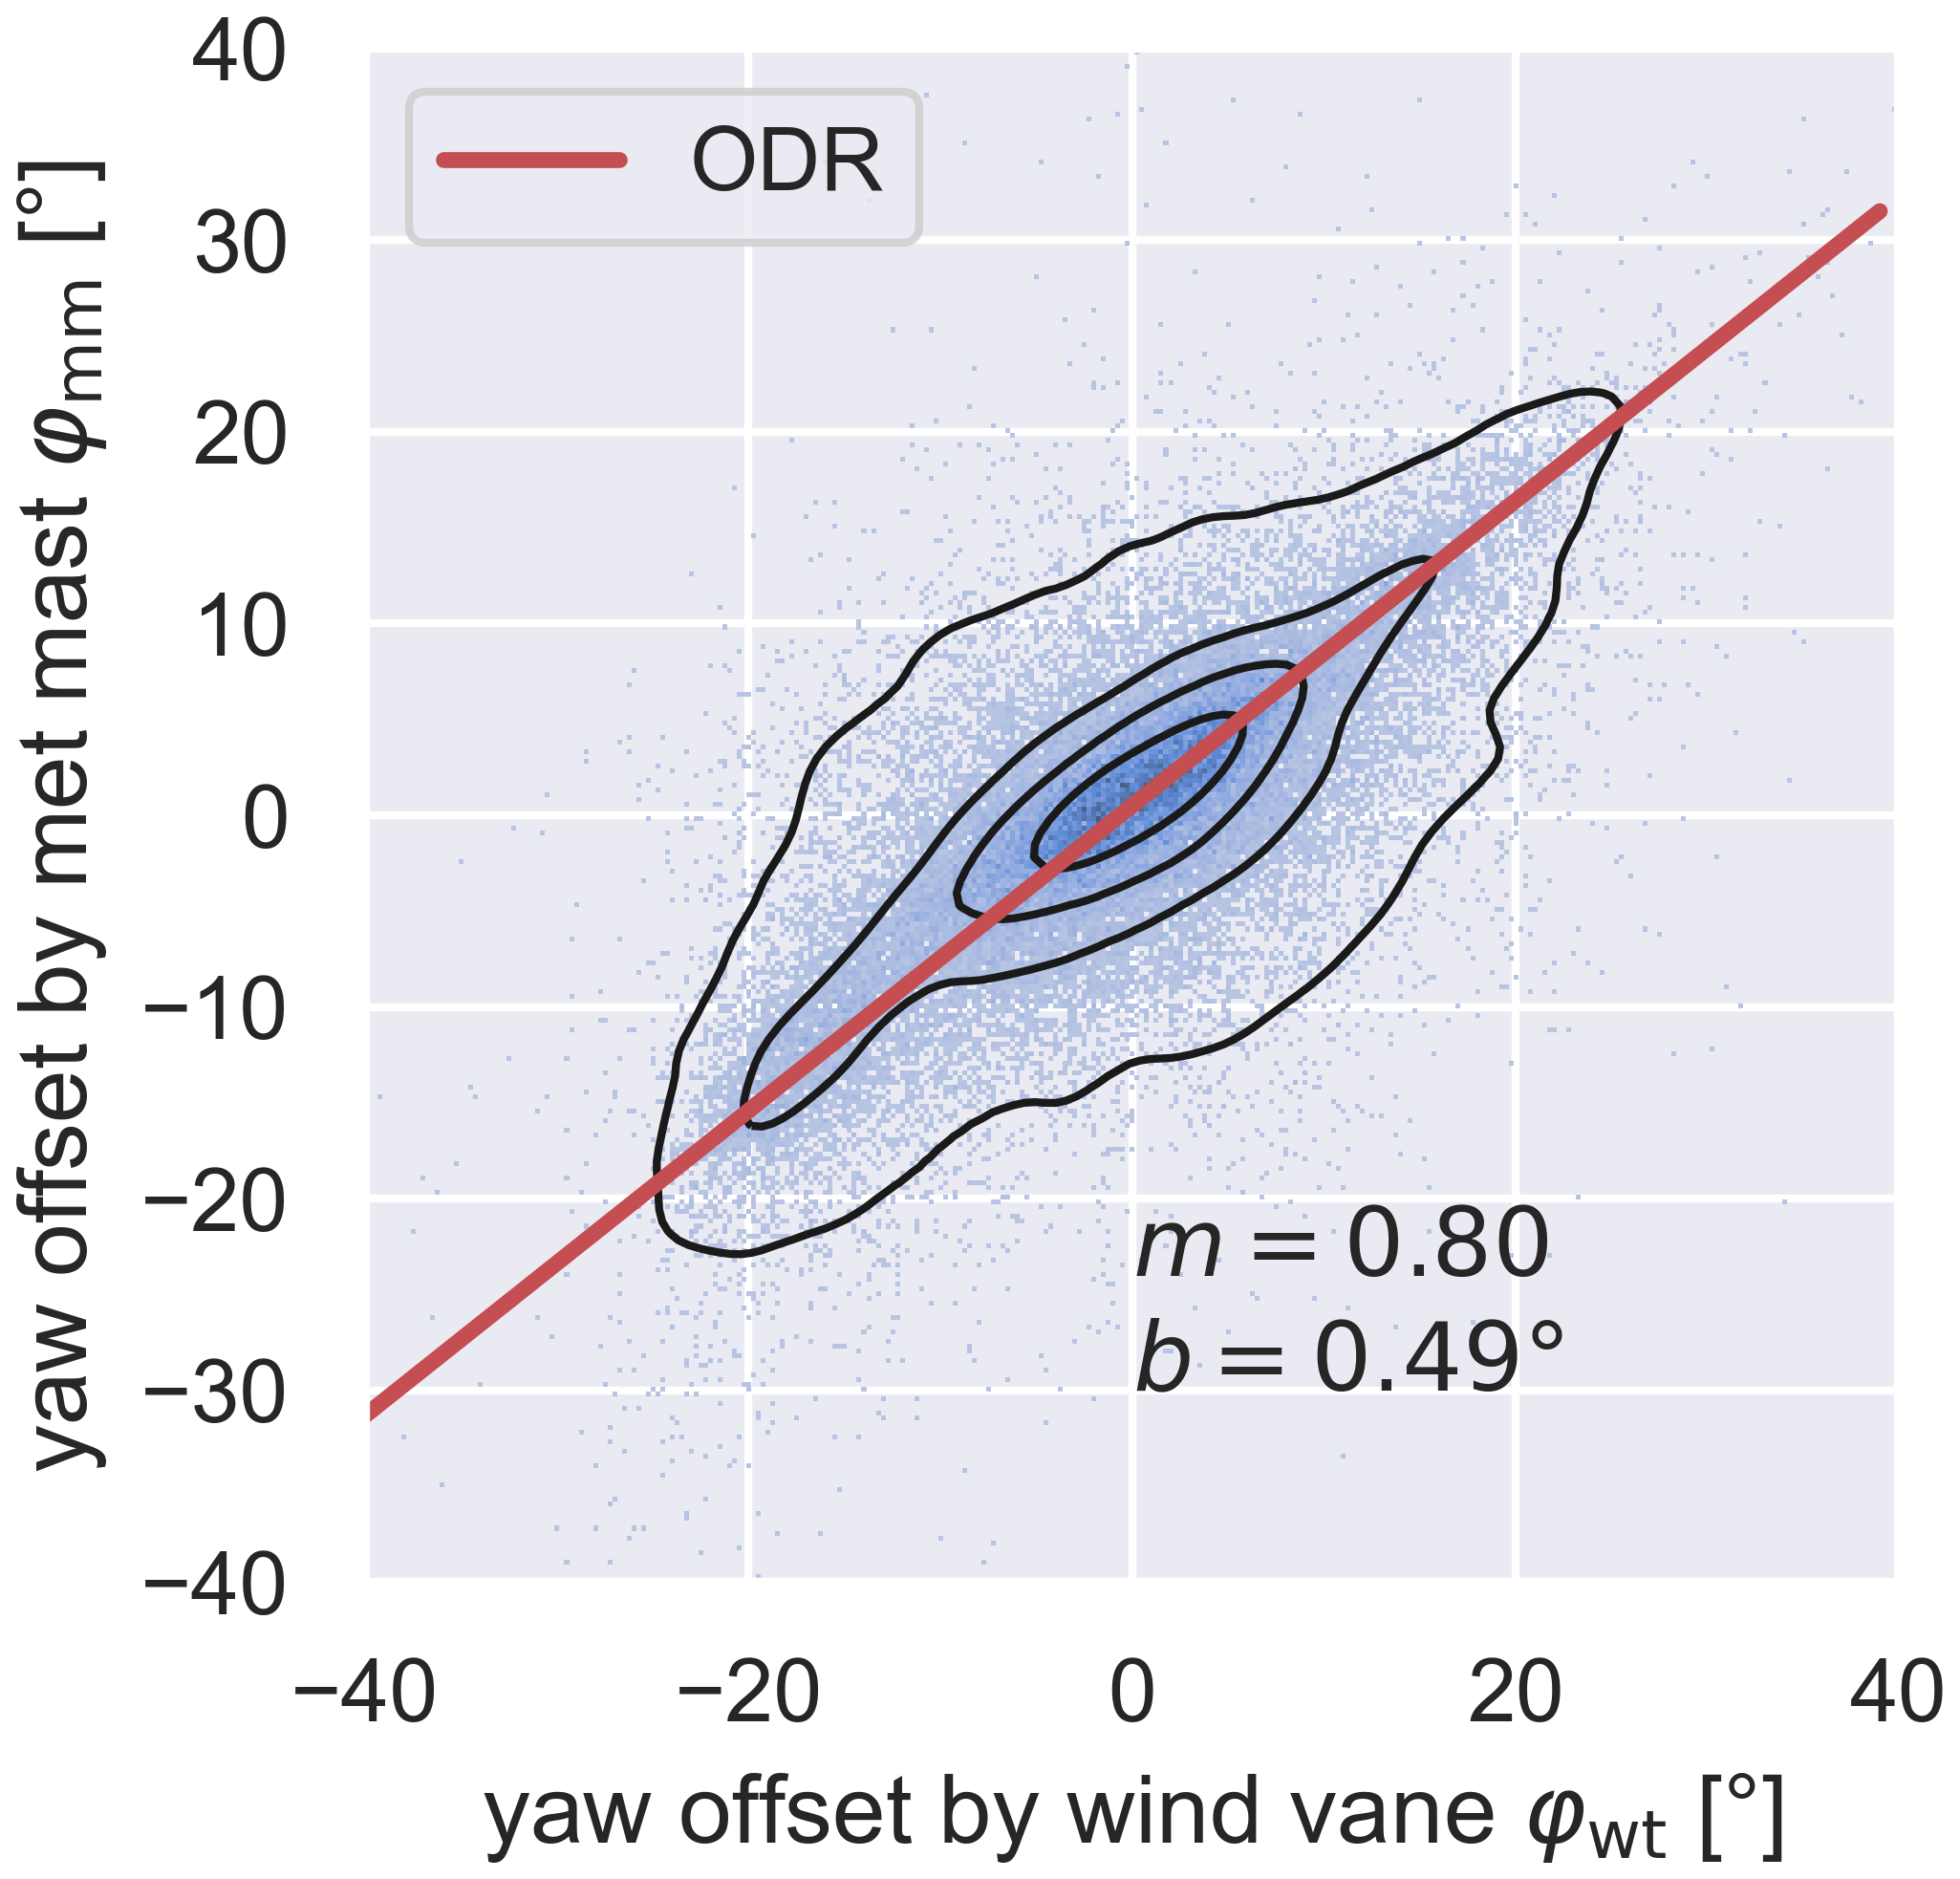
Figure 8A 2D histogram of the yaw misalignment determined by the wind vane of the eno114 φwt (x axis) and the met mast φmm (y axis) at the Kirch Mulsow site. Kernel density estimation is shown with black contour lines, and the ODR is displayed in red.
Since intentional misalignments of the rotor of up to 20∘ in both directions were also tested at this test site, our range of values here extends much further than in the first case.
3.2.2 Wind vane measurements before and after yaw actuation
In this section, an analysis of wind direction measurements by the wind vane at the Bard 5.0 wind turbine in the Rysumer Nacken test area during the period from 1 August to 8 October 2020 is performed using the methods presented in Sect. 2.4.2. Since the yaw manoeuvre can have an influence on the measured values due to the time averaging, we excluded the measurements 10 s before and after the yaw manoeuvre from the analysis. Figure 9 shows the 2D histograms of the wind vane measurements before and after the yaw manoeuvre in the cw direction, and Fig. 10 shows the same for yaw manoeuvres in the acw direction.
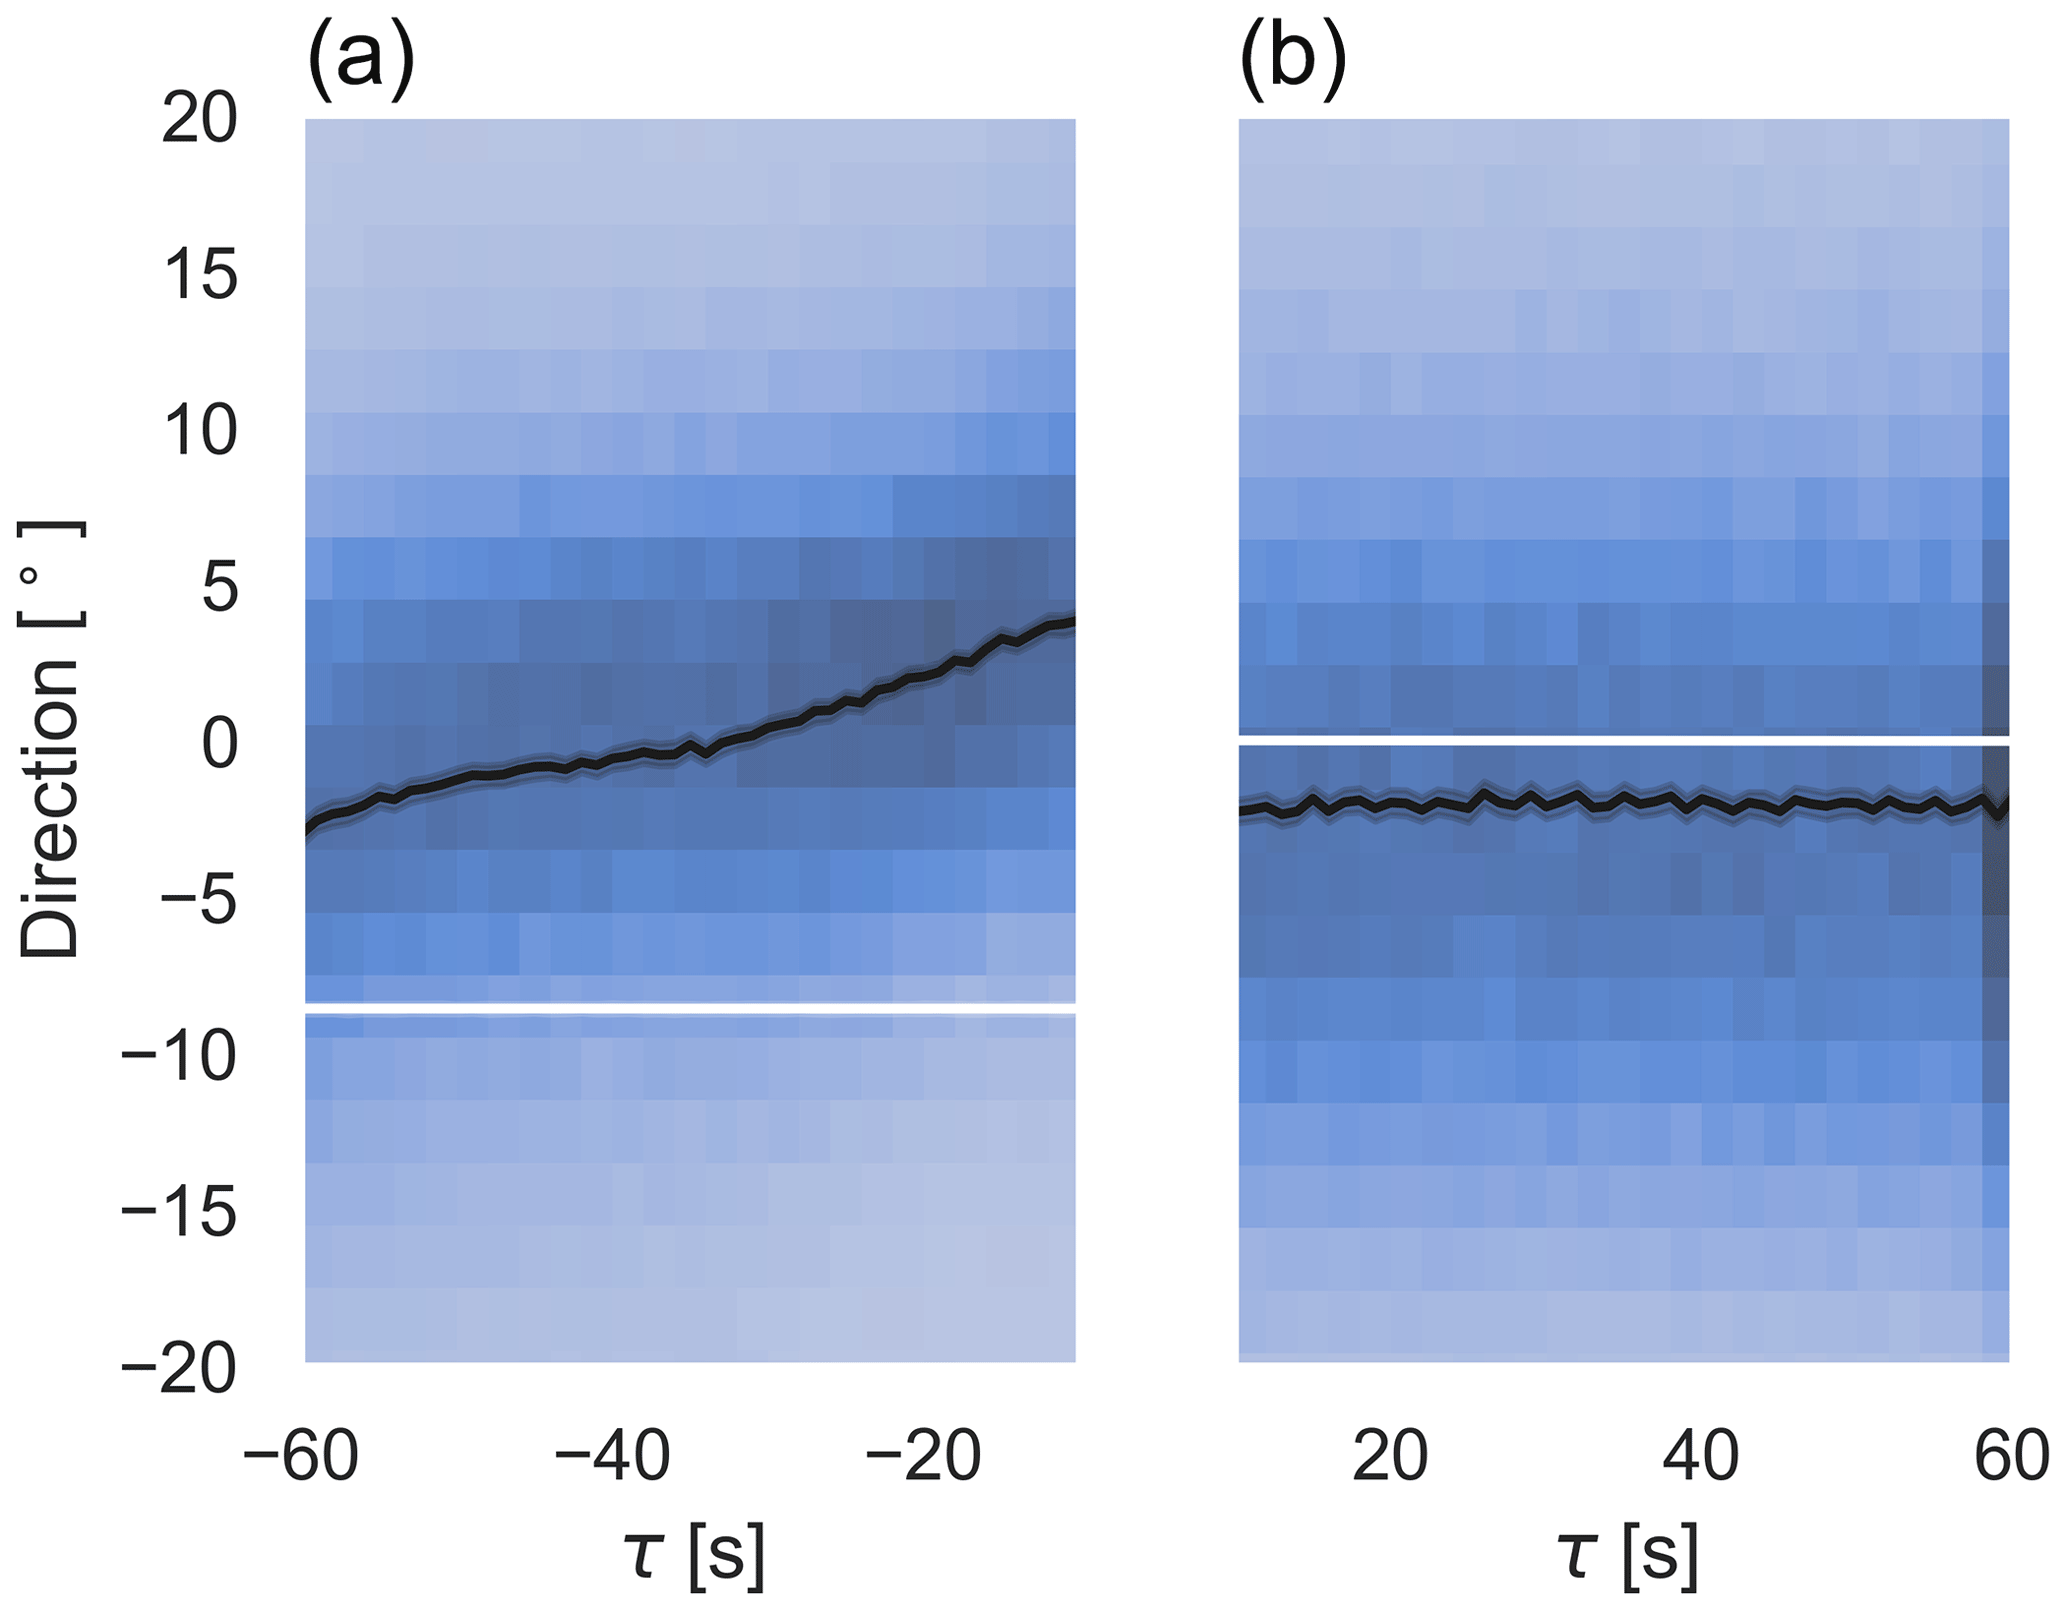
Figure 9A 2D histogram of wind direction measured by the wind vane of the Bard 5.0 wind turbine before (a) and after (b) a cw yaw manoeuvre centred around the yaw angle at the end of the yaw manoeuvre. The blue colouring indicates the number of occurrences, with a darker blue indicating a higher count. The average wind direction (see Eq. 4) is shown in black with a 99 % confidence interval displayed by the thin grey band around the black line. The yaw angle (see Eq. 5), also with its 99 % confidence interval, is displayed in white.
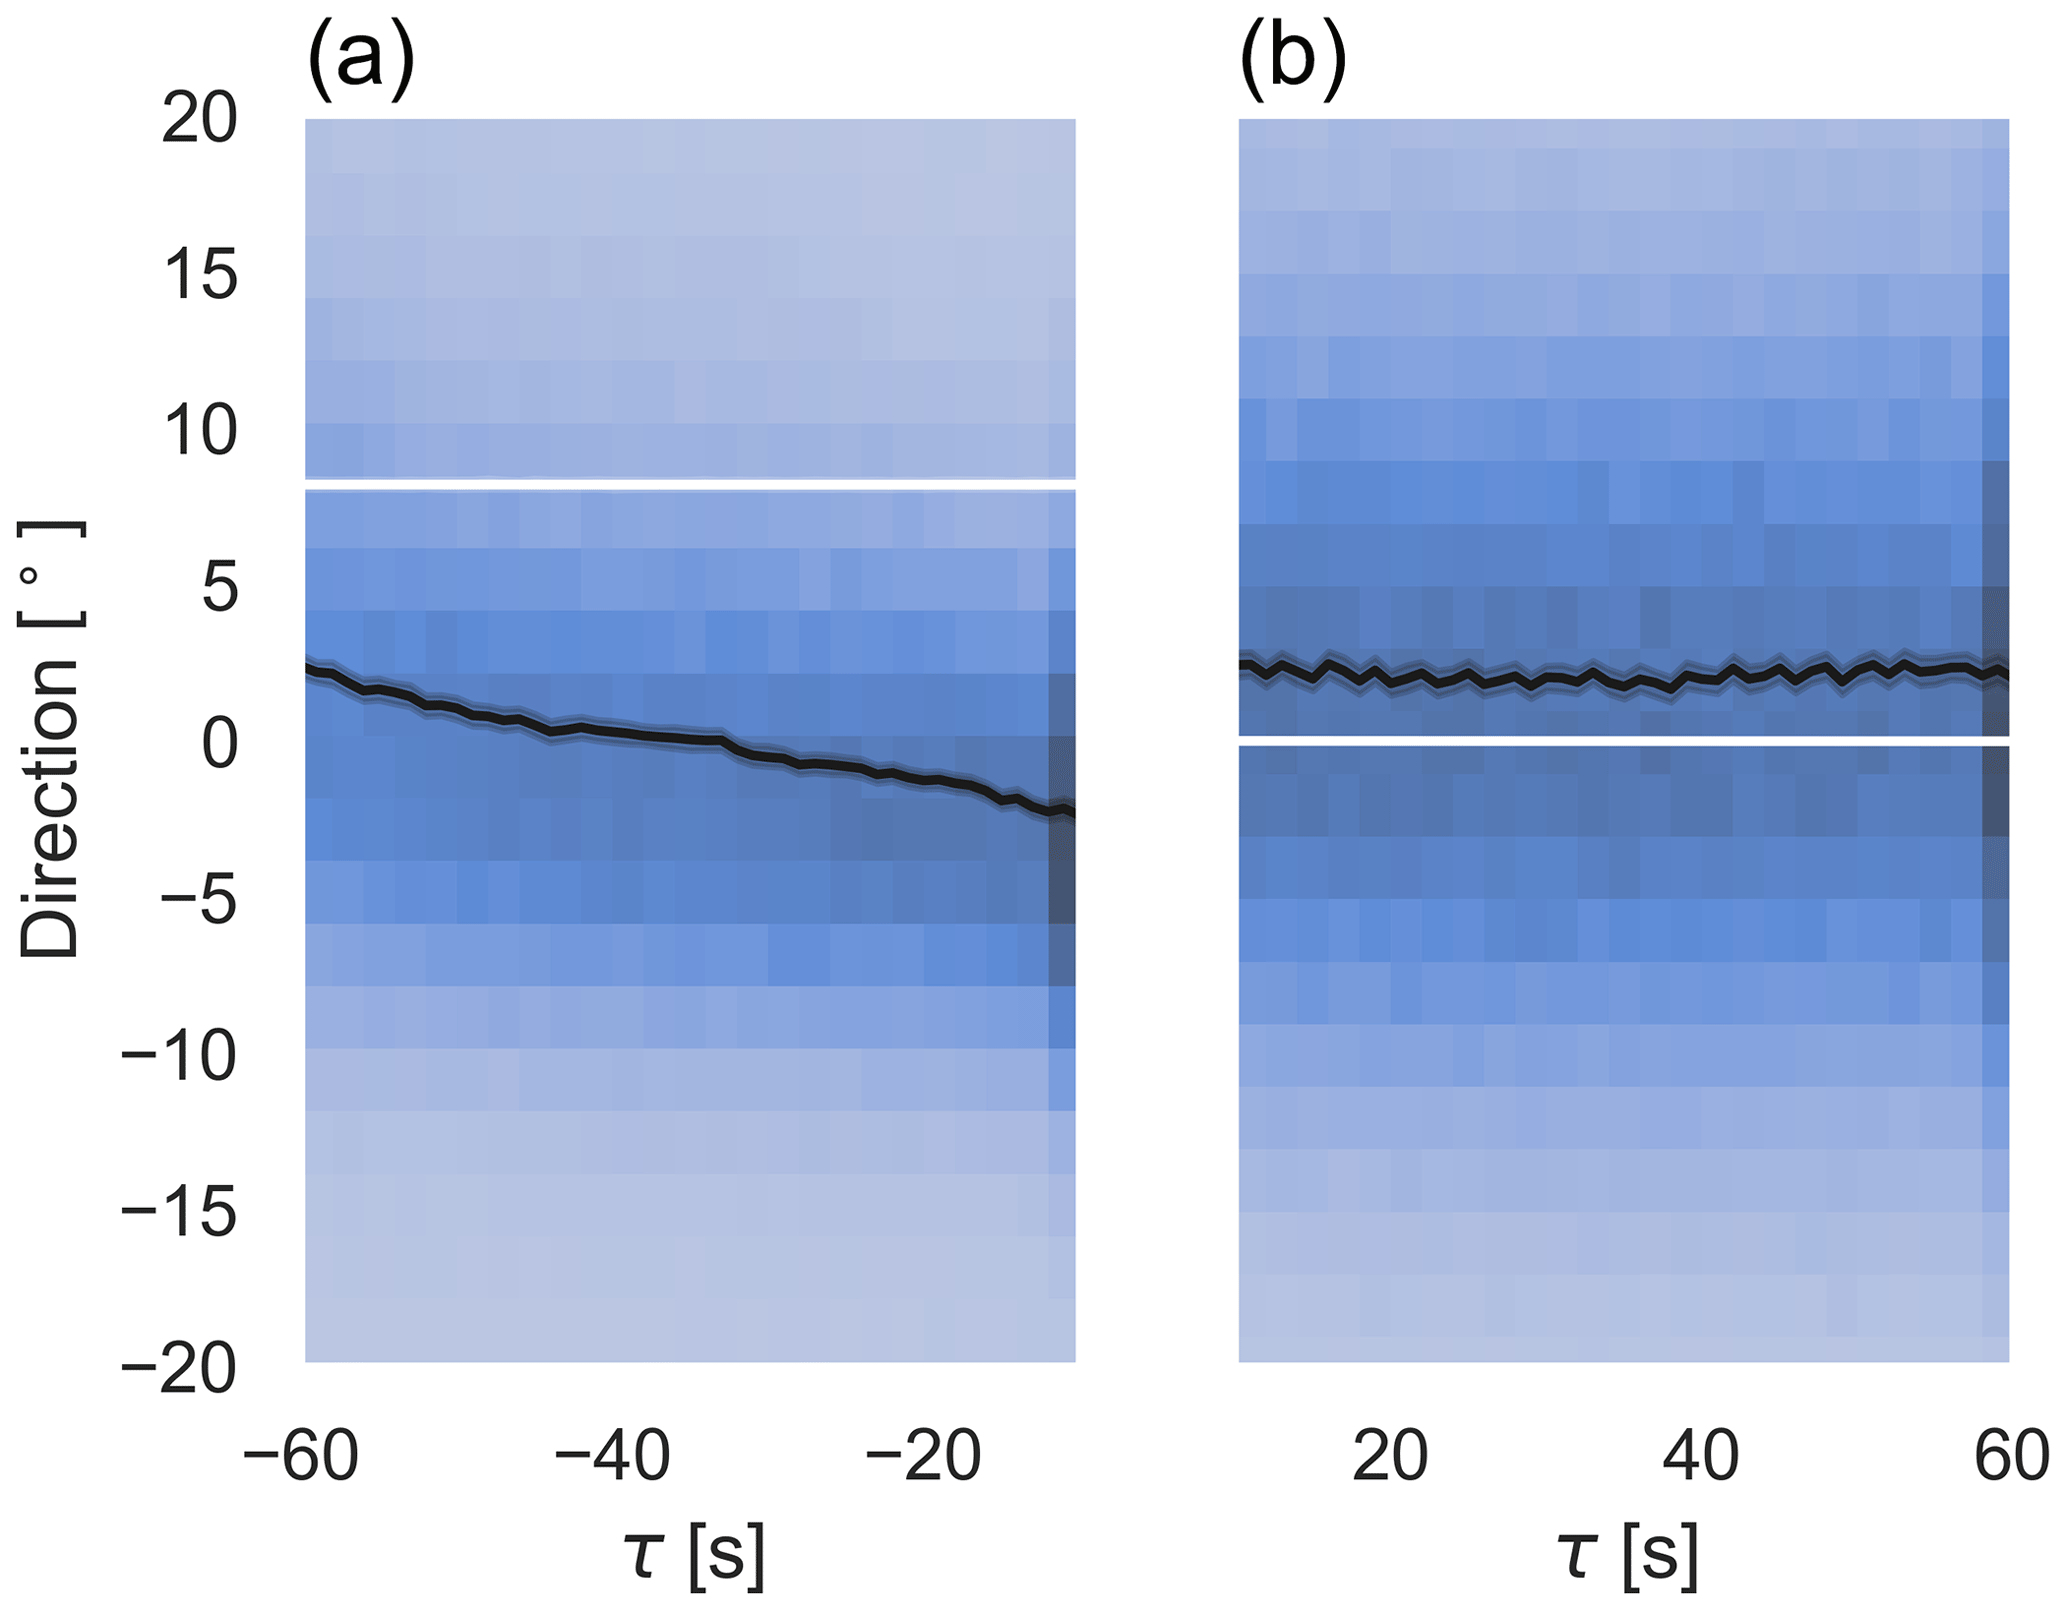
Figure 10A 2D histogram of wind direction measured by the wind vane of the Bard 5.0 wind turbine before (a) and after (b) an acw yaw manoeuvre centred around the yaw angle at the end of the yaw manoeuvre. The blue colouring indicates the number of occurrences, with a darker blue indicating a higher count. The average wind direction (see Eq. 4) is shown in black with a 99 % confidence interval displayed by the thin grey band around the black line. The yaw angle (see Eq. 5), also with its 99 % confidence interval, is displayed in white.
In this time period, we recorded 4234 yaw manoeuvres in the cw direction and 4082 in the acw direction.
The time series of each yaw manoeuvre were averaged as described in Eq. (4) and plotted as a black graph, with a 99 % confidence interval. The individual measurements of the wind direction are displayed in a 2D histogram, which reflects the frequency by a blue colouration. The yaw angle of the wind turbine was averaged according to Eq. (5) and is displayed in white. Since the yaw manoeuvres can be of different magnitudes, we have also given a confidence range for the yaw angle before the manoeuvre, although the confidence range is very small, so it is hardly visible.
In both figures, an increase in the wind direction deviation can be seen before the yaw manoeuvre. This increase in the deviation can be explained by the fact that a yaw manoeuvre is triggered by the yaw controller when a moving average value of the wind direction deviation exceeds a certain threshold value. Since we filtered for exactly these situations, we can see an increase in the moving average up to the point where a yaw manoeuvre is triggered.
Both figures further reveal that after a yaw manoeuvre, on average, the measured wind direction does not match the orientation of the wind turbine but that the wind turbine has overshot the target by 2 to 3∘ for both cw and acw yaw directions.
For the calculation of the correction factors, we use Eq. (11). From the measurements of the cw yaw manoeuvres we retrieve an average wind direction deviation before the yaw manoeuvre of ∘ and after the yaw manoeuvre of ∘, which results in a correction factor of . Analogously, the wind direction deviation before the yaw manoeuvre for the acw cases is ∘ and after the yaw manoeuvre . The correction factor for the acw yaw manoeuvres is therefore .
3.3 Free-field experiment of wind vane correction
We conducted experiments at the Rysumer Nacken test field on the Bard 5.0 wind turbine to investigate the effects of wind vane correction on the operation of a commercial wind turbine. Since the operation of a wind turbine depends on uncontrollable and random conditions, we wanted to build a database that would give us a good comparison between normal operation and operation with wind vane correction. For this reason, we ran the wind turbine alternately for 1 h in normal operation and 1 h with wind vane correction enabled. We repeated this procedure until we collected sufficient data. We refer to this procedure as a “toggle test”.
We performed the first toggle test during the period from 6 July to 26 August 2021. In this experiment, we use the correction model described above (see Eq. 11) with a correction factor of c=0.8 for the wind vane since our investigations at the time of the experiments resulted in this correction factor. This means that the wind vane signal φwt(t), used in the yaw controller to steer the wind turbine orientation, was multiplied by this factor directly at the input, i.e. for the yaw trigger and the yaw target. We denote the corrected wind vane measurement as .
In the second toggle test, performed from 1 September to 19 November 2021, we also use a correction factor of c=0.8. However, this test uses the unmodified wind vane measurement φwt(t) for the yaw trigger. The corrected value φcorr(t) is applied only for the yaw target.
For the evaluations of the tests, we consider the number of yaw manoeuvres in the respective test period. We analyse the step response of the measured wind direction deviation during a yaw manoeuvre according to Sect. 2.4.2, and we investigate the influence on the power output by calculating the changes in the power curve.
3.3.1 Evaluation of the toggle tests
This section summarizes the results of the two toggle tests that were conducted in the Rysumer Nacken test site on the Bard 5.0 wind turbine. Table 1 lists the most important statistics of the toggle tests, which are referred to in the following when describing the individual test results.
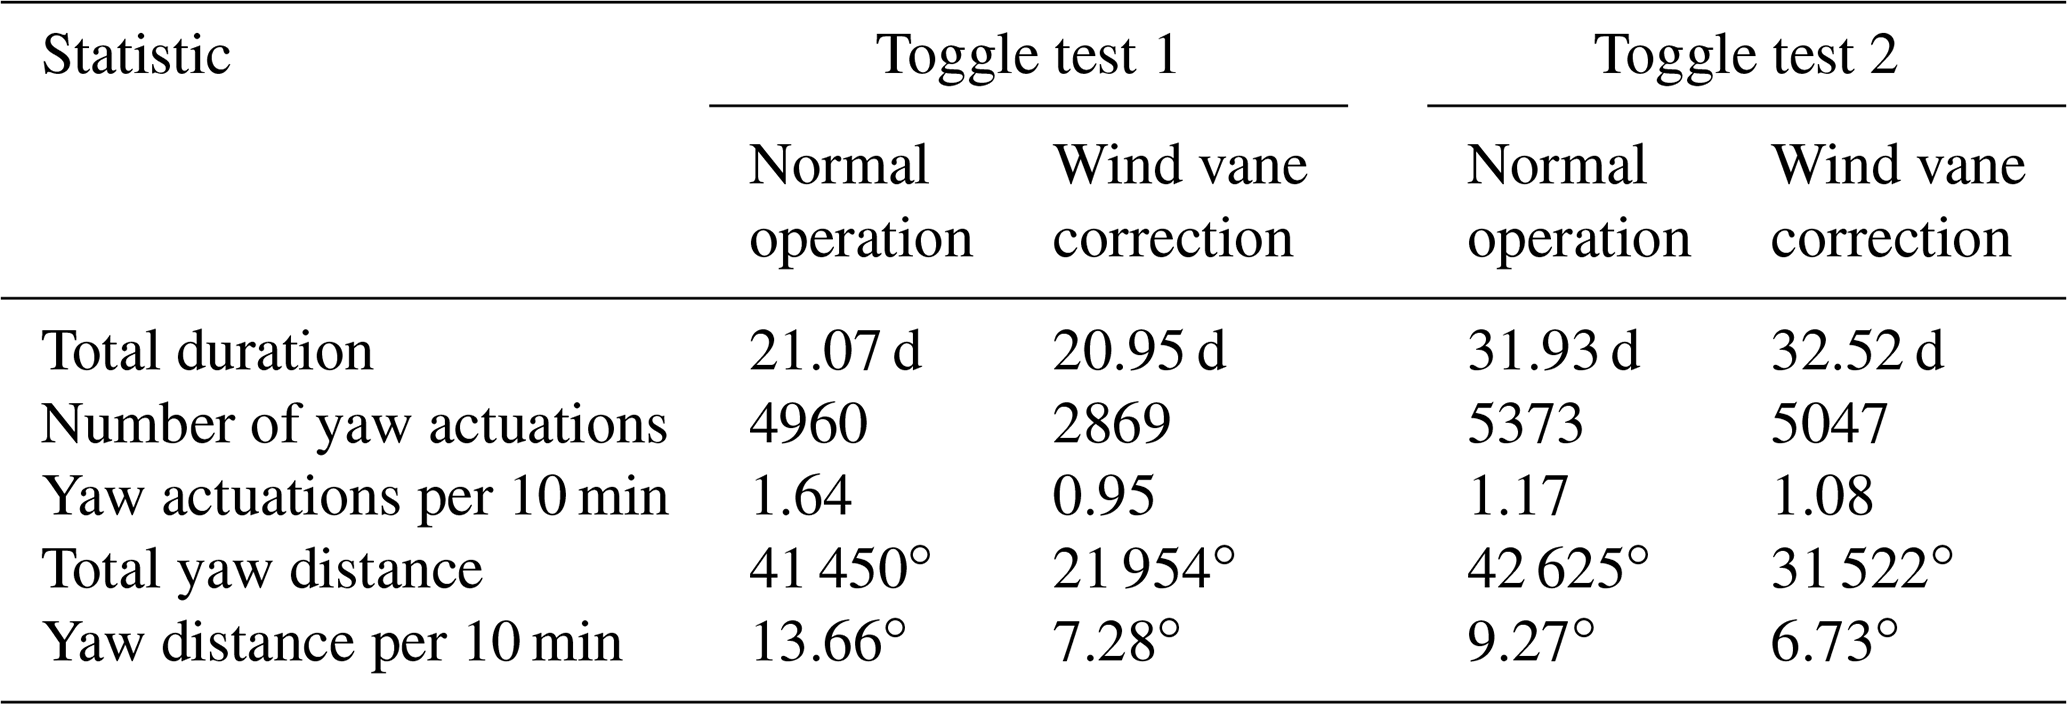
Even though the period of normal operation was the same as the period with activated wind vane correction when performing a toggle test, the “total durations” differ here. The data filtering can explain this, since only periods in which the wind turbine was active and operated in the partial-load range with no active power curtailment applied were considered.
In the first toggle test, the turbine performed on average 0.95 yaw actuations in 10 min with the activated wind vane correction, turning 7.28∘ per 10 min on average. Compared to 1.64 yaw manoeuvres and a yaw distance of 13.66∘ per 10 min on average in normal operation, this is a reduction of 41.8 % in actuations and 46.7 % in total yaw distance.
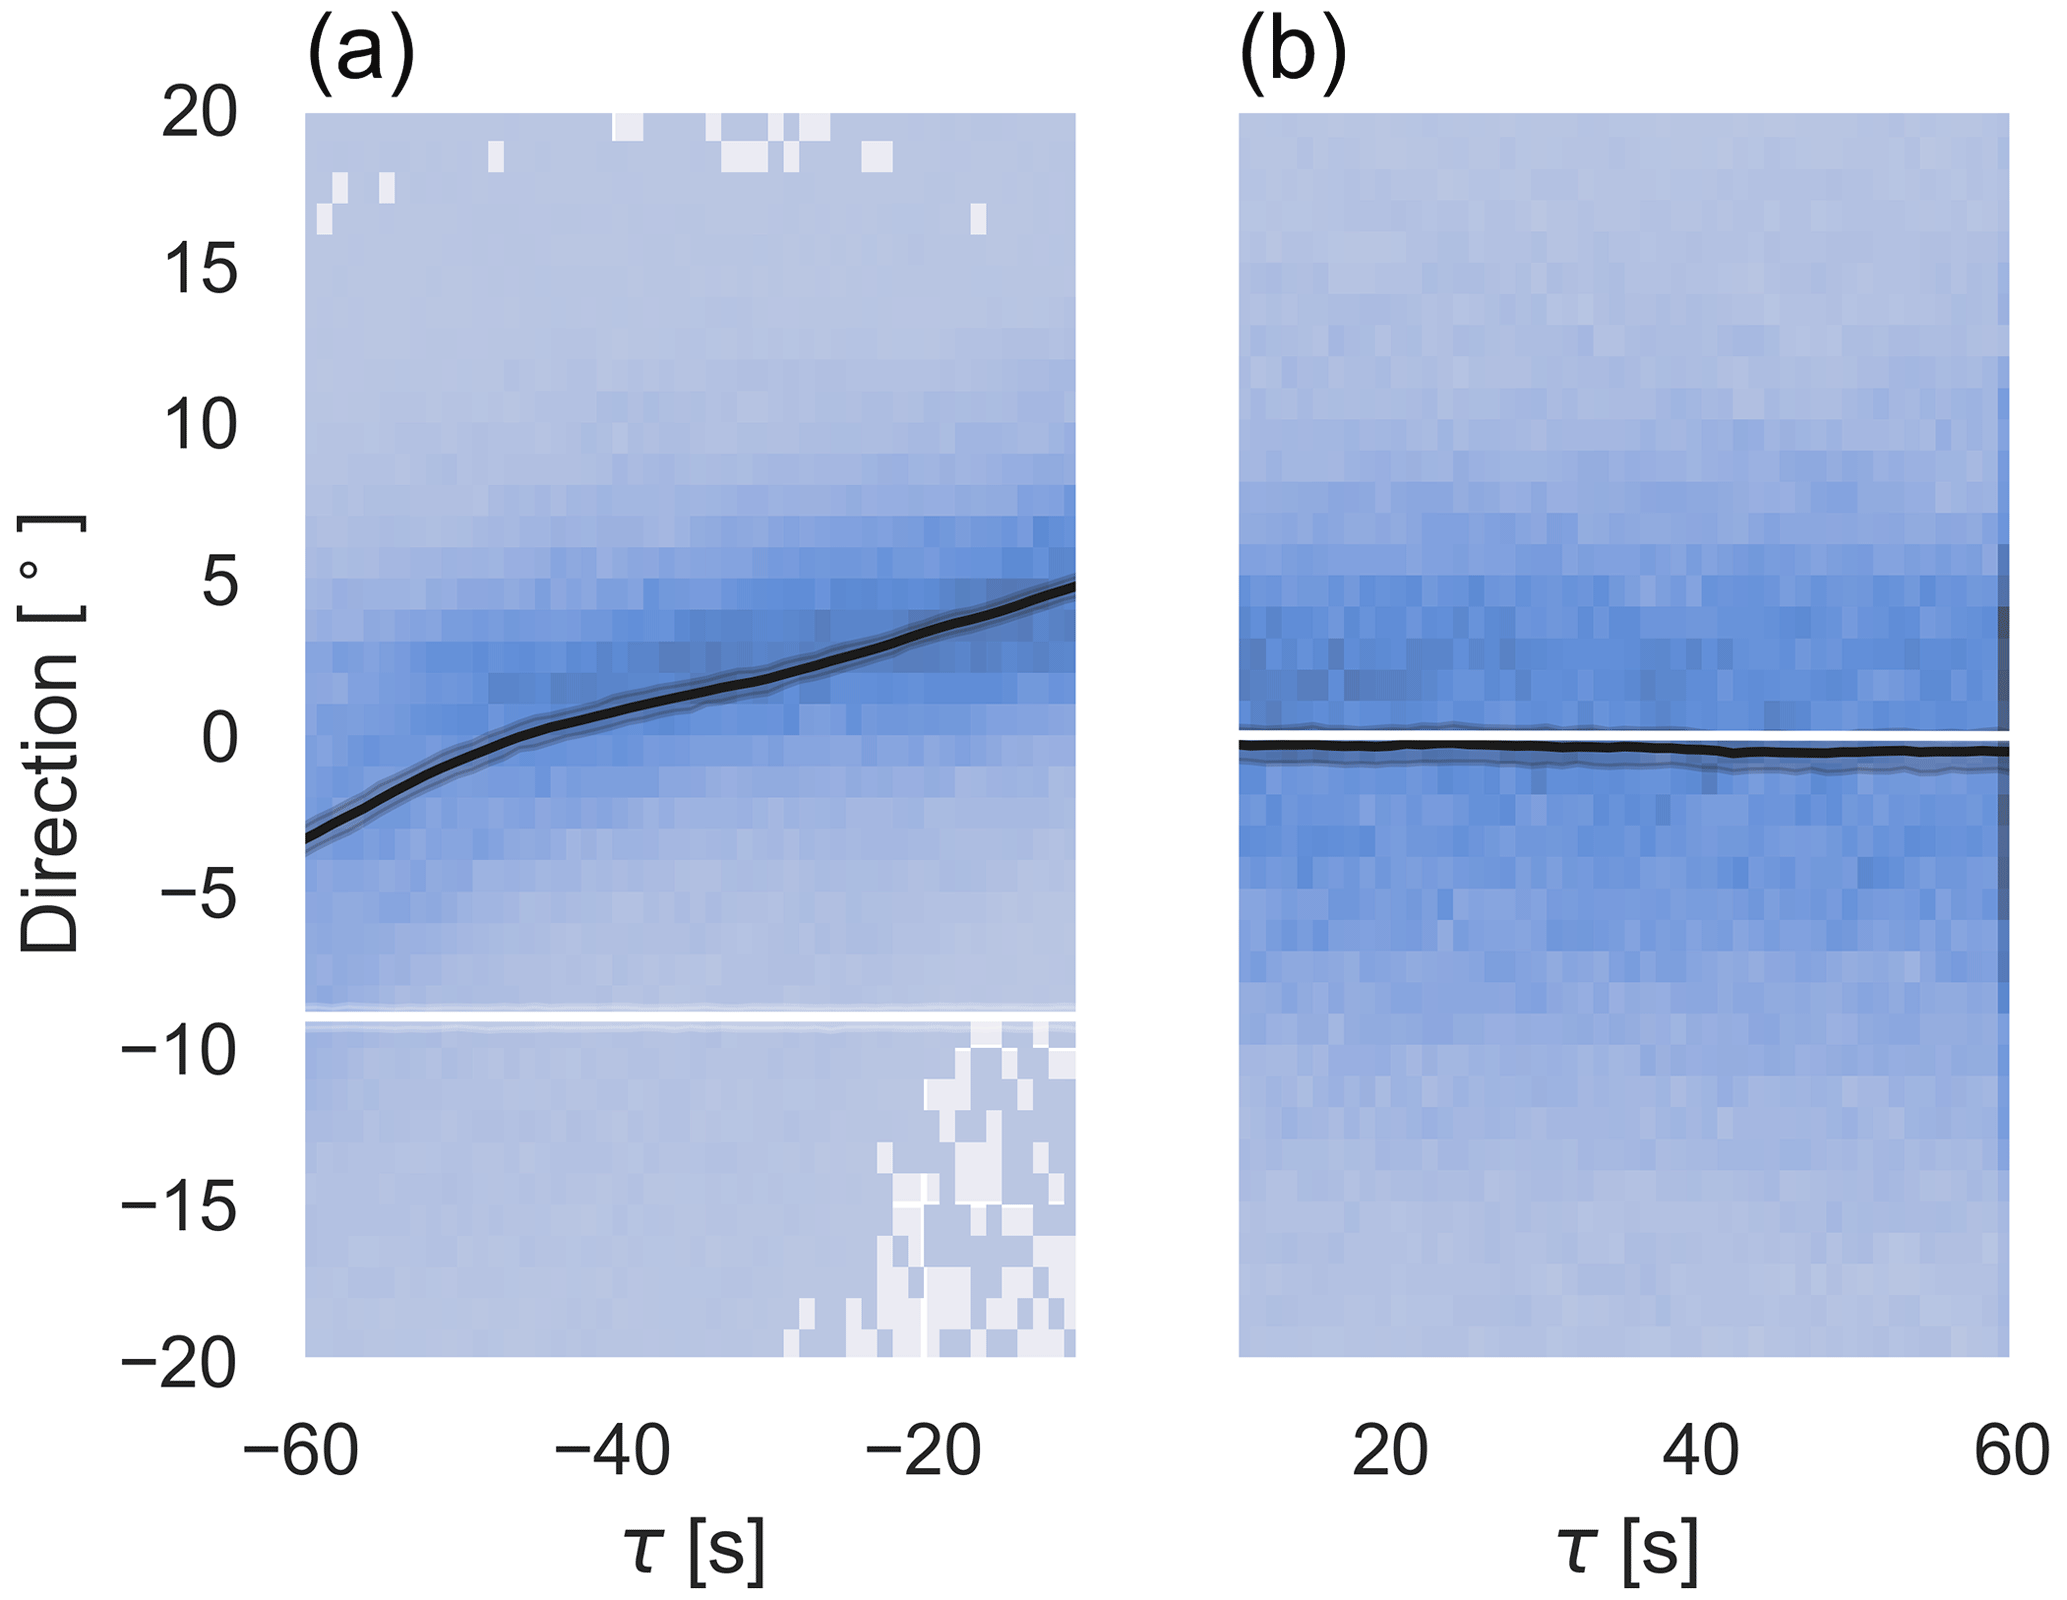
Figure 11A 2D histogram of wind direction measured by the wind vane of the Bard 5.0 before (a) and after (b) a cw yaw manoeuvre centred around the yaw angle at the end of the yaw manoeuvre for activated wind vane correction in the first toggle test. The average wind direction and its 99 % confidence interval are shown in black. The yaw angle is displayed in white.
The yaw distance, in general, is closely related to the actuator duty cycle (ADC) of the yaw controller. The Bard 5.0 turbine yaws at an average rotational speed of about 0.75∘ per second, so the average yaw distance per 10 min of 13.66∘ for normal operation takes approximately 18.21 s, which means that the yaw motor is active about 3 % of the time. Due to the inertia of the nacelle, the rotation speed is not entirely constant; therefore, this conversion is only an approximation. Thus, in this evaluation, we only use the average yaw distance per 10 min and not additionally the ADC.
In the second toggle test, the yawing activity was reduced from 1.169 yaw actuations per 10 min in regular operation to 1.078 per 10 min with wind vane correction activated, i.e. by 7.8 %. Due to the wind vane correction, the yaw distance experienced a reduction of 27.4 % from 9.27 to 6.73∘ per 10 min.
For both test cases, we aggregated the wind direction deviation before and after the yaw processes as described in Sect. 2.4.2 and present them in Figs. 11 and 12 for the first test case, similar to Figs. 9 and 10. The measurements shown are the 10 s moving average wind direction measurements. It can be seen that the alignment of the wind turbine and the measured wind direction at the wind vane match better after the yaw process compared to Figs. 9 and 10. The result for the second test case looks very similar to this figure, so we do not show it here.
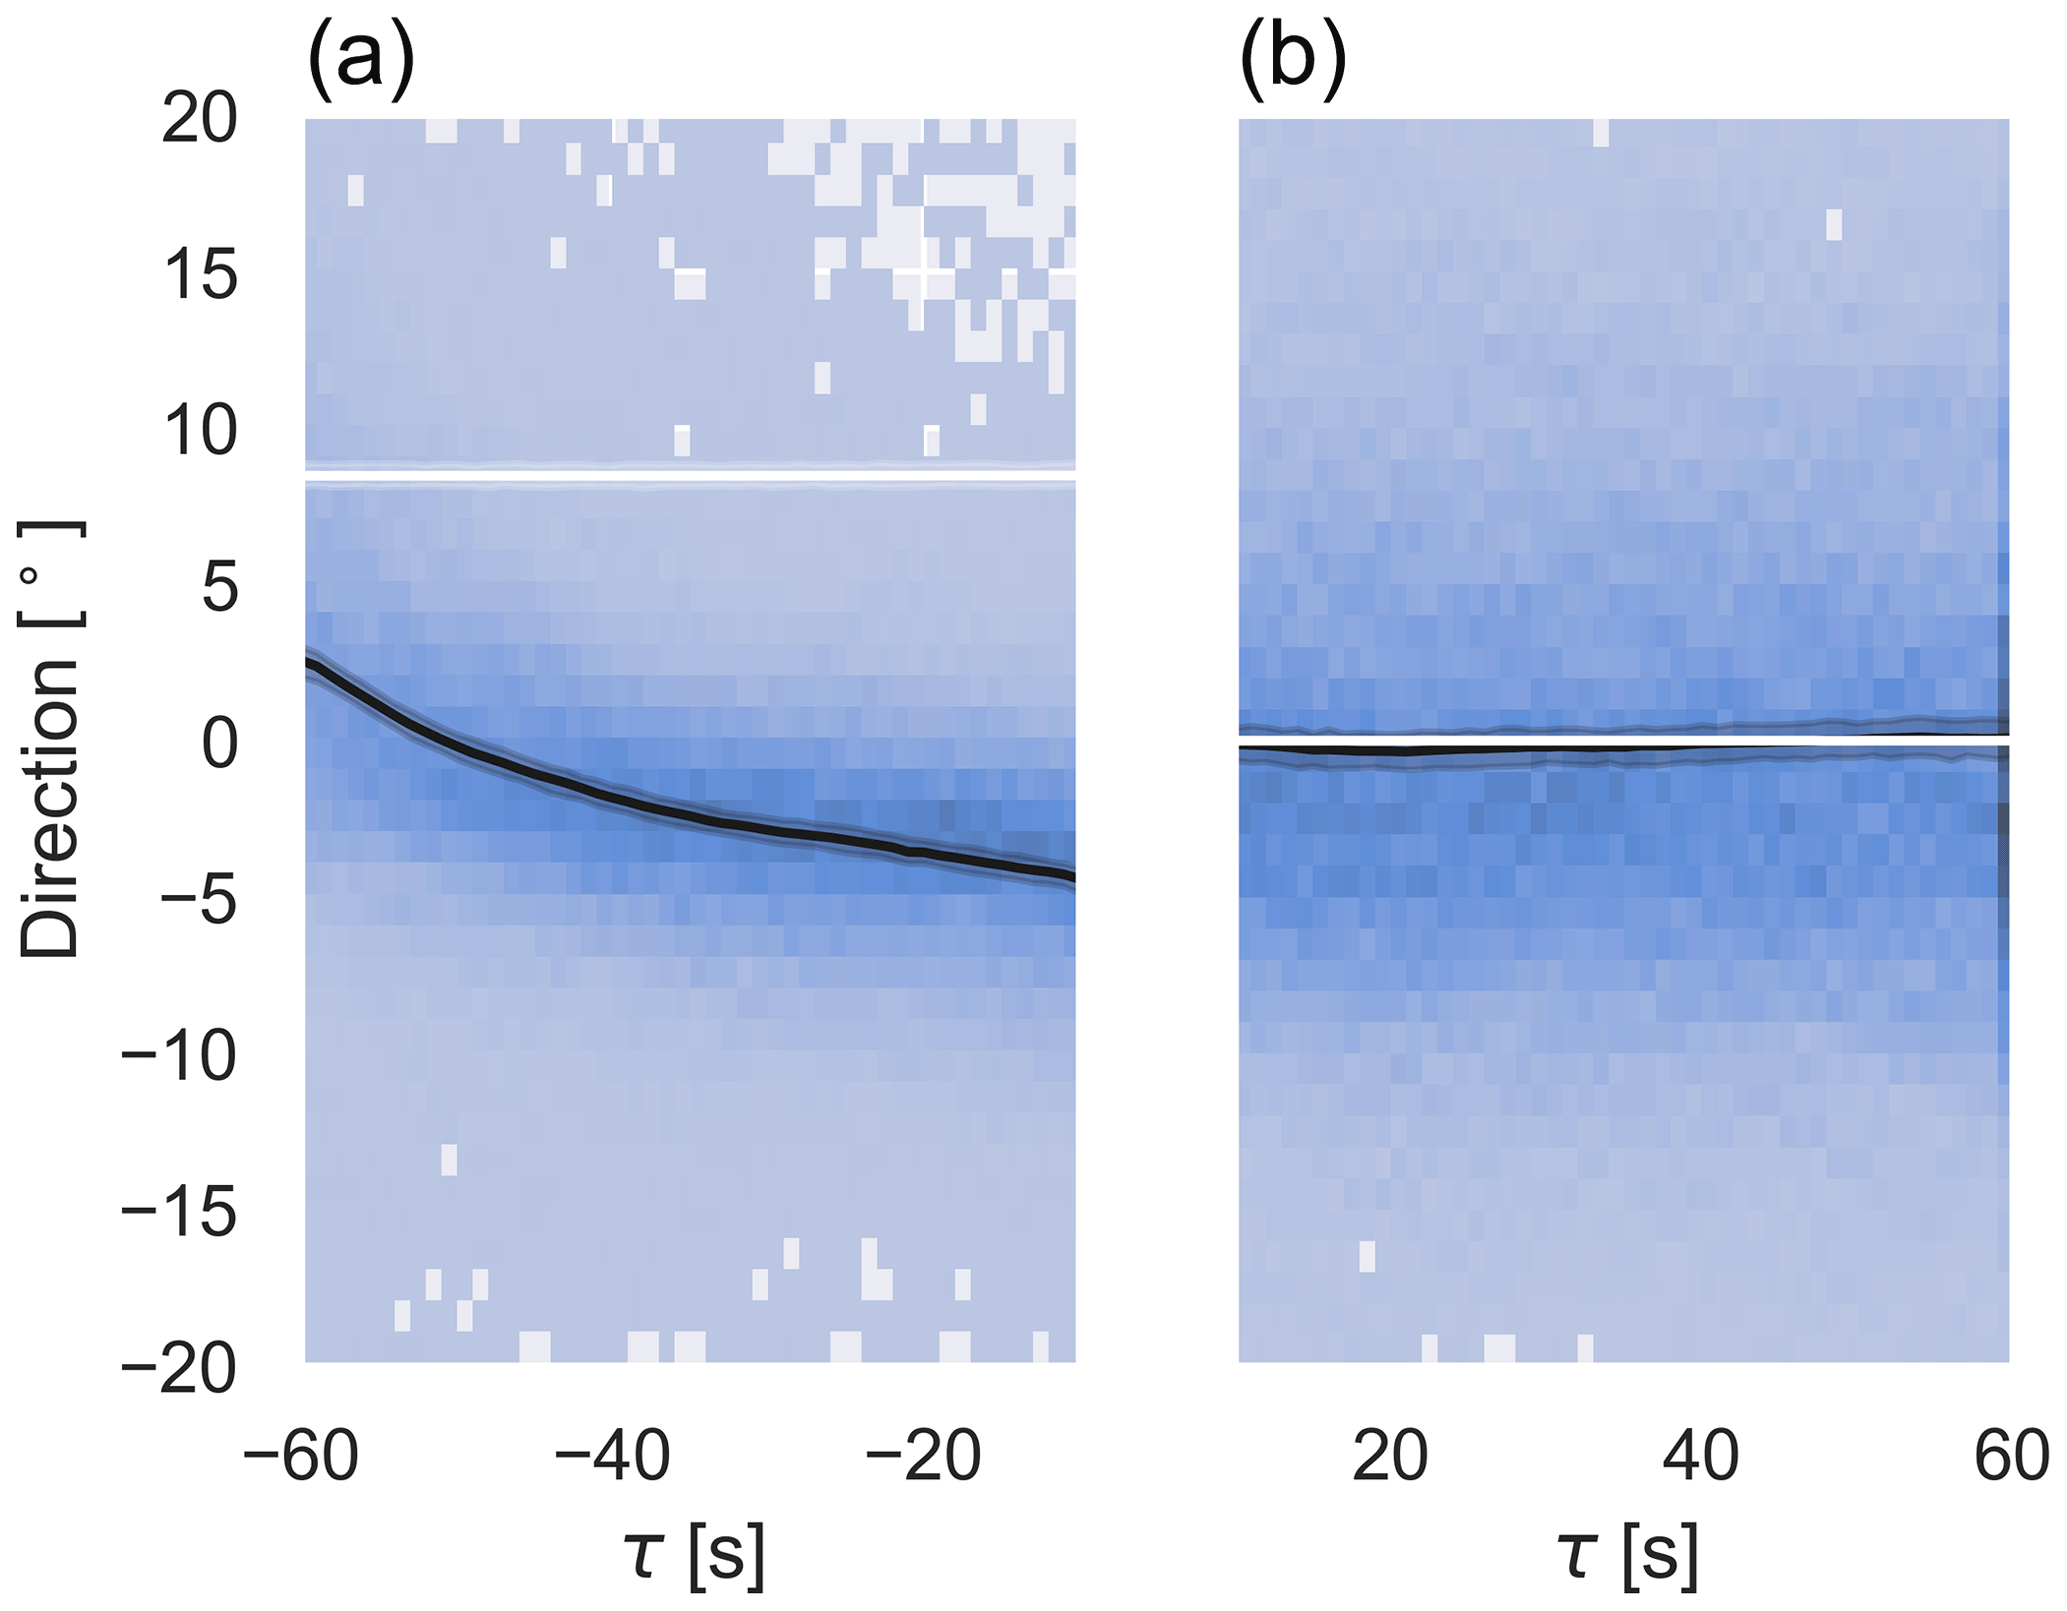
Figure 12A 2D histogram of wind direction measured by the wind vane of the Bard 5.0 before (a) and after (b) an acw yaw manoeuvre centred around the yaw angle at the end of the yaw manoeuvre for activated wind vane correction in the first toggle test. The average yaw misalignment and the 99 % confidence interval are shown in black. The yaw angle is displayed in white.
To identify the influence of the wind vane correction on the performance, we determined the power curves binned in 1 m s−1 steps from the 10 min data for both conditions in both test cases. We calculated the absolute power difference for each bin , where Pcorr is the power output with the wind vane correction active, and Pstandard is the power output during standard yaw control, with no wind vane correction.
Figure 13 shows the difference in these power curves for the first toggle test and Fig. 14 for the second toggle test. In addition to the difference, we added error bars. These were calculated from the square root of the sum of the squared standard errors in the mean of both power curves multiplied by 2.576 to give an estimate of the 99 % confidence interval.
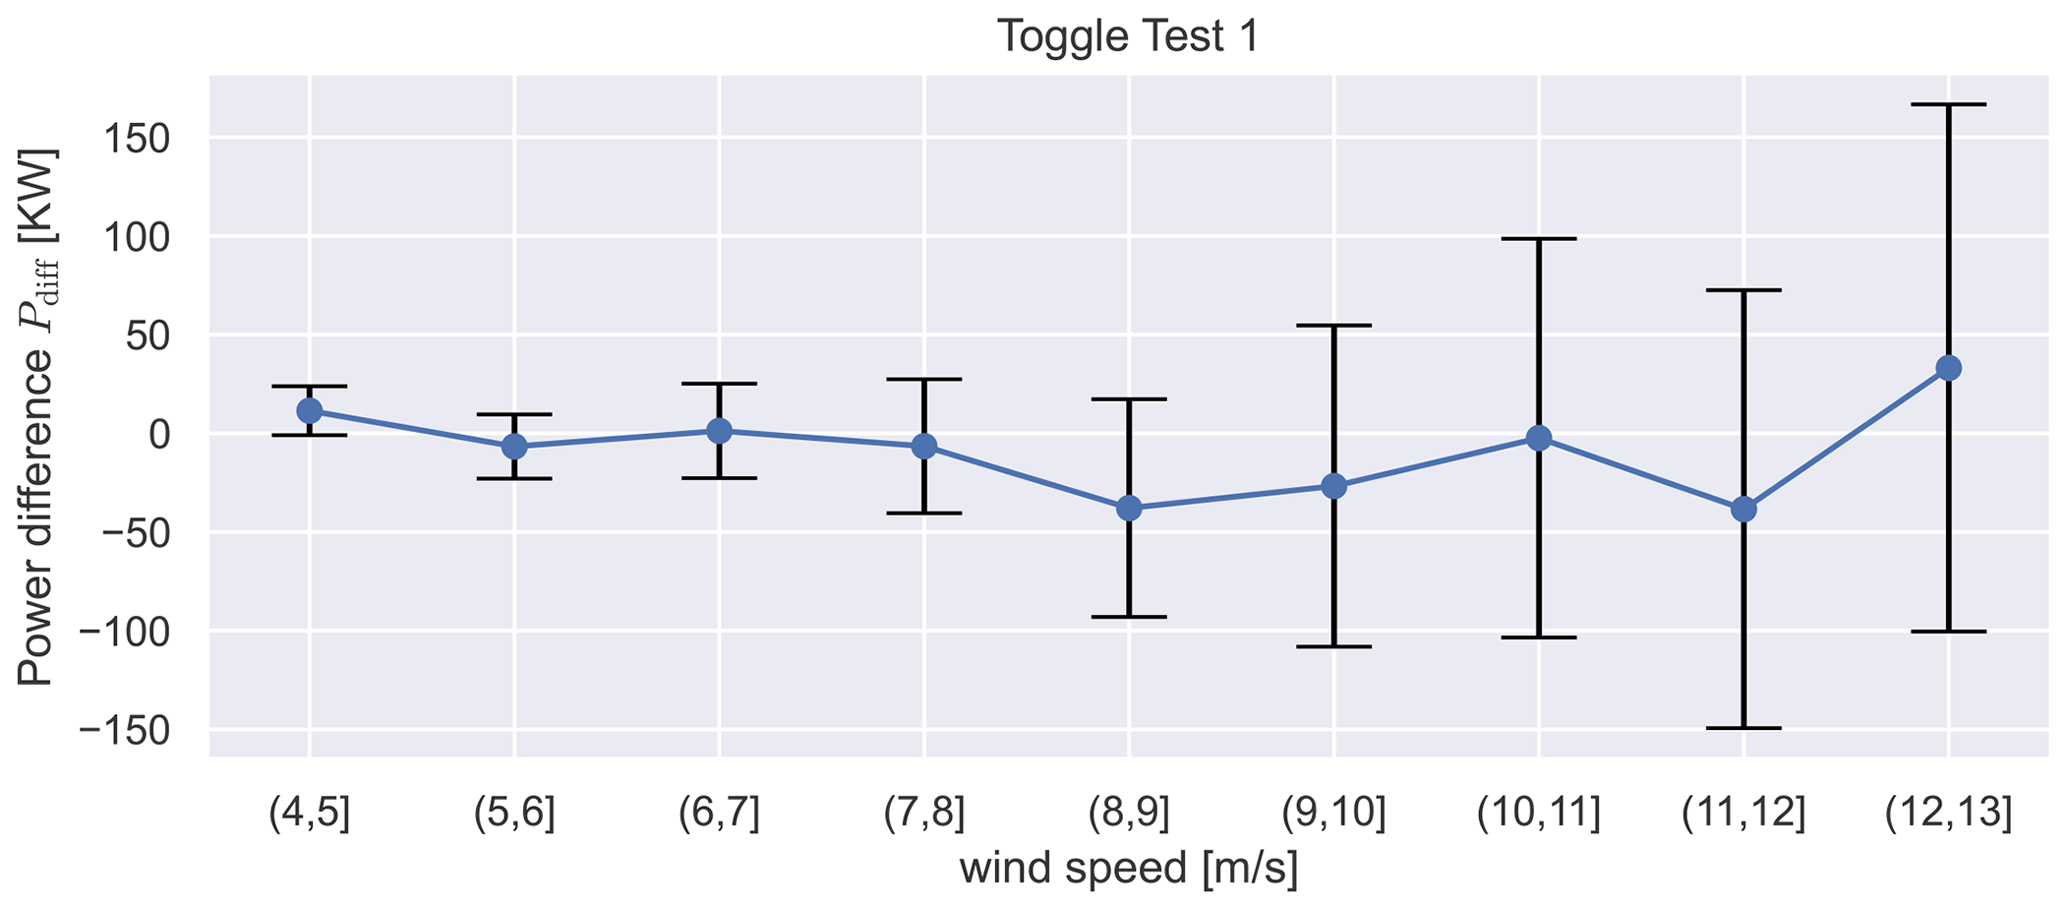
Figure 13The power difference between the activated wind vane correction and regular operation over wind speed binned in 1 m s−1, with an error bar, which represents the 99 % confidence interval for toggle test 1.
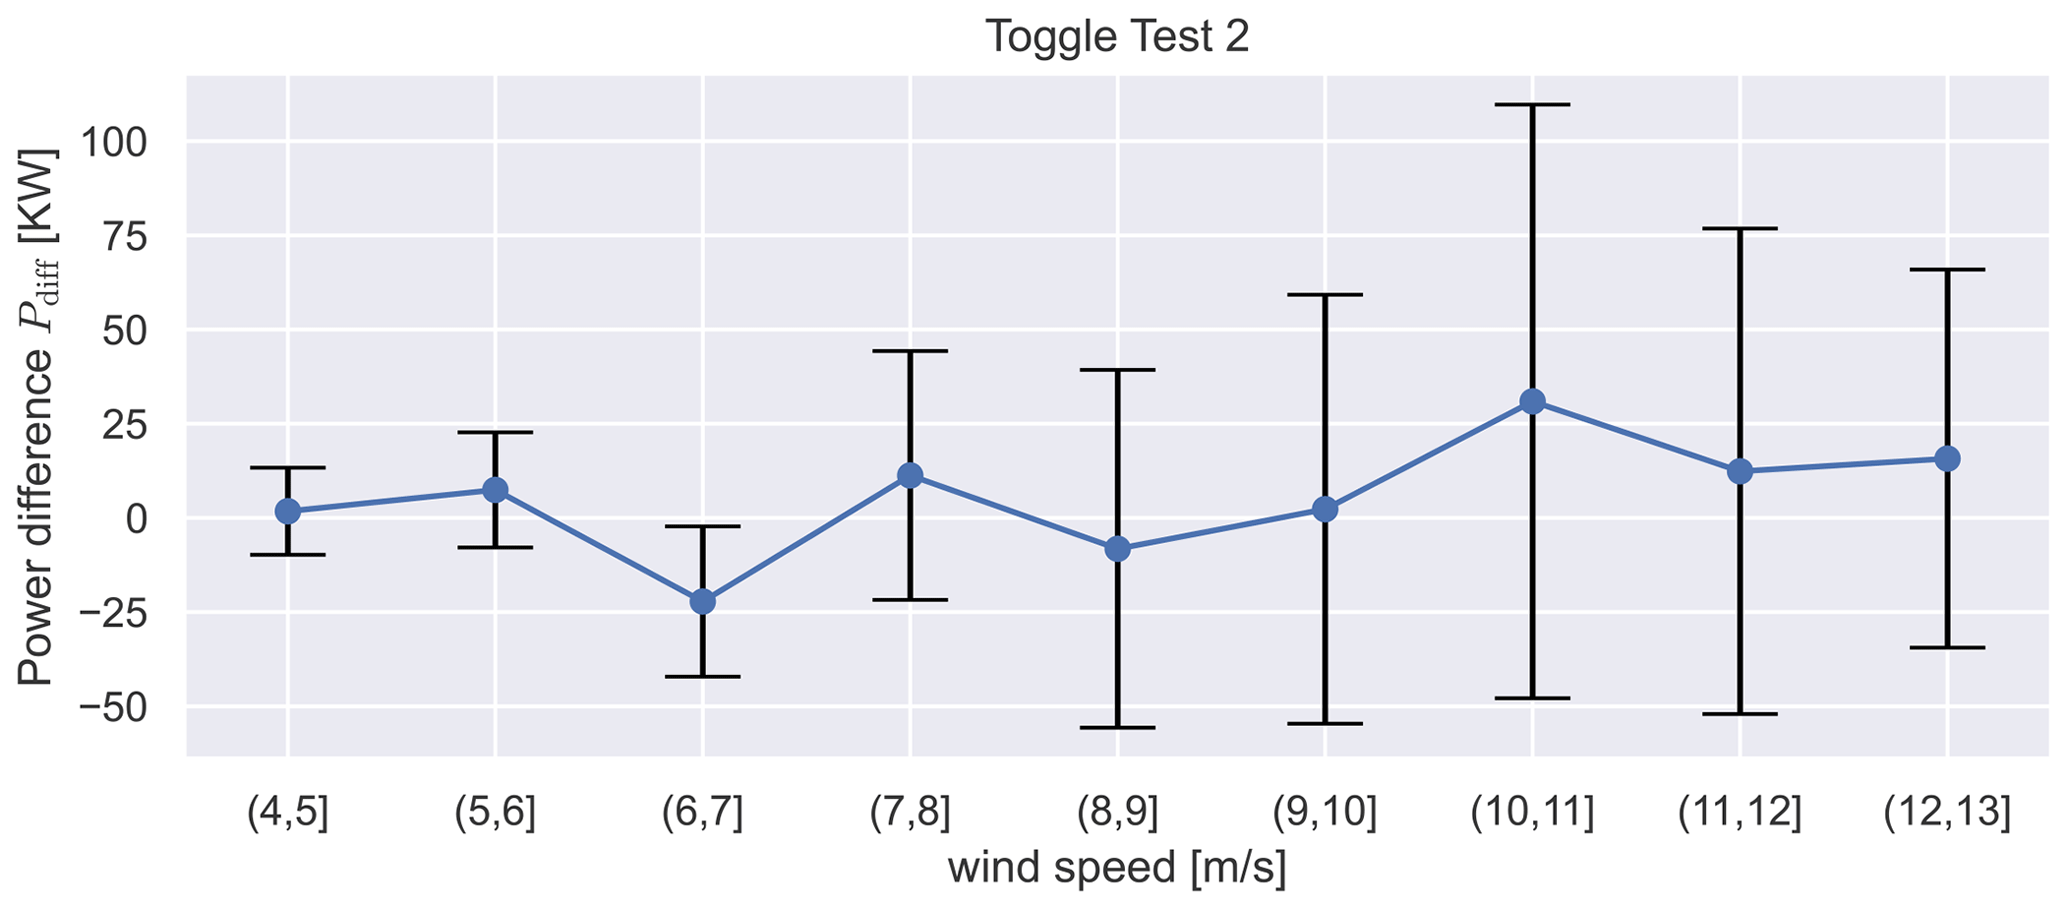
Figure 14The power difference between the activated wind vane correction and regular operation over wind speed binned in 1 m s−1, with an error bar, which represents the 99 % confidence interval for toggle test 2.
Figure 13 shows that in the first toggle test, on average, less power is produced by the wind vane correction for most wind speeds. Still, the fluctuations in the measurements are so large that this is not statistically significant. In Fig. 14, more power is produced during the second toggle test for most wind speeds by the wind vane correction, but the difference is not statistically significant here either.
For both test cases, we calculated the influence on the annual energy production (AEP) using the average values and an assumed Weibull wind distribution (Weibull scale parameter A=11.33 m s−1 and Weibull shape parameter k=2.29). For toggle test 1, this results in a loss of power generation of −0.43 % and for toggle test 2 an increase in power of 0.06 %.
The CFD simulations we performed (see Sect. 3.1) to better understand the mean wind direction immediately behind the rotor plane support our hypothesis that the rotor's thrust deflects the flow at the wind vane location during yaw misalignment. This effect affects the far wake, as previously shown in other studies (Jiménez et al., 2010; Bastankhah and Porté-Agel, 2016), and has an impact on the flow directly above the nacelle and thus on conventional wind vanes of a wind turbine. However, our simulations only serve as a proof of concept, as we used ideal conditions (uniform flow) for the calculations in order to be able to represent the effect of the rotor on the flow in isolation. We focused our investigation on an average error in the wind vane signal. For modelling the wind vane error, we assumed a simple affine linear function, which seems to be confirmed in the CFD simulations in the range of −20 to 20∘. In general, we believe that this model is appropriate for small misalignments but no longer applies to larger misalignments, as the turbine's thrust decreases in these situations, and the overestimation of the wind vane should not increase linearly anymore. The influence of more complex conditions, such as increased turbulence intensity as in an unstable atmospheric condition or stronger veer and shear in the flow as in a stable atmospheric condition, was not investigated in the simulation here. For further future investigations, spatially high-resolution large eddy simulations (LES) could be used to study complex conditions and dynamic inflows in combination with different yaw controllers.
The comparisons between met mast measurements and wind turbine measurements (see Sect. 3.2.1) also show that the wind vane tends to overestimate the deviation of the wind direction, both at the Bard 5.0 wind turbine at the Rysumer Nacken test site and the eno114 wind turbine in Kirch Mulsow. A direct comparison is difficult because the met mast is located at about 2.5D (approx. 300 m) from the wind turbine and, therefore, experiences a slightly different flow. In addition, we filtered out wind direction sectors for each site, as in these, the met mast would be in the wake of the surrounding wind turbines, and the wind direction measurement would thus be affected. Nevertheless, the measurements on both test sites confirm our hypothesis in general. In the case of the Rysumer Nacken test field, it can be observed that the measurement data are not centred around 0∘. This is due to the fact that the measurement values of the wind vane are the raw values without the offset correction and that the measurement mast has a slightly different northing to the orientation of the wind turbine. We received the offset-corrected measured values at the Kirch Mulsow test site. However, in the case of Kirch Mulsow it is also interesting that we considered larger misalignments here, and it shows in Fig. 8 that the values in the centre receive a proportionally larger deflection than the outer values, which speaks against a linear model for the overestimation. One can assume that the thrust decreases with greater misalignment, and therefore the deflection also becomes weaker and no longer increases linearly. For the misalignments analysed here, however, the linear model seems to be sufficiently accurate. In a similar study, Simley et al. (2021) compared wind vane measurements with those obtained from a nacelle-based lidar, in contrast to our research, which utilized measurements from the met mast. Although Simley et al. (2021) conducted their study on a different turbine and employed other reference measurements, their findings are consistent with ours, demonstrating that the wind vane overestimates wind direction deviation.
Simley et al. (2021) also encountered a problem with regression dilution when performing linear regression. To mitigate this issue, they attempted to reduce the uncertainties in the prediction variable through binning. In contrast, we opted to use orthogonal distance regression (ODR), which accounts for the uncertainties in both variables, to circumvent the problem with linear regression.
The comparison of the wind vane measurements before and after the yaw manoeuvre (Sect. 3.2.2) has the advantage that it can be performed without external measurements. Thus, a correction factor for the wind vane can be determined for a wind turbine with no reference measurement, such as a measuring mast or a lidar. Similar to the analysis of a step response for linear time-invariant control systems, this method opens up the possibility of analysing the effect of misalignment on a variety of variables, such as power, wind speed measurements, or load measurements, if available, albeit in an empirical rather than deterministic manner.
The evaluations of both toggle tests (Sect. 3.3.1) have shown that the correction factor improved the wind turbine's alignment to the wind direction on average after the yawing process. In the first toggle test, the correction factor was applied to the wind vane measurement for the yaw trigger and the yaw target. The results show that the yawing activity was significantly reduced (by 41.82 %), but this was at the expense of performance, as the corrected wind vane resulted in larger misalignments than in normal operation. However, the reduction in yawing activity is not only related to allowing larger misalignments, as shown by the evaluation of the second toggle test; where the yaw trigger is the same as in normal operation, only the yaw target is affected by the corrected wind vane signal. Nevertheless, the yawing activity was still reduced by 7.78 % compared to normal operation due to a better alignment of the wind turbine after the yaw manoeuvre. In particular, the number of alternating yaw manoeuvres could be significantly reduced. And since the yaw distance of each yaw manoeuvre was by definition 20 % shorter in the second toggle test, the total yaw distance was reduced by more than 27 %. The performance could increase slightly in the second toggle test due to the better alignment. However, the decrease in power in the first toggle test and the increase in power in the second test are not statistically significant. More extended test periods are needed to determine this, mainly because the measurements are not independent samples but correlated time series. The effective sample size is, therefore, even smaller.
Table 1 reveals that the time period of the tests has a large influence on the number of yaw manoeuvres. We suspect that during the second toggle test, which took place in autumn, stable atmospheric stratification was more frequent compared to the first toggle test in summer and that this had an influence on the number of yaw manoeuvres in general. Therefore, it made sense to conduct toggle tests, as the conditions for both test states were largely identical. Nevertheless, a longer test period and a differentiation of the effects of the wind vane correction for different atmospheric stabilities could provide further useful insights.
In our study, each of our investigations (CFD simulation in Sect. 3.1, wind vane and met mast comparison in Sect. 3.2.1, yaw manoeuvre analysis in Sect. 3.2.2) resulted in a correction factor of approximately 0.8, and the toggle tests in Sect. 3.3.1 show great improvement for applying a wind vane correction with this factor. This indicates the general order of magnitude for the correction factor, but this value will depend on the shape of the turbine nacelle and the placement of the wind vane on the nacelle. Therefore, the authors advise that the methods presented here be carefully repeated using data from a wind turbine before applying a correction factor to other wind turbine types.
Overall, our results are consistent with those of Simley et al. (2021) and Kragh and Fleming (2012), indicating that for yaw control based on wind vanes, transfer functions and offset calibration are required to correct wind vane overshoot. In our investigation, we presented methods for parametrizing the transfer function for the specific wind turbine. Atmospheric stability can have a significant impact on these parameters. Therefore, in future studies, we will conduct analyses to determine atmospheric stability and filter data accordingly.
Our study on wind vane measurements during yaw misalignment on two commercial wind turbines and a CFD simulation revealed that wind direction deviation was overestimated by about 20 % to 30 %, with the CFD simulation supporting the hypothesis that this is an inherent characteristic due to the rotor's thrust. To mitigate this problem, we developed a linear correction function and two data-driven methods to parameterize it. These methods involved using measurements from a meteorological mast or analysing wind direction measurements before and after yaw manoeuvres. We tested the correction function on one wind turbine in two scenarios. In the first scenario, the correction was applied to both the yaw trigger and the yaw target, reducing yaw activity by more than 40 %. In the second scenario, the correction was only applied to the yaw target, resulting in a reduction of yaw activity by approximately 8 %. The results also indicated an improvement in alignment with the flow in both scenarios, while power production of the wind turbine was not significantly influenced. Our findings suggest that a corrected wind vane signal is crucial for improved wind turbine control strategies, particularly for wake deflection. Future studies could explore using our correction function and data-driven methods on other wind turbine types and in different environmental conditions.
| Yaw angle after the yaw manoeuvre centred | |
| around the yaw angle at the end of the yaw | |
| manoeuvre, averaged over all considered yaw | |
| manoeuvres, i.e. | |
| Yaw angle before the yaw manoeuvre centred | |
| around the yaw angle after the yaw | |
| manoeuvre, averaged over all considered | |
| cw yaw manoeuvres | |
| γwt | Yaw angle of the wind turbine |
| Yaw angle centred around the yaw angle at | |
| the end of the yaw manoeuvre, averaged | |
| over all considered cw yaw manoeuvres | |
| Estimate for the reference wind direction | |
| Wind direction deviation measured by | |
| the wind turbine, averaged over all | |
| considered cw yaw manoeuvres |
| Time average of over the time T after | |
| the yaw manoeuvre | |
| Time average of over the time T before | |
| the yaw manoeuvre | |
| φcorr | Corrected wind vane measurement |
| φmm | Wind direction deviation of the wind turbine to |
| the inflow measured by the met mast | |
| φref | True or reference wind direction deviation |
| φwt | Wind direction measurement by the wind vane |
| of the wind turbine | |
| Estimate of the time-averaged wind direction | |
| before and after the cw yaw manoeuvre | |
| centred around the yaw angle at the end of | |
| the cw yaw manoeuvre | |
| ωmm | Global wind direction measured by the met |
| mast | |
| ωwt | Wind direction in the global frame of |
| reference measured by the wind turbine | |
| Wind direction centred around the yaw angle | |
| at the end of the respective yaw manoeuvre, | |
| averaged over all considered cw yaw | |
| manoeuvres | |
| Moving time-averaged global wind direction | |
| measured by the wind turbine | |
| A | Weibull scale parameter |
| b | Offset of the transfer function |
| c | Wind vane correction factor and slope of the |
| transfer function | |
| ccw | Correction factor estimated by the yaw |
| manoeuvre analysis for cw yaw manoeuvres | |
| D | Diameter of the wind turbine |
| i | Index variable for the number of cw and acw |
| yaw manoeuvres | |
| k | Weibull shape parameter |
| nacw | Number of acw yaw manoeuvres |
| ncw | Number of cw yaw manoeuvres |
| Pcorr | Average power output of the wind turbine |
| with the corrected wind vane signal over the | |
| wind speed | |
| Pdiff | Absolute power difference between Pcorr |
| and Pstandard | |
| Pstandard | Average power output of the wind turbine |
| over the wind speed with standard yaw | |
| control | |
| T | Duration of time interval before and after the |
| yaw manoeuvre considered | |
| t | Time |
| tye,i | Time at which the ith cw and acw yaw |
| manoeuvre ends | |
| tys,i | Time at which the ith cw and acw yaw |
| manoeuvre starts |
The corresponding author can be contacted to obtain the code used to generate the figures of this manuscript.
AR coordinated the research, developed the methods, and performed the analysis of the measured data. LH performed the CFD simulation, provided the simulation data, and assisted with valuable discussions. PH aided helpful discussions, provided support with respect to gaining access to data, and gave an overview of the data from the Kirch Mulsow site. LJL provided important advice regarding the simulations, a thorough internal review, and valuable feedback. CM was responsible for providing data from the Rysumer Nacken test site, integrating the correction factor into the Bard 5.0 turbine controller, performing the toggle tests, and providing important advice on methods and data analysis. MK provided a thorough internal review and valuable feedback and had a supervisory function.
The contact author has declared that none of the authors has any competing interests.
Publisher's note: Copernicus Publications remains neutral with regard to jurisdictional claims made in the text, published maps, institutional affiliations, or any other geographical representation in this paper. While Copernicus Publications makes every effort to include appropriate place names, the final responsibility lies with the authors.
We thank Ocean Breeze Energy GmbH & Co. KG and eno energy GmbH for the access to wind turbines and measurement data as well as fruitful discussions.
This work was partially funded by the German Federal Ministry for Economic Affairs and Climate Action (BMWK) in the scope of the YawDyn project (FKZ 03EE3019). In addition, data from the CompactWind II project (FKZ 0325492) were used.
This paper was edited by Jennifer King and reviewed by two anonymous referees.
Bastankhah, M. and Porté-Agel, F.: Experimental and theoretical study of wind turbine wakes in yawed conditions, J. Fluid Mech., 806, 506–541, https://doi.org/10.1017/jfm.2016.595, 2016. a, b
Bertelè, M., Bottasso, C. L., Cacciola, S., Adegas, F. D., and Delport, S.: Wind inflow observation from load harmonics, Wind Energ. Sci., 2, 615–640, https://doi.org/10.5194/wes-2-615-2017, 2017. a
Boggs, P. T. and Rogers, J. E.: Orthogonal distance regression, Contemp. Math., 112, 183–194, 1990. a
Bromm, M., Rott, A., Beck, H., Vollmer, L., Steinfeld, G., and Kühn, M.: Field investigation on the influence of yaw misalignment on the propagation of wind turbine wakes, Wind Energy, 21, 1011–1028, https://doi.org/10.1002/we.2210, 2018. a
Burton, T., Jenkins, N., Sharpe, D., and Bossanyi, E.: Wind Energy Handbook Second Edition, John Wiley & Sons, Ltd, ISBN 9780470699751, https://doi.org/10.1002/9781119992714, 2011. a
Frost, C. and Thompson, S. G.: Correcting for regression dilution bias: comparison of methods for a single predictor variable, J. Roy. Stat. Soc. Ser. A, 163, 173–189, https://doi.org/10.1111/1467-985x.00164, 2000. a
Gebraad, P. M. O., Teeuwisse, F. W., van Wingerden, J. W., Fleming, P. A., Ruben, S. D., Marden, J. R., and Pao, L. Y.: Wind plant power optimization through yaw control using a parametric model for wake effects – a CFD simulation study, Wind Energy, 19, 95–114, https://doi.org/10.1002/we.1822, 2016. a, b
Held, D. P. and Mann, J.: Detection of wakes in the inflow of turbines using nacelle lidars, Wind Energ. Sci., 4, 407–420, https://doi.org/10.5194/wes-4-407-2019, 2019. a
Hulsman, P., Sucameli, C., Petrović, V., Rott, A., Gerds, A., and Kühn, M.: Turbine power loss during yaw-misaligned freefield tests at different atmospheric conditions, J. Phys.: Conf. Ser., 2265, 032074, https://doi.org/10.1088/1742-6596/2265/3/032074, 2022. a
International Electrotechnical Commission: Wind energy generation systems – Part 12-3: Power performance – Measurement based site calibration, IEC Standard, iEC 61400-12-3, 2022. a
Jeong, J. and Hussain, F.: On the identification of a vortex, J. Fluid Mech., 285, 69–94, 1995. a
Jiménez, Á., Crespo, A., and Migoya, E.: Application of a LES technique to characterize the wake deflection of a wind turbine in yaw, Wind Energy, 13, 559–572, https://doi.org/10.1002/we.380, 2010. a, b
Jonkman, J., Butterfield, S., Musial, W., and Scott, G.: Definition of a 5-MW Reference Wind Turbine for Offshore System Development, Tech. rep., NREL, https://doi.org/10.2172/947422, 2009. a
Kragh, K. and Fleming, P.: Rotor Speed Dependent Yaw Control of Wind Turbines Based on Empirical Data, in: 50th AIAA Aerospace Sciences Meeting including the New Horizons Forum and Aerospace Exposition 9–12 January 2012, Nashville, Tennessee, p. 1018, https://doi.org/10.2514/6.2012-1018, 2012. a, b
Mittelmeier, N. and Kühn, M.: Determination of optimal wind turbine alignment into the wind and detection of alignment changes with SCADA data, Wind Energ. Sci., 3, 395–408, https://doi.org/10.5194/wes-3-395-2018, 2018. a, b
OpenFOAM: Open Source Field Operation and Manipulation, https://openfoam.org/ (last access: 21 October 2021), 2021. a
Pedersen, T., Demurtas, G., and Zahle, F.: Calibration of a spinner anemometer for yaw misalignment measurements, Wind Energy, 18, 1933–1952, https://doi.org/10.1002/we.1798, 2014. a
Rahimi, H., Daniele, E., Stoevesandt, B., and Peinke, J.: Development and application of a grid generation tool for aerodynamic simulations of wind turbines, Wind Eng., 40, 148–172, https://doi.org/10.1177/0309524x16636318, 2016. a
Rott, A., Doekemeijer, B., Seifert, J. K., van Wingerden, J.-W., and Kühn, M.: Robust active wake control in consideration of wind direction variability and uncertainty, Wind Energ. Sci., 3, 869–882, https://doi.org/10.5194/wes-3-869-2018, 2018. a, b
Schreiber, J., Bottasso, C. L., and Bertelè, M.: Field testing of a local wind inflow estimator and wake detector, Wind Energ. Sci., 5, 867–884, https://doi.org/10.5194/wes-5-867-2020, 2020. a
Simley, E., Fleming, P., Girard, N., Alloin, L., Godefroy, E., and Duc, T.: Results from a wake-steering experiment at a commercial wind plant: investigating the wind speed dependence of wake-steering performance, Wind Energ. Sci., 6, 1427–1453, https://doi.org/10.5194/wes-6-1427-2021, 2021. a, b, c, d, e
Spalart, P. R., Deck, S., Shur, M. L., Squires, K. D., Strelets, M. K., and Travin, A.: A New Version of Detached-eddy Simulation, Resistant to Ambiguous Grid Densities, Theor. Comput. Fluid Dynam., 20, 181–195, https://doi.org/10.1007/s00162-006-0015-0, 2006. a
Wiesen, K., Teubler, J., and Rohn, H.: Resource Use of Wind Farms in the German North Sea – The Example of Alpha Ventus and Bard Offshore I, Resources, 2, 504–516, https://doi.org/10.3390/resources2040504, 2023. a