the Creative Commons Attribution 4.0 License.
the Creative Commons Attribution 4.0 License.
 | 09 Jan 2023
A large-scale wind turbine model installed on a floating structure: experimental validation of the numerical design
Federico Taruffi
Simone Di Carlo
Sara Muggiasca
Marco Belloli
In the field of floating wind energy, large-scale wind turbine models deployed in natural environments represent a key link between small-scale laboratory tests and full-scale prototypes. While implying smaller cost, design and installation effort than a full-scale prototype, large-scale models are technologically very similar to prototypes, can be tested in natural sea and wind conditions, and reduce by a consistent amount the dimensional scaling issues arising in small-scale experiments. In this framework the presented work report the aerodynamic and control system assessment of a 1:15 model of the DTU 10 MW wind turbine installed on a multipurpose-platform model for fish farming and energy production. The model has operated for 6 months in a natural laboratory and has been exposed to fully natural and uncontrolled environmental conditions. Assessment is performed in terms of rotor thrust force and power controller parameters such as rotor speed, blade pitch and rotor power as a function of incoming wind speed.
- Article
(10454 KB) - Full-text XML
- BibTeX
- EndNote


Nowadays the continuously increasing demand for green energy production and the quest for sustainable food are pushing forward the exploitation of ocean areas for resources that are more and more difficult to harness on land (Jouffrey et al., 2020). Renewable ocean energy production technologies are mainly focused on wave energy, tidal energy or floating wind; on the other hand, as far as food production is concerned, fish farming is a leading activity. It is known, regarding this last statement, that fish farming activity is concentrated along shores for ease of logistics and to benefit from more moderate sea conditions, and effort is required to install farms in more open waters.
In the framework of ocean area exploitation, a novel technology now being researched is multipurpose platforms (Abhinav et al., 2020). A multipurpose platform is a floating platform hosting different technologies for contemporary energy and food production. In this way different activities can improve their redditivity by sharing common and expensive facilities, like the platform itself, the mooring system, the electrical dispatch system (Aubault et al., 2011) and so on. Michailides et al. (2014) and Muliawan et al. (2013) investigated the system dynamics and power generation of multipurpose platforms for wave and wind energy production, revealing an improvement in combined power generation. A partly different example is the multipurpose platform designed during the Horizon 2020 project “The Blue Growth Farm” (Lagasco et al., 2019), whose model-scale tests are the main topic of this paper. This time the full-scale platform is a barge-shaped floater hosting a moon pool for fish farming, which is the primary activity to be performed on the platform; in addition, wave energy converters exploit wave motions and platform motions for energy production. Last, a multi-megawatt wind turbine exploits wind power. It is obvious to think that from a design point of view, it is extremely difficult to numerically model such a system, given the contemporary occurrence of several subsystems, each one characterized by its own way of operation, and by the existence of several fields of engineering all together, like hydrodynamics, aerodynamics, turbomachinery and structural dynamics.
It becomes very important, therefore, to be able to perform experiments on scaled models. The aim of model tests is to inspect aspects of the system that are not visible in numerical modelling and at the same time to validate or calibrate numerical models. During the aforementioned project, two test campaigns were performed to investigate the behaviour of the platform and gain hints about its feasibility. The first campaign was about a 1:40 model tested in a wave tank, at ECN; the second campaign, explained in this paper, was conducted on a 1:15 model, thus a large-scale model, to inspect the behaviour of the platform in open sea (Ruzzo et al., 2021). Large-scale models deployed in a natural outdoor environment are a valid complement to traditional small-scale laboratory models in understanding the real features of the system and in updating or validating codes. Large-scale models allow us to increase the fidelity of the experiment by reducing the scaling effect: focusing on wind turbines, adopting a large scale allows us to better reproduce the aerodynamic behaviour of the rotor, which in laboratory-scale experiments is usually impaired by low-Reynolds effects. Another advantage in large-scale modelling is represented by the chance to operate in a natural environment, ensuring exposure to uncontrolled environmental actions and further enhancing the fidelity of the experiment. Moreover, such models can be built to be very similar to full-scale prototypes from the point of view of construction, technology involved and operation, allowing us to reach higher TRLs (technology readiness levels) of about 5–7.
The platform was moored for 10 months in the waters of the Strait of Messina, in front of the city of Reggio Calabria, and the experimental campaign targeted the inspection of feasibility of the whole system as a combined food and energy production platform. The present work is focused particularly on the assessment of the aerodynamic and controller performance of a 1:15 wind turbine model of the 10 MW DTU reference wind turbine (Bak et al., 2013) that is installed on the platform. A preliminary assessment of the wind turbine aerodynamic design is also reported synthetically in Taruffi et al. (2022), with a focus on the methodology adopted to process data. In this work the methodology used to perform the analysis is improved and detailed. Results are shown in a more extensive way, and some of the wind turbine properties, like the thrust curve, are presented here for the first time. It is of interest to understand if the performance in terms of the power curve and thrust curve respects the operational parameters that were established during the design phase. This operation is performed by inspecting the experimental behaviour of the wind turbine model in particular and steady-state operation points and by comparing relevant parameters to the ones found in the numerical simulations.
The paper is structured as follows: Sect. 2 explains briefly the characteristics of the multipurpose-platform scaled model and of the wind turbine model; Sect. 3 details sensor setup and test procedures; Sect. 4 reports some preliminary checks to verify the consistency of gathered data; Sects. 5 and 6 detail the assessment of aerodynamic performance; Sect. 7 concludes the work.
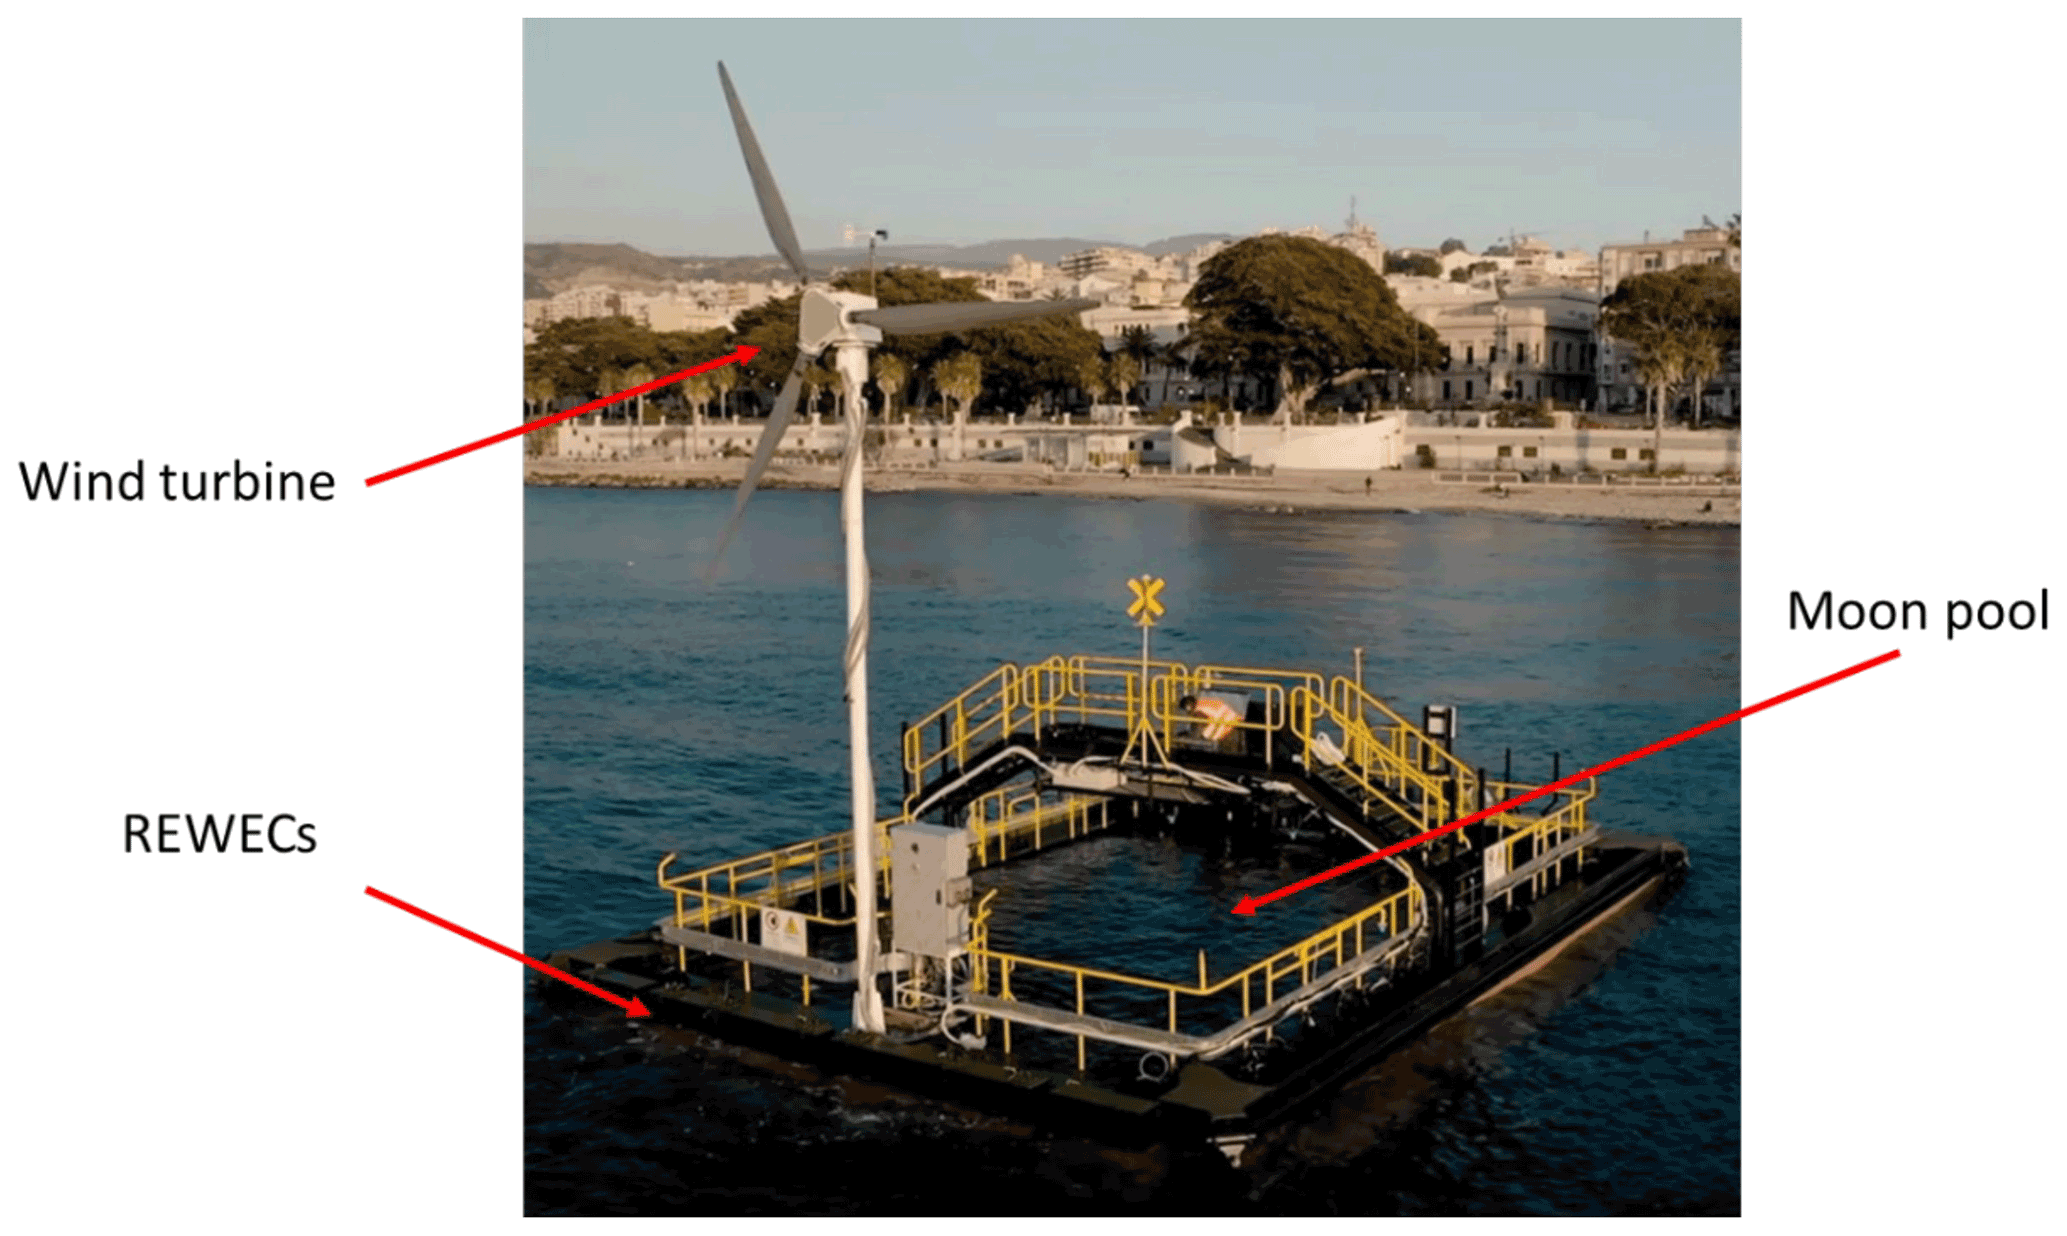
The large-scale model of the platform is a rectangular barge with sides equal to 14 and 10.8 m, with a draft of 2 m. One of the short sides of the platform hosts a row of wave energy converters of the REWEC (Boccotti, 2002, 2007) type that can be opened or closed depending on the needs of the campaign. The wave energy converters are not equipped with any energy conversion device, and a calibrated hole reproduces the correct airflow condition (Thiebaut et al., 2015). On the same side of the platform is located a 1:15 scaled model of the 10 MW DTU wind turbine, with the aim of recreating the dynamical effect of the wind turbine on the full-scale platform. Then, the centre of the platform hosts a moon pool for fish farming; the fish cages are in this way shielded by waves (Fig. 1).
Wind turbine model
The wind turbine is a 1:15 scaled model of the 10 MW DTU reference wind turbine, designed to be an aeroelastic model and to reproduce the effect of a full-scale wind turbine (Muggiasca et al., 2021b).
The design reflects the necessity to build a scale model and a real, fully functioning machine to be operated in an outdoor and not-confined environment at the same time. For this reason, safety issues were considered of utmost importance. The full-scale reference was scaled following a performance scaling approach: the goal is to reproduce the 1:15 scaled thrust force. A hybrid scale law was adopted, allowing us to obtain the same goal performance but with a smaller rotor (Fontanella et al., 2019). For the blade airfoil the SG6040, an intermediate choice between the full-scale and a typical wind tunnel application, was selected and experimentally characterized by means of wind tunnel tests on a 2D model. The rotor aerodynamics was designed following an iterative procedure obtaining the chord and twist distribution along the blades, as detailed in Muggiasca et al. (2021a).
To grant structural integrity even under extreme wind and wave events, a structural assessment was performed. All the crucial components, including the tower and rotor–nacelle assembly, were verified by means of FEM analysis. The GFRP composite blade layup was verified by means of static experimental tests performed on a blade prototype. The tower aeroelastic constraint was fulfilled with the resulting first natural frequency matching the target, while for the blades the safety concerns were found to be primary (Muggiasca et al., 2021a).
The turbine has 5 degrees of freedom (DOF): the rotor rotation, three individual drives for blade pitch and yawing of the nacelle. An embedded control and monitoring system supervises the turbine to ensure the full operation of the machine similarly to the full-scale one, the management of the status, and the signal monitoring and acquisition. In particular, the control system is a derivation of the variable-speed variable-pitch (VSVP) algorithm developed for the DTU 10 MW turbine (Bak et al., 2013). It features a startup procedure, partial- and full-load operation, and shutdown action (Muggiasca et al., 2019).
Relevant data about the model are listed in Table 1, and the complete design can be found in Muggiasca et al. (2021b).

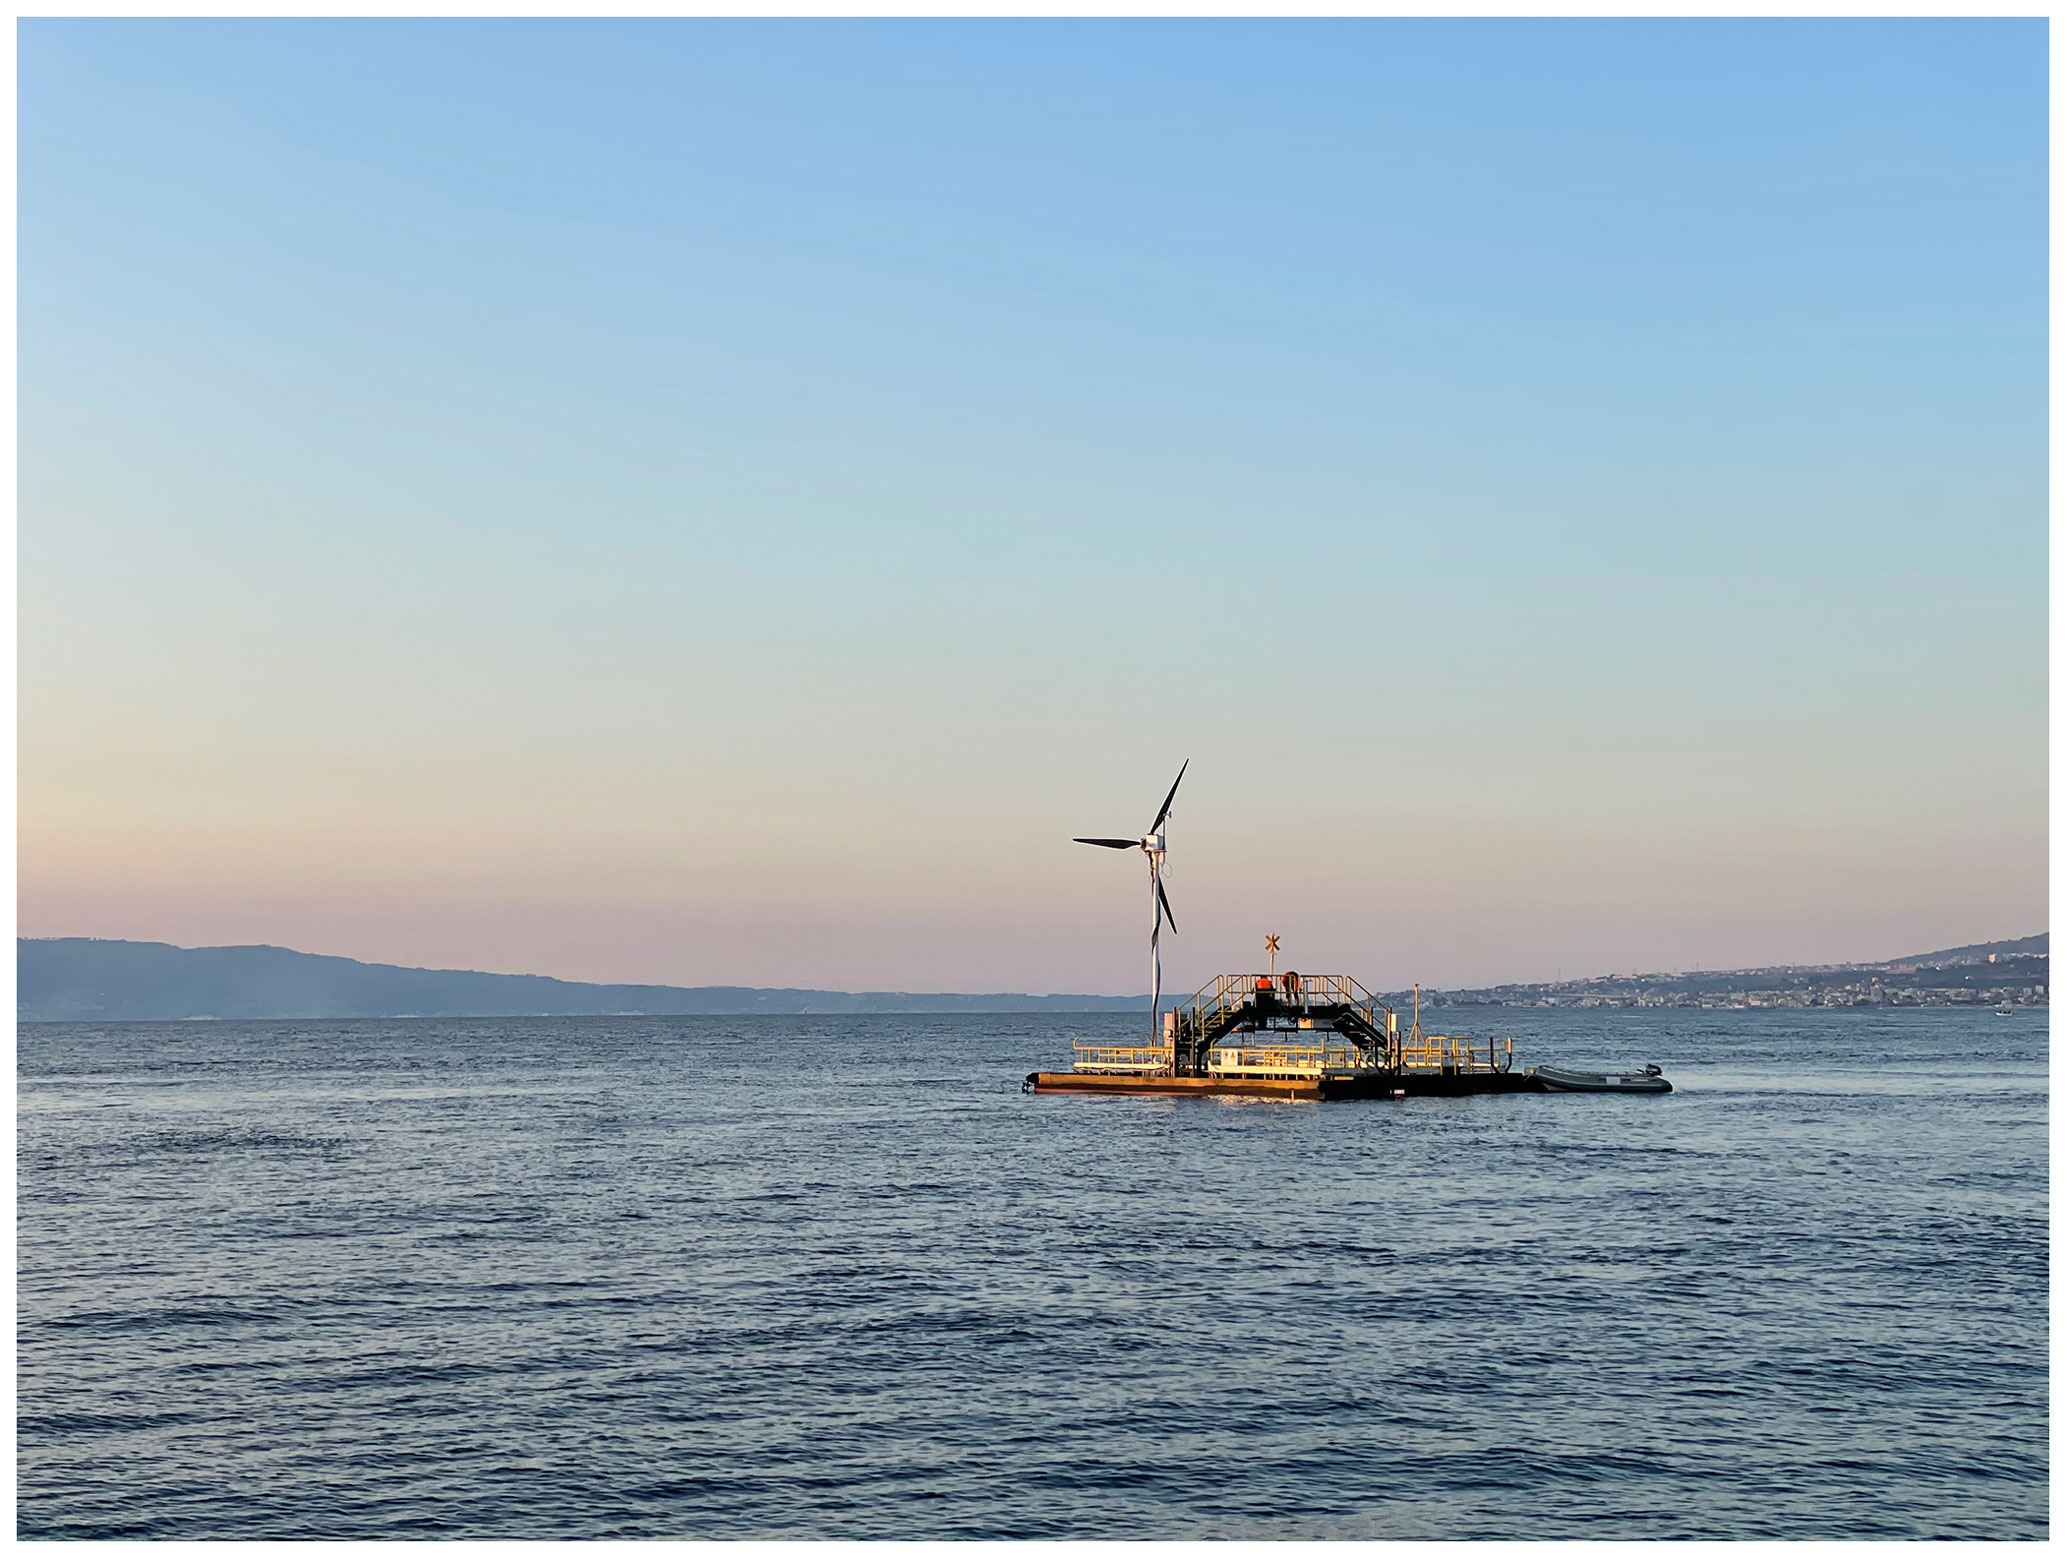
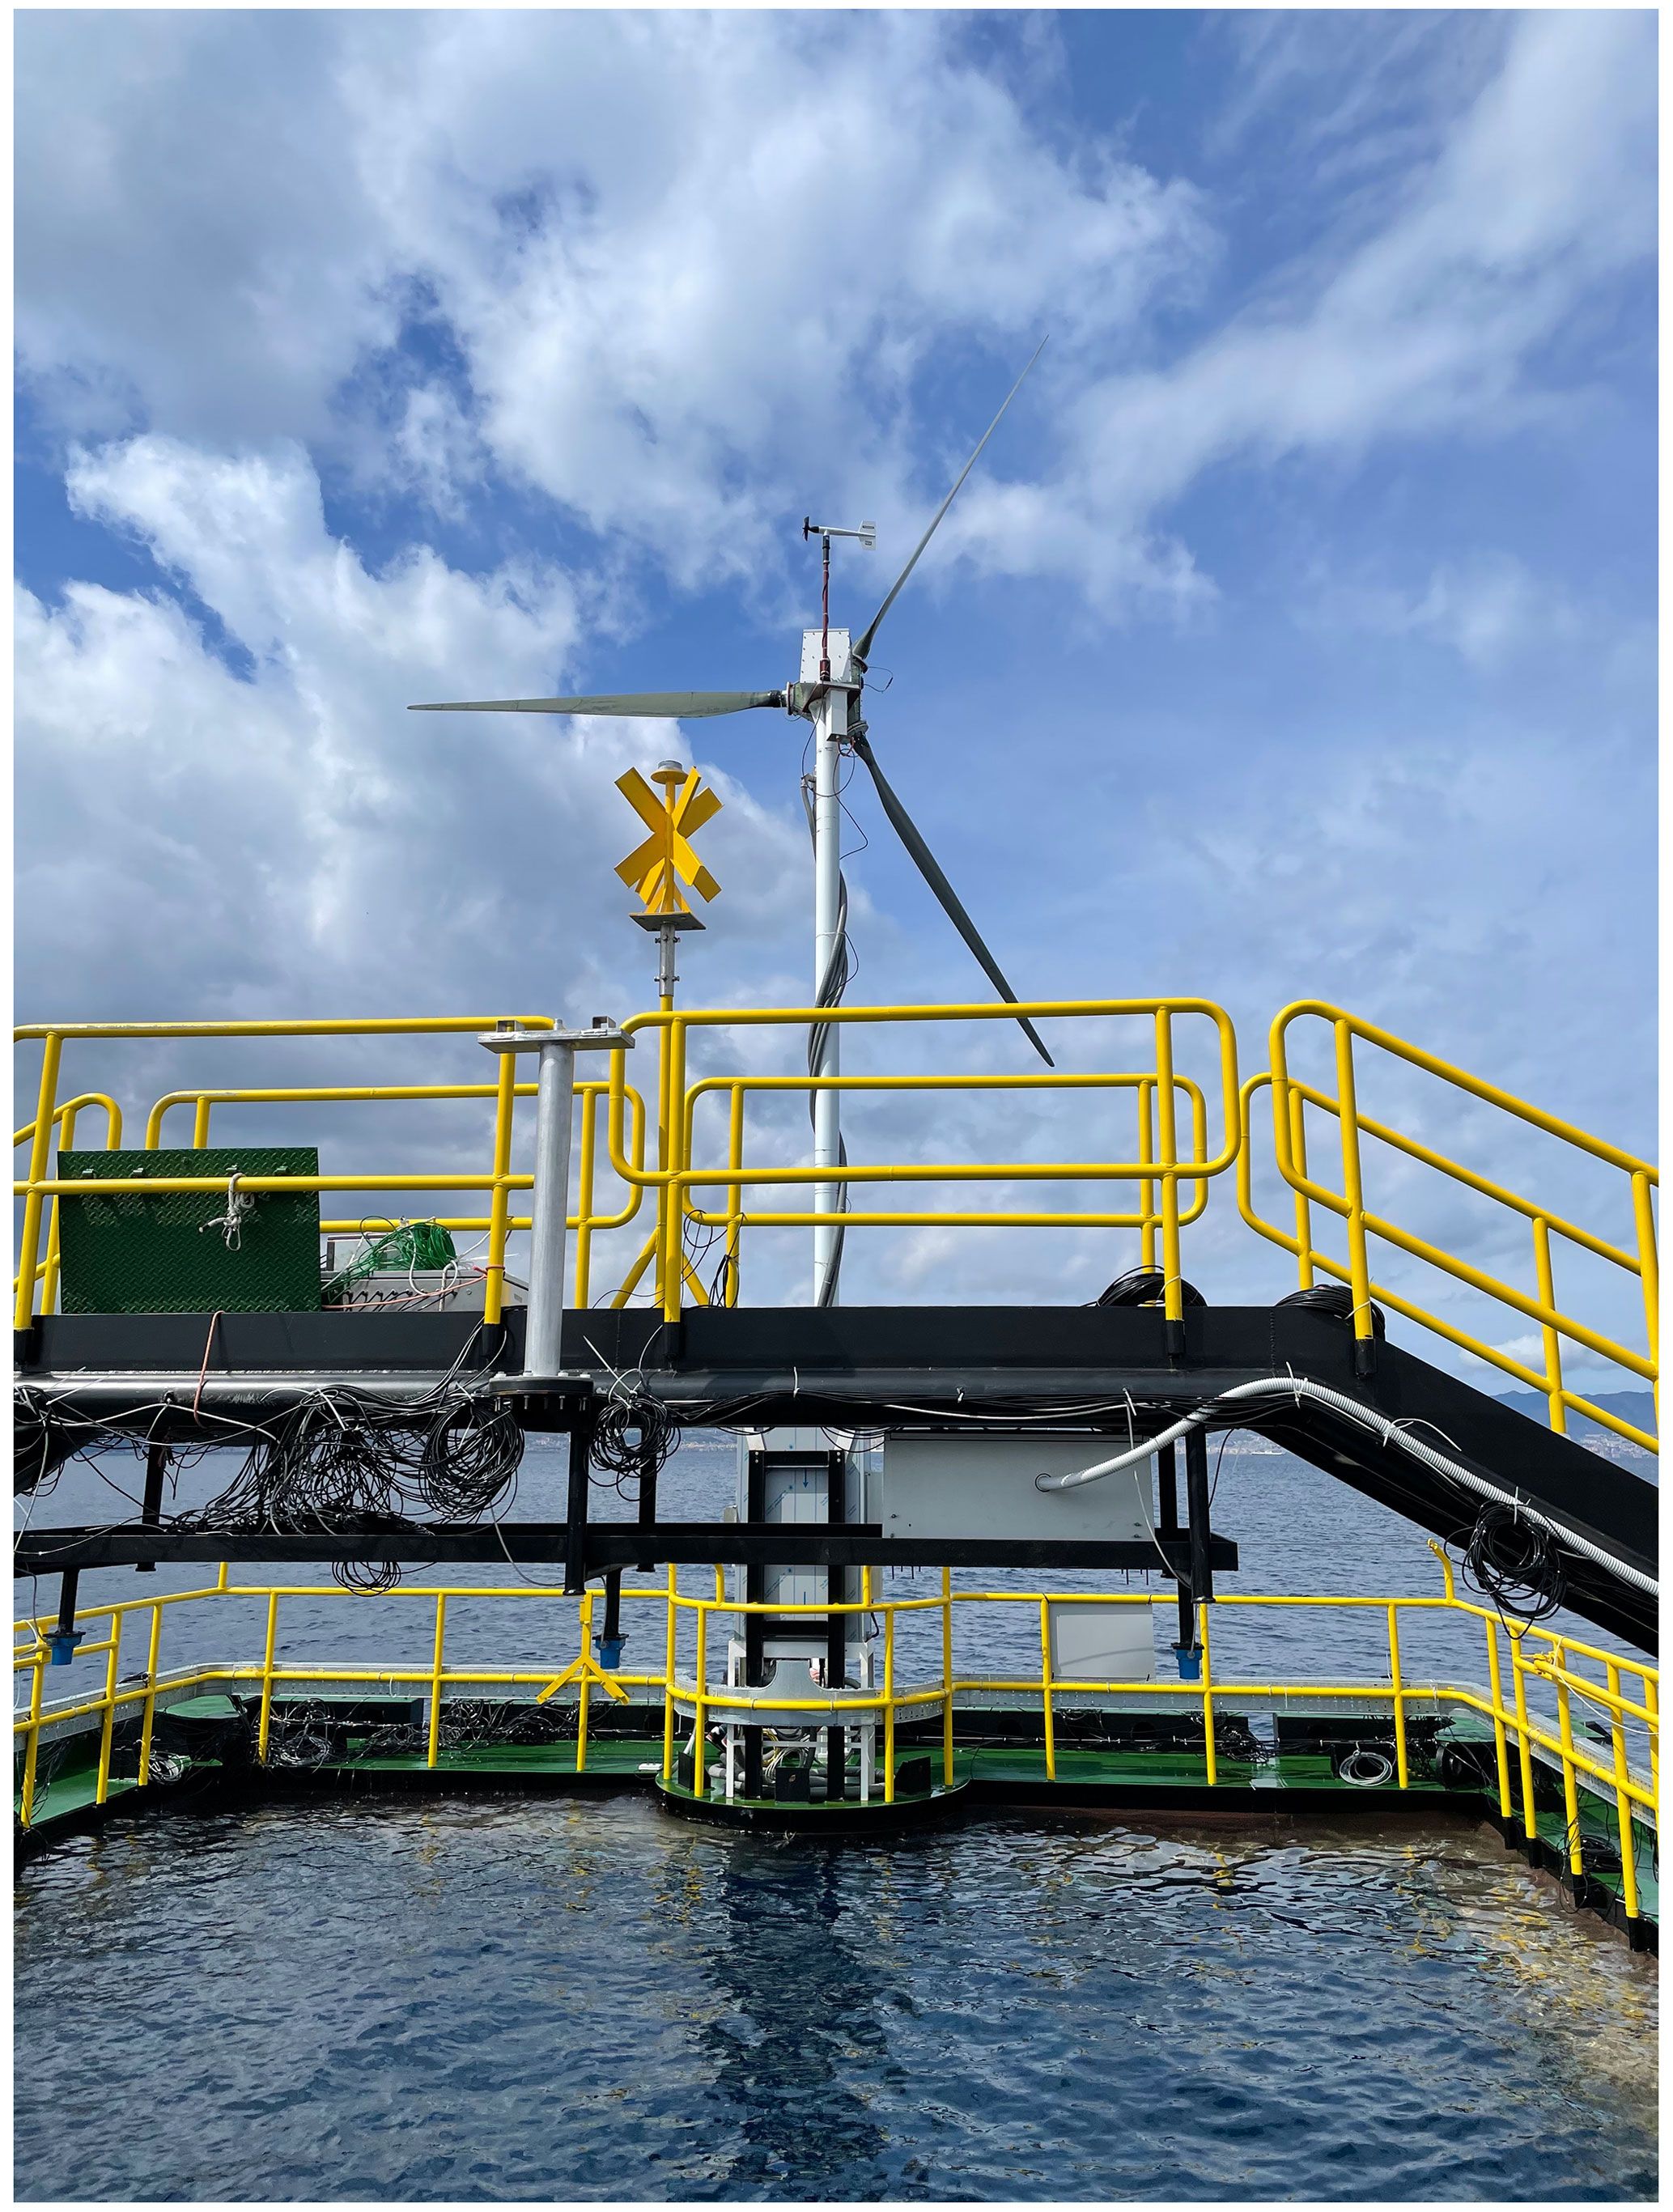
The floating multipurpose platform hosting the wind turbine large-scale model was deployed at the end of February 2021 in the waters of the Strait of Messina, in front of the city of Reggio Calabria, in southern Italy. In this area, the Natural Ocean Engineering Laboratory (NOEL) (Arena and Barbaro, 2013) (NOEL – University of Reggio Calabria, 2022) performs experiments in outdoor conditions on several ocean engineering applications. Actually, the coexistence of peculiar wind conditions, wind fetch and sea current causes wave spectra to be a scaled version of oceanic wave spectra, thus making this place suited to being a natural laboratory for offshore engineering scaled experiments, which have also been conducted here in past times. The experimental campaign started in February 2021, and the turbine was operated from April 2021 to July 2021 (Ruzzo et al., 2021). Photos of the multipurpose platform on the site of deployment and of the large-wind-turbine-scale model are shown in Figs. 2 and 3. The general scope of the tests is to prove the feasibility of the concept as a multipurpose offshore system for aquaculture, wave energy production and wind energy production; in more detail it is interesting to evaluate how much these subsystems interfere with one another and if this interference is detrimental to their efficient operation. Moreover, these large-scale experiments represent a sort of intermediate step between small-scale model tests performed in the wave basin and the full-scale one. While in a wave basin just the preliminary assessment of the dynamic behaviour of the prototype can be achieved in a fully controlled setting, in this experiment the behaviour and the feasibility of the concept can be inspected from several points of view, thanks to the greater dimensions of the model and to the exposure to natural environments. Greater dimensions allow us to have a state-of-the-art structural monitoring system, electrical dispatch system and realistic operation of integrated technologies; the outdoor conditions guarantee of course the presence of natural sea and wind conditions, including extreme events, the occurrence of corrosion, wear and marine growth. From the wind turbine perspective, the aim of the experimental campaign is to evaluate the influence of floating conditions (e.g. platform motions) on turbine power production and turbine structural health.
3.1 Sensor setup
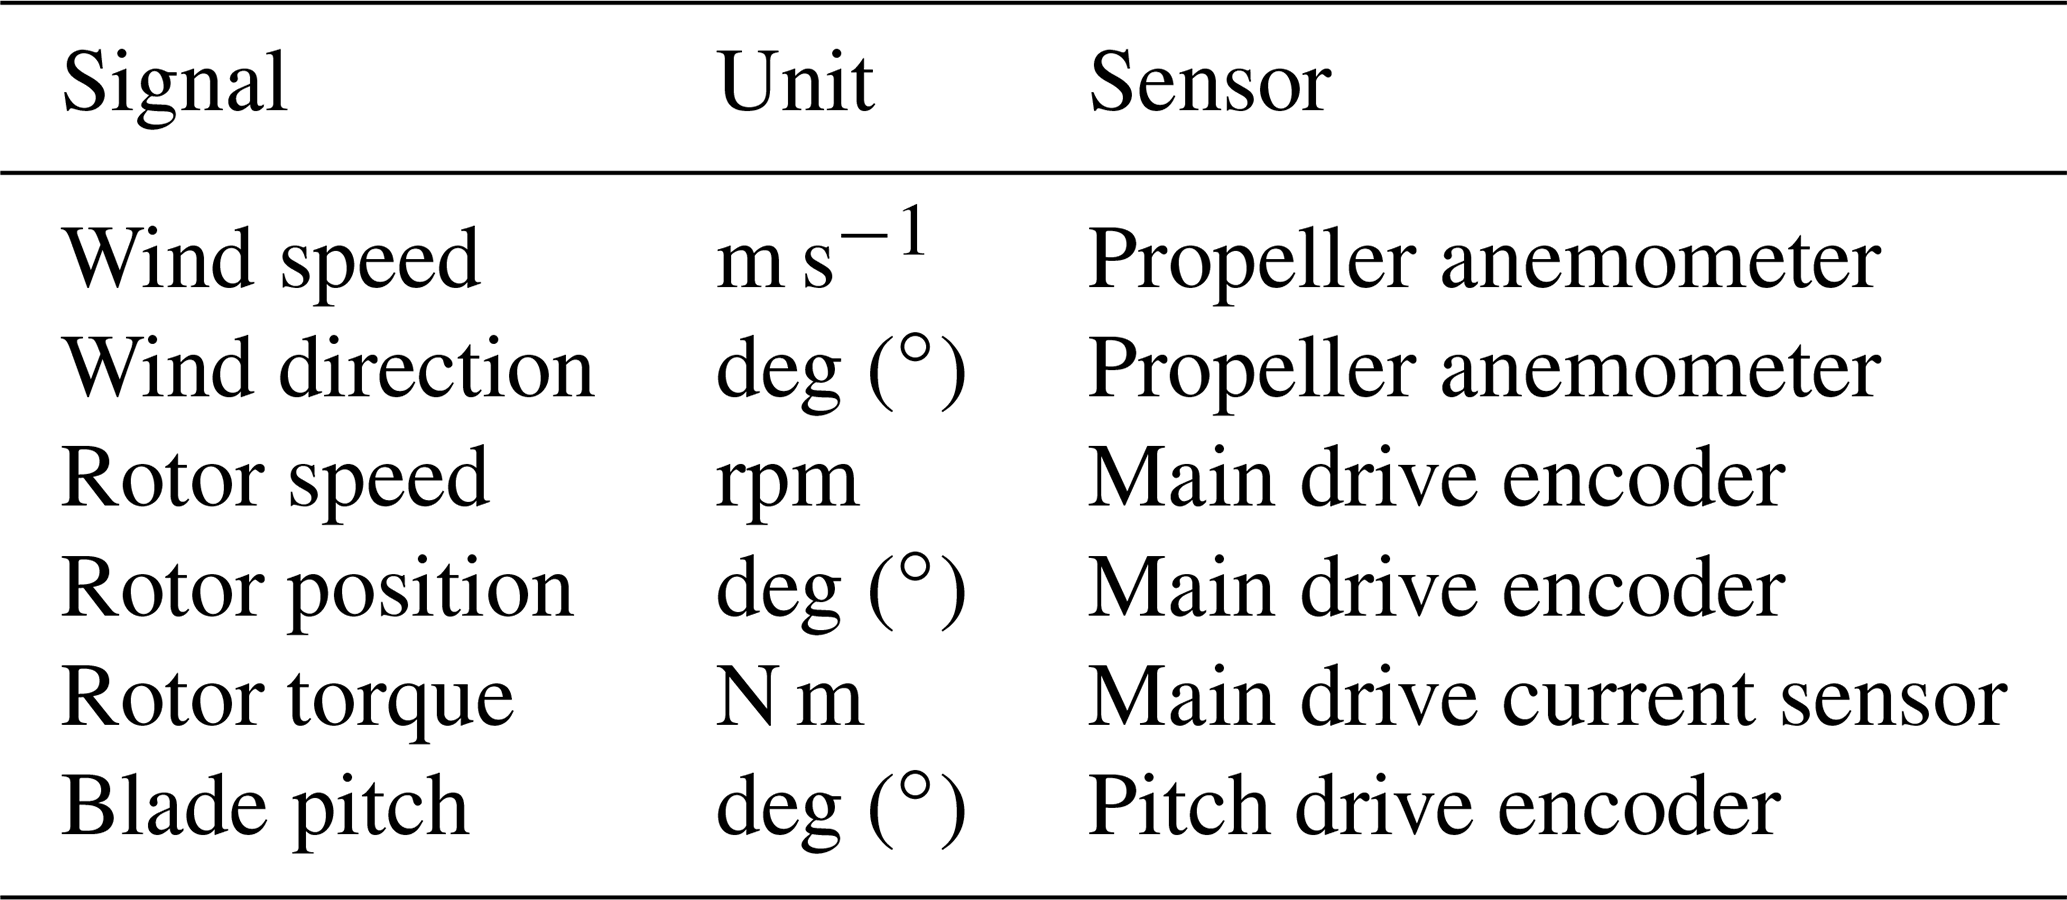
For the sake of aerodynamic validation, structural monitoring and more in general the scientific investigation of floating wind turbine operation, the model is equipped with a system of sensors devoted to on-demand data gathering during the whole experimental campaign. Firstly, a propeller anemometer placed on the top of the nacelle measures the wind speed and direction, relative to the yaw angle of the nacelle itself. Rotor main drive and blade pitch drive encoders register the actual rotor speed, rotor angle and blade pitch angle; a current sensor on the main generator is used to evaluate the torque on the generator side and consequently the generator power. Data gathered by these sensors allow us in detail to evaluate the CP–λ curves of the rotor (CP is the power coefficient, and λ or TSR is the tip speed ratio). Derived quantities of mechanical power, CP and TSR are calculated from the measurements as follows:
where Ω is the rotational speed (reported at either the rotor or the generator side), Q is the generator torque, U is the wind speed, ρ is the standard air density, r is the rotor radius and A is the rotor area.
A summary of measurements for wind turbine power capabilities is reported in Table 2.
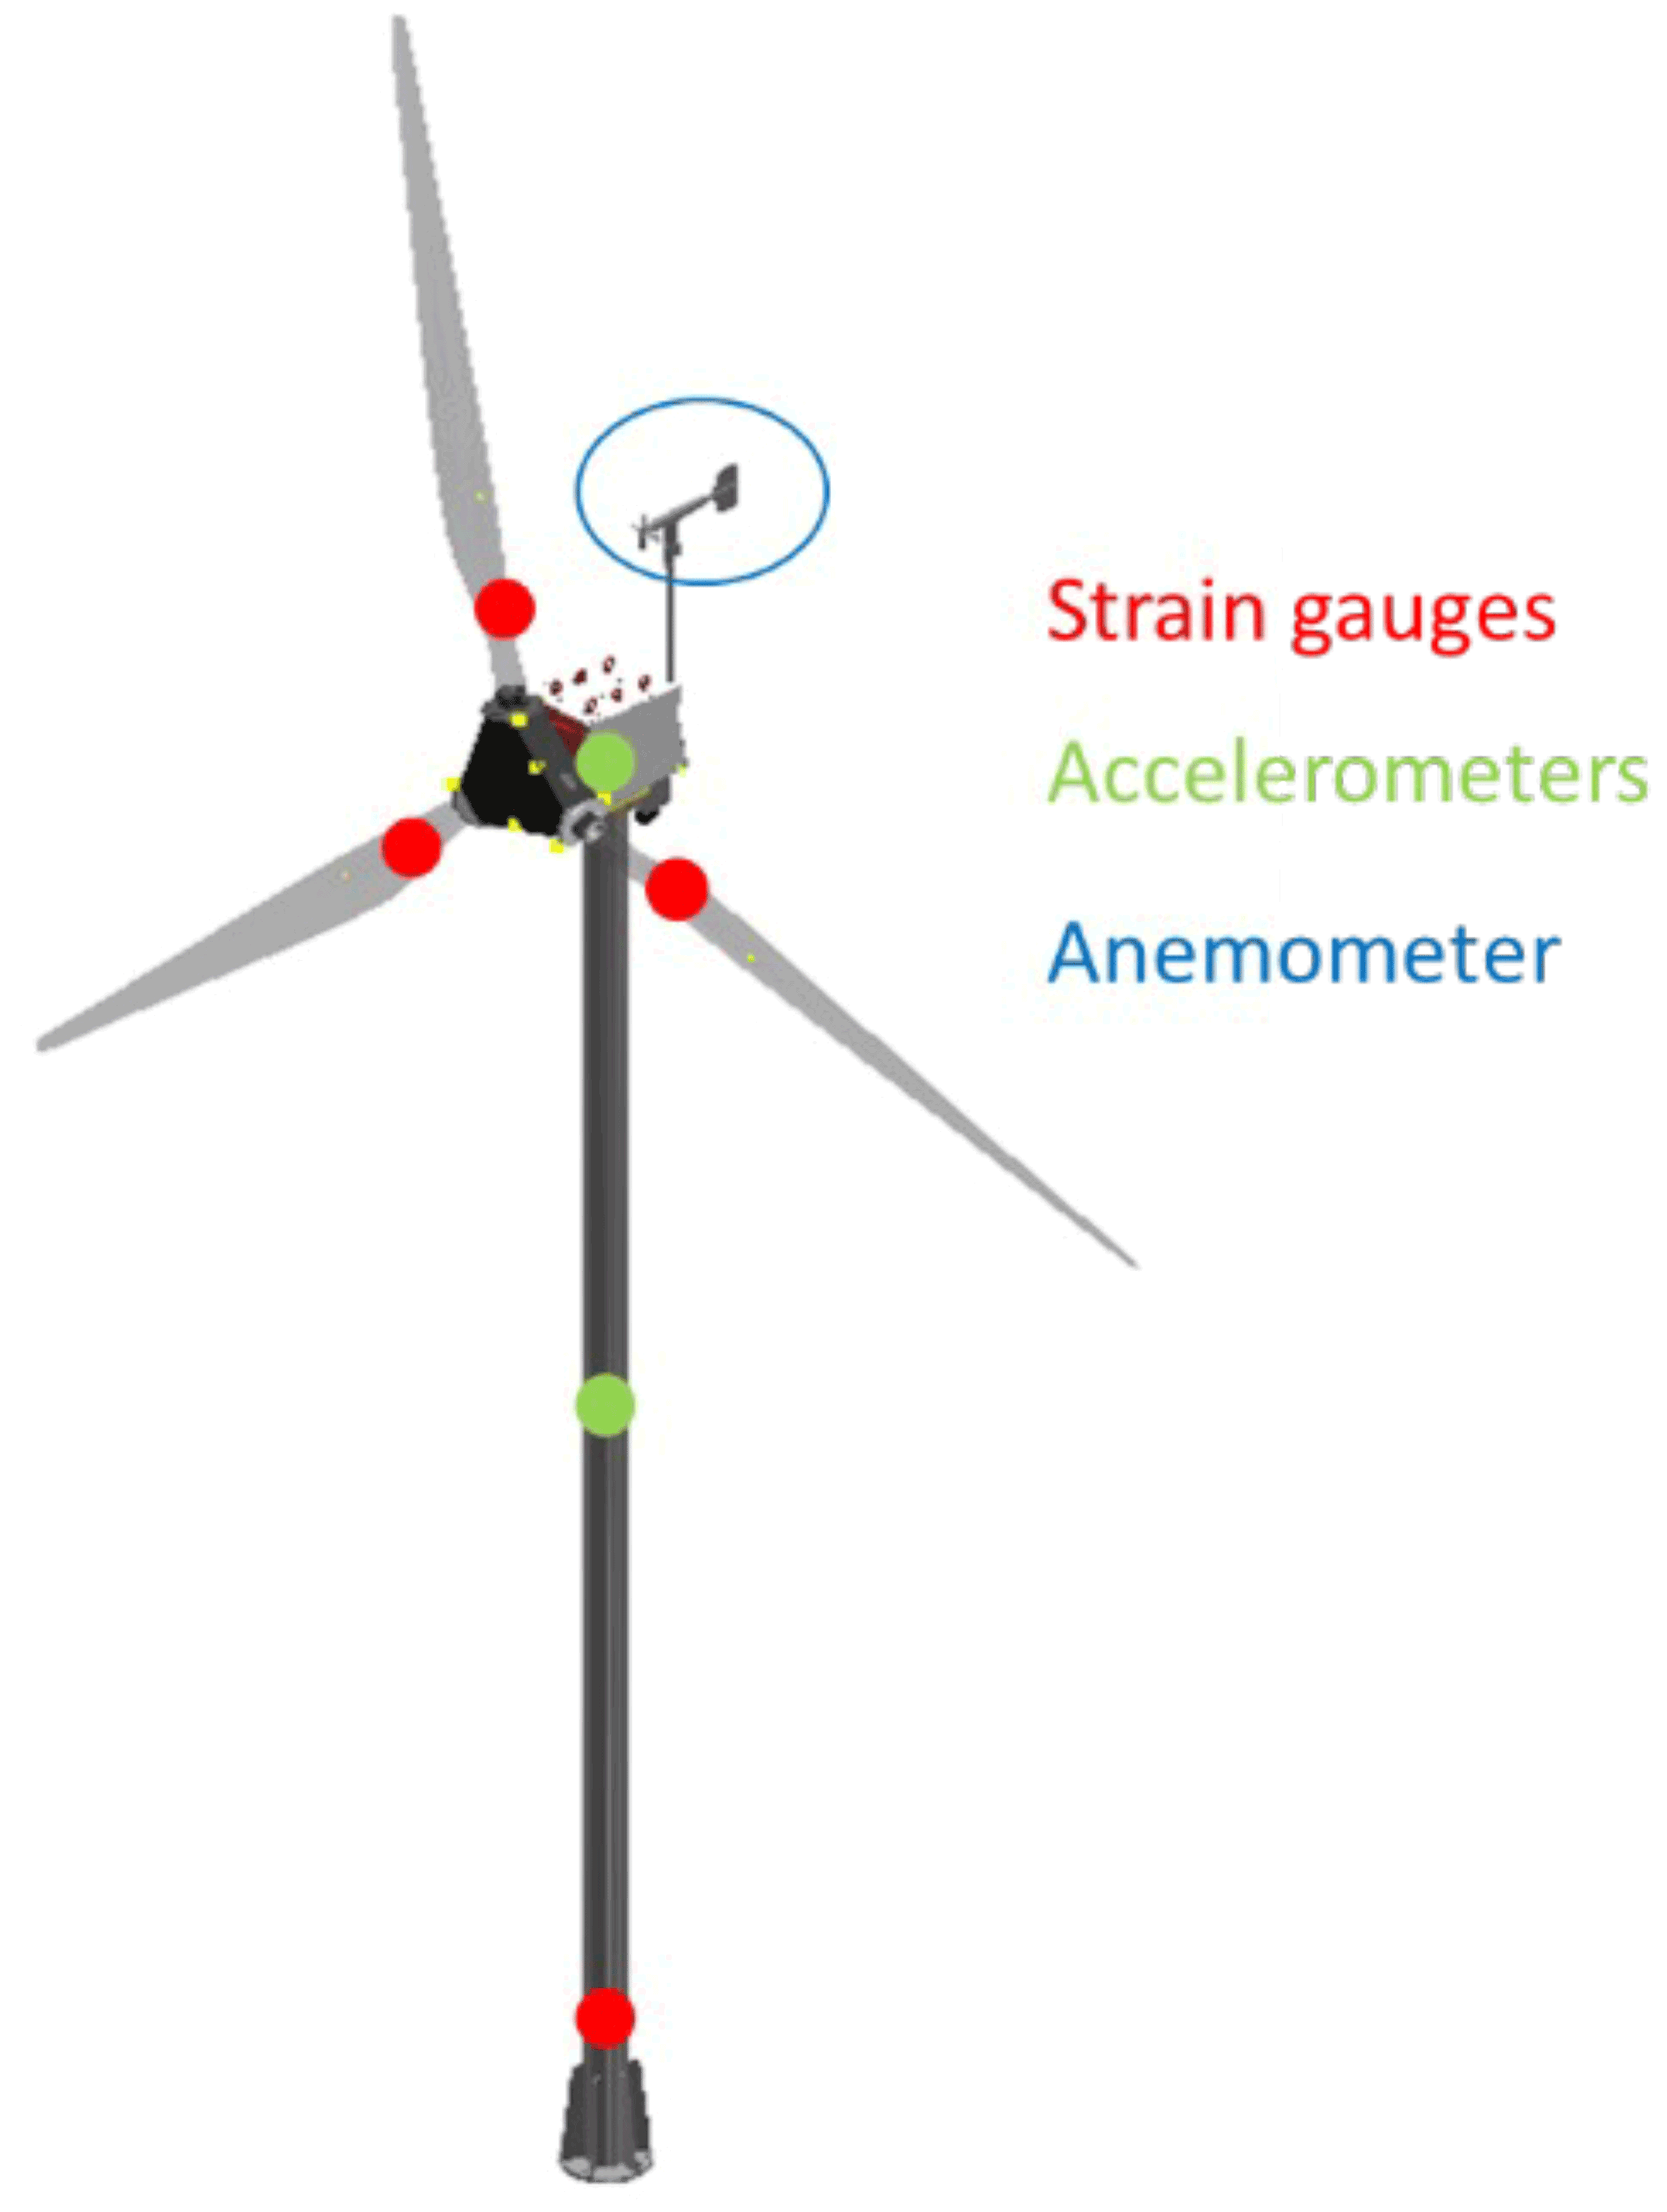
The sensor set is completed by a structural monitoring system composed of a set of strain gauges on tower base, a set of strain gauges on the blades and some accelerometers; this set of sensors is devoted to load and vibration monitoring. Tower base strain gauges are arranged in two half-bridge configurations, to measure flexional stresses on two perpendicular axes, and a full bridge for torsional stress sensing. Blade strain gauges are arranged so as to measure flapwise and edgewise bending stresses and torsional stresses on one of the blades, the other two being provided only with flapwise bending stress measurement instruments. Accelerometric measurement is accomplished by means of two triaxial accelerometers, one placed in the nacelle and the other at mid-tower (Fig. 4).
Data are acquired by an NI PXIe at a 50 Hz sampling rate. Files containing time histories are sent to a laboratory on the shore and saved in the cloud.
3.2 Wind turbine operation
The wind turbine is normally kept parked, and it is operated when sea conditions are favourable to avoid dangerous operation. The rotor is first oriented towards the wind direction and then put into rotation under the supervision of the user. The yaw control is not activated. Data acquisition is active during each operation. Then a typical time history comprises a startup phase, with the main motor accelerating the rotor; an operating phase, when rotor speed and torque are regulated by the VSVP controller; and a shutdown phase, when the blades are feathered to 90∘ and the rotor is stopped and then braked. Depending on wind conditions, the wind turbine is set to an operating point defined by rotor speed, torque and blade pitch; among all operating points a major division is made of course in below-rated conditions and above-rated conditions, with different control system behaviour. The length of a time history is usually 30 min or 1 h to have a sufficiently long time duration of continuous operation data.

Figure 5An example of time history with both a below- and an above-rated regime (time zone: CEST).
4.1 Inspection of tower dynamics
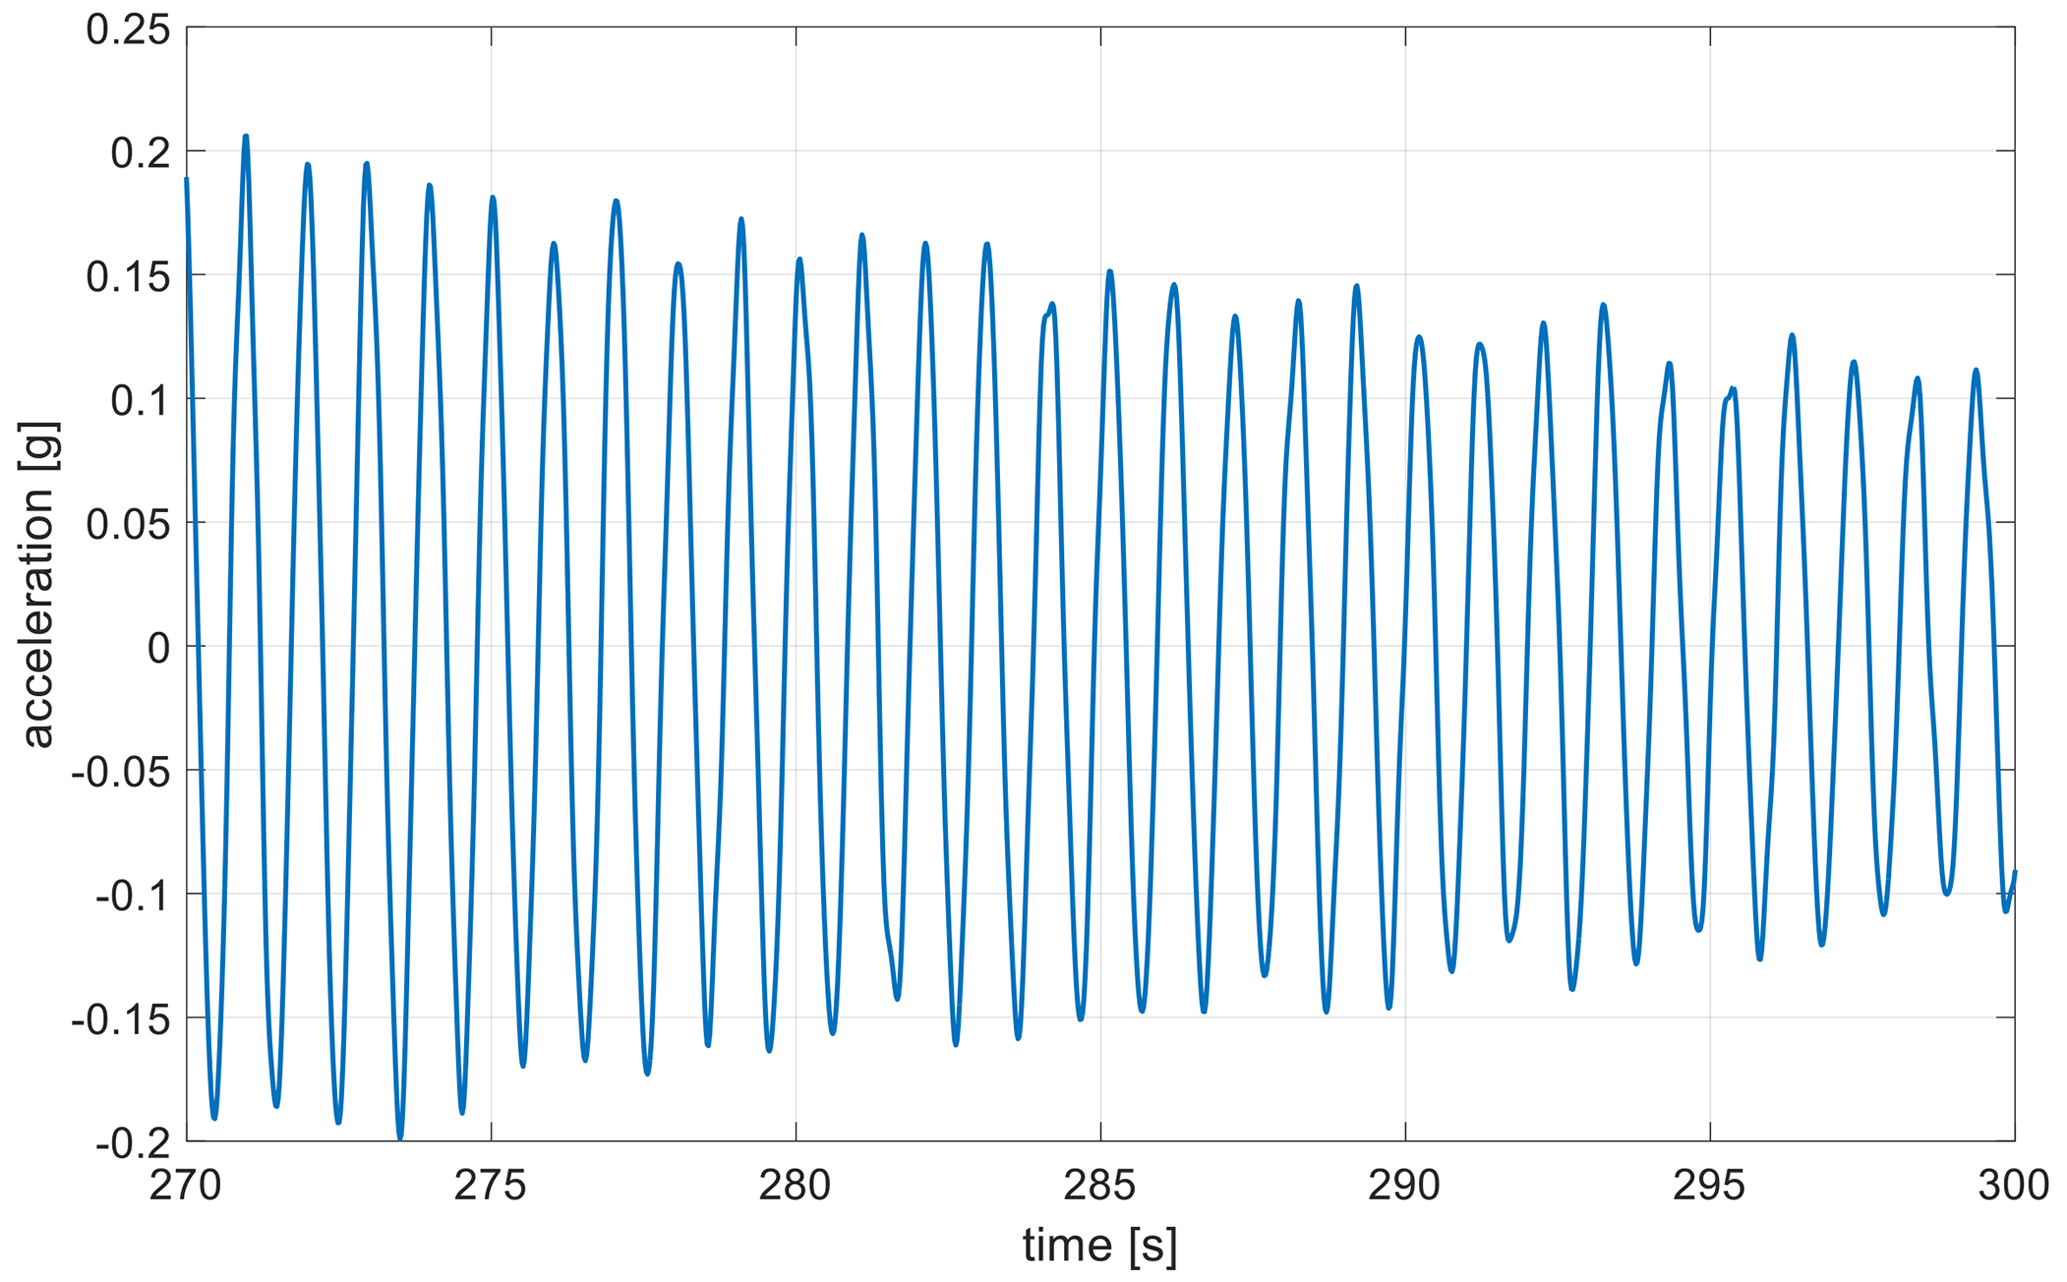
As one of the first tasks of the experimental campaign, the dynamic behaviour of the tower is investigated. Due to tower dimensions, it was not possible to perform a complete modal analysis of the system; thus an on-site investigation is preferred. This step is necessary to verify the FE tower numerical model used during the design phase and to have an insight into tower damping, a quantity that is difficult to evaluate by theory. To obtain this piece of information, a decay test is performed: starting from a rated operation condition, with the maximum value of thrust, the blades are abruptly feathered to trigger a free decay of the tower. The free-decay acceleration signal (Fig. 6) is then acquired and post-processed.
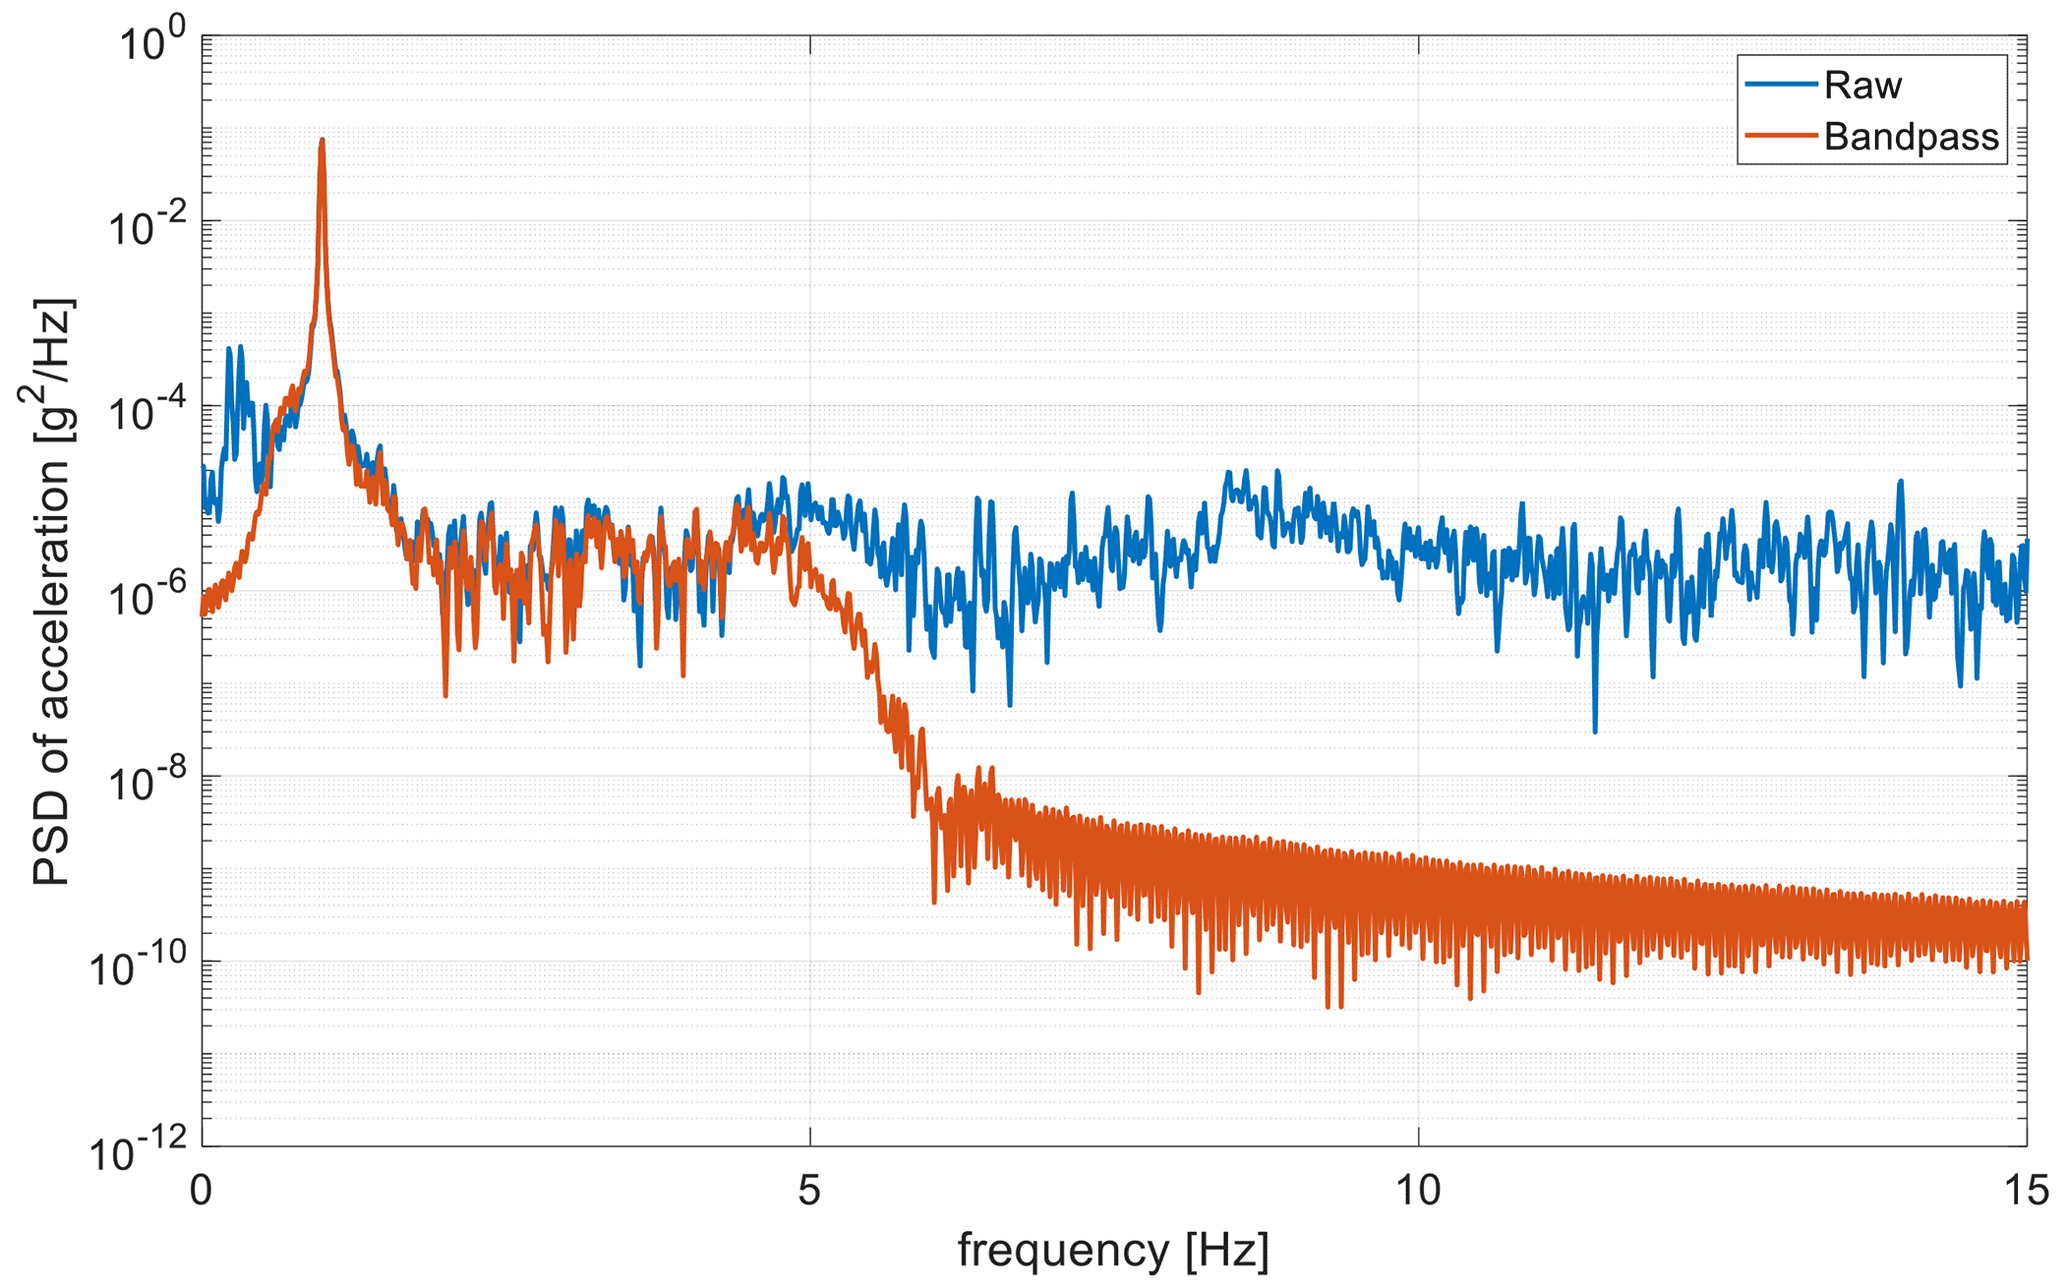
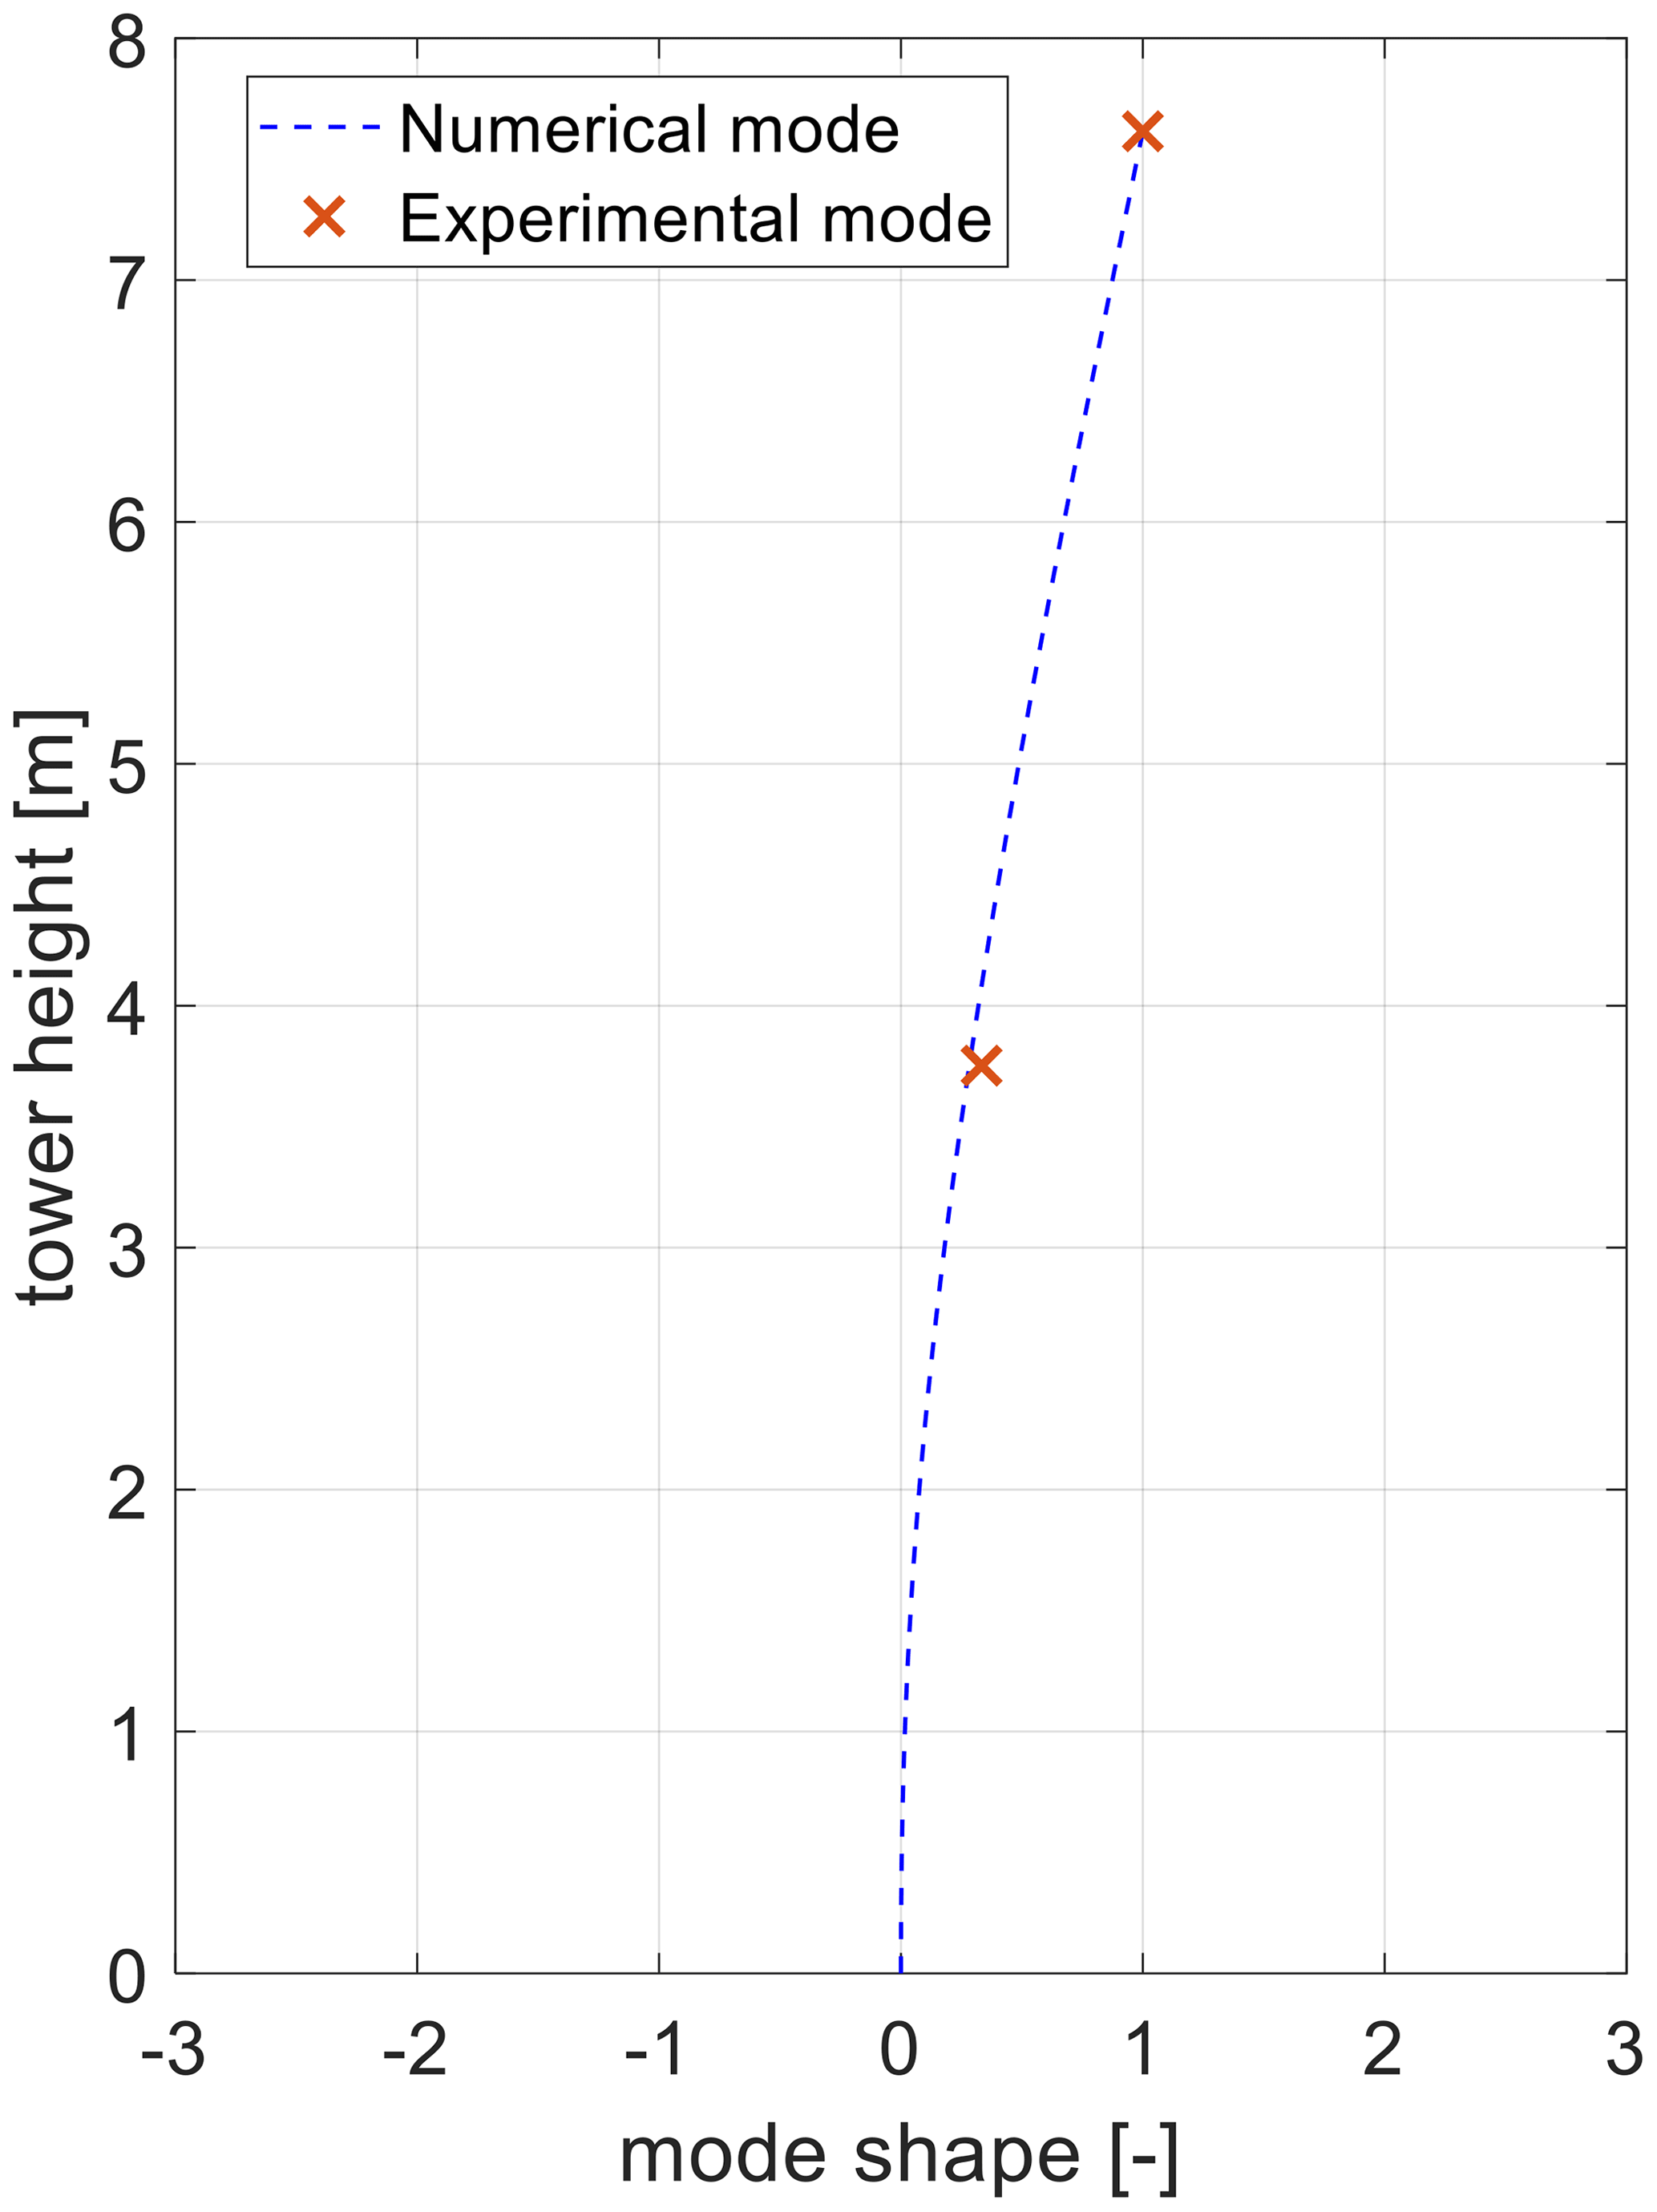
Preliminary results of the numerical model of the tower individuated the first tower mode at 1.05 Hz and the second at 14 Hz. Being the second mode of vibration out of the expected harmonic forcing, major attention is given to the experimental verification of the first-mode frequency. The decay signal of course also contains higher-mode contributions, even if in a slight manner, and some low-frequency content due to slow platform motions. To remove these undesired frequency components, a bandpass filter is applied to the signal, in detail a sixth-order Butterworth filter with lower and higher cut-off frequencies of 0.6 and 5 Hz respectively. The application of the filter allows us to obtain the 1 DOF decay corresponding to the first mode of vibration (Fig. 7). Analysis of the signal revealed a first-mode frequency of 0.98 Hz. As far as damping is concerned, by assuming a 1 DOF linear behaviour of the system, the logarithmic decrement procedure is applied (Cheli and Diana, 2015), and a damping ratio of 0.33 % is found. Besides this, given the presence of two accelerometers along the tower, an approximate verification of the mode shape was also possible by comparing the numerical mode shape to the amplitudes of oscillation at the tower top and mid-tower. This verification resulted in a 3 % mismatch in the first-mode shape (Fig. 8). The free-decay signal, this time not low-pass-filtered, also gave an insight into the second tower mode, located at around 12 Hz. As can be seen, experimental natural frequencies are lower than the numerically predicted ones, and some reason for this mismatch can here be inferred. Firstly, in the FEM model the constraint at the tower base is modelled as a perfect clamp, while in reality a bolted joint connects the tower base flange to the steel hull of the platform, allowing some flexibility; secondly, some more mass should be accounted for on the nacelle and on the tower, given by cable bundles, sheats, bolting and paint.
4.2 Wind correction
To correctly evaluate wind turbine performance curves, in terms of thrust and power, a reliable measurement of wind is necessary. The large-scale model is indeed equipped with a propeller anemometer placed on the nacelle, at a height of approximately 1 m above the tower–nacelle connection. This sensor provides wind speed and wind misalignment with respect to yaw heading. It is obvious that the wind measurement obtained when the wind turbine is spinning is influenced by the shade of the rotor, given that the anemometer is always oriented in the direction of incoming wind, as the rotor itself is. The influence is observed to be more or less intense as the rotor spins with different velocities: it is found generally that the influence of the rotor wake is more intense when the spinning velocity is low, in below-rated operation, leading to an underestimation of the measurement; conversely, as the rotor speed is increased the wind speed measurement is less and less influenced. When the wind turbine is parked, the wind measurement obtained with this sensor is deemed to be reliable. To obtain a wind speed measurement that is reliable as much as possible when the rotor is spinning, a procedure to correct wind measurement has been formulated, and it is hereby presented. The procedure takes advantage of presence of an onshore anemometer of a sonic type, installed on a 5 m pole on the shore facing the platform. As the wind turbine anemometer is considered to provide the most reliable wind speed measurement when the wind turbine is parked, mainly because it is located at hub height and close to the rotor and thus measures the actual wind that hits the turbine, firstly a correction coefficient is derived between the offshore and the onshore anemometer in non-spinning conditions. The correction coefficient is of course variable both in speed and in direction because the onshore anemometer reading is influenced by some obstacles present nearby; nevertheless, the variability in direction was found to be negligible. A second coefficient is derived between the onshore and the offshore anemometer for spinning cases (i.e. the measurement to be corrected), always considering the wind speed variability (which includes the rotor speed variability, given the unique operating points of the machine). The two coefficients are then merged, obtaining a single coefficient to be multiplied to the offshore anemometer measurement in spinning-rotor conditions to evaluate the correct measurement and overcome the shadow effect.
The correction procedure is summed up in Eq. (2), where U stands for wind speed, “ns” for non-spinning condition, “s” for spinning condition, “off” for offshore, “on” for onshore and “CORR” for corrected measurement; the coefficients are a function of the wind speed. First the coefficients cns, cs and C are evaluated, and then the corrected measurement is obtained by applying the coefficient C to the original, offshore measurement.
To calculate the coefficients in the range of 2.5 to 9.5 m s−1, two curve-fitting procedures were performed separately for the points collected in below-rated and above-rated regions because the coefficients clearly present a different trend. This fact is considered reasonable because in below-rated regions the rotor spins at different and increasing speeds, while in above-rated regions the rotor speed is constant. In the below-rated region a decreasing trend is observed and the obtained coefficient is , while in the above-rated region the trend is constant and approximately equal to 1; thus no correction is applied to the measures for wind speeds greater than 5 m s−1.
The correction presented here is applied to all the wind speed data in spinning-rotor conditions utilized in this work, while no correction is applied for non-spinning cases. As for the wind direction, the offshore measurement is also considered reliable in spinning conditions.
4.3 Operating points
In view of the validation of the design, the wind turbine operational parameters should be evaluated so that the extracted values are meaningful. It is necessary, therefore, to extract from time histories time windows of data with peculiar characteristics, here termed operating points. We can define an operating point as a time interval in which all the environmental conditions and wind turbine parameters are constant, meaning that the machine is set to a steady-state point, or regime point. It is obvious that pure constant conditions for parameters do not exist, but nevertheless, this fact is not an impediment to finding a regime point with sufficiently stationary statistical characteristics. Each point is characterized by a given wind speed, rotor speed and blade pitch. In order to individuate operating points, the following procedure was considered. All the time history records featuring the wind turbine in working conditions (identified by an inquiring rotor speed greater than 60 rpm, commanded torque greater than 0 and collective blade pitch less than 30∘) were cut into 10 s frames, and the average values of measures calculated for each selected frame are considered operating points. For each frame, the operating conditions are considered stationary if the rotor speed variance is within a certain range, discarding transient conditions that can alter the resulting performance. Since the yaw control is not active during tests, the alignment of the rotor with the wind direction is checked too, discarding frames with greater misalignment that can show performance altered with respect to the ideal, fully aligned case.
The obtained operating points are then utilized to evaluate the machine performance and calculate the thrust force and power coefficients for the purpose of validating the design. The operating points are further averaged considering 0.25 m s−1 wide wind speed ranges spaced from 2.5 to 9.5 m s−1 in order to obtain a curve as a function of wind speed.
Considering the randomness of the environmental conditions, months of testing are needed to collect a sufficiently high number of regime points at several wind speeds, covering all the working regions of the VSVP controller.
For good results of the experimental campaign, which aims at reproducing at model scale the multipurpose platform concept and all its subsystems, it is of fundamental importance to assess whether the wind turbine model behaves as it was laid out in the design phase. In particular, this refers to the aerodynamic loads and the performance of the turbine, pictured by the thrust force (the aerodynamic force acting perpendicular to the rotor plane and considered crucial in particular for FOWT – floating offshore wind turbine – dynamics) and the power output. Thus it is necessary to validate the aerodynamic design to ensure the quality of the results. This is accomplished by comparing the numerical power coefficient curve with experimental values and by matching the numerical and experimental thrust curves. The comparator numerical data were the base of the wind turbine design and were in turn assessed with the targets given by the full-scale concept (Muggiasca et al., 2021b).
5.1 Power coefficient
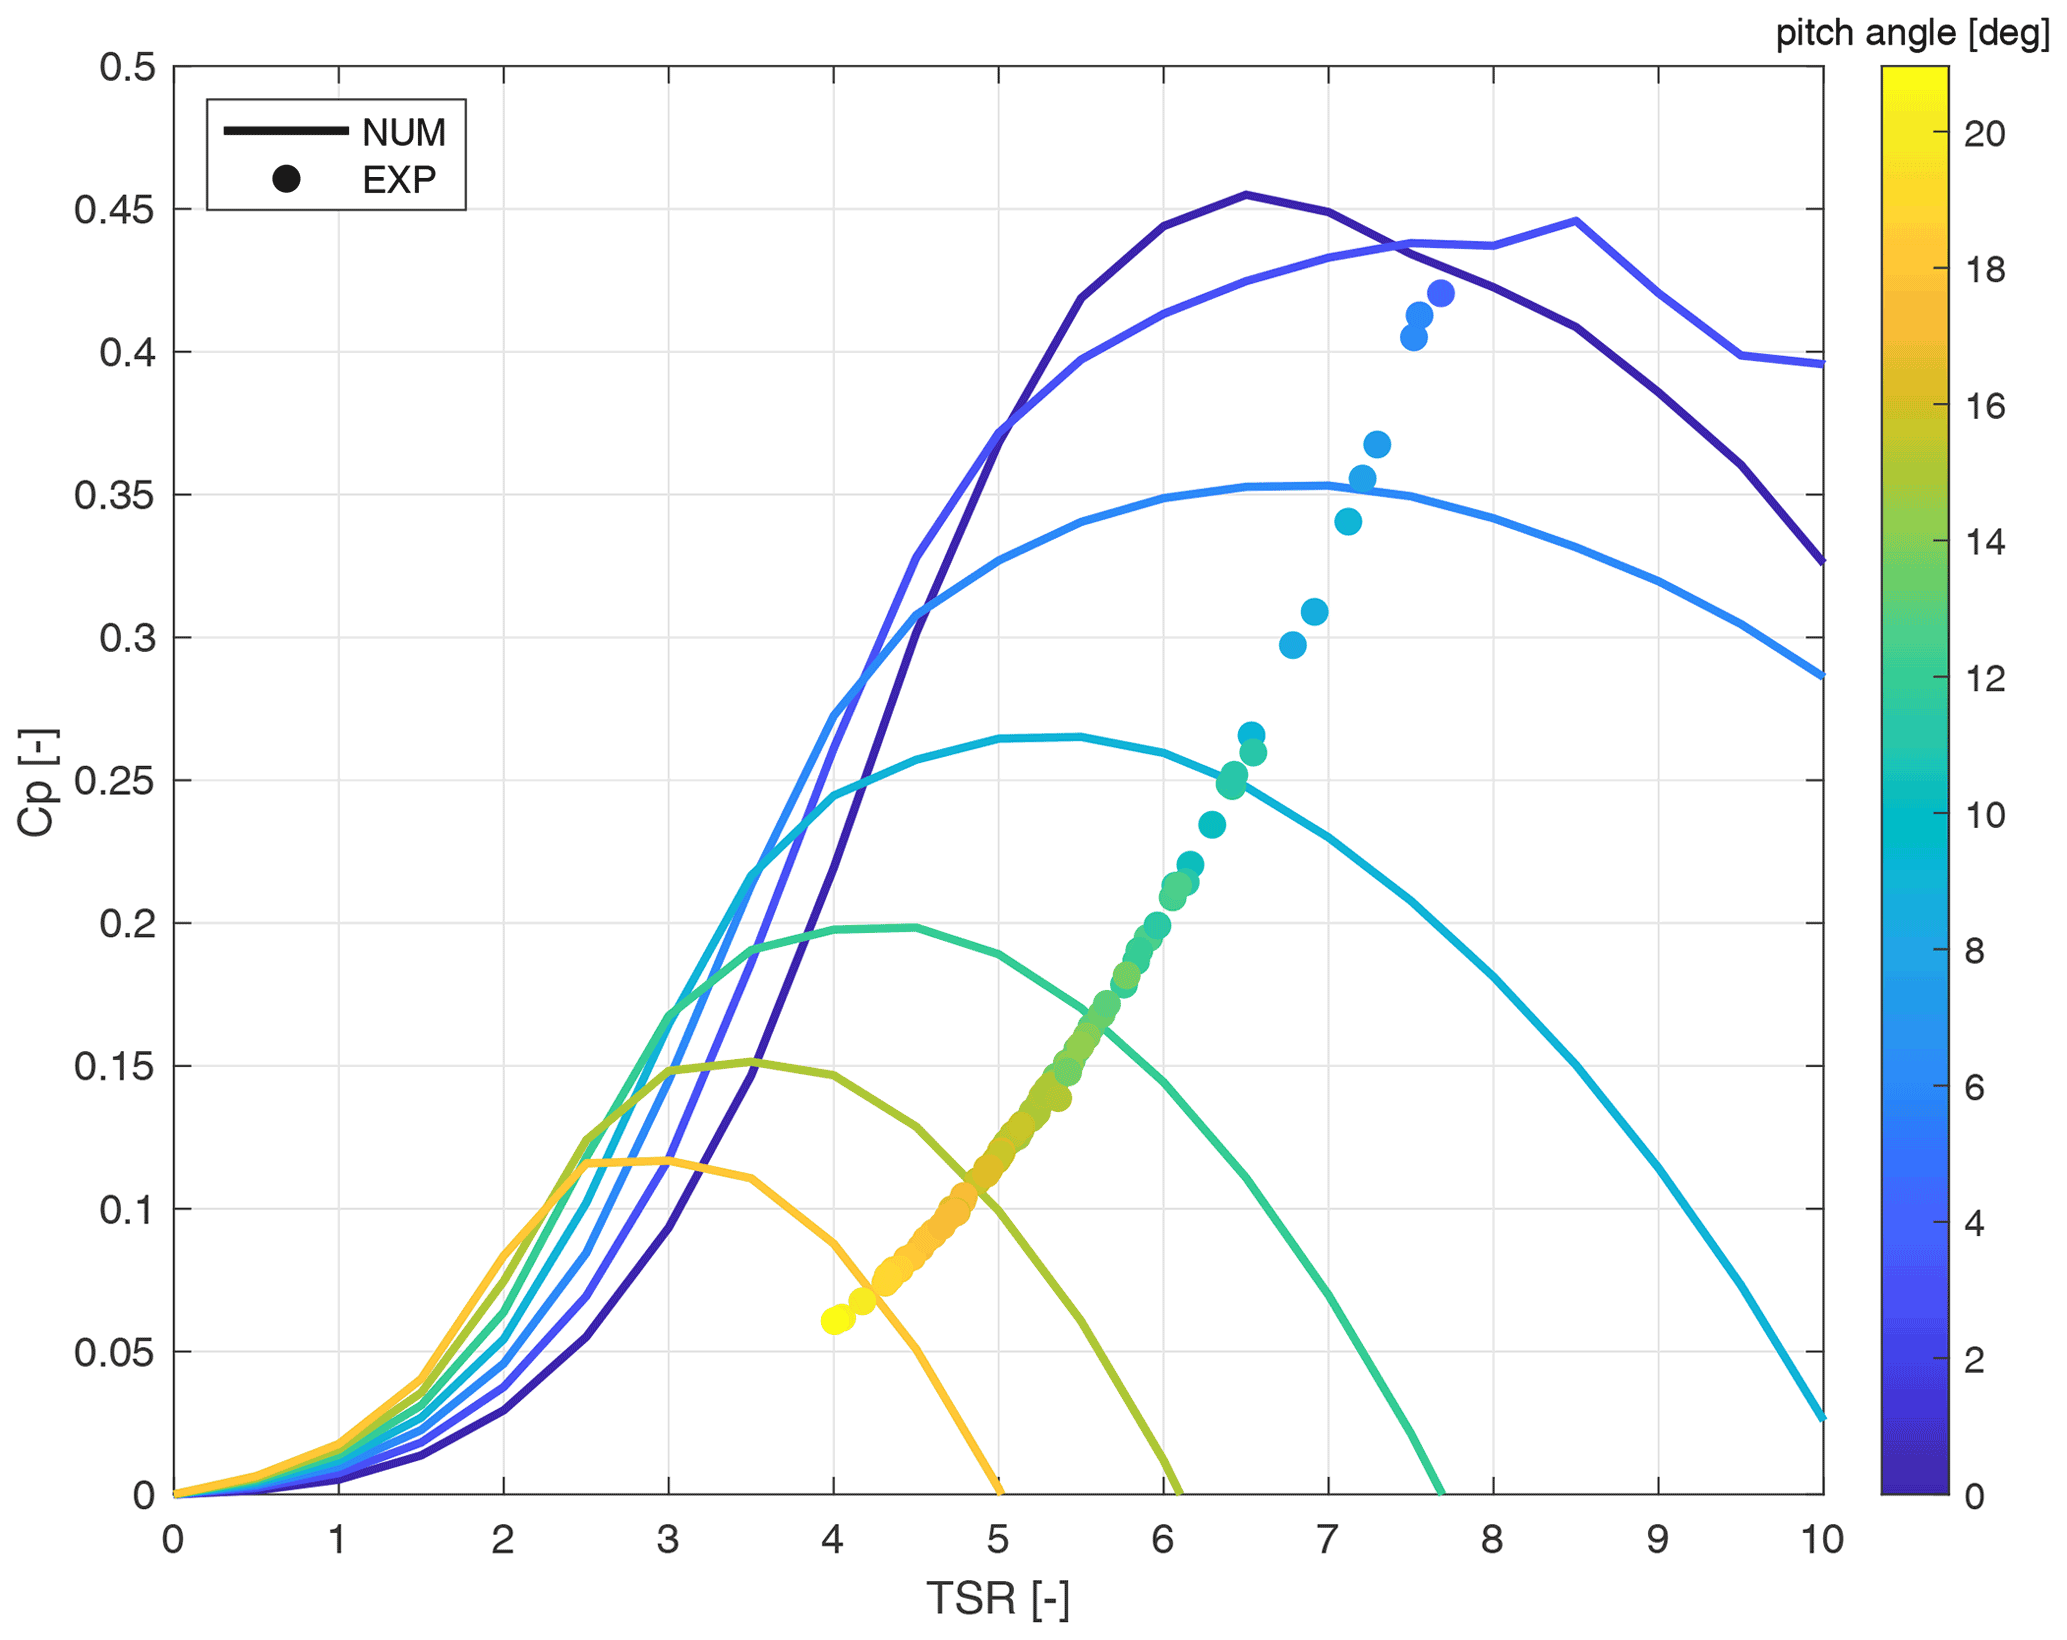
The power output of the wind turbine is representative of the aerodynamic performance. The power output, nondimensionalized in terms of the power coefficient (CP), is the term of comparison. The numerical CP curves, expressed as a function of the tip speed ratio (TSR or λ) and discretized by pitch angle, were evaluated by means of steady-state simulation in FAST v8 (Jonkman and Buhl, 2005) for the aerodynamic design of the model, and they were successfully matched with the CP curves of the full-scale reference (Muggiasca et al., 2021a). The experimental CP values are calculated for the steady-state operating points identified as in Sect. 4.3. The comparison is shown in Fig. 9: experimental measurements (dots) are compared with numerical curves evaluated in FAST v8 (lines). It focuses on the above-rated region: the modifications introduced into the torque controller (see Sect. 6.1) that result in a non-optimal CP tracking in the region, the nature of the graph itself (all points would nearly collapse into one) and the higher uncertainty in the speed measurement make a comparison of the values in the below-rated region less significative. A good match between experimental measurements and the target can be found: the experimental points lie on the correct CP–λ for the same pitch angle. Thus, the aerodynamic performance of the rotor meets expectations and correctly reproduces the numerical design.
5.2 Thrust force evaluation
Thrust measurement can simply be accomplished by placing a load cell under the nacelle, and this is actually the procedure followed in small-scale models for wind tunnel experiments (Bayati et al., 2020). In the present case, however, several factors related to the model construction and the experimental campaign characteristics made impossible the use of a load cell in the model. A load cell would not have guaranteed the necessary mechanical resistance and stiffness at the connection between the tower and nacelle, and in addition to this, the accommodation of the yaw mechanism and cable routes descending from the nacelle would have been too complicated from a constructional point of view. Moreover, the load cell protection from environmental actions like rain or salty water would not have been a straightforward task. For these reasons it has been decided during the model design phase to evaluate the thrust force on the rotor in an indirect way, by measuring the bending deformation on the tower and exploiting the strain gauge sets. In addition, the thrust was indirectly evaluated measuring the deformation on the blade root, and the results were compared.
5.2.1 Tower strain gauge calibration
Due to the dimensions of the tower and the peculiarity of its installation, it was not possible to calibrate the strain gauges with the same acquisition system used during the experimental campaign, and then the output of strain gauges was biased by an offset from zero and a multiplicative coefficient. The offset was obtained by acquiring the strain gauge signal in calm wind and sea conditions, corresponding to a practically zero bending moment on the tower base. For the multiplicative coefficient, in contrast, a more sophisticated procedure has been performed, exploiting the accelerometer system. The starting point of the procedure is the free-decay signal obtained during the dynamic investigation of the tower (Fig. 6). The resulting accelerometric signal has been low-pass-filtered to isolate the first mode of the pole, and the 1 DOF acceleration decay is then integrated to obtain nacelle displacement time history.
The measured displacement time history is coupled to the first modal shape of the tower, obtained with FEM software. The mode shape w(x) is fitted with a sixth-order polynomial as in Eq. (3); following Bernoulli's beam theory the strain along the beam can be obtained with Eq. (4), where z is the distance from the neutral axis of the beam.
The strain is particularly evaluated with an x coordinate equal to the location of strain gauges along the tower, and the result obtained via the numerical model is compared with the stress value acquired experimentally during the decay. Comparison showed that a coefficient equal to should be applied to measured stresses in order to correct the reading of extensometer bridges acquired with the acquisition system available on board the platform. In Fig. 10 the time histories of strain as measured by strain gauges and as evaluated with the modal model are shown.

5.2.2 Blade strain gauge calibration
The strain gauges measuring flapwise deformation at the blade root, placed on a specific blade and used for the analysis, were experimentally calibrated in the laboratory at Politecnico di Milano. The moment–deformation curve was obtained by applying increasing weights at the blade tip with the blade lying horizontally oriented in a way that the loads would cause deformation in the flapwise direction only. The resulting moment–deformation expression is M=1.56ε, where M is the moment measured in newton metres (N m) and ε is the strain at the blade root measured in micrometres per metre (µm m−1).
5.2.3 Thrust curve
An ensemble of operating points is used to evaluate the experimental thrust curve. Firstly, the thrust force was evaluated by means of base tower strain measurements. In each operating point, the mean value of strain recorded by the strain gauges is used to estimate the bending stress on the tower fore–aft and side–side bending axis; then, by knowing the geometry of the tower cross-section and the distance between the strain gauge location and rotor axis, it is possible to evaluate the forces giving rise to the evaluated bending stress. Forces are then projected in the along-wind direction, and the value of the thrust is obtained. Prior to this operation, to avoid including undesired signal offsets and tower drag (even if the tower drag can be deemed negligible with respect to the amount of thrust force) in the thrust value, the offsets of the tower base fore–aft and side–side deformation signals are evaluated. The procedure is similar to the one presented for the operating-point evaluation in Sect. 4.3, considering the average values of 10 s windows selected under constraints that identify that the turbine rotor is parked and subject to low aerodynamic loads (inquiring rotor speed less than 5 rpm and collective blade pitch between 80 and 100∘, i.e. feather position). The offset applied to each signal is the one closer in time to the time of signal acquisition.
The resulting thrust force calculated for each operating point is reported in Fig. 11 as a function of wind speed (dots) together with the thrust curve evaluated averaging the points as explained in Sect. 4.3 (triangles), and it is compared to the numerical target curve drawn in the design phase by means of FAST v8 simulations (line). The dispersion, in the form of standard deviation, is displayed for the average points, and it represents how the regime points are spread from the mean.
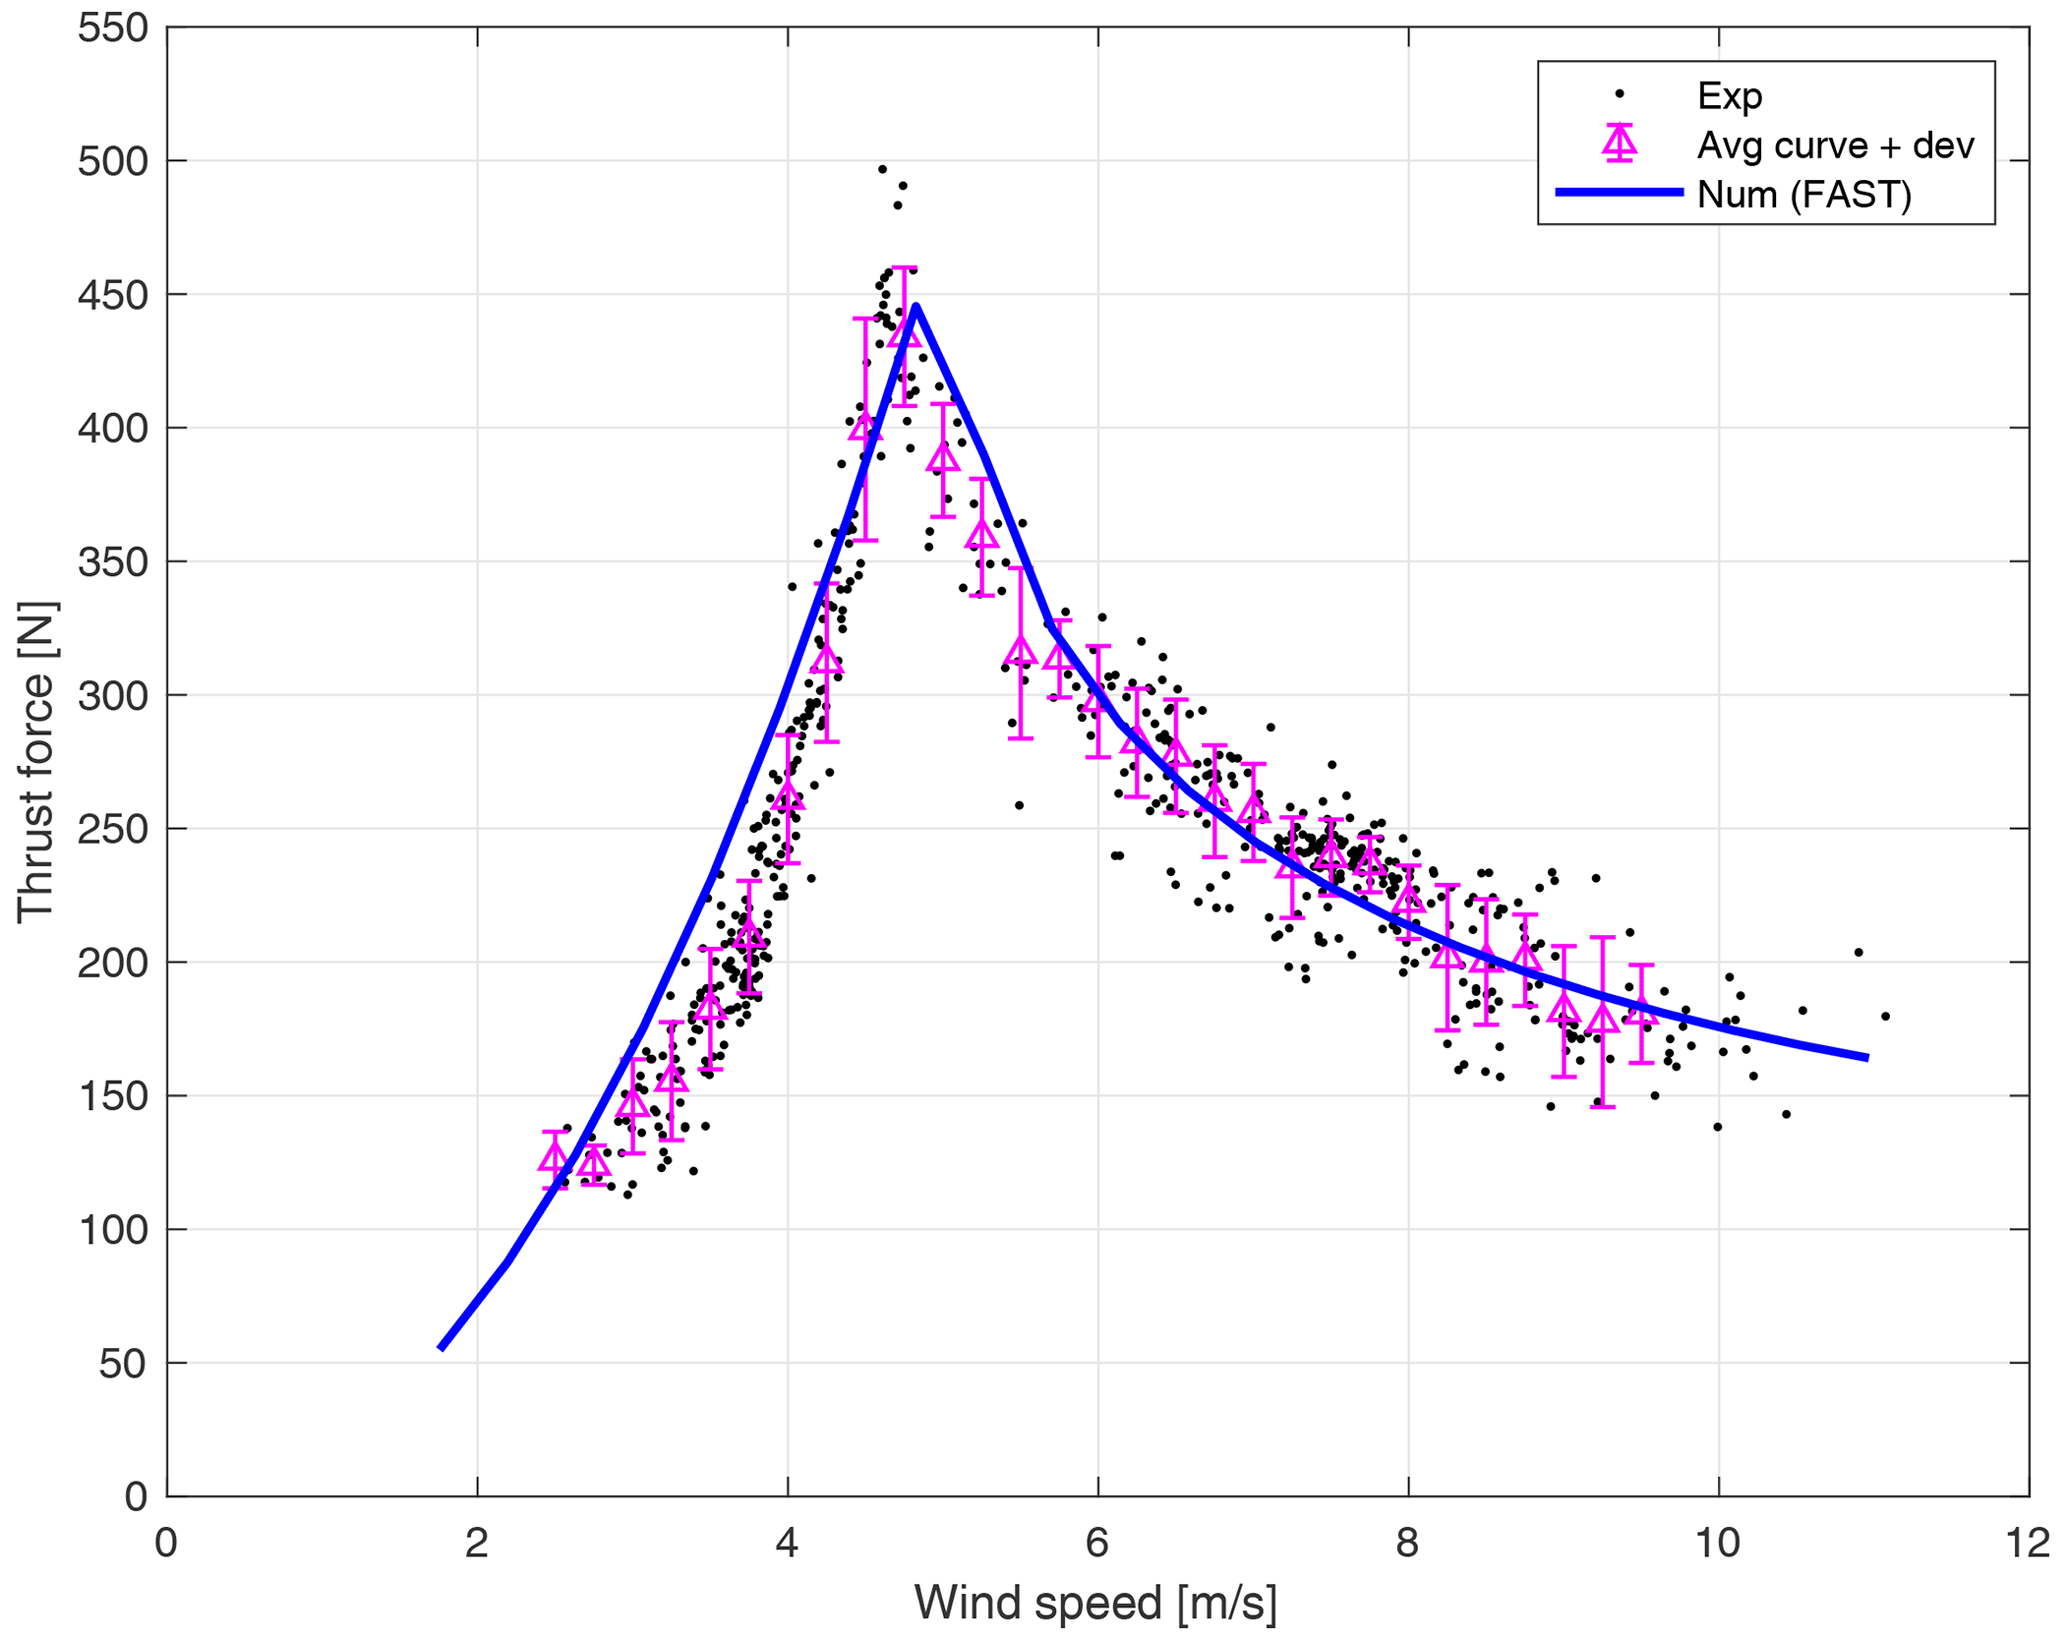
Figure 11Comparison between the target and experimental thrust curve evaluated from tower deformation.
Secondly, the thrust force was evaluated by means of blade deformation measurements. The strain values measured at the blade root for a single blade allow us to calculate the flapwise moment at the blade root applying the experimental moment–deformation curve. Once the blade root flapwise bending moment is estimated, it is necessary to estimate the equivalent force giving rise to the bending moment, which is the same force generating the rotor thrust together with the forces acting on the other two blades. The equivalent force here mentioned is the force whose intensity is equal to the integral of aerodynamic distributed forces all along the blade axis and whose point of application yields the same blade root bending moment of the whole distribution, essentially the barycentre of force distribution. The point of application of the equivalent force is estimated numerically thanks to FAST v8 simulations performed in the same wind and operational conditions as experimental measures. The force, projected according to the blade pitch angle, is then multiplied 3 times to obtain the global thrust force acting on the rotor. As an intermediate sanity check on acquired measurements, the moment at the blade root experimentally measured is compared to FAST v8 simulation results: this procedure is followed to directly check bending moment values and avoid the uncertainty given by the numerical estimation of the point of application of the equivalent, one-blade-only thrust force. The rotor thrust force estimated according to the mentioned procedure is reported in Fig. 12, with notation equivalent to that of Fig. 11.
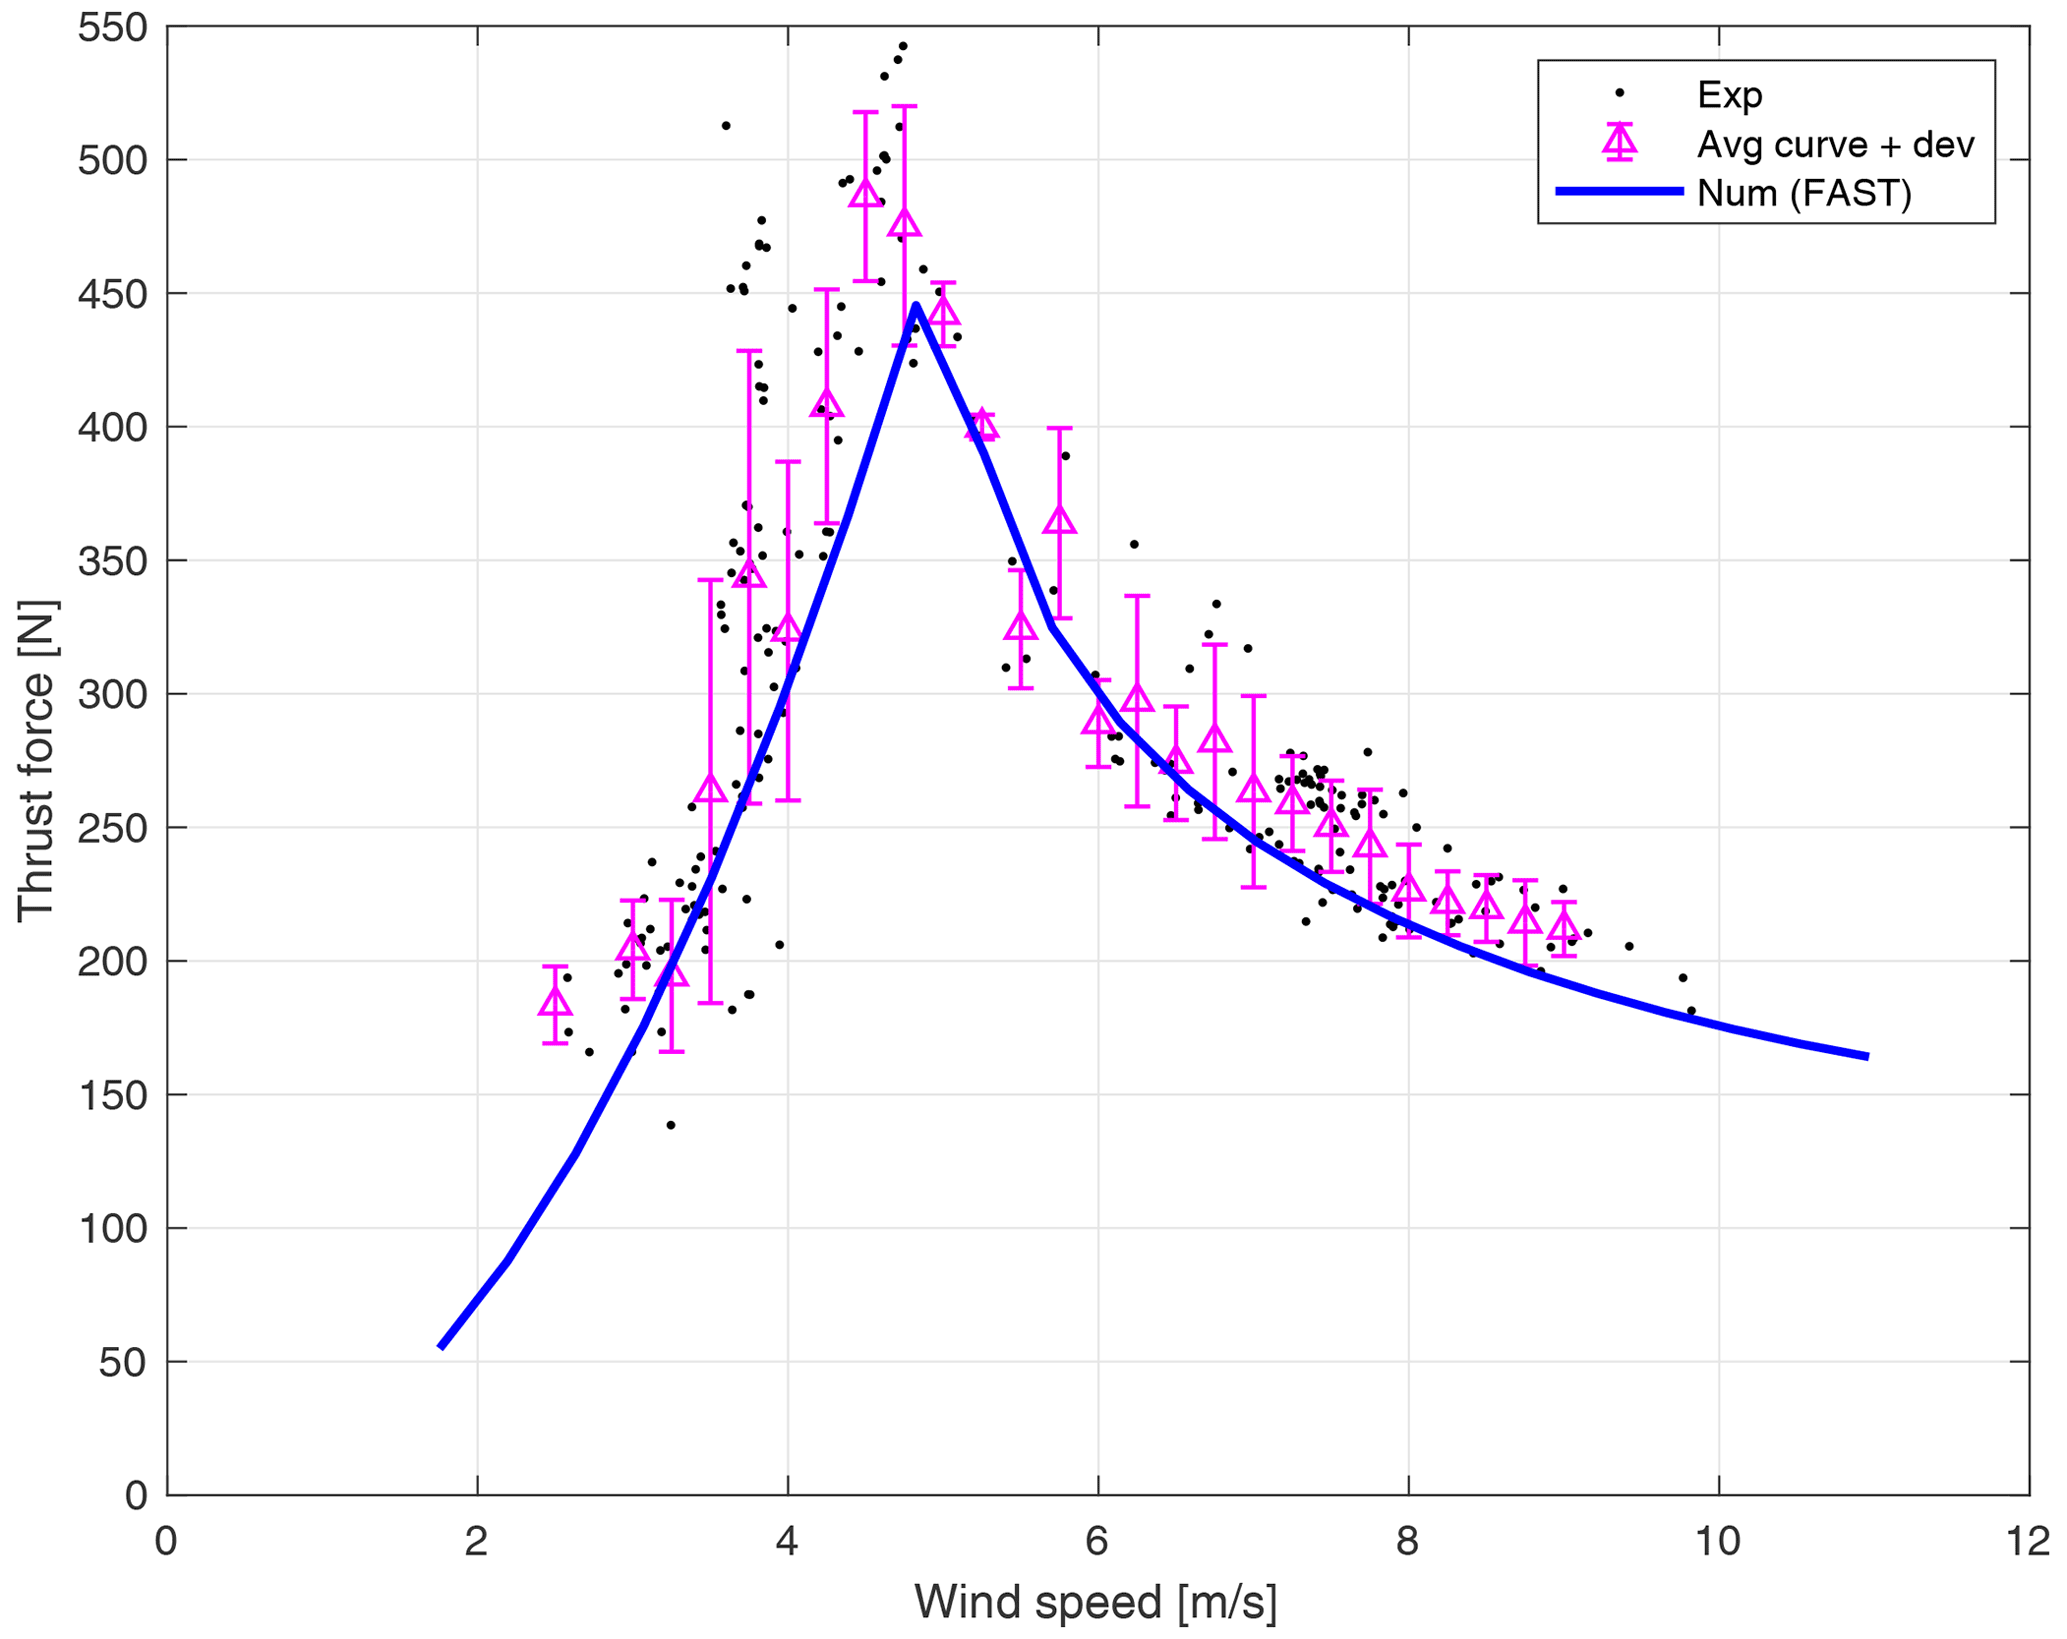
Figure 12Comparison between target and experimental thrust curve evaluated from blade deformation.
The thrust curves obtained with the two methods are compared to the numerical target curve in Fig. 13, which shows the target curve (line), average points from tower deformation (red triangles) and average points from blade deformation (green triangles).
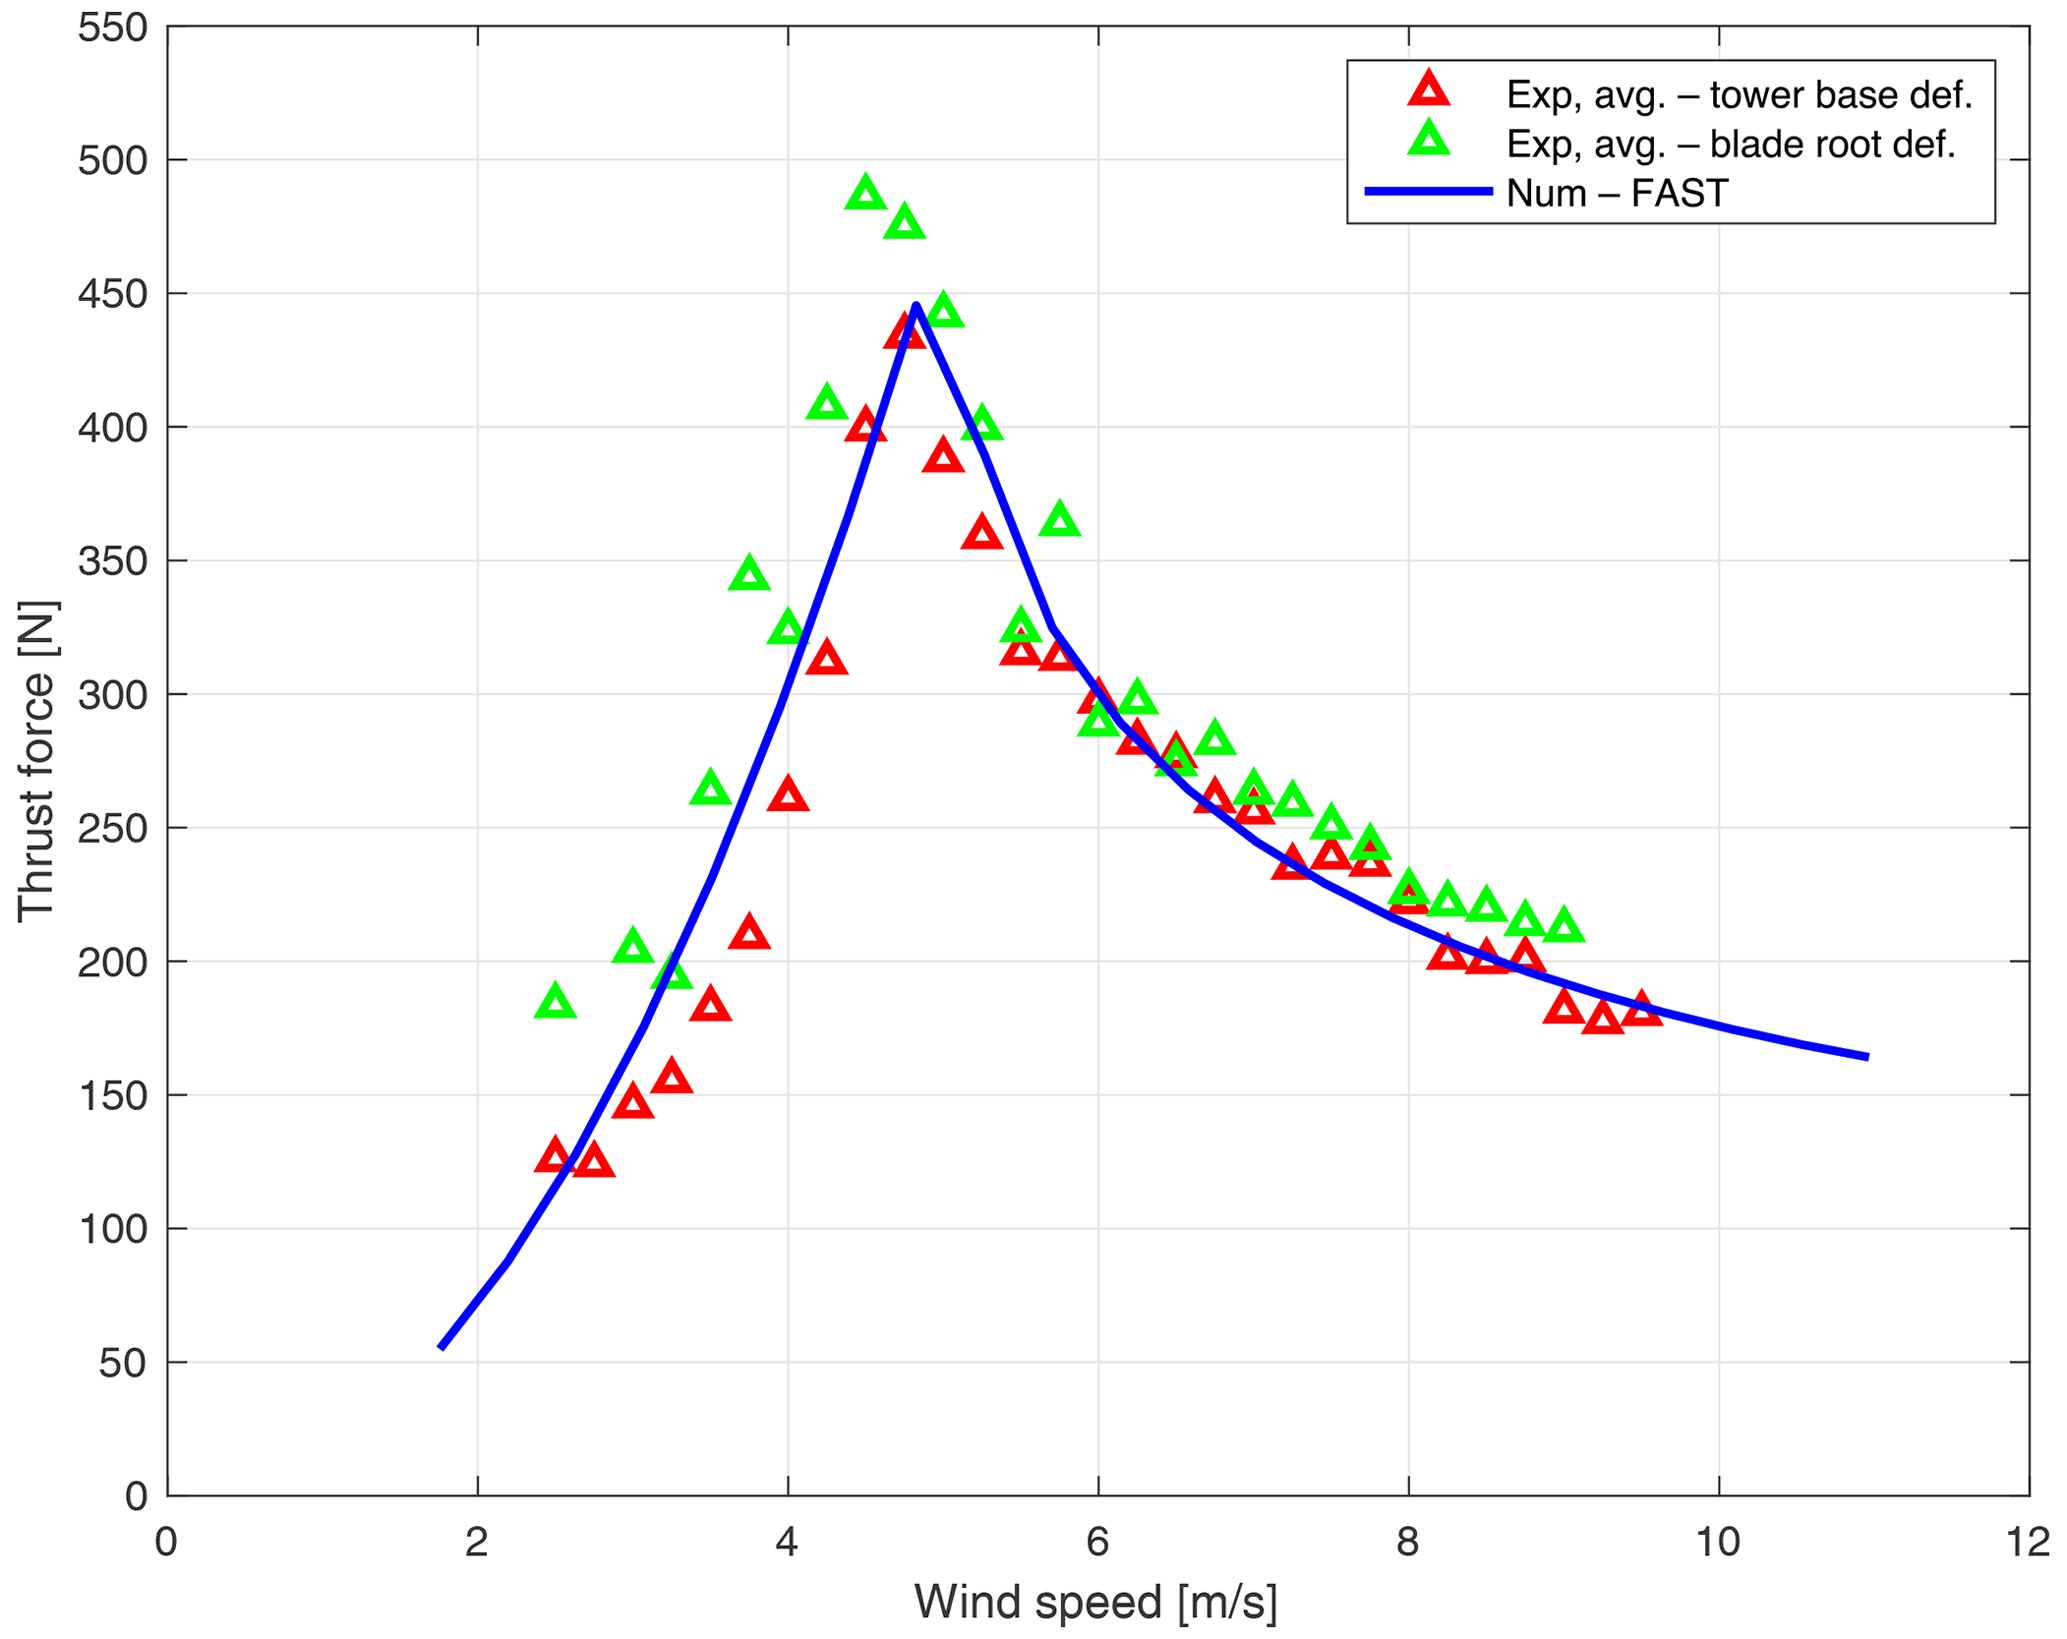
The first consideration to be made regarding the comparison between the numerically evaluated thrust curve and the experimental ones is that there is a good agreement between the numerical design and the large-scale physical model. The values are comparable, and the trend is superimposable. In this sense the aerodynamic performance of the rotor is also validated as far as rotor thrust is concerned. However, small discrepancies can be found, and some comments on them are provided here: the curve obtained from the blade is higher with respect to the tower one for all wind speeds, and both curves are further from the target for below-rated wind. In a below-rated region, as it is stated in Sect. 6.1, some improvements have been made to the control system to ease the startup of the wind turbine in unfavourable wind conditions; this fact causes the rotor speed found experimentally to be slightly different from the one predicted by the numerical model (see Fig. 14), thus also causing a difference in thrust force. Moreover, as stated in Sect. 4.2, below-rated wind speeds seem to be more affected by rotor shade effects, with an obvious shift in the thrust curve values. Concerning the discrepancy found between the curves, with the blade thrust being a bit higher than the tower-estimated one, it is to be considered that some approximation is inserted in the procedure of thrust estimation by assuming the numerical distribution of aerodynamic forces on the blade span, being impossible to obtain on the model.

The correct operation of the wind turbine is assured by the control system. The power controller, during the operation of the machine, acts on the generator torque and on the pitch angle of the blades to regulate the rotor speed for the different inflow conditions. A description of the control system installed on the machine is given in Muggiasca et al. (2021b). Generator torque, blade pitch and rotor speed directly depend on the controller. Also the thrust force indirectly depends on the control action and thus the main static and dynamic loads acting on the system. For this reason, it is important to assess whether the operation of the controller during tests correctly reproduces the design target, in terms of both steady-state operating points and the dynamic response.
Particular care is taken regarding the dynamic effect of the pitch controller. In above-rated operations, the turbine is controlled varying the pitch angle and the variation in the pitch angle has a direct influence on the thrust force: increasing the pitch angle of the blade means the thrust force acting on the rotor decreases. This leads to a dynamic loading of the structure at a frequency determined by the control action. Moreover, as is well known (Larsen and Hanson, 2007), instability phenomena can arise in FOWT due to the coupling between the control action, which is determining the frequency of the pitch-controlled drivetrain and thus the loading frequency of the thrust force, and the rigid body modes of the floater, in particular the pitch mode.
In order to assess the controller operation, firstly a steady-state analysis of the operating points in the whole working range of the turbine is performed. Secondly, the dynamic effect of the pitch controller action is investigated. This was performed for different gain sets in order to study the dependence on them.
6.1 Steady-state operating points
This paragraph reports the assessment of controller design concerning the correct reproduction of the operating points prescribed in the design phase; to this end, the design rotor steady-state performance is compared to the experimental one. For each operating point found as in Sect. 4.3, the turbine operating parameters are collected. The result of the analysis is shown in Fig. 14 where the rotor speed, blade collective pitch and rotor power are represented as a function of wind speed: dots represent the operating points; triangles represent the averaged values (see Sect. 4.3); the line represents the design curves. As can be seen, there is a slight discrepancy in all the curves in the below-rated region, while in the above-rated region a slight shift can be noticed in the blade collective pitch but preserving the correct trend. The first effect can be explained by bearing in mind that in the below-rated region, some modifications have been made to the torque controller with respect to the design phase, as detailed in Taruffi et al. (2022), and these modifications induced alterations in the actual operating points of the machine. The modifications were considered necessary during the setup of the experimental campaign to guarantee an easier turbine operation: since the wind turbine is started on demand, the startup also has to be feasible at wind speeds much higher than the cut-in value. As a consequence, a motoring torque was introduced to enable the turbine startup, and the demanded torque curve in partial-load operation was adjusted to ease the startup in particular cases when the aerodynamic torque for a specific rotational speed resulted in being too low for the turbine to reach the correct operating point. This can be considered the main reason for the discrepancies found in below-rated regions. Moreover, despite the correction applied (see Sect. 4.2), a grade of uncertainty persists in the wind speed measurement, and this can affect the curves in both below- and above-rated regions, resulting in a slight horizontal shift. However, a better-than-expected efficiency of the blade profile could also explain the slight upward shift in the pitch angle curve seen in above-rated regions.
6.2 Pitch control effect
The effect of the pitch controller on the wind turbine dynamics is investigated evaluating the PSD of rotor speed and blade pitch for different gain sets (kP and ki) of the pitch controller (Fig. 15): baseline gains are multiplied from 0.5× to 3× to observe their influence on rotor speed oscillation and blade pitch control effort. The PSD has been evaluated for signals of the same duration belonging to consecutive tests repeated in similar wind and wave conditions with different gain sets. The rotor speed and the pitch angle represent the controlled output and the control input respectively.

In the low-frequency range, between 0 and 1 Hz, it is possible to see how the gain sets affect the dynamic amplification of wind turbulence by the transfer function of the controlled drivetrain: as the gains are increased, the peak shifts to the right and thus the pitch-controlled drivetrain becomes “stiffer”. In the “3×” case the peak is highly amplified with respect to the other cases, mainly because the frequency of the controlled drivetrain is moving close to the first natural frequency of the tower (1 Hz): the thrust force, whose natural frequency of oscillation is given by the blade pitching, is forcing the tower to be near its first mode. Increasing the gains, the amplitude of the pitch actuation PSD increases in the whole frequency range, reflecting an increased actuation effort. However, increasing the gains does not always result in reduced rotor speed oscillations and consequently lower amplitude in the rotor speed PSD: for the 3× case an increased fluctuation is noticed, and other cases do not show a reduction with respect to the baseline as would be expected. After this investigation of controller dynamics sensitivity to gain changes, the baseline gains were adopted in the rest of the experimental campaign.
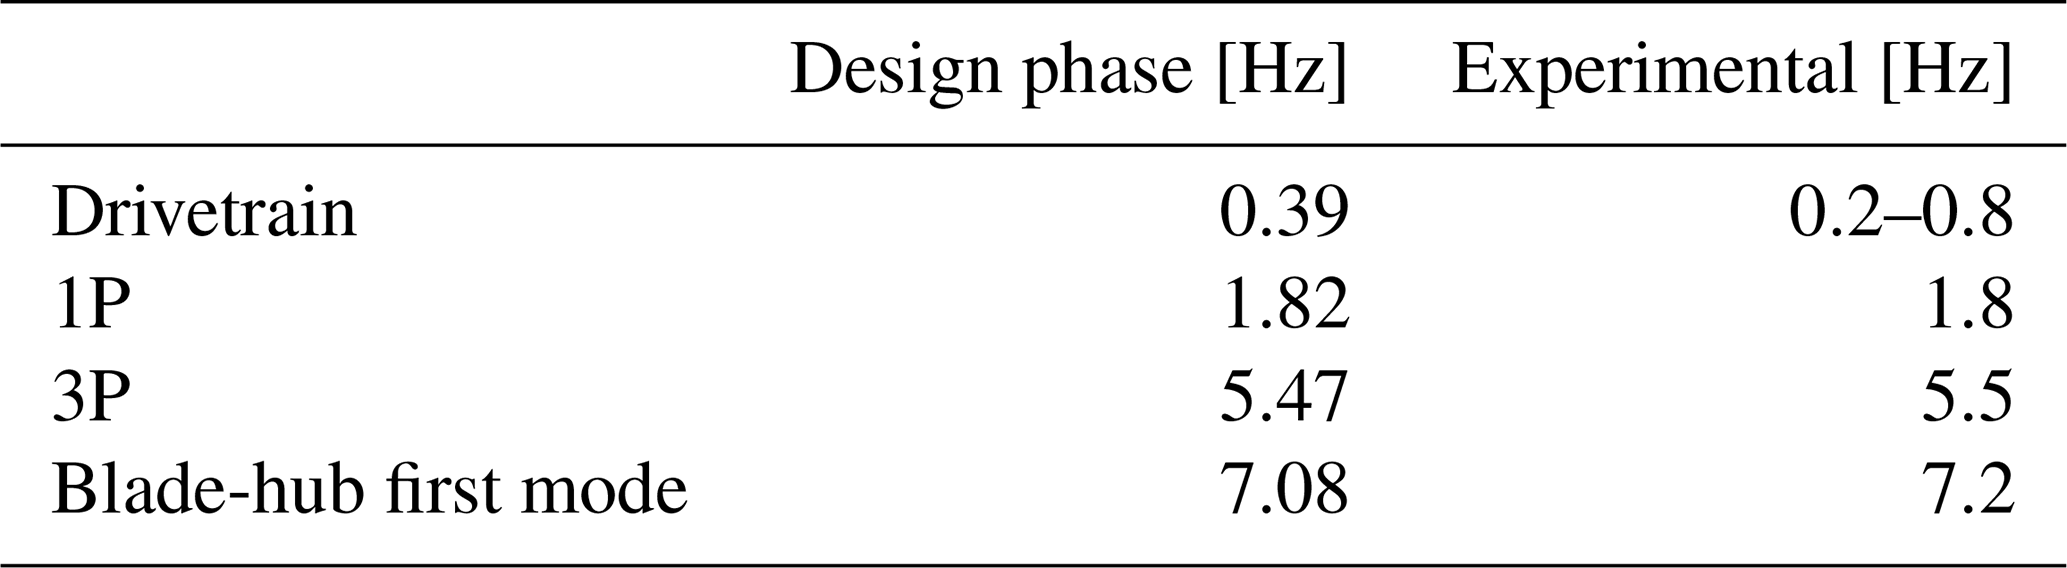
From Fig. 15 the main characteristic frequencies of the rotor system can also be pointed out. The identified frequencies are compared with the ones resulting from the design phase in Table 3. A good agreement was found, enhancing the quality of the design.
This work focused on the experimental validation of the design of a large-scale wind turbine model installed on a floating multipurpose platform. The aim of the validation is to assess whether the behaviour of the wind turbine model respects the parameters established during the design phase in terms of structural dynamics, aerodynamics of the rotor and power controller dynamics. The evaluation of structural dynamics revealed some discrepancies due to assumptions made in the numerical model of the tower in terms of a mismatch in flexible natural frequencies; nevertheless those deviations are acknowledged and taken into account in the rest of the assessment. The number of accelerometers installed on the tower made possible just a rough validation of mode shapes (just in two points), and a greater number of sensors should be taken into account in a future experimental test to have a better knowledge of tower dynamics. Nevertheless, the procedure of a sudden turbine shutdown to trigger a free decay of the tower proved to be successful in the inspection of tower flexible dynamics.
Concerning wind turbine performance, the aerodynamic design was evaluated in terms of the thrust force exerted by the rotor. Great care was taken regarding this point because the correct reproduction of thrust force is the key point of the whole scaling process that generated the dimensions of the wind turbine model. Rotor thrust is evaluated in two ways: measuring tower base loads and measuring blade root loads. In both cases the agreement between numerically predicted and experimentally observed thrust is very good, apart from some discrepancies in below-rated operation given by deviations of the control system from the design behaviour made during the experimental campaign and uncertainty in the wind speed measurement. In addition to the assessment of performance, the combined procedure for thrust estimation also validates a strategy to overcome one of the initial difficulties of the experimental campaign, connected to the impossibility of measuring rotor thrust force directly with a load cell. The complexity of the large-scale model, together with the natural environmental conditions, makes the use of a load cell extremely difficult, which would be fundamental to measuring such an important parameter of the system. One of the outcomes of the experimental campaign is that it is possible, with good accuracy, to measure indirectly this parameter. Uncertainty connected with the estimation procedures, like the inertial loads and the hub drag effect, was handled by processing of data or proved not to be relevant.
Regarding the control system, the controller operation revealed a very good numerical–experimental agreement in the above-rated region for the rotor speed, blade pitch and rotor power. Even in these quantities, deviations are observed in the below-rated region due to the aforementioned changes made to the controller settings. A remark to be made regarding this point is about issues found during the startup phase of the wind turbine. Given the low-Reynolds conditions found at low wind speeds, it is very difficult to obtain a model able to start up by itself from a zero-rotational-speed condition. The strategy adopted during this experimental campaign or giving a startup motive torque is straightforward and can be implemented easily in the control system. More complex strategies are available, like improving blade inflow angles with blade pitch, just to list one of them.
The overall outcome of the investigation is a good match between the desired and the observed characteristics of the large-scale model that ensures the validity of the design process. The findings exposed in this work are on the one hand consolidating novel procedures in the design of large-scale models and on the other hand encouraging for further attempts in the field to conduct large-scale modelling in natural environments.
The dataset is accessible upon request to the authors.
FT, SDC and SM designed the tests. FT and SDC carried out the tests, performed the analyses and prepared the manuscript with all the contributions. SM supervised the analyses and reviewed the manuscript. MB was responsible for supervision, funding acquisition and project administration.
The contact author has declared that none of the authors has any competing interests.
The content of the work does not report
the opinion of the European Commission and reflects only the views of the
author(s), including errors or omissions. The European Commission is also
not liable for any use that may be made of the information contained herein.
Publisher’s note: Copernicus Publications remains neutral with regard to jurisdictional claims in published maps and institutional affiliations.
This work has been produced in the framework of The Blue Growth Farm project (http://www.thebluegrowthfarm.eu/, last access: 27 December 2022), which has received funding from the European Union's Horizon 2020 research and innovation programme under grant agreement number 774426.
This research has been supported by European Union's Horizon 2020 research and innovation programme (grant no. 774426).
This paper was edited by Amy Robertson and reviewed by two anonymous referees.
Abhinav, K. A., Collu, M., Benjamins, S., Cai, H., Hughes, A., Jiang, B., Jude, S., Leithead, W., Lin, C., Liu, H., Recalde-Camacho, L., Serpetti, N., Sun, K., Wilson, B., Yue, H., and Zhou, B.: Offshore multipurpose platform for a Blue Growth: a technological, environmental and socioeconomic review, Sci. Total Environ., 734, 138256, https://doi.org/10.1016/j.scitotenv.2020.138256, 2020.
Arena, F. and Barbaro, G.: The Natural Ocean Engineering Laboratory, NOEL, in Reggio Calabria, Italy: a commentary and an announcement, J. Coast. Res., 29, vii–x, https://doi.org/10.2112/13A-00004, 2013.
Aubault, A., Alves, M., Sarmento, A., Roddier, D., and Peiffer, A.: Modeling of an oscillating water column on the floating foundation WindFloat, in: Proceedings of the ASME 2011 30th International Conference on Ocean, Offshore and Arctic Engineering, Rotterdam, The Netherlands, 19–24 June 2011, 5, 235–246, https://doi.org/10.1115/OMAE2011-49014, 2011.
Bak, C., Zahle, F., Bitsche, R.,. Kim, T, Yde, A., Henriksen, L. C., Hansen, M. H., Blasques, J. P. A. A., Gaunaa, M., and Natarajan, A.: The DTU 10 MW reference wind turbine, Danish wind power research, https://orbit.dtu.dk/en/publications/the-dtu-10-mw-reference-wind-turbine (last access: 8 January 2023), 2013.
Bayati, I., Facchineti, A., Fontanella, A., Taruffi, F., and Belloli M.: Analysis of FOWT dynamics in 2-DOF hybrid HIL wind tunnel experiments, Ocean Eng., 195, 106717, https://doi.org/10.1016/j.oceaneng.2019.106717, 2020.
Boccotti, P.: Caisson for absorbing wave energy, US Patents, 2002.
Boccotti, P.: Caisson breakwaters embodying an OWC with a small opening – Part I: Theory, Ocean Eng., 34, 816–819, https://doi.org/10.1016/j.oceaneng.2019.106717, 2007.
Cheli, F. and Diana, G.: Advanced dynamics of mechanical systems, Springer, Edn. 1, XXII, 818, https://doi.org/10.1007/978-3-319-18200-1, 2015.
Fontanella, A., Taruffi, F., Muggiasca S., and Belloli, M.: Design methodology for a floating offshore wind turbine large-scale outdoor prototype, in: Proceedings of the ASME 2019 38th International Conference on Ocean, Offshore and Arctic Engineering, Glasgow, Scotland, UK, 9–14 June 2019, https://doi.org/10.1115/OMAE2019-95979, 2019.
Jonkman, J. M. and Buhl, M. L.: FAST User's Guide, NREL, 2005.
Jouffrey, J. B., Blasiak, R.,. Norström, A. V, Österblom, A. V., Crona, B., Søgaard, Jørgensen P., Carpenter, S. R., Bodin, Ö., Galaz, V., and Folke, C.: The Blue Acceleration: the trajectory of human expansion into the oceans, One Earth, 2, 43–54, https://doi.org/10.1016/j.oneear.2019.12.016, 2020.
Lagasco, F., Collu, M., Mariotti, A., Safier, E., Arena, F., Atack, T., Brizzi, G., Tett, P., Santoro, A., Bourdier, S., Salcedo Fernandez, F., Muggiasca, S., and Larrea, I.: New engineering approach for the development and demonstration of a multipurpose platform for the blue growth economy, in: Proceedings of the ASME 38th International Conference on Ocean, Offshore and Arctic Engineering Glasgow, Scotland, UK, 9–14 June 2019, https://doi.org/10.1115/OMAE2019-96104, 2019.
Larsen, T. J. and Hanson, T. D.: A method to avoid negative damped low frequent tower vibrations for a floating, pitch controlled wind, in: Journal of Physics: Conference Series, 75, 012073, IOP Publishing, https://doi.org/10.1088/1742-6596/75/1/012073, 2007.
Michailides, C., Luan, C., Gao, Z., and Moan, T.: Effect of flap type wave energy converters on the response of a semi-submersible wind turbine in operational conditions, in: Proceedings of the ASME 2014 33rd International Conference on Ocean, Offshore and Arctic Engineering, San Francisco, California, USA, 8–13 June 2014, https://doi.org/10.1115/OMAE2014-24065, 2014.
Muggiasca, S., Fontanella, A., Taruffi, F., Giberti, H., Facchinetti, A., and Belloli, M.: Large Aeroelastic Model of a Floating Offshore Wind Turbine: Mechanical and Mechatronics Design, in: Proceedings of the ASME 2019 2nd International Offshore Wind Technical Conference, St. Julian's, Malta, 3–6 November 2019, https://doi.org/10.1115/IOWTC2019-7537, 2019.
Muggiasca, S., Taruffi, F., Fontanella, A., Di Carlo, S., and Belloli, M.: Aerodynamic and structural strategies for the rotor design of a wind turbine scaled model, Energies, 14, 2119, https://doi.org/10.3390/en14082119, 2021a.
Muggiasca, S., Taruffi, F., Fontanella, A., Di Carlo, S., Giberti, H., Facchinetti, A., and Belloli, M.: Design of an aeroelastic model of the DTU 10 MW wind turbine for a floating offshore multipurpose platform, Ocean Eng., 239, 109837, https://doi.org/10.1016/j.oceaneng.2021.109837, 2021b.
Muliawan, M. J., Karimirad, M., and Moan, T.: Dynamic response and power performance of a combined spar-type floating wind turbine and coaxial floating wave energy converter, Renew. Energ., 50, 47–57, https://doi.org/10.1016/j.renene.2012.05.025, 2013.
NOEL – University of Reggio Calabria: http://noel.unirc.it/, last access: 6 June 2022.
Ruzzo, C., Romolo, A., Malara, G., Arena, F., Taruffi, F., Muggiasca, S., Belloli, M., Bouscasse, B., Ohana, J., Santoro, A., Aubriere, K., Brizzi, G., Collu, M., Corvaglia, P., and Lagasco, F.: On the arrangement of two experimental activities on a novel multipurpose floating structure concept, in: Developments in Renewable Energies Offshore, 291–302, CRC Press, https://doi.org/10.1201/9781003134572-35, 2021.
Taruffi, F., Di Carlo, S., Muggiasca, S., and Belloli, M.: Experimental validation of the aero-servo design of a large-scale floating offshore wind turbine model, in: Journal of Physics: Conference Series, 2265, 042008, IOP Publishing, https://doi.org/10.1088/1742-6596/2265/4/042008, 2022.
Thiebaut, F., Pascal, R. C. R., and Andreu, A. G.: Investigation into the calibration of orifices used in OWC tank testing, in: Proceedings of the 11th European Wave and Tidal Energy Conferenece (EWTEC), Nantes, France, 2015.