the Creative Commons Attribution 4.0 License.
the Creative Commons Attribution 4.0 License.
 | 19 Jun 2024
Operation and maintenance cost comparison between 15 MW direct-drive and medium-speed offshore wind turbines
Orla Donnelly
Fraser Anderson
James Carroll
Determining offshore wind energy operational expenditures relies on acquiring reliability data, particularly as turbine power ratings increase. The uncertainty surrounding operational costs and optimal drivetrain configurations for larger turbines persists. While previous research has addressed reliability data for 3 MW offshore wind turbines, this study reviews and collates updated failure data for 15 MW turbines, comparing direct-drive and medium-speed configurations. It employs an operation and maintenance (O&M) modelling tool to calculate total operational costs. The study concurs with existing literature, showing that direct-drive turbines have lower operational costs than medium-speed turbines in three case studies. However, the cost and availability differences between configurations are smaller than previously suggested. For 15 MW turbines, the analysis reveals that the cost disparity between direct-drive and medium-speed turbines is significantly smaller than for smaller-rated turbines, with percentages of 1.59 %, 1.58 %, and 5.78 % for the three ScotWind sites selected. Previously, the absolute percentage difference in cost between direct-drive and medium-speed turbines was estimated to be 29.79 %. Sensitivity analyses explore the influence of three factors – failure rates, accessibility limits, and major replacement times – on total operational costs. These analyses demonstrate that medium-speed configurations exhibit more significant cost fluctuations, and the cost gap between configurations is reduced if failure rates are lowered at the same rate for each configuration, accessibility increases, or the major replacement time is reduced for the larger wind turbine components.
- Article
(2038 KB) - Full-text XML
- BibTeX
- EndNote


With a strive to become net zero by 2050, the UK is continuing to invest more into the renewable energy industry (UK Government, 2022). Offshore wind is one of the predominant renewable energy resources that the UK has available, in particular in Scotland, with 10-year agreements in place to build 20 new offshore fixed and floating sites (Crown Estate Scotland, 2023b). To ensure the growth of the offshore wind market, further reduction in the cost of energy for wind energy is required in order to compete with other energy sources. Recent trends in offshore wind include projects that have larger wind farm sites, containing more wind turbines, which have increased rated nominal power (>5 MW) (Díaz and Guedes Soares, 2020). These sites are now also being located further from the shore than pre-existing fixed-bottom wind farms. These trends align with the Climate Change Committee (CCC) net zero report, which calls for 75 GW to be installed offshore in the UK, which is around 7500 more turbines, rated at 10 MW, in order for net zero targets to be met (Committee for Climate Change, 2021). Due to the lack of available operational data for these sites, there remains large uncertainty around their operation and maintenance (O&M) costs. In particular, there is a gap in knowledge surrounding generator and drivetrain technology in terms of reliability, diagnostics, and prognostics. Previous research with old reliability datasets has provided insights into the operation and maintenance costs for smaller-rated turbines with different drivetrain configurations; see Sect. 1.1. Collating and utilising newer failure data for the prominent drivetrain configurations used in larger-rated turbines will provide an understanding of the possible operation and maintenance costs for future wind farms that are currently being developed. Modelling operations and maintenance for new wind farm sites allows for comparisons to be made between drivetrain configurations in terms of availability, power production, and total maintenance costs. Reducing unplanned downtime for turbines has the potential to reduce the cost of generating offshore electricity by roughly 10 % (Carroll et al., 2017).
This study provides novelty to the field, as it reviews the literature for larger-turbine failure rate estimates and data, putting some of it in the public domain through journal paper publication for the first time, and uses O&M modelling to analyse the following:
-
the impact of drivetrain type on operation and maintenance cost for 15 MW rated turbines
-
the sensitivity of O&M costs using lower and upper estimates of failure rates for 15 MW medium-speed and direct-drive turbines
-
the sensitivity of O&M costs by adjusting repair times for major components of a 15 MW rated turbine for different drivetrain configurations
-
the impact that accessibility to maintenance vessels has on the O&M costs for 15 MW turbines by altering the accessibility limits for the wind farm.
The rest of the paper is outlined as follows: Sect. 1.1 provides an overview of the medium-speed geared turbine and direct-drive turbine; Sect. 2 provides a literature review of new reliability data for offshore wind turbines; Sect. 3 expands on the methodology used for the research; Sect. 4 contains the results of the baseline O&M scenario and several sensitivity analyses; Sect. 5 discusses the results, main assumptions, and limitations of the work; and Sect. 6 includes a conclusion and suggestion for further work.
1.1 Comparison of geared and direct-drive O&M costs
Carroll et al. (2017) provide a comparison of O&M costs for offshore wind turbines with different drivetrain configurations. The chosen configurations represented the most popular offshore wind turbines at the time of writing and varied from geared to direct-drive configurations with different types of generators and converters. A geared turbine uses a gearbox, typically two-stage or three-stage, in its drivetrain. The component sits between the turbine shaft connected to the rotor and the generator. Its role is to convert the high-torque low-speed motor of the turbine shaft to a low-torque high-speed motor for the generator. The downsides of this component are higher failure rates and low reliability, which can be detrimental in offshore wind, as component repairs require heavy-lift vessels, incurring greater operational costs. The alternative to a gearbox is a direct-drive configuration, which removes the gearbox component entirely. The downside to this configuration is the heavy and expensive generators required in the absence of a gearbox to convert high torque. To elaborate, the configurations studied in Carroll et al. (2017) are the following:
-
a three-stage gearbox with a doubly fed induction generator (DFIG) and partially rated converter
-
a three-stage gearbox with a permanent magnet synchronous generator (PMSG) and fully rated converter
-
a two-stage (medium-speed) gearbox with a PMSG and fully rated converter
-
a direct-drive turbine with a PMSG and fully rated converter.
The results from this study show that the direct-drive configuration has the highest availability and lowest O&M costs, followed by the medium-speed configuration, the three-stage gearbox with PMSG, and the DFIG. Lower O&M costs contribute to a lower overall levelised cost of energy (LCoE) for direct-drive and medium-speed turbines (Carroll, 2016). This conclusion is corroborated by a trend in the industry to move away from older high-speed drivetrains and towards lower-speed machines. Figure 1 includes the two drivetrain configurations from Carroll (2016) that are investigated in this study.
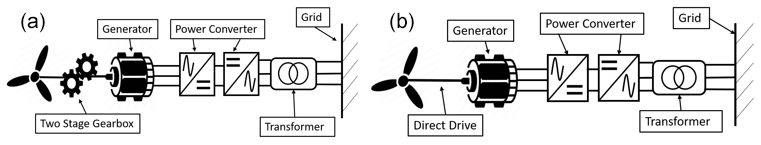
Figure 1Drivetrain configurations for two offshore turbines. The left configuration shows a two-stage permanent magnet generator with a fully rated converter. The right configuration is the direct-drive turbine with a permanent magnet generator and fully rated converter.
Figure 2, taken from the Global Wind Energy Council (GWEC) 2022 Global Offshore Wind Report, shows the market share of the different drivetrain concepts in 2016 and 2021 in both Europe and China. Europe has gone from an approximately equal split of conventional squirrel cage induction generators (SCIGs) and direct-drive PMSGs to an approximately equal split of medium-speed PMSGs and direct-drive PMSGs. China's proportion of low- and medium-speed machines has also increased; however, approximately a third of the market remains high speed.
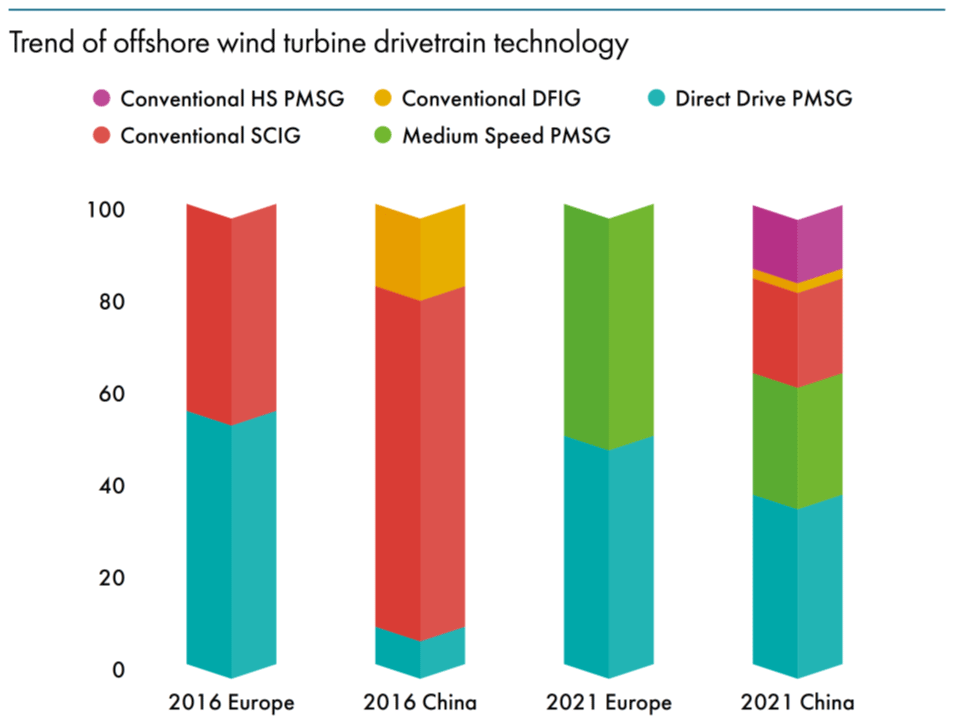
Figure 2Offshore wind market share in Europe and China according to GWEC's 2022 Global Offshore Wind Report (Global Wind Energy Council, 2022).
From these figures, it seems the pertinent question in the industry has shifted from “What is the best among high-speed, medium-speed, and low-speed drivetrains?” to “What is the best among medium-speed and low-speed drivetrains?” A study by van de Kaa et al. (2020) presents a methodology to determine which of the two configurations has the highest chance of achieving success. They conclude that, as of 2020, both drivetrain types still have the potential to become dominant. They also conclude that the cost of energy and reliability are the most important determinants for success from a list also containing brand reputation and credibility, total energy yield, pricing strategy, pre-emption of scarce assets, commitment, and suppliers.
Coinciding with this shift in the market towards direct-drive turbines is a shift towards higher power ratings (Jenkins et al., 2022a). This is a theme investigated by Turnbull et al. (2022). They pose the following question: how much insight can be drawn from data gathered on older technology and applied to modern direct-drive machines? To answer this question, they present a meta-analysis of the available literature. Their results show that “even for components that are assumed to be similar between turbine configurations, there are quite large differences in stop rate and downtimes”.
Jenkins et al. (2022b) provide an estimate for availability and O&M costs from component replacements for the two configurations presented in Fig. 1 for next-generation (15 MW) turbines. Their replacement rates were based on structured expert elicitation, which is detailed further in Jenkins et al. (2022a). In contrast to the results of Carroll et al. (2017), their results showed that medium-speed turbines had lower O&M costs for major replacements than direct-drive machines. They attributed the disparity to lower component costs of the medium-speed generator and gearbox compared to the expensive direct-drive generator.
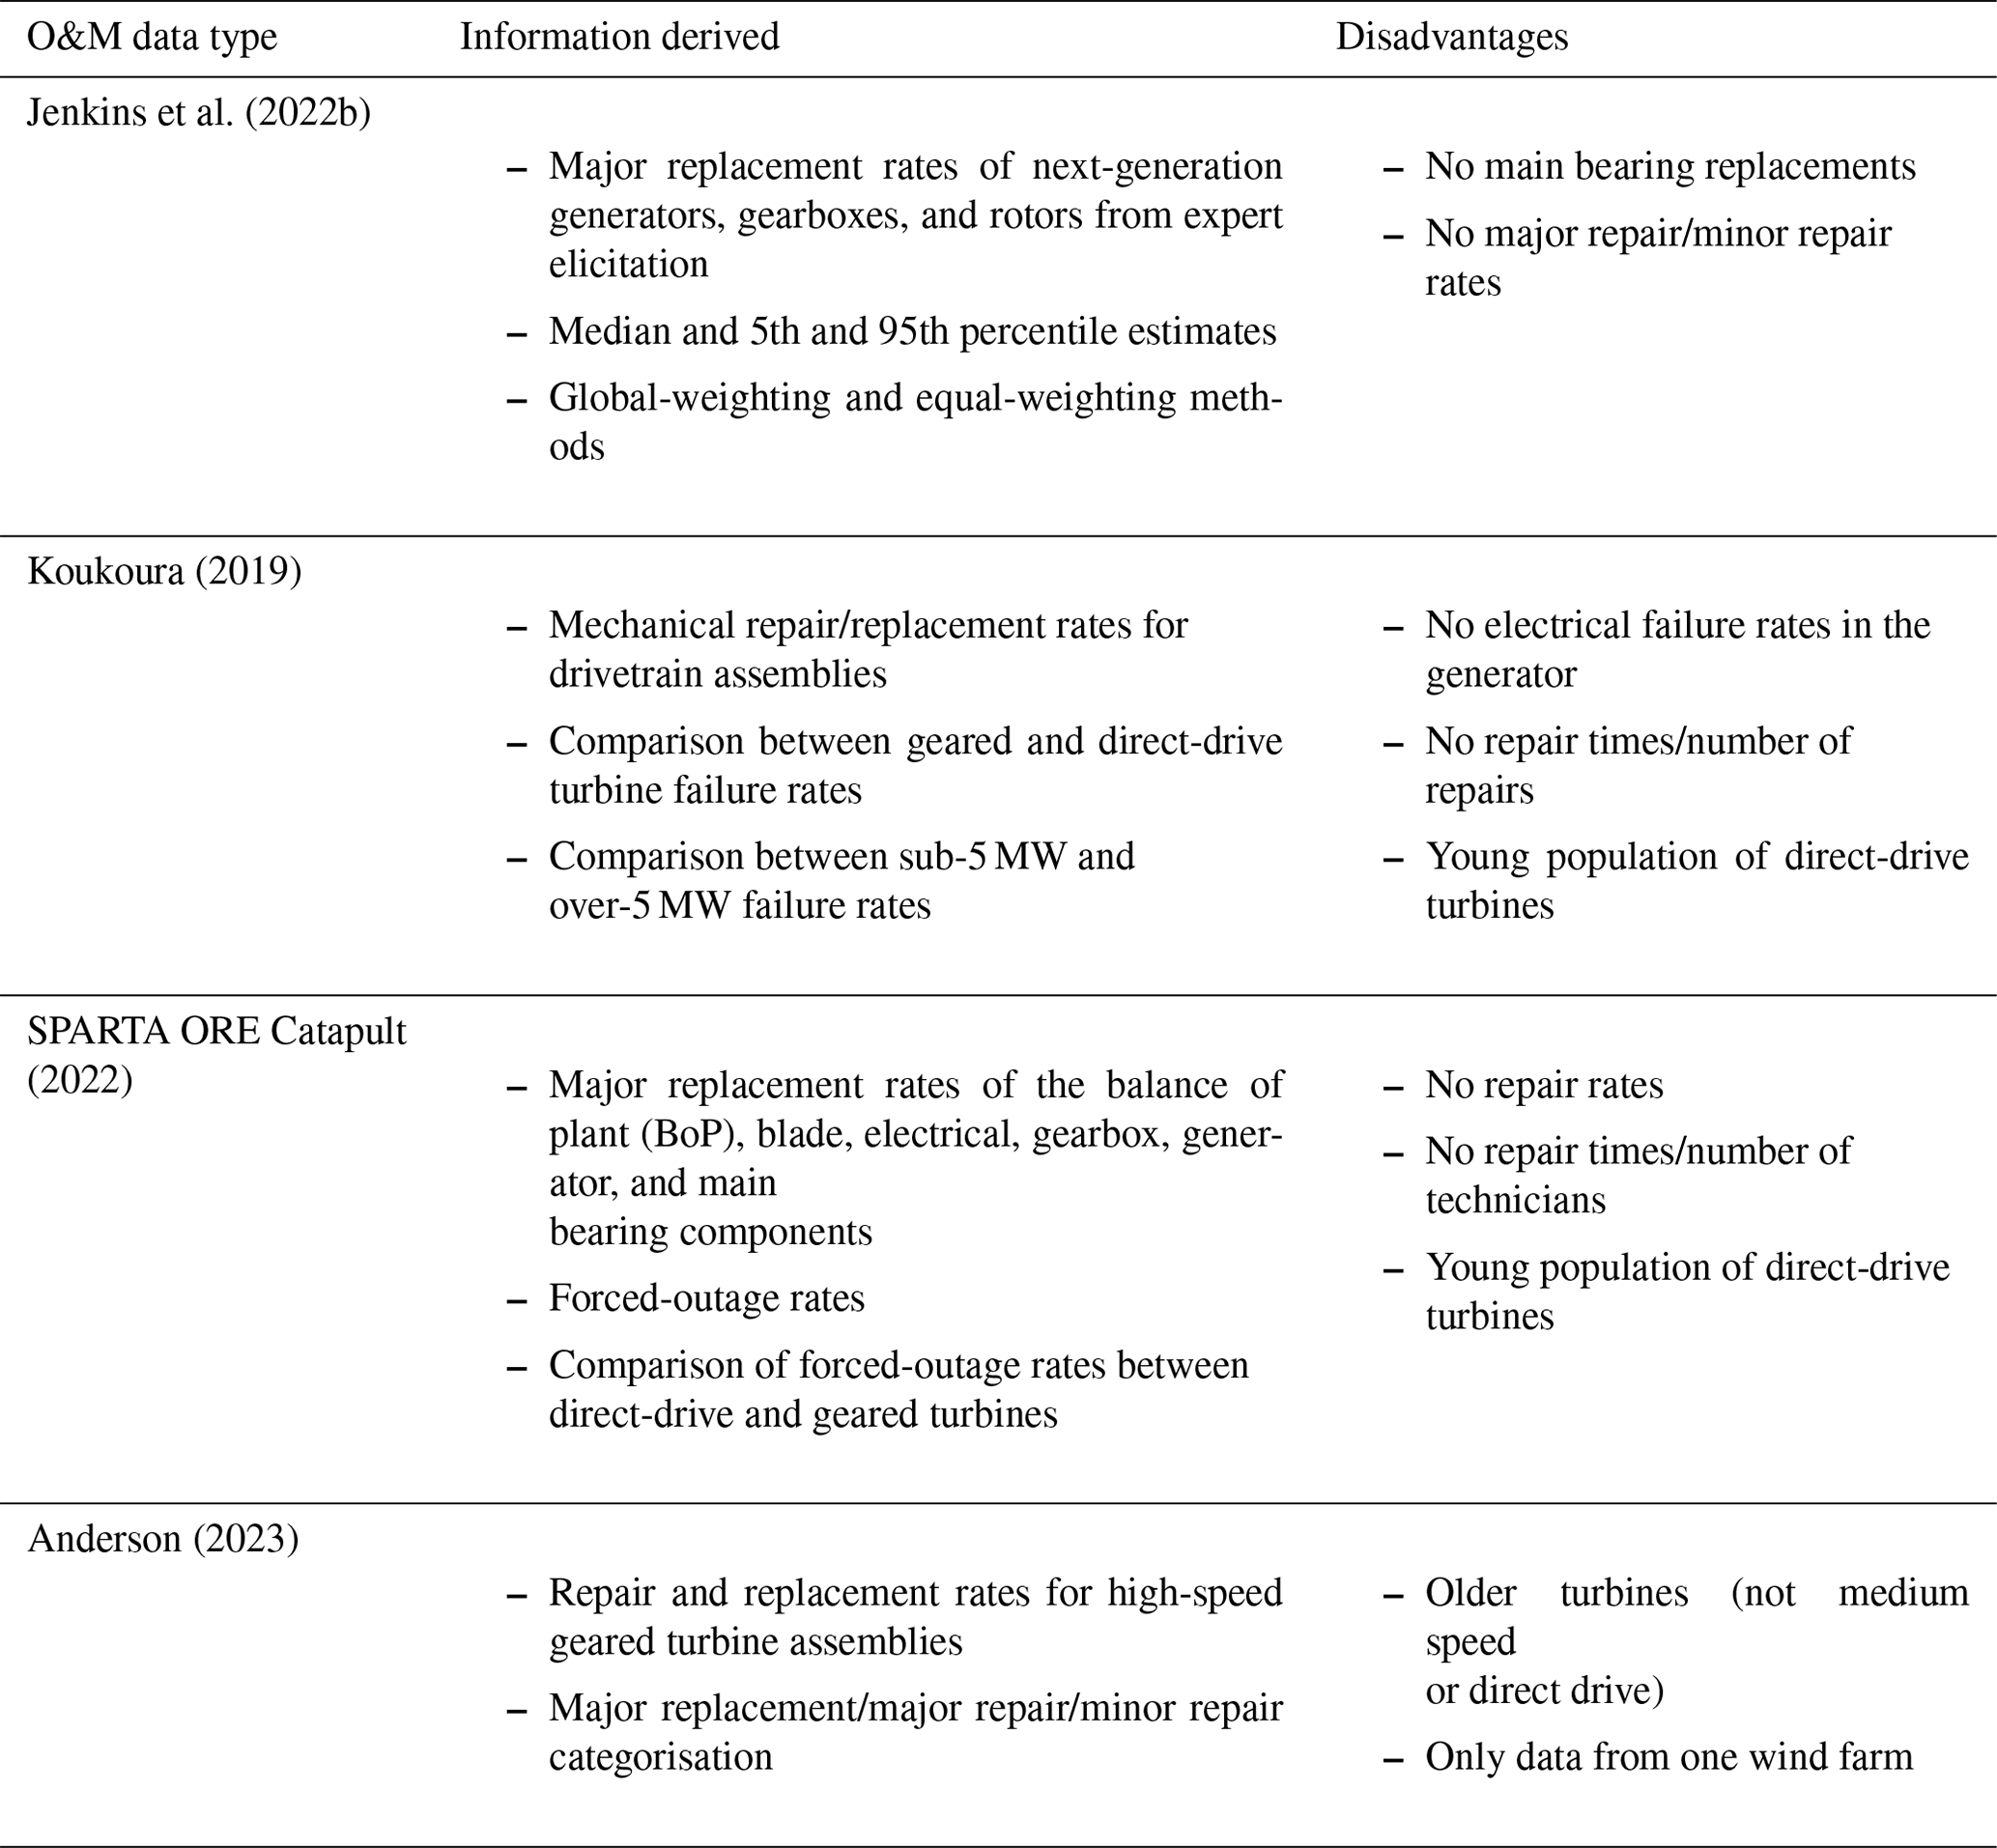
The uncertainty in the estimates of Carroll et al. (2017) may be reduced by updated reliability data for offshore wind turbines in the public domain. The dataset presented by Carroll et al. (2016) and used in the original comparison of drivetrain configurations remains the most comprehensive source of reliability figures for offshore wind turbines. Failure rates estimated in the study are summarised in Fig. 3. The analysis also catalogues repair times, repair costs, and the number of technicians per repair for the same categories. However, the analysis by Carroll et al. (2017) has two disadvantages: (i) the failure data of Carroll et al. (2016) are becoming out of date with respect to the latest wind turbines, and (ii) the availability and O&M rate estimates utilise some transformed data from onshore turbines. Applying updated failure rates may reduce the uncertainty in the failure rate figures of the previous drivetrain comparison. The following subsections elaborate on the sources for these updated failure rates.
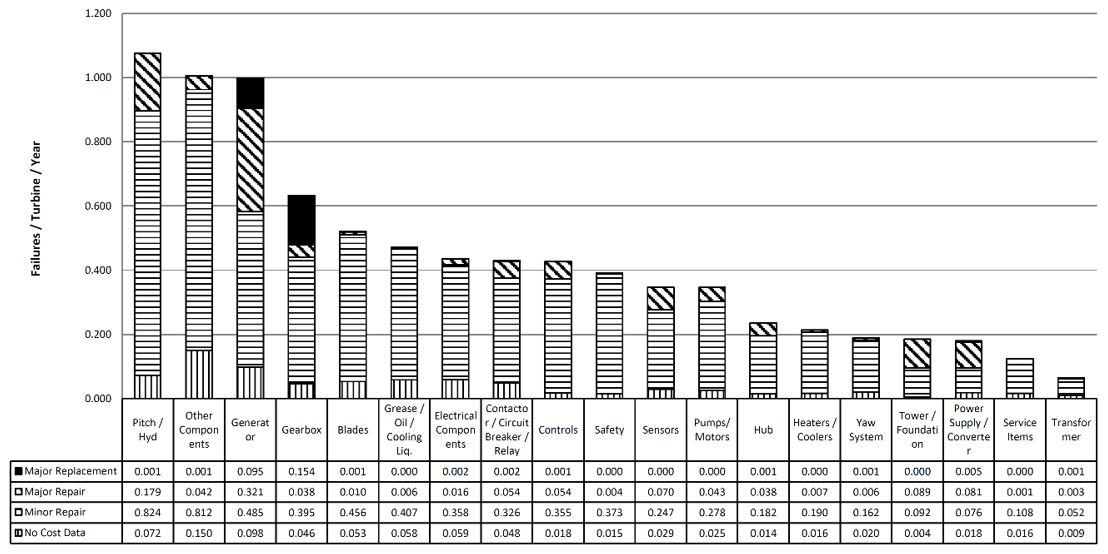
Figure 3Failure rates for components by Carroll et al. (2016).
2.1 Jenkins
Jenkins et al. (2022a) estimate replacement rates for major components of next-generation turbines using the classical method of structured expert elicitation. Namely, they estimate replacement rates for the gearbox, generator, and rotor for 15 MW medium-speed and direct-drive turbines. Both fixed-bottom and floating turbine concepts are considered. While the cited conference paper provides combined replacement rates for these components (Jenkins et al., 2022a), the breakdown of replacement rates by component is presented in the PhD thesis of Jenkins (2022). The results of that analysis are shown in Fig. 4.
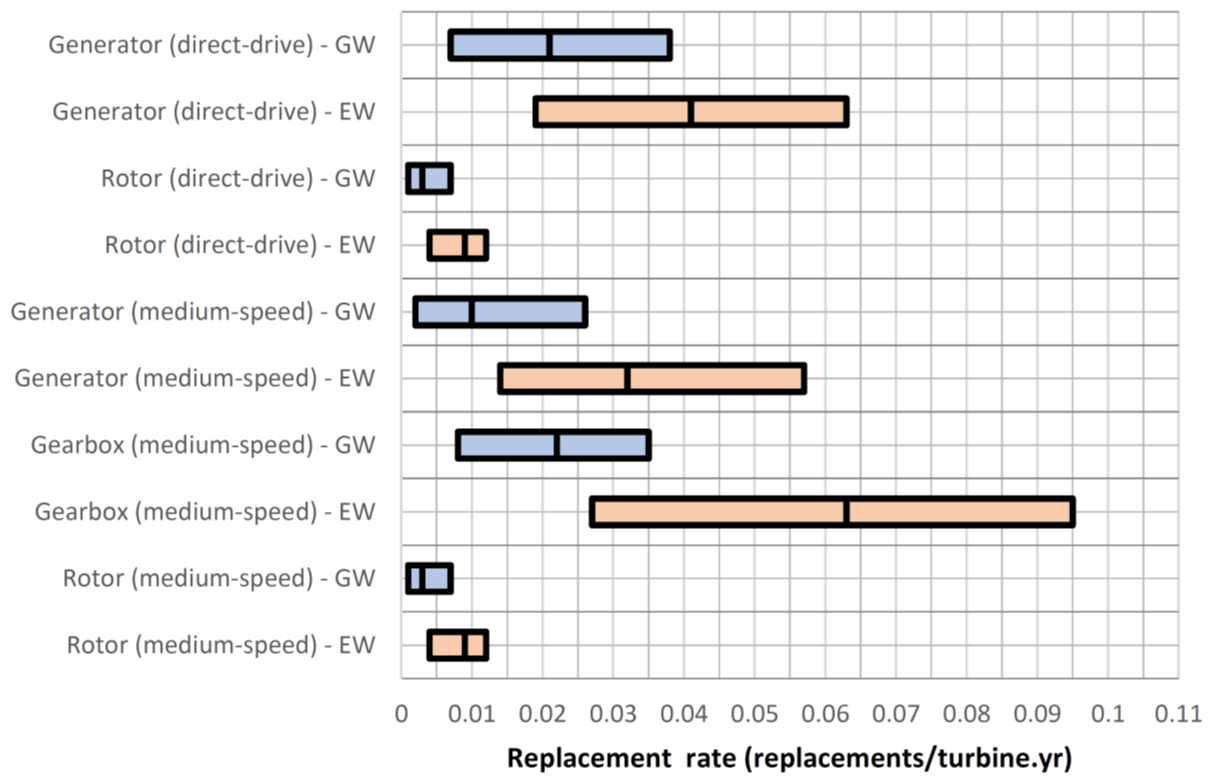
Two sets of replacement estimates are provided by Jenkins (2022). These were obtained using different methods of structural expert elicitation, which is described in more detail in Jenkins (2022). The methodology has the benefit of uncertainty quantification, meaning that estimates for the 5th and 95th percentiles are available for each replacement rate estimate and the median. Key takeaway points from the results of Jenkins (2022) are as follows:
-
Comparing the estimated failure rates for next-generation turbines shown in Fig. 4 to first-generation turbines shown in Fig. 3, there is a decrease in generator and gearbox major replacements and increase in rotor major replacements. The overall view of the experts used in that study is therefore of a shifting risk profile. Major drivetrain components have been identified as a problem point for first-generation turbines, and consequently there has been an effort to increase their reliability.
-
Collectively, medium-speed drivetrain components still have higher replacement rates than direct-drive turbines.
2.2 Koukoura
Koukoura (2019) also includes drivetrain failure rate data in their thesis. These are derived from field data. The field data are a population of 1200 offshore wind turbines from over 20 wind farms with a power rating between 2–10 MW. They contain a mixture of drivetrain configurations containing high-speed gearboxes, medium-speed gearboxes, and direct-drive machines. Koukoura (2019) presents the following two sets of partitioned data that might be of use in the following analysis:
-
They compare failure rates for direct-drive and geared turbines – Fig. 5.
-
They compare lower power ratings (<5 MW) to higher power ratings (>5 MW) – Fig. 6.
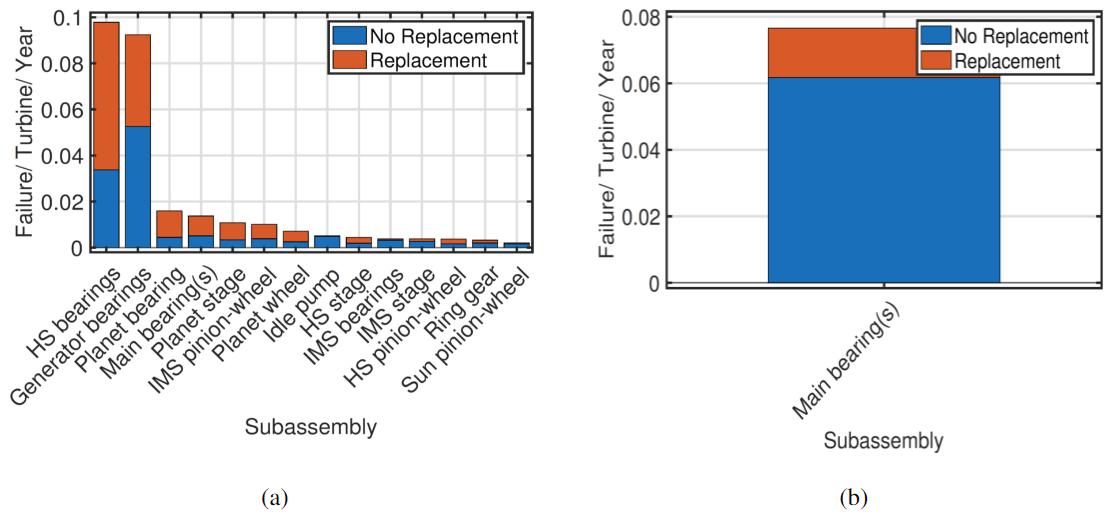
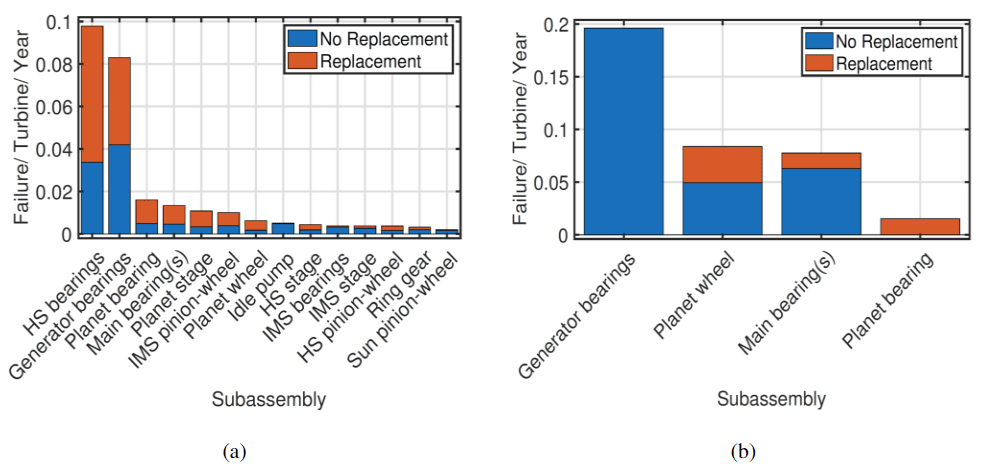
The first point could ostensibly provide failure rate data which could be used directly for an O&M cost comparison. However, the population of geared turbines in that comparison contains a mix of high-speed and medium-speed gearboxes. The second point goes some way towards breaking this down; newer, higher-capacity turbines are more likely to be medium speed than high speed. Figure 6b also suggests a medium-speed population of turbines since many of the failure categories associated with a high-speed gearbox have been removed.
There are some features of Koukoura's failure rate figures that should be kept in mind if they are to be incorporated into the following analysis. First, the failures are mechanical only. For the generator, this effectively restricts the failure modes to the generator bearings. They do not capture failures in the generator fan, cooling system, stator/rotor, or grease pipes. The gearbox and rotor are mechanical components, so most of the failure modes are captured for those components. Still, issues with the oil/lubrication system for those components are not captured. Second, the reliability statistics in Figs. 5 and 6 are sub-assembly repairs/replacements. Only replacement rates for the gearbox are detailed in the thesis. These are shown in Fig. 7.
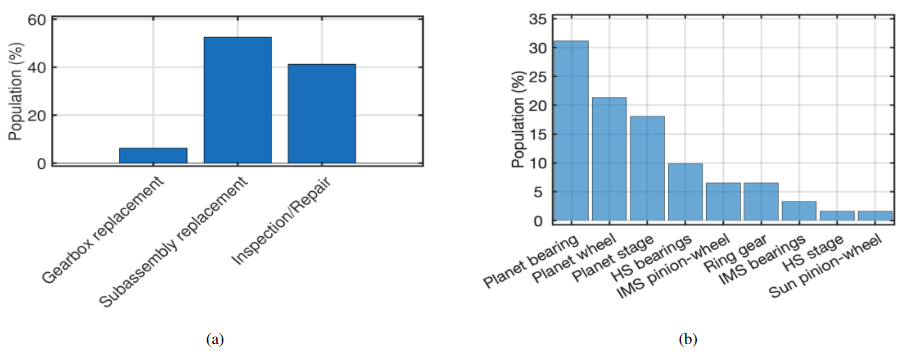
Thirdly, both repair and replacement rates are presented for sub-assemblies. From a cost modelling perspective, this only provides one set of necessary inputs. Using these figures on their own would induce an uncertainty in the repair/replacement times and number of technicians needed for repair. Lastly, replacement and repair rates are presented for the main bearing. The main bearing is another key O&M cost driver in the drivetrain that was not considered to be a separate component by either Carroll et al. (2017) or Jenkins et al. (2022a).
2.3 SPARTA
The System Performance, Availability and Reliability Trend Analysis (SPARTA) campaign is a benchmarking initiative for offshore wind farms in the UK. The 2020/2021 SPARTA portfolio review by ORE Catapult (2022) contains major-component failure rates and forced outages per turbine. Their estimates for major-component replacement rates are shown in Fig. 8.
Figure 8Major-component replacement rates from the 2020/2021 SPARTA portfolio review (ORE Catapult, 2022).
Again, these figures come with some caveats. Firstly, they represent a mixed population of first-generation and current-generation turbines which would contain high-speed, medium-speed, and direct-drive machines. It would also presumably contain a mix of predominantly first-generation DFIGs and current-generation PMSGs. Secondly, SPARTA reports component repairs as forced outages. How forced outages relate to repairs or failures in their definition is not clearly defined. As part of that portfolio review they also compare the forced outages of direct-drive turbines with geared turbines (grouped by capacity <3.6 MW and ≥3.6 MW). Figure 9 shows their results. Here we can see that turbines in the direct-drive and ≥3.6 MW categories show higher forced-outage rates than in the <3.6 MW category. However, SPARTA notes that “Since these turbines are still young, these failure rates can be expected to decrease in general in the future” and that “more data is required to create strong insights about the differences between direct drive turbines and turbines with gearboxes.”
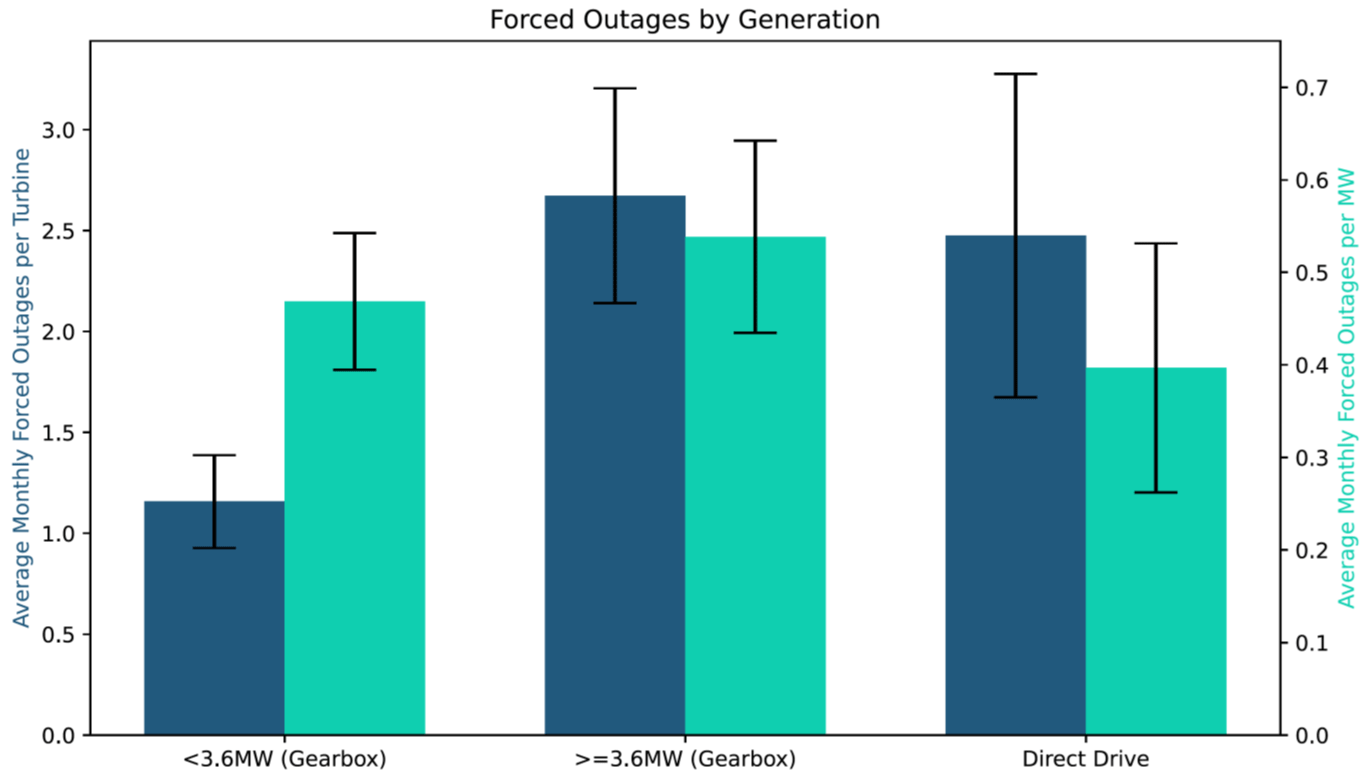
Figure 9Comparison of different wind turbine concepts from the 2020/2021 SPARTA portfolio review (ORE Catapult, 2022).
2.4 Anderson
Anderson (2023) presents reliability data for an offshore wind farm in the UK. The analysed database consists of approximately 800 turbine hours of data. Reliability information is presented in terms of interventions per year in the case of non-corrective works and failures per turbine per year in the case of corrective works. The study also presents mean downtime per maintenance action. Similar to the datasets of Jenkins, Koukoura, and SPARTA, the dataset has some limitations. Firstly, the dataset is only representative of one turbine model at one location and so is much less representative of a generic wind turbine than the other reliability figures. Second, the turbine model that is represented is a high-speed geared machine, so the figures are not directly applicable to the research question of this study. Third, Anderson highlights in their thesis that there are uncertainties in the failure rate figures due to (i) the possibility of different failure definitions and (ii) the possibility of misinterpretation of work orders and alarm codes from the researcher.
2.5 Summary
This section presents a review of the literature surrounding drivetrain reliability for wind turbines after the publication by Carroll et al. (2016), which was not included by Turnbull et al. (2022). These are summarised in Table 1. With the aim to complete a cost modelling comparison between direct-drive and medium-speed machines, the key components are (ostensibly) the generator, gearbox, and main bearing. The level of detail for future-generation turbines to be noted for each of these components is summarised below.
-
Gearbox. Jenkins (2022) provides estimates for replacement rates of next-generation gearboxes. These estimates present a significant increase in reliability compared to the work of Carroll et al. (2016). Referring to Fig. 9, the annual major replacement rate for gearboxes, as estimated by SPARTA, is approximately 0.015. This is within the uncertainty range presented by Jenkins (2022) and reinforces the trend of improving reliability for wind turbine gearboxes. Improved repair rate estimates for gearboxes might be assumed from Koukoura (2019). “Improved” is used here to simply say that the failure data are less out of date than those used by Carroll et al. (2017). However, the population of turbines making up those figures is young. Therefore, the failure rates presented might be obfuscated by failures that occur later in the component lifetime or by more frequent early failures.
-
Generator. Again, Jenkins (2022) provides estimates for replacement rates of next-generation generators, for both direct-drive (DD) and medium-speed (MS) geared turbines. Similar to the gearbox, there is a reliability improvement over the first generation of wind turbines represented by Fig. 3. SPARTA's figure of approximately 0.005 is within the uncertainty limits for medium-speed machines but outwith that of direct-drive machines. Mechanical repair rates for geared turbines can be updated by the figures of Koukoura (2019) for >5 MW machines. Similar to the above, the failure rates represent a young population of turbines.
-
Main bearing. Neither Carroll et al. (2016) nor Jenkins et al. (2022b) present failure figures for main bearings. As summarised by Hart et al. (2020), main bearings are often neglected in reliability analyses, such as those presented by Carroll et al. (2016), Hahn et al. (2007), Spinato et al. (2009), and Wilkinson et al. (2011), either by (i) lumping the main bearing together with the gearbox or (ii) not including it at all (Koukoura, 2019). Koukoura provides figures for the main bearing of both direct-drive and geared configurations, which might be used for cost modelling purposes.
Table 1Summary of the data tables relevant to a reliability analysis.
Jenkins et al. (2022a) provide estimates for drivetrain component replacements based on a structured method for elicitation which incorporates uncertainty quantification. Since replacements are a driver of costs, their study provides a solid base upon which to build the analysis. Koukoura (2019) data are useful for building on that base to provide updated reliability estimates for the drivetrain for offshore turbines which are less out of date than those used previously by Carroll et al. (2016). However, those figures will likely still not accurately represent the failure rates of a 15 MW wind turbine. Since they are only mechanical failures, they will also need to be fleshed out by minor failure rates from Anderson (2023) – the dataset which is least representative of a future 15 MW machine but nevertheless still a new source of failure data.
3.1 O&M model
This study relies on the StrathOW-OM model for the O&M modelling. The model was developed at the University of Strathclyde by Dinwoodie and McMillan (2014). It has subsequently been validated against three other cost modelling tools (Dinwoodie et al., 2015). Since then, it has been further developed and frequently utilised by other Strathclyde researchers (Dalgic et al., 2015a; Carroll et al., 2017; Flannigan et al., 2022). See Dinwoodie (2014) for a detailed description of the model. StrathOW-OM models a series of work shifts simulated in the time domain. Three simulated time series feed into the central simulation: one describing significant wave height and wind speed, one the ideal power production for the farm, and the other the probability of a subsystem failure in each time step. These are all derived from user inputs describing the met-ocean climate, power curve, and turbine reliability estimates respectively. The weather conditions are generated using the historical climate dataset provided by the user. A non-homogeneous poisson process (NHPP) is used to model reliability through time. For each time step, the conditional reliability of a subsystem is compared to a randomly generated number to determine if that subsystem has failed. When a failure occurs, repairs are carried out depending on availability of required resources (in terms of vessels, staff, and materials) and climate restraints on vessel operational usage (significant wave height and wind speed limits). Again, the resource and operational limits are user-defined. Once the shift is simulated, the model records the condition of the wind farm in terms of turbines available and resources utilised. The process is repeated for the specified lifetime of the farm, and the lifetime power production and availability are calculated and stored. This is repeated until there is convergence of availability estimates on cross-simulation values. Cross-simulation calculations are passed to model outputs for post-processing. Outputs consist of a list of key performance indicators (availability, power production, and number of failures), cost estimates (revenue, lost production costs, vessel and staff costs, and costs of spare parts), and vessel-specific information (crew transfer vessel (CTV) utilisation and number of jack-up vessel (JUV) charters).
3.2 Reliability model inputs
3.2.1 Failure rates
Failure rates for every component bar the drivetrain are assumed to be equivalent for geared and direct-drive turbine concepts. These are taken from Carroll et al. (2016), excluding the rotor major replacement rate, which is taken from Jenkins et al. (2022b). Assumed failure rates for the gearbox, generator, and main bearing are summarised in Table 2.
Table 2Summary of baseline failure rate inputs.
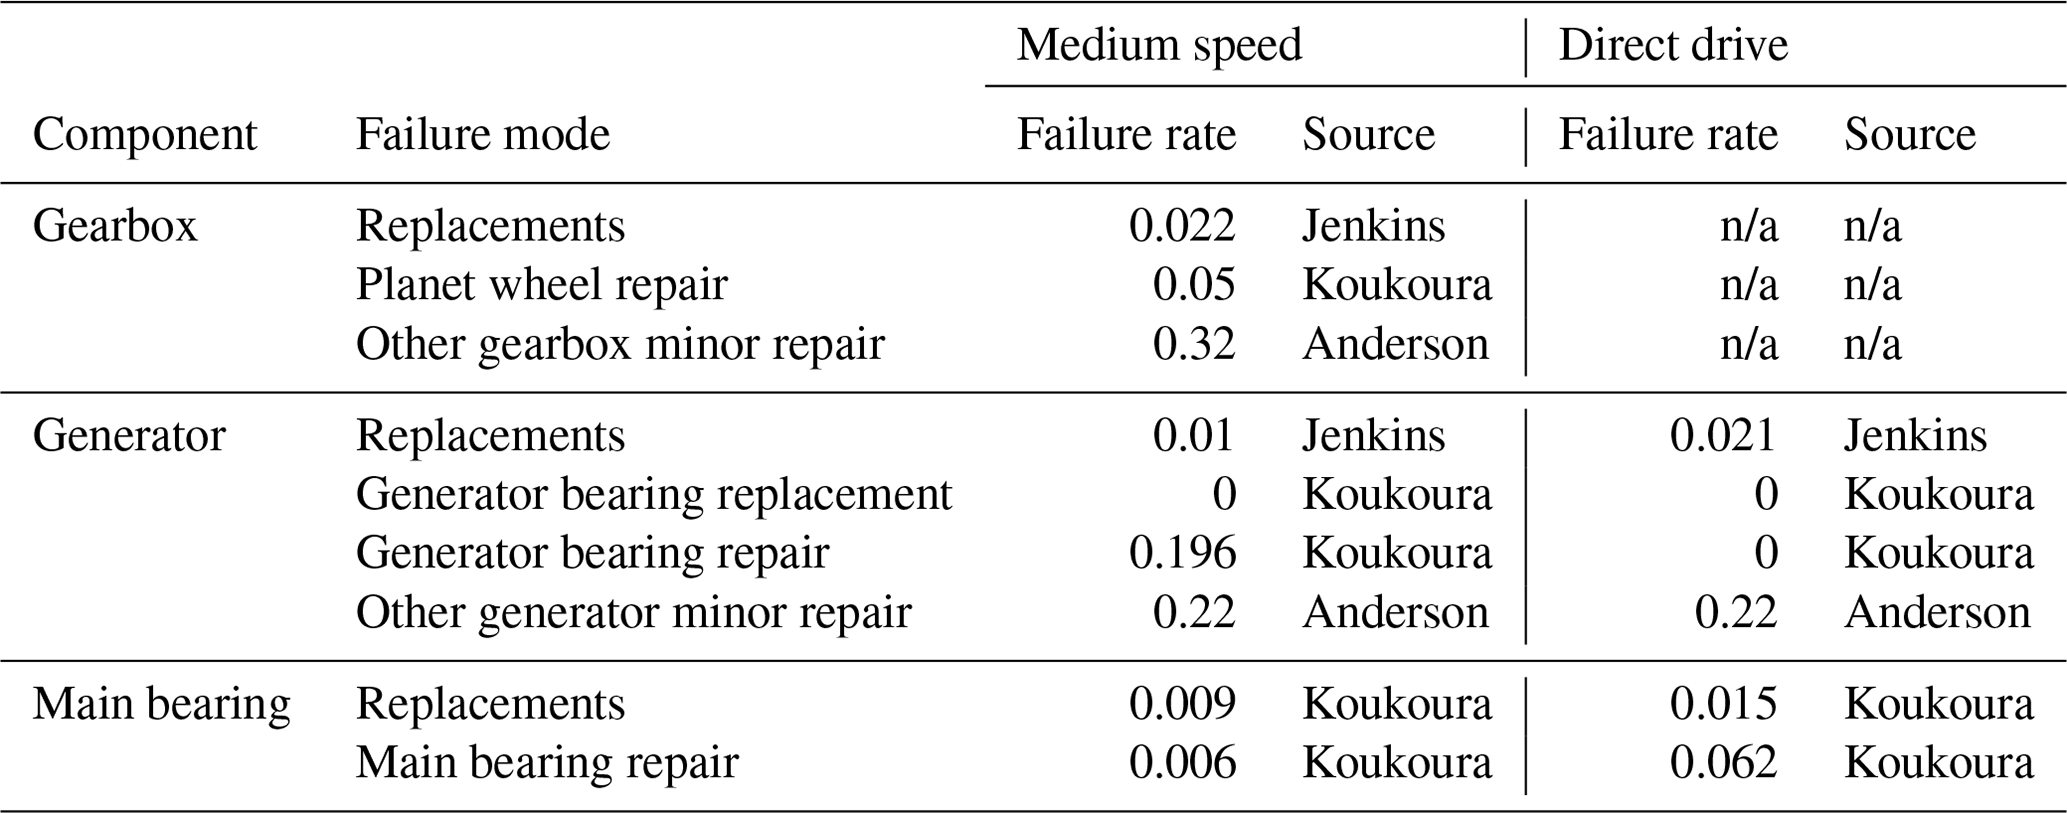
n/a: not applicable.
3.2.2 Repair times and required number of technicians
For the baseline comparison, repair times and the number of technicians are based on the work by Carroll et al. (2016). Main bearing replacements/repairs are assumed to take the same time as gearbox replacements/repairs and use the same number of technicians.
3.2.3 Repair costs
Replacement costs are based on the BVG Associates' guide to an offshore wind farm (Catapult, 2019). Since those figures are representative of 10 MW turbines, they are scaled to 15 MW turbines by power rating based on a linear cost assumption (i.e. all components are multiplied by 1.5). Repair costs are based on Carroll (2016) and calculated in a similar way to Flannigan et al. (2022). The cost ratios for minor and major repairs to major replacement costs are calculated. Those ratios are multiplied by the cost of a new component to estimate the repair cost.
3.3 Wind farm, power curve, and weather specification
Similarly to Jenkins et al. (2022a), a 1.5 GW wind farm with 100 × 15 MW wind turbines is used. The farms are assumed to have a 25-year operational lifetime. Three of the locations designated as suitable for fixed-bottom sites in the ScotWind offshore wind leasing process were used as case studies (, 2023a), namely the Bowdun, Caledonia, and Machair sites depicted in Fig. 10. ERA5 reanalysis data for each site were downloaded from the online ESOX tool developed by Lautec Eso (2023). This consists of 25 years of wind speed at a height of 100 m and significant wave height values at an hourly frequency. For all case studies the power curve used is based on the IEA 15 MW reference turbine from Gaertner et al. (2020), and an electricity price of GBP 40.7 per megawatt hour was assumed based on the work by Wiser et al. (2021).
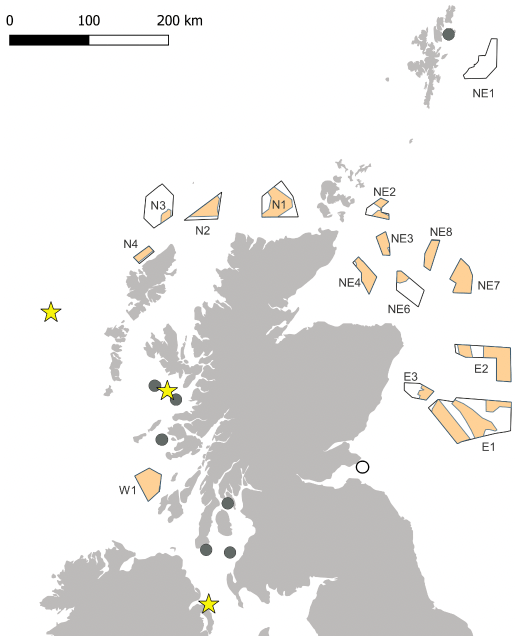
Figure 10Map of ScotWind leasing sites (Crown Estate Scotland, 2023a). The three chosen sites of Bowdun, Caledonia, and Machair are identified by the codes E3, NE4, and W1 respectively.
An important site characteristic for the wind farms in this analysis is accessibility. Accessibility is the measure of the amount of time that the climate at the site is below the accessibility limits set by the marine coordinator to allow for the transfer of technicians to turbines for maintenance to occur. The two widely used limits for vessels are wind speed and wave height. Figure 11 shows the average significant wave height for the three chosen sites. For reference, the CTV access limit is 1.5 m and 2.5 m for the service operation vessel (SOV). The Machair site has the highest average significant wave height throughout all months of the year, with Caledonia and Bowdun at a similar lower average. The higher significant wave height values will potentially reduce accessibility for Machair.
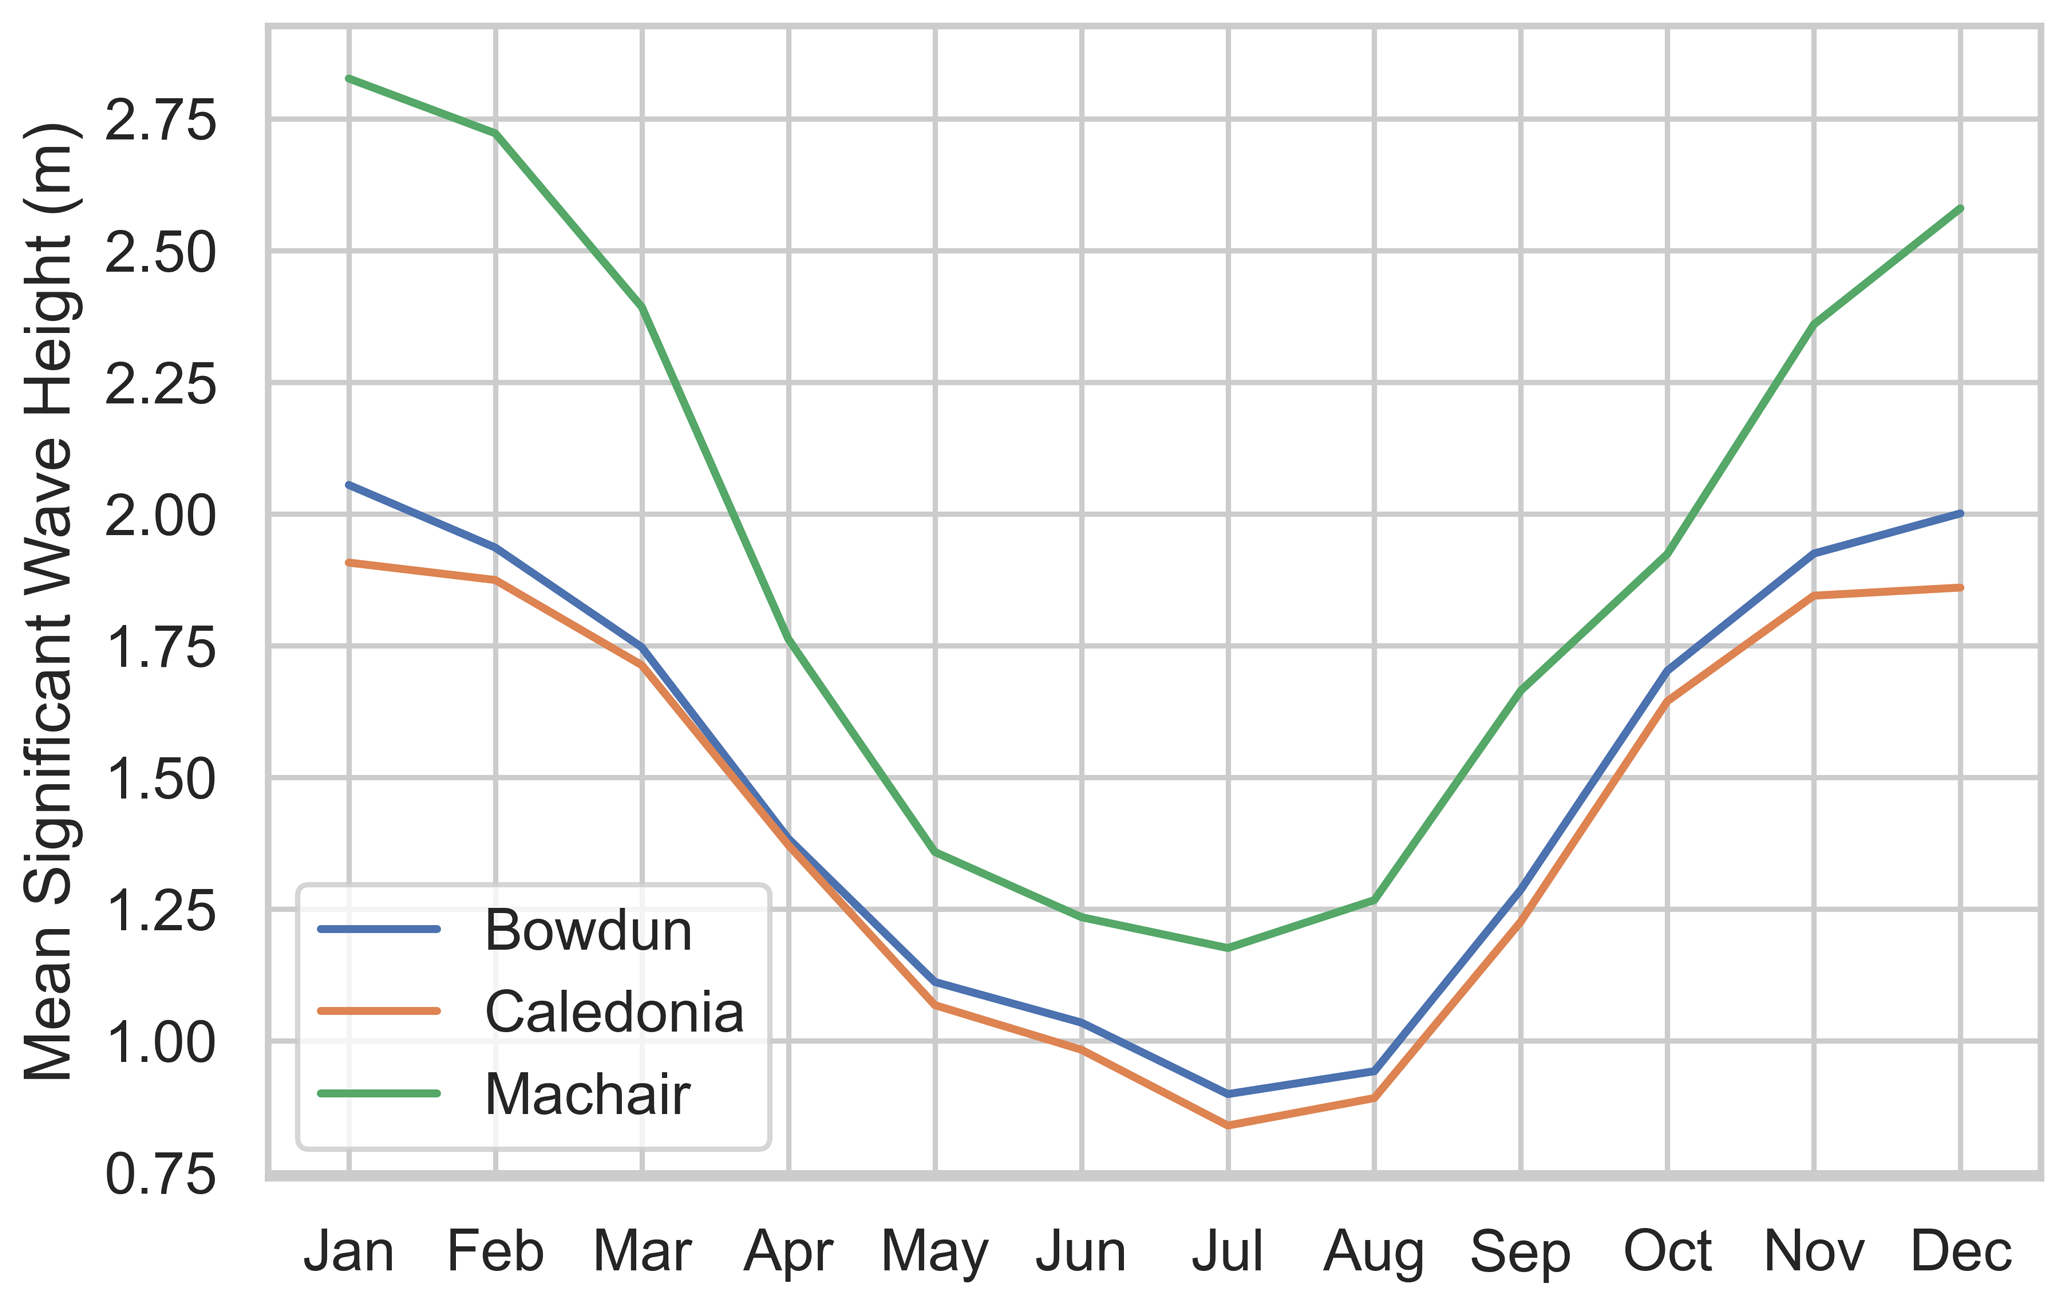
Figure 11The mean significant wave height for the three selected ScotWind sites, revealing that Machair has on average a higher significant wave height than the Bowdun and Caledonia sites.
3.4 Vessel inputs
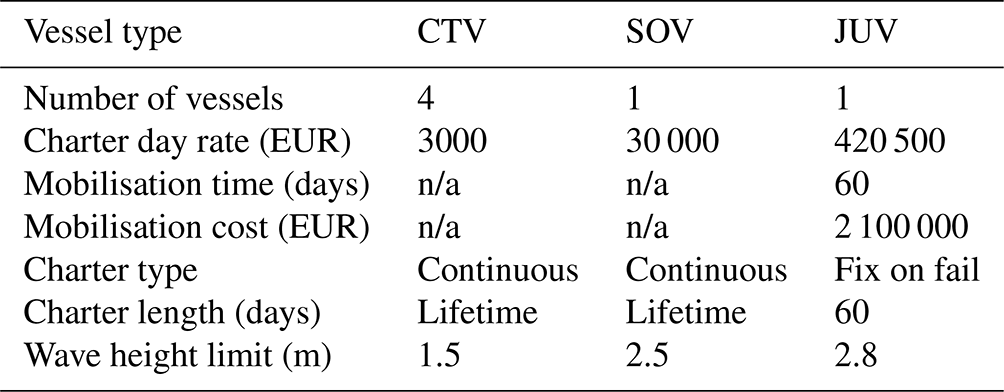
The vessel inputs are shown in Table 3. A combined SOV–CTV-based strategy is assumed at the site. This is effectively modelled as a mothership concept, as described by Dalgic et al. (2015b), where the mothership vessel is assumed to have an access mechanism for technician-to-turbine transfers. No mooring capabilities are assumed to be in use. For an overview of the input parameters for the vessels, see Table 3. Note that, for some of the costs, we have rounded the figures when converting from GBP to EUR.
Table 3Summary of vessel inputs. Wave height limits are based on work by Dalgic et al. (2015a) and McMorland et al. (2022), and charter rates come from Catapult (2019, 2020).
n/a: not applicable
The following section provides the simulation results for the baseline scenario that compares the three wind farm sites for the two drivetrain configurations. After simulating the baseline scenario, multiple sensitivity analyses are completed to determine the susceptibility of the cost outputs to several inputs.
4.1 Baseline comparison between direct drive and medium speed
The results of the baseline comparison are shown in Figs. 12 and 13. Figure 12 shows the baseline availability results. For all scenarios, the direct drive has higher availability than the medium-speed concepts. The differences in the absolute percentages of the two configurations are 0.49 %, 0.54 %, and 1.73 % for the Bowdun, Caledonia, and Machair sites respectively. The delta is notably greater for Machair, which is characterised by lower accessibility than the other two sites, as seen in Fig. 11.
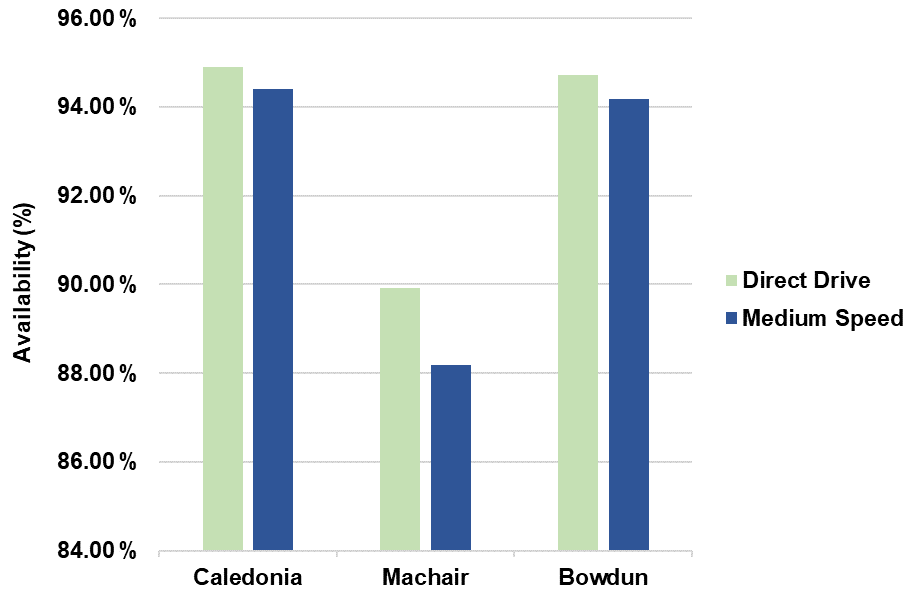
Figure 12Comparison of availability for the three chosen wind farm sites between the two drivetrain configurations.
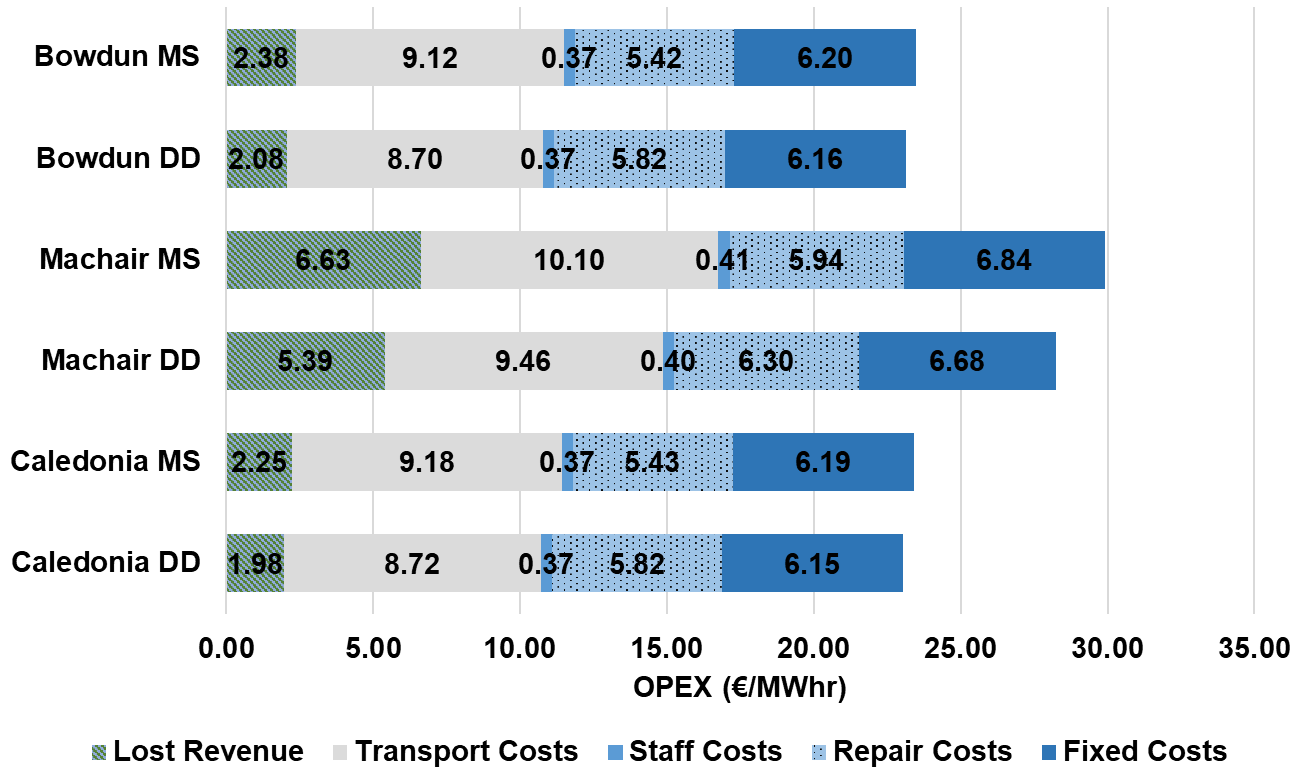
Figure 13Breakdown of OPEX costs for the three wind farm sites for the 15 MW medium-speed (MS) turbine scenario and the 15 MW direct-drive (DD) turbine scenario.
Figure 13 shows the O&M cost results, measured in euros per megawatt hour. For all scenarios, the direct-drive configuration has lower O&M costs than the medium speed. Again, the difference is greater for the less-accessible Machair site than the Bowdun and Caledonia sites. The relative percentage differences between the two configurations are around 1.59 %, 1.58 %, and 5.78 % for the Bowdun, Caledonia, and Machair sites respectively.
Important differences in the cost breakdown between the two concepts are as follows:
-
Lost revenue costs. Opportunity costs are higher for medium-speed turbines than direct-drive turbines. The medium-speed machines are still expected to have (i) higher overall failure rates and (ii) more major replacements than direct-drive turbines. The relative difference between the two configurations, in terms of the lost production cost, is higher at the less-accessible Machair site (at around 20 %) compared to the Caledonia and Bowdun sites (at around 13 % each).
-
Transport costs. Vessel costs are higher for medium-speed turbines than direct drives. Since there are more major replacements for medium-speed machines, the increased utilisation of JUVs results in higher transport costs.
-
Repair costs. Repair costs are higher for direct-drive turbines compared to medium-speed machines. This is attributable to higher assumed generator costs. According to the BVG Associates' guide to an offshore wind farm (Catapult, 2019), a direct-drive generator costs twice as much as that of a medium-speed generator. The cost of replacements and repairs is therefore assumed to be twice as much for direct-drive generators. This extra assumed cost is enough to exceed the repair costs afforded to the gearbox. This is enough of an expenditure that it outweighs the extra cost of gearbox repairs (at least under the current assumptions).
4.2 Sensitivity of assumptions
Due to the nature of the inputs used for the model and the various sources utilised to synthesise the baseline scenario, it is important to investigate how sensitive these assumptions are. There are three inputs which were identified for sensitivity analysis: replacement rate, SOV accessibility limits, and replacement times. For the replacement rates, two analyses were completed by using the 5th and 95th percentile estimates from Jenkins (2022), namely a low-replacement-rate scenario and high-replacement-rate scenario. These were input into the model for the generator, gearbox, and rotor components.
Secondly, the accessibility for the SOV was increased. The Machair site was identified as the least-accessible site, which, after analysing the baseline scenario, had a clear impact on the overall costs of the wind farm. The SOV wave height limit input was adjusted from 2.5 to 3.5 m to increase accessibility for maintenance trips.
Additionally, the repair times for the baseline scenario are based on Carroll et al. (2016), but a study by Catapult (2020) uses the assumption that major replacements take under 47 h to complete. Using this assumption, the repair times which exceeded 47 h in the baseline scenario are set to 47 h to simulate the lower replacement times. Finally, the repair costs were altered in post-processing. The repair costs were based on 10 MW turbine costs and scaled linearly 1.5 times for the 15 MW turbines. In the sensitivity analyses the minor repair costs were scaled down to the original values, as it was not known whether minor repairs would continue to increase in cost linearly with the turbine size. However, the results showed that altering the minor repair costs in this manner resulted in a less than 1 % change in total O&M costs for all sites and the two different configurations. Therefore, it has not been included in the following figures as the change in repair costs was deemed not significant compared to the other factors being studied.
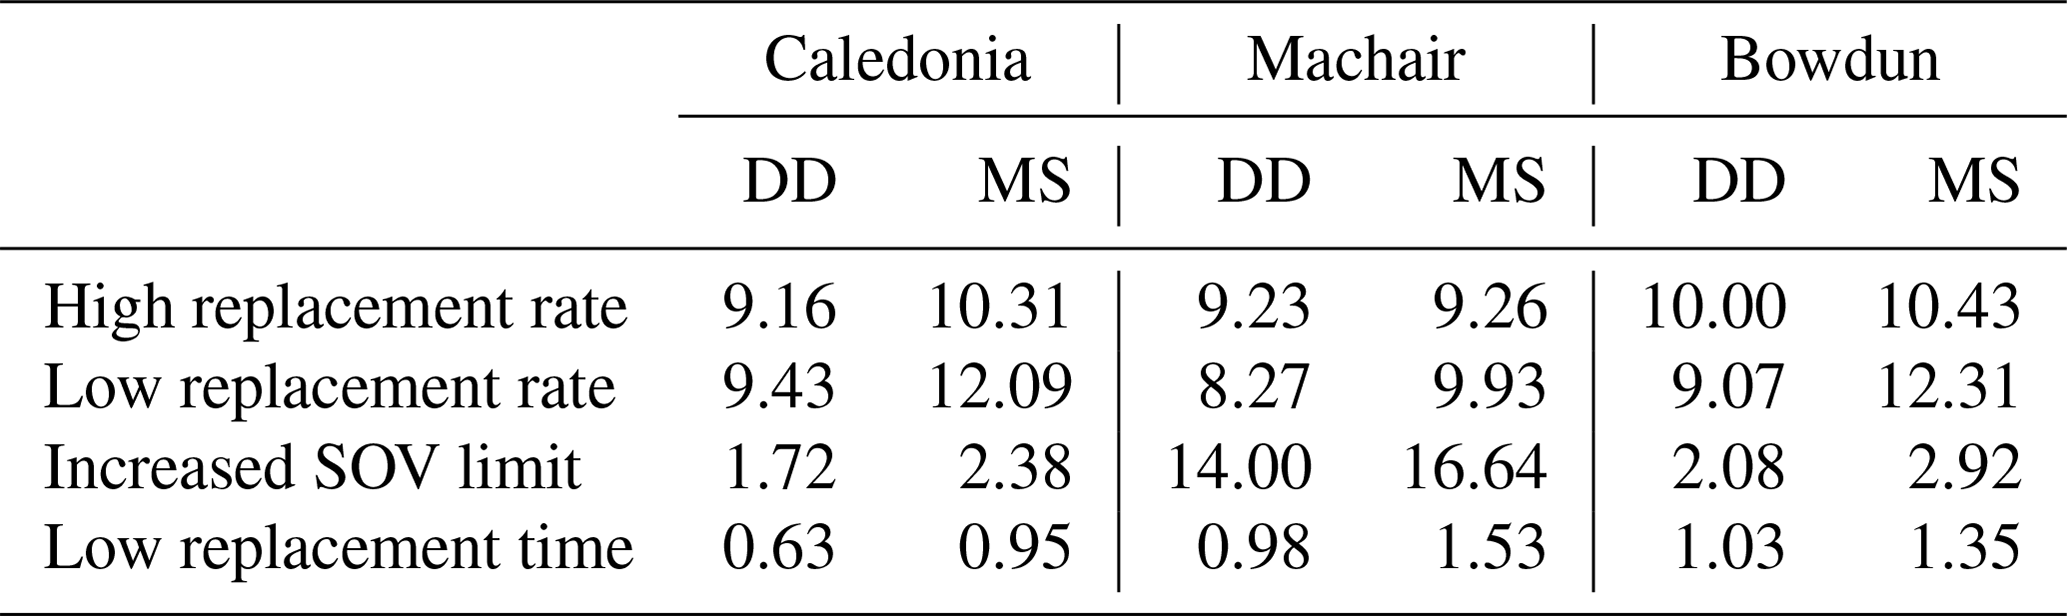
These four sensitivity analysis results are plotted in Figs. 14, 15, and 16 against the baseline scenario. The figures show the total O&M costs for each of the wind farm sites. To highlight the change in costs from the baseline scenario, Table 4 shows the percentage change for the three wind farm sites.
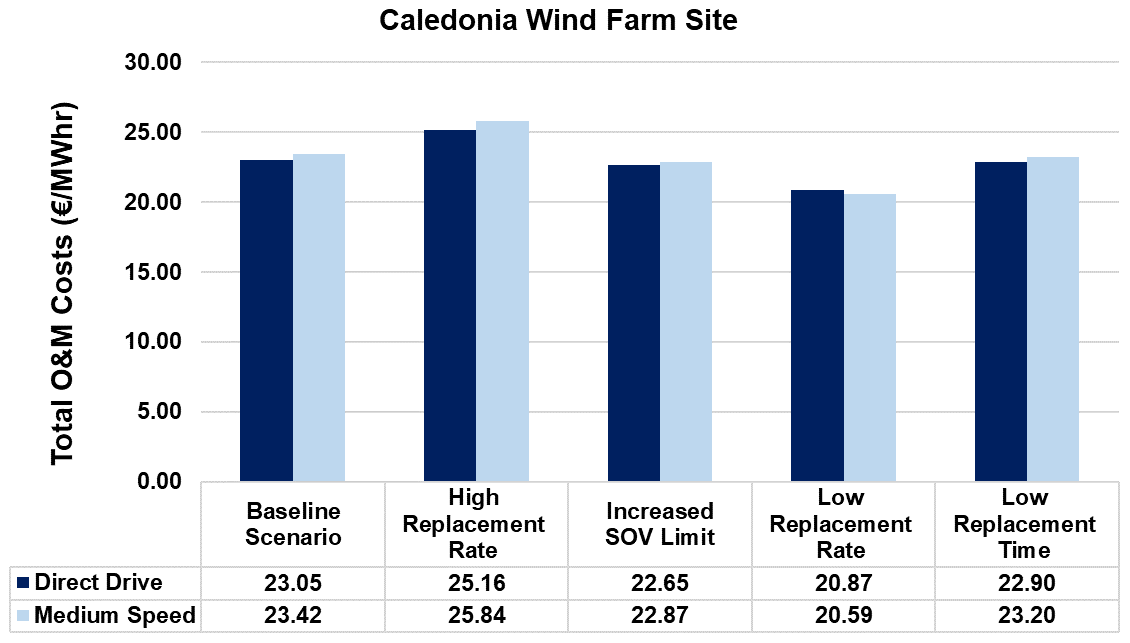
Figure 14Sensitivity analysis results for the Caledonia wind farm site. The total O&M costs of the baseline scenario are compared to the total O&M costs for each analysis.
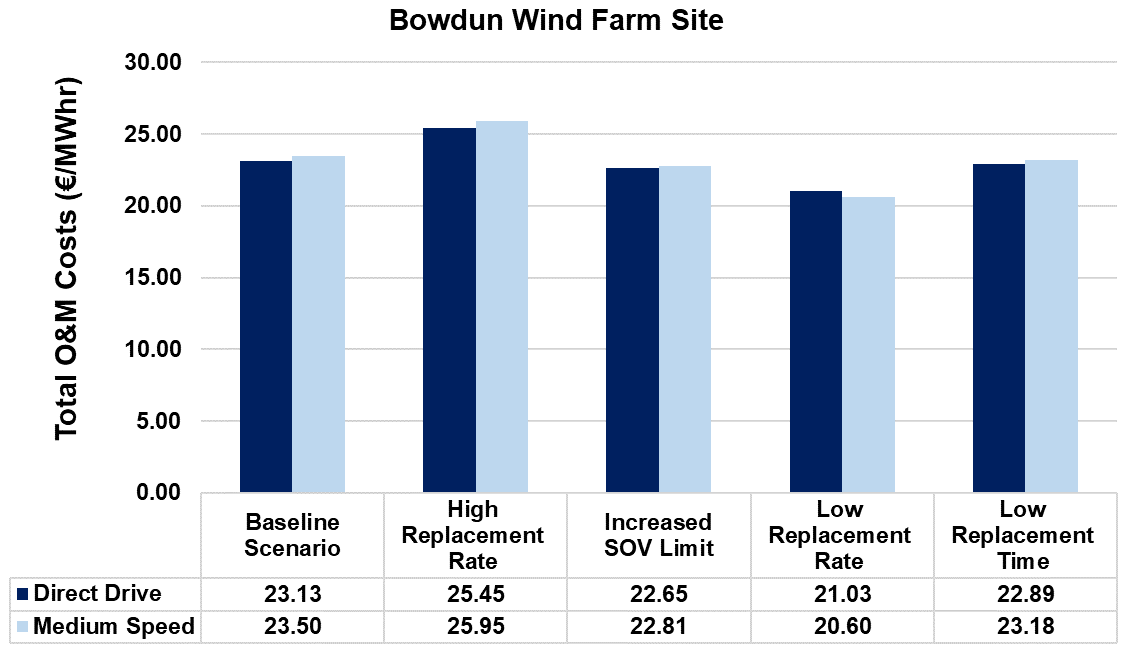
Figure 15Sensitivity analysis results for the Bowdun wind farm site. The total O&M costs of the baseline scenario are compared to the total O&M costs for each analysis.
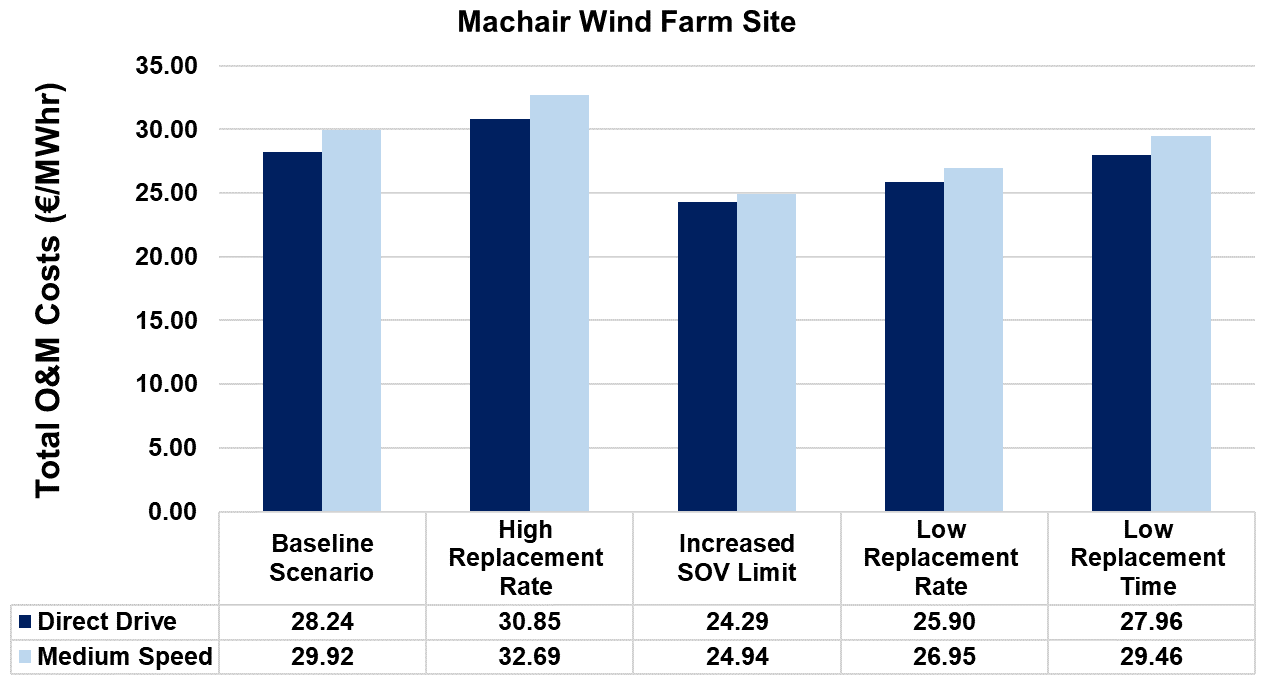
Figure 16Sensitivity analysis results for the Machair wind farm site. The total O&M costs of the baseline scenario are compared to the total O&M costs for each analysis.
One of the main takeaways from Fig. 14 is that the direct drive is the drivetrain configuration with lower costs for all cases except for the low replacement rate at the Caledonia wind farm. The same trend is seen for the Bowdun wind farm in Fig. 15, where direct drive has higher costs than medium speed for the low-replacement-rate case. Table 4 indicates that for the higher replacement rate, the cost difference between the configurations becomes wider, with medium-speed costs increasing more than the direct-drive costs. Aside from the high-replacement-rate case, all other scenarios result in a reduction in the cost gap between the medium-speed and direct-drive cases, which in two scenarios resulted in the direct drive having a higher cost than the medium speed. For the Machair site, the high replacement rate resulted in the medium speed still having higher costs than the direct drive, as seen in Fig. 16. However, in Table 4, it is clear that the percentage increase in costs compared to the baseline was 9.26 % for medium speed, only a slightly bigger increase than the 9.23 % for the direct drive.
Table 4The percentage change in total operational costs from the baseline scenario for all three wind farm sites. Note that high-replacement-rate values are a percentage increase in the operational costs, whereas low-replacement-rate, increased SOV limit, and low-replacement-time values are a percentage decrease in operational costs. DD represents the direct-drive turbine simulation, and MS represents the medium-speed turbine simulation.
4.2.1 High replacement rate
In this analysis, the failure rates were increased to the 95th percentile estimate of the baseline scenario failure rates for the major components of the drivetrain for both configurations. This resulted in higher operational costs for all sites due to the increase in repairs required. Based on Table 4, the percentage increase in costs was relatively similar in all scenarios, with a 9 %–10.5 % increase in the operational costs compared to the baseline scenario. The high replacement rates resulted in a larger percentage increase in total operational costs for the medium-speed configuration for all three sites. For the Machair site, there was a similar percentage increase for the total operational costs for both configurations; therefore there was little change to the cost gap between turbines. This could be related to the accessibility issues at the site.
4.2.2 Low replacement rate
Lowering the failure rate for the major components of each turbine to the 5th percentile estimate from the baseline scenario failure rates resulted in a decrease in operational costs for all sites. The reduction in failures leads to a reduction in downtime, which contributes to lower lost revenue, as well as lower transport costs, repair costs, and staff costs. In all cases, there was a significant percentage reduction in costs compared to the baseline case for both medium speed and direct drive, as seen in Table 4. However, the percentage reduction in costs was larger for the medium-speed turbines than the direct-drive turbines, resulting in a smaller difference in cost between the configurations compared to the difference seen in the baseline scenario. The reason behind the larger percentage reduction for medium speed is that the failure rates for medium speed that were lowered also included the gearbox component, which is a large source of failure for the turbine. Reducing the failure for this component significantly reduces the overall cost, whereas the drivetrain for the direct drive does not have a gearbox and so does not benefit.
4.2.3 Increased SOV limit
From Table 4, all scenarios had a reduction in the total operational cost compared to the baseline case when the SOV limit was increased from 2.5 to 3.5 m. Increasing the accessibility of a site will reduce the lost revenue generated due to longer downtimes, explaining the reduction in cost seen for this analysis. In particular, the Machair site saw a large percentage reduction in operational costs, which stems from the low accessibility the site had in the baseline scenario, so altering the SOV limit would benefit this site more than the other two site selections. In terms of configurations, the medium-speed configuration saw a greater reduction in the total operation costs for all three sites when compared to the direct-drive turbine case. Increasing the SOV wave height limit benefits medium-speed turbines more as these turbines have higher failure rates and an increased number of major replacements required due to the additional gearbox component. Therefore, increasing accessibility will reduce a greater amount of downtime for medium speed, which leads to the greater percentage difference in cost between the baseline scenario and the increased SOV limit scenario. In this analysis, the increased limit for SOV transfers also results in a smaller total difference in operational costs between the configurations, which narrows the gap between the two drivetrain types.
4.2.4 Low replacement time
Setting the maximum replacement time to 47 h meant a number of components had a reduced time required for replacement. As a result, the operational cost for all sites was lowered when compared to the baseline scenario. The reduction in total operational costs was not as significant as the other sensitivity analyses, indicating that replacement time is not as significant a factor in the operational costs as the failure rates or the accessibility limits of the wind farm. There was, however, a larger percentage reduction in costs for the medium-speed turbines than the direct-drive turbines in this analysis. For all sites, the medium speed saw a larger reduction, which stems again from the gearbox component. The gearbox replacement time in the baseline scenario is 231 h, so lowering this time to 47 h saw a larger reduction in the overall costs compared with the direct drive, which does not include the gearbox component.
5.1 Limitations of analysis/model
Operation and maintenance modelling comes with a level of uncertainty; as with all models they are never a perfect representation of reality. This analysis also maintains this uncertainty in certain aspects. Firstly, the reliability figures taken from Koukoura (2019) are based on two different graphs presented in the work, and there may be a level of uncertainty in using the two different sources. It is also assumed that these failure rates can be applied to a 15 MW turbine, which may not be the case. However, the assumption is that even with a 10 MW power curve the trend between configurations would not differ, but the magnitude of the power produced, and therefore the magnitude of the costs, may change. As seen in Table 2, some of the generator failure rates are 0; this may be due to the fact that the data are taken from a relatively young population of turbines which have not had failures, adding to the uncertainty in some of the results. The reliability data from Sect. 2 are taken from four different sources that categorise failure data in different ways. Therefore, there is a possibility that the failure rates for the components for minor repair, major repair, and major replacement may have some overlap. Furthermore, the reliability figures from Anderson (2023) for the generator and gearbox minor repair and major repair come from high-speed geared machines and do not directly translate to direct-drive and medium-speed turbines. Other model inputs are based on previous literature and industry knowledge; however, it is important to consider that some of the literature may be considered outdated, and therefore the inputs may carry a level of uncertainty. This study assumes that the only failure rates that change between the two configurations are the gearbox, generator, and main bearing. However, the work done by Turnbull et al. (2022) suggests that this is not the case. The study showed that direct-drive turbines had twice as many stops per year compared to the medium-speed geared turbine. Further work would involve adjusting some of the direct-drive components based on the work done by Turnbull et al. (2022) to see the impact this would have on the cost gap between the configurations.
The model aims to capture the most important aspects of O&M modelling, but due to the complex nature of the industry itself, it is impossible to accurately capture the variability of all the different aspects. In this analysis, some of the factors that may not be true to reality are the following:
-
Electricity prices. The electricity prices in the UK are constantly changing, and so the fixed price chosen for this study may be subject to change in reality.
-
Future failure rates. Future failure rates are still unknown; therefore as time progresses the inputs used in this analysis may prove to not match the operational data of future wind farms.
-
The supply chain. Finally, the supply chain is becoming a growing concern for a lot of wind energy experts, who have stated that the expanding industry may not have the resources and vessels to support the growth. Supply chain bottlenecks are not captured in this O&M model, although this may be an important consideration in reality.
5.2 Key takeaways
In the majority of cases, this study corroborates the finding of Carroll (2016) that direct-drive turbines outperform medium-speed turbines in terms of availability and O&M costs. However, considering more recent failure rate estimates for offshore turbines leads to a narrower gap than that presented by Carroll (2016), where accessibility is good. To summarise, the main points of interest to take away from this study are the following:
-
The work done by Carroll (2016) found the difference in availability between configurations, for a site 50 km from the shore, to be roughly 0.7 %, with direct drive having higher availability. The baseline case in this study finds the difference in availability to be 0.49 % and 0.54 % for Bowdun and Caledonia, which are also 50 km from the shore.
-
Previously, in terms of cost, Carroll (2016) found the absolute percentage difference in O&M costs for the two configurations to be 29.79 %, with direct drive having lower cost, whereas with the updated reliability data used in this analysis, the absolute percentage differences between the configurations for the baseline comparison were 1.58 %, 1.59 %, and 5.78 % for Bowdun, Caledonia, and Machair respectively.
-
Medium-speed turbines incur larger O&M costs if the site suffers from low accessibility due to the increased number of major replacements and higher overall failure rates. This was highlighted in this study through the Machair case study site.
-
At a certain threshold of improved drivetrain reliability, there are scenarios where the medium-speed turbines have lower operational costs than the direct-drive turbines. These lower operational costs are dependent on the accessibility of the site. One way to tackle the higher costs incurred for medium-speed turbines at low-accessibility sites is by increasing the wave height limit for vessels to allow more transfers to occur. While the results from this analysis paint the medium-speed turbines in a more favourable light than previous studies, it is important to note that the direction of industry is to select sites further from shore, which tend to have lower accessibility.
-
Similarly, if future-generation turbines have higher failure rates than expected in equal measure across both drivetrain configurations, based on the analysis carried out in this study, the operational costs for the medium speed will be higher than the operational costs of a direct-drive turbine, and more importantly, the cost gap between the configurations will be larger.
-
One factor that did not seem to have as large an impact on the operational costs of a site is the replacement time for major components. Although lower replacement time did lower costs and the cost gap between configurations, it had the least impact on costs when comparing to failure rates and accessibility limits.
Overall, the apparent reduction in the cost gap between the two configurations seems to corroborate the opinion held in industry. Many developers are still investing in two-stage medium-speed turbines and direct-drive turbines, which implies an understanding that both turbines are viable options for offshore wind farms. Whether this trend continues remains to be seen as there is still large uncertainty surrounding the operation of larger-rated turbines for configurations.
The primary objective of this study was to assess whether conclusions derived from prior reliability studies on smaller turbines could be extrapolated to the emerging generation of larger turbines, specifically those rated at 15 MW. Earlier research had established that direct-drive turbines exhibited superior cost-effectiveness and higher availability compared to medium-speed geared turbines. To investigate the applicability of these conclusions to larger turbines, the study synthesised new failure rate data for the generator, gearbox, and main bearing, simulating the operations and maintenance of a wind farm featuring 15 MW turbines. Utilising the StrathOW-OM modelling tool, simulations were conducted for three distinct case study wind farm sites, incorporating updated repair costs.
The simulations consistently demonstrated that direct-drive turbines, across all three sites, yielded lower operational costs and higher availability in comparison to medium-speed turbines. Notably, the cost gap between the two configurations was found to be narrower than in previous studies.
Following the establishment of a baseline scenario, sensitivity analyses were conducted to evaluate the influence of various inputs on overall costs. In scenarios with high replacement rates, costs increased by approximately 10 %, whereas low replacement rates resulted in a 10 % cost decrease for both turbine configurations across all sites. The impact of replacement rate variations was more pronounced on medium-speed turbines, widening the cost gap between the two configurations. Accessibility proved critical, with low-accessibility sites favouring direct-drive turbines due to their lower failure rates and reduced need for major replacements, minimising downtime.
The study's key takeaway was that, in situations where site accessibility is limited, direct-drive turbines prove to be more economically viable for next-generation 15 MW turbines. However, with good accessibility, the cost gap between direct-drive and medium-speed configurations is reduced. Moreover, medium-speed turbines might have lower operational costs than direct-drive turbines if failure rates fall below a specific threshold, as indicated by the 5th percentile estimates from Jenkins (2022). These findings hold significance for developers planning future wind farms with larger turbines, aiding them in selecting the optimal drivetrain for specific sites.
The study recommends a continued focus on obtaining reliability data from larger operational turbines to enhance the accuracy of operation and maintenance modelling for offshore turbines. Additionally, obtaining updated failure rates for components beyond the generator, gearbox, and main bearing is suggested for a more comprehensive analysis and informed decision-making in turbine selection.
The datasets used for the climate modelling in this work come from the ERA5 reanalysis data (https://doi.org/10.24381/cds.adbb2d47, Hersbach et al., 2023) and can be downloaded using the ESOX tool by Lautec Eso (2023), and information on how to access the data can be found at https://esox.lautec.com/ (last access: 1 November 2023).
OD: formal analysis, writing. FA: data curation, writing (original draft preparation). JC: supervision.
The contact author has declared that none of the authors has any competing interests.
Publisher’s note: Copernicus Publications remains neutral with regard to jurisdictional claims made in the text, published maps, institutional affiliations, or any other geographical representation in this paper. While Copernicus Publications makes every effort to include appropriate place names, the final responsibility lies with the authors.
Acknowledgement is given to the UKRI Engineering and Physical Sciences Research Council (EPSRC; project EP/S023801 and project EP/T031549/1) for their continued support.
This research has been supported by the Engineering and Physical Sciences Research Council (grant nos. EP/S023801 and EP/T031549/1).
This paper was edited by Weifei Hu and reviewed by Davide Astolfi and two anonymous referees.
Anderson, F.: Operational Data Mining for Offshore Wind Farm Maintenance, PhD thesis, University of Edinburgh, https://doi.org/10.7488/era/4357, 2023. a, b, c, d
Carroll, J.: Cost of energy modelling and reduction opportunities for offshore wind turbines, PhD thesis, University of Strathclyde, https://doi.org/10.48730/akxk-rq05, 2016 a, b, c, d, e, f, g
Carroll, J., McDonald, A., and McMillan, D.: Failure rate, repair time and unscheduled O&M cost analysis of offshore wind turbines, Wind Energy, 19, 1107–1119, 2016. a, b, c, d, e, f, g, h, i, j, k
Carroll, J., McDonald, A., Dinwoodie, I., McMillan, D., Revie, M., and Lazakis, I.: Availability, operation and maintenance costs of offshore wind turbines with different drive train configurations, Wind Energy, 20, 361–378, https://doi.org/10.1002/we.2011, 2017. a, b, c, d, e, f, g, h, i
Catapult, O. R. E.: Guide to an Offshore Wind Farm: Updated and Extended, https://ore.catapult.org.uk/app/uploads/2019/04/BVGA-5238-Guide-r2.pdf (last access: 1 November 2023), 2019. a, b, c
Catapult, O. R. E.: Floating wind: Cost modelling of major repair strategies, https://offshorewindinnovationhub.com/industry_insight/floating-wind-cost-modelling-of-major-repair-strategies/ (last access: 1 November 2023) 2020. a, b
Committee for Climate Change: Independent Assessment: The UK’s Net Zero Strategy, https://www.theccc.org.uk/publication/independent-assessment-the-uks-net-zero-strategy/ (last access: 1 November 2023), 2021. a
Crown Estate Scotland: Awards: Lead Applicants, Project Partners, Area, Capacity and Foundations, https://www.crownestatescotland.com/sites/default/files/2023-07/scotwind-awards-with-project-partners-november-2022.pdf, last access: 20 July 2023. a
Crown Estate Scotland: ScotWind Awarded Sites, https://www.crownestatescotland.com/resources/documents/scotwind-map-of-option-areas-170122 (last access: 20 July 2023), 2023a. a, b
Crown Estate Scotland: Briefing: ScotWind Leasing for offshore wind, https://crownestatescotland.com/sites/default/files/2024-02/ScotWind Leasing Briefing Nov 2023 PDF.pdf (last access: 1 November 2023), 2023b. a
Dalgic, Y., Lazakis, I., Dinwoodie, I., McMillan, D., and Revie, M.: Advanced logistics planning for offshore wind farm operation and maintenance activities, Ocean Eng., 101, 211–226, 2015a. a, b
Dalgic, Y., Lazakis, I., Dinwoodie, I., McMillan, D., Revie, M., and Majumder, J.: Cost benefit analysis of mothership concept and investigation of optimum chartering strategy for offshore wind farms, Enrgy. Proced., 80, 63–71, 2015b. a
Dinwoodie, I.: Modelling the operation and maintenance of offshore wind farms, PhD thesis, University of Strathclyde, https://doi.org/10.48730/151d-1194, 2014. a
Dinwoodie, I., Endrerud, O.-E. V., Hofmann, M., Martin, R., and Sperstad, I. B.: Reference cases for verification of operation and maintenance simulation models for offshore wind farms, Wind Engineering, 39, 1–14, 2015. a
Dinwoodie, I. A. and McMillan, D.: Operational strategies for offshore wind turbines to mitigate failure rate uncertainty on operational costs and revenue, IET Renew. Power Gen., 8, 359–366, 2014. a
Díaz, H. and Guedes Soares, C.: Review of the current status, technology and future trends of offshore wind farms, Ocean Eng., 209, 107381, https://doi.org/10.1016/j.oceaneng.2020.107381, 2020. a
Flannigan, C., Carroll, J., and Leithead, W.: Operations expenditure modelling of the X-Rotor offshore wind turbine concept, J. Phys. Conf. Ser., 2265, 032054, https://doi.org/10.1088/1742-6596/2265/3/032054, 2022. a, b
Gaertner, E., Rinker, J., Sethuraman, L., Zahle, F., Anderson, B., Barter, G. E., Abbas, N. J., Meng, F., Bortolotti, P., Skrzypinski, W., Scott, G. N., Feil, R., Bredmose, H., Dykes, K., Shields, M., Allen, C., and Viselli, A.: IEA wind TCP task 37: definition of the IEA 15-megawatt offshore reference wind turbine, Tech. rep., National Renewable Energy Lab (NREL), Golden, CO, USA, https://doi.org/10.2172/1603478, 2020. a
Global Wind Energy Council: Global Offshore Wind Report 2020, Tech. rep., Global Wind Energy Council, https://gwec.net/global-offshore-wind-report-2020/ (last access: 1 November 2023), 2022. a
Hahn, B., Durstewitz, M., and Rohrig, K.: Reliability of wind turbines, in: Wind Energy: Proceedings of the Euromech Colloquium, Springer, Berlin, Heidelberg, 329–332, https://doi.org/10.1007/978-3-540-33866-6_62, 2007. a
Hart, E., Clarke, B., Nicholas, G., Kazemi Amiri, A., Stirling, J., Carroll, J., Dwyer-Joyce, R., McDonald, A., and Long, H.: A review of wind turbine main bearings: design, operation, modelling, damage mechanisms and fault detection, Wind Energ. Sci., 5, 105–124, https://doi.org/10.5194/wes-5-105-2020, 2020. a
Hersbach, H., Bell, B., Berrisford, P., Biavati, G., Horányi, A., Muñoz Sabater, J., Nicolas, J., Peubey, C., Radu, R., Rozum, I., Schepers, D., Simmons, A., Soci, C., Dee, D., and Thépaut, J.-N.: ERA5 hourly data on single levels from 1940 to present, Copernicus Climate Change Service (C3S) Climate Data Store (CDS) [data set], https://doi.org/10.24381/cds.adbb2d47, 2023.
Jenkins, B.: O&M cost modelling of large component major replacement in next-generation offshore wind turbines with uncertain failure rates, PhD thesis, Univeristy of Strathclyde, https://doi.org/10.48730/jzq9-8604, 2022. a, b, c, d, e, f, g, h, i, j, k
Jenkins, B., Belton, I., Carroll, J., and McMillan, D.: Estimating the major replacement rates in next-generation offshore wind turbines using structured expert elicitation, J. Phys. Conf. Ser., 2362, 012020, https://doi.org/10.1088/1742-6596/2362/1/012020, 2022a. a, b, c, d, e, f, g
Jenkins, B., Carroll, J., and McMillan, D.: O&M cost modelling of major replacements in next-generation offshore wind turbines, in: 11th International Conference on Renewable Power Generation-Meeting net zero carbon (RPG 2022), online, 22–23 September 2022, IET, vol. 2022, 189–194, https://doi.org/10.1049/icp.2022.1819, 2022b. a, b, c, d
Koukoura, S.: Wind turbine gearbox diagnostics using artificial intelligence, PhD thesis, University of Strathclyde, https://doi.org/10.48730/qmkx-tw26, 2019. a, b, c, d, e, f, g, h, i, j, k
Lautec Eso: ESOX Tool, https://esox.lautec.com/ (last access: 20 July 2023), 2023. a, b
McMorland, J., Flannigan, C., Carroll, J., Collu, M., McMillan, D., Leithead, W., and Coraddu, A.: A review of operations and maintenance modelling with considerations for novel wind turbine concepts, Renew. Sust. Energ. Rev., 165, 112581, https://doi.org/10.1016/j.rser.2022.112581, 2022. a
ORE Catapult: Sparta Portfolio Review 2020/21, https://ore.catapult.org.uk/?orecatapultreports=sparta-portfolio-review-2020-21 (last access: 1 November 2023), 2022. a, b, c, d
Spinato, F., Tavner, P. J., Van Bussel, G. J., and Koutoulakos, E.: Reliability of wind turbine subassemblies, IET Renew. Power Gen., 3, 387–401, 2009. a
Turnbull, A., McKinnon, C., Carrol, J., and McDonald, A.: On the Development of Offshore Wind Turbine Technology: An Assessment of Reliability Rates and Fault Detection Methods in a Changing Market, Energies, 15, 3180, https://doi.org/10.3390/en15093180, 2022. a, b, c, d
UK Government: UK Energy in brief 2022, https://www.gov.uk/government/statistics/uk-energy-in-brief-2022 (last access: 1 November 2023), 2022. a
van de Kaa, G., van Ek, M., Kamp, L. M., and Rezaei, J.: Wind turbine technology battles: Gearbox versus direct drive – opening up the black box of technology characteristics, Technol. Forecast. Soc., 153, 119933, https://doi.org/10.1016/j.techfore.2020.119933, 2020. a
Wilkinson, M., Harman, K., Hendriks, B., Spinato, F., van Delft, T., Garrad, G., and Thomas, U.: Measuring wind turbine reliability-results of the reliawind project, Wind Energy, 35, 102–109, 2011. a
Wiser, R., Rand, J., Seel, J., Beiter, P., Baker, E., Lantz, E., and Gilman, P.: Expert elicitation survey predicts 37 % to 49 % declines in wind energy costs by 2050, Nature Energy, 6, 555–565, 2021. a