the Creative Commons Attribution 4.0 License.
the Creative Commons Attribution 4.0 License.
 | 02 Jul 2024
Wind farm structural response and wake dynamics for an evolving stable boundary layer: computational and experimental comparisons
Kelsey Shaler
Eliot Quon
Hristo Ivanov
The wind turbine design process requires performing thousands of simulations for a wide range of inflow and control conditions, which necessitates computationally efficient yet time-accurate models, especially when considering wind farm settings. To this end, FAST.Farm is a dynamic-wake-meandering-based mid-fidelity engineering tool developed by the National Renewable Energy Laboratory targeted at accurately and efficiently predicting wind turbine power production and structural loading in wind farm settings, including wake interactions between turbines. This work is an extension of a study that addressed constructing a diurnal cycle evolution based on experimental data (Quon, 2024). Here, this inflow is used to validate the turbine structural and wake-meandering response between experimental data, FAST.Farm simulation results, and high-fidelity large-eddy simulation results from the coupled Simulator fOr Wind Farm Applications (SOWFA)–OpenFAST tool. The validation occurs within the nocturnal stable boundary layer when corresponding meteorological and turbine data are available. To this end, we compared the load results from FAST.Farm and SOWFA–OpenFAST to multi-turbine measurements from a subset of a full-scale wind farm. Computational predictions of blade-root and tower-base bending loads are compared to 10 min statistics of strain gauge measurements during 3.5 h of the evolving stable boundary layer, generally with good agreement. This time period coincided with an active wake-steering campaign of an upstream turbine, resulting in time-varying yaw positions of all turbines. Wake meandering was also compared between the computational solutions, generally with excellent agreement. Simulations were based on a high-fidelity precursor constructed from inflow measurements and using state-of-the-art mesoscale-to-microscale coupling.
- Article
(6462 KB) - Full-text XML
- Companion paper
- BibTeX
- EndNote


This work was authored by the National Renewable Energy Laboratory, operated by the Alliance for Sustainable Energy, LLC, for the US Department of Energy (DOE) under contract no. DE-AC36-08GO28308. The US Government retains and the publisher, by accepting the article for publication, acknowledges that the US Government retains a nonexclusive, paid-up, irrevocable, worldwide license to publish or reproduce the published form of this work, or allow others to do so, for US Government purposes.
The wind turbine design process requires performing thousands of simulations for a wide range of inflow and control conditions to capture the structural loads experienced by the turbine over its lifetime. This process necessitates computationally efficient yet time-accurate models. When turbines are placed in wind farms, structural loading is also driven by wakes from neighboring turbines and from wind-farm-wide control strategies, such as wake steering (Fleming et al., 2019, 2020). To this end, FAST.Farm is a dynamic wake meandering (DWM-)based mid-fidelity engineering tool developed by the National Renewable Energy Laboratory (NREL) targeted at accurately and efficiently predicting wind turbine power production and structural loading in wind farm conditions, including farm-wide atmospheric inflows, wake interactions between turbines, and farm-wide control (Jonkman and Shaler, 2021).
Previous FAST.Farm studies have shown the similarities and differences between FAST.Farm and high-fidelity large-eddy simulations (LESs) for rigid and flexible turbines, including wake development and meandering, power performance, and structural loading (Jonkman et al., 2018; Shaler et al., 2019; Shaler and Jonkman, 2021). The first validation of FAST.Farm against measured data took place during the Scaled Wind Farm Technology (SWiFT) benchmark study (Doubrawa et al., 2020), which showed that under-performing aspects of the simulated wakes were primarily a result of inaccuracies in the inflow and not related to wake modeling itself. But this study did not consider interaction between multiple wind turbines or structural loads. Structural loads calculated by FAST.Farm in single-wake conditions (where one turbine is directly upstream of a second turbine) were validated against measurement data from the Alpha Ventus wind farm (Kretschmer et al., 2021), which showed the importance of wake-added turbulence in low-ambient-turbulence conditions. In another single-wake condition, FAST.Farm was further verified and validated against other engineering models, LESs, and measured data from the DanAero wake benchmark study (Asmuth et al., 2022), which further highlighted the importance of accurate inflow characterization on the turbine response. These validation studies considered two turbines. The only validation of FAST.Farm against measured data with more than two turbines that has been done to date involved validating FAST.Farm against five-turbine generator power, rotor speed, and blade pitch results from supervisory control and data acquisition measurements (Shaler et al., 2020). Despite this verification and validation work, the load and wake-meandering results for multi-turbine interactions have yet to be validated.
The objective of this work is to assess the ability of FAST.Farm to accurately predict wind turbine loads and wake evolution in a small wind farm based on realistic atmospheric conditions, specifically within a non-stationary stable boundary layer. This is done via a three-way comparison between FAST.Farm simulations, high-fidelity LESs using the coupled Simulator fOr Wind Farm Applications (SOWFA)-OpenFAST tool, and multi-turbine measurements from a small full-scale wind farm, with the simulations driven by a high-fidelity LES precursor using the SOWFA of a diurnal cycle derived from measurement-driven mesoscale-to-microscale coupling techniques. The development of the high-fidelity LES precursor is detailed in a companion paper (Quon, 2024). FAST.Farm and SOWFA–OpenFAST simulations are performed for a 3.5 h nighttime period when atmospheric and turbine data are available and compared to experimental data from a cluster of five General Electric (GE) 1.5 MW turbines, as shown in Fig. 1. This turbine has a hub height of 80 m, a rotor diameter of 77 m, a controller supporting variable speed below rated, and collective blade pitch-to-feather regulation above rated. The data are collected from the turbines located at the northwest corner of a larger wind farm. The 10 min averages, standard deviations, and power spectra are compared for generator power, rotor speed, and blade-root flapwise and edgewise bending moments. Additionally, wake center meandering is compared between FAST.Farm and SOWFA results for all turbines. A portion of the time period studied involved active wake steering of Tr02.
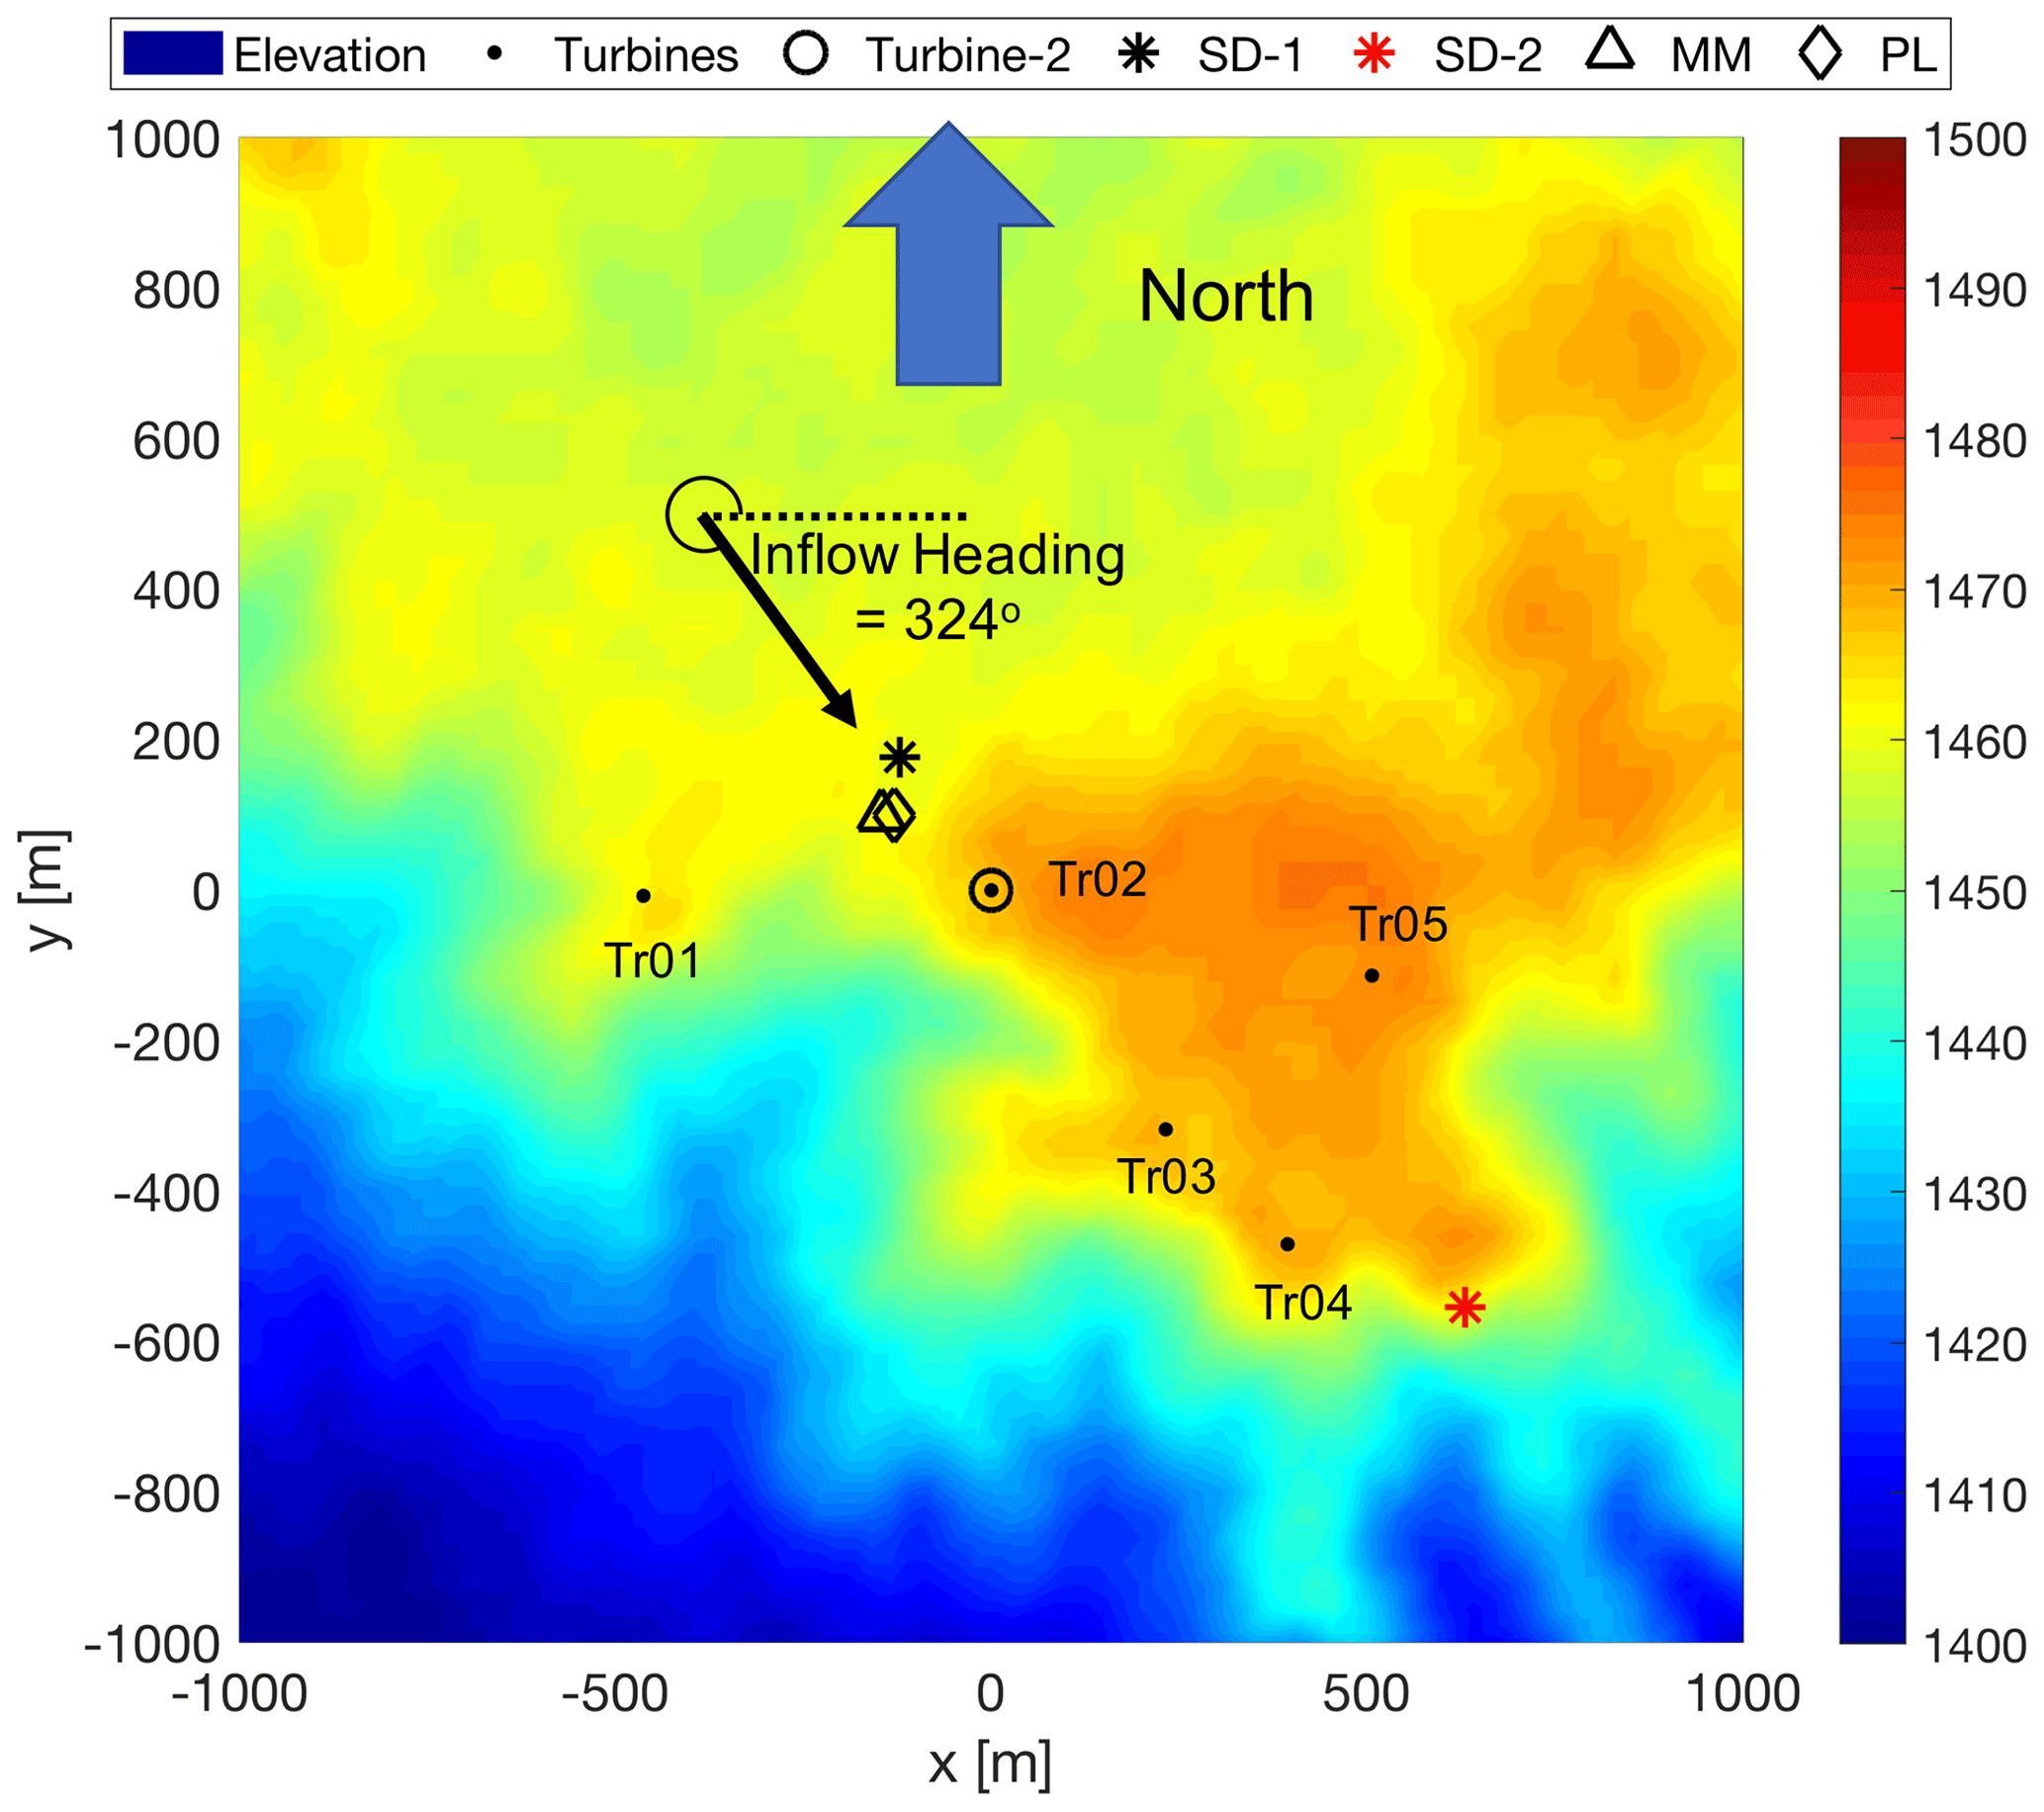
Figure 1Wind farm layout. Tr01–Tr05 indicate the wind turbine locations. The contours show elevation above sea level in meters. The x and y axes are easting and northing coordinates, respectively, centered at Tr02. The profiling Doppler lidar (PL) and meteorological mast (MM) are indicated by the diamond and triangle symbols. Sodar (SD) locations are indicated by stars but are not used in this work.
This section provides an overview of FAST.Farm, SOWFA, and experimental measurements, followed by a description of the validation case that was used in this study.
2.1 Data measurements
We applied data measurements to construct the inflow domain used in the FAST.Farm and SOWFA–OpenFAST simulations and to validate the FAST.Farm and SOWFA–OpenFAST structural load results.
2.1.1 Inflow conditions
To measure the wind inflow conditions, a 60 m meteorological mast and a WindCube v2 profiling Doppler lidar are available approximately 160 m upstream of turbine Tr02 along the predominant wind direction. An ultrasonic anemometer on the meteorological mast provides 20 Hz u-, v-, and w-velocity components; additional sensors provide virtual temperature, pressure, and humidity. The profiling Doppler lidar provides 1 Hz wind speed and wind direction data from 40 to 260 m heights with an interval of 20 m. A detailed list of all inflow measurements used to construct the high-fidelity inflow is provided in Quon (2024), which also provides more information on the inflow wind properties, measurements, wake-steering campaign details, and why this time period was selected.
2.1.2 Wind turbine measurements
Two sets of wind turbine measurements are used for validation in this study. The first contained rotor power measurements from the supervisory control and data acquisition (SCADA) system of all five turbines. These data were collected at 1 Hz and post-processed into 10 min averages. The second set of measurements contained more comprehensive data from Tr02 and Tr03. These two turbines were instrumented to measure mechanical loads based on guidance from the International Electrotechnical Commission 61400-13, edition 1. Turbine controller outputs such as rotor power, torque, and speed were provided at 1 Hz and directly integrated with the independent instrumentation into the data acquisition system. All data were recorded at 50 Hz and stored as 10 min files. In this study, blade-root and tower-base bending moments were extracted as quantities of interest. The blade-root bending moments were measured 1500 mm from the face of the pitch ring. Calibration and scaling were done using a slow rotor roll procedure at two different pitch angles with the blade overhang moment. Tower-base strain gauges were located roughly 6 m above the tower-base flange. A yaw sweep procedure in conjunction with the rotor overhang moment was used to calculate the scale factor. The load measurement campaign took place from 10 December 2019 to 16 February 2020. However, this work focuses on the 3.5 h period between 07:30–11:00 UTC on 26 December 2019, as detailed in Quon (2024).
For complete details on the experimental load campaign, see Ivanov et al. (2021).
2.2 Large-eddy simulation setup
We performed high-fidelity LES of the field campaign using SOWFA. This software is based on OpenFOAM version 6 and solves the momentum and potential temperature transport equations for a dry, impressible flow with buoyancy effects represented by the Boussinesq approximation. For the turbine simulations, turbines are represented by actuator disk (AD) and actuator line (AL) models in two distinct simulations. The turbine aerodynamics are loosely coupled to OpenFAST (NREL, 2021a), in which SOWFA passes flow-field velocities to OpenFAST and OpenFAST passes blade forces to SOWFA. (We refer to the coupled software as SOWFA–OpenFAST herein.) The OpenFAST blade forces are represented within SOWFA as a distributed body force, the distribution of which is dictated by a uniform Gaussian kernel with width ϵ. This width is generally chosen to be as small as possible while maintaining numerical stability. For the AD model, the blade forces are distributed with a constant ϵ=3.5 m and then spread over the entire rotor disk; for the AL model, the blade forces are distributed as a function of the blade chord, with . In general, the AL model requires a finer discretization and is considered to have higher fidelity than the AD model.
SOWFA simulations were performed in a 4 km × 4 km × 1 km computational domain. The precursor simulation was run with uniform spatial discretization of 10 m and temporal discretization of 0.5 s. Each of the two simulations with turbines was initiated from the diurnal precursor simulation at 07:30 UTC on 26 December 2019. In the AD simulation, mesh refinement was added at 2.5 D (rotor diameters) upstream and laterally from all turbines and extending 15 D downstream of Tr04 in the mean wind direction of 337°. In the refinement region, the spatial discretization was reduced to 5 m, and the temporal discretization was reduced to 0.25 s. In the AL simulation, the initial refinement was expanded to 10 D upstream and laterally 20 D downstream. An additional refinement level was added around each turbine that extended 2 D upstream and laterally and 5 D downstream. The finest grid spacing was 2.5 m, and the temporal discretization was further reduced to 0.1 s.
For further details on the SOWFA model and how it was used to generate the inflow, see the companion paper of Quon (2024).
2.3 FAST.Farm simulation setup
FAST.Farm is a multi-physics engineering tool that accounts for wake interaction effects on wind turbine performance and structural loading within wind farms. It is an extension of NREL's OpenFAST, which solves the aero-hydro-servo-elasto dynamics of individual turbines, extending this analysis to include wake deficits, advection, deflection, meandering, and merging for wind farms. FAST.Farm is based on the DWM model (Larsen et al., 2008) but expands on it to address many limitations of past DWM implementations. Using this method, the wake deficit of each turbine is computed using the steady-state thin shear layer approximation of the Navier–Stokes equations, and the wake is perturbed with a turbulent freestream to capture wake meandering. Wake merging is modeled using a superposition method (Jonkman and Shaler, 2021).
Compared to SOWFA, which resolves the inflow and wakes of the flow field through the scales resolved by LES, the flow field in FAST.Farm is solved via engineering models for wave evolution, meandering, and merging atop the inflow field. The main disadvantage of FAST.Farm relative to SOWFA is the potential lower accuracy (hence the need for validation), and the main advantage is a drastic reduction in computational expense.
FAST.Farm simulations were performed using the same precursor generated in SOWFA and used for the SOWFA–OpenFAST simulations. To accomplish this step, the SOWFA precursor simulation was sampled at the FAST.Farm low- and high-resolution spatial and temporal sampling frequencies. The high- and low-resolution time steps were at 0.5 and 2 s, respectively. High- and low-resolution spatial discretization was 5 and 10 m, respectively. The low-resolution spatial domain was sized at 2045 m × 1100 m × 280 m, and the high-resolution spatial domains were sized at ±1.5 D × ±1.5 D × 3.6 D, centered around each turbine. Rather than calibrating the wake-related FAST.Farm parameters based on the measured data or SOWFA–OpenFAST results, default values were used.
2.4 OpenFAST model setup
In the OpenFAST model of each wind turbine, aerodynamic, structural, and controller components were enabled. For FAST.Farm simulations, OpenFAST computes the rotor aerodynamics using the blade-element-momentum theory in the AeroDyn15 module with advanced corrections, including unsteady aerodynamics. For SOWFA simulations, OpenFAST computes the blade-element part, while the induction is accounted for within SOWFA. For all simulations, OpenFAST computes the wind turbine structural response using the ElastoDyn module, which models the flexibility of the blades, drivetrain, and tower with a combined multi-body and modal structural approach. The controller was modeled using the Reference Open-Source Controller (ROSCO; NREL, 2021b) and is described further in Shaler et al. (2020). A separate controller model was used for Tr02, as described in Shaler et al. (2020). Tower influence on the flow and nacelle blockage, as well as drag on the tower, was not considered.
2.5 Validation cases
Figure 2 shows the time-varying inflow conditions from the nacelle anemometer and the turbine simulations (sampled at hub height, just upstream of the rotor), the turbine yaw positions from the nacelle yaw encoder, and the estimated shear exponent from the meteorological mast. The yaw position of each turbine is directly specified through the user-defined controller option in the ServoDyn module of OpenFAST; thus no distinction is made between the computational methods and measurements in Fig. 2. Yaw positions are centered around a nominal value such that a yaw position of 0° corresponds to no yaw misalignment when the inflow wind is primarily at 337°. Time-varying yaw angle settings for Tr02 and Tr03 values were taken directly from experimental data. Because of a lack of measurements, Tr04 values were set to be the same as Tr03 values, and Tr01 and Tr05 were set to have no yaw misalignment relative to the incoming flow. For more details on these measurements and corresponding uncertainty, see Fleming et al. (2020). The turbine inflow velocities for Tr02 and Tr03 come from experimental measurements and simulation results. The FAST.Farm and SOWFA–OpenFAST results were taken from the InflowWind module of OpenFAST generated at each turbine, computed at the turbine hub location. This simulation output includes wake deficits from upstream turbines and for SOWFA–OpenFAST only, the induction zone of the turbine whose inflow wind is being output. While there is reasonable agreement between the experimental and FAST.Farm results, the SOWFA–OpenFAST results are consistently lower, especially for Tr03. This is due to the induction zone upstream of the turbines captured by SOWFA, which reduces the inflow velocity experienced by the wind turbines. The time-varying shear exponent was computed using profiling lidar data and based on changes to the wind speed between heights of 40 and 120 m. These measurements show a wide range of shear exponents during this time period and at times large gradients, indicating that the background conditions are not stationary. This is important when comparing simulated results and measured data, and this non-stationarity can have a significant impact on the ability of a code to accurately capture rotor response. As discussed in Quon (2024), the mean absolute errors in inflow wind speed, wind direction, and turbulence intensity during the study period are 0.19 m s−1, 1.5°, and 0.031 (non-dimensional), respectively.
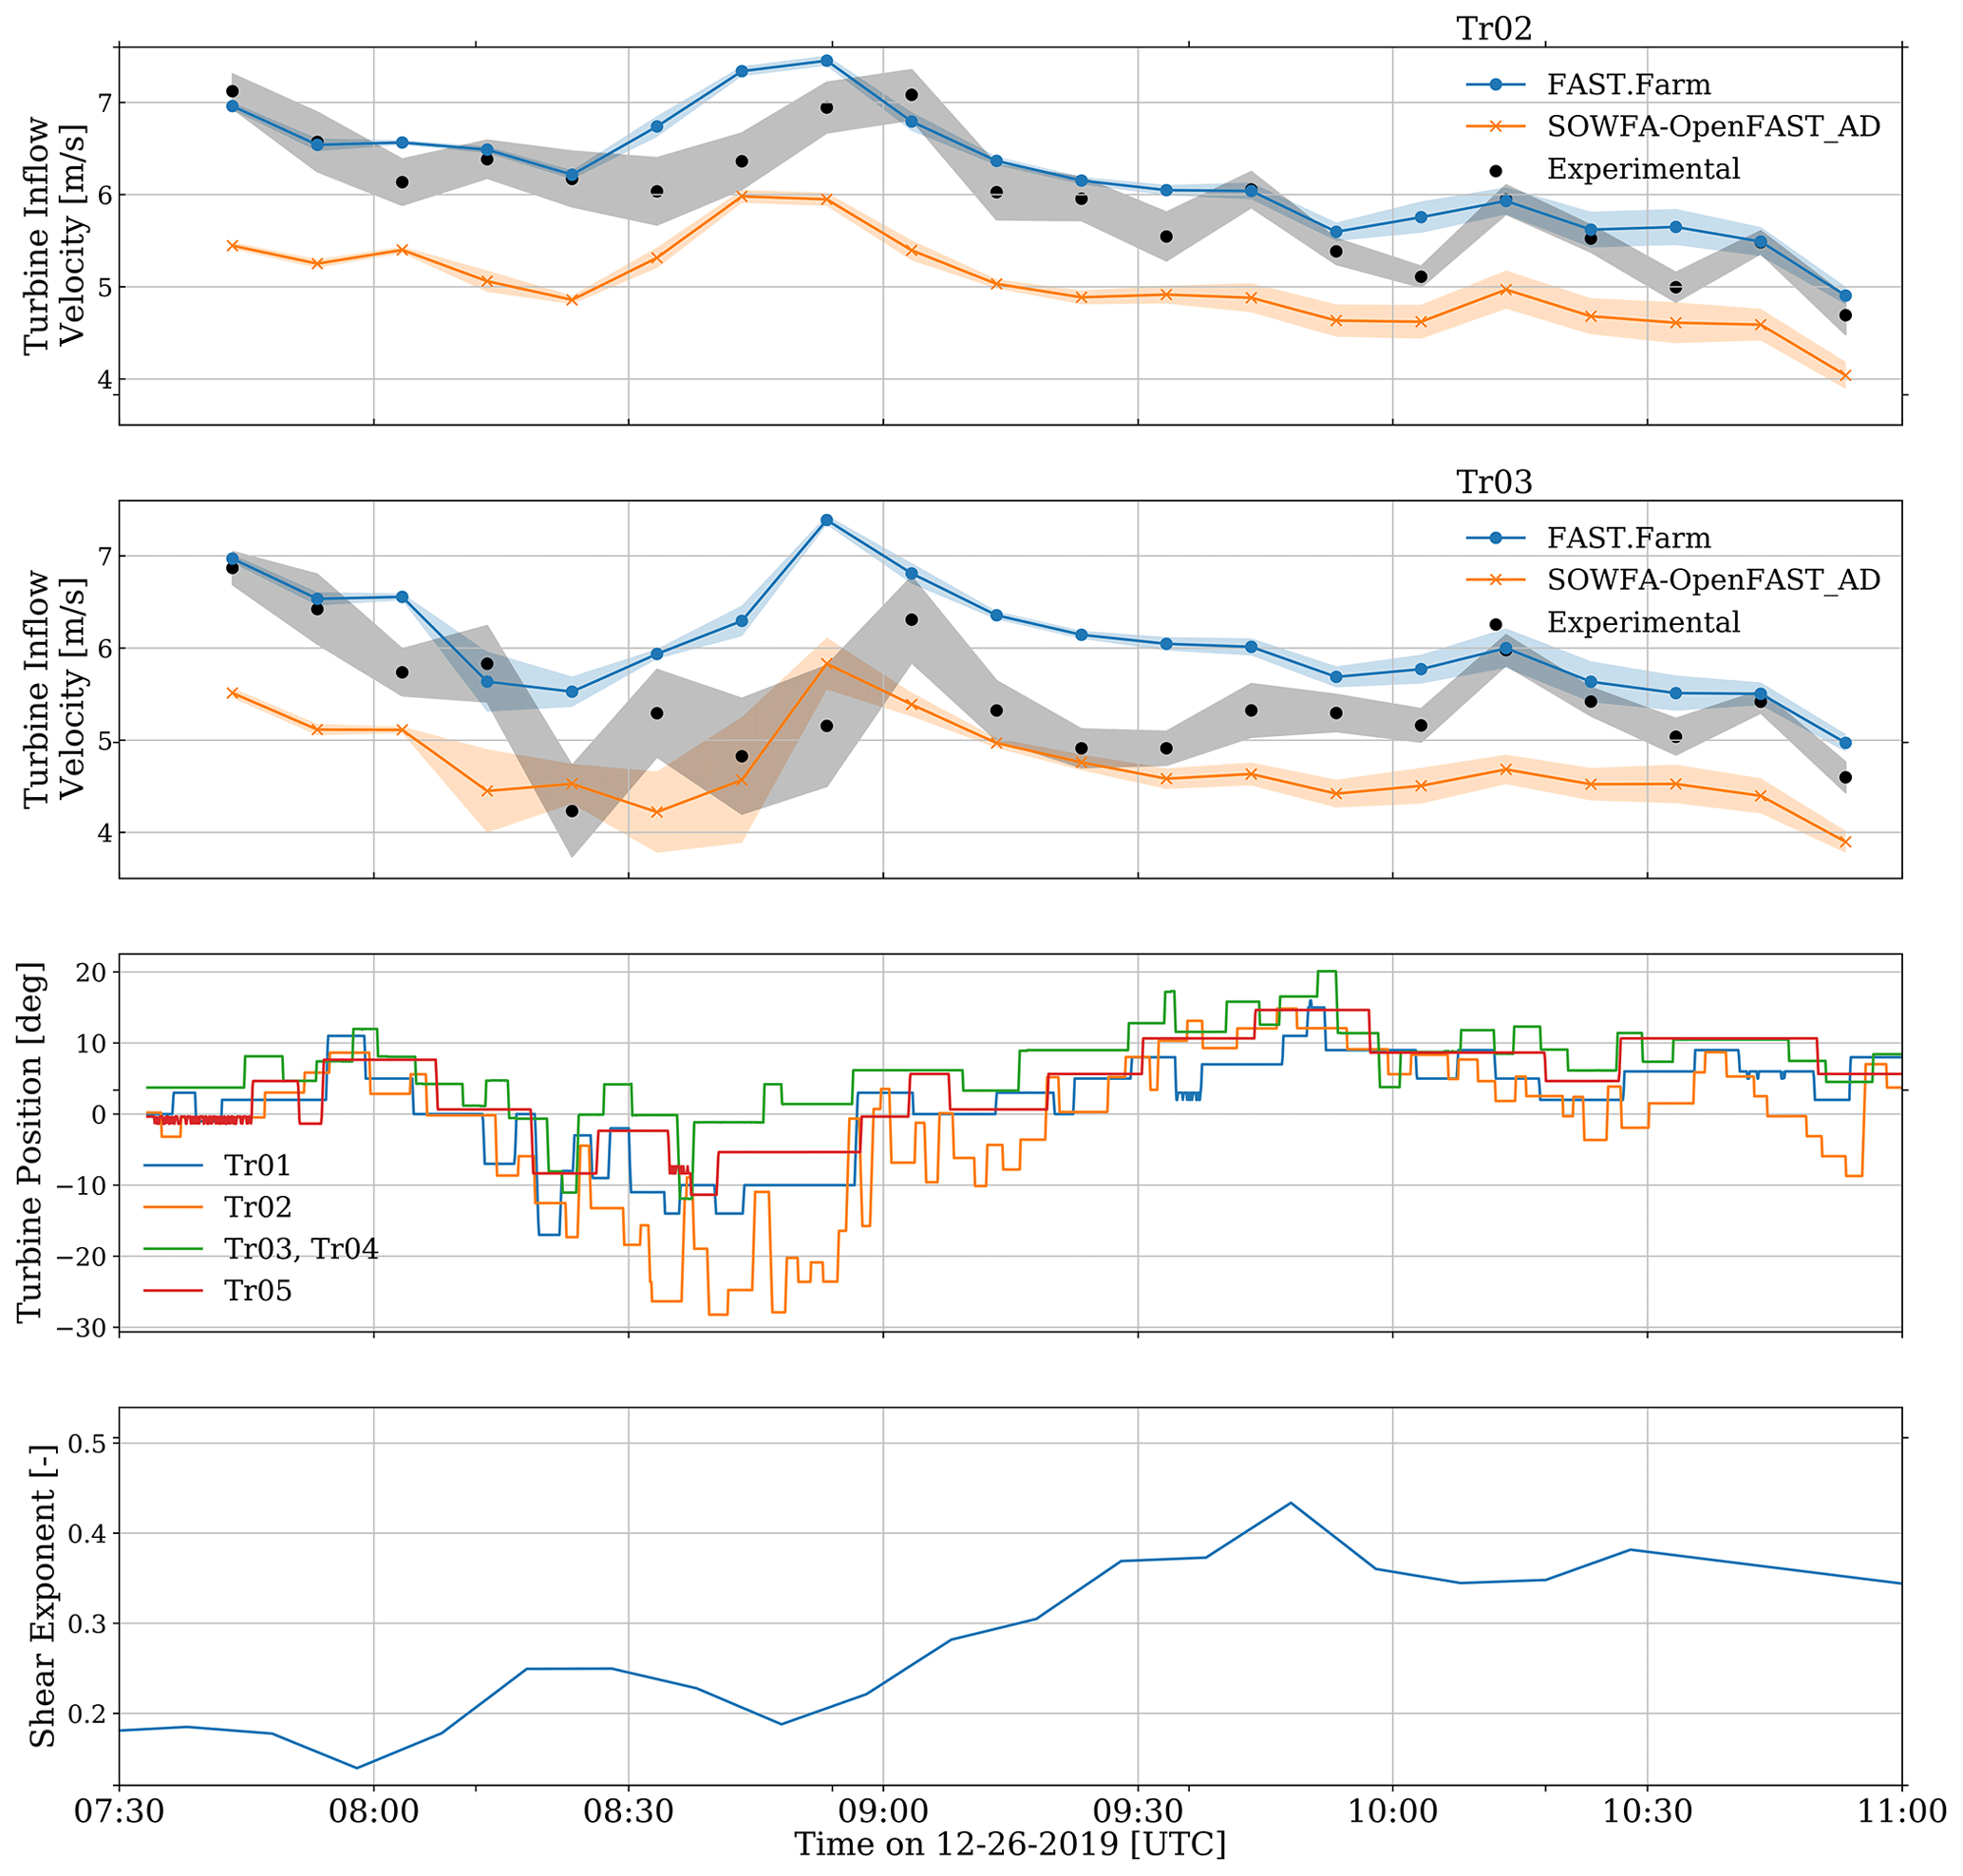
Figure 2Time-varying results for measured and simulated inflow velocities at Tr02 (top row) and Tr03 (second row), turbine yaw position (third row), and ambient shear exponent (bottom). Yaw position and shear exponent results are from measurements. The dots in inflow velocity results show 10 min averages, and bands extend to ±1 standard deviation (SD) from the mean.
Two-dimensional flow visualizations at hub height of the five turbine simulations are shown in Fig. 3.
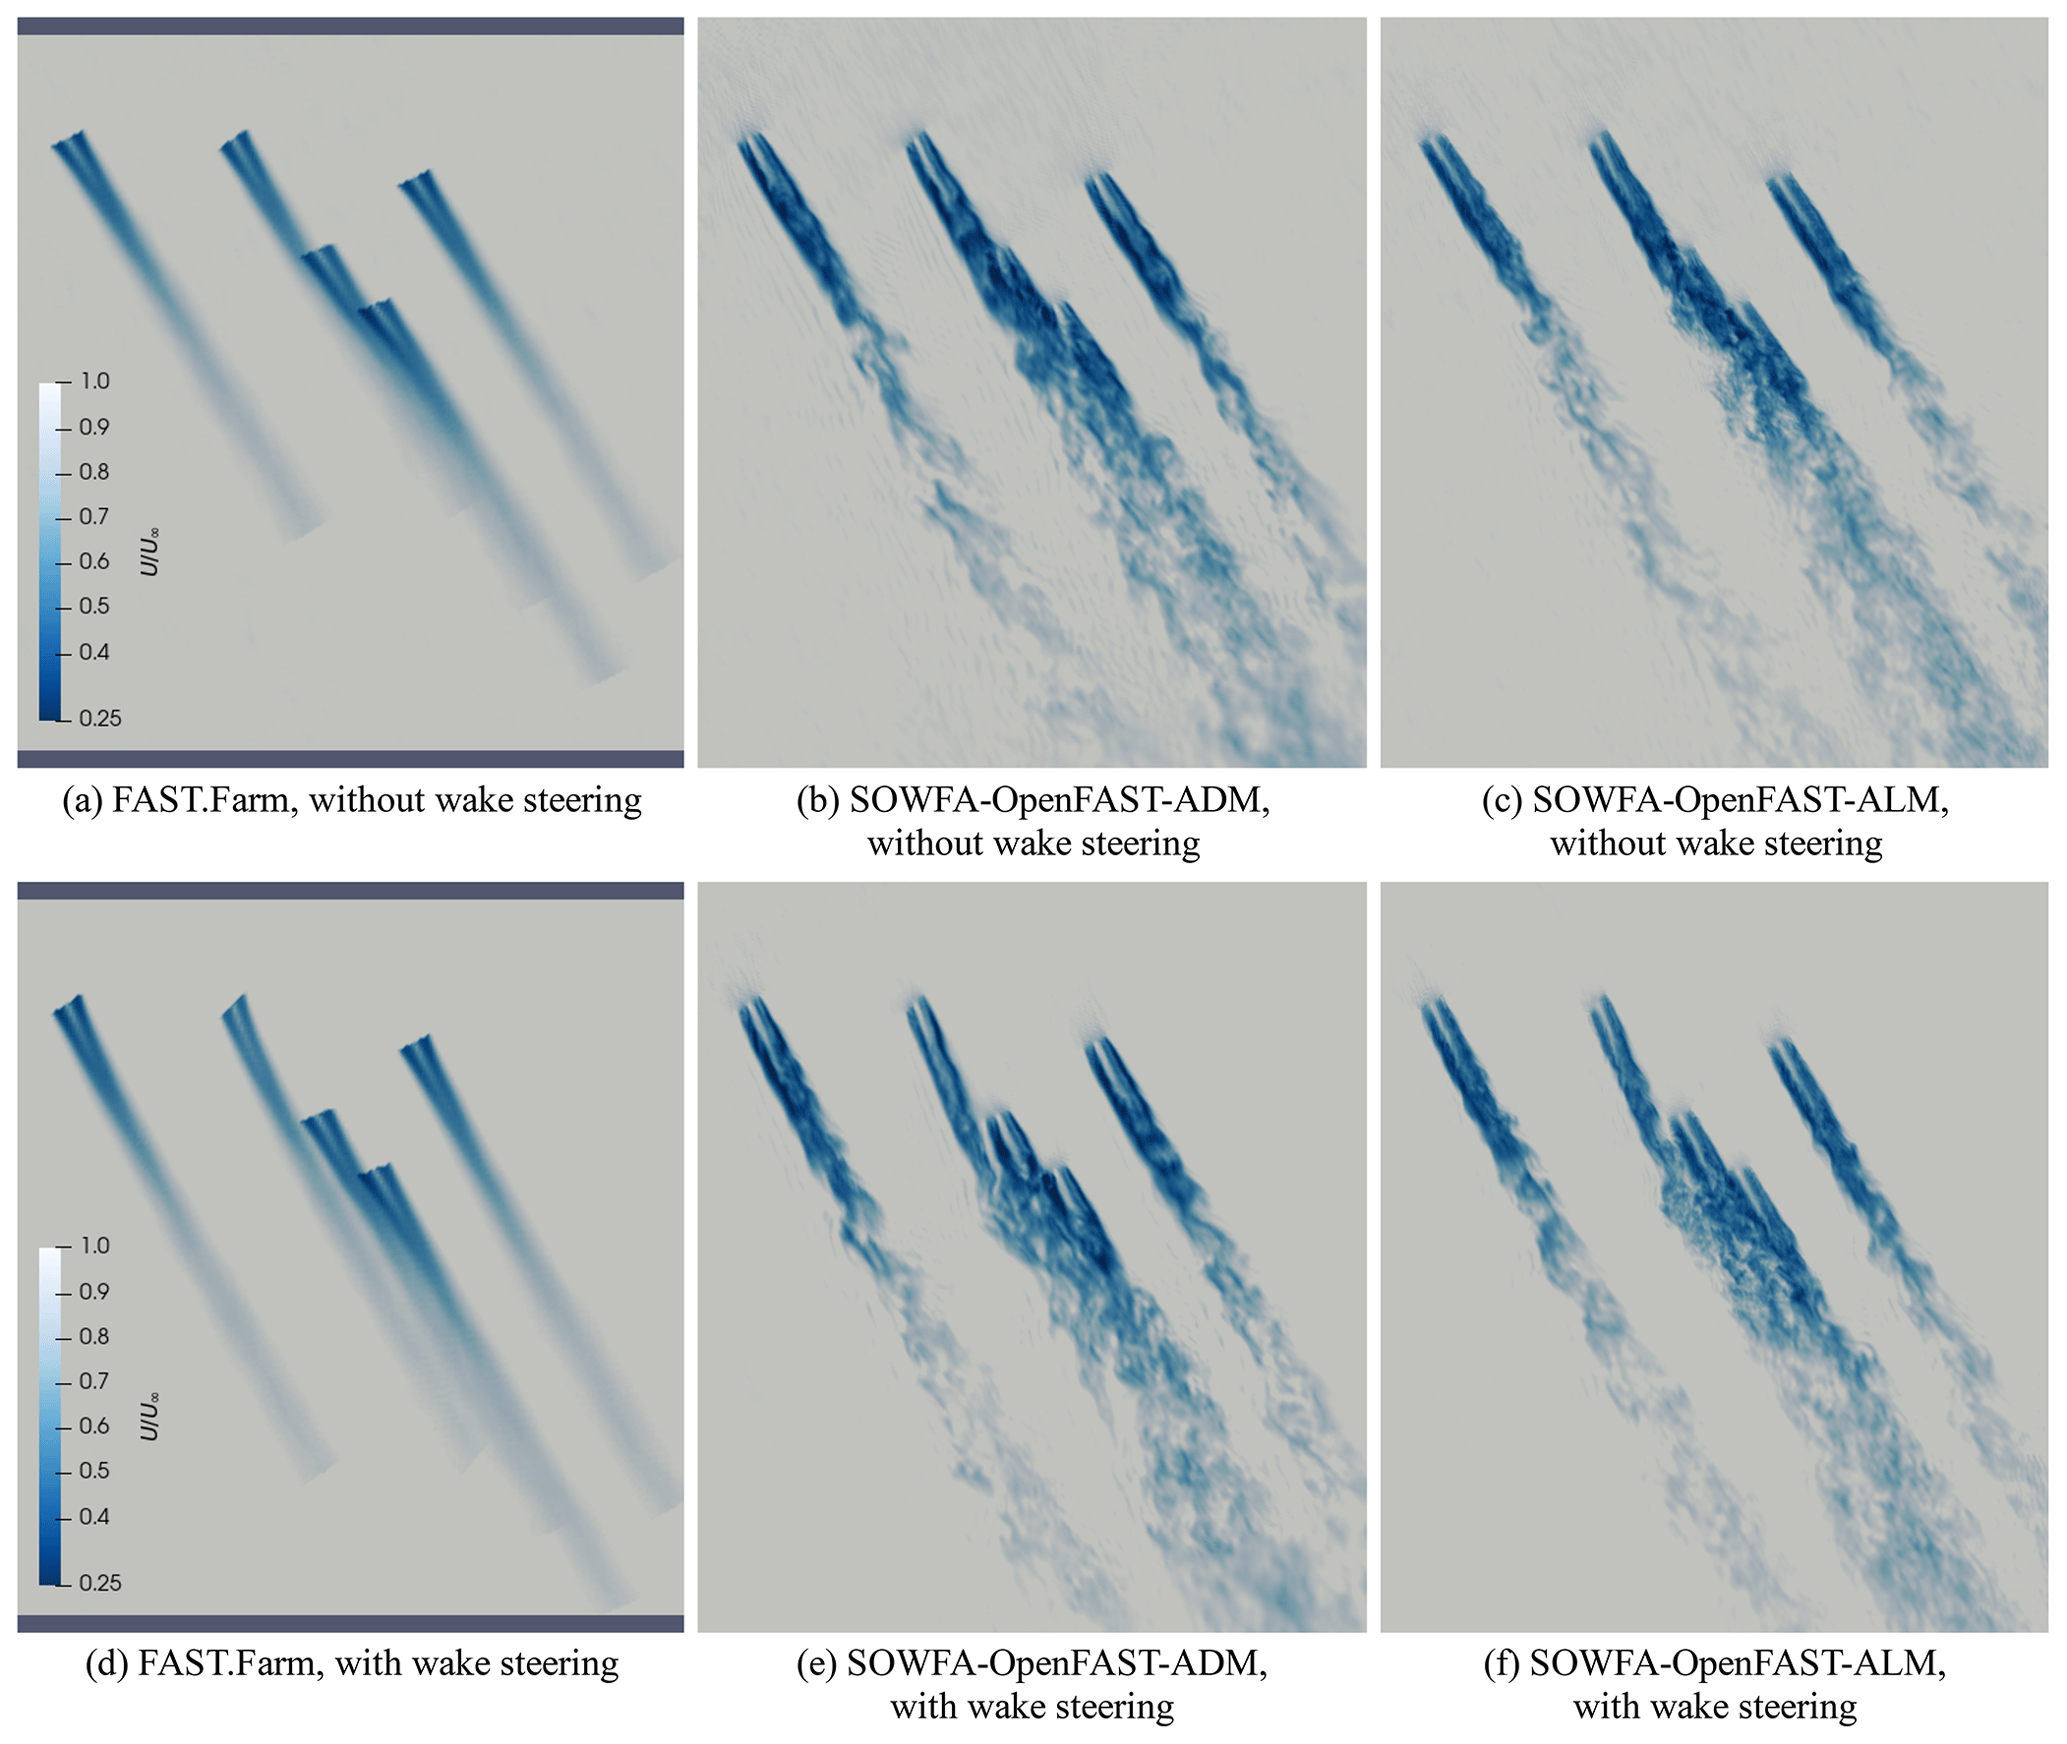
Figure 3Time-averaged (FAST.Farm) and instantaneous (SOWFA) two-dimensional flow visualization at 08:30 UTC (without wake steering) and 08:49 UTC (with wake steering), sampled at hub height and colored by velocity magnitude normalized by the mean horizontal wind speed. Turbine yaw positions at these time stamps can be found in Fig. 2.
Each row contains results from FAST.Farm (shown as a time average), SOWFA–OpenFAST–ADM (shown as an instantaneous snapshot), and SOWFA–OpenFAST–ALM simulations (shown as an instantaneous snapshot), both without (top) and with (bottom) wake steering. The overall wake trajectory and magnitude are consistent between simulations. Such comparisons have been investigated in more detail in previous studies (Jonkman et al., 2018; Doubrawa et al., 2020).
In addition to experimental turbine load comparisons, the wake evolution between FAST.Farm and SOWFA–OpenFAST–ALM results is compared. For each turbine, the wake center position was computed using the Simulated and Measured Wake Identification and CHaracterization ToolBox (SAMWICH Box; Quon, 2017), an open-source, Python-based library of wake-tracking algorithms. There are several wake-tracking algorithms available in the SAMWICH ToolBox. The one chosen for this work is the two-dimensional Gaussian fit model, which solves an optimization problem to determine the wake position, two-dimensional shape, and rotation parameters of a Gaussian wake-deficit function. This method is able to estimate the wake center, size, and shape and was successfully applied to identify wakes under non-neutral atmospheric conditions (Doubrawa et al., 2020). This and other wake-tracking methods available in SAMWICH Box are discussed in more detail in Quon et al. (2019). Because the wake-tracking algorithm may be sensitive to instantaneous mean wind conditions and the presence of background turbulence structures, the resulting wake center time series can include non-physical discontinuities. To minimize this, filtering is applied to remove spurious results, as was done previously by Doubrawa et al. (2020). For each wake center time series, a moving-median filter was first applied to remove the majority of non-physical spikes in the data. A moving median rather than moving mean was applied to help preserve the extrema in the identified wake positions. Any remaining spikes were removed by eliminating high gradients in the position histories that correspond to abrupt changes in wake position, and then a final moving-median filter was applied. The resulting filtered trajectories were manually verified to be representative of the simulated wake motion.
An instantaneous snapshot visualizing the wake center locations is shown in Fig. 4. Here, the u velocity is shown in a plane that is roughly parallel to the un-yawed rotor planes, wherein the black circles represent the projected rotor locations, the white circles indicate the region searched by the algorithm to identify the wake center, and the white x shows the calculated wake center after all filtering has been applied. With visual inspection, these x's appear to be roughly in the center of the wake area and indicate that the wake centers are accurately calculated by the algorithm (this might not be fully obvious from Fig. 4 but is clearer when the wakes are shown with the ambient inflow subtracted out, which is how SAMWICH processes the wake centers).
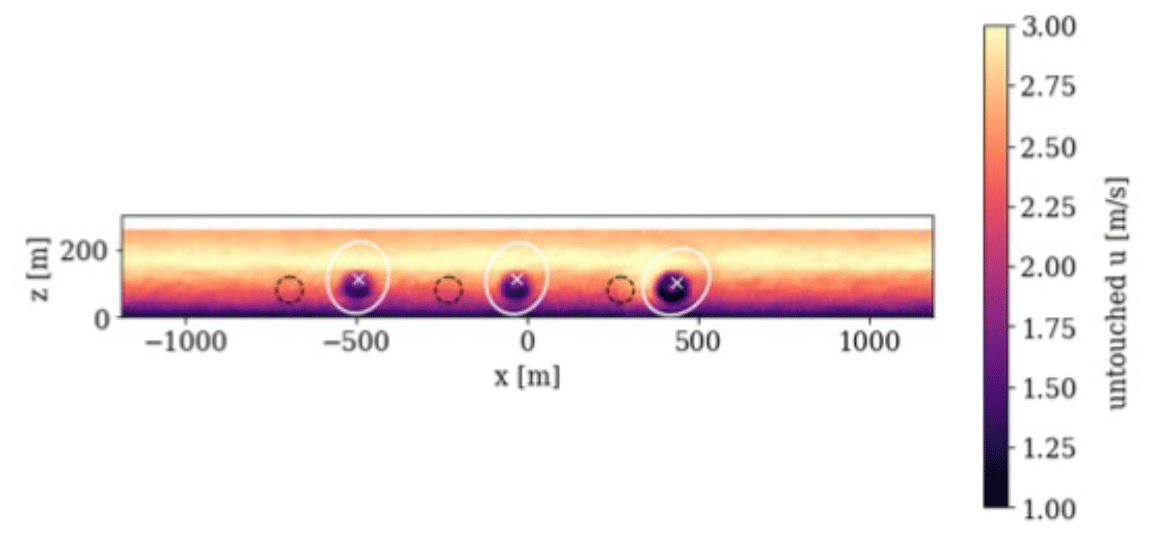
Figure 4Instantaneous snapshot of FAST.Farm u velocity located 2 D downstream of Tr01, Tr02, and Tr05. The black circles show the projected location of the rotor plane. The white circles show the area searched for calculating the wake center of the corresponding wind turbine wake, with the white x showing the calculated instantaneous wake center location 1 h into the simulation.
The results of this article are broken up into two parts. First, time series and power spectral density (PSD) data are compared between experimental measurements and all computational models. In all time series plots, the dots represent 10 min averages, and the shaded regions represent ±1 standard deviation for that 10 min period. Because these time series data were collected during a wake-steering campaign for Tr02, vertical shaded regions are used to show when wake steering of more than ±10° is present (red) and when there is prominent waking of Tr03 (purple). All PSD plots are focused on key excitation and natural frequencies and do not show the full y-axis range reached (mostly indicative of the mean values whose peak is not shown). Second, wake center tracking is used to compare the approximate time-varying wake center position of Tr02, Tr03, and Tr04 for all computational methods.
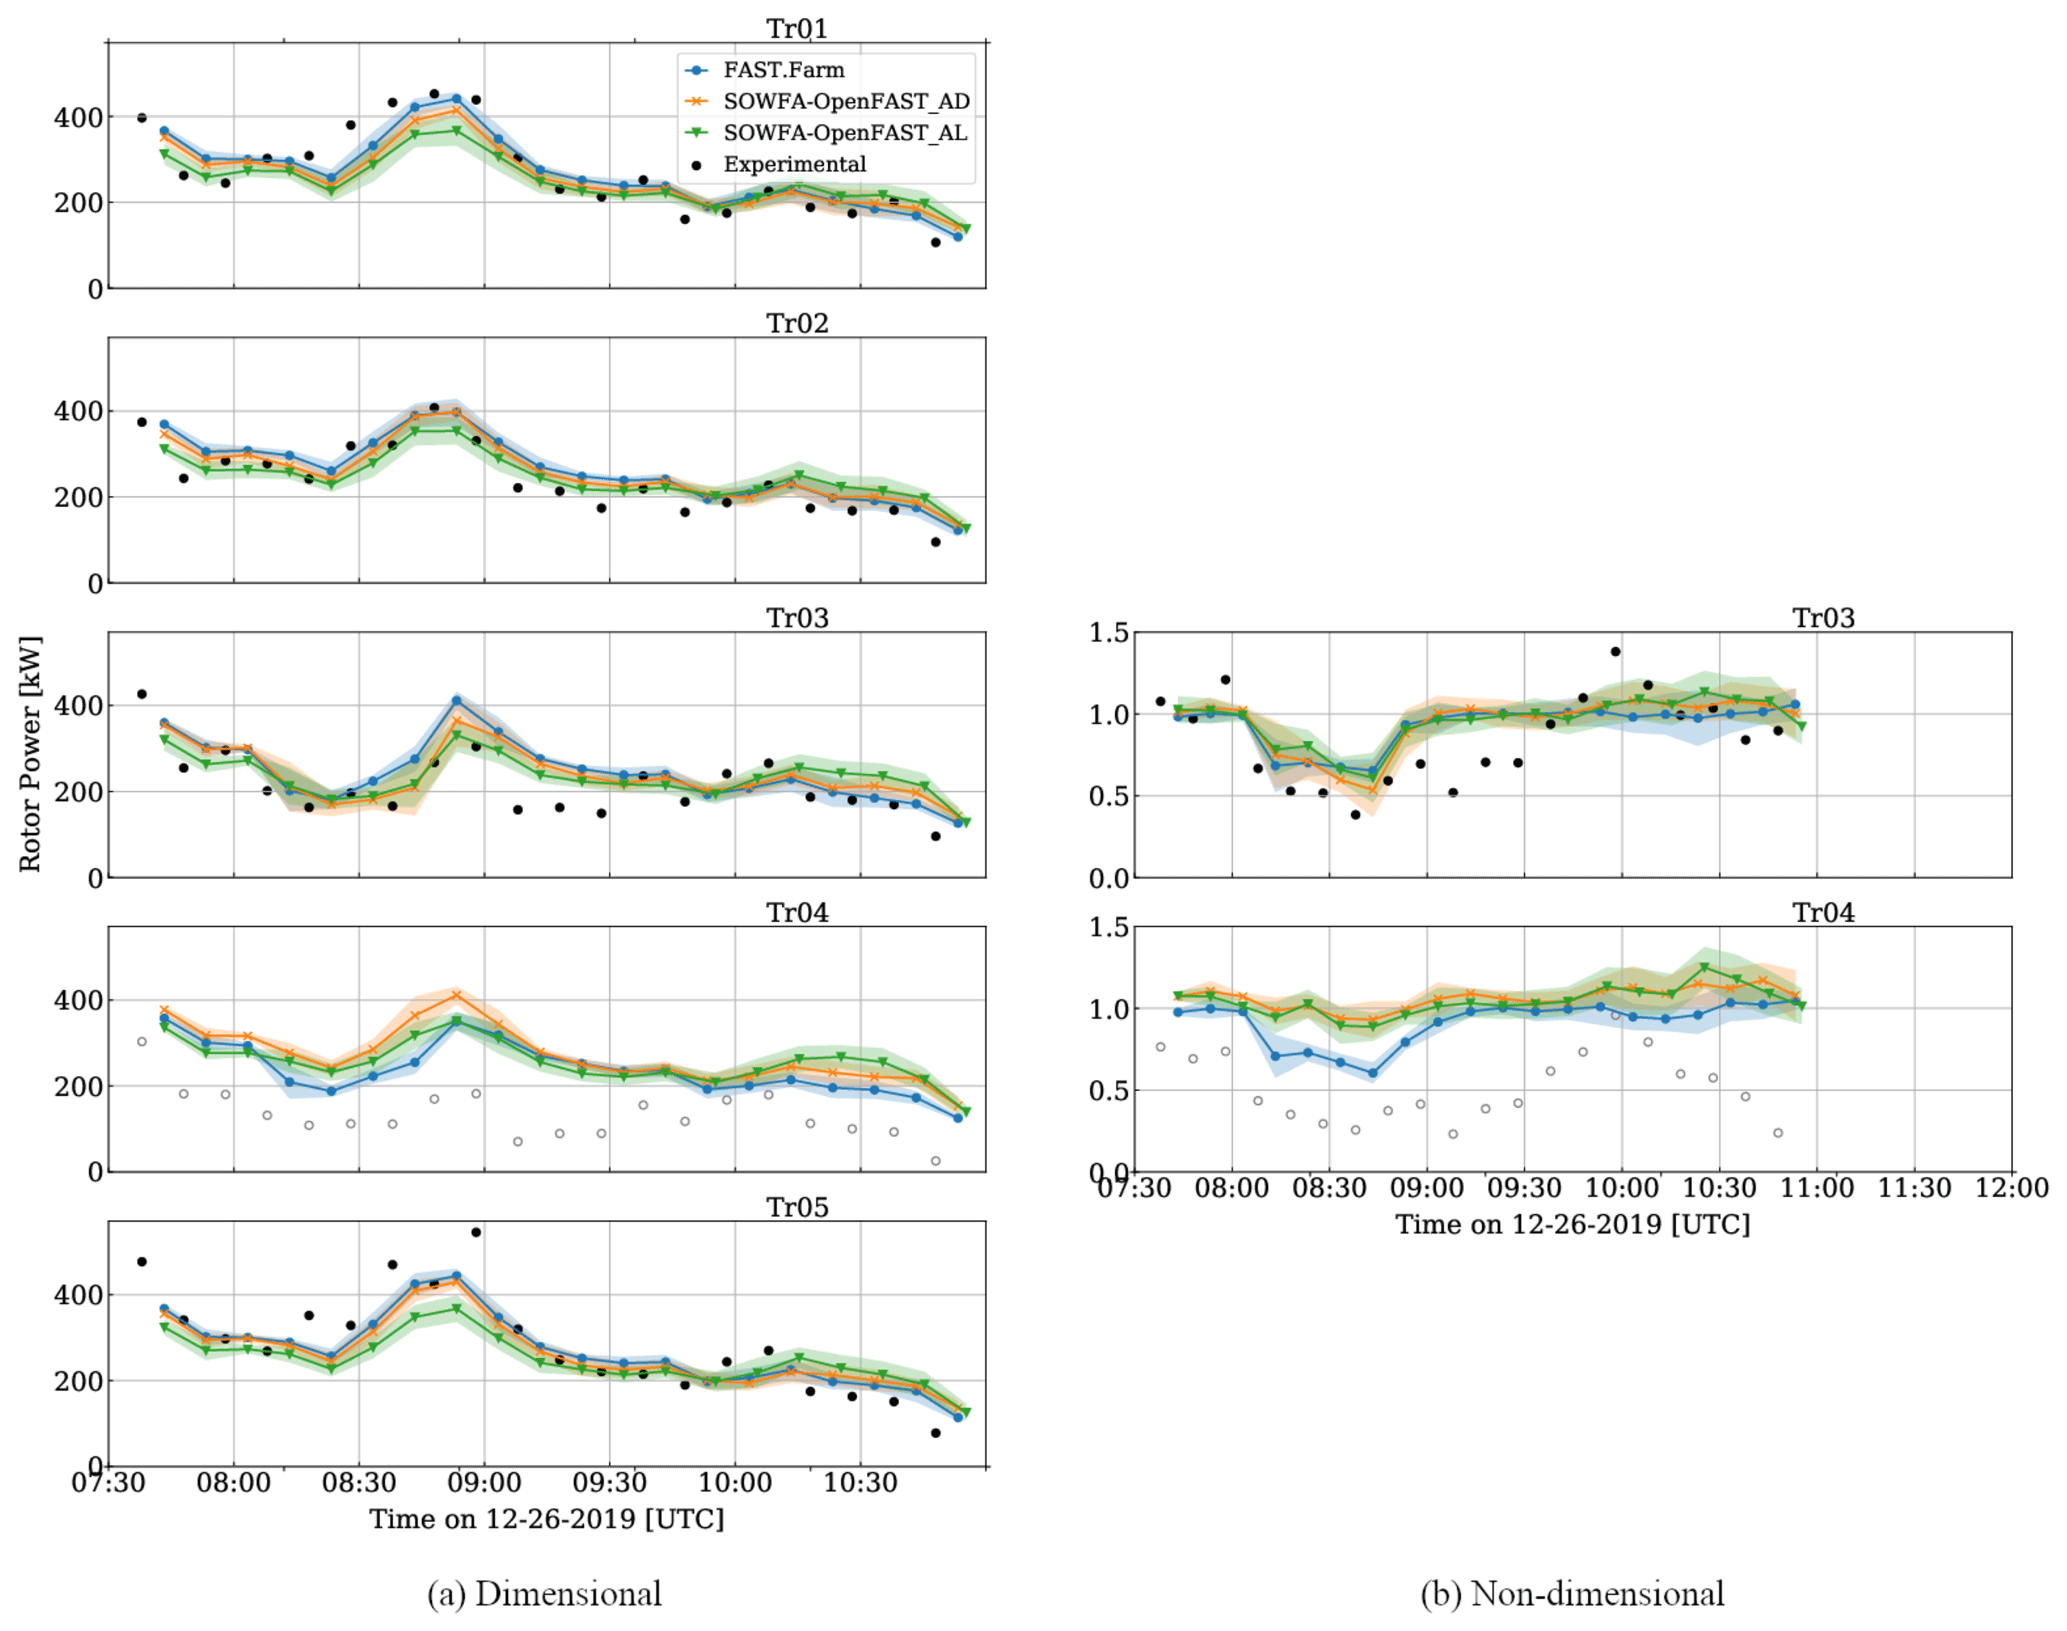
Figure 5Time series (TS) results for rotor power of all turbines for all computational methods and experimental results. The subplots on the left (a) are dimensional, and those on the right (b) are non-dimensional. The dots show 10 min averages, and bands extend to ±1 standard deviation (SD) from the mean. Results from each wind turbine are shown in separate sub-figures. Experimental results for Tr04 are invalid.
3.1 Wind turbine response
The response of the turbine array for the case study defined in Quon (2024) has been simulated with three different model fidelities. Figure 5 shows the time series plots of rotor power for all computational methods and experimental measurements. Here, the experimental data are taken from SCADA measurements; therefore, results are shown for all five turbines but without the bands for standard deviation that could not be derived from the 10 min averages. Tr04 has been shown for completeness but was excluded from the analysis because, unlike the other wind turbines, its performance on this day deviated from its operational power curve in both Region 2 and Region 3. Additionally, both dimensional (Fig. 5a) and non-dimensional (Fig. 5b) results are shown. For the non-dimensional plots, Tr01 remains dimensional, and the remaining turbines were non-dimensionalized by the corresponding average 10 min mean value of Tr01 and Tr05 . When comparing the rotor power of the unwaked turbines (Tr01, Tr02, and Tr05), a primary observation is that at higher wind speeds FAST.Farm tends to have the highest rotor power for a given 10 min period, followed by SOWFA–OpenFAST_AD and then SOWFA–OpenFAST_AL. As the wind speed slows down, this order reverses, with SOWFA–OpenFAST_AL results tending to predict the highest power and FAST.Farm predicting the lowest power. There is particularly strong agreement between FAST.Farm and SOWFA–OpenFAST_AD results for Tr01 and Tr05, turbines for which wake steering is never used. When compared to the experimental results, there is overall strong agreement with the computational results, though some time periods show a higher error. In particular, the experimental power of Tr05 is significantly higher than the computation at a few 10 min periods before 09:00 UTC. This is expected to be caused by an unmeasured spatial variation in the inflow (horizontal gradient). Note that the strongest agreement between the computational and experimental results is for Tr02. Though this was the turbine for which wake steering was used, the precise yaw angle was prescribed to match experimental measurements, which is likely the reason for such close agreement, combined with the turbine being unwaked.
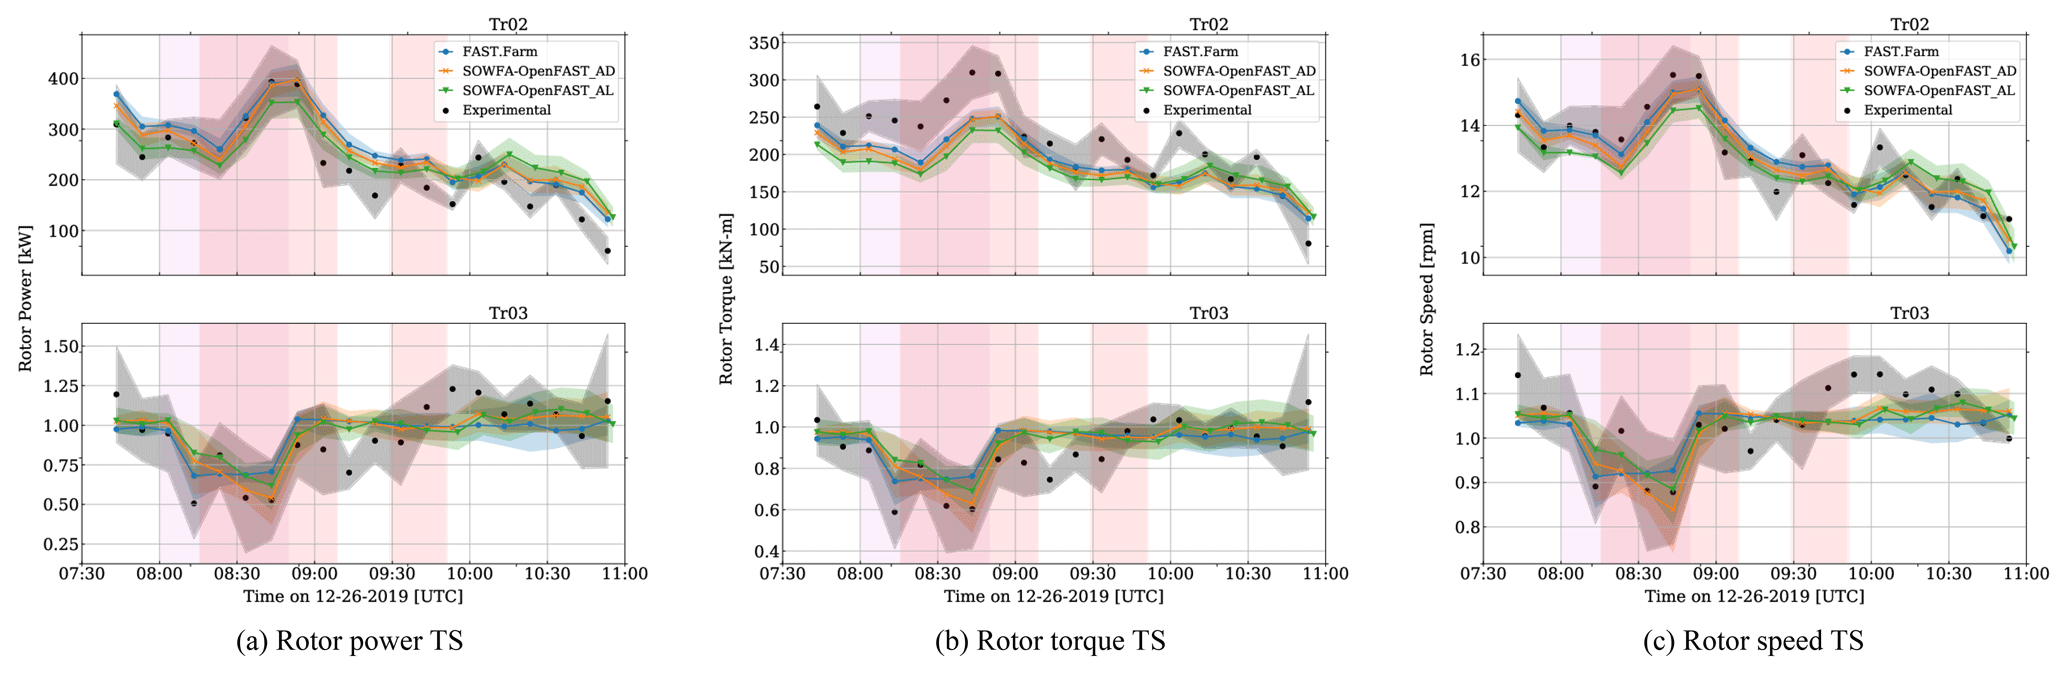
Figure 6Time series results for rotor power, torque, and speed for all computational methods and experimental results (not SCADA). The subplots on the top are dimensional for Tr02, and those on the bottom are non-dimensional for Tr03. The dots show 10 min averages, and bands extend to ±1 standard deviation (SD) from the mean. Results from each wind turbine are shown in separate sub-figures. The vertical shaded regions are used to show when wake steering of more than ±10° is present (red) and when there is prominent waking of Tr03 (purple).
When comparing the response of waked turbines (Tr03 and Tr04), discrepancies vary based on how many wakes impact the turbine. For Tr03, the same relative trends are observed between the computational methods, with FAST.Farm predicting the highest rotor power at a higher wind speed and SOWFA–OpenFAST_AL predicting the highest rotor power at lower wind speeds. Additionally, there is strong agreement of all models and experimental results for most of the time period, with larger discrepancies at the lowest wind speeds. For Tr04, there are significant discrepancies between all computational models and experimental data for the duration of the time series and large discrepancies between the computational models during the period with strong waking. The differences in computational results during the period with strong waking is likely because of the differences in wake breakdown or wake position. In particular, FAST.Farm predicts the lowest rotor power in this region, which is contrary to the unwaked turbine results. This lower rotor power is likely due to a stronger wake that has not broken down as quickly as the wake from the SOWFA–OpenFAST results. At the time these simulations were performed, FAST.Farm did not have a wake-added turbulence model or a curled wake model. The lack of a curled wake model may lead to differences in wake shape and deflection, resulting in more of the wake from Tr03 impacting that of Tr04. Both of these points are investigated in Sect. 3.2. FAST.Farm is expected to be inaccurate in waked conditions for Tr04 because of its close proximity to Tr03 (223 m), which is less than 3 D, due to the near-wake correction used in FAST.Farm that is implemented to approximate the effect of pressure recovery on the far-wake solution.
Figure 6a–c show time series results for rotor power, torque, and speed for all computational results and experimental measurements (not SCADA) for Tr02 and Tr03. Results for Tr02 are presented dimensionally, whereas results for Tr03 are non-dimensionalized by the corresponding 10 min average of Tr02. For rotor power, these time series results are very similar to those in Fig. 5 but not exact because of different measurement instruments. Note that although rotor power and speed may be measured directly, the reported torque has uncertainty associated with the strain gauge measurement and the estimated gearbox and generator loss factor assumed during calibration. The non-dimensionalization of Tr03 results allow for a clearer view of the effect of wake interaction, with a strong dip in all quantities during the period of wake interaction, shaded by purple.
Comparable results are observed between all methods for all quantities, following the trends described for Fig. 5. For all quantities, experimental measurements show higher standard deviations throughout the time series.
Figure 7a and b show time series results for blade-root flapwise and edgewise bending moments for all computational results and experimental measurements for Tr02 and Tr03.
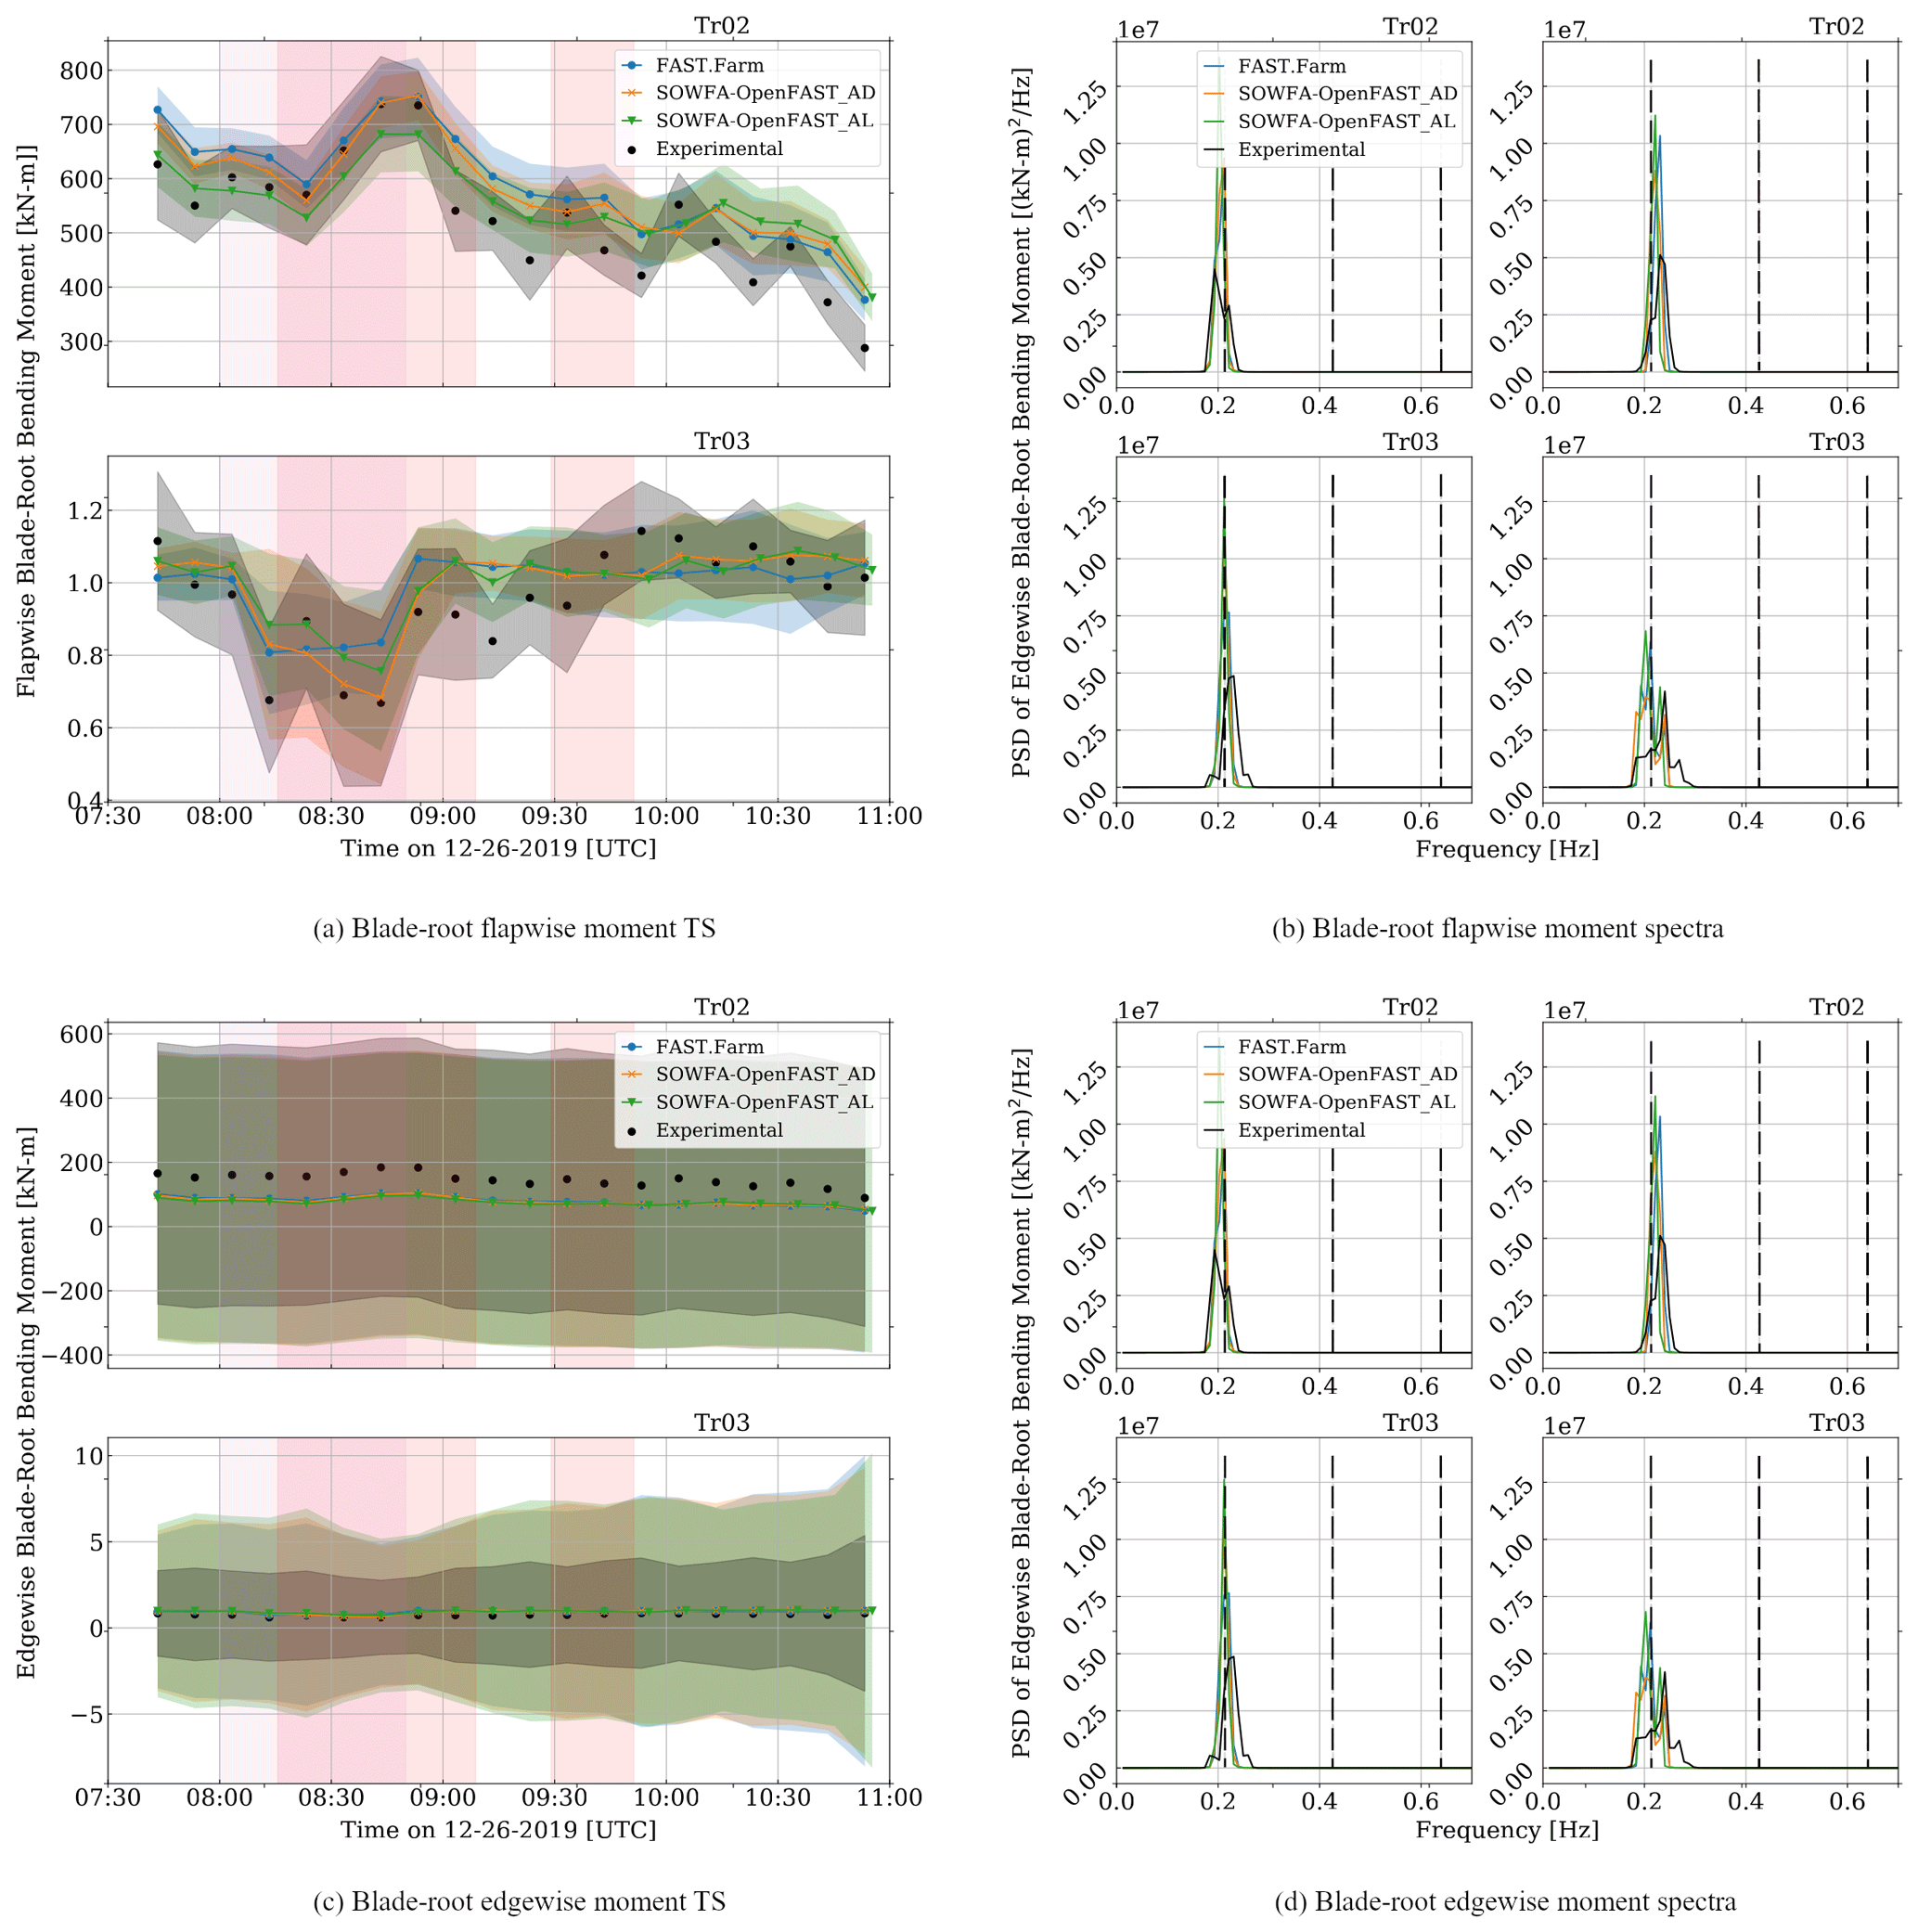
Figure 7Time series (a, c) and PSD (b, d) results for blade-root flapwise (a, b) and edgewise (c, d) bending moments for all computational methods and experimental results. The dots show 10 min averages, and bands extend to ±1 standard deviation (SD) from the mean. Results from Tr02 and Tr03 are shown in separate sub-figures. PSD results are shown for two 10 min time periods for each output channel, one with good agreement between experimental measurements and computational results (left sub-figures in b and d) and one with poorer agreement (right sub-figures in b and d). The vertical dashed lines indicate the 1P, 2P, and 3P frequencies based on the average SOWFA–OpenFAST_AD rotor speed. The vertical shaded regions are used to show when wake steering of more than ±10° is present (red) and when there is prominent waking of Tr03 (purple).
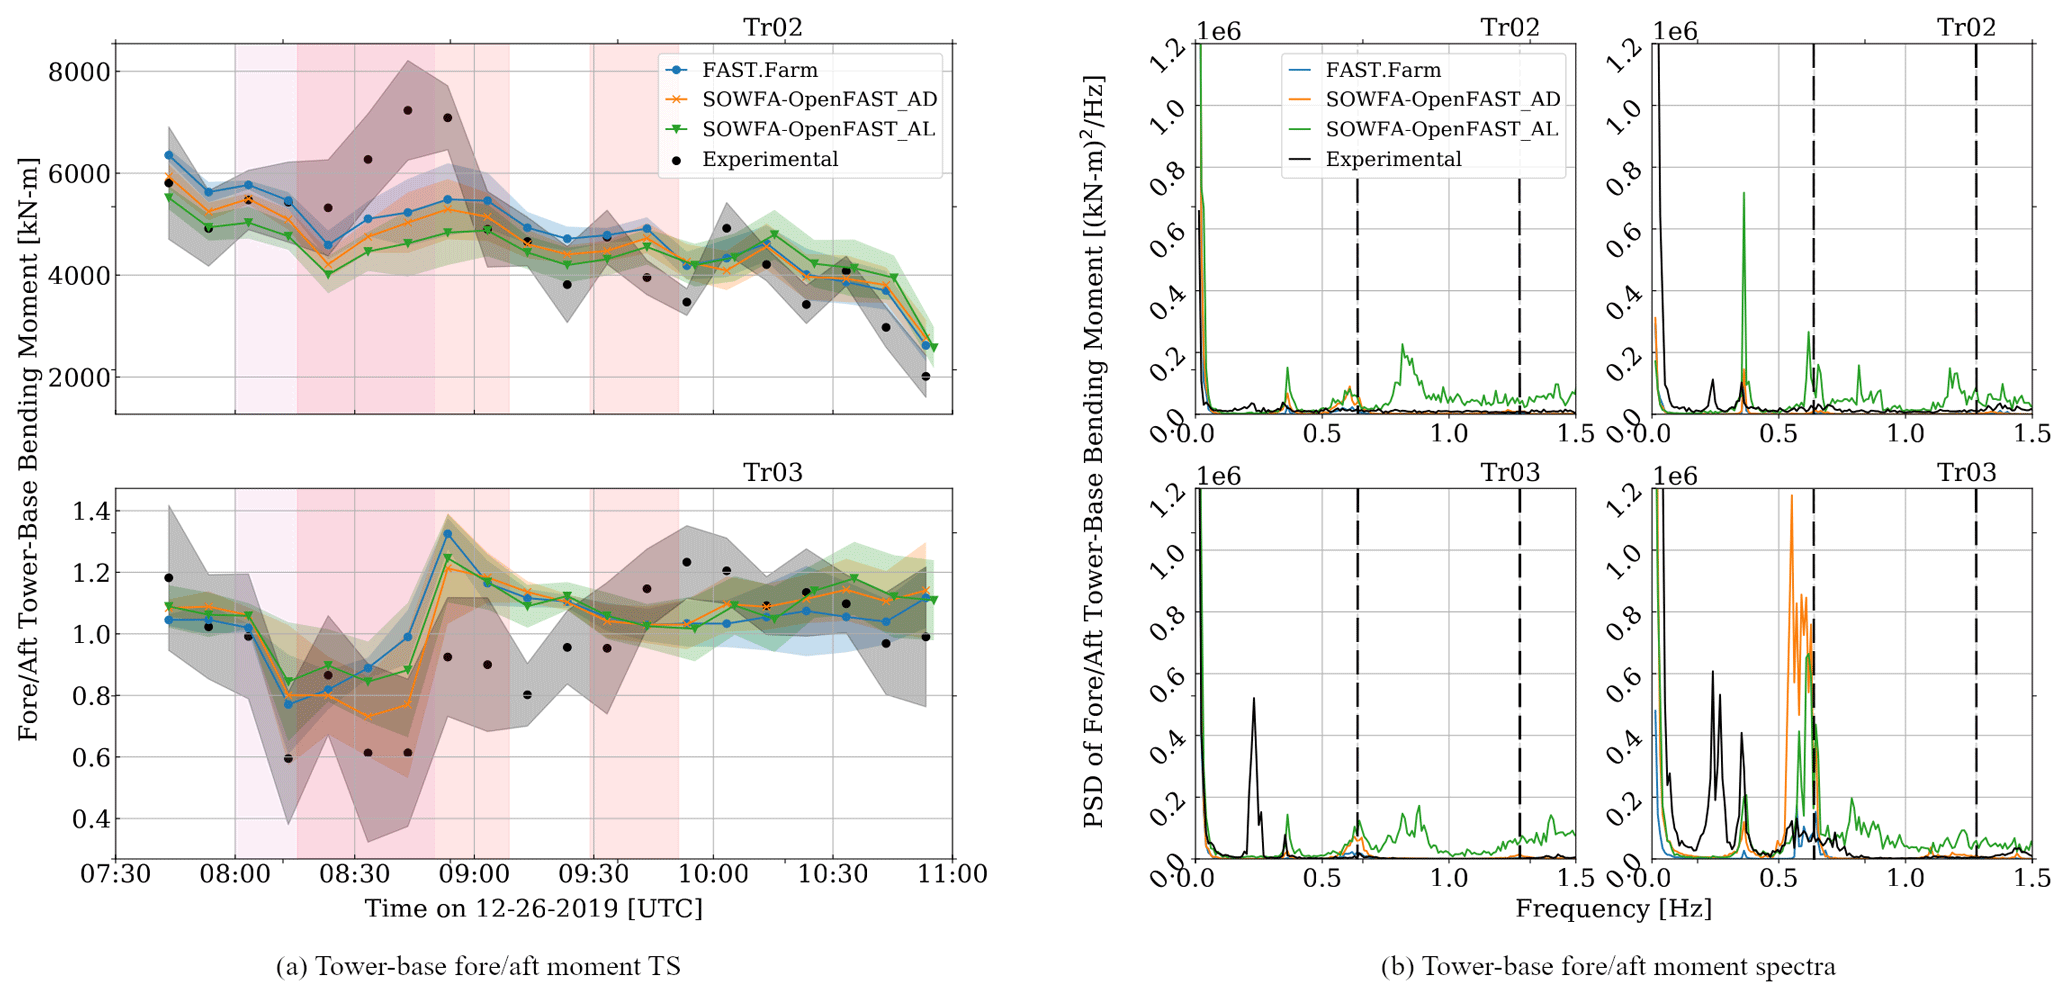
Figure 8Time series (a) and PSD (b) results of tower-base fore–aft bending moment for all computational methods and experimental results. The dots show 10 min averages, and bands extend to ±1 standard deviation from the mean. Results from Tr02 and Tr03 are shown in separate sub-figures. PSD results are shown for two 10 min time periods, one with good agreement between experimental measurements and computational results (left sub-figures in b) and one with poorer agreement (right sub-figures in b). The vertical dashed lines indicate the 3P and 6P frequencies based on the average SOWFA–OpenFAST_AD rotor speed. The vertical shaded regions are used to show when wake steering of more than ±10° is present (red) and when there is prominent waking of Tr03 (purple).
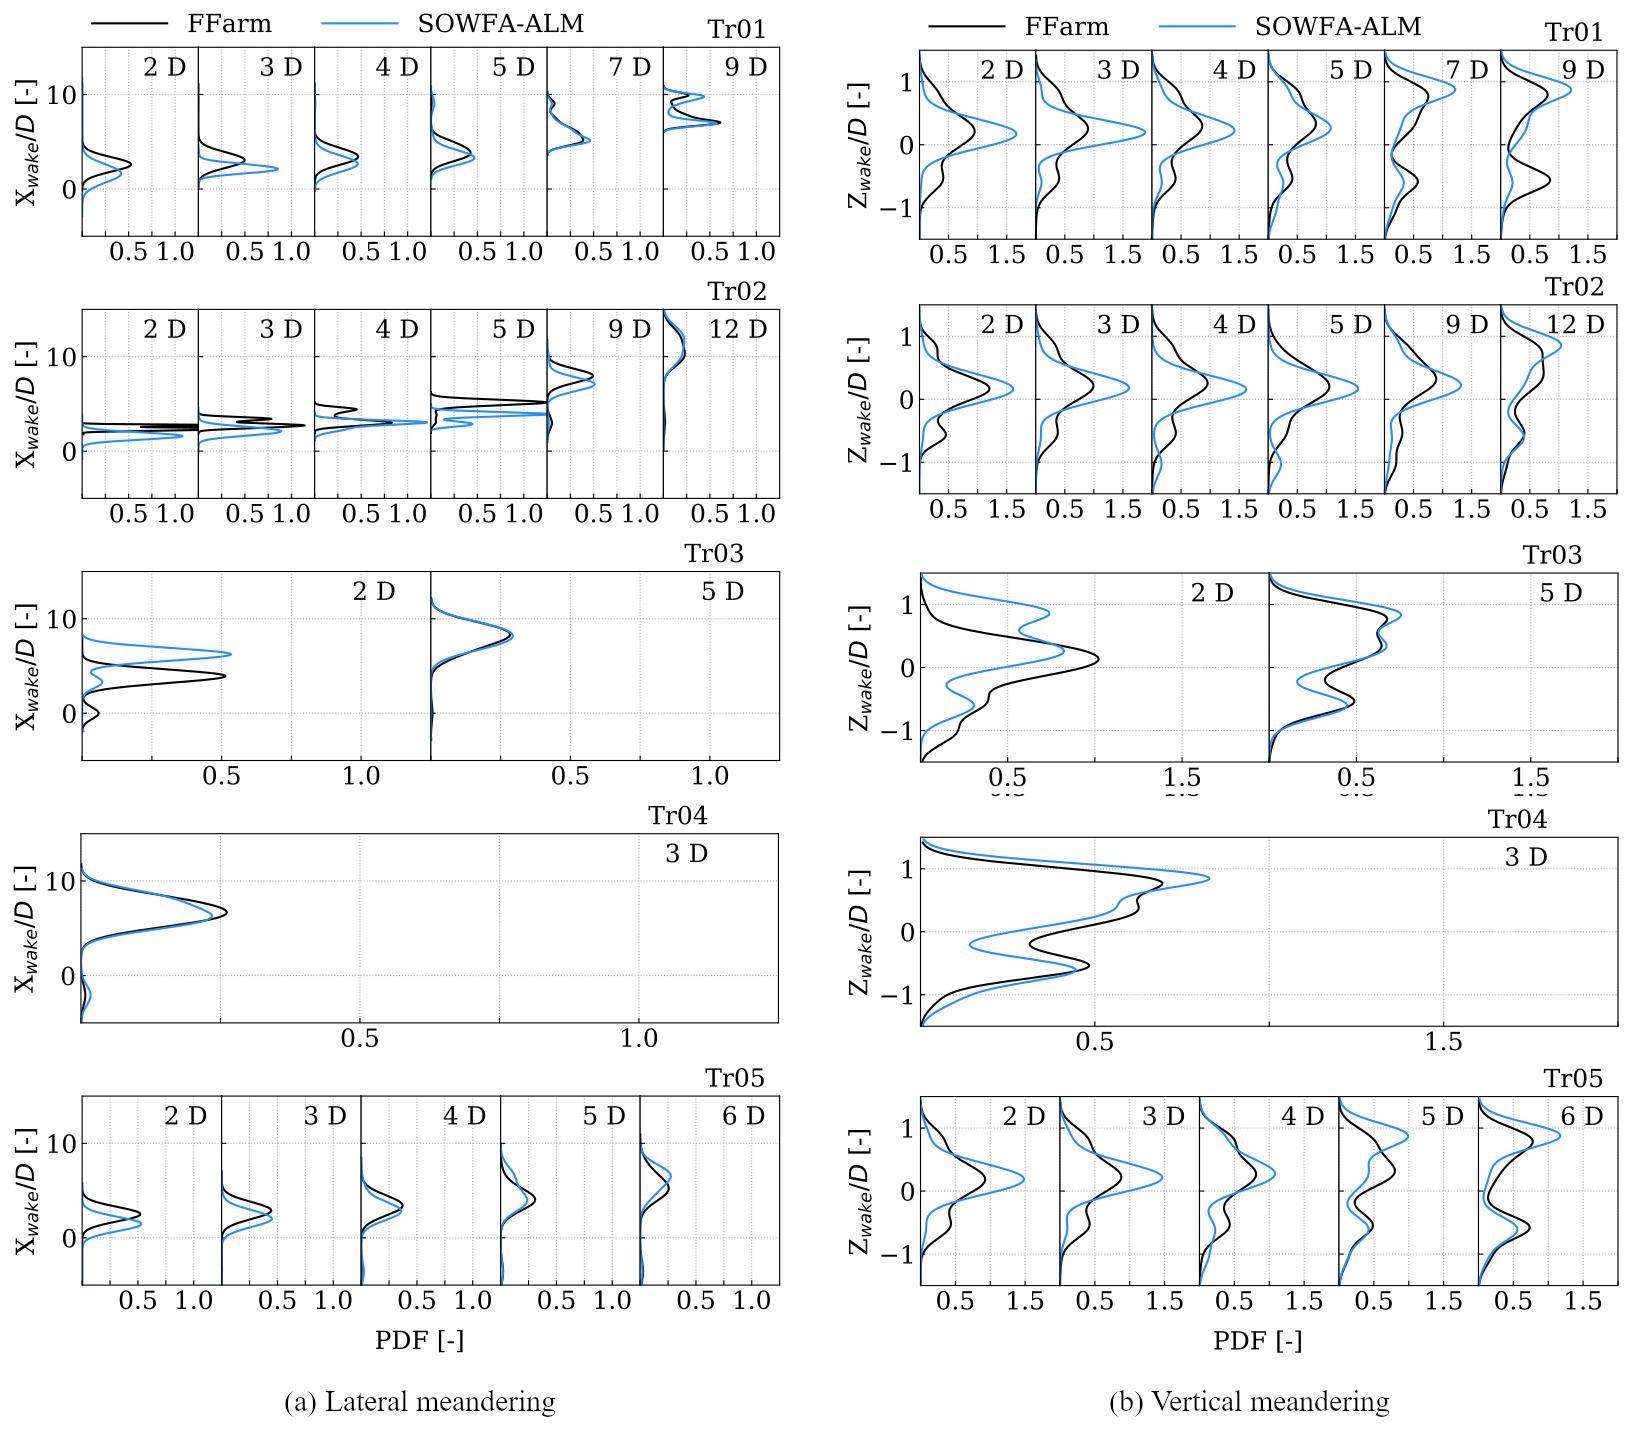
Figure 9PDF of the lateral (left panels) and vertical (right panels) wake center positions for all wind turbines during time periods without wake steering. Results are shown for FAST.Farm and SOWFA–ALM.
These results show strong agreement between all computational results and experimental measurements, for both the means and the standard deviations. Relative trends between the computational results are the same as for rotor power, with FAST.Farm predicting the highest loads at higher wind speeds and SOWFA–OpenFAST_AL predicting the highest loads at lower wind speeds. For the flapwise bending moment, the wake impact on Tr03 is clearly visible, with all normalized results reduced below 1, as well as increased standard deviations, which are generally picked up well by all computational models. The PSD responses for “good agreement” and “poorer agreement” time periods are shown in Fig. 7b and d. The good agreement time period was selected as a period where there was consistent time series agreement between the computational methods and experimental results near the end of the simulated time range, and the poorer agreement time period was selected as a period with consistent time series disagreement between the computational models and experimental results in the region with turbine waking. The results compare well for both wind turbines for the good agreement time period, with clear spikes in all results at the 1P frequency, though the computational results show higher spikes for both turbines. For the poorer agreement time period, the results are again comparable, but Tr03 shows much higher spectral content at 1P for the computational results and a spike near the 2P frequency for the SOWFA–OpenFAST results. This spike is likely caused by higher levels of computed turbulence at this frequency. Edgewise bending moments compare well for all results, for both the time series and the PSD results, which is expected considering the edgewise bending moment is dominated by gravity. For the good agreement PSD results, all computational results show consistent means and spectral content peaks at the 1P frequency. The computational results do show higher standard deviations for Tr03, which is likely due to differences in the turbine controllers for Tr02 and Tr03.
Figure 8a shows time series results for the tower-base fore–aft bending moment for all computational results and experimental measurements for Tr02 and Tr03.
Given the upstream position of Tr02, the Tr02 results indicate the accuracy of the models in capturing the atmospheric conditions. The time series computational results for Tr02 compare well with experimental measurements except in the region between 08:30–09:00 UTC, where all computational results are nearly 30 % lower than experimental measurements. This time period also corresponds to a region with sharply increasing wind speed, as shown in Fig. 2. As Tr03 is downstream of Tr02, the Tr03 results are more indicative of the accuracy of the models in capturing wake conditions. These results for Tr03, relative to Tr02, compare better than Tr02 results in the 08:30–09:00 UTC time period, with the effects of wake interaction captured by all computational methods. When comparing the PSD results in Fig. 8b, there is overall good agreement for the higher-frequency content, though SOWFA–OpenFAST_AL results tend to have higher spectral content. For experimental measurements, there is a clear spike at 0.2 Hz, which does not correspond to an nP frequency and is not present in any computational results. This spike is likely due to a rotor imbalance present in the actual wind turbine that is not captured in the turbine model. Additionally, during the poorer agreement time period, the SOWFA–OpenFAST results have much higher spectral content around the 3P frequency that is not present in the FAST.Farm or experimental results.
3.2 Wake center tracking
Lateral and vertical wake center tracking was performed for all wind turbines and separated into time periods with and without active wake steering. Shown in Fig. 9 are probability density function (PDF) distributions for the lateral and vertical wake center locations for each wind turbine at various downstream distances, relative to the wind turbine location (e.g., the results for Tr02 are relative to the location of Tr02).
Different wake positions are shown for each turbine based on the availability of information. Recall that Tr01, Tr02, and Tr05 are unwaked turbines, and Tr03 and Tr04 are waked by Tr02 under certain inflow wind directions. When comparing the lateral wake center positions in Fig. 9a, there is comparable agreement between the FAST.Farm and SOWFA–ALM results at all distances, though FAST.Farm tends to predict more wake deflection at lower downstream distances. A bimodal wake center position is captured for both methods at 9 D downstream of Tr01. This is due to the changing wind direction and resulting change in turbine yaw misalignment (ranging between +5 and −10°), which has a more pronounced impact on the wake location further downstream of the turbine and is seen developing by 5 D downstream of Tr01. As with Tr01 and Tr05, FAST.Farm tends to predict more wake deflection at lower downstream distances, though for Tr02 this persists farther downstream. Note that Tr03 and Tr04 are located 5 and 8 D downstream of Tr02, respectively. SOWFA–ALM results show more wake deflection than FAST.Farm results at 2 D downstream of Tr03; FAST.Farm is not expected to accurately model wakes in the near region, but rather, the near-wake model of FAST.Farm exists so as to more accurately model the far wake. Further downstream of Tr03, agreement between the computational methods is very good at 5 D downstream, as well as 3 D downstream of Tr04.
The vertical wake center position results in Fig. 9b are comparable to those of the lateral wake center position in terms of relative difference between computational approaches. The mean wake center position agrees well overall between the computational methods for all turbines and downstream locations, though discrepancies in standard deviation are observed more for Tr01 and Tr05 results, especially close to the rotor. There are also differences in the vertical meandering for Tr01 that grow with increasing downstream distance. Most notably, at 9 D downstream the FAST.Farm results have clear bimodal peaks, one below and one above the turbine hub height, whereas SOWFA–ALM results only show a peak above the turbine hub height.
Overall, though, there is strong agreement between the computational methods in the lateral and vertical wake center positions for all turbines, especially at downstream distances outside of the near-wake region or approximately more than 3 D downstream. FAST.Farm is expected to be inaccurate at distances less than 3 D downstream due to the near-wake correction used in the tool that is implemented to approximate the effect of pressure recovery on the far-wake solution.
The objective of this work was to assess the ability of FAST.Farm to accurately predict wind turbine loads and wake evolution in a small wind farm based on realistic atmospheric conditions, specifically a non-stationary stable boundary layer. This assessment was done via a three-way comparison between FAST.Farm simulations, high-fidelity SOWFA–OpenFAST simulations, and multi-turbine measurements from a subset of turbines within a full-scale wind farm, with the simulations driven by a high-fidelity LES precursor of a diurnal cycle derived from measurement-driven mesoscale-to-microscale coupling techniques. There is generally good agreement between the experimental measurements of turbine response in terms of power and loads with both computational methods. This agreement was shown for the time series response, where the trends and value ranges were captured, and the PSD response for certain periods of time. Overall, there is strong agreement between the computational methods in the lateral and vertical wake center positions for all turbines, especially at downstream distances outside of the near-wake region or approximately more than 3 D downstream. This finding demonstrates the importance and power of creating highly accurate atmospheric inflow conditions for use in validation studies.
Considering that FAST.Farm is much less computationally expensive than SOWFA–OpenFAST, this three-way validation effort provides further confidence to apply FAST.Farm to the calculation of wind turbine power production and structural loading in wind farm settings, including wake interactions between turbines.
OpenFAST and FAST.Farm are publicly available as open-source software accessible at https://github.com/OpenFAST/openfast (NREL, 2021a). SOWFA is publicly available as open-source software accessible at https://github.com/NREL/SOWFA (NREL, 2018).
The wind turbine and wind turbine model and measurement data are not publicly available. The source code repositories (see “Code availability”) contain open-source models for research purposes.
KS led the load and wake comparison studies and ran all FAST.Farm simulations. EQ led the inflow generation and SOWFA simulations and assisted with the experimental data post-processing. HI was involved in the experimental load campaign and assisted with the experimental data post-processing. JJ supervised the validation effort. KS prepared the article with support from EQ, HI, and JJ.
The contact author has declared that none of the authors has any competing interests.
The views expressed in the article do not necessarily represent the views of the DOE or the US Government.
Publisher's note: Copernicus Publications remains neutral with regard to jurisdictional claims made in the text, published maps, institutional affiliations, or any other geographical representation in this paper. While Copernicus Publications makes every effort to include appropriate place names, the final responsibility lies with the authors.
The research was performed using computational resources sponsored by the DOE's Office of Energy Efficiency and Renewable Energy and located at the National Renewable Energy Laboratory.
This research has been supported by the National Renewable Energy Laboratory (contract no. DE-AC36-08GO28308). Funding was provided by the US Department of Energy Office of Energy Efficiency and Renewable Energy Wind Energy Technologies Office.
This paper was edited by Sandrine Aubrun and reviewed by two anonymous referees.
Asmuth, H., Navarro Diaz, G. P., Madsen, H. A., Branlard, E., Myer Forsting, A. R., Nilsson, K., Jonkman, J., and Ivanell, S.: Wind Turbine Response in Waked Inflow: A Modelling Benchmark Against Full-Scale Measurements, Renew. Energy, 191, 868–887, https://doi.org/10.1016/j.renene.2022.04.047, 2022. a
Doubrawa, P., Quon, E. W., Martinez-Tossas, L. A., Shaler, K., Debnath, M., Hamilton, N., Herges, T. G., Maniaci, D., Kelley, C. L., Hsieh, A. S., Blaylock, M. L., van der Laan, P., Andersen, S. J., Krueger, S., Cathelain, M., Schlez, W., Jonkman, J., Branlard, E., Steinfield, G., Schmidt, S., Blondel, F., Lukassen. L. J., and Moriarty, P.: Multi-Model Validation of Single Wakes in Neutral and Stratified Atmospheric Conditions, Wind Energy, 23, 2027–2055, https://doi.org/10.1002/(ISSN)1099-1824, 2020. a, b, c, d
Fleming, P., King, J., Dykes, K., Simley, E., Roadman, J., Scholbrock, A., Murphy, P., Lundquist, J. K., Moriarty, P., Fleming, K., van Dam, J., Bay, C., Mudafort, R., Lopez, H., Skopek, J., Scott, M., Ryan, B., Guernsey, C., and Brake, D.: Initial results from a field campaign of wake steering applied at a commercial wind farm – Part 1, Wind Energ. Sci., 4, 273–285, https://doi.org/10.5194/wes-4-273-2019, 2019. a
Fleming, P., King, J., Simley, E., Roadman, J., Scholbrock, A., Murphy, P., Lundquist, J. K., Moriarty, P., Fleming, K., van Dam, J., Bay, C., Mudafort, R., Jager, D., Skopek, J., Scott, M., Ryan, B., Guernsey, C., and Brake, D.: Continued results from a field campaign of wake steering applied at a commercial wind farm – Part 2, Wind Energ. Sci., 5, 945–958, https://doi.org/10.5194/wes-5-945-2020, 2020. a, b
Ivanov, H., Dana, S., and Doubrawa, P.: Loads Response That is Due to Wake Steering on a Pair of Utility-Scale Wind Turbines, Tech. Rep. NREL/TP-5000-79187, National Renewable Energy Laboratory, Golden, CO, https://www.nrel.gov/docs/fy21osti/79187.pdf (last access: 15 June 2024), 2021. a
Jonkman, J. and Shaler, K.: FAST.Farm User's Guide and Theory Manual, Tech. Rep. NREL/TP-5000-78485, National Renewable Energy Laboratory, Golden, CO, https://www.nrel.gov/docs/fy21osti/78485.pdf (last access: 15 June 2024), 2021. a, b
Jonkman, J., Doubrawa, P., Hamilton, N., Annoni, J., and Fleming, P.: Validation of FAST.Farm Against Large-Eddy Simulations, in: TORQUE 2018, EAWE, Milano, Italy, 20–22 June 2018, http://iopscience.iop.org/article/10.1088/1742-6596/1037/6/062005 (last access: 15 June 2024), 2018. a, b
Kretschmer, M., Jonkman, J., Pettas, V., and Cheng, P. W.: FAST.Farm load validation for single wake situations at alpha ventus, Wind Energ. Sci., 6, 1247–1262, https://doi.org/10.5194/wes-6-1247-2021, 2021. a
Larsen, G. C., Madsen, H. A., Thomsen, K., and Larsen, T. J.: Wake Meander: A Pragmatic Approach, Wind Energy, 11, 337–395, https://doi.org/10.1002/we.267, 2008. a
1 NREL: SOWFA, Version 2.0.0, GitHub [code], https://github.com/NREL/SOWFA (last access: 15 June 2024), 2018.
NREL: OpenFAST, Version 3.0.0, GitHub [code], https://github.com/OpenFAST/openfast (last access: 15 June 2024), 2021a. a
NREL: ROSCO, Version 2.4.1, GitHub [code], https://github.com/NREL/ROSCO (last access: 15 June 2024), 2021b. a
Quon, E.: SAMWICH Wake-Tracking Toolbox, GitHub [code], https://github.com/ewquon/waketracking (last access: 15 June 2024), 2017. a
Quon, E.: Measurement-driven large-eddy simulations of a diurnal cycle during a wake-steering field campaign, Wind Energ. Sci., 9, 495–518, https://doi.org/10.5194/wes-9-495-2024, 2024. a, b, c, d, e, f, g
Quon, E., Doubrawa, P., and Debnath, M.: Comparison of Rotor Wake Identification and Characterization Methods for the Analysis of Wake Dynamics and Evolution, J. Phys.: Conf. Ser., 1452, 012070, https://doi.org/10.1088/1742-6596/1452/1/012070, 2019. a
Shaler, K. and Jonkman, J.: FAST.Farm Development and Verification of Structural Load Predictions Against Large Eddy Simulations, Wind Energy, 24, 428–449, https://doi.org/10.1002/we.2581, 2021. a
Shaler, K., Jonkman, J., Doubrawa, P., and Hamilton, N.: FAST.Farm Response of Varying Wind Inflow Techniques, in: AIAA SciTech Forum, 37th Wind Energy Symposium, AIAA, 7–11 January 2019, San Diego, CA, https://doi.org/10.2514/6.2019-2086, 2019. a
Shaler, K., Debnath, M., and Jonkman, J.: Validation of FAST.Farm Against Full-Scale Turbine SCADA Data for a Small Wind Farm, J. Phys.: Conf. Ser., 1618, 062061, https://doi.org/10.1088/1742-6596/1618/6/062061, 2020. a, b, c