the Creative Commons Attribution 4.0 License.
the Creative Commons Attribution 4.0 License.
 | 16 Sep 2024
Investigating the interactions between wakes and floating wind turbines using FAST.Farm
Jason Jonkman
Regis Thedin
As floating offshore wind progresses to commercial maturity, wake and array effects across a farm of floating offshore wind turbines (FOWTs) will become increasingly important. While wakes of land-based and bottom-fixed offshore wind turbines have been extensively studied, only recently has this topic become relevant for floating turbines. This work presents an investigation of the mutual interaction between the motions of floating wind turbines and wakes using FAST.Farm. While FAST.Farm has been extensively validated across a wide range of conditions, it has never been validated for FOWT applications. Hence, in the first part of this work, we validate FAST.Farm by comparing simulations of a single FOWT against high-fidelity results from large-eddy simulations available in the literature. The validation is based on wake meandering, mean wake deflection, and velocity deficit at different downstream locations. This validation showed that the original axisymmetric (polar) wake model of FAST.Farm overpredicts the vertical wake deflection induced by shaft tilt and floater pitch, while the new curled wake model is capable of properly capturing the vertical wake deflection. In the second part, we use FAST.Farm to analyze a small three-unit array of FOWTs with a spacing of 7 diameters across a wide range of environmental conditions. The same National Renewable Energy Laboratory 5 MW reference wind turbine atop the OC4-DeepCwind semisubmersible is adopted for the three FOWTs and for the validation against high-fidelity simulations. To assess the effect of the floating substructure, we compare the power production, tower-base moments, and blade-root moments obtained for the floating turbines with the results obtained in a fixed-bottom configuration. The main differences introduced by the floating substructure are the motions induced by the waves, the change in the natural frequencies of the tower caused by differences in the boundary condition at its base, and the larger vertical deflection of the wake deficit due to the mean pitch of the platform. The impact of these differences, as well as other minor effects, are analyzed in detail.
- Article
(3531 KB) - Full-text XML
- BibTeX
- EndNote


This work was authored by the National Renewable Energy Laboratory, operated by the Alliance for Sustainable Energy, LLC, for the U.S. Department of Energy (DOE) under Contract No. DE-AC36-08GO28308. Funding provided by the U.S. Department of Energy Office of Energy Efficiency and Renewable Energy Wind Energy Technologies Office. The views expressed in the article do not necessarily represent the views of the DOE or the U.S. Government. The U.S. Government retains and the publisher, by accepting the article for publication, acknowledges that the U.S. Government retains a nonexclusive, paid-up, irrevocable, worldwide license to publish or reproduce the published form of this work, or allow others to do so, for U.S. Government purposes.
Floating offshore wind turbines (FOWTs) are a promising solution to harness the vast wind resources located at water depths that cannot be exploited by bottom-fixed turbines (GWEC, 2023). Currently, floating wind applications are transitioning from single-turbine installations to arrays of a few turbines, as exemplified by the Hywind Scotland (five 6 MW turbines, installed in 2017) (Equinor, 2023), the WindFloat Atlantic (three 8 MW turbines, installed in 2020) (Ocean Winds, 2023), and the Hywind Tampen (11 8 MW turbines, installed in 2023) (Equinor, 2024) projects. Larger-scale floating farms are expected in the near future (GWEC, 2023). As floating wind transitions to arrays with multiple units, understanding the wakes and array effects of floating turbines is becoming increasingly relevant for design and the associated needs of numerical modeling and design tools.
The wake is a region of reduced wind speed and increased turbulence intensity that forms downstream of the rotor as the turbine extracts kinetic energy from the incoming wind. Wake effects, which have been studied extensively for land-based and bottom-fixed offshore wind turbines, impact power production and increase structural loads for downwind units (Thomsen and Sørensen, 1999; Kim et al., 2015; Shaler et al., 2022). However, due to the floating substructure and the coupling between motions and aerodynamic loads, the wake of an FOWT may behave differently from that of a fixed turbine. Given that this topic has become relevant only recently, the mutual effects between FOWT motions and wakes are still not fully understood.
Previous works have studied the impact of the motions of a single FOWT on power production, showing that the upwind–downwind motion of the rotor from wave excitation can increase mean power production (Sant et al., 2015; Wen et al., 2017, 2018; Huang and Wan, 2019; Johlas et al., 2021) and that the mean pitch of the floater caused by rotor thrust reduces power production by increasing the relative angle between the rotor and the incoming wind (Johlas et al., 2021, 2022). The latter is similar to the reduction observed for a yawed turbine (Fleming et al., 2015). While the power performance of a single floating turbine compared to a fixed-bottom turbine is mostly given by the balance between those two opposing effects, the performance of floating arrays also depends on how the wakes of floating turbines behave, which may differ compared to those of fixed-bottom units.
Some studies have analyzed the wakes of FOWTs using high-fidelity simulations. Johlas et al. (2019) performed large-eddy simulations (LESs) – using coupled Simulator fOr Wind Farm Applications (SOWFA)–OpenFAST (Churchfield and Lee, 2015; Jonkman et al., 2023) simulations implemented through an actuator line method – of a single National Renewable Energy Laboratory (NREL) 5 MW reference wind turbine atop the OC3-Hywind spar to compare the downstream wake characteristics against simulations of an equivalent fixed-bottom turbine. They considered two different inflows and two different sea states, concluding that the floating substructure affects the wake by (i) a larger upward vertical deflection of the wake deficit due to mean platform pitch, an effect that is similar to the horizontal wake deflection caused by rotor yaw, and (ii) larger wake fluctuations and wake-induced turbulence. This increase in wake fluctuations and wake-induced turbulence observed for the floating turbines, however, was small. In subsequent work, Johlas et al. (2020) expanded their analysis to assess the impact of floating platform types on the wake of a FOWT, analyzing the same NREL 5 MW reference wind turbine atop the OC3-Hywind spar and atop the OC4-DeepCwind semisubmersible. They showed that the OC3-Hywind spar presents a larger vertical wake deflection due to a larger mean pitch and that the vertical deflection is more important for the stable atmosphere boundary layer condition than for the neutral atmosphere condition analyzed in their work. They also concluded that the rotor motions did not significantly affect the middle- to far-wake fluctuations, which were more noticeable in the stable atmosphere condition due to low turbulence levels.
The low impact of rotor motions on the wake fluctuations reported by Johlas et al. (2019, 2020) agrees with wind tunnel experiments (Schliffke et al., 2020) and field observations (Angelou et al., 2023). Other experiments and high-fidelity simulations considering laminar or low-turbulence inflow indicate that the rotor motions do influence wake dynamics and recovery (Rockel et al., 2017; Fu et al., 2019; Li et al., 2022; Messmer et al., 2024), but these effects seem to be negligible for moderate to high atmospheric turbulence levels.
While experiments and high-fidelity simulations are important to understand the physical mechanisms that differentiate the wakes of FOWTs from bottom-fixed turbines, their high economic and computational cost restricts analyses to only a limited number of different test cases. On the other hand, engineering-fidelity tools like FAST.Farm (Jonkman et al., 2017; Jonkman and Shaler, 2021) present a good balance between fidelity and computational cost, thus allowing for analyses of hundreds of test cases within a reasonable time frame and cost. FAST.Farm is an open-source, mid-fidelity, multiphysics, nonlinear, time domain engineering tool developed by NREL for predicting the power performance and structural loads of wind turbines, including FOWTs, within a wind farm. FAST.Farm uses NREL's OpenFAST wind turbine simulation tool to solve the aero-hydro-servo-elastic dynamics of each individual (floating offshore) wind turbine but considers additional physics for farm-wide ambient inflow, farm-level control, wake evolution and convection including meandering, and wake merging. The software is based on some of the principles of the dynamic wake meandering model (Larsen et al., 2008), including passive tracer modeling of meandering, but it addresses many of the limitations of previous dynamic wake meandering implementations such as wake overlap and wake merging (a complete list of the previous dynamic wake meandering limitations addressed in FAST.Farm is given in Jonkman et al., 2017).
FAST.Farm has been validated and successfully applied to bottom-fixed turbines. Jonkman et al. (2018) validated FAST.Farm against high-fidelity LESs from the Simulator fOr Wind Farm Applications (SOWFA) for various cases, showing accurate predictions of thrust and power in both single-turbine and small wind farm scenarios; of wake meandering across different atmospheric conditions; and of averaged wake deficit advection, evolution, and merging effects. Kretschmer et al. (2021) validated FAST.Farm in single-wake conditions using data from the Alpha Ventus offshore wind farm, presenting good predictions for power and structural loads. They also demonstrated the importance of a wake-added turbulence model to improve the accuracy of fatigue load prediction, particularly for low ambient turbulence conditions and for tower-base loading. Shaler et al. (2022) employed FAST.Farm to investigate the impact of wake steering on wind farm loads. They concluded that while wake steering does not significantly affect ultimate loads – because wake steering is typically applied below rated wind speeds – it does increase fatigue of loads such as blade-root and shaft bending. Nevertheless, this fatigue increase leads to more uniform damage distribution across the array, which might be beneficial for planning maintenance over the long term. Thedin et al. (2024) also used FAST.Farm to investigate wake steering, focusing on the trade-off between power production and fatigue loading for a small wind farm. They concluded that configurations with positive yaw of the nacelle are preferred, even for negative wind inflows, due to significantly lower fatigue loads compared to negative yaw angles.
For floating wind applications, Wise and Bachynski (2020) used FAST.Farm to simulate a two-turbine array with different floater concepts (a semisubmersible, a spar, and a tension leg platform) and investigate wake meandering, motions of the floating substructure, and fatigue loads of the tower and blades. They showed that wake meandering has a secondary effect on surge and pitch motions of the floater but a significant influence on the tower-top yaw moment and, consequently, yaw motions. The results also showed that mooring loads were sensitive to wake deficit but not meandering. The different floater concepts presented distinct behavior concerning tower-base fore–aft bending moment, which was attributed to the distinct tower natural frequencies of each concept. Rivera-Arreba et al. (2023a) employed FAST.Farm to study the impact of vertical wake deflection on the power performance of a waked floating turbine, while Rivera-Arreba et al. (2023c) performed a similar investigation on the effect of atmospheric stability. Both works demonstrated the importance of vertical wake deflection for the power production and structural response of waked turbines. Rivera-Arreba et al. (2023b) compared the results obtained with FAST.Farm against LES results of the International Energy Agency 15 MW reference turbine (Gaertner et al., 2020) under different misalignment angles in yaw and tilt. All these works that applied FAST.Farm to FOWTs considered the polar wake formulation, with Rivera-Arreba et al. (2023b) reporting difficulties in matching the vertical and horizontal wake deflection concurrently by calibrating model inputs – in particular, the size of the polar grid used to calculate the spatially averaged velocity adopted to propagate the wake.
This work aims to investigate the mutual interaction between the motions of floating wind turbines and wakes. To do so, we use FAST.Farm to analyze a small three-unit FOWT array across a wide range of environmental conditions, including variations in mean hub-height wind speed (below, at, and above rated), shear profile (low to high shear), turbulence intensity (low to high turbulence levels), and sea state severity (mild, medium, and severe). Due to the large number of simulations required (648 different simulations), FAST.Farm is well suited for this kind of study because it presents a good balance between fidelity and computational cost. The same NREL 5 MW reference wind turbine (Jonkman et al., 2009) atop the OC4-DeepCwind semisubmersible (Robertson et al., 2014) is adopted for the three FOWTs. To assess the effect of the floating substructure, we compare the power production, tower-base moments, and blade-root moments obtained for the floating turbines with the results obtained from an equivalent fixed-bottom configuration.
Even though FAST.Farm has been validated in several projects across a wide range of conditions, it has never been validated for FOWT applications. Hence, before analyzing the floating array, we first compare FAST.Farm simulations of a single FOWT – also employing the NREL 5 MW reference wind turbine atop the OC4-DeepCwind semisubmersible – against high-fidelity results from LES reported by Johlas et al. (2020). The validation is based on wake meandering, mean wake deflection, and velocity deficit at different downstream locations. In particular, we demonstrate that the issue with the vertical wake deflection reported by Rivera-Arreba et al. (2023b) can be solved by adopting the curled wake model that was recently implemented in FAST.Farm (Branlard et al., 2023) instead of the original polar wake model.
This section describes the FOWT, wind farm, and FAST.Farm model considered in this work, as well as the methodology adopted to post-process the simulation results. Throughout this work, we adopt a coordinate system with origin at the intersection between the mean water level and the undisplaced tower axis, with the x axis aligned with the nominal wind and wave directions, the z axis directed upwards, and the y axis following from the right-hand rule.
2.1 Floating offshore wind turbine and farm
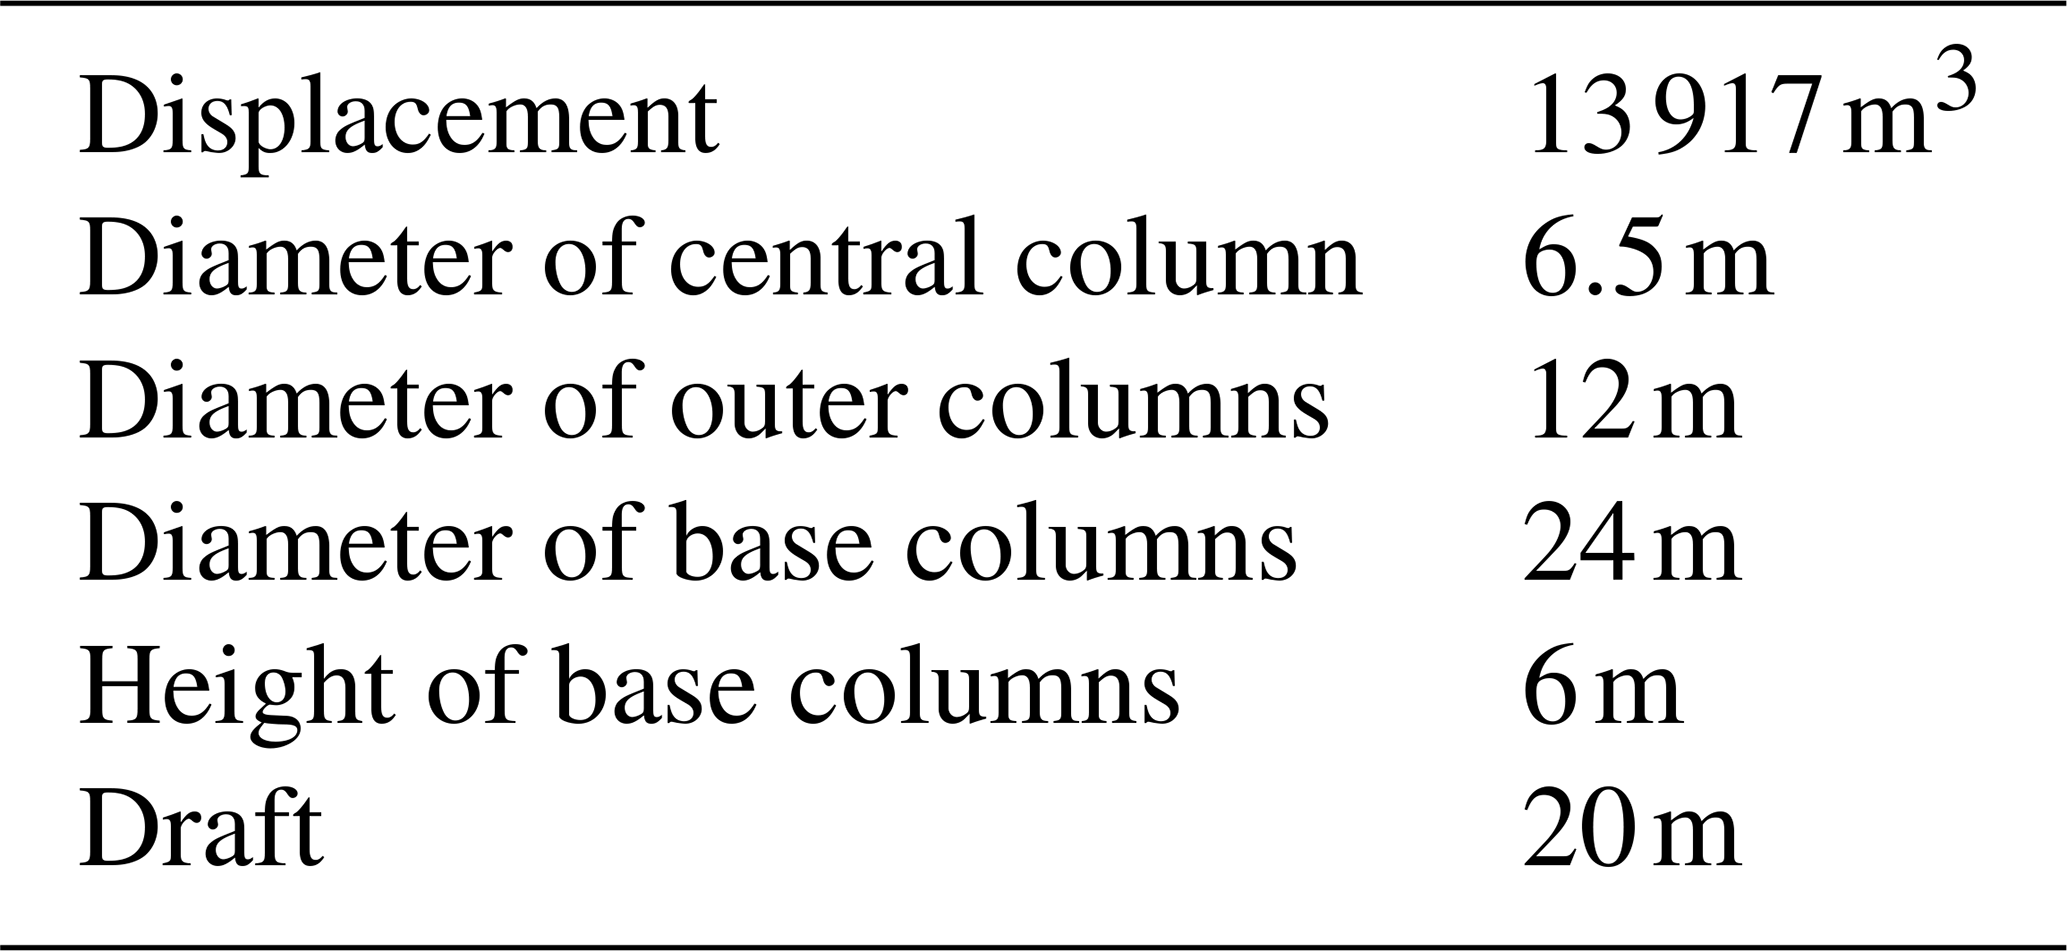
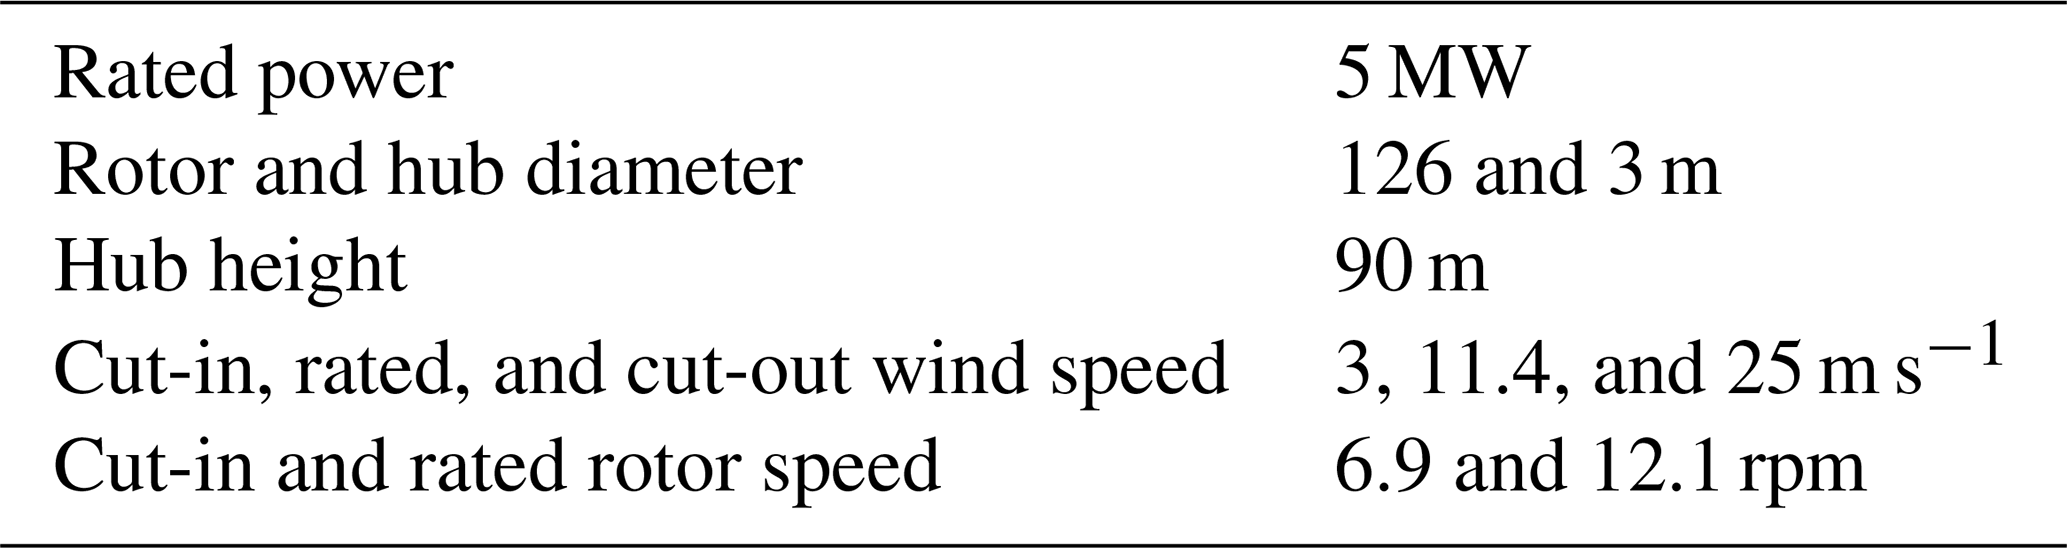
The OC4-DeepCwind semisubmersible (Robertson et al., 2014) consists of a 6.5 m diameter central column connected to three 12 m diameter external columns arranged as an equilateral triangle, with a draft of 20 m. A 24 m diameter and 6 m high column is attached to the base of each external column to help suppress motions, similar to heave plates. The NREL 5 MW reference turbine (Jonkman et al., 2009) is located atop the tower, which is positioned atop the central column. The main properties of the semisubmersible and of the turbine are summarized in Tables 1 and 2, respectively. For the three-unit array, the turbines are aligned along the global x axis with a spacing of 7 D (882 m), where D is the rotor diameter.
The platform is moored using three catenary lines. The fairleads are located at the top of the base columns, at a depth of 14 m and at a radius of 40.9 m from the platform centerline. The anchors are located at a water depth of 200 m and at a radius of 837.6 m from the platform centerline. The natural periods and frequencies of the moored FOWT are presented in Table 3. Note that the frequency of the first tower fore–aft bending mode reported in Table 3 of 0.426 Hz corresponds to the tower atop the OC4-DeepCwind platform. This frequency is higher than the value of 0.324 Hz obtained for a tower cantilevered to the ground, as reported by Jonkman et al. (2009), due to the different boundary condition (tower clamped to a floating substructure). Also, the natural frequencies of surge, heave, pitch, and yaw were obtained from decay tests around the undisplaced body position in the absence of wind; the values for the FOWT with mean aerodynamic thrust loads may be slightly different due to changes in the mooring system for different offsets.
An illustration of the floating turbine is given in Fig. 1. For simplicity, all the simulations analyzed in this work consider the turbines to be aligned with the mean wind direction (i.e., no mean yaw error other than small dynamic yaw errors resulting from floater yaw motion).
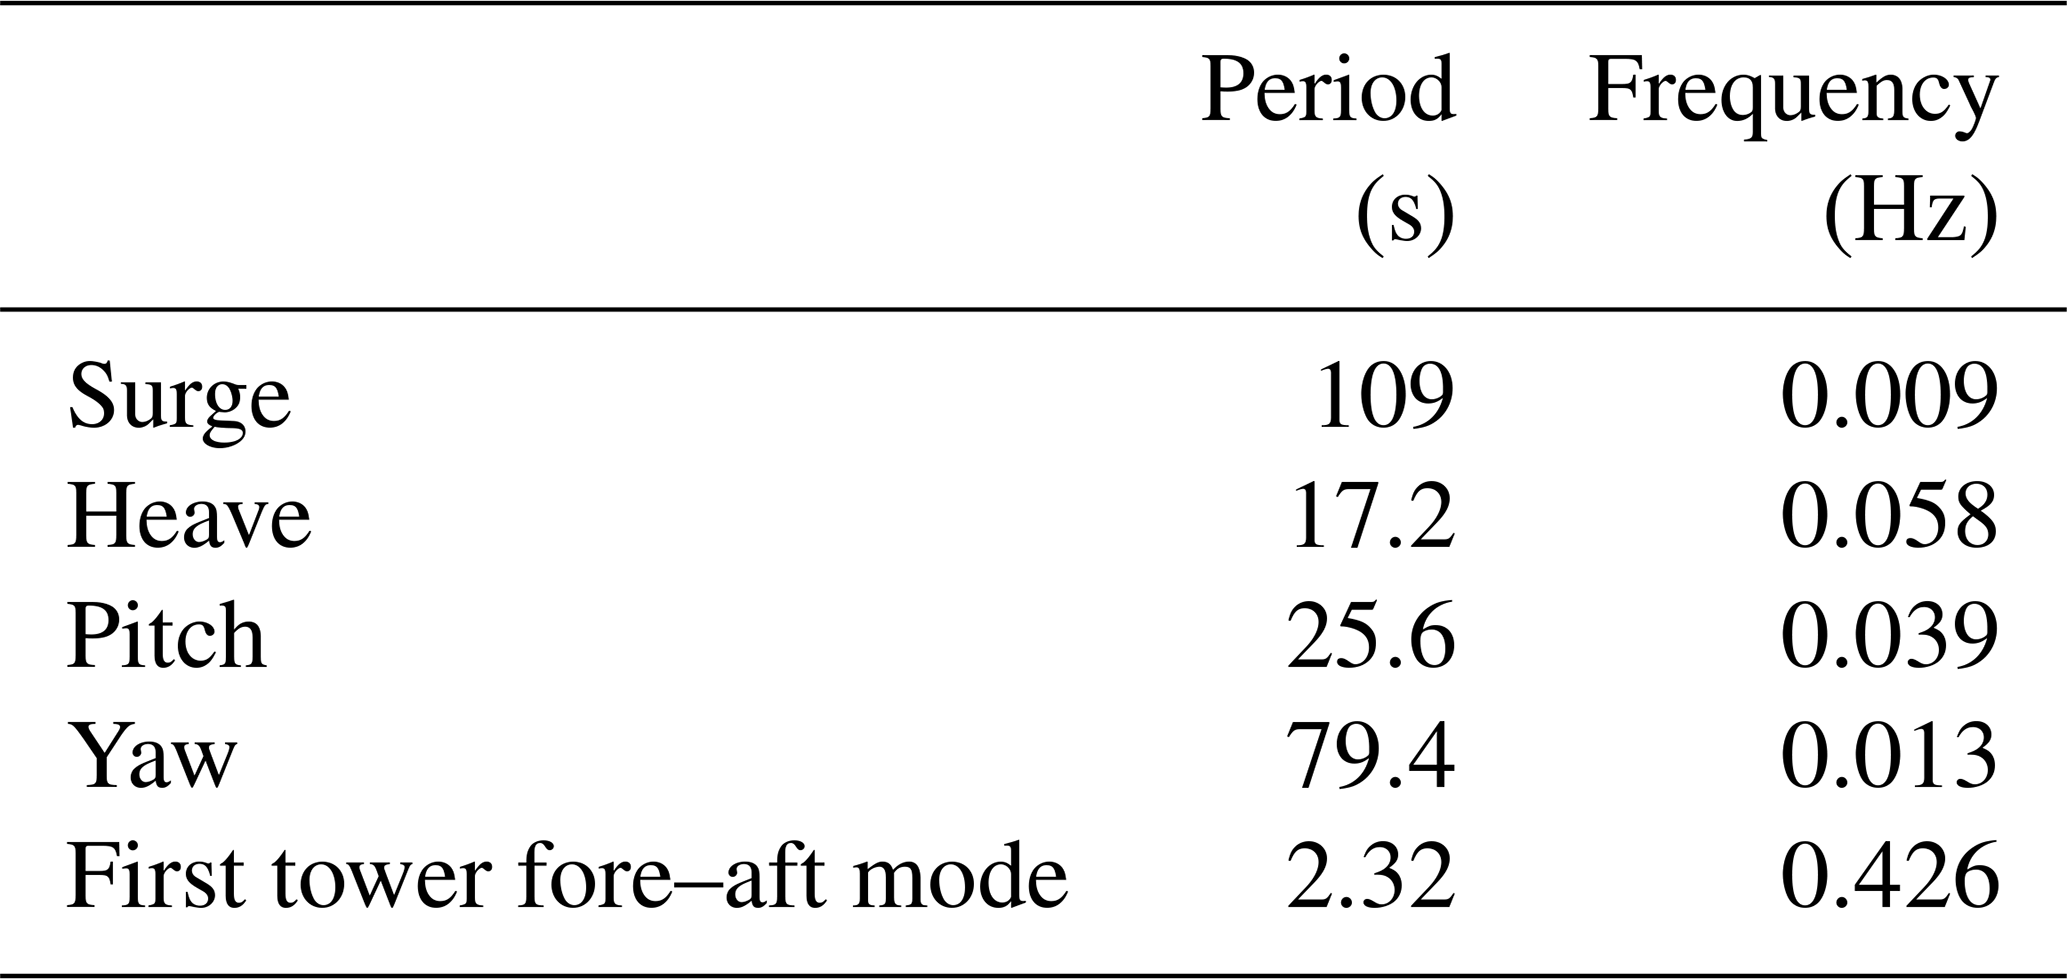
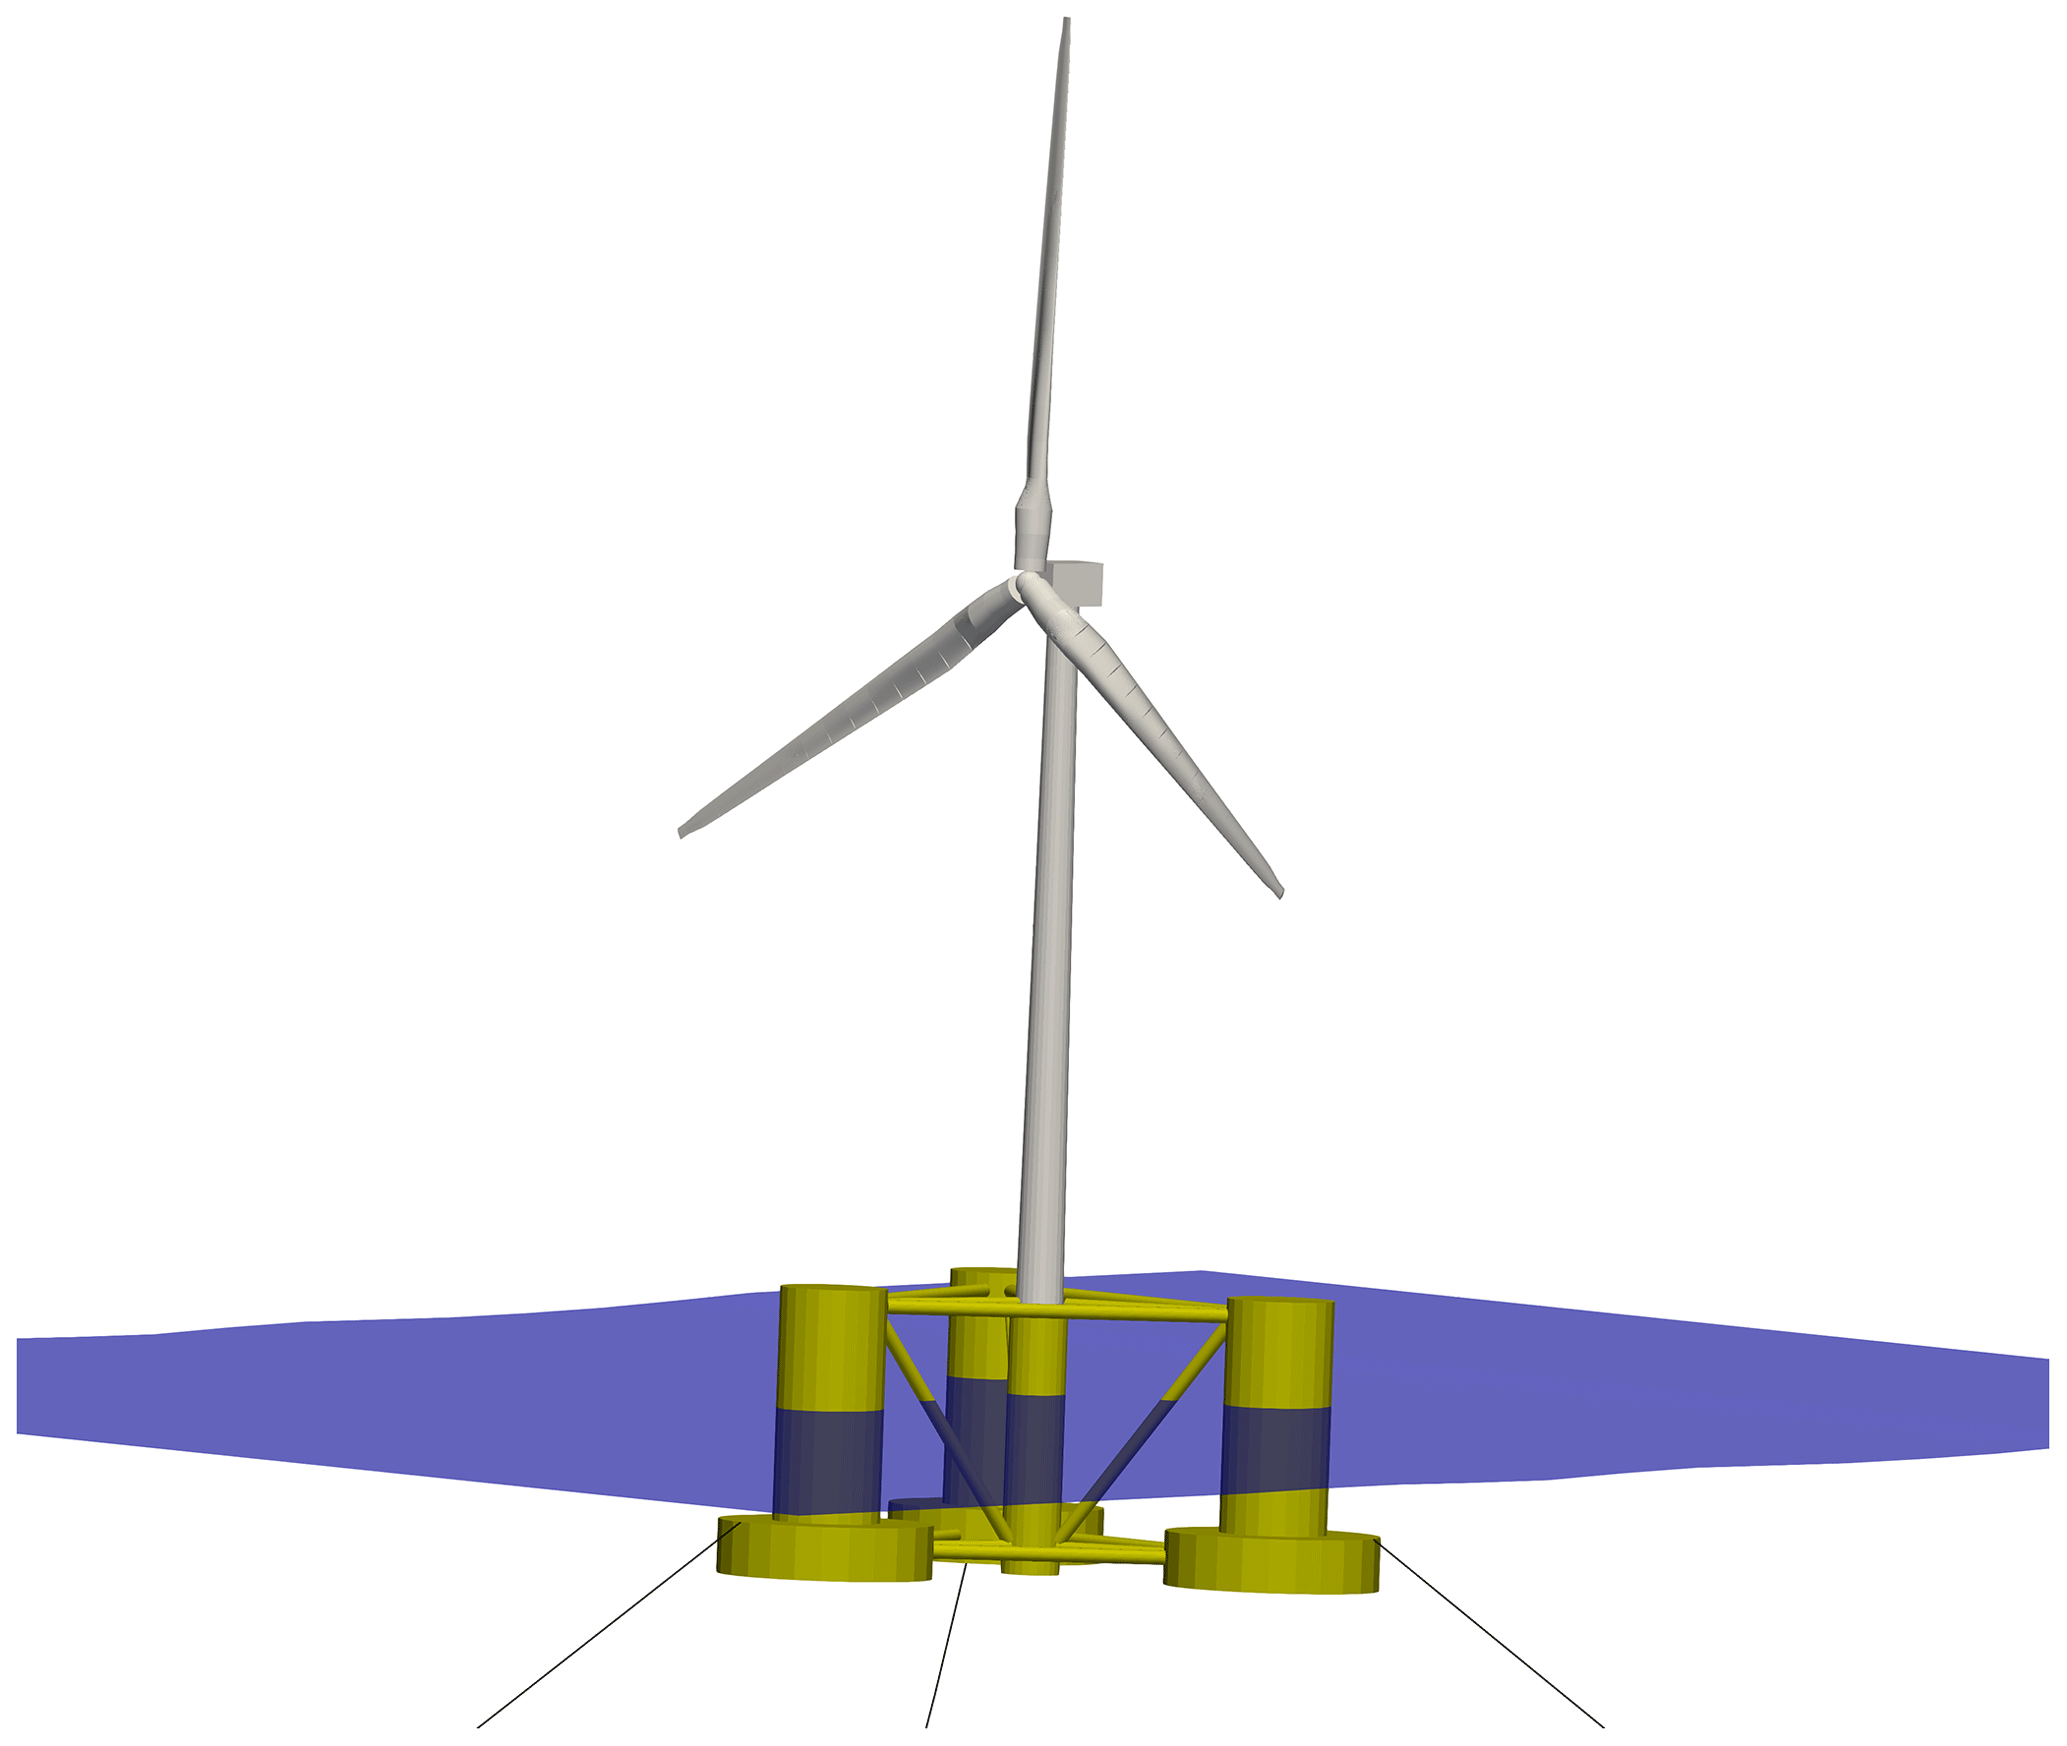
Figure 1Illustration of the NREL 5 MW reference turbine atop the OC4-DeepCwind semisubmersible.
2.2 Environmental conditions
Due to the two different objectives of this work, we consider two different sets of environmental conditions: one for the validation against high-fidelity simulations and another for the analysis of the three-turbine array.
2.2.1 For the validation against high-fidelity simulations
The validation against high-fidelity results from LESs is based on one of the environmental conditions analyzed by Johlas et al. (2020). They generated the inflow using a precursor atmospheric boundary layer simulation in SOWFA considering a mean wind speed of 8 m s−1 at hub height, a surface roughness height chosen based on the Charnock model with α=0.011, and neutral atmosphere with a capping inversion height of z=750 m. Since we did not have access to the original LES results or the original inflow, we have tried to reproduce the reported wind profile as well as possible – in particular aiming to match the shear profile and mean wind speed standard deviation across the rotor – using the synthetic turbulent wind field generator TurbSim (Jonkman, 2009) with a Kaimal spectrum and the normal turbulence model from the International Electrotechnical Commission standards (IEC, 2005). To reduce the uncertainties associated with the stochastic nature of the wind inflow, all results consider the average of six different realizations with distinct seeds for the turbulent wind field. As illustrated in Fig. 2, though the wind profile generated with TurbSim is not the same as the one considered by Johlas et al. (2020), it is deemed similar enough for our purposes – for instance, we obtained a rotor-averaged standard deviation of 0.332 m s−1, which is within 3 % of the value of 0.324 m s−1 from Johlas et al. (2020). One significant difference between the TurbSim and the LES inflows is that the LESs account for wind veer due to the atmospheric Coriolis effect, an effect that is not modeled in FAST.Farm and influences the comparisons presented ahead.
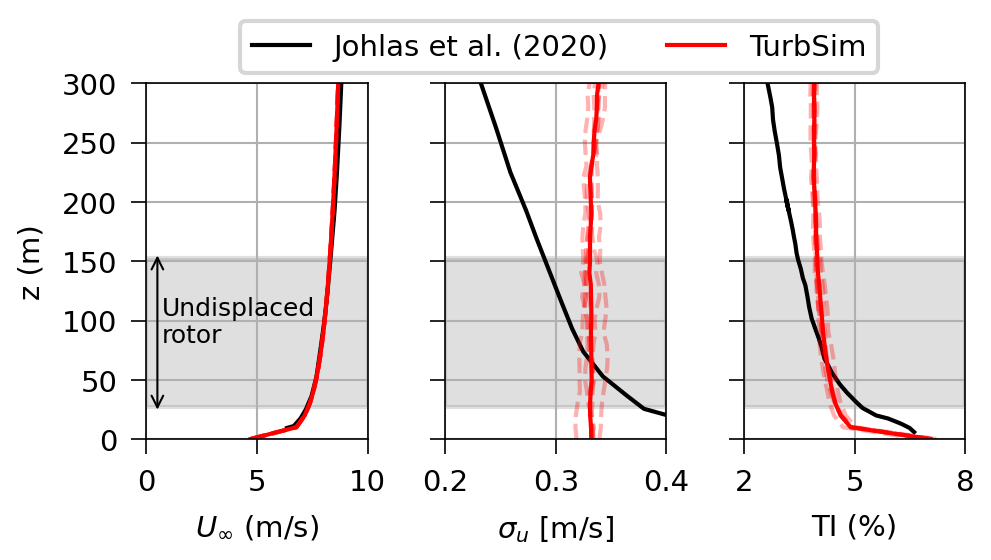
Figure 2Comparison between the mean wind speed and turbulence intensity profiles considered by Johlas et al. (2020) and the ones obtained with TurbSim. The TurbSim results correspond to the average of six seeds, with the result from each seed visible as transparent dashed lines.
We consider the same wave condition as Johlas et al. (2020), namely a long-crested irregular sea characterized by a JONSWAP spectrum with significant wave height of Hs=8.0 m, peak period of Tp=14.0 s, and wave propagation direction of 25° relative to the wind. For simplicity, we consider only one realization of this sea state (i.e., only one seed).
2.2.2 For the three-turbine array
We analyze the three-turbine array under a wide range of environmental conditions, including variations in mean hub-height wind speed, shear profile, turbulence intensity, and sea state severity. We generated the wind inflows using TurbSim with a Kaimal spectrum, the normal turbulence model from the IEC standards, and a power-law shear profile. For the incoming wave field, we employ linear wave theory and irregular waves characterized by a JONSWAP spectrum. For simplicity, both the wind and incoming waves are aligned with the x axis of the global coordinate system. We consider all the combinations of the following:
-
three different mean wind speeds at hub height – below, at, and above rated;
-
three different turbulence intensity levels (TI) – low, medium, and high TI;
-
three different shear profiles, characterized by the exponent of the power-law profile – low, medium, and high shear;
-
three different wave conditions – mild, medium, and severe sea states.
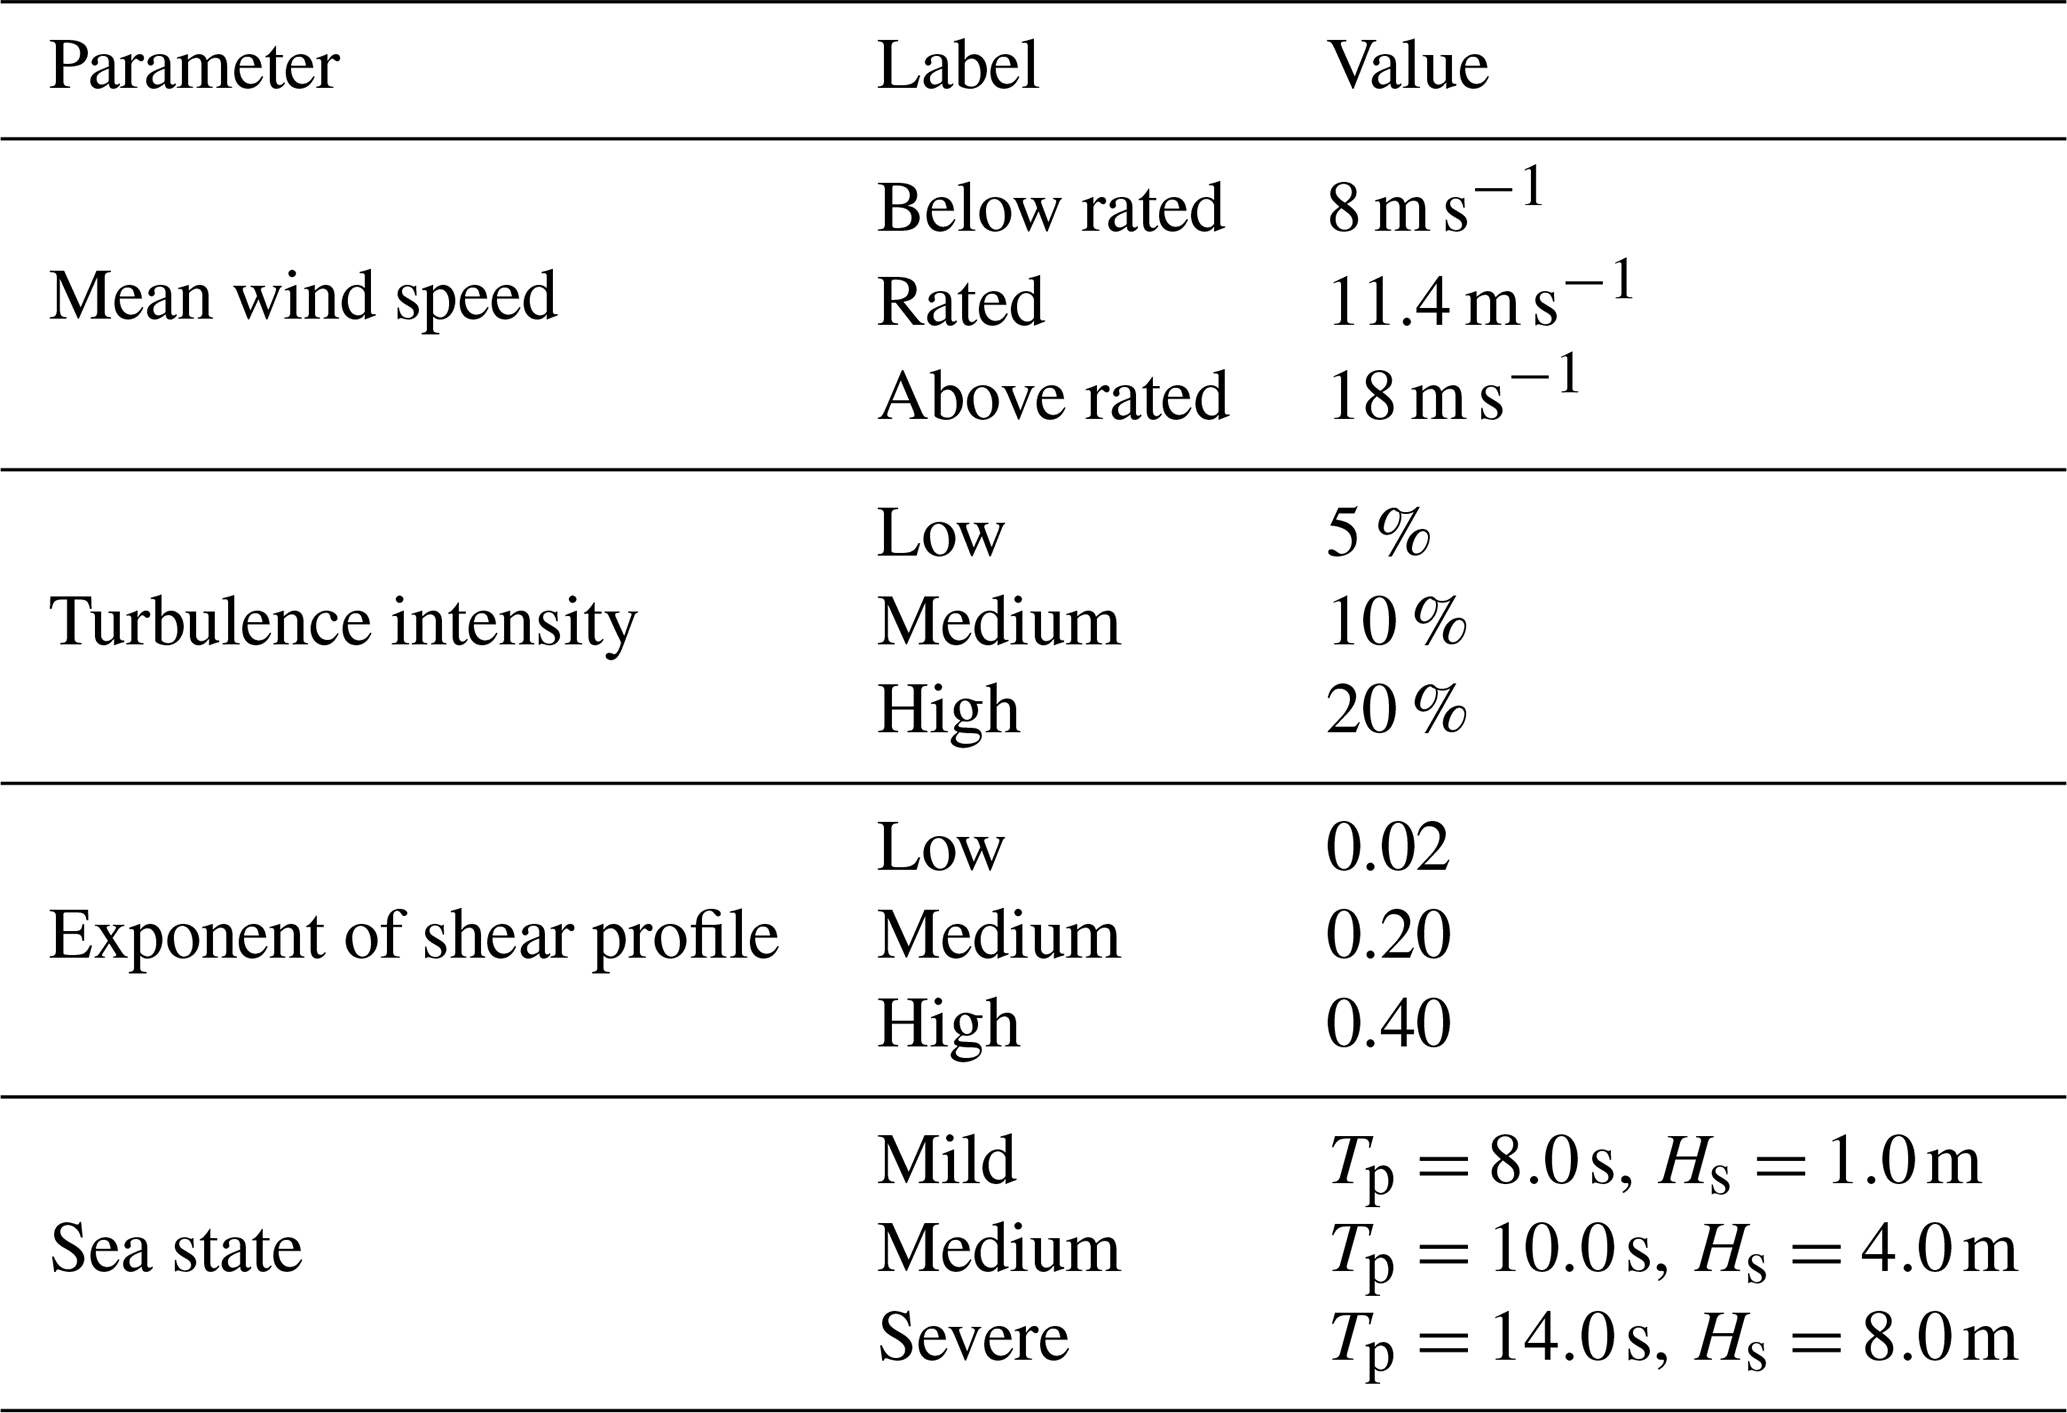
The numerical values adopted for the different environmental parameters are given in Table 4. Besides the floating conditions, we also analyze FAST.Farm simulations of the floater in a fixed configuration for the same set of wind conditions. The fixed configuration is obtained by disabling the degrees of freedom associated with floater motion and the hydrodynamic loading; hence, the turbines behave as if they were onshore and the response is insensitive to the wave condition. We consider six different seeds for the wind inflow but only one for each sea state, leading to a total of 648 different simulations.
Table 4Environmental conditions considered for the three-turbine array.
2.3 Numerical model in FAST.Farm
FAST.Farm employs different domains (in both time and space) for the wind field. The first is a low-resolution domain that encompasses the whole wind farm and which is primarily responsible for wake meandering and merging. For accurate load calculation by OpenFAST, FAST.Farm also employs high-resolution wind domains around each wind turbine that need to encompass any turbine displacement. We adopt a low-resolution domain with dimensions , a spatial resolution , and a temporal resolution Δtlow=3.0 s. To avoid double-interpolating the wind data in the X direction, ΔXlow is different for each wind speed (Jonkman and Shaler, 2021): , , and . This spatial–temporal discretization is a bit coarser than current modeling guidance (Jonkman and Shaler, 2021), which evolved over the course of this project; however, a subset of cases were run with finer discretization that follows current modeling guidance, and the results were generally found to be consistent with the present results, but the present results show a small underprediction of fatigue loads at low ambient turbulence levels.
Each high-resolution domain has dimensions originating 78 m upwind of each turbine, with a spatial resolution ΔXhigh=4 m and and a temporal discretization Δthigh=0.3 s. Figure 3 illustrates the low- and high-resolution domains. Because we only have one turbine for the validation against high-fidelity simulations, we use a shorter low-resolution domain along the wind direction, Xlow=1608 m, to reduce the computational cost; all other discretization parameters are the same. We performed all numerical simulations using FAST.Farm v3.4.1.
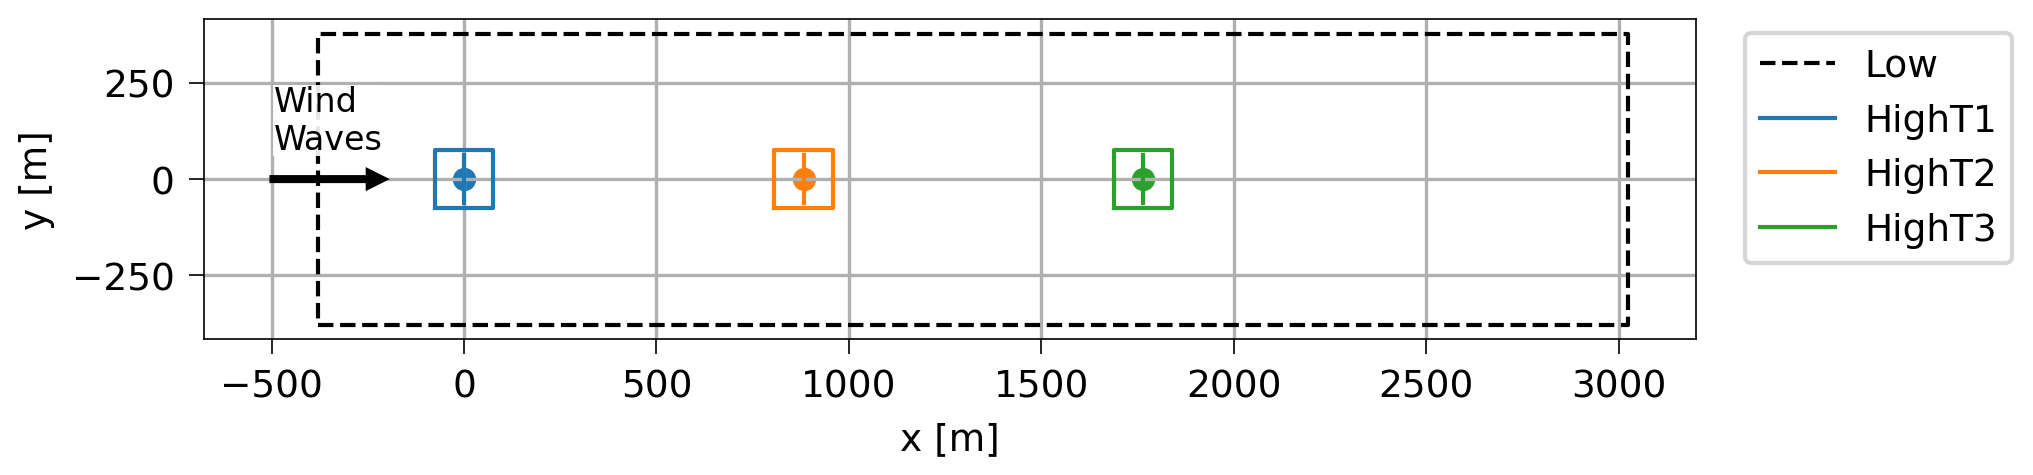
Figure 3Illustration of the three-unit wind farm, showing the low- and high-resolution domains adopted in FAST.Farm, with the turbines marked with dots and vertical lines.
We also use the validation against high-fidelity simulations to calibrate the numerical model before analyzing the three-unit array. As discussed in Sect. 3, a particularly relevant aspect for the floating turbine case is the choice of wake formulation. The comparisons show that the original polar (axisymmetric) wake model adopted by FAST.Farm overpredicts the vertical wake deflection (due to shaft tilt and floater pitch), while the new curled wake model (Branlard et al., 2023) captures this vertical wake deflection well. We adopt a radial increment for the finite-difference grid used to solve the wake deficits of 13 m for the simulations with the curled wake model and 5 m for the ones with the polar wake model. This value follows previous modeling guidance, which suggested using a radial increment dr for the curled wake model, and is a bit coarser than the current recommendation of dr . Similar to the coarser spatial–temporal discretization for the low-resolution grid, this coarser dr did not lead to any problems in our simulations.
The setup of the aero-hydro-servo-elastic part of the FAST.Farm simulation is very similar to the analysis of a single wind turbine with OpenFAST, and all the inputs required to simulate the NREL 5 MW reference wind turbine atop the OC4-DeepCwind semisubmersible are publicly available in the OpenFAST repository on GitHub (Jonkman et al., 2023). Wave forces and moments on the floating substructure are computed with HydroDyn – the hydrodynamics module of OpenFAST – using a hybrid approach that combines first- and second-order potential flow coefficients precomputed in the frequency domain with WAMIT (WAMIT, 2020) and the quadratic drag from Morison's equation. Aerodynamic loads on the blades are obtained with blade element momentum theory with various corrections such as dynamic inflow and unsteady airfoil aerodynamics using AeroDyn (Jonkman et al., 2015). The mooring system is modeled with MoorDyn (Hall, 2015), which uses a lumped mass model. Turbine control is included with ServoDyn using the conventional baseline generator-torque controller and a full-span rotor-collective blade-pitch controller. Structural dynamics are solved using ElastoDyn considering the first and second flap-wise blade modes, the first edgewise blade mode, rigid-body rotor rotation plus shaft torsion, the first and second fore–aft and side-to-side tower bending modes, and, for the floating case, the six degrees of freedom corresponding to the rigid-body motions of the platform. For the fixed configuration, the degrees of freedom corresponding to floater motion are deactivated. Each of the simulations was performed for a total of 4000 s, from which the first 400 s were discarded to remove transients related to simulation startup.
Air–sea interaction is not considered in FAST.Farm or the LES results that FAST.Farm is validated against. Moreover, though wake-added turbulence was recently implemented in FAST.Farm, it was not fully integrated to the software when we performed the simulations. Hence, this effect is not considered in this work, which is an important limitation for the low-turbulence cases (Kretschmer et al., 2021). Inclusion of wake-added turbulence and the use of finer spatial–temporal discretizations is important future work.
2.4 Post-processing of simulation results
The quantities of interest analyzed in this work are the motions of the floating substructure, bending moments at the blade root and tower base, and generator power. Additionally, wake deflection and meandering are important for validation against the high-fidelity simulations and to help explain the results obtained for the other quantities of interest. Due to the large number of simulations, we concentrate the analysis on the mean and standard deviation for most of the quantities of interest. We also present power spectral densities (PSDs) of some cases of interest to illustrate the physical effects involved.
In place of standard deviation for the bending moment quantities, we present short-term damage-equivalent loads (DELs) calculated using a modified version of pCrunch (Nunemaker and Abbas, 2023). A DEL is a constant-amplitude fatigue load that produces equivalent damage as the original load time series. The short-term DEL for a given time series j about a fixed mean load, DEL, is computed as
where nji is the number of cycles in the ith bin of the rain-flow histogram, is the cycle's load range about a fixed load-mean value using Goodman correction, is the total equivalent fatigue counts for time series j, feq is the DEL frequency, Tj is the elapsed time, and m is the Wöhler exponent. We adopt feq=1 Hz, m=4 for the steel tower and m=10 for the composite blades.
To account for load directionality, we compute the DELs by first computing the moment along several directions θ within the blade-root and tower-base cross-sections, M(t,θ), as
where Mx and My are the moments along two orthogonal directions – for instance the fore–aft and side-to-side tower-base moment. We then compute the DEL for each direction θ and take the maximum value across all directions as the final DEL for that given time series. We consider directions ranging from 0 to 180° with a 10° discretization – the values between 180 and 360° are equivalent to their symmetrical counterparts.
We use Goodman's correction to take into account the mean loads in the DEL calculation. For the tower, which is made of a single isotropic material, the ultimate load required by Goodman's correction follows directly from the ultimate stress and the geometry of the cross-section at the tower base:
where I=2.925 m4 is the cross-sectional area moment of inertia (the same for all θ) and R=3.0 m is the radius of the tower base (Jonkman et al., 2009). The stress is not as readily computed for the composite blades, so we assume a circular cross-section with a thickness of 10 % of the radius for simplicity and for lack of better information. Given the root radius of the blades of 1.771 m, the resulting area moment of inertia is I=2.657 m4. Because neither the ultimate stress of the tower nor the ultimate stress of the blades is available in the documentation of the NREL 5 MW reference turbine, we adopt and , which are within the expected range for the steel tower and the composite blade.
We analyze the wakes based on their wake center. Though FAST.Farm outputs the instantaneous center of the wake at a given downstream position, this value is not necessarily correct when adopting the curled wake model due to its asymmetric shape. Hence, we compute the instantaneous wake center using the SAMWICH toolbox (Quon, 2017) with the constant area method (Quon et al., 2020) to post-process the visualization files output by FAST.Farm. The left panel of Fig. 4 provides an example of an instantaneous wake outline and corresponding wake center computed with SAMWICH from a velocity snapshot output by FAST.Farm. From the time series of wake position, we use the mean value to characterize wake deflection and the standard deviation to characterize wake meandering.
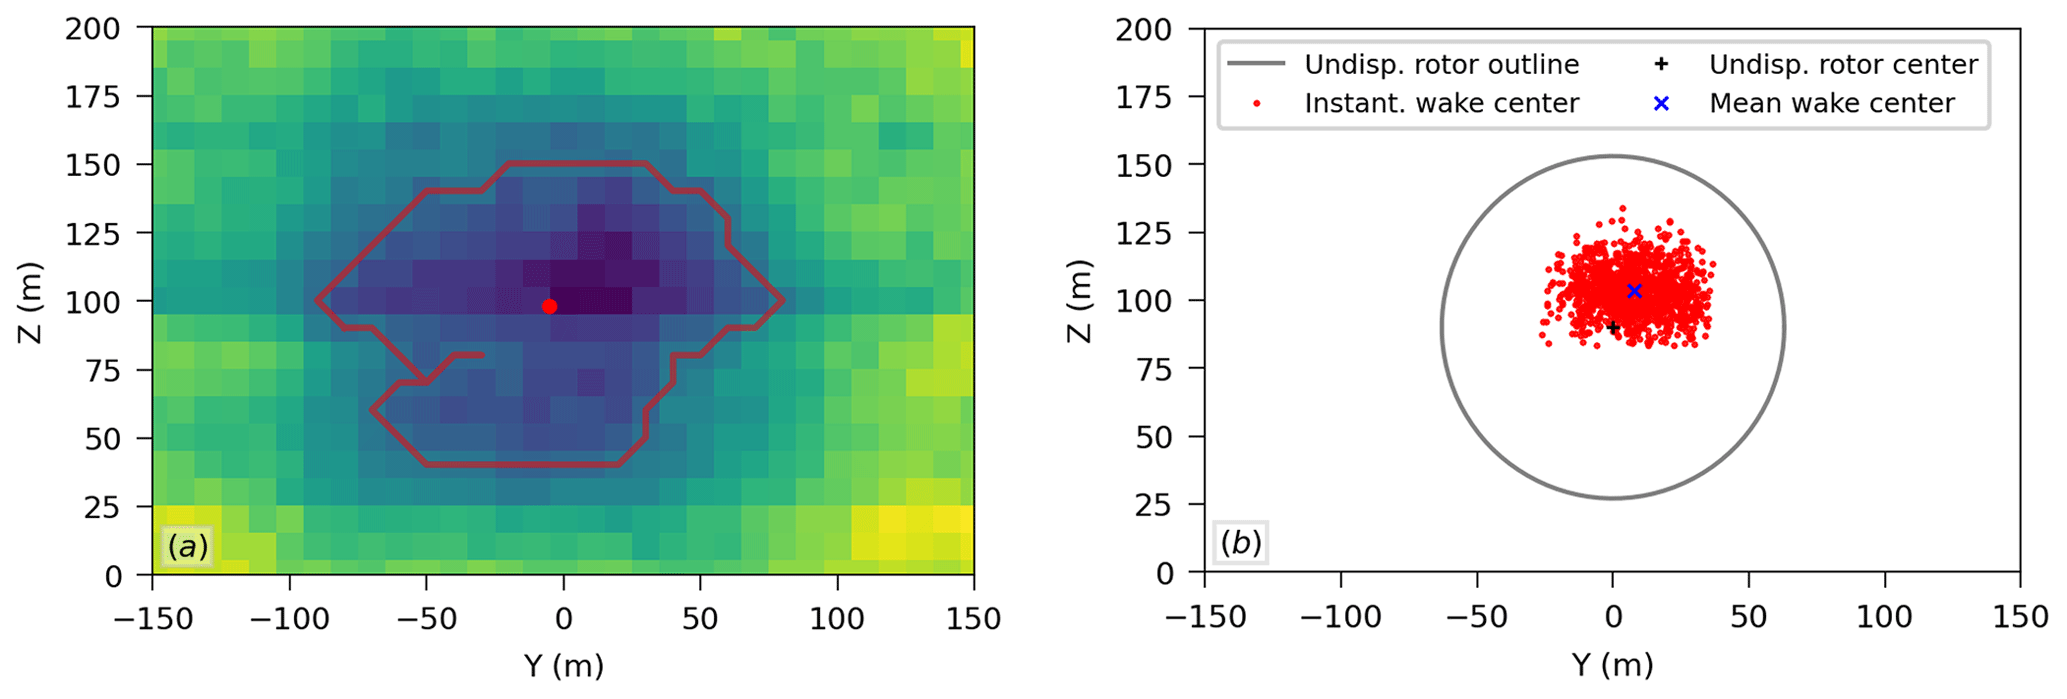
Figure 4(a) Example of an instantaneous wake outline and corresponding wake center computed with SAMWICH from a velocity snapshot output by FAST.Farm and (b) all the instantaneous wake center locations obtained for this given case as well as the corresponding mean wake position. These results correspond to a vertical plane located 6 D downwind of the undisplaced rotor center of the floating turbine case considered in the validation against LES.
This section presents the validation and calibration of FAST.Farm against high-fidelity results from LESs reported by Johlas et al. (2020). The comparisons are based on the mean and standard deviation (meandering) of the wake center position, as well as on the mean velocity deficit at different downstream locations.
Before moving to the analysis of wake quantities, Fig. 5 shows the good agreement between the motions of the floating substructure obtained with FAST.Farm and the ones reported by Johlas et al. (2020). Though not identical, they are close enough that differences in the wake results cannot be attributed to differences in platform motions.
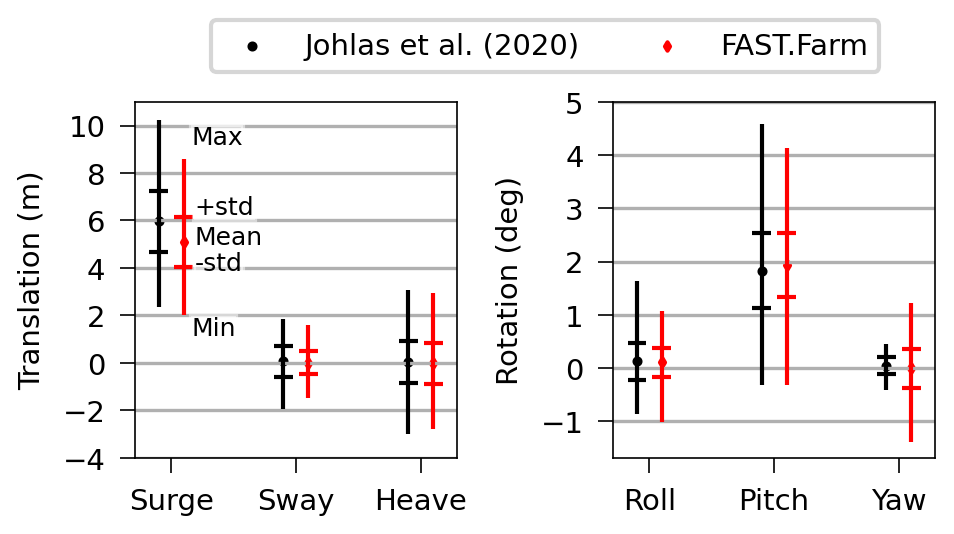
Figure 5Comparison of the motions of the floating substructure obtained in this work and the ones reported by Johlas et al. (2020).
3.1 Cut-off frequency
The first parameter that required tuning is the cut-off frequency, fc, of the low-pass filter that FAST.Farm uses for computing wake advection, deflection, and meandering to ensure high frequencies do not enter the quasi-steady wake deficit calculation. Branlard et al. (2023) recommend a cut-off frequency given by
where τ1 is the timescale used in the Øye dynamic inflow model, aavg is the average axial induction factor across the rotor disk, R is the rotor radius, and U is the mean wind speed at hub height. For the present case, the recommended value results in 0.083 Hz.
This value works well for the FAST.Farm simulations of the fixed turbine but leads to nonphysical results for the simulations of the floating turbine. As illustrated in Fig. 6, the wind field obtained with FAST.Farm downstream of the floating turbine presents nonphysical streaks that result from a limitation of the present method adopted by FAST.Farm to compute wake evolution. In FAST.Farm, the wake deficit evolution is solved within wake volumes that are delimited by wake planes. Those wake planes are generated at the rotor at each time step and convect downstream in subsequent steps. The problem is that the motions of the floating substructure change the position where those planes are generated and also their propagation velocity in such a way that they can pass each other. In reality, this would result in pulsation of the wake. But this situation is not well handled by FAST.Farm, leading to the nonphysical behavior of streaks in the wake resulting from overlapping wakes, as shown in Fig. 6. Such overlapping wakes would lead to nonphysical step changes in the aerodynamic loading of downstream turbines, resulting in inaccurate DELs.
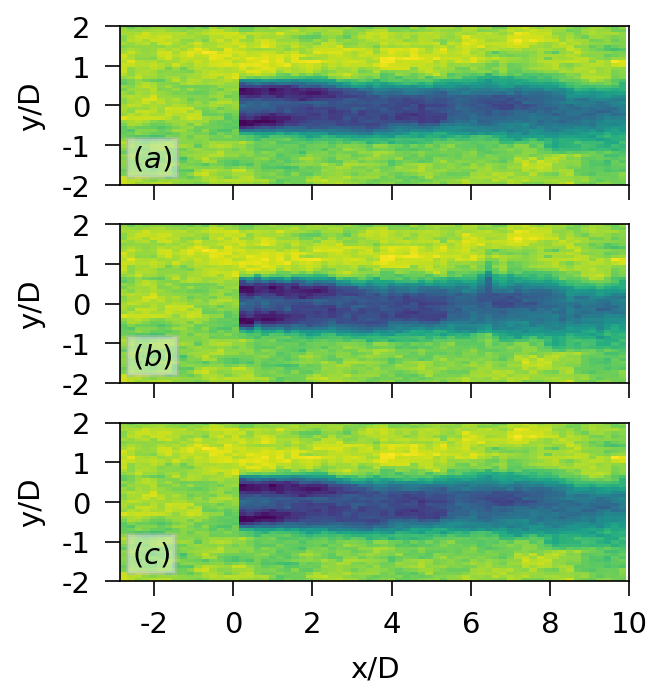
Figure 6Top view of the wake obtained with FAST.Farm for (a) the fixed turbine with the recommended value of fc=0.083 Hz for this case, (b) the floating turbine with the recommended value of fc=0.083 Hz, and (c) the floating turbine with fc=0.010 Hz, a value close to the resonance frequency of surge.
Addressing this issue is planned for the future but requires significant changes in the formulation adopted in FAST.Farm. For now, a workaround to avoid this nonphysical behavior is to reduce fc to a value close to the resonance frequency of surge of the floating substructure. For the present study, we adopt fc=0.010 Hz. As shown in Fig. 6, this value is enough to remove the nonphysical streaks from the wake.
However, by lowering the value of fc, we filter out the dynamic influence of floater motions on the wake, thus reducing the amplitude of pulsations in the wake resulting from surge and pitch of the floating substructure. This effect is expected to be more relevant in very low-turbulence inflow conditions, similar to what is observed for wake-added turbulence. We consider this limitation to be acceptable for the present work and in need of reassessment in future work.
3.2 Wake formulation
FAST.Farm can solve for the wake dynamics within a wind farm using either a polar wake formulation (Jonkman et al., 2017), which assumes an axisymmetric wake, or the recently implemented curled wake formulation (Branlard et al., 2023), which allows for an asymmetric wake as a result of skewed flow from rotor yaw and/or tilt.
The mean wake trajectory (deflection) and wake motion standard deviation (meandering) from both wake models are illustrated in Fig. 7. Neither wake model captures the horizontal wake deflection from the LES results. This horizontal wake deflection seen in the LES solution results from an atmospheric Coriolis effect that is not in FAST.Farm. This is reflected in the wind veer reported by Johlas et al. (2020) that is not present in our FAST.Farm simulations, as noted in Sect. 2.2.1.
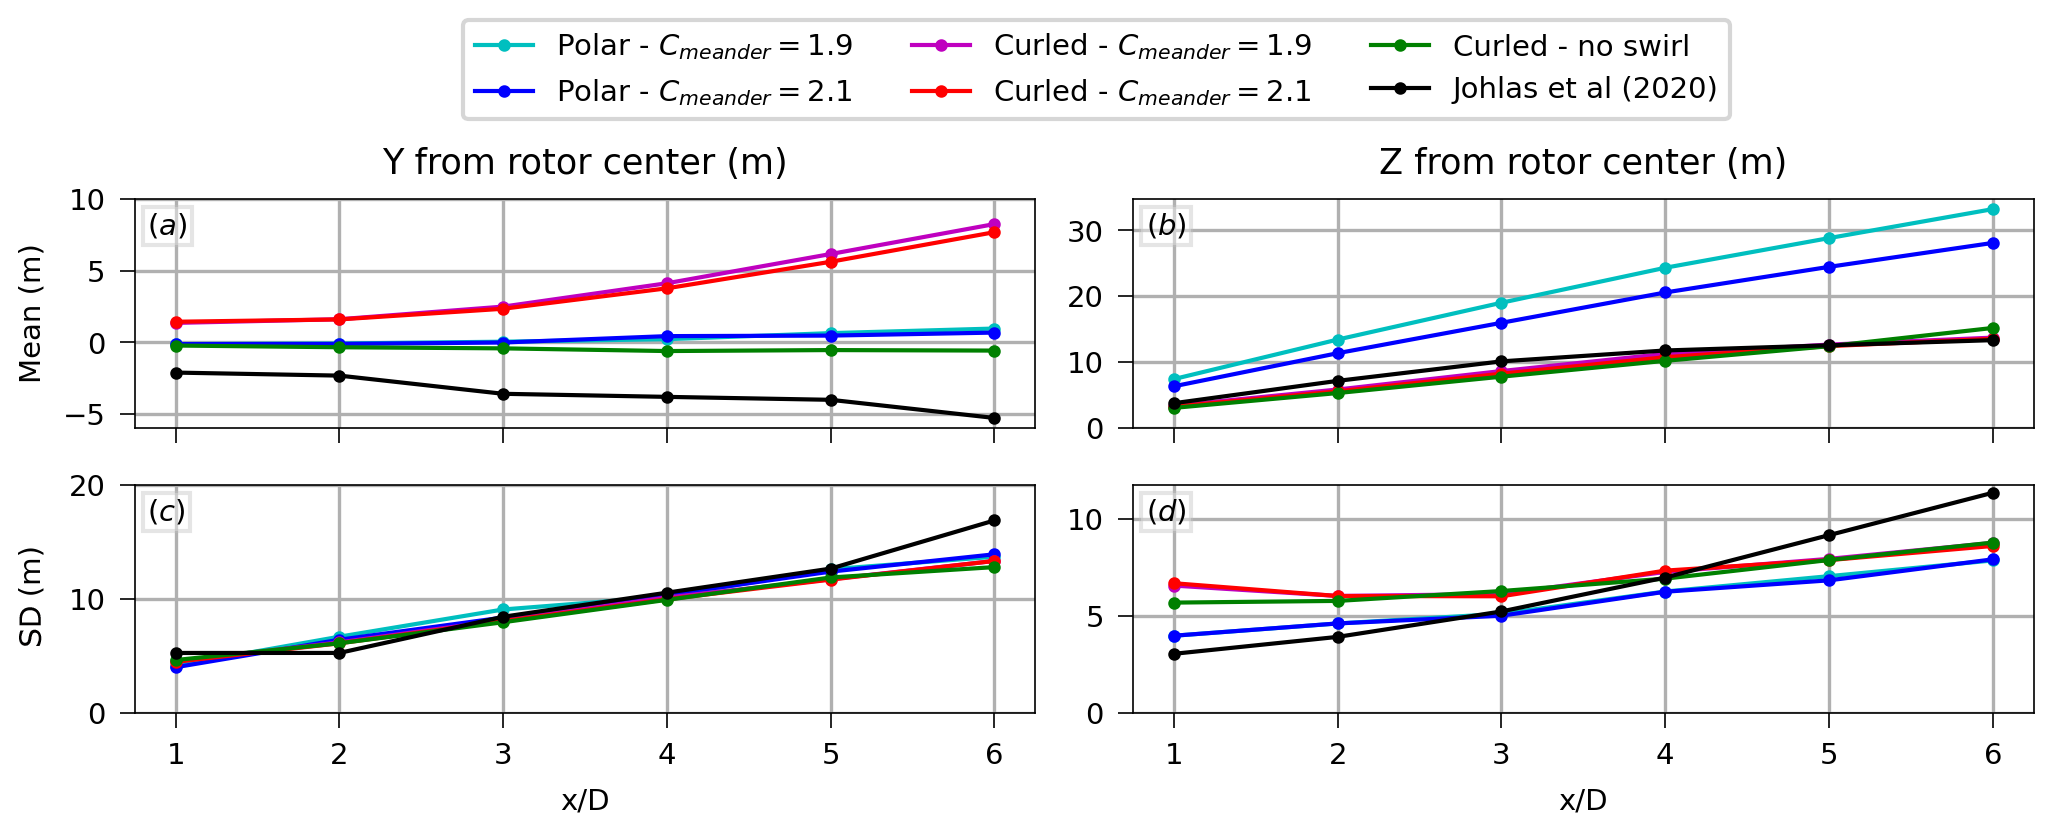
Figure 7(a) Mean horizontal wake deflection, (b) mean vertical wake deflection, (c) horizontal wake meandering (expressed in terms of standard deviation of the wake center), and (d) vertical wake meandering as a function of downstream distance obtained with FAST.Farm considering different wake models compared with LES results from Johlas et al. (2020) (floating case).
Neglecting this difference for now, the polar wake model yields good results for wake standard deviation (meandering) in both the vertical and horizontal directions. However, the polar wake model is unable to match the vertical wake deflection (resulting from shaft tilt and floater pitch) from the LESs, even when calibrating a key input of the polar wake model within a range of reasonable values. The parameter that most impacts the vertical wake deflection computed with the polar wake model is Cmeander. This parameter determines the size of the polar grid used to calculate the spatial average of the velocity in the passive tracer model, which is used to propagate the wake. By increasing Cmeander, the size of the polar grid is increased, thus reducing the wake deficit’s influence on the spatial average and, consequently, reducing the vertical wake deflection. Figure 7 shows that we can reduce the overestimation of the vertical wake deflection obtained with the polar wake model by increasing Cmeander, but we would need to consider an unrealistically large value of Cmeander to match the vertical wake deflection from the LESs at the expense of reducing the wake meandering and deviating considerably from the default value of 1.9 (previously calibrated in Doubrawa et al., 2018, to ensure that the wake meandering from FAST.Farm matches LES in the absence of significant skew).
The curled wake model, on the other hand, can reproduce the vertical wake deflection from the LESs very well, with a nearly perfect match at 6 diameters downstream of the rotor. Wake meandering is also well captured by the curled wake model. Though the vertical wake meandering for x<4D is better modeled by the polar wake model, this is not very relevant because we are not interested in the near-wake region for wind farm analyses. Considering the horizontal wake deflection again, while in the LES results the horizontal wake deflection is mainly due to an atmospheric Coriolis effect that is not in FAST.Farm, the curled wake formulation captures the opposite deflection that results from swirl of the curled wake induced by rotor torque (this is demonstrated in Fig. 7 through the curled wake results shown without swirl). This deflection resulting from swirl is also captured in LES, but the Coriolis effect is opposite in magnitude and stronger. It is noted, though, that the strength and direction of the Coriolis effect will depend on the latitude of a given wind farm.
As shown in Fig. 8, the main difference between the fixed and floating cases is the larger vertical wake deflection induced by the mean pitch (tilt) of the floating substructure. Because our objective is to assess the differences between a floating wind array compared to a fixed one, we accept the small differences in the horizontal wake deflection given the good agreement between the curled wake model and the LES results for the vertical wake deflection.
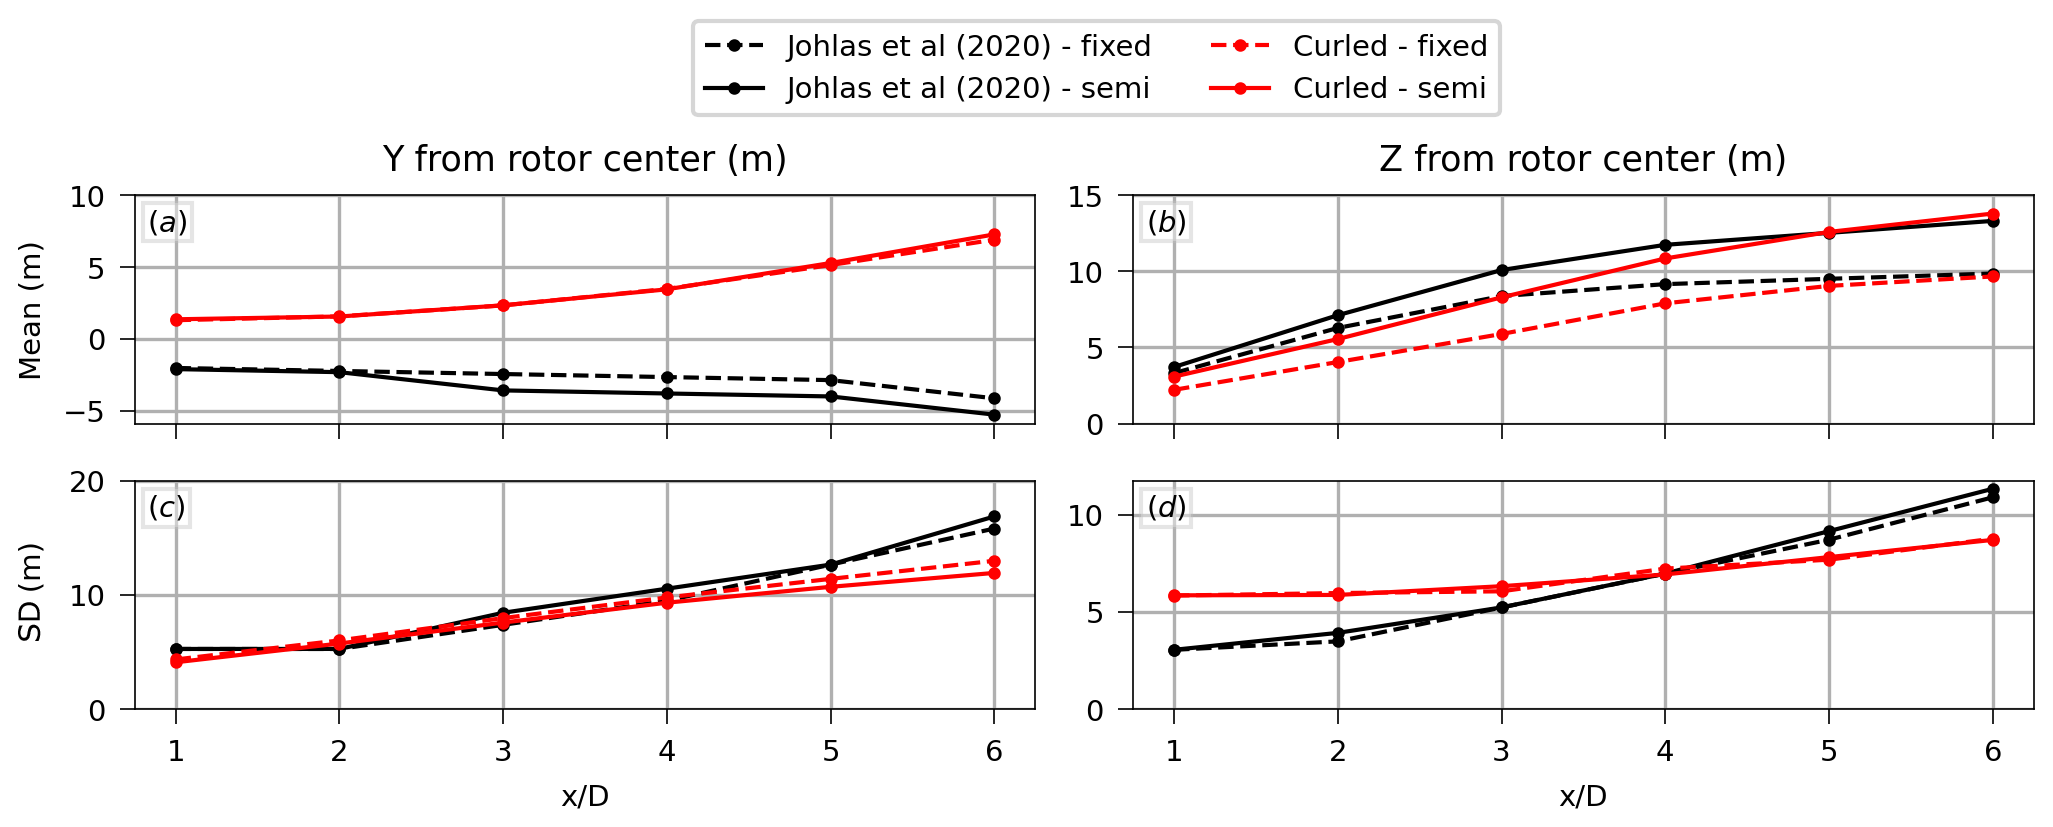
Figure 8(a) Mean horizontal wake deflection, (b) mean vertical wake deflection, (c) horizontal wake meandering (expressed in terms of standard deviation of the wake center), and (d) vertical wake meandering as a function of downstream distance obtained with FAST.Farm (adopting the curled wake model) compared with LES results from Johlas et al. (2020) for the floating and fixed cases.
3.3 Summary of the calibrated model
Based on the results presented in this section, we adopt the curled wake model with swirl, fc=0.010 Hz, and Cmeander=2.1 for the simulations of the three-turbine array. We adopt this value of Cmeander for consistency with the polar wake model, but the same conclusions are obtained with the default value of 1.9. In the end, FAST.Farm has a reduction in the amplitude of pulsations in the wake induced by floater motions (related to the choice of fc) and a difference in the mean horizontal wake deflection (due to the lack of an atmospheric Coriolis effect in FAST.Farm) compared to the LESs. Despite these limitations of FAST.Farm, this validation provides confidence to proceed with the primary objective of investigating the interactions between the motions of floating wind turbines and wakes using FAST.Farm.
The good agreement with the LES results is illustrated by the temporal mean wake deficits at different downstream distances shown in Fig. 9. The figure shows that FAST.Farm can reproduce the transition from a bimodal distribution in the near wake to a more Gaussian distribution further downwind with a good match of the wake deficit values.
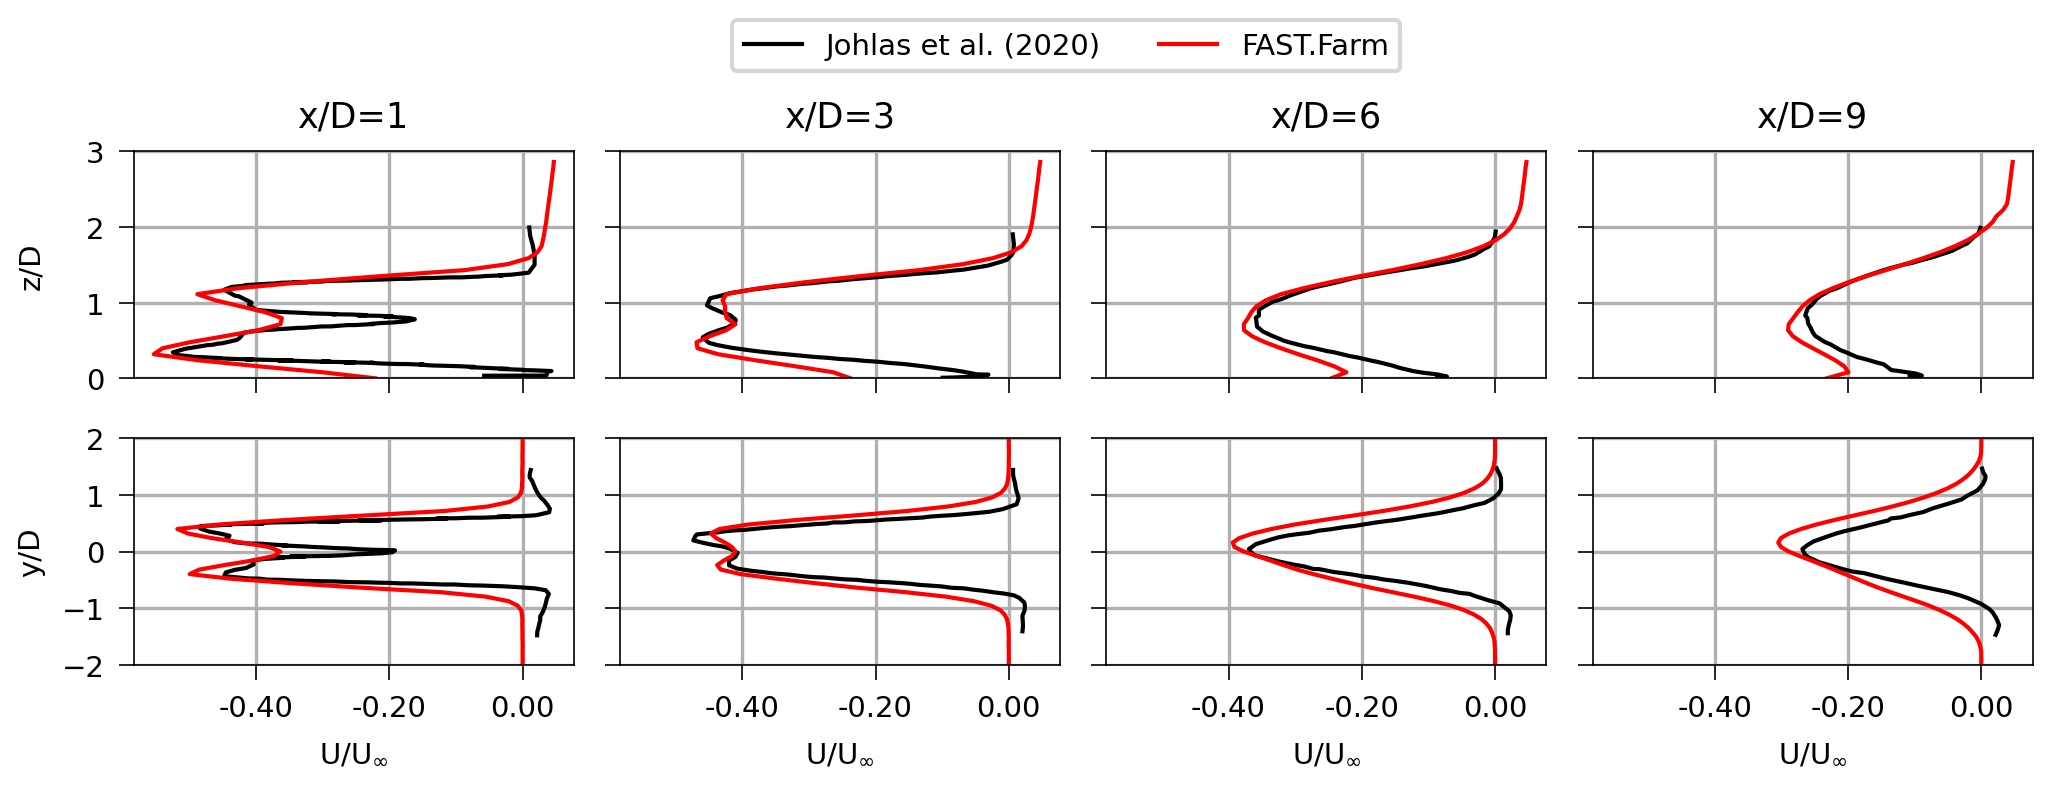
Figure 9Vertical (top) and horizontal (bottom) temporal mean wake deficits at different downstream distances obtained from FAST.Farm (adopting the curled wake model) compared with LES results from Johlas et al. (2020).
This section presents the results of the three-unit array simulations with FAST.Farm to assess the differences between a floating wind array and a fixed one across a comprehensive range of environmental conditions. The main differences introduced by the floating substructure are the motions induced by the wind and waves, the change in the natural frequencies of the tower, and the larger vertical wake deflection due to the mean pitch of the platform discussed in the previous section. In the following, we investigate how these differences affect the power production and the tower-base moment. Because the floating substructure did not impact the blade-root moments in a meaningful way, the blade-root moment is only briefly discussed in Appendix A.
4.1 Generator power
One of the main motivations for studying the wakes of wind turbines is the impact on power production of downstream units. As shown in Fig. 10a – which presents the mean generator power along the array for a mean wind speed of 8 m s−1, TI 5 %, and low shear – the waked turbines can produce significantly less power than the free-stream unit. To verify the effect of the floating substructure, we analyze the relative difference between the generator power of the floating turbines with respect to their fixed counterparts:
where and are the mean generator power of turbine i in the floating and fixed conditions, respectively. The value of RP,i across the three-turbine array is illustrated in Fig. 10b for the same wind condition as Fig. 10a but different wave conditions, showing how each floating turbine compares with its fixed counterpart. Fig. 10c to k show how RP,i varies for each turbine in the array across all the environmental conditions considered in this work.
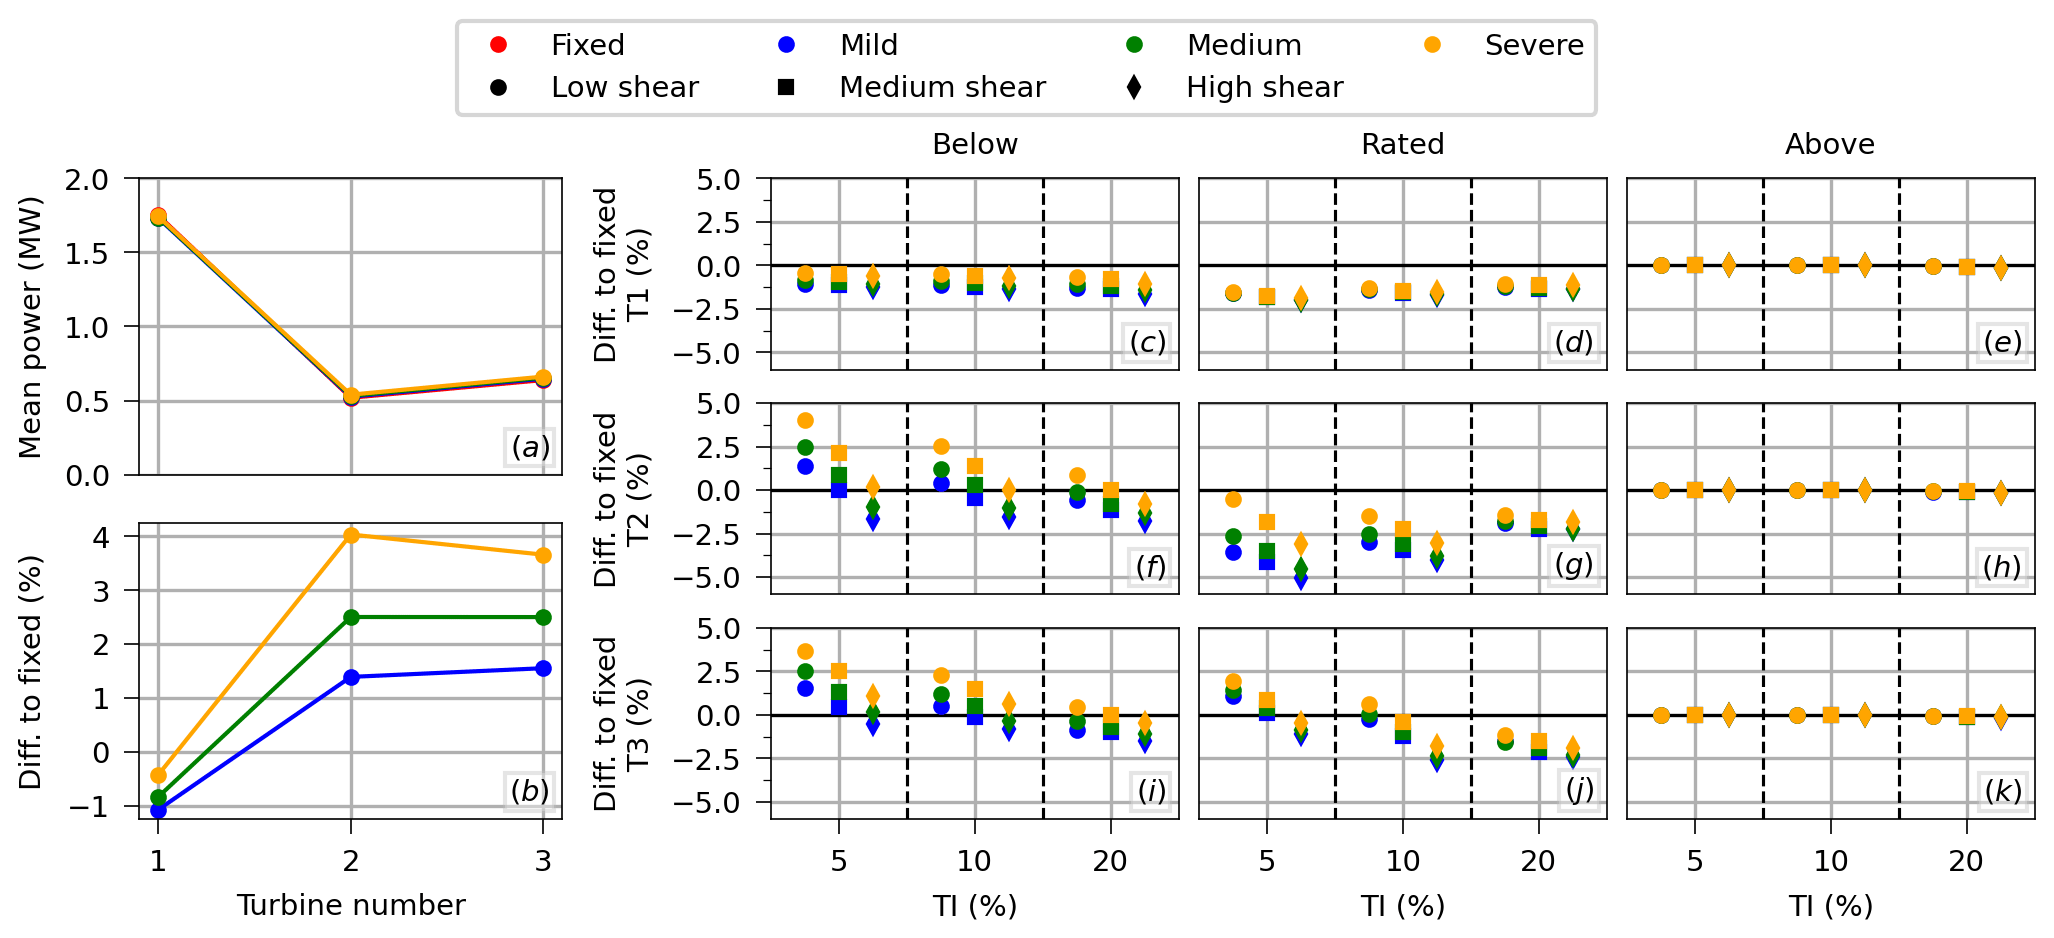
Figure 10(a) Illustration of the mean generator power along the array for a given wind condition (mean wind speed 8 m s−1, TI 5 %, and low shear). (b) Relative difference between the floating turbines along the array and their fixed counterpart for the same wind condition as (a) and all wave conditions. The relative difference between floating and fixed across all environmental conditions for (c–e) the first turbine in the array, (f–h) the second, and (i–k) the third.
The results demonstrate that the free-stream floating turbine (T1) generates, on average, less power than its fixed counterpart for below and rated conditions. This is due to the mean floater pitch angle, which reduces power by reducing the effective swept area with respect to the incoming wind (similar to yaw misalignment). Hence, cases with larger mean pitch angles perform worse in terms of generator power than cases with smaller mean pitch angles. The largest difference in generator power for the free-stream floating turbine occurs at the rated condition for TI=5 % and high shear, with a power reduction of 2 %. While the sea condition does not significantly impact RP,i at rated mean wind speed, the severity of the sea state slightly improves the performance of the free-stream floating turbine in the below-rated condition – increasing by about 0.6 % when comparing the severe and the mild sea states. This increase in power with sea state severity arises because the waves induce floater and rotor motion, which increases and decreases the relative wind speed at the rotor and power extracted from the rotor, with the increases outweighing the decreases due to the cubic relationship of power to wind speed. This trend, however, is likely heavily tied to the turbine controller and could be different with a different controller. For the above-rated condition, the floating and fixed turbines generate practically the same mean power due to the action of the control system.
For the waked turbines in the below-rated condition, Fig. 10c, f, and i show that the floating turbines yield more power than their fixed counterparts in a few cases. This is a consequence of the larger vertical wake deflection and the floater motions compensating for the power reduction due to the mean pitch angle in those cases. This improvement reduces with TI and shear in such a way that the best scenario for the waked floating turbine (in terms of power production compared to the fixed case) is in low TI, low shear, and severe sea state. For rated mean wind speed, the first waked floating turbine (T2) produces less power than its fixed counterpart for all conditions, with the different sea states and shear conditions converging to the same results as TI increases. The second waked floating turbine (T3) behaves similarly to T2 in the below-rated condition, but it is different in the rated condition: due to the larger vertical wake deflection, floating T3 compares better to fixed T3 to the point that it produces more power than its fixed counterpart in low shear and low TI. T3 also exhibits less sensitivity to the sea condition than T2. Just like for the free-stream turbine, the waked floating and fixed turbines generate the same mean power for the above-rated condition.
The balance between these different effects – (i) mean power reduction due to mean floater pitch angle, (ii) mean power increase for waked turbines due to larger vertical wake deflection, and (iii) mean power increase due to floater motions – dictates how the floating array compares with the fixed array. This is illustrated in Fig. 11, with the top row showing the mean generated power of the whole farm (summed across all three turbines) and the bottom row showing the relative difference between the floating and the fixed arrays. The differences in mean generator power between the floating and fixed arrays are small, being within −2.6 % and 1.5 % depending on the environmental condition. Like the behavior observed for the turbines individually, for below and rated conditions, the performance of the floating array with respect to the fixed array increases with the severity of the sea state but decreases with both increasing shear and increasing TI. Compared to the fixed array, the floating array produces less power in most cases, with the exceptions being some cases in the below-rated condition for the severe and medium sea states.
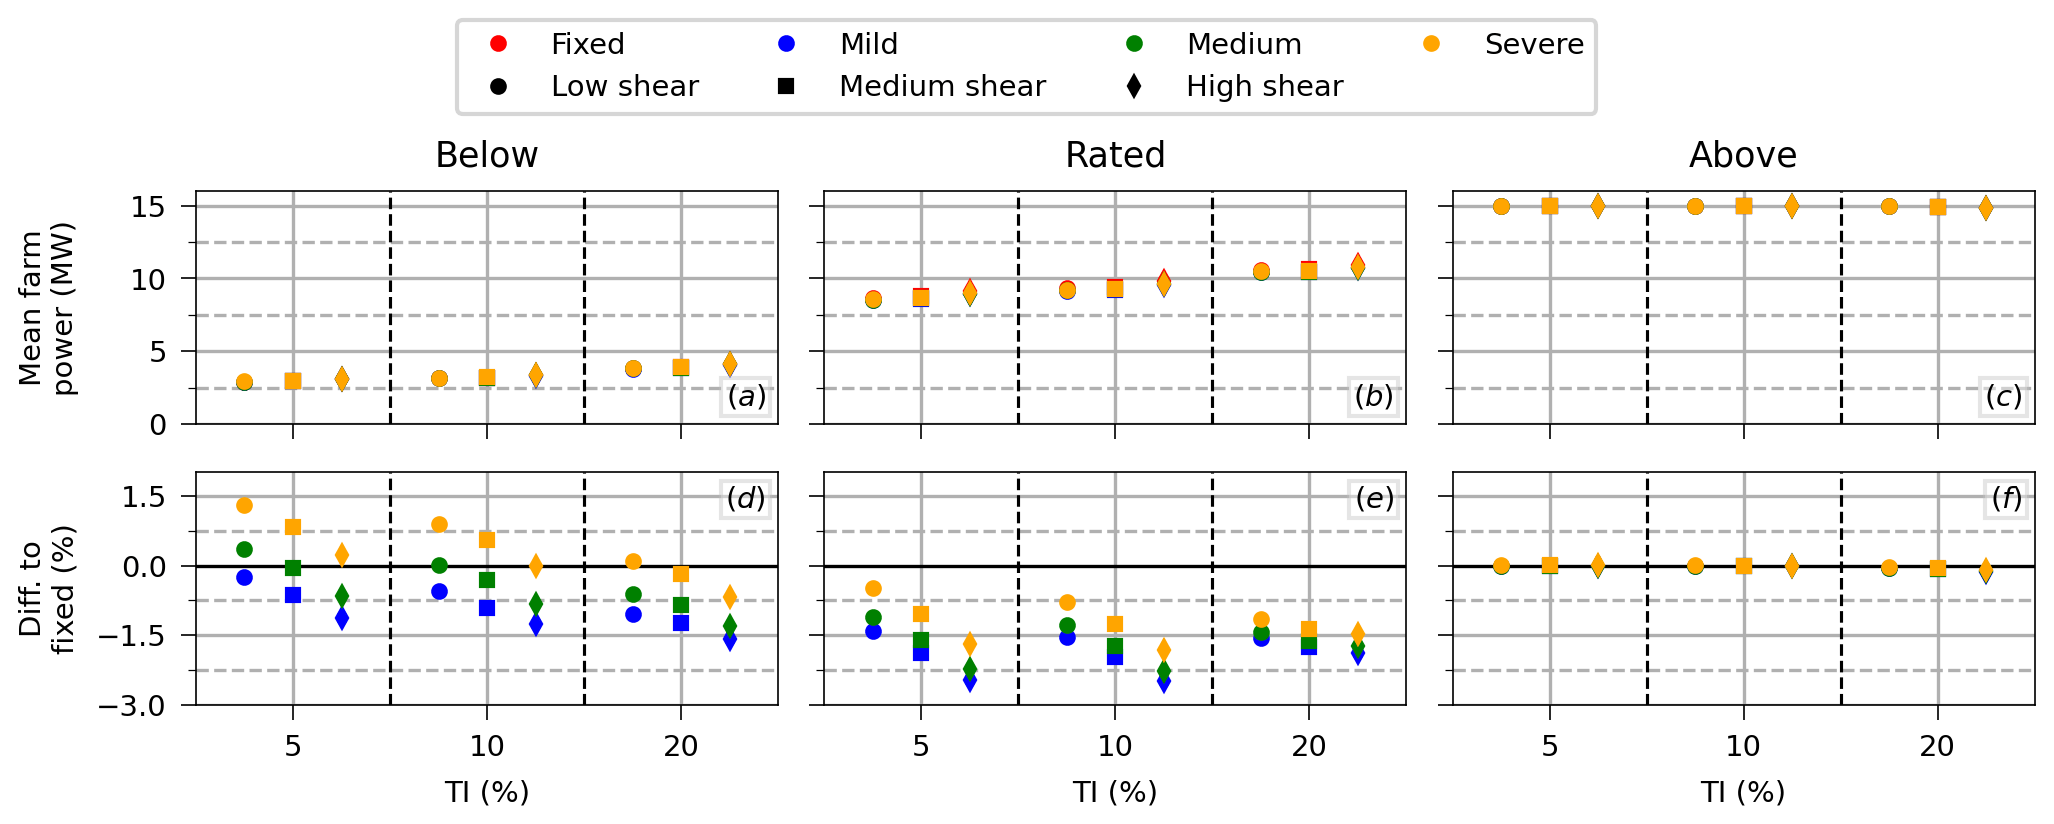
Figure 11(a–c) Mean generated power of the whole farm for all environmental conditions and (d–f) the relative difference between the floating farm and the fixed farm.
Concerning power fluctuation, Fig. 12 presents the PSD of the generator power, evidencing the two frequency ranges of interest: (i) the low frequencies of the turbulent incoming wind (shown in the top row) and (ii) the wave frequency range (shown in the bottom row), which is increasingly more pronounced with the severity of the sea state. For the severe sea state, we can notice a peak in Fig. 12d to f that is due to the wave frequency range encompassing the natural frequency of heave for this relatively large peak period.
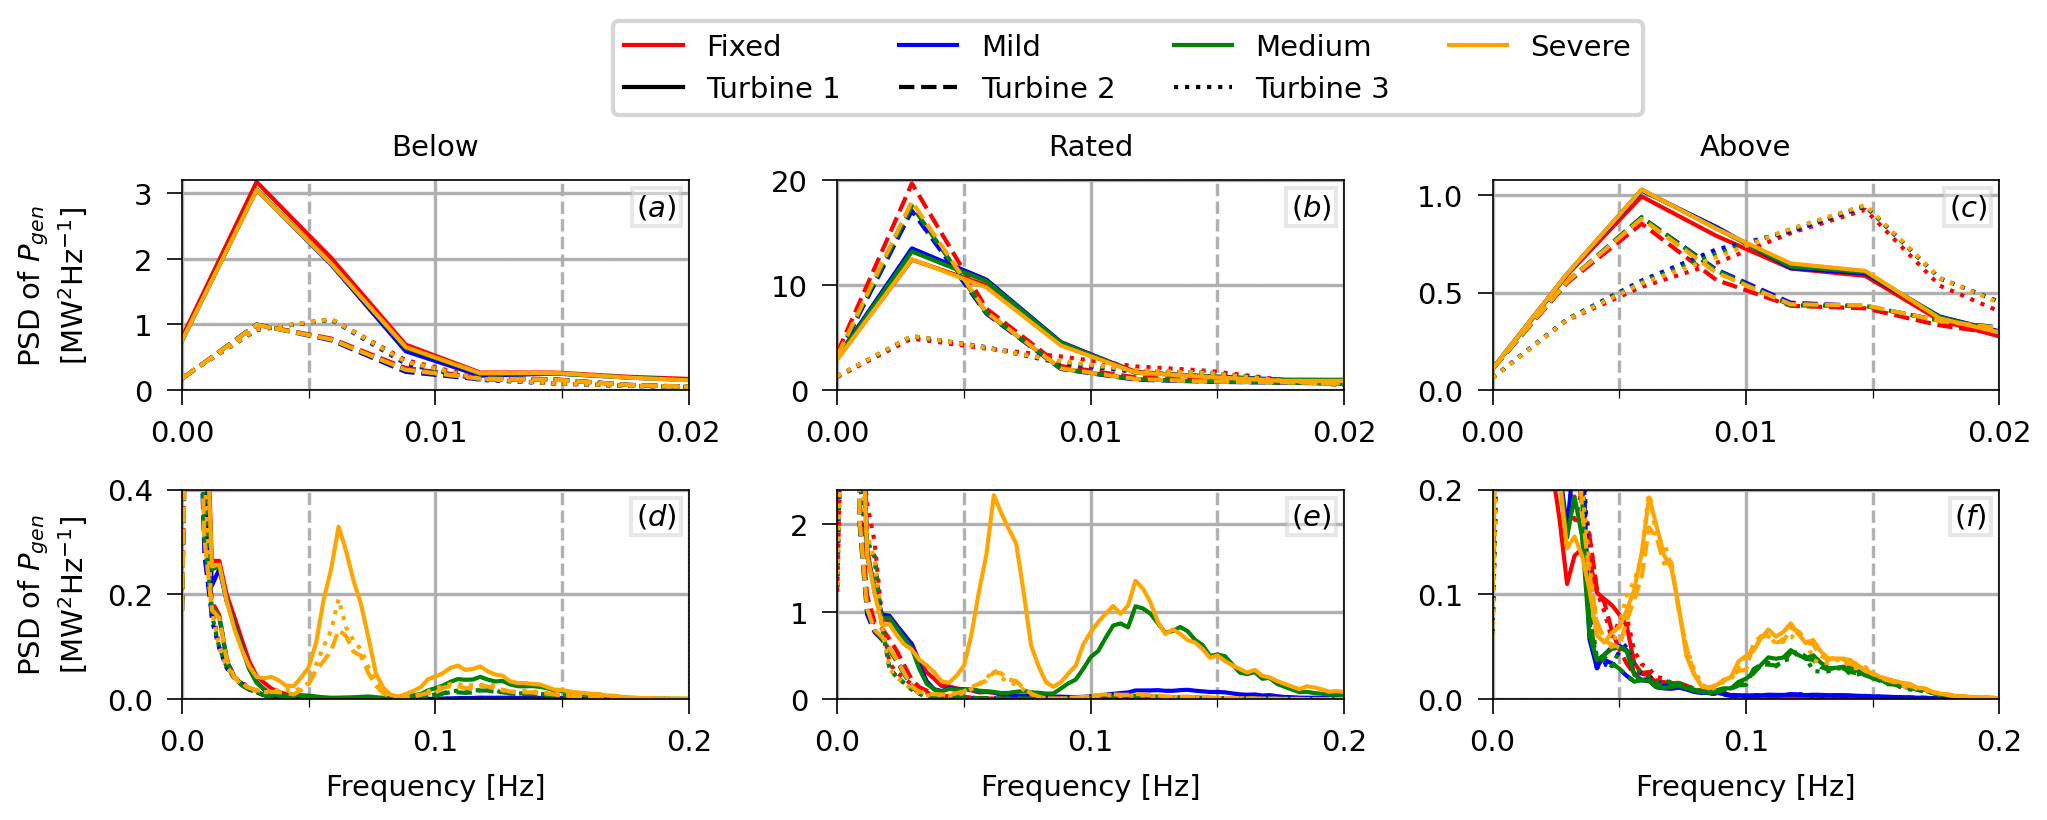
Figure 12PSD of the generator power of each turbine in the array for low shear, TI=5 %, and the three different mean wind speeds. The first row (a–c) corresponds to the low frequencies that are excited by the turbulent wind, while the second row (d–f) corresponds to the frequencies that are excited by the waves.
As expected, the motions of the floating substructure introduce power fluctuations at the frequency of the waves that are not present in the fixed case, but these occur with a much lower intensity than the fluctuations at the frequency of the turbulent wind. On the other hand, the mean floater pitch angle slightly reduces the fluctuation at the frequency of the turbulent wind for the below-rated and rated conditions, similar to how it reduces the mean generator power. The magnitude of this reduction at the frequency of the turbulent wind is proportional to the turbulence intensity.
Figure 13 shows the impact of those two opposite effects on the standard deviation of the generated power of the whole farm. For the below-rated and rated conditions, the reduction of standard deviation at the frequency of the turbulent wind due to the mean pitch angle is more pronounced for the cases with larger TI, offsetting the increase in standard deviation due to the motions of the floating substructure that can be clearly seen in the low-TI cases. For the above-rated condition, the control system is able to attenuate the fluctuations at the frequency of the turbulent wind – notice that the PSD values presented in Fig. 12c are much lower than in Fig. 12b, even though the standard deviation of wind fluctuation, given by , is larger – but it is incapable of attenuating the relatively high frequencies of the incoming waves. Hence, for the above-rated condition, the standard deviation of the generated power of the floating array is larger than the fixed array, irrespective of the turbulence level.
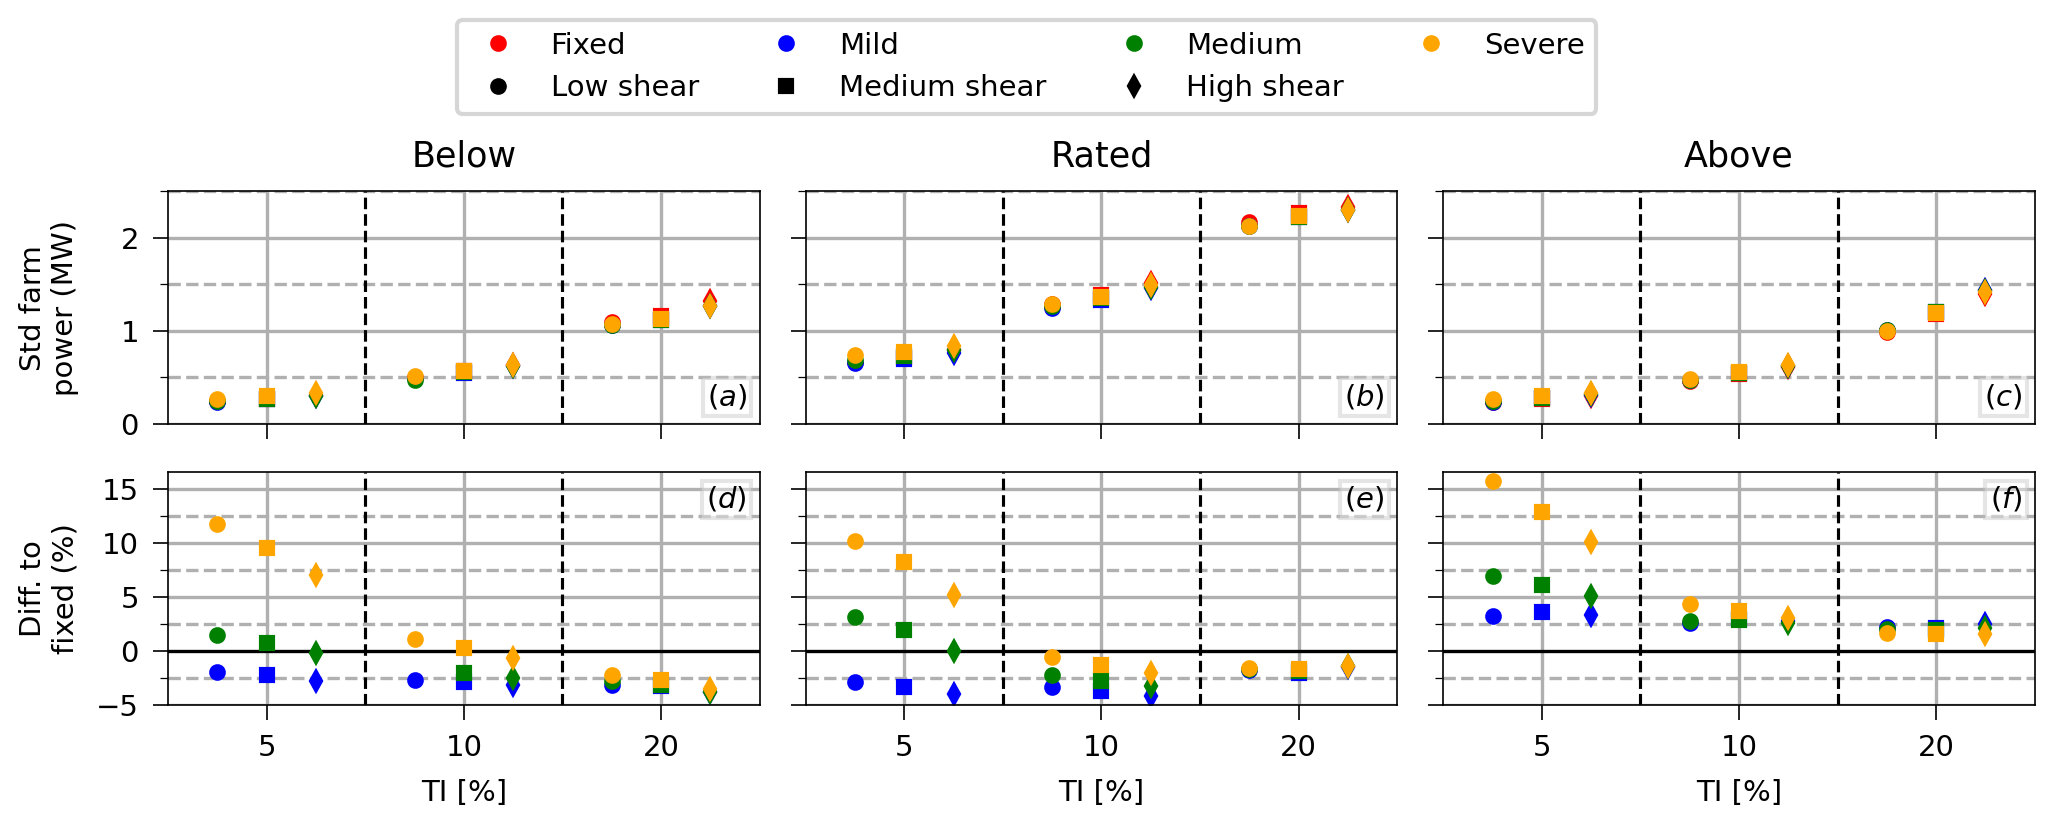
Figure 13(a–c) Standard deviation of the generated power of the whole farm for all environmental conditions and (d–f) the relative difference between the floating and the fixed farm.
4.2 Tower-base moment
Though the mean loads play a part in the DEL (as a result of the Goodman correction applied), the dynamic variation of the loads – which can be measured by the standard deviation – is the main factor influencing the DEL. Fig. 14a illustrates how the mean and standard deviation of the tower-base moment (in the fore–aft direction) vary along the array for a given wind condition (mean wind speed of 8 m s−1, TI 5 %, and low shear). For this particular case, the mean tower-base moment decreases from the free-stream (T1) to the first waked turbine (T2) and then increases again for the second waked turbine (T3), regardless of the turbine being floating or fixed. This behavior of the mean tower-base moment is directly related to the mean thrust force. The floating system has higher means than the fixed system due to mean floater pitch.
Differently, the standard deviation presents qualitative differences between the fixed and floating cases that show up in the DEL. As presented in Fig. 14b, even though the DEL of the floating turbines is always larger than the DEL of their fixed counterparts (due to wave-induced floater motion, which increases with sea state severity), a difference between the fixed and floating cases is how the waked turbines compare to the free-stream turbine. Figure 14b shows that, for this particular case, the DEL of the tower-base moment (which includes the contribution from both the fore–aft and side-to-side tower-base moments) increases from T1 to T2 for the fixed case, but it decreases from T1 to T2 for the floating case. This is related to the different natural frequencies of tower bending in the fixed and in the floating conditions, as discussed later in this section.
To investigate this difference between the fixed and floating arrays, Fig. 14c to e present the tower-base moment DEL for the fixed and floating turbines across all the environmental conditions considered in this work. The other two rows of Fig. 14 present the relative difference between T2 and T1 (Fig. 14f to h) and between T3 and T1 (Fig. 14i to k).
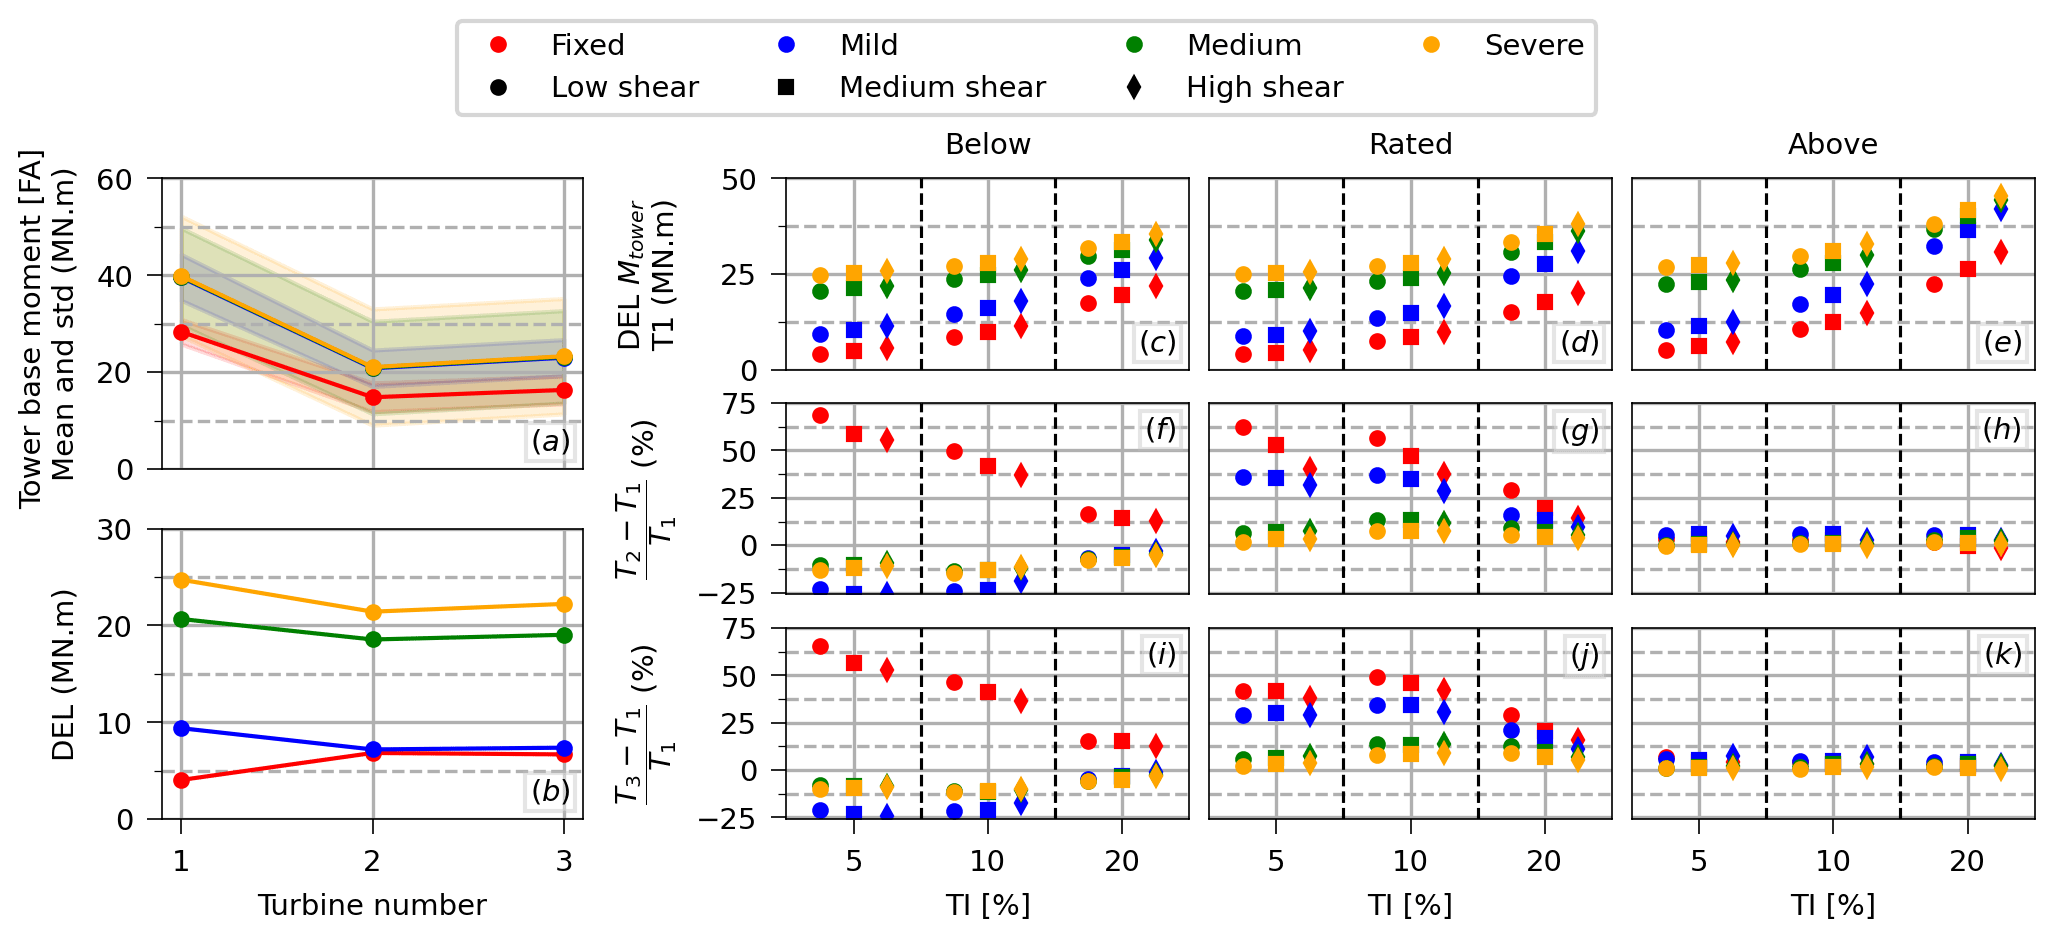
Figure 14(a) Illustration of the mean (solid line) and standard deviation (shaded area) of the fore–aft tower-base moment along the array for a given wind condition (mean wind speed 8 m s−1, TI 5 %, low shear). (b) Similar illustration, but for the tower-base moment DEL. (c–e) DEL of the tower-base moment of the free-stream turbine (T1) across all the environmental conditions considered in this work. The relative difference between the tower-base moment DEL of (f–h) the first waked turbine (T2) and T1 as well as (i–k) the second waked turbine (T3) and T1.
Figure 14c to e show that the DEL of the tower-base moment increases with the severity of the sea state, TI, and shear. Though not shown in the plots, this trend with respect to sea state, TI, and shear is true for the waked turbines as well.
Figure 14f to h and Fig. 14i to k illustrate that the reduction in DEL from T1 to T2 for the floating case observed in Fig. 14b is exclusive to below-rated conditions. For the rated condition, the waked turbines present larger DEL than T1 regardless of being fixed or floating, but this difference is less important with the severity of the sea state. This is a consequence of the relevance of the loads introduced by the wave frequency motions, which make the free-stream and waked turbines more similar. For the above-rated condition, though the tower-base moment DEL of the waked turbines is similar to the DEL of the free-stream turbines, the values for the waked floating turbines can be about 10 % larger than for the free-stream floating.
To better understand the physical effects leading to the trends observed in Fig. 14, we analyze the PSDs of the tower-base moment at the different frequencies of interest. There are four frequency ranges of interest: (i) the slow frequencies induced by the turbulent wind spectrum; (ii) the frequency range of the incoming waves, which is different for each sea state; (iii) the natural frequency of pitch; and (iv) the blade-passing frequency (3P). These different frequency ranges are illustrated in Fig. 15, which presents the PSD of the fore–aft tower-base moment of the turbines for three distinct conditions. For the severe sea state, the wave frequency range encompasses the natural frequency of heave (0.056 Hz, as also pointed out when discussing power), leading to one of the peaks identified in the PSD – caused by the inertial loads due to the center of gravity of the tower and RNA not being aligned with the tower axis, especially when the platform is tilted by the aerodynamic loads, and by the fluctuation of aerodynamic thrust due to the rotor moving vertically within the wind shear profile. Here, we focus on the fore–aft tower-base moment because its contribution to the DEL is much more relevant than the side-to-side bending moment due to the wave and wind incidence of 0°.
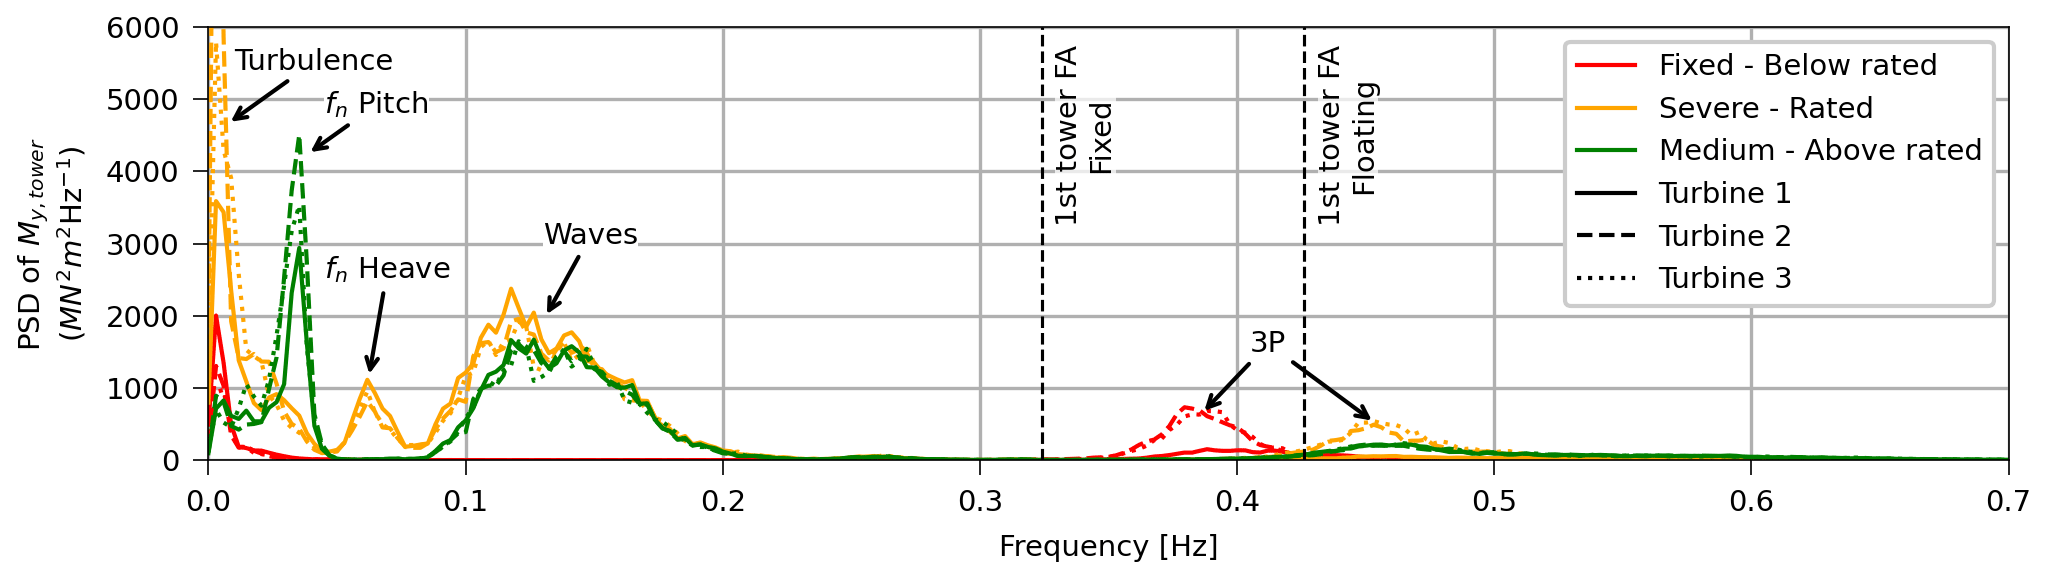
Figure 15PSD of the fore–aft tower-base moment illustrating the distinct frequencies of interest. The examples in the figure consider TI 10 % and medium shear.
Figure 16 presents the PSD of the fore–aft tower-base moment at the frequency range most excited by the turbulent wind for the three different mean wind speeds (below, at, and above rated). Each row focuses on the impact of a different aspect. The first row, Fig. 16a to c, shows that the tower-base moment excited by the turbulent wind does not depend on the sea state, as expected, but it is larger for the floating turbines than for the fixed turbines. The reason is that while the tower of a fixed turbine mostly has to resist the fluctuation of aerodynamic loads, the tower of a floating turbine also has to resist the inertial loads caused by the motions of the floating substructure induced by the fluctuating wind.
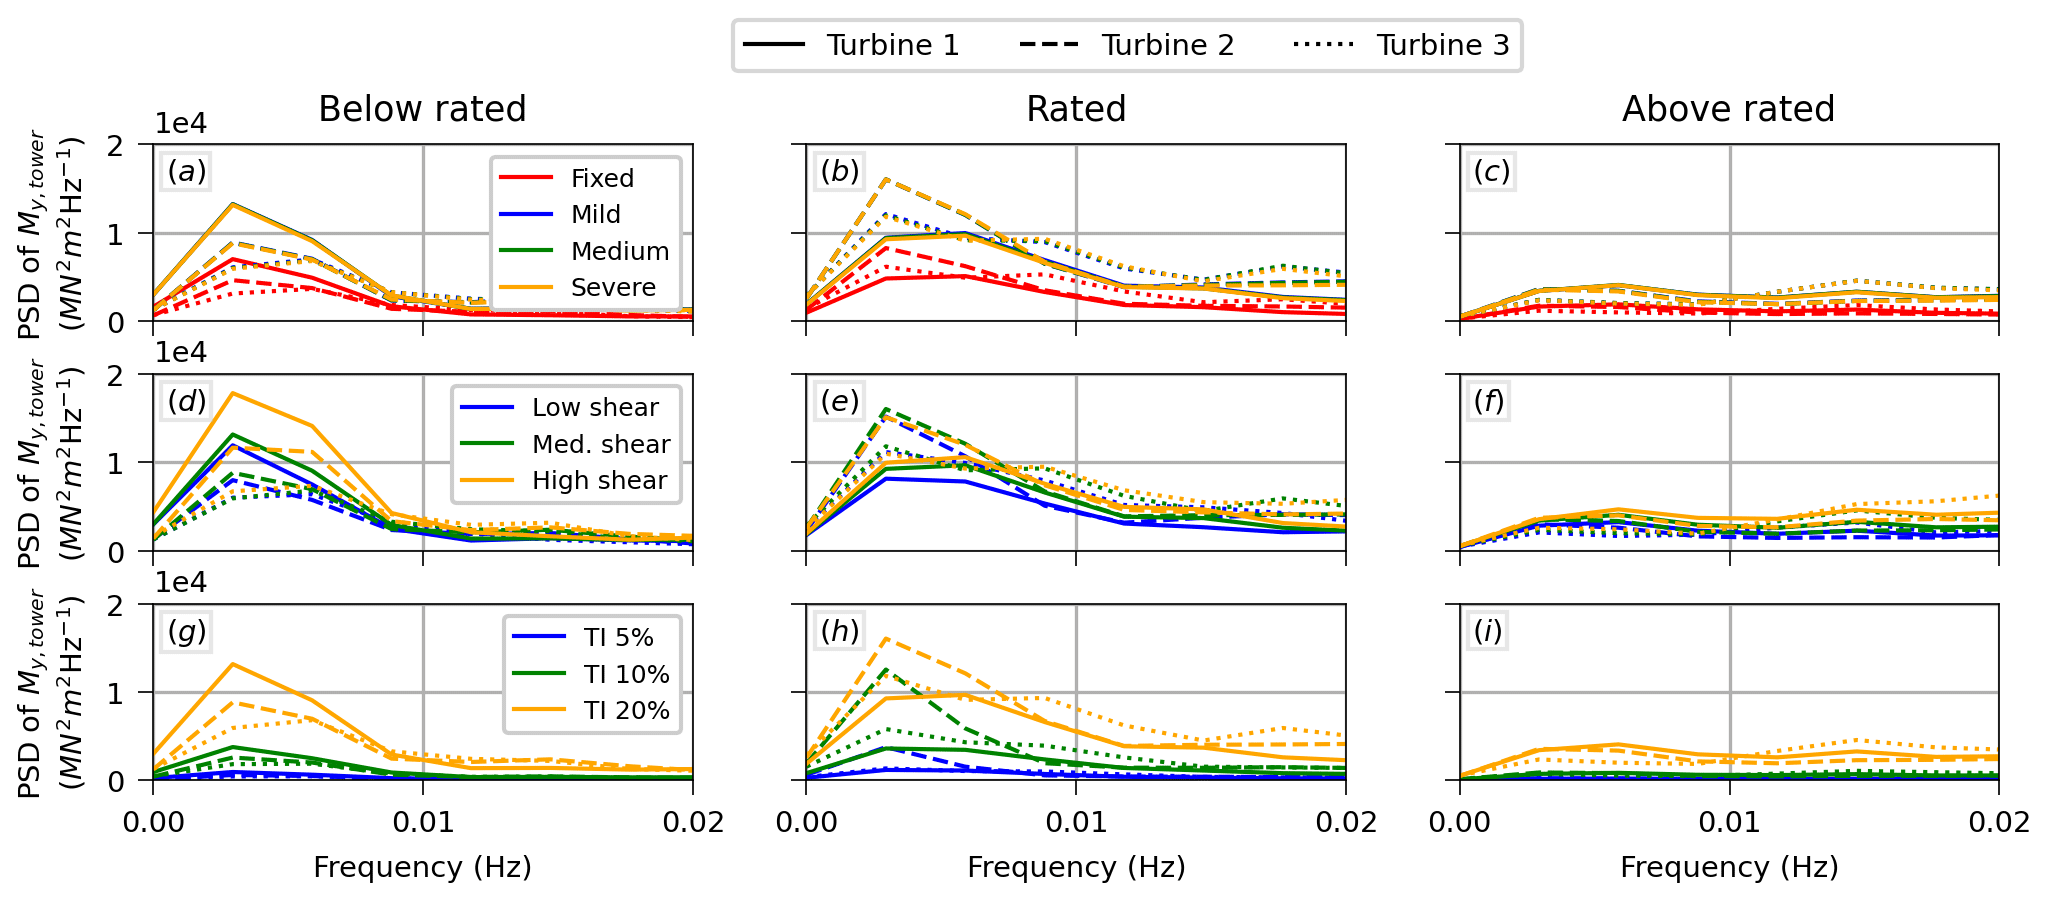
Figure 16PSD of the fore–aft tower-base moment at the frequency range excited by the turbulent wind for the three different mean wind speeds. (a–c) Different sea conditions for TI 20 % and medium shear. (d–f) Different shear conditions for the severe sea state and TI 20 %. (g–i) Different TI conditions for the severe sea state and medium shear.
For both floating and fixed turbines, the waked turbines have lower dynamic tower-base moment induced by the turbulent wind in the below-rated condition, a result of the lower apparent wind speed and consequent lower thrust. The opposite happens in the rated condition, with the waked turbines presenting larger dynamic tower-base moment because they are operating in a below-rated condition due to the velocity deficit. In the above-rated condition, the waked and free-stream turbines are very similar due to the weak wake deficit and low thrust when the blades are pitched. As expected, the importance of the tower-base moment induced by the turbulent wind increases with turbulence intensity, as evidenced by Fig. 16g to i. Figure 16d to f show that the impact of shear is less relevant, with the dynamic tower-base moment increasing with shear. The effect of shear is mostly noticeable for the below-rated wind speed, being less relevant for the rated condition and practically negligible for the above-rated condition.
Figure 17 presents the PSD of the fore–aft tower-base moment at the wave frequency range. Figure 17a evidences the large impact of sea state severity on the tower-base moment. The wave frequency range is especially important because it is wide (about 0.10 Hz slightly depending on the sea condition), thus contributing significantly to the standard deviation, and occurs at relatively high frequencies (relative to the low-frequency wind), thus heavily impacting the tower-base moment DEL. As shown by Fig. 17b, the wind condition impacts the tower-base moment at the wave frequency range only slightly via the mean wind speed, but the impact of shear or TI is negligible in the wave frequency range.
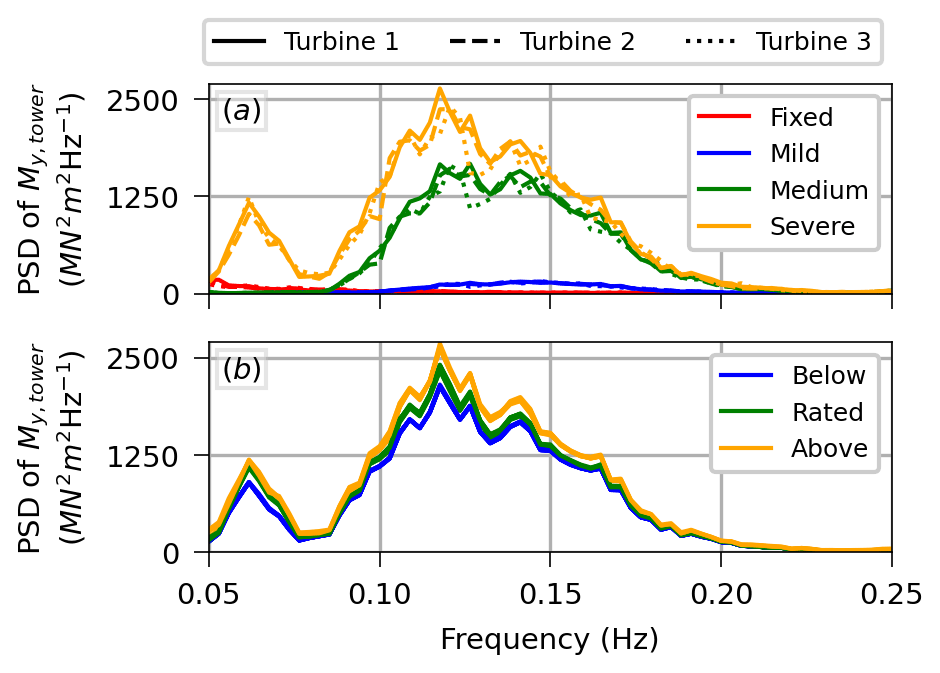
Figure 17PSD of the fore–aft tower-base moment at the incoming wave frequency range. (a) Different sea states for a given wind condition (mean wind speed 18.0 m s−1, TI 10 %, and medium shear). (b) For the severe sea state, the response of the second turbine of the array (T2) for all the wind conditions considered in this work (different TI and shear levels are not explicitly distinguished in the plot).
Though other frequency ranges are also responsible for the larger tower-base moment DEL of the floating turbines compared to their fixed counterparts – such as the 3P frequency range discussed ahead – most of this difference is due to the wave frequency range. Because the wave frequency range has a large contribution to the DELs and is not affected by the wake, the wake effects are not as important for the tower-base moment of the floating array as for the fixed array (see Fig. 14f to k).
Besides the wave frequency range, another frequency range of interest exclusively experienced by the floating turbines is the natural frequency of the pitch of the floating substructure, which is about 0.039 Hz. This frequency is excited by the control system in above-rated speeds as the rotor-collective blade-pitch controller resonates with the natural frequency of pitch of the floating substructure. Hence, it is observed for the above-rated mean wind speed and, to a smaller extent, for the rated mean wind speed as the relative wind speed transitions between below and above rated. This frequency range is illustrated in Fig. 18 for the above-rated mean wind speed only. As expected, the dynamic tower-base moment at this frequency range increases with the turbulence intensity, as shown in Fig. 18c. It also increases with shear, as presented in Fig. 18b, but to a smaller extent. It is more significant for the waked turbines than for the free-stream turbine.
Perhaps surprisingly, Fig. 18a shows that the magnitude of the tower-base moment around the natural frequency of the platform pitch decreases with the severity of the sea state. Though the slow floater pitch induced by the second-order wave loads is indeed larger for the mild sea state in wave-only conditions, the wave loading is negligible for the slow pitch in the face of the turbulent wind; hence, it is not the explanation. It is not clear why this happens, but it is possible that the larger motions induced at the frequency of the waves increase the damping at the natural frequency of pitch. It is worth mentioning that the fluctuation at the natural frequency of pitch could be attenuated by adapting the controller, for instance by adding a floating feedback term to the pitch control signal (Abbas et al., 2022), but this feedback is not included in the baseline controller used here.
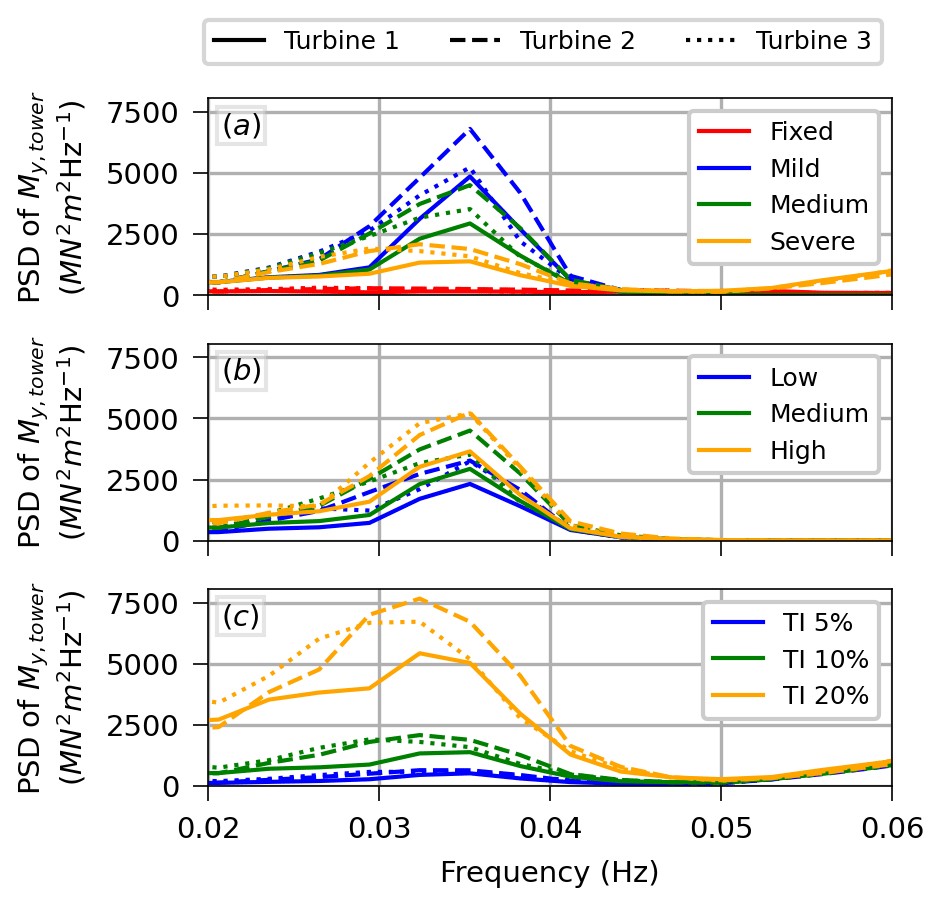
Figure 18PSD of the fore–aft tower-base moment around the natural frequency of pitch for the above-rated condition (mean wind speed 18.0 m s−1). (a) Different sea conditions for TI 10 % and medium shear. (b) Different shear conditions for the severe sea state and TI 10 %. (c) Different TI conditions for the severe sea state and medium shear.
The last range of interest is the blade-passing frequency range, illustrated in Fig. 19. The middle and bottom rows in Fig. 19d to i show that the fore–aft tower-base moment at the 3P frequency range increases with shear, though only slightly in the rated condition, and with TI. The top row in Fig. 19a to c shows that the fore–aft tower-base moment at the 3P frequency range is insensitive to the sea state, which is expected for this frequency range that is rotor-dominated.
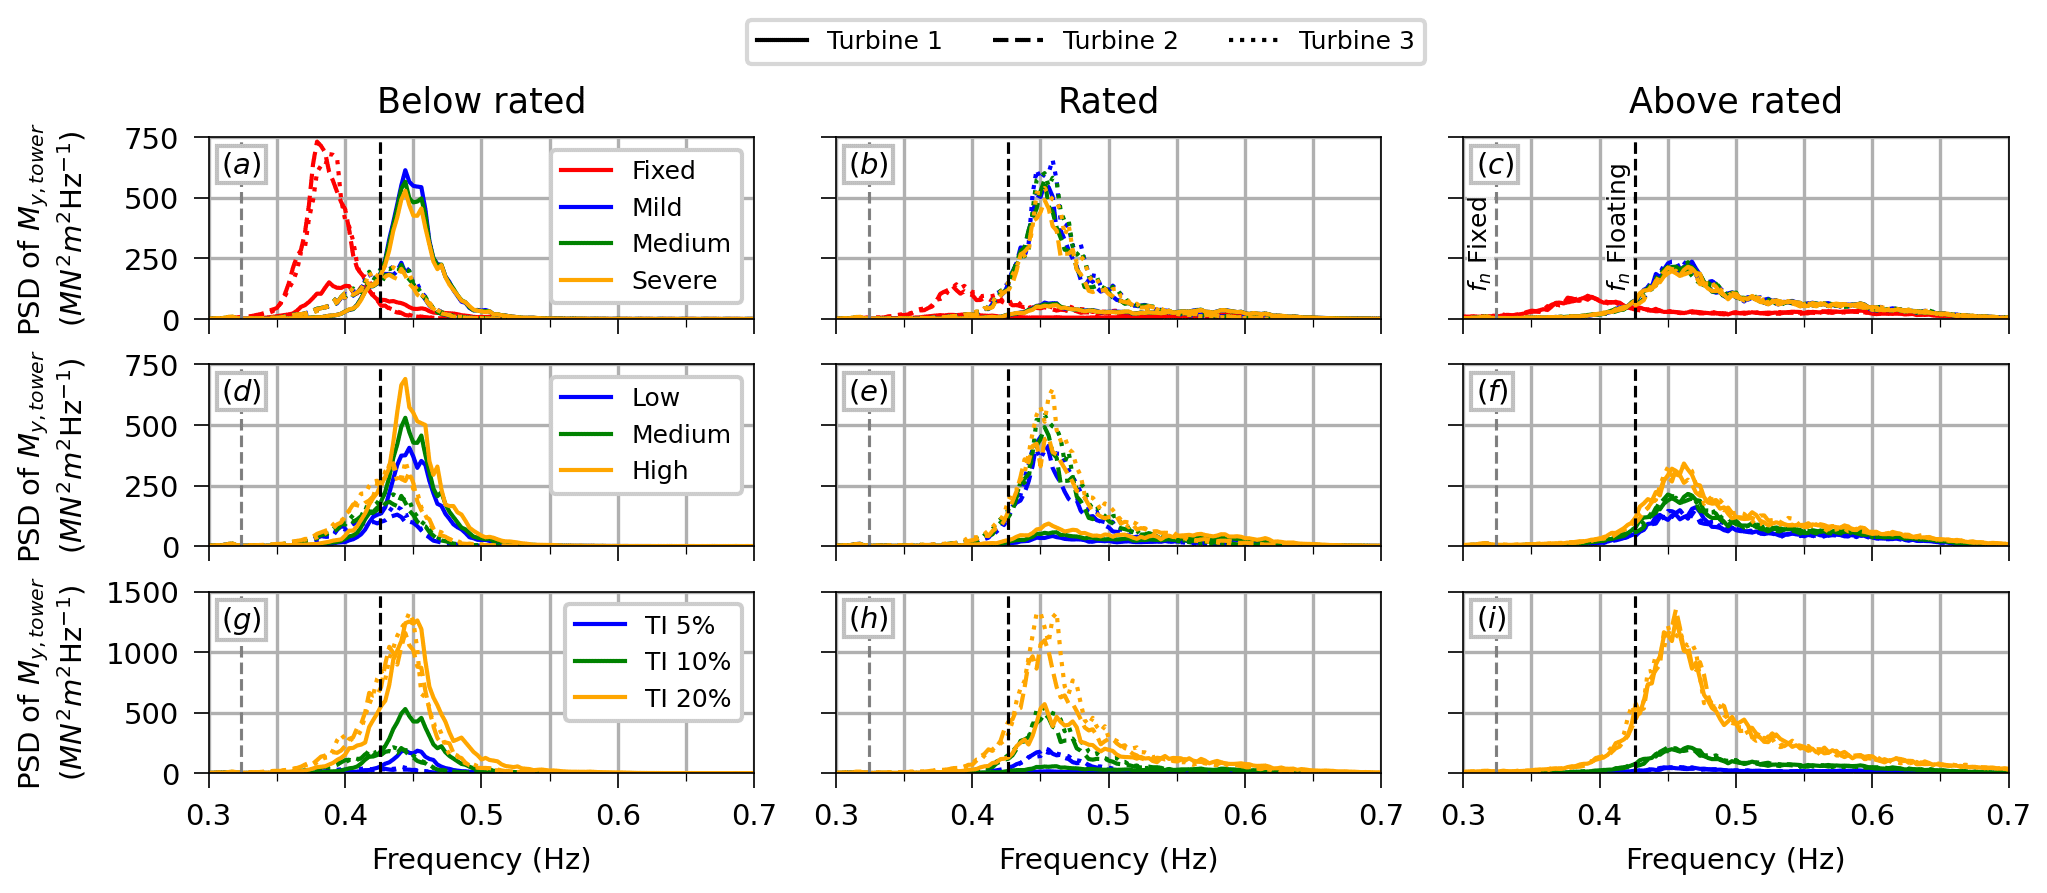
Figure 19PSD of the fore–aft tower-base moment at the 3P frequency range for the three different mean wind speeds. (a–c) Different sea conditions for TI 10 % and medium shear. (d–f) Different shear conditions for the severe sea state and TI 10 %. (g–i) Different TI conditions for the severe sea state and medium shear.
Figure 19a shows an interesting qualitative difference between the floating and fixed turbines for the below-rated mean wind speed. Due to the different boundary condition at the base of the tower, the first natural bending frequency of the tower for the fixed condition is 0.324 Hz, which is significantly lower than for the tower atop the OC4-DeepCwind semisubmersible of 0.426 Hz. As shown in Fig. 20, the 3P frequency range – which is essentially the same for both the fixed and floating turbines – of the free-stream turbine in the below-rated condition has significant content around 0.426 Hz. The first waked turbine operates at a lower rotor speed so that the 3P frequency range does not excite tower resonance as much. As a consequence, the waked floating turbines present a smaller tower-base moment at the 3P frequency than the free-stream floating turbine. The opposite occurs for the fixed turbine, with the waked turbines presenting a 3P frequency range that is closer to 0.324 Hz than the free-stream unit. Hence, for the below-rated mean wind speed, the waked fixed turbines present a larger tower-base moment at the 3P frequency than the free-stream fixed turbines. This effect is only present for the below-rated wind speed, and it is the reason for the reduction in the DEL of the tower-base moment from T1 to T2 and T3 observed in Fig. 14f and i for the floating turbines. Clearly, this reduction in DEL from T1 to the waked turbines depends on the tower natural frequency. For the rated condition, the waked turbines present larger loads than T1 at the 3P range for both the fixed and floating turbines – see Fig. 19b, e, and h. No difference is observed between waked and free-stream turbines for the above-rated condition – see Fig. 19c, f, and i – due to the weak wake deficit and low thrust when the blades are pitched.
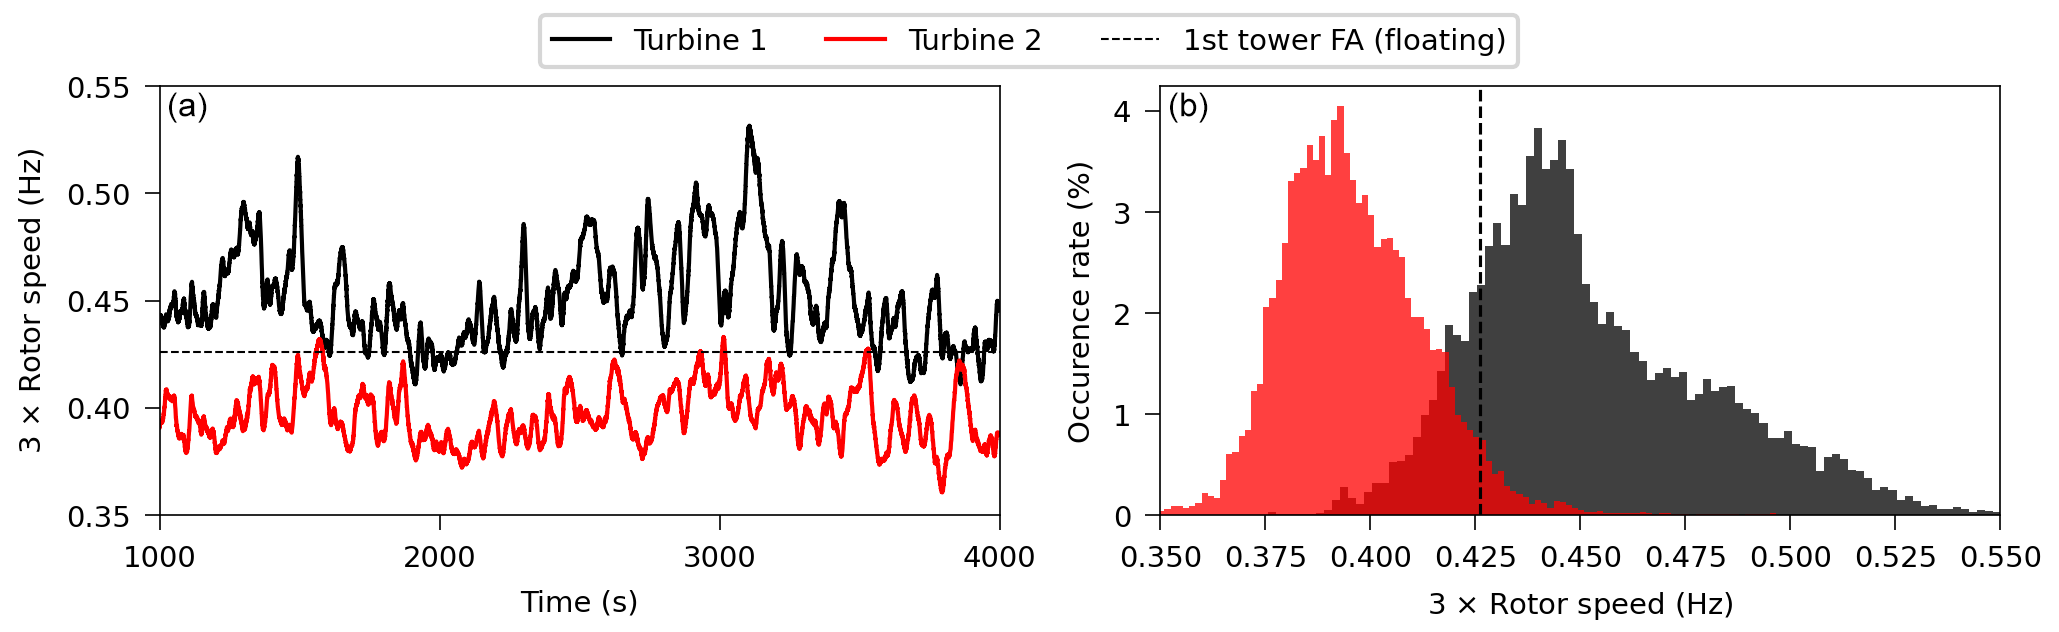
Figure 20Time series (a, one seed only) and histogram (b, all six seeds) of the blade-passing frequency (3P) for the below-rated wind speed, TI 10 %, medium shear, and medium sea condition.
This work presented an investigation of the mutual interaction between the motions of floating wind turbines and wakes using FAST.Farm. Since FAST.Farm had never been validated for FOWT applications, the paper consists of two parts: a validation against high-fidelity simulation results reported in the literature and the study of a three-unit floating array across a wide range of environmental conditions. For both parts, we considered the NREL 5 MW reference wind turbine atop the OC4-DeepCwind semisubmersible.
The validation process against LES results showed that the original axisymmetric (polar) wake model of FAST.Farm overpredicts the vertical wake deflection induced by shaft tilt and floater pitch. On the other hand, the new curled wake model provides very good agreement with the LES results. The validation process also evidenced two limitations of the FAST.Farm model. The first is a nonphysical behavior of the wake of the floating turbines in place of what in reality would be pulsations in the wake associated with floater motion that is visible in the flow-field snapshots of the simulations. This behavior is exclusive to floating wind applications and is due to a limitation of the current formulation employed in FAST.Farm. For now, we adopted a workaround that consists of filtering the impact of motions of the floater on the wake. Though this leads to a reduction in the amplitude of pulsations in the wake induced by motions of the floating substructure, it is not expected to significantly affect the conclusions of the present work, although this limitation should be assessed in future work. The second limitation is the lack of an atmospheric Coriolis effect captured by LES that is not in FAST.Farm. Together with differences in the inflow, this leads to some differences between the horizontal wake deflection predicted with the curled wake model and the LES results. Overall, though, this horizontal deflection is small and is not expected to significantly affect the conclusions of this work (and will be latitude-dependent).
In the second part of this work, we used FAST.Farm to analyze a three-unit floating array across a wide range of environmental conditions, including variations in mean hub-height wind speed (below, at, and above rated), shear profile (low to high shear), turbulence intensity (low to high turbulence levels), and sea state severity (mild, medium, and severe). The turbines were aligned with both the wind and the waves with a spacing of 7 diameters (7D=882 m). To assess the effect of the floating substructure, we compared the power production, tower-base moments, and blade-root moments obtained for the floating turbines with the ones obtained in a fixed configuration. The main differences introduced by the floating substructure are the motions induced by the waves and wind, the change in the natural frequencies of the tower caused by differences in the boundary condition at tower bottom, and the larger vertical wake deflection due to the mean pitch of the platform.
Concerning the mean generator power, the performance of the floating array compared to the equivalent fixed array is the outcome of three different effects: (i) the mean pitch angle of the floating substructure, which reduces power by increasing the relative angle between the rotor and the incoming wind (similar to yaw misalignment); (ii) the motions of the floating substructure, which tend to increase generator power in the below-rated condition (an effect that could be different depending on turbine control); and (iii) the larger vertical wake deflection compared to the fixed turbine, which increases the power available to downwind units. Because shear and TI play a role in the wake, they affect the performance of the downstream turbines. Overall, the best scenario observed for the waked floating turbines (in terms of power production compared to the fixed case) is in below-rated wind speed, low TI, low shear, and severe sea state, although this scenario is not expected to be common in reality.
The motions of the floating substructure increase the fluctuation of the generator power compared to the fixed structure. However, for the medium and high turbulence levels, this effect is offset by a smaller fluctuation of power at the frequency range of the turbulent wind for the floating turbines – due to the mean pitch angle of the platform – in below- and at-rated conditions. In above-rated conditions, the control system can attenuate the fluctuations at the frequency of the turbulent wind but not wave-induced fluctuations, resulting in larger power fluctuation for the floating array compared to the fixed array regardless of turbulence levels.
The tower-base moment of the floating turbines is considerably larger than that of their fixed counterparts, with certain cases exhibiting DELs nearly 7 times greater. This is mostly due to the large contribution of the inertial loads caused by the motions of the floating substructure. Because of the large influence of these inertial loads, which are insensitive to the wake, wake effects are less relevant for the tower-base moment of the floating turbines than for the fixed turbines. Moreover, while the wake increases the tower-base moment DEL of the fixed turbine for all wind conditions – except above rated, where wake effects did not play a significant role – this is not always the case for the floating turbines. For the below-rated condition, the waked floating turbines presented a lower tower-base moment DEL than the free-stream unit. This reduction is related to the lower 3P frequency of the waked turbines compared to the free-stream unit, which happens in the below-rated condition, and to the higher natural bending frequency of the tower for the floating case. This effect depends on the natural frequencies of the tower so that a different behavior might be observed for other concepts.
Motions of the floating substructure did not impact the blade-root moment in a meaningful way. Therefore, the blade-root moment DEL of the floating turbines, both free-stream and waked, is very similar to the one exhibited by their fixed counterparts for all environmental conditions analyzed in this work.
A natural progression for the present work is to address the limitations of FAST.Farm observed during validation to capture pulsations in the wake associated with floater motions and the Coriolis effect. Moreover, a similar analysis could be performed considering other wind farm layouts (including the number of turbines, their placement, and their spacing), wind and wave directionality, different floater concepts, and different turbine sizes. Other quantities of interest, such as tower-base yaw moment and mooring loads, should also be investigated.
The blade-root moment DEL is nearly completely due to the fluctuations at the turbulence frequency range and at the rotor speed range (1P), as illustrated in Fig. A1, with no significant blade moment at the wave frequency range or at the natural frequencies of motions of the floater. As a consequence, the blade-root moment DEL of the floating turbines is very similar to the one exhibited by the fixed turbine. This is illustrated in Fig. A2a, which shows how the mean and standard deviation of the blade-root moment – in the out-of-plane direction – vary along the array for a given wind condition (mean wind speed of 8 m s−1, TI 5 %, and low shear). Figure A2b is a similar plot but for the blade-root moment DEL resulting from both the out-of-plane and in-plane blade-root moments. Figure 14c to k present the blade-root moment DEL (combining the effects of out-of-plane and in-plane moments) for the fixed and floating turbines across all the environmental conditions considered in this work.
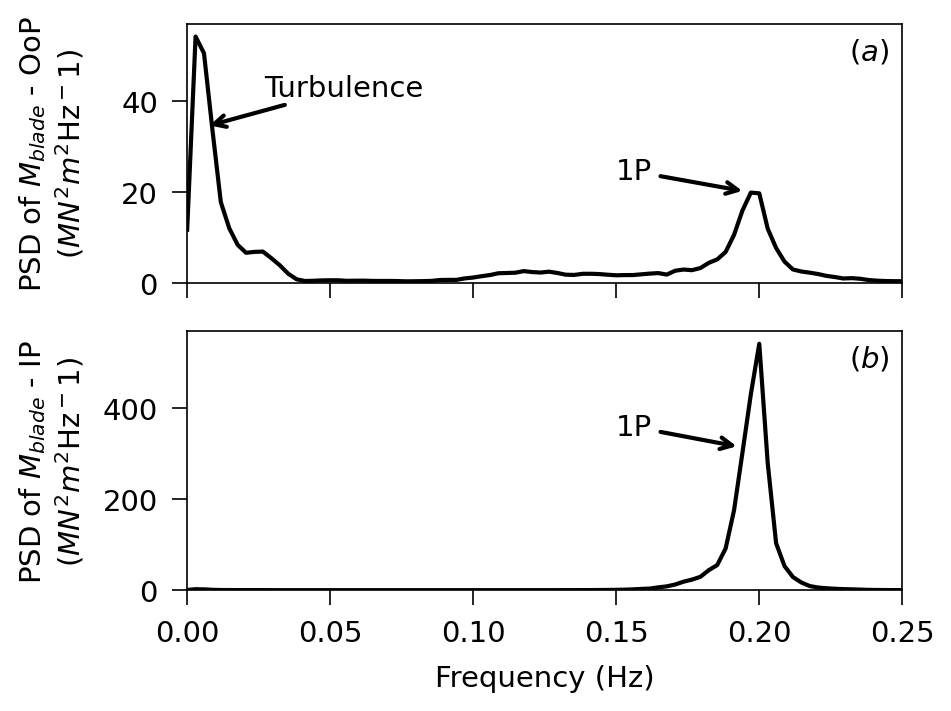
Figure A1PSD of the out-of-plane (a) and in-plane (b) blade-root moment for the rated wind speed, TI 10 %, medium shear, and medium sea condition.
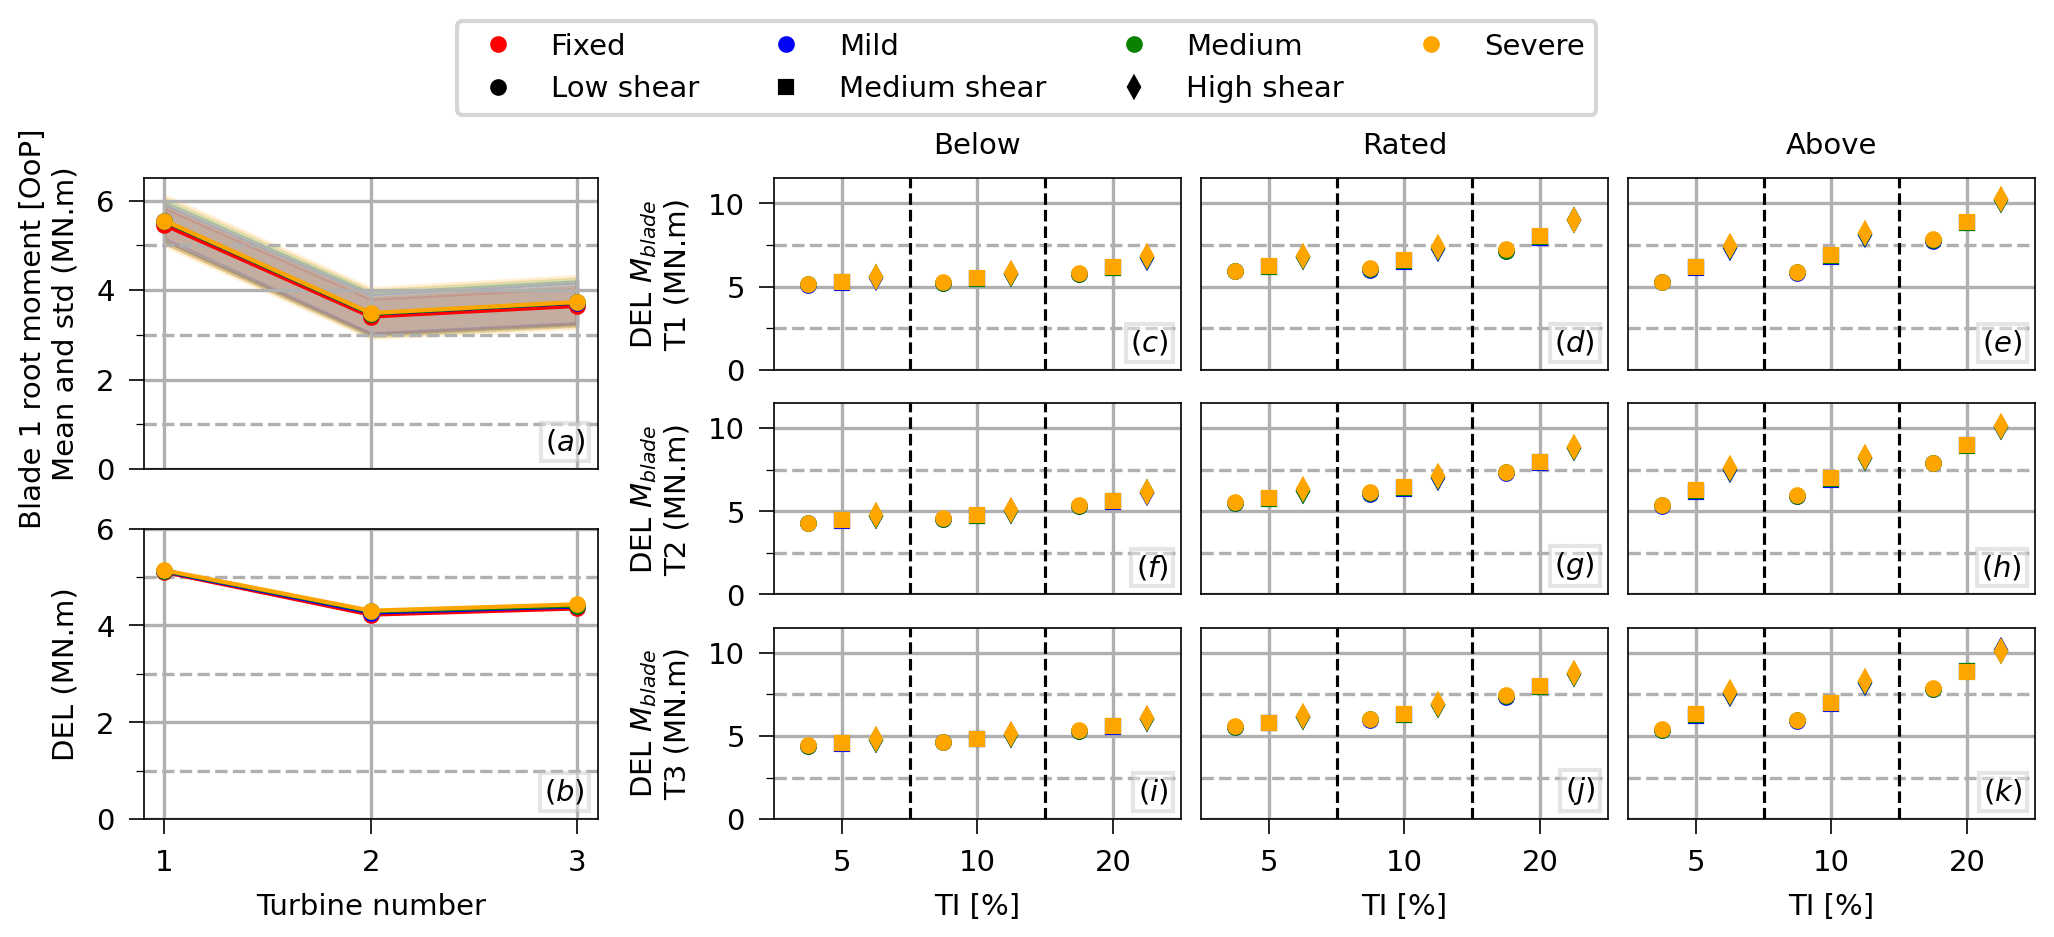
Figure A2(a) Illustration of the mean (solid line) and standard deviation (shaded area) of the out-of-plane blade-root bending moment along the array for a given wind condition (mean wind speed 8 m s−1, TI 5 %, low shear). (b) Similar illustration, but for the blade-root bending moment DEL. The relative difference between the blade-root bending moment DEL of the floating turbines compared to their fixed counterparts for all environmental conditions for (c–e) the first turbine in the array, (f–h) the second, and (i–k) the third.
Simulations were performed using FAST.Farm (available at https://www.github.com/OpenFAST/openfast, last access: 5 September 2024; https://doi.org/10.5281/zenodo.6324287, Jonkman et al., 2023). Data are available from the authors upon request.
LC: methodology, investigation, data curation, formal analysis, validation, writing (original draft). JJ: conceptualization, formal analysis, supervision, funding acquisition, writing (review and editing). RT: data curation, supervision.
The contact author has declared that none of the authors has any competing interests.
The views expressed in the article do not necessarily represent the views of the DOE or the US government.
Publisher’s note: Copernicus Publications remains neutral with regard to jurisdictional claims made in the text, published maps, institutional affiliations, or any other geographical representation in this paper. While Copernicus Publications makes every effort to include appropriate place names, the final responsibility lies with the authors.
The research was performed using computational resources sponsored by the U.S. Department of Energy's Office of Energy Efficiency and Renewable Energy and located at the National Renewable Energy Laboratory.
This work was authored by the National Renewable Energy Laboratory, operated by the Alliance for Sustainable Energy, LLC, for the U.S. Department of Energy (DOE) under Contract No. DE-AC36-08GO28308. Funding provided by the U.S. Department of Energy Office of Energy Efficiency and Renewable Energy Wind Energy Technologies Office.
This paper was edited by Yi Guo and reviewed by two anonymous referees.
Abbas, N. J., Zalkind, D. S., Pao, L., and Wright, A.: A reference open-source controller for fixed and floating offshore wind turbines, Wind Energ. Sci., 7, 53–73, https://doi.org/10.5194/wes-7-53-2022, 2022. a
Angelou, N., Mann, J., and Dubreuil-Boisclair, C.: Revealing inflow and wake conditions of a 6 MW floating turbine, Wind Energ. Sci., 8, 1511–1531, https://doi.org/10.5194/wes-8-1511-2023, 2023. a
Branlard, E., Martínez-Tossas, L., and Jonkman, J.: A time-varying formulation of the curled wake model within the FAST.Farm framework, Wind Energy, 26, 44–63, 2023. a, b, c, d
Churchfield, M. and Lee, S.: SOWFA: Simulator fOr Wind Farm Applications, https://www.nrel.gov/wind/nwtc/sowfa.html (last access: 5 September 2024), 2015. a
Doubrawa, P., Annoni, J., and Jonkman, J.: Optimization-based calibration of FAST.Farm parameters against large-eddy simulations, in: 2018 Wind Energy Symposium,Kissimmee, Florida, USA, 8–12 January 2018, p. 0512, https://doi.org/10.2514/6.2018-0512, 2018. a
Equinor: Hywind Scotland, https://www.equinor.com/energy/hywind-scotland (last access: 5 September 2024), 2023. a
Equinor: Hywind Tampen, https://www.equinor.com/energy/hywind-tampen (last access: 5 September 2024), 2024. a
Fleming, P., Gebraad, P., Lee, S., van Wingerden, J.-W., Johnson, K., Churchfield, M., Michalakes, J., Spalart, P., and Moriarty, P.: Simulation comparison of wake mitigation control strategies for a two-turbine case, Wind Energy, 18, 2135–2143, 2015. a
Fu, S., Jin, Y., Zheng, Y., and Chamorro, L.: Wake and power fluctuations of a model wind turbine subjected to pitch and roll oscillations, Appl. Energ., 253, 113605, https://doi.org/10.1016/j.apenergy.2019.113605, 2019. a
Gaertner, E., Rinker, J., Sethuraman, L., Zahle, F., Anderson, B., Barter, G., Abbas, N., Meng, F., Bortolotti, P., Skrzypinski, W., Scott, G., Roland, F., Bredmose, H., Dykes, K., Shields, M., Allen, C., and Viselli, A.: IEA Wind TCP Task 37: Definition of the IEA 15-megawatt offshore reference wind turbine, Tech. rep., National Renewable Energy Lab. (NREL), Golden, CO (United States), https://doi.org/10.2172/1603478, 2020. a
GWEC: GLOBAL WIND REPORT 2023, Tech. rep., Global Wind Energy Council, https://gwec.net/wp-content/uploads/2023/04/GWEC-2023_interactive.pdf (last access: 5 September 2024), 2023. a, b
Hall, M.: MoorDyn user's guide, Tech. rep., University of Maine, Orono, ME, USA, https://www.nrel.gov/wind/nwtc/moordyn.html (last access: 5 September 2024), 2015. a
Huang, Y. and Wan, D.: Investigation of interference effects between wind turbine and spar-type floating platform under combined wind-wave excitation, Sustainability, 12, 246, https://doi.org/10.3390/su12010246, 2019. a
IEC: Wind turbines – Part 1: Design requirements, Tech. rep., International Electrotechnical Commission (IEC), https://webstore.iec.ch/en/publication/26423 (last access: 5 September 2024), 2005. a
Johlas, H., Martínez-Tossas, L., Schmidt, D., Lackner, M., and Churchfield, M.: Large eddy simulations of floating offshore wind turbine wakes with coupled platform motion, J. Phys. Conf. Ser., 1256, 012018, https://doi.org/10.1088/1742-6596/1256/1/012018, 2019. a, b
Johlas, H., Martínez-Tossas, L., Lackner, M., Schmidt, D., and Churchfield, M.: Large eddy simulations of offshore wind turbine wakes for two floating platform types, J. Phys. Conf. Ser., 1452, 012034, https://doi.org/10.1088/1742-6596/1452/1/012034, 2020. a, b, c, d, e, f, g, h, i, j, k, l, m, n, o
Johlas, H., Martínez-Tossas, L., Churchfield, M., Lackner, M., and Schmidt, D.: Floating platform effects on power generation in spar and semisubmersible wind turbines, Wind Energy, 24, 901–916, 2021. a, b
Johlas, H., Schmidt, D., and Lackner, M.: Large eddy simulations of curled wakes from tilted wind turbines, Renew. Energ., 188, 349–360, 2022. a
Jonkman, B.: TurbSim user's guide: Version 1.50, Tech. rep., National Renewable Energy Lab. (NREL), Golden, CO, USA, https://www.nrel.gov/docs/fy09osti/46198.pdf (last access: 5 September 2024), 2009. a
Jonkman, B., Mudafort, R., Platt, A., Branlard, E., Sprague, M., Jonkman, J., Ross, H., Hayman, G., Hall, M., Vijayakumar, G., Buhl, M., Bortolotti, P., Ananthan, S., Rood, J., Damiani, R., Mendoza, N., Long, H., Schunemann, P., Slaughter, D., Sharma, A., Shaler, K., Housner, S., Sakievich, P., Bendl, K., Carmo, L., Quon, E., Phillips, M., Kusuno, N., and Salcedo, A.: OpenFAST/openfast: v3.4.1, Zenodo [code], https://doi.org/10.5281/zenodo.6324287, 2023. a, b, c
Jonkman, J. and Shaler, K.: FAST.Farm user's guide and theory manual, Tech. rep., National Renewable Energy Lab. (NREL), Golden, CO, USA, https://www.nrel.gov/docs/fy21osti/78485.pdf (last access: 5 September 2024), 2021. a, b, c
Jonkman, J., Butterfield, S., Musial, W., and Scott, G.: Definition of a 5-MW reference wind turbine for offshore system development, Tech. rep., National Renewable Energy Lab. (NREL), Golden, CO, USA, https://www.nrel.gov/docs/fy09osti/38060.pdf (last access: 5 September 2024), 2009. a, b, c, d
Jonkman, J., Hayman, G., Jonkman, B., Damiani, R., and Murray, R.: AeroDyn v15 user's guide and theory manual, Tech. rep., National Renewable Energy Lab. (NREL), Golden, CO, USA, https://www.nrel.gov/wind/nwtc/assets/pdfs/aerodyn-manual.pdf (last access: 5 September 2024), 2015. a
Jonkman, J., Annoni, J., Hayman, G., Jonkman, B., and Purkayastha, A.: Development of FAST.Farm: A new multi-physics engineering tool for wind-farm design and analysis, in: 35th Wind Energy Symposium, p. 0454, Grapevine, Texas, USA, 9–13 January 2017, https://doi.org/10.2514/6.2017-0454, 2017. a, b, c
Jonkman, J., Doubrawa, P., Hamilton, N., Annoni, J., and Fleming, P.: Validation of FAST.Farm against large-eddy simulations, J. Phys. Conf. Ser., 1037, 062005, https://doi.org/10.1088/1742-6596/1037/6/062005, 2018. a
Kim, S., Shin, H., Joo, Y., and Kim, K.: A study of the wake effects on the wind characteristics and fatigue loads for the turbines in a wind farm, Renew. Energ., 74, 536–543, https://doi.org/10.1016/j.renene.2014.08.054, 2015. a
Kretschmer, M., Jonkman, J., Pettas, V., and Cheng, P. W.: FAST.Farm load validation for single wake situations at alpha ventus, Wind Energ. Sci., 6, 1247–1262, https://doi.org/10.5194/wes-6-1247-2021, 2021. a, b
Larsen, G., Madsen, H., Thomsen, K., and Larsen, T.: Wake meandering: a pragmatic approach, Wind Energy, 11, 377–395, https://doi.org/10.1002/we.267, 2008. a
Li, Z., Dong, G., and Yang, X.: Onset of wake meandering for a floating offshore wind turbine under side-to-side motion, J. Fluid Mech., 934, A29, https://doi.org/10.1017/jfm.2021.1147, 2022. a
Messmer, T., Hölling, M., and Peinke, J.: Enhanced recovery caused by nonlinear dynamics in the wake of a floating offshore wind turbine, J. Fluid Mech., 984, A66, https://doi.org/10.1017/jfm.2024.175, 2024. a
Nunemaker, J. and Abbas, N.: pCrunch, GitHub [code], https://github.com/NREL/pCrunch (last access: 5 September 2024), 2023. a
Ocean Winds: WindFloat Atlantic, https://www.oceanwinds.com/projects/windfloat-atlantic-project/ (last access: 5 September 2024), 2023. a
Quon, E.: SAMWICH Box: A Python-based toolbox for Simulated And Measured Wake Identification and CHaracterization, GitHub [code], https://github.com/ewquon/waketracking, 2017. a
Quon, E., Doubrawa, P., and Debnath, M.: Comparison of rotor wake identification and characterization methods for the analysis of wake dynamics and evolution, J. Phys. Conf. Ser., 1452, 012070, https://doi.org/10.1088/1742-6596/1452/1/012070, 2020. a
Rivera-Arreba, I., Eliassen, L., and Bachynski-Polić, E.: Effect of the vertical wake deflection on the response of a 12MW semisubmersible FWT, J. Phys. Conf. Ser., 2626, 012057, https://doi.org/10.1088/1742-6596/2626/1/012057, 2023a. a
Rivera-Arreba, I., Li, Z., Yang, X., and Bachynski-Polić, E.: Validation of the dynamic wake meandering model against large eddy simulation for horizontal and vertical steering of wind turbine wakes, arXiv [preprint], https://doi.org/10.48550/arXiv.2308.01004, 2023b. a, b, c
Rivera-Arreba, I., Wise, A., Eliassen, L., and Bachynski-Polić, E.: Effect of atmospheric stability on the dynamic wake meandering model applied to two 12MW floating wind turbines, Wind Energy, 26, 1235–1253, 2023c. a
Robertson, A., Jonkman, J., Masciola, M., Song, H., Goupee, A., Coulling, A., and Luan, C.: Definition of the semisubmersible floating system for phase II of OC4, Tech. rep., National Renewable Energy Lab. (NREL), Golden, CO, USA, https://www.nrel.gov/docs/fy14osti/60601.pdf (last access: 5 September 2024), 2014. a, b
Rockel, S., Peinke, J., Hölling, M., and Cal, R.: Dynamic wake development of a floating wind turbine in free pitch motion subjected to turbulent inflow generated with an active grid, Renew. Energ., 112, 1–16, 2017. a
Sant, T., Bonnici, D., Farrugia, R., and Micallef, D.: Measurements and modelling of the power performance of a model floating wind turbine under controlled conditions, Wind Energy, 18, 811–834, 2015. a
Schliffke, B., Aubrun, S., and Conan, B.: Wind tunnel study of a “floating” wind turbine's wake in an atmospheric boundary layer with imposed characteristic surge motion, J. Phys. Conf. Ser., 1618, 062015, https://doi.org/10.1088/1742-6596/1618/6/062015, 2020. a
Shaler, K., Jonkman, J., Barter, G. E., Kreeft, J. J., and Muller, J.: Loads assessment of a fixed-bottom offshore wind farm with wake steering, Wind Energy, 25, 1530–1554, https://doi.org/10.1002/we.2756, 2022. a, b
Thedin, R., Barter, G., Jonkman, J., Mudafort, R., Bay, C. J., Shaler, K., and Kreeft, J.: Load assessment of a wind farm considering negative and positive yaw misalignment for wake steering, Wind Energ. Sci. Discuss. [preprint], https://doi.org/10.5194/wes-2024-6, in review, 2024. a
Thomsen, K. and Sørensen, P.: Fatigue loads for wind turbines operating in wakes, J. Wind Eng. Ind. Aerod., 80, 121–136, https://doi.org/10.1016/S0167-6105(98)00194-9, 1999. a
WAMIT, I.: WAMIT User Manual – Version 7.4, Chestnut Hill, MA, USA, https://www.wamit.com/manualupdate/v74_manual.pdf (last access: 5 September 2024), 2020. a
Wen, B., Tian, X., Dong, X., Peng, Z., and Zhang, W.: Influences of surge motion on the power and thrust characteristics of an offshore floating wind turbine, Energy, 141, 2054–2068, 2017. a
Wen, B., Dong, X., Tian, X., Peng, Z., Zhang, W., and Wei, K.: The power performance of an offshore floating wind turbine in platform pitching motion, Energy, 154, 508–521, 2018. a
Wise, A. and Bachynski, E.: Wake meandering effects on floating wind turbines, Wind Energy, 23, 1266–1285, 2020. a
- Abstract
- Copyright statement
- Introduction
- Methodology
- Validation and calibration against high-fidelity simulations
- Results
- Conclusions
- Appendix A: Blade-root moment
- Code and data availability
- Author contributions
- Competing interests
- Disclaimer
- Acknowledgements
- Financial support
- Review statement
- References