the Creative Commons Attribution 4.0 License.
the Creative Commons Attribution 4.0 License.
Converging profile relationships for offshore wind speed and turbulence intensity
Gus Jeans
This paper reduces uncertainty in the quantification of offshore wind speed and turbulence intensity. A range of industry standard relationships, including those from International Electrotechnical Commission (IEC) and International Organization for Standardization (ISO), are compared with an extensive set of met mast data collected offshore northwestern Europe over recent decades. Analysis initially focused on over 1000 independent storm peak events identified within the 10 min mean wind speed data. Time series and coherent vertical profiles were subjected to detailed scrutiny and analysis, considering wind speeds at various averaging periods, turbulence intensity and gust factors. Most peak events were associated with neutral atmospheric conditions, so they were well represented by the ISO Frøya profile, with a shear close to the IEC power law exponent of α= 0.11. A new pragmatic approximation of atmospheric stability in terms of relative shear is outlined, bringing together key elements of the IEC and ISO standards. New empirical relationships to quantify offshore wind ambient turbulence intensity are described. A simple generalised form of gust factor relationship is adopted, with a coefficient that varies with averaging period. Distinct recommendations are made for estimating peak 10 min mean winds from peaks in 1 or 3 h mean winds. Finally, a simplified workflow for the estimation of extreme offshore winds is used to show how IEC and ISO relationships can be effectively combined.
- Article
(2430 KB) - Full-text XML
- BibTeX
- EndNote
1.1 Background and literature
The wind energy industry evolved onshore, where many of the standard relationships and established practices are still focused. These are established within the International Electrotechnical Commission (IEC) standards. The quantification of offshore winds for engineering design and operations has a long history in oil and gas, leading to relationships established by International Organization for Standardization (ISO). The development of offshore turbine guidelines by IEC makes extensive reference to relevant ISO standards, but some differences persist between the two traditions. These can lead to inconsistencies and potentially waste time and effort during wind energy projects. The motivations for this study include efforts to help resolve some of these inconsistencies and encourage appropriate convergence of the technical disciplines. This is now especially important as the energy transition accelerates, with an increasing number of established offshore energy operators rapidly diversifying into wind power.
The primary references for this study are IEC and ISO standards, outlined in Sect. 1.2 with other relevant literature. The IEC and ISO relationships are widely used but have not been brought together in this way before for empirical evaluation using most of the relevant available measured data. There are too many publications on related theory and observations to cite here, with reviews provided by texts such as Landberg (2015), Emeis (2018), and Holmes and Bekele (2020). Most previous wind energy publications have focused on normal wind speeds, while this paper provides a new and different focus on measured storm peak events. A primary application of this work is estimation of extreme wind speeds for design of wind energy generation systems, including turbines and fixed or floating support structures. Results of significance to normal winds, for resource assessment, engineering design or operations can also be derived.
1.2 Standard relationships
This paper considers three types of vertical profile relationships, which are not independent but closely related to each other. The first type of relationship considers profiles of mean wind speed. At any point above the sea surface, there are an infinite number of possible mean wind speed values, each corresponding to a different averaging period. In practical terms, averaging periods from a few seconds to several decades are of interest for offshore wind energy. Most engineering applications require wind speed averages over periods of 10 min or 1 h. Shorter-duration gusts are considered below, very appropriately after turbulence intensity. In broad terms, the IEC guidelines specify power laws, while ISO tends to prefer logarithmic profiles. Both can provide a pragmatic representation of the wind speed profile in the surface layer in the absence of strong atmospheric stability or instability. A power law gives the wind speed U(z) at height z as a function of wind speed U(zr) at height zr according to Eq. (1):
The power law exponent α is widely known as the shear parameter in wind energy applications. A value of α= 0.11 is given for 50-year extreme profiles of 10 min mean wind speed for onshore wind turbines by IEC 61400-1:2019. The same value is inherited by IEC 61400-3-1:2019 for offshore turbines, which also gives α= 0.14 for normal offshore wind conditions. The following Frøya logarithmic profile is given by ISO 19901-1:2015 for offshore storm conditions, characterised by nearly neutral atmospheric stability:
where , and U(zr) is the 1 h mean wind speed at zr= 10 m above the sea surface. The ISO Frøya profile is a special case of the logarithmic profile, in which the roughness length can be determined from the wind speed at just one elevation. Pragmatically, U(zr) can be found by fitting any measured wind profile to Eq. (2). This paper will demonstrate that Eq. (2) can also be applied when U(zr) is the 10 min mean wind speed at zr= 10 m, of more direct relevance to offshore wind energy. This follows the fact that U(zr) is the 40 min mean wind speed at zr= 10 m in the original Frøya formulation of Andersen and Løvseth (2006). The performance of the IEC and ISO relationships is compared in Sect. 3.1 and then brought together in a new wind shear characterisation framework in Sect. 3.2.
The second type of vertical profile relationship considered in this paper is turbulence intensity. This is a critical parameter for wind turbine design that is often associated with considerable uncertainty in offshore wind energy projects, especially when site-specific measurements are only available from floating lidar. Turbulence intensity plays a secondary role in some other long-established wind engineering applications. It is often only an intermediate calculation used to determine appropriate gust factors, considered further below.
A range of turbulence intensity relationships from IEC 61400-1:2019 and IEC 61400-3-1:2019 will be briefly considered in Sect. 3.3 this paper, but the equations are not duplicated here. An especially useful relationship is provided by the offshore turbulence model outlined by Wang et al. (2014), referred to by IEC 61400-3-1:2019. Of more relevance to this paper is the Frøya relationship for turbulence intensity Iu(z) at height z given by ISO 19901-1:2015:
where again U(zr) is the 1 h mean wind speed at zr = 10 m in the original formulation. This paper suggests that taking U(zr) as the more directly available 10 min mean wind speed adds a little desirable conservatism, making a small difference compared to variability within measured storm peak events. This paper also introduces the first publication of a previously proprietary extended ISO relationship for ambient turbulence intensity:
where this time U(z) is taken as the 10 min mean wind speed, with Uref= 10 m s−1 and at zr= 10 m. The coefficients a1, a2 and a3 can be varied to represent site-specific data, with default values a1= 0.035, a2= 0.0089 and a3= 0.0402 adopted in the propriety formulation identified in the Acknowledgements of this paper. Alternative values of these coefficients will be derived for different atmospheric stability conditions in Sect. 3.3 of this paper.
Gust factors are the third and final type of vertical profile relationship considered here. They are traditionally used in a variety of applications, especially estimation of extreme winds for engineering design. They provide an estimate of the most likely maximum 3 s gust associated with an extreme value of 10 min or 1 h mean wind speed. They do not permit a simulation of all short-period variability within the longer averaging period, for which more sophisticated methods exist. There are opportunities to improve the way extreme gusts are represented in design, beyond the scope of this paper. The following fixed gust factor is given by IEC 61400-1:2019 and consequently IEC 61400-3-1:2019 for estimating the maximum 3 s gust associated with a 50-year extreme value of 10 minute mean wind speed:
This is assumed to be representative of wind turbine hub height but does not vary through the vertical. In other wind engineering standards such as ISO 19901-1:2015, gust factors Gτ:T (z) vary with height z and are directly related to the turbulence intensity Iu(z), as formulated below:
where τ is the gust duration and T is the longer averaging period, both in seconds. The widely used Frøya relationship in ISO 19901-1:2015 includes a coefficient of f= 0.41 in Eq. (6) for extratropical storms. The same formulation but with a coefficient of f= 0.50 was derived by Ishizaki (1983) for cyclones in Japan. Appropriate values for this coefficient f will be explored in Sect. 3.4 of this paper.
Gust factor relationships are often also used to derive ratios for converting estimates of extreme wind speed between averaging periods much longer than 3 s. Following the methods of ISO 19901-1:2015, this would involve using Eq. (6) with τ= 600 s instead of τ= 3 s and T= 3600 s or longer. A range of alternative ratios from IEC 61400-3-1:2019 are given in Table 1, which do not vary with height. This paper quantifies the performance of these ISO- and IEC-derived ratios in Sect. 3.5, making a clear distinction from the factors used to estimate gusts of a few seconds' duration.
The ISO and IEC relationships outlined above are generally assumed to be representative of extratropical storm regions, not lower-latitude regions impacted by tropical revolving storms. Industry standard relationships applicable to tropical revolving storm conditions can be obtained from the Engineering Science Data Unit (ESDU) models described by Vickery (2014). Similarly, different relationships are applicable to squall winds, as outlined by Santala et al. (2014).
2.1 Offshore wind data
An extensive set of met mast data are used to empirically quantify performance of the relationships in Sect. 1.2. The datasets included in this study are summarised in Table 2, broadly in order of descending latitude. At the time of gathering in 2018, the selection included most of the publicly available met mast data in the region, as all long-duration Forschungsplattformen in Nord- und Ostsee (FINO) met masts were included. Most data were from the public domain, except four confidential datasets made available for these analyses. These include proprietary datasets from Dogger Bank and the original Frøya data, of which the latter were used to derive the ISO relationships of the same name.
Table 2Metadata for met mast datasets including height of top anemometer above land (Frøya) or mean sea level (all others).
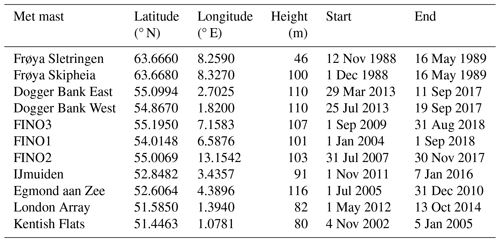
The integrity of all measured data was carefully examined with corresponding documentation to remove invalid records. This was a considerable effort, details of which are beyond the scope of this concise paper. Traditional cup anemometers were generally found to be more reliable than sonic sensors. Established methods were used to objectively identify data affected by the mast or other nearby structures, combining anemometers from different orientations at each height. The validity of measured wind direction was therefore a primary consideration, before assessing the validity of wind speeds. Records of adjacent wind farm construction were examined, to identify times and wind directions potentially impacted by wake effects. These were removed before the analysis of clean winds in this paper. Data from the Greater Gabbard met mast were also gathered but completely rejected at this stage, because all available data originated from within a constructed wind farm. Directional screening was also applied to the onshore Frøya met mast data, to only retain winds from the maritime regime. Further intensive data cleaning was conducted iteratively in multiple stages for all met masts, assessing impacts on resulting analyses in extensive sensitivity tests. Proprietary algorithms were developed to identify anomalous profiles, considering the root mean square error (RMSE) values calculated within the wind shear classification framework described in Sect. 3.2 of this paper.
2.2 Storm peak identification
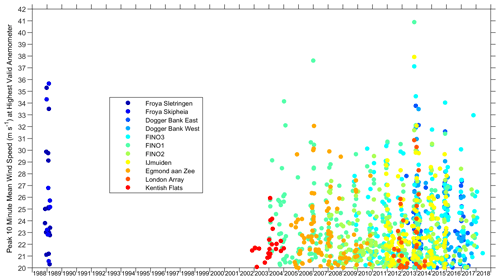
The analysis initially focused on over 1000 storm peak events in the met mast data. These were identified using a peaks-over-threshold approach, also known as the method of independent storms. These peaks had 10 min mean winds exceeding a threshold of 20 m s−1, separated in time by at least 2 d. Peaks were initially identified at each measurement height individually and then consolidated into a set of vertically coherent peak profile events for each dataset, illustrated in Fig. 1. The height of each peak is not given here, because it varied within each dataset. Several datasets provide good coverage of the severe winter of 2013–2014, described by Kendon (2015).
3.1 Wind profiles and shear
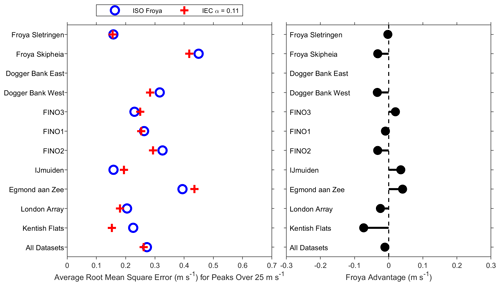
Measured profiles of 10 min mean wind speed during the identified storm events of Fig. 1 were compared to the IEC power law of Eq. (1) and ISO Frøya logarithmic profile of Eq. (2). No conversion was made to the 1 h mean wind speeds in the original Frøya formulation, so this analysis quantifies performance when U(z) and U(zr) are taken as 10 min mean wind speeds. Both types of profiles were fit to the measured profiles by minimising the RMSE, with the resulting RMSE values used to quantify performance of the IEC and ISO relationships. The average RMSEs, over all peaks with wind speeds over 25 m s−1, are shown for each met mast in Fig. 2. Only wind speeds above 25 m s−1 are considered, to avoid a higher proportion of profiles with larger errors due to variable atmospheric stability, because ISO Frøya only represents near-neutral conditions. No peaks remain above this threshold at Dogger Bank East, where the strongest winds were removed during data cleaning due to anomalies in wind direction. The Frøya advantage was calculated as the difference in average RMSE and is very close to zero when further averaged over all datasets. This shows very similar performance for both the IEC and ISO profile relationships, suggesting IEC has a very small advantage, much smaller than the variability between the met masts. Some individual wind profiles during key storm events will be examined further in Sect. 3.2.
3.2 Relative shear classification
The storm-peak-focused wind shear analysis of Sect. 3.1 is now extended to the full range of measured wind speeds. First, the power law exponent α was determined for every valid measured wind speed profile, by minimising the RMSE. The ISO Frøya profile was similarly fit to every measured profile and the equivalent power law exponent αISO determined from a further fit to this ISO Frøya profile. A new parameter, the relative shear r, was calculated for every measured profile:
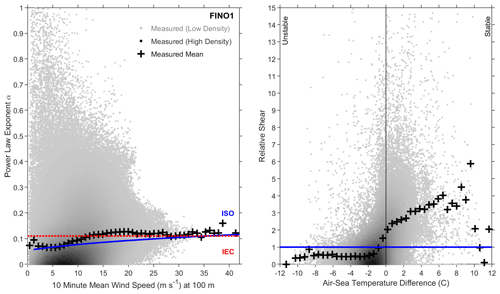
The ISO Frøya profile represents wind shear associated with near-neutral atmospheric stability. The relative shear parameter of Eq. (7) is used to quantify how each individual measured profile is impacted by stable or unstable conditions. This approach was verified using available measurements of atmospheric stability, including air–sea temperature difference, vertical temperature gradient and Monin–Obukhov length. Of these, the clearest trends were determined using air–sea temperature difference, similar to the findings of Furevik and Haakenstad (2012) and Kettle (2014). The calculation of relative shear in Eq. (7) and relationship with measured atmospheric stability are shown in Fig. 3 for the FINO1 met mast.
The correlation between relative shear and atmospheric stability measured by air–sea temperature difference follows the expectations of Monin–Obukhov theory, which gives linear profiles for strong stability. These cannot be accurately represented by power law profiles or relative shear. Simple linear slope fits were therefore also made to all measured wind profiles, with positive slopes representing strong stability. Negative linear slopes were also included, to capture the inverted profiles documented by Kettle (2014).
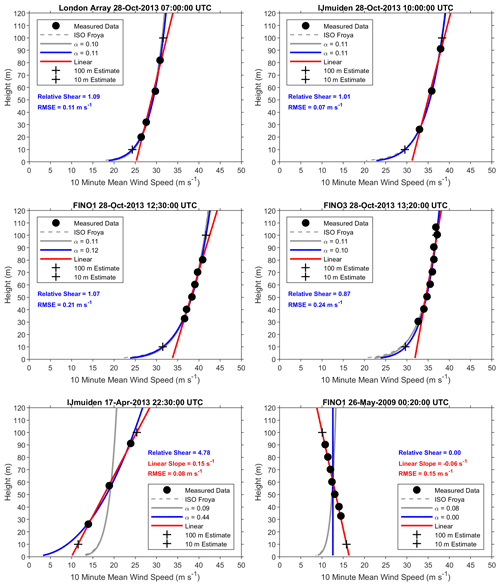
The RMSE values from the power law and linear slope fits were compared, and linear fits were preferred when RMSE was lower by at least 0.066 m s−1. This somewhat arbitrary threshold was determined through iteration, to retain the traditional power law fit when small errors could otherwise lead to a linear fit being selected. The profile classification method is illustrated in Fig. 4. The ISO Frøya profile and equivalent αISO are shown in grey, with the power law and linear fits in blue and red respectively. The RMSE is given in the colour corresponding to the preferred fit. The upper subplots show profiles at the peak of the strongest measured storm event as it impacted four met masts, classified by the relative shear values in blue. The lower two subplots of Fig. 4 show profiles that were better classified with positive or negative linear slopes, with values shown in red.
Thresholds of relative shear were selected to classify profiles as unstable, neutral or stable. These were embedded within a wider classification framework including the negative and positive linear slopes. This framework provides a pragmatic proxy for stability classification, used in Sect. 3.3 to obtain different ambient turbulence intensity relationships for distinct stability conditions.
3.3 Turbulence intensity
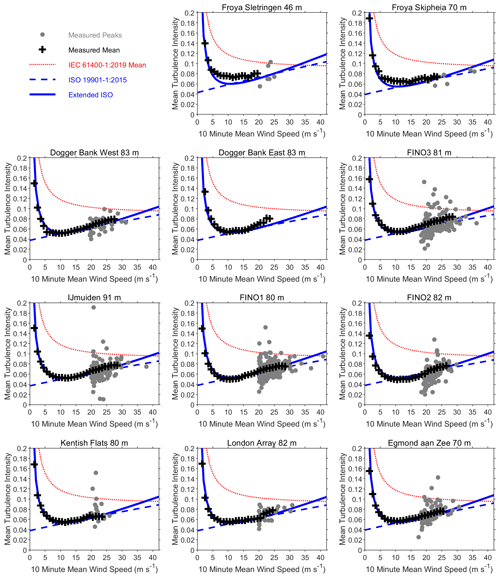
This paper now quantifies the performance of turbulence intensity relationships in Sect. 1.2, with some other relationships from IEC standards also briefly considered. The focus is ambient or freestream turbulence intensity, representing clean wind conditions in the absence of wake effects from near or far wind turbines. The analysis is based on measured turbulence intensity Iu(z) derived from the standard deviation and corresponding 10 min mean wind speeds from each anemometer on each met mast. By far most of the data retained for this analysis were derived from traditional cup anemometers. The mean values of turbulence intensity were derived for each bin in 10 min mean wind speed, shown with values from the peak of each storm in Fig. 5. Results are presented from the measurement height closest to 80 m, which gave the highest valid data at FINO1 during the strongest measured storm and generally good data coverage at all met masts.
The mean values in Fig. 5 are compared with the Weibull form of the normal turbulence model (NTM) in Eq. (11) of IEC 61400-1:2019. This is the only IEC relationship which permits mean turbulence intensity to be calculated directly. It is prescribed for onshore conditions but still referenced in IEC 61400-3-1:2019 for offshore turbines. The reference value of turbulence intensity was taken to be 0.12, for the least turbulent wind turbine class C. Similar analyses were undertaken for the 90th percentile (P90) turbulence intensity and compared to a wider range of relevant IEC relationships, but the results are beyond the scope of this concise paper.
Figure 5 also shows the ISO and extended ISO relationships from Sect. 1.2. The extended ISO relationship of Eq. (4) with default coefficients clearly provides the best representation of measured turbulence intensity of all the relationships considered so far. It corrects the failure of the ISO Frøya relationship of Eq. (3) at low wind speeds. It is unclear which of these provides superior representation at high wind speeds. The most severe measured storm event, shown in Fig. 4, led to the strongest wind speeds at several met masts. This is visible as an isolated grey dot between the ISO Frøya and extended ISO lines for FINO1 in Fig. 5. It is useful to consider the scatter in the storm peak values of turbulence intensity and how this relates to an assessment of uncertainty. The ISO Frøya turbulence intensity values in Fig. 5 were calculated with Eq. (3) taking U(zr) as the 1 h mean wind speed at zr= 10 m but plotted versus the corresponding 10 min mean wind speed at measurement height. The values would be slightly higher if U(zr) was taken as the 10 min mean wind speed at zr= 10 m, with the difference hardly visible in Fig. 5 and much smaller than the scatter in individual peak values.
The relative shear and linear slope classification framework described in Sect. 3.2 is now used to cluster the measured turbulence intensity data, broadly representing different types of atmospheric stability. A further distinction was made between maritime and terrestrial regimes, according to the wind direction associated with each measured profile. The maritime regime was defined as direction sectors with a distance from the coast of at least 50 km. This followed Pollak (2014), who found turbulence intensity decreased with increasing distance from the coast until about this value.
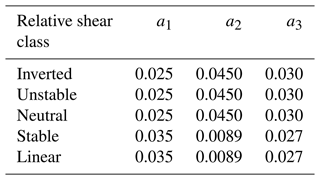
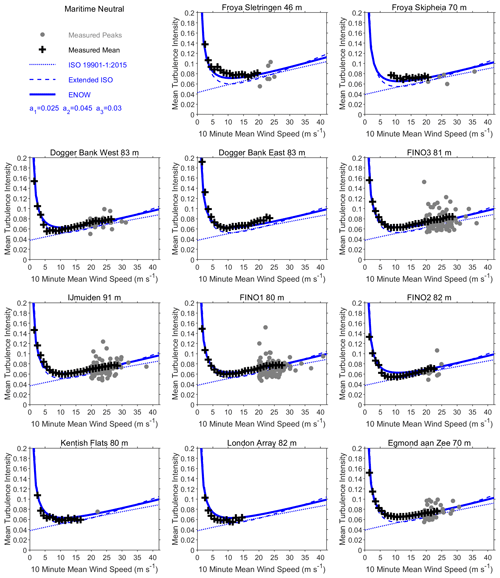
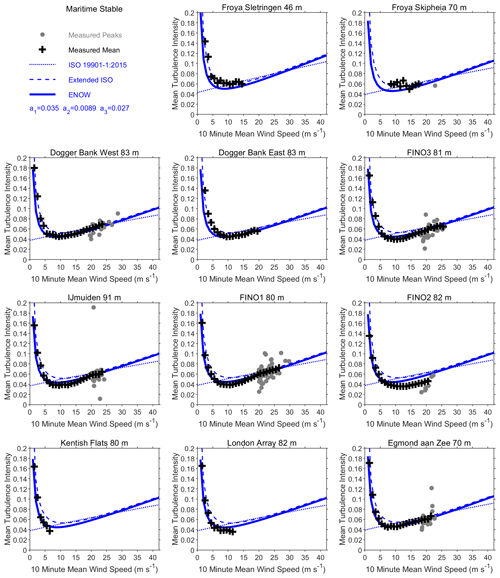
The coefficients of the extended ISO relationship were modified to provide an improved representation of measured turbulence intensity in each relative shear class, with examples shown for the maritime regime in Figs. 6 and 7. Key features of the measured data could be effectively characterised by only two sets of coefficients, given in Table 3. These are denoted the Extreme and Normal Offshore Wind (ENOW) coefficients, after the Joint Industry Project on which they were derived. A notable feature of this analysis is how the same relationships can represent turbulence intensity at most met masts, supporting the hypothesis that there may be less uncertainty and spatial variability in the offshore domain than sometimes assumed.
3.4 Gust factors
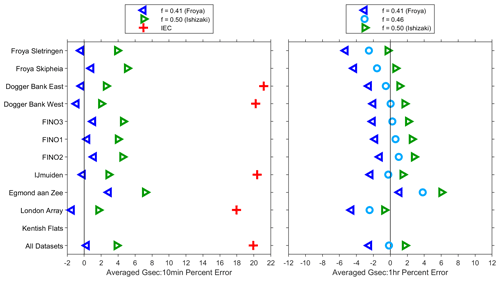
This paper now reverts to the initial focus on the storm peak events in Sect. 3.1, considering the performance of gust factor relationships of Sect. 1.2. Measured gust factors were derived directly from the 10 min data or by taking the 1 h mean wind speed centred on each 10 min peak. Equation (6) was used to calculate gust factors at all measurement heights, for a range of values of coefficient f. Importantly, this calculation used the measured turbulence intensity described in Sect. 3.3, not estimates of Iu(z) derived from any of the relationships in Sect. 1.2. The percent error in gust factor was calculated at each measurement height and then averaged through the vertical. Further averages were then taken over all peak events at each met mast, to produce the summary in Fig. 8. Detailed assessment of over 1000 storm peak profiles confirmed this concise summary represented trends at all measurement heights.
The horizontal axis in Fig. 8 does not indicate the gust duration, which varied between met masts and was usually 1 or 3 s. Met masts with 3 s gusts are indicated by a corresponding IEC value from Eq. (5) on the left in Fig. 8. These have a consistent large positive percent error, indicating the IEC gust factor provides a conservative overestimate of extreme 3 s gusts. The Frøya relationship is superior to Ishizaki for estimating gusts from 10 min mean wind speeds. An intermediate value of f= 0.46 on the right of Fig. 8 provides the best overall performance for estimating gusts from 1 h mean wind speeds.
3.5 Averaging period ratios
The gust factors considered in Sect. 3.4 are distinguished from the ratios used to convert extreme wind speed estimates from one averaging period to another, as explained in Sect. 1.2. The performance of ratios derived from ISO in Eq. (6) and IEC in Table 1 is now assessed, using ratios between the measured 10 min and 1 h mean wind speeds described in Sect. 3.4. Measured 3 h mean wind speeds centred on each 10 min peak are now also included in the analysis. Percent errors were again averaged through the vertical and then over all peaks at each met mast to produce the summary in Fig. 9.
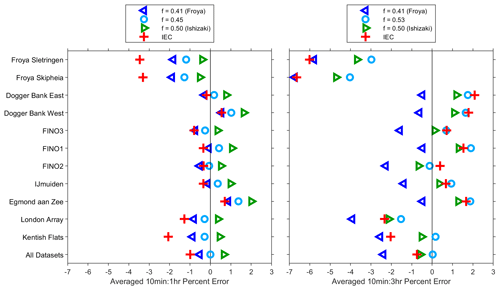
Figure 9Averaged percent error in ratios to estimate 10 min mean peak values from longer averaging periods.
The IEC ratios from Table 1 exhibit similar performance to those derived from ISO Eq. (6). As in Sect. 3.4, ratios derived from additional values of the coefficient f are shown when they provide the best overall performance. This suggests the best estimates of peak 10 min mean wind speeds are obtained from 1 h mean values using f= 0.45 or from 3 h mean values using f= 0.53.
3.6 Extreme wind workflow
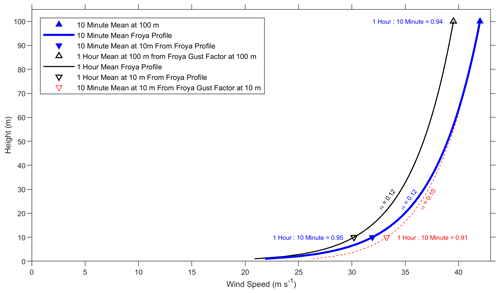
Relevant findings from previous parts of this paper are now brought together to demonstrate application in a simplified workflow for estimating extreme wind speeds for offshore wind energy applications. This starts with the assumption that a reliable estimate of 50-year extreme 10 min mean wind speed is available at 100 m above the sea surface. The origin of the initial estimate is beyond the scope of this paper. Subsequent steps in the workflow are illustrated in Fig. 10, with the sequence indicated from top to bottom in the legend.
First, the Frøya relationship of Eq. (2) is used to derive a coherent vertical profile of extreme 10 min mean wind speed, noting that this not necessarily assumed valid above the height of traditional met masts. Figure 10 indicates that the shear is only a little greater than IEC α= 0.11 in Eq. (1) so that could be a pragmatic alternative. Next, the extreme 10 min mean wind speed at 10 m is used to estimate a profile of turbulence intensity using the ISO relationship in Eq. (3). The value of Iu(z) at 100 m above sea level is then used to estimate extreme 1 h mean wind speed at 100 m via the ISO gust factor relationship of Eq. (6), in this case using the default f= 0.41. Figure 10 shows the corresponding ratio is close to the IEC value in Table 1, which again offers a pragmatic alternative. Finally, a coherent vertical profile of extreme 1 h mean wind speed is obtained using the ISO Frøya relationship of Eq. (2). Again, the shear is a little greater than IEC α= 0.11.
The workflow outlined above differs from methods commonly adopted by some metocean practitioners, which usually need to be independently reviewed and often certified. In metocean practice, the original ISO relationships are often used more literally, with an emphasis of obtaining an estimate of 1 h mean wind speed at 10 m earlier in the workflow, as a key input to Eq. (3). However, the workflow can be streamlined by using some of the pragmatic simplifications explored in this paper, which in some cases might involve using the much simpler IEC alternatives. A robust assessment of uncertainty has not yet been undertaken here, but the differences between these shortlisted methods are expected to be small compared to other uncertainties involved in the estimation of extreme wind speed profiles.
An alternative estimate of 10 min mean wind speed at 10 m is shown in red in Fig. 10, representing part of the widely used metocean tradition following ISO. This is derived from the 1 h mean wind speed at 10 m via the turbulence intensity at 10 m, which is higher than the turbulence intensity at 100 m according to Eq. (3). The gust factor from Eq. (6) is therefore higher at 10 m than 100 m, indicated by the different ratio shown in red in Fig. 10. This higher red estimate of 10 min mean wind speed at 10 m is interpreted as the value associated with the 1 h mean wind speed at 10 m. In contrast, the lower blue estimate of 10 min mean wind speed at 10 m is interpreted as the value associated with the 10 min mean wind speed at 100 m. This latter value is more consistent with IEC and represents a coherent vertical profile, arguably more appropriate for wind turbine engineering.
3.7 Discussion summary
The IEC α= 0.11 power law and ISO Frøya profiles proved practically indistinguishable for quantification of shear during measured storm peak events. Either can be used for related applications, although the ISO Frøya relationship has the advantage of wind speed dependence. It is important to highlight how the shear analysis in this paper only considers the atmospheric boundary layer up to heights covered by traditional met masts. This is critical for metocean applications that relate winds in the turbine swept area to those that drive surface waves. Consideration of lidar data, usually needed to quantify shear at higher elevations, is beyond the scope of this concise paper.
The relative shear analysis in this paper integrates the IEC- and ISO-preferred methods of wind profile characterisation. The established ISO Frøya logarithmic profile is used to quantify neutral conditions, from which IEC favoured power law profiles are rescaled in terms of relative shear. Clear correlations permit this to be used as a practical approximation of atmospheric stability. Relative shear is embedded within a wider classification framework, incorporating positive and negative linear slopes, to represent strongly stable and inverted profiles respectively. This offers a simple alternative to Monin–Obukhov theory for representing strong stability while capturing the inverted profiles that Monin–Obukhov theory cannot. This new classification framework requires no measurement of atmospheric stability, so it can be applied directly to any offshore lidar dataset.
This paper proposes just two fundamentally different offshore turbulence intensity relationships, distinguishing unstable or neutral conditions from stable conditions. In the absence of wake effects, mean offshore turbulence intensity is lower than prescribed by the weakest turbine class in the IEC onshore standard. Quantification of 90th percentile turbulence intensity is also required for wind energy applications but is beyond the scope of this concise paper. The coefficients of the Wang et al. (2014) offshore turbulence model can be empirically modified as were those of extended ISO. This paper offers a simple pragmatic analysis, and opportunities exist for further refinement using the wealth of available data. The quantification of turbulence intensity from fixed or floating lidar data remains the subject of ongoing research.
Most measured storm peak profiles fall into the neutral relative shear classification. Mean turbulence intensity under neutral conditions in Fig. 6 is consistently a little higher than given by the ISO Frøya relationship, reflected by the extended ISO modifications. This further supports the pragmatic use of U(zr) as the 10 min mean wind at zr= 10 m in Eq. (3). This would increase turbulence intensity above the original 1 h mean wind derivative by a factor of about 2 %, which would be difficult to see in Fig. 6 and much smaller than the scatter in measured peak values. Mean turbulence intensity was clearly lower than ISO Frøya in stable conditions, in line with physical expectations.
The ISO Frøya and extended ISO relationships for offshore turbulence intensity diverge at high wind speed, with both continuing to increase without limit. This is not physically realistic when the limits on drag coefficient for very strong winds described by Powell et al. (2003) are considered. These limits are included in the ESDU relationships described by Vickery (2014), but much simpler pragmatic modifications to the ISO Frøya relationship can be effectively derived (Holmes, 2024).
This study highlights the critical role of turbulence intensity in the estimation of gust factors, with a range of relevant relationships from IEC, ISO and other sources assessed using the extensive set of measured storm peak events. The ISO Frøya gust factor relationship is recommended for estimating the most probable 3 s gusts associated with extremes in 10 min mean winds. A modified coefficient f= 0.46 in Eq. (6) is superior when these gusts are estimated from 1 h mean winds. Further modifications of this coefficient in Fig. 9 are effective when Eq. (6) is used to estimate peak values of 10 min mean wind from peaks representing averaging periods of 1 or 3 h. However, the IEC ratios of Table 1 are a simple pragmatic alternative, with percent errors comparable to the variability between individual met masts. There is greater variability and uncertainty in these peak wind speed conversion factors when the difference between the averaging periods is larger. This can to some extent be attributed to greater nonstationarity within longer averaging periods. A few of the strongest peak events were strongly nonstationary and deviated from the most probable trends quantified here. The quantification and engineering impacts of strongly nonstationary events, such as sharp fronts or squalls, remain a subject of active research. This may be increasingly relevant to floating offshore wind structures.
This study has focused on quantifying the most probable 3 s gusts associated with extremes in 10 min or longer averages in wind speed. The IEC extreme gust factor of Eq. (5) is clearly higher than measured in most peaks. However, different extreme gust estimates can be derived by considering the distribution all gusts within each storm, rather than only those occurring at the same time as peaks in wind speed averaged over longer periods. Related research will soon be submitted for publication in a separate paper.
Efforts have been made to disseminate useful results from extensive data analyses in a concise coherent paper. Details of wind shear are presented for all relevant measured profiles. Turbulence intensity is presented as statistics over the full range of wind speeds, plus individual values from each storm peak event. Statistical results are even more condensed for gust factors and averaging period conversions, but all values from individual storm peaks were assessed before developing a representative summary of the key trends. This paper does not attempt to include sufficient detail on all variability to permit a robust assessment of uncertainty.
The storm peak focus of this paper differs from numerous other published studies. Some of the relationships examined literally converge at high wind speed, but related research addresses a wider convergence of technical disciplines within the rapidly growing offshore wind industry. The ISO Frøya relationships were originally derived from the limited data over land that were included in this study. These relationships are now validated against much longer-duration data, covering a considerably wider offshore region more relevant to wind energy. They are used extensively in offshore engineering but are not yet widely adopted in offshore wind energy. This paper is intended to demonstrate some benefits of appropriately incorporating these relationships into industry standard practice. Key benefits include performance in directly representing profiles of 10 min mean wind and providing a pragmatic method for approximating near-neutral wind shear. The extreme wind workflow outlined in this paper is intended to explore how established ISO and IEC relationships can be practically combined and to stimulate further debate within the wind energy community.
Relationships from ISO are generally more reliable for representing extreme offshore wind conditions than those from IEC, but IEC can provide a simple pragmatic alternative in some cases. Some useful new relationships are developed, including extended ISO for turbulence intensity and a range of gust factor coefficients. These results are directly applicable to many offshore wind energy developments, primarily for estimation of extreme wind speeds in engineering design. Some areas of suggested further research are outlined below.
Extending some analyses to lidar data could provide valuable results at higher elevation, if the measured data are considered reliable during storm peak events. This is still more straightforward for wind shear than turbulence intensity and gusts. It may be beneficial to explore the application of relative shear to approximate atmospheric stability from lidar wind profiles when traditional measures are unavailable.
A more detailed examination of turbulence intensity is desirable, considering variations with height and distance offshore. The hypothesis of relatively low uncertainty and spatial variability in the offshore domain should be investigated further. Analyses should extend to the P90 turbulence intensity and assess the full range of relevant IEC relationships. Turbine wake effects could also be investigated with the available met mast data.
Opportunities exist to improve the representation of extreme gusts for engineering applications. This includes statistical representation of all gusts within each storm and time domain characterisation. The response of offshore structures needs to be quantified, so data reduction techniques are beneficial to reduce computational costs. The probability and impact of highly nonstationary extreme wind events could also be investigated further.
The extensive met mast dataset collated for this study could be subjected to more sophisticated statistical techniques, such as state-of-the-art machine learning algorithms. This could provide more detailed characterisation of wind speed and turbulence intensity with improved quantification of uncertainty. This could support extending some analysis beyond storm peaks to the full range of wind speeds, for characterisation of normal winds and assessment of energy yield.
Data sources are detailed in the Acknowledgements, with some public domain data conveniently available via https://groups.io/g/wrag/wiki/13236 (WRAG, 2024).
No conflicts of interest exist, but it is desirable to clearly state how this applied research was funded and delivered by commercial organisations. The author works as a metocean consultant in the offshore wind energy industry and this paper is derived from confidential results of the Extreme and Normal Offshore Wind (ENOW) Joint Industry Project (JIP). He is an active member of the PEL/88 committee for UK contributions to IEC standards on wind energy generation systems and a liaison to the corresponding ISO committee to encourage collaboration, coordination, and consistency. He initiated the Wind Resource Metocean (WRM) discussion group to exchange knowledge between traditionally separate technical disciplines. The objective of this paper is to openly share meaningful results as part of wider efforts to reduce uncertainty and promote engagement within the wind energy community.
Publisher’s note: Copernicus Publications remains neutral with regard to jurisdictional claims made in the text, published maps, institutional affiliations, or any other geographical representation in this paper. While Copernicus Publications makes every effort to include appropriate place names, the final responsibility lies with the authors.
In order of joining the project, the following ENOW participants are thanked for financial support and permission to publish: Vattenfall, Shell, Equinor, TotalEnergies, bp and SSE Renewables. Among numerous participant representatives, Einar Nygaard, Zoe Roberts, Paul Verlaan and Alison Brown are acknowledged for helping to create the project. Andrew Watson and Dave Quantrell made notable contributions at an early stage of the project, leading to some of the results presented here. Laure Grignon and Gil Lizcano are also thanked for valuable early contributions. The extended ISO relationship described in this paper was provided for consideration in the ENOW project by Equinor in a confidential report by Martin Mathiesen. The original Frøya data and both Dogger Bank datasets were provided in confidence by Equinor to support the ENOW project, with the latter subsequently available via the UK Crown Estate Marine Data Exchange (MDE). Data from all three FINO masts were acquired from the German Federal Maritime and Hydrographic Agency (BSH), with support from the BMWi (Bundesministerium für Wirtschaft und Energie, Federal Ministry for Economic Affairs and Energy) and the PTJ (Projektträger Jülich, project executing organisation). The IJmuiden dataset was acquired from https://www.WindOpZee.net (last access: 12 April 2018) via Energy research Centre of the Netherlands (ECN). The Egmond aan Zee data were downloaded from the NoordzeeWind web pages. The London Array and Kentish Flats data were acquired via the MDE. George Forristall, Ian Wade, Rémi Gandoin and two anonymous reviewers are thanked for their contributions to the public peer review of this paper. Julia Gottschall and Carlo Bottasso are thanked for their efforts in a lengthy review process. This paper is dedicated to my father and my son, who passed each other out of and into this world during publication.
This paper was edited by Julia Gottschall and reviewed by three anonymous referees.
Andersen, O. J. and Løvseth, J.: The Frøya database and maritime boundary layer wind description, Mar. Struct., 19, 173–192, https://doi.org/10.1016/j.marstruc.2006.07.003, 2006.
Emeis, S.: Wind energy meteorology, second edition, Springer, https://doi.org/10.1007/978-3-319-72859-9, 2018.
Furevik, B. R. and Haakenstad, H.: Near-surface marine wind profiles from rawinsonde and NORA10 hindcast, J. Geophys. Res., 117, D23106, https://doi.org/10.1029/2012JD018523, 2012.
Holmes, J. D.: Mean wind and turbulence profiles over the ocean with roughness saturation, https://www.researchgate.net/publication/382639800 (last access: 18 October 2024), 2024.
Holmes, J. D. and Bekele, S.: Wind loading of structures, fourth edition, CRC Press, https://doi.org/10.1201/9780429296123, 2020.
IEC 61400-1:2019: Wind energy generation systems, Part 1: Design requirements, https://webstore.iec.ch/en/publication/26423 (last access: 18 October 2024), 2019.
IEC 61400-3-1:2019: Wind energy generation systems, Part 3-1: Design requirements for fixed offshore wind turbines, https://webstore.iec.ch/en/publication/29360 (last access: 18 October 2024), 2019.
ISO 19901-1:2015: Petroleum and natural gas industries – Specific requirements for offshore structures – Part 1: Metocean design and operating considerations, https://www.iso.org/standard/60183.html (last access: 18 October 2024), 2015.
Ishizaki, H.: Wind profiles, turbulence intensities and gust factors for design in typhoon-prone regions, J. Wind Eng. Ind. Aerod., 13, 55–66, https://doi.org/10.1016/0167-6105(83)90128-9, 1983.
Kendon, M.: Editorial: The UK storms of winter 2013/2014, Weather, 70, 39–40, https://doi.org/10.1002/wea.2474, 2015.
Kettle, A. J.: Unexpected vertical wind speed profiles in the boundary layer over the southern North Sea, J. Wind Eng. Ind. Aerod., 134, 149–162, https://doi.org/10.1016/j.jweia.2014.07.012, 2014.
Landberg, L.: Meteorology for wind energy: An introduction, Wiley, ISBN 978-1-118-91344-4, 2015.
Pollak, D. A.: Characterization of ambient offshore turbulence intensity from analysis of nine offshore meteorological masts in Northern Europe, MS thesis, Technical University of Denmark, M-0056, https://c2wind.com/f/content/daniel-pollak-edited.pdf (last access: 16 October 2024), 2014.
Powell, M. D., Vickery, P. J., and Reinhold, T. A.: Reduced drag coefficient for high wind speeds in tropical cyclones, Nature, 422, 279–283, https://doi.org/10.1038/nature01481, 2003.
Santala, M. J., Calverley, M., Taws, S., Grant, H., Watson, A., and Jeans, G.: Squall wind elevation/gust factors and squall coherence, Offshore Technology Conference, Houston, 5–8 May 2014, OTC-25249-MS, https://doi.org/10.4043/25249-MS, 2014.
Vickery, P. J.: Analysis of hurricane winds, Offshore Technology Conference, Houston, 5–8 May 2014, OTC-25244-MS, https://doi.org/10.4043/25244-MS, 2014.
Wang, H., Barthelmie, R. J., Pryor, S. C., and Kim, H. G.: A new turbulence model for offshore wind turbine standards, Wind Energy, 17, 1587–1604, https://doi.org/10.1002/we.1654, 2014.
Wind Resource Assessment Group (WRAG): Links to datasets, https://groups.io/g/wrag/wiki/13236 (last access: 18 October 2024), 2024.


