the Creative Commons Attribution 4.0 License.
the Creative Commons Attribution 4.0 License.
Full-scale wind turbine performance assessment using the turbine performance integral (TPI) method: a study of aerodynamic degradation and operational influences
Christian Bak
This study investigates how blade aerodynamic modifications, including leading edge roughness (LER), influence wind turbine performance over their operational lifespan. It introduces a methodology developed to examine the intricate relationship between blade erosion, blade enhancements, operations and maintenance (O&M) events, control programmable logic controller (PLC) parameter updates, and their cumulative impact on turbine efficiency. Analysing data from 12 multi-megawatt offshore turbines over a 12-year period, the investigation hinges on the integration of supervisory control and data acquisition (SCADA) data, O&M records, and air density corrections. A key contribution is the development of the turbine performance integral (TPI) method, which, for the investigated turbines, leverages generator speed and power output data to track performance trajectories. Seasonal trend decomposition using locally estimated scatterplot smoothing (STL) further isolates long-term trends and seasonal variations in performance. Despite data availability and quality limitations, the study reveals significant findings concerning the impact of manufacturer software updates on turbine control strategies, resulting in improved performance; the variable effects of blade repairs and enhancements; and the complex interaction between O&M events and performance. This work applies a methodical approach and statistical rigour, offering a path forward for effectively monitoring wind turbine efficiency and advancing renewable energy.
- Article
(4942 KB) - Full-text XML
- BibTeX
- EndNote
The detrimental effect of leading edge roughness (LER) and leading edge erosion (LEE) on aerofoil characteristics has been investigated through wind tunnel experiments and various studies on the impact of erosion and roughness on wind turbine annual energy production (AEP) (Mishnaevsky et al., 2021). Erosion has the potential to cause significant AEP losses, with some studies predicting reductions of up to 7 % (Han et al., 2018; Maniaci et al., 2016; Bak et al., 2020; Bak, 2022). Nevertheless, a key challenge remains in identifying and validating these computed energy losses when analysing supervisory control and data acquisition (SCADA) data from operational wind turbines (Ding et al., 2022). This challenge is manifested by a continued absence of an established correlation between blade erosion and turbine performance, underscoring a lack of deeper understanding of the underlying reasons.
Wind turbine performance assessment is especially challenging in the academic and owner-operator environment due to limited access to quality data from wind turbines (Pandit et al., 2023; Leahy et al., 2019). Where data are accessible, they are often limited to a restricted set of sensors or SCADA channels, typically sampled at a lower rate, or they may be available for very limited time periods (Yang et al., 2014). Such restrictions hinder comprehensive data analysis and conclusive research findings (Badihi et al., 2022; Gonzalez et al., 2019). Usually, little to no information on specifications of the turbine, such as blade profiles or aerofoil polars, is available, such as those tested by Krog Kruse et al. (2021) and Gaudern (2014). There are several reasons contributing to this limitation, with one of the primary factors being intellectual property protection by original equipment manufacturers (OEMs), since their significant research and development (R&D) investments help them maintain their advantage in a highly competitive market. Additionally, suppliers are often hesitant to empower customers with detailed data that could be leveraged in, for example, a performance warranty claim. Moreover, the owner-operator faction of the industry has seen limited success in gleaning valuable turbine performance data from SCADA systems (Ding et al., 2022), which has not created a compelling incentive for a push towards suppliers to provide more comprehensive data, nor has it sparked a cost–benefit argument for owner-operators to invest in higher-quality data or more expensive dedicated condition monitoring systems (CMSs) (Yang et al., 2014; Tautz-Weinert and Watson, 2017). This situation has culminated in a lack of drive from customers to push for better data accessibility and quality, exacerbating the challenge of wind turbine performance assessment and impeding innovation and progress in the field (Pandit et al., 2023). Furthermore, the controller of the wind turbine often remains a black box (Aho et al., 2012) to owners, operators and academics, making the assessment of the turbine's behaviour in response to atmospheric conditions, operations and maintenance (O&M) events, upgrades, or blade conditions highly challenging, leading to inconclusive or, in the worst case, incorrect conclusions. Developing a reliable performance evaluation method and enhancing the efficiency of current wind turbine fleets, where even marginal performance gains can translate into significant economic and environmental benefits, are crucial.
To address these challenges, wind turbine SCADA data were analysed and an understanding of the wind turbine controller underlying turbine behaviour in response to atmospheric conditions, O&M events and modified blade aerodynamics was applied. The goal was to discern the effect of leading edge roughness from the numerous variables and uncertainties affecting the turbine's performance, which may be likened to finding a needle in a haystack. The developed method avoids the need for direct wind speed measurements for the turbine under study, reducing uncertainty and providing insights that were previously difficult to achieve with currently available SCADA data (Butler et al., 2013; Albers, 2012).
This study aims to dissect measurement data from 12 multi-megawatt offshore wind turbines to determine the specific effects of modified blade aerodynamics on their performance and separate these relatively minor effects from the plethora of events that affect a wind turbine over its lifetime.
The distinguishing aspect of this work lies in the development of a method where a single turbine indicates performance shifts, without the use of wind speed measurements, customised for the OEM and the turbine's specific controller. Comprehensive O&M data for wind turbines are a rarity in the academic field, as is the opportunity to modify blade aerodynamics to assess its impact on turbine performance. The present investigation leverages these aspects to assess turbine performance, creating understanding to enable more informed business decisions and predictive maintenance strategies and, in turn, enhance the energy yield and longevity of the turbines. Ultimately, this is done in an attempt to shed light on how many kilowatt hours are lost due to the limited understanding of field performance influenced by blade erosion.
The present study employs a detailed analysis of wind turbine measurement SCADA data to assess the influence on performance due to various factors. These causes include seasonal variations, O&M events and turbine component degradation. A particular emphasis is placed on evaluating the effect on performance due to modified blade aerodynamics resulting from blade erosion and enhancements. These particular causes of performance alterations are known to have relatively smaller performance deviations, especially when compared to other, more prominent sources of variation such as main component malfunctions (Dao et al., 2019; Yang et al., 2014; see also a general study by Astolfi et al., 2020). The presented methodology concentrates on the separation of causes of variation in performance deviations and their individual contributions. For this purpose, 12 front-row offshore multi-megawatt turbines within the same wind farm were selected for their direct exposure to undisturbed dominant wind conditions. These turbines experienced progressive blade erosion, which was repaired during the study period. Due to confidentiality reasons, neither the site nor the wind turbine type is described in detail. Nevertheless, to provide context for the results, the average wind speed at the site is approximately 8.6 m s−1 and the wind turbine has a nominal power between 2 and 3 MW and is a horizontal-axis, three-bladed model.
2.1 Data collection
2.1.1 Operations and maintenance (O&M) data
A detailed compilation of maintenance records was undertaken, which were subsequently consolidated with the SCADA data. This dataset included dates and details for inspection and maintenance activities, such as blade repair, blade leading edge protection (LEP), application of blade enhancements such as aftermarket vortex generators and Gurney flaps, component repairs or replacements, turbine curtailments and outages etc. An auxiliary source of data was a system application and product (SAP) or accounting database, which held records of O&M billing dates and respective costs. Despite this being a source of data, due to the transactional nature of the SAP records, they were used only to a very limited extent as their date did not reflect the actual date an O&M event took place on a wind turbine but rather the date when the work was billed to the business.
It is important to recognise the challenges in assembling a complete and precise record of all repairs for the wind farm in question. This can be attributed to occasional gaps in reports, variability in maintenance records over some periods and instances of data loss – similar challenges have been encountered by others in the field (Leahy et al., 2019). Recognising the repercussions of these discrepancies for the findings is addressed and deliberated on in Sect. 3, as the inherent integrity of these records had implications for the depth and accuracy of the analysis.
The O&M events compiled for the selected wind farm were categorised under the following main categories, with a detailed breakdown shown in Fig. 9:
-
control programmable logic controller (PLC) parameter update (only the approximate date of the last update is recorded, and previous updates' dates are unavailable)
-
mechanical repairs (e.g. gearbox replaced, generator bearing replaced)
-
blade maintenance (e.g. blade repaired, blade enhancements)
-
sensor and instrumentation (e.g. wind sensor replaced, generator high temperature)
-
fluid maintenance (e.g. gearbox oil change, hydraulic oil change)
-
other.
2.1.2 Wind turbine SCADA data
The data used in this study were sourced from 12 individual wind turbines situated in the first row of an offshore wind farm with exposure to predominant wind conditions. This selection mitigated wake effects of other turbines or wind parks. A comprehensive 12-year dataset, with SCADA data sampled every second, was employed to improve accuracy (Badihi et al., 2022) while searching for small performance changes. This, of course, created computational challenges due to the associated increased volume of data (Pandit et al., 2023).
The SCADA system records various parameters at regular intervals. From the limited available sensors, the following parameters relevant to this study were collected:
-
nacelle wind speed ν (m s−1)
-
nacelle direction (°)
-
ambient temperature T (K)
-
blade pitch angle β (°)
-
rotor speed ω (rpm)
-
generator speed Ω (rpm)
-
power production P (kW)
-
power setpoint demand P (kW)
-
turbine operational state (e.g. waiting for wind, curtailed, cable unwind).
Additionally, relevant parameters were collected from an on-site meteorological mast (located at the offshore substation) and the EMD International database (via windPRO EMD International A/S, 2023). The following obtained metrics were used separately to account and correct for variations in air density, the importance of which was highlighted by Farkas (2011): atmospheric pressure P (Pa), ambient temperature T (K) and air density ρ (kg m−3).
2.2 Pre-processing
The SCADA dataset utilised in this study was pre-computed from the wind turbine's high-frequency data archive, where a sensor's signal is only updated when a change is recorded. Due to the substantial volume of data generated, it is worth noting that these high-frequency records are retained on the turbine for only a limited duration. The employed dataset was sampled at 1 s intervals. Consequently, any missing values encountered were filled using the “previous value” method, which replaces each missing value with the most recent preceding non-missing value. In the absence of historical high-frequency data, this approach to handling missing values reduces the computational demands while attempting to minimise the introduction of potential bias or inaccuracies.
Certain derived variables were also computed to aid data filtering. For instance, the tip speed ratio (λ) was calculated using rotor speed and horizontal wind speed measurements. Additionally, the nacelle direction was used as a proxy for wind direction despite it being influenced by the turbine's control algorithm hysteresis and rotor wake.
Furthermore, the air density (ρ) calculated at the substation was compared with that from EMD International's database and was found to be a close match. Due to occasional gaps in the meteorological mast data, the EMD data, available at hourly intervals, were employed for analysis, of course, adding some degree of uncertainty. The gaps between the hourly timestamps were filled using linear interpolation. An adjusted power value was computed based on the obtained air density and was used in all subsequent analysis.
The data were filtered and processed in accordance with the guidelines outlined in the International Electrotechnical Commission (IEC) 61400-12-1 (IEC, 2017).
2.3 Density correction
To isolate the factors that influence wind turbine performance variation, it is crucial to adjust for variables that introduce uncertainty, to whatever extent possible. Air density is one such variable (Farkas, 2011) in the haystack of uncertainties that confound the data. With wind kinetic energy being proportional to turbine power, correcting for air density variations over time is essential, as demonstrated by Butler et al. (2013).
The power generated by a wind turbine may be expressed by
where P is the mechanical power generated by the wind turbine, ρ is the air density, A is the swept area of the wind turbine (calculated as , where D is the rotor diameter), v is the wind speed and Cp is the power coefficient of a turbine at the design load case. The maximum theoretical value of Cp is 0.593, according to Betz's law.
In this analysis, the turbine power output is adjusted for site-specific temperature, pressure and consequent air density variations, thus standardising the data and partially reducing an aspect of seasonally or atmospherically induced variations over time. The adjusted power Padj is calculated by correcting the measured power output Pmeas for air density variations. This is achieved by using the density ratio, which is the quotient of the mean air density over the instantaneous air density ρ at the time of measurement. The adjusted power is given by
where Padj is the adjusted power output, Pmeas is the measured power output, is the mean air density over the measurement period and ρ is the instantaneous air density at the time of measurement.
The mean air density is calculated from the available air density data, and the instantaneous air density is obtained from synchronised environmental data obtained from EMD International A/S (2023).
2.4 Wind turbine control – data analysis
Developing a method for measuring power performance from SCADA data necessitates a comprehensive understanding of the individual turbine and manufacturer's control algorithm. Every OEM has developed its own unique control strategy to manage turbine loads and optimise power production. These proprietary control philosophies (Aho et al., 2012), which are closely guarded intellectual property, highlight their significance in the competitive landscape. Importantly, turbines within the same family can exhibit variations in control strategies due to incremental revisions. Moreover, a turbine's control system may undergo significant changes during its operational lifespan, through either software or hardware upgrades. These upgrades, at times offered as paid customer services, can markedly alter the turbine's performance and the dynamics of performance measurement; this has been ascertained by empirical observations made during this study.
In this context, the chosen approach is tailored to the unique control strategies employed in the particular turbine model under investigation. The specific turbine model utilises both generator torque and blade pitch as primary handles to regulate turbine speed. For the turbines analysed in this study, the blade pitch angle and rotor speed are dynamically adjusted based on the current wind conditions, aiming to optimise energy capture. Consequently, under varying wind conditions, the turbine's generator speed and power output are expected to change dynamically in partial load. Existing literature provides examples of wind turbine controllers that incorporate wind measurement alongside torque measurement (Bolik, 2004). This detailed description of the controller describes how the rotor is operated at low wind speed, with the controller ensuring a mix of torque as a function of rotor speed and constant tip speed ratio. In this region of the power curve, the blade pitch curve is relatively flat (as seen later in Fig. 2). At higher wind speeds, the rated power is kept constant by pitching the blades.
2.5 Turbine performance integral: a method for assessing wind turbine performance
This study introduces an approach to assess wind turbine performance. Traditional power curve analysis (power as a function of wind speed) suffers from significant uncertainty in representative wind speed measurement. This work explores an alternative metric to enhance assessment accuracy. For this turbine, monitoring the generator speed and power output in the partial-load region, marked by its relatively inactive pitch, provides an understanding of whether the turbine is operating as expected. A discrepancy, where the power output does not increase as expected with increasing generator speed, may indicate potential issues, such as mechanical wear and tear, an O&M event, or component inefficiency. Analysing the relationship between generator speed and power output in this operational region can serve as a proxy for turbine performance and function as a “virtual sensor” for long-term performance monitoring. This approach may reveal performance changes due to aspects such as changes in blade aerodynamics as a result of erosion or application of blade enhancements.
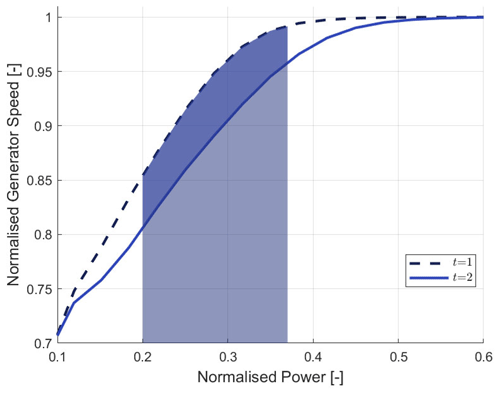
Figure 1TPI sensor: monitoring area below normalised generator speed as a function of power over time.
Datasets for each turbine covering a 12-year period are loaded. The integral or area under the generator speed curve between 20 % and 37 % of normalised power is monitored, as illustrated in Fig. 1, a region empirically determined by observing linear segments of this curve – where the pitch angle is minimally active (see Figs. 2 and 3). Buffers are added to each side of the range to accommodate transient behaviour. Within the specified power range, an increase in area under the curve indicates that the turbine has to rotate at higher speeds to generate the same amount of power. Thus, an increase in this area reflects a decrease in the turbine's efficiency. Over the observation period, the trend in this integral provides a metric for the turbine's performance trajectory: an increasing area suggests a deteriorating performance, while a decreasing area indicates an improvement. Thus, the integral, with units of rpm kW (rad W s−1), is indicative of this turbine's performance trajectory and is referred to as the turbine performance integral (TPI).
Mathematically, the TPI can generally be described as follows:
where f(x) in this study is the electric power, P(Ω), and x is the generator speed, Ω. Thus, it can be expressed as
where Ω is the generator speed (rpm); P(Ω) is the power output (kW) as a function of the generator speed; and Ω1 and Ω2 are the lower and upper bounds of the generator speed corresponding to 20 % and 37 % of the normalised power, respectively.
For the trapezoidal integration within defined bounds, the method computes the integral under the curve, ensuring consistent data smoothing across all turbines by maintaining a uniform buffer size. The ring buffer, with a fixed size, is updated weekly, and its configuration directly influences the turbine performance integral (TPI) outcomes. The integration is based on data measured over a 1-week period, with the ring buffer being initialised and updated by filling it progressively with new data points. If a bin does not have sufficient data points for the current week, the ring buffer carries over the previous week's data to fill the gap. This process continues until the current week's bin has accumulated enough valid data points. When new data points are added, the ring buffer is updated in a circular manner, replacing the oldest data with the newest as needed. If insufficient data points remain, values from previous periods are “shed”. The buffer's circular structure ensures that each bin consistently retains the most recent data points, providing a means for tracking changes over time.
Data processing involves several steps: filling missing bins, updating the ring buffer and estimating the seasonal component. In particular, the estimation of the seasonal component leverages seasonal and trend decomposition using locally estimated scatterplot smoothing (STL), which breaks down the data into a long-term trend, seasonal trend and residual short-term remainder, a process elaborated on in Sect. 2.6.
Finally, the power output is adjusted for air density (ρ). A moving-average filter is applied to smooth the data, and a detrended plot is generated for better visualisation.
This methodology provides a robust framework for dissecting and evaluating the performance of wind turbines over a specified period and varying time frames considering various performance-altering factors. It enables the identification of seasonal trends, short-term variations and long-term performance trends, offering valuable insight into wind turbines' performance evolution. Notably, in this turbine's case, this method proves to be effective without direct wind speed measurements.
2.6 Seasonal trend decomposition
After calculating the TPI virtual sensor signal from the generator speed–power relationship, seasonal and trend decomposition using locally estimated scatterplot smoothing (LOESS) is employed to extract valuable insights from the time-series data. STL is a robust and adaptable time-series decomposition technique introduced by Cleveland et al. (1990) with widespread applications (Sanchez-Vazquez et al., 2012; Hafen et al., 2009; Anderson et al., 2013; Xu et al., 2023; Verbesselt et al., 2010). Decomposition models have also been proposed in the application of wind forecasting (Prema and Rao, 2015). Its suitability for analysing the wind turbine performance integral stems from the presence of both trend and seasonal components in the data.
Following the methodology described by Cleveland et al. (1990), STL decomposes a time series into three components: seasonal, trend and residual. This decomposition is mathematically represented as follows:
where Yt denotes the observed data at time t, Tt is the trend component, St is the seasonal component and Rt is the residual component.
The long-term trend component isolates the underlying progression of turbine performance over extended periods. Unwanted seasonal elements and random noise are filtered out, providing a smoothed signal representing factors such as O&M events, cumulative wear and tear of the wind turbine, or longer-term climatic changes.
The seasonal component captures effects and variations related to cyclical atmospheric conditions over multiple years. It effectively attempts to remove the provided signal of the multitude of weather effects, such as turbulence patterns and other wind patterns. For this study, the frequency of this component is set to an annual frequency, essentially “telling” the function where to expect a repeating pattern in the signal, which aligns with the periodicity expected in wind data. This approach reveals performance trends within a calendar year. Notably, STL decomposition does not artificially create seasonality; a missing seasonal component at the fed cycle, or an incorrect frequency specification or absent seasonal pattern, results in a very apparent weak or missing decomposition.
The short-term remainder component of the signal encapsulates what is left over from the time series after removal of the long-term and seasonal trends and is constituted by erratic or erroneous fluctuations. The variations seen in this component may on occasion be attributed to transient technical issues or daily weather changes or may remain unaccounted-for factors due to immediately unknown causes that may include erroneous data.
The implementation of STL in the methodology was done through MATLAB's “trenddecomp” function (The MathWorks, Inc., 2023) applied to the virtual TPI signal generated from the relationship between generator speed and turbine power.
2.7 Data visualisation
Data visualisation plays a crucial role in interpreting the findings derived from the STL decomposition results. A multi-panel figure with a common x axis (time) and individual y axes for each panel was employed to effectively present the findings in a comprehensive manner. This structure facilitates the simultaneous examination of the trend, seasonal and remainder components, revealing their interaction over time. This was applied for each wind turbine for the 12-year period of analysis.
The common x axis, representing time, provides a reference point for all subplots, enhancing the understanding of the concurrent evolution of these components. Each panel of the stacked plot is dedicated to one component of the STL decomposition: long-term trend, seasonal trend, short-term remainder and a combination of these components. By examining patterns within each component, one can determine seasonal and long-term trend impacts on overall wind turbine performance and identify potential anomalies.
2.8 Statistical analysis
Moving beyond visual assessment and accounting for data uncertainty and limited sample sizes for certain categories, the application of statistical methods is imperative. While observational analysis provides valuable initial understanding, it does not fully account for the intrinsic and nuanced variability within the dataset. The use of statistical tests provides a scientific methodology to determine the likelihood that observed effects genuinely exist and are not merely coincidental artefacts. This study aims to determine the significance of observed performance differences and ensure the reliability of the findings through appropriate statistical analysis. A sequence of statistical analysis is employed to gain an understanding of the dataset and the study's findings. First, the normality of the “difference” values across each event category is assessed to determine the appropriate statistical tests. Then, significance tests are conducted to evaluate whether the performance differences for each category are significantly different from zero. Finally, optimal sample sizes are considered through power analysis to ensure the reliability of the findings. The following section outlines the rationale behind each statistical method.
Normality tests are conducted to determine the distribution characteristics of the data, as this information is crucial for selecting appropriate statistical tests. For the normality assessment, the selection of suitable statistical tests for the analysis depends on the distribution characteristics of the difference values across each event category. The Shapiro–Wilk test (Shapiro and Wilk, 1965), known for its efficacy in assessing deviations from normality, was employed to test the null hypothesis that these values originate from a normally distributed population. It is important to note that this test can be sensitive to sample size, especially for very small or very large samples, with optimal performance for sample sizes around 20–50, and its application requires careful consideration. A p-value threshold of 0.05 was used. Results above this threshold do not definitively prove normality; they indicate an absence of sufficient evidence to the contrary, justifying a working assumption of normality.
Significance tests are carried out to determine whether the observed performance differences for each event category are statistically significant or merely due to chance. Significance tests were conducted to assess whether the performance differences for each event category were significantly different from zero. The choice of significance test was contingent upon the results of the normality assessment. Depending on the normality of the data in each category, as determined by the Shapiro–Wilk test, either parametric one-sample t tests (Student, 1908), for normally distributed data, or non-parametric Wilcoxon signed-rank tests were utilised. The latter is particularly valuable for non-normally distributed data (Wilcoxon, 1945), offering an alternative to parametric tests. This test has previously been employed in studies regarding condition monitoring and fault detection in wind turbines by Dao (2022).
Sample size considerations are given to ensure that the study has sufficient statistical power to detect meaningful effects and to provide reliable results. The optimal sample size depends on a desired level of statistical power, the magnitude of the effect size to be detected and the variability within the dataset. A power analysis (Cohen, 1988) was conducted to ascertain the minimum sample size necessary to detect a statistically significant effect with a specified confidence level. The desired power was set at 0.8, representing an 80 % probability of correctly rejecting the null hypothesis when it is, indeed, false. The alpha, or significance level, was set to 0.05 for the alpha level, indicating a 5 % risk of erroneously rejecting the null hypothesis when it is true. Particular attention was paid to categories with limited sample sizes (fewer than 20 data points), as these can reduce the power of statistical tests and increase the risk of errors. The effect size, indicative of the magnitude of the difference aimed to be detected, was estimated from the current dataset using Cohen's d as a metric, alongside measures of variability such as the standard deviation. It is important to acknowledge that using sample data as an estimate of the effect size and sample standard deviation as an estimate of the true population standard deviation is an approximation. The actual sample size required may vary considerably depending on the true effect size and population variability, which are unknown a priori. Therefore, the results of the power analysis should be interpreted as an initial guide, subject to refinement as more data become available.
3.1 The effects of software updates
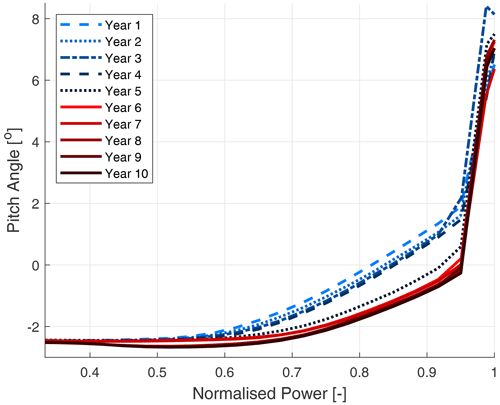
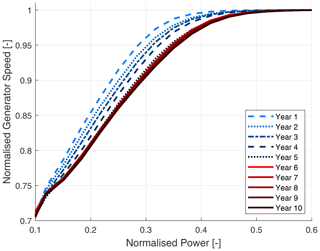
Figures 2 and 3 illustrate the evolution of the pitch angle and normalised generator speed, respectively, as functions of power output for the initial decade of a turbine's operation, segmented into annual intervals. The analysis indicates recognisable alterations in the operational trajectory of both parameters within the first half of the observation period. These changes appear to coincide with the roll-out of turbine manufacturer software updates while the turbines were under an OEM service contract. Each update likely altered both the pitch as a function of power and the generator speed as a function of power curve relationships. In subsequent years, without any software updates, the curves stabilised, showing no significant deviations. This supports the hypothesis that these updates were the causal factor in the observed shifts.
Beyond the shift itself, these alterations suggest specific impacts. In the higher power range, where the generator speed is constant and the turbine's control solely relies on the pitch, a progressive annual decrease in pitch angle of up to 2° was observed at power levels approaching the upper threshold of the nominal capacity, until year 5 of operation.
In the lower normalised power range, despite the pitch angle remaining constant and unaltered, the generator exhibited progressively higher relative power outputs at specific normalised generator speeds over the initial 5 years. This increase is noteworthy, with relative power gains reaching up to 10 % of nominal capacity at generator speeds close to the upper limit of the nominal operating range.
As the turbine power increases, the point of maximum thrust, known as the knee of the power curve, is reached around the rated power. Here, the turbine blades initiate their pitching, thereby relieving loads on the blades. These findings suggest that the change in the relation between pitch and generator speed as a function of power is not as a consequence of degradation of the rotor performance; rather, it is more likely due to software updates resulting in more aggressive pitch control, increasing blade loading as they pitched in more frequently. This shift in control strategy boosted power output, albeit potentially at the expense of reduced blade and turbine component longevity. Despite these changes, an original equipment manufacturer (OEM) may describe this adjustment as “load neutral” or within the turbine's certified design tolerances.
These observations raise questions as to whether such “uprates” in power are strategic decisions, balancing immediate gains against long-term component durability. One may also consider whether such business-impacting decisions were made solely by the supplier or collaboratively with the owner. Consideration must be given to economic aspects, weighing immediate benefits against component lifespan, particularly in light of potentially less favourable future energy tariffs.
Such software updates introduce an additional variable into the complex haystack of factors or uncertainties that can obscure the relatively smaller performance shifts caused by blade erosion. Accurate documenting and logging of these updates, along with their tangible effects on turbine control, is imperative to be factored into assessments. Changes in parameters can significantly alter conclusions regarding the turbine's response and are critical in the inclusion of holistic long-term performance evaluations.
3.2 Seasonal trend decomposition
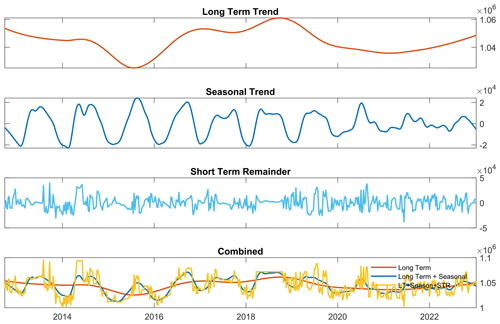
The analysis of the time-series data for the 12-year period of analysis revealed the distinct trend components influencing the generator speed as a function of power or TPI characteristics for the 12 wind turbines. Figure 4 exemplifies a single turbine's decomposition. To reiterate, as detailed earlier in Sect. 2.5, a TPI decrease reflects improved turbine performance.
The long-term trend subplot highlights the fundamental performance trend within the data. While it experienced variations over the analysed time period, the trend remained stable considering its variation between the start and end dates of the time frame. This trend and its correlation with the life cycle events of the 12 turbines are further discussed in Sect. 3.4.
The seasonal trend definitively confirms expected cyclic patterns. Notably, seasonality in turbine performance emerges distinctly with peaks during summer and troughs in winter. A deeper exploration of this trend is undertaken in Sect. 3.3.
The third subplot of Fig. 4 illustrates the short-term remainder (STR). This represents the residual fluctuations after accounting for the long-term and seasonal trends, capturing unexpected events or anomalies beyond the other trends.
Lastly, the combined subplot integrates the effects of the long-term trend, seasonal trend and STR, providing a holistic representation of the raw signal over time.
3.3 Seasonal influence
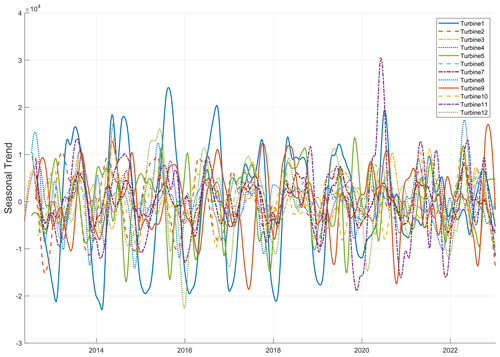
Figure 5 depicts the superimposed seasonal trend signals for all 12 turbines. Despite the inherent noise in the data, clear seasonal patterns emerge, characterised by pronounced peaks indicating reduced performance in the summer months and noticeable troughs signifying improved performance during the winter months. This counterintuitive direction stems from the turbine-specific approach used in the TPI calculation.
The analysis encompassed a dataset spanning several years, focusing on the summer peaks, considering May to September time periods and winter troughs, spanning December to mid-March. Extreme performance values were extracted from these seasons, and their distribution was presented using a violin plot (Bechtold, 2016; Bechtold et al., 2021) in Fig. 6 to visualise the distribution of these extreme values across the two seasons. This figure highlights the contrasting oscillatory performance of the turbines across these seasons.
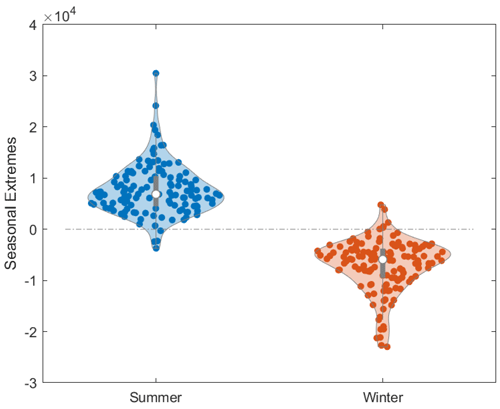
Figure 6Seasonal performance extremes for 12 turbines: a comparative analysis of summer and winter variability. Lower values indicate enhanced performance, while higher values denote reduced efficiency.
Nevertheless, it is noteworthy that the peaks and troughs are inconsistent among the 12 turbines, despite their shared operational environment. This inconsistency may arise from the underlying method of deriving the TPI where a ring buffer accumulates data before generating the signal. Consequently, such buffering introduces a downstream lag in the TPI signal that depends on non-weather-dependent factors specific to each turbine, such as outages or repairs. The extent of this lag generated by this method is reflected in the varying dates of summer peaks or winter troughs for individual turbines within a given season. While the ring buffer runs dynamically, individual tuning of buffer parameters for each turbine may offer an opportunity for method refinement (discussed in Sect. 3.5).
Additionally, Fig. 5 suggests muted and diverse summer and winter extremes for all turbines post-2020. This could potentially be caused by greater weather instability in recent years or cumulative ring buffer effects. These factors may also explain the spread of extreme values observed in Fig. 6.
This approach using the TPI demonstrates that distinct seasonal variations in an individual turbine's performance can be detected without direct wind speed measurements and without comparing the single turbine to a group or using combined data from multiple sources. Essentially, an individual turbine can distinctly reveal performance fluctuations driven by seasonal dynamics.
Although the data were density-corrected, seasonal patterns still emerge, indicating that density correction (to the extent possible) does not account for other effects such as wind shear and direction, wave conditions, and component temperature impacts, which may contribute to the observed variations.
Despite this, the evident variance in seasonal performance peaks and troughs across the 12 turbines also underscores the challenges tied to this approach. Notably, the winter troughs signify a more enhanced or improved performance compared to the summer peaks. With a sharper understanding of the dates of seasonal variations, one may strategically schedule outages or operations and maintenance, maximising energy production. Furthermore, anticipating periods of high and low generation, strategies can be formulated for energy storage, distribution and consumption, ensuring grid stability and efficient utilisation.
In the context of climate change, broader performance trends observed across multiple turbines, unrelated to specific events, may be indicative of changing weather patterns affecting turbine performance. This common environmental impact may be studied to further understand how the performance of turbines is affected by weather. Time-series decomposition tools can help differentiate event-driven changes from seasonal and potentially climate-related trends. Future research could include data normalisation to enhance this distinction. Given the shared climatic conditions, normalising the performance of a turbine against the daily average performance of all turbines could isolate the effects of events from those caused by broader weather influences, offering a purer perspective on the direct impacts of weather on turbine performance.
3.4 Long-term trend
Figure 7 depicts the superimposed long-term trend signals of all 12 turbines. Three broad yet distinct clusters among the turbine performances emerge. Turbines sharing similar trajectories of decrease, increase or variation across the long-term trend component were thus grouped, suggesting possible shared drivers:
-
Group One (light blue) – early performance improvement. Turbines 2, 4, 7 and 12 predominantly exhibit a downward trajectory in TPI, indicating an improvement in performances. This improvement is particularly apparent up to approximately 2017. The early improvement may potentially be associated with the iterative software updates rolled out to these turbines, as discussed in Sect. 3.1. Post-2017 these turbine performances seem to stabilise and become more consistent, likely due to the end of the service contract with the OEM and cessation of further software updates.
-
Group Two (dark blue) – late performance decline. Turbines 3, 5 and 9 show a similar improvement in performance during earlier years to Group One. Nevertheless, they subsequently experience a drop over time, with an exception being Turbine 5, which exhibits a later-stage improvement and also displays slight performance undulations through its operational lifespan, in a pattern similar to that seen for Group 3.
-
Group Three (red) – synchronised performance variability. Turbines 1, 6, 8, 10 and 11 exhibit predominantly synchronised performance fluctuations, albeit with a lag between them, which may be ascribed to the ring buffer effects. This effect was seen earlier in the seasonal trend for the turbines in Fig. 5, in Sect. 3.3. In the cluster, Turbine 11 notably deviates from the common longer-term trend path, exhibiting characteristics similar to Group One, especially towards the later progression of time. Despite this, most turbines in this group show an improvement in trend in the earlier years relative to Groups One and Two, which may be attributable to software updates. It should be noted that updates for certain turbines may have been applied at differing intervals. In later sections, this shared performance pattern is explored more thoroughly, aiming to correlate it with specific events in the timelines of these turbines. If common events are not identified, it may be plausible that these commonalities are attributed to long-term climatic changes, though this would need to be reconciled with Group One's lack of similar effects.
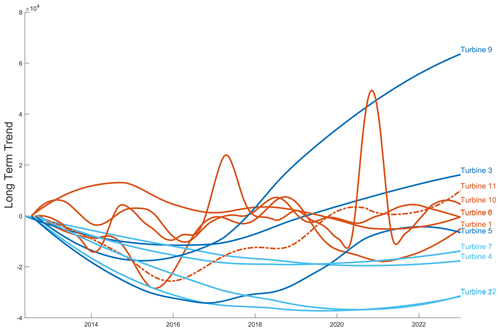
Figure 7Grouped long-term trends in turbine performance: analysis of shared trajectories among 12 turbines.
As illustrated in the long-term trend graph of Fig. 7, it is evident that the aggregation method and data handling techniques can greatly influence the interpretation of performance trends. The application of a ring buffer in data processing, consistent across all turbines in the analysis, while not explicitly shown in the graph, underpins the observed performance trends by controlling the flow and smoothing of the input data. A smaller buffer size provides a detailed, immediate view, ideal for detecting short-term variations and immediate operational issues. On the other hand, a larger buffer size offers a comprehensive overview, highlighting long-term trends and gradual changes, while potentially missing brief anomalies. Future studies could include analysing the effects of different buffer sizes to assess their impact on the long-term performance trajectories, providing insights into the optimal data processing parameters for trend analysis. This would refine the analytical model, potentially offering a more tailored approach to understanding each turbine's unique performance characteristics.
3.5 Influence of erosion, blade enhancements, and operations and maintenance (O&M) events
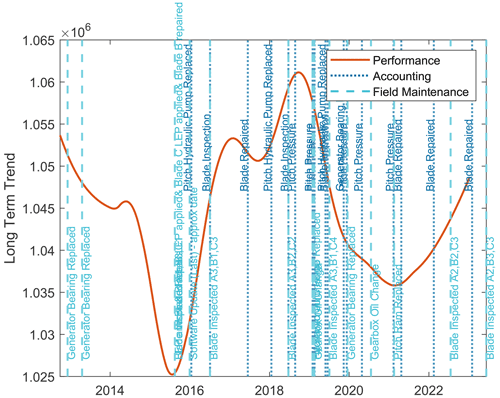
This section aims to uncover correlations between specific maintenance activities, blade modifications and the observed long-term TPI trends of individual turbines. Efforts taken to compile a comprehensive record of maintenance activities are outlined Sect. 2.1. Compiled field maintenance reports and financial accounting data sourced from SAP were amalgamated and overlaid visually on the long-term trend component in Fig. 8 for Turbine 1.
To reduce subjectivity in this assessment and observational bias of visual correlations, an automated approach was used to quantify the influence of various event categories on the TPI long-term trend gradient. The gradient was calculated between two points: the first 2 weeks prior to an event, accounting for repair time, and the second 3 weeks after the event to capture potential trend deviations. Varying the temporal buffers around the events resulted in analogous outcomes for the analysis. It is important to note that the analysis presented here is based solely on the field maintenance reports. The accounting SAP data, despite being a potential source of event information, were not utilised in this analysis due to the incorrect event dates associated with the work. This limitation, caused by the temporal discrepancies in the SAP data, is significant as it results in a partial view of the event data, affecting the comprehensiveness and accuracy of the analysis. Figure 9 presents the results as violin plots, visually summarising the performance impact distribution for each event category.
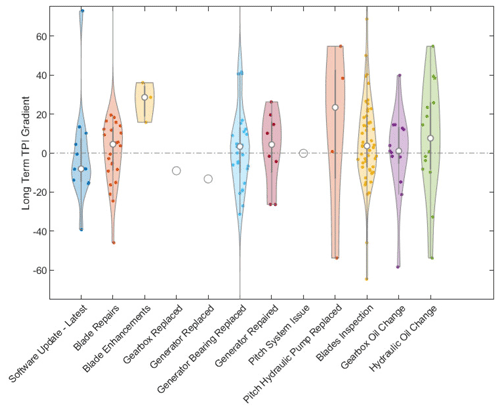
Figure 9Event impact on TPI trend: violin plots summarising the performance impacts post-events, derived from gradients calculated around event timings based on field reports, excluding SAP data due to date discrepancies.
The plot provides an overview of the performance impact distribution for each event category, deliberately focused on densest region, while retaining the rare (three) outliers in the underlying data. The direction towards the positive signifies a reduction in turbine performance. The white dot represents the median of the distribution, the bar in the centre represents the interquartile range and the whiskers represent the remaining distribution. Each shape provides the distribution of individual performance impact events for the category. The bulge of the shape at different gradients represents the density of event data points at that value. Essentially, the spread of data within a category is easily identified by its shape. Additionally, categories of events that have the most variable effects on turbine performance and those that tend to have consistently positive or negative impacts can be identified.
Key observations and limitations from this analysis include the following:
-
Controller PLC parameter or software updates (latest). Numerous software updates were applied to all 12 turbines over the first 5 years of operation. The plot represents the impact of only the last software update applied in the last quarter of 2015. The category shows a relatively narrow distribution that is negatively skewed, indicating that the updates often improved turbine performance. The effects were first observed by the change in turbine operational trajectory in Figs. 2 and 3. These performance changes align with observations of the long-term trend of the turbines in Sect. 3.4 and Fig. 7, although, in the earlier figure, with a wider overview, a somewhat continuous improvement over the first 5 years of the turbines' lifetimes was observed for the numerous iterative updates.
-
Blade repairs (all). When interpreting the impact of blade repairs, it is important to note that new blades may not always precisely match the aerodynamicist's intended profile due to manufacturing variances – tolerances for which are treated as intellectual property by manufacturers – which subtly affect baseline performance (Ernst et al., 2014; Loeven and Bijl, 2008). Regarding uptower repairs, a wider distribution with a slight positive performance bias suggests that such repairs can sometimes lead to a decrease in turbine performance. Nevertheless, the variance is wide, indicating that the impact can be inconsistent. This is a curious and unexpected result. Yet, digging deeper one must acknowledge that not all blade repairs have a positive influence on the blade aerodynamics. Blade repairs often aim to stop or prevent progression of structural damage to a blade leading edge. The blade leading edge is sanded and filler is applied, after which leading edge protection (LEP) may be applied. The task is labour-intensive, requiring trained, skilled personnel, often working under sub-optimal conditions, challenges that are amplified in offshore uptower environments. These repairs often result in the blade leading edge no longer matching its original and intended aerodynamic profile, resulting in a reduction in efficiency (Katnam et al., 2015). In the case of the underlying dataset represented here, all blade repairs, including those that are known to be defective and thus detrimental to turbine performance, are included. It is therefore prudent to break down the category of blade repairs into those that result in a cleaner blade profile and those that are likely to have degraded the turbine performance. Additionally, it is crucial to consider the seasonal timing of blade repairs, predominantly conducted during the summer months, which may inadvertently introduce a bias into the analysis. This seasonal scheduling of maintenance activities, driven by operational and logistical considerations, especially in an offshore environment, could skew the observed performance trends, creating an uncorrected seasonal bias that influences the interpretation of the TPI's long-term performance trajectory.
-
Blade inspections. Although inspections may be a precursor to repairs, this category comprises events or data points when the turbine blades were simply inspected and no work was conducted. The category can serve as somewhat of a control, since no actual physical changes were made to the turbine blade. The very wide distribution with a slight negative skew suggests that blade inspections can sometimes lead to improved performance, though not consistently. The degree of slight negative skew may be interpreted as the uncertainty in the method. This is because there should, in fact, be no expected change in turbine performance, and the negative skew does not, of course, reflect reality. However, it is worth speculating that during some of these inspections, the work instructions may have encompassed a pitch re-calibration, potentially influencing these outcomes. While this remains speculative, such re-calibrations, if they occur, could inadvertently impact performance, thereby slightly altering the expected “no change” scenario post-inspection. Similar to blade repairs, the timing of these inspections, often aligned with the summer months for operational convenience, introduces an uncorrected seasonal bias into the analysis.
-
Blade enhancements. A number of turbines in the wind farm were furnished with third party Gurney flaps and vortex generators as an experiment to understand their impact on the turbine performance. Three of these turbines were in the population under investigation. The efficacy of these enhancements hinges on their positional design tolerance and, consequently, precise application, which is notably more challenging in uptower installations than in controlled factory conditions, potentially impacting the observed performance outcomes. These blade enhancements were not applied in collaboration with the OEM, and there was thus no associated controller changes made, with software updates being under the exclusive mandate of the OEM and integral to the turbine's certification. It was noted that the wind anemometer of these turbines showed a step change in the measurement of wind speed compared to their neighbours in the same row, which would have a direct impact on the turbine's operational setpoint, considering its control utilises the anemometer for its operation. The upshot of these changes to the aerodynamic profile of the blade is that the distribution is positively skewed with a relatively narrow distribution, indicating that blade enhancements often lead to a decrease in performance for the three turbines. Although, one should consider that this is on the basis of a very small population size.
-
Gearbox and generator replacement. These categories both show a slight improvement in turbine performance, as would be expected when faulty major components such as these are replaced. Although, since these categories each have a population of one, the high uncertainty should be considered while making conclusions.
-
Generator bearing replaced, generator repaired and pitch hydraulic pump replaced. These categories show, to varying degrees, a reduction in turbine performance. The exclusion of some additional generator bearing faults, as noted in the accounting SAP data, although not time matched with or entirely absent from the repair reports, highlights a limitation of the analysis.
-
Pitch system issue. This category shows a neutral impact. Again, the high uncertainty due to the population consisting of one should be considered while making conclusions. Although, again, an important consideration in the interpretation of these results is the discrepancy in the recording of events between different data sources. Notably, numerous pitch ram replacements were identified in the accounting SAP data, which were not captured in the field maintenance reports. This discrepancy is significant, as the replacement of a critical component such as the pitch ram could have a substantial impact on the turbine's performance, potentially affecting its ability to correctly adjust blade pitch in response to wind conditions. The absence of these events in the repair reports introduces a limitation in the analysis, as the influence of pitch ram replacements on turbine performance remains unaccounted for.
Additionally, one may consider the mechanical integration of the blade root end, pitch bearing and hub. Over time the blade root flange surface could deviate from design specifications such as its flatness and perpendicularity. Such deviations could potentially compromise the turbine's ability to accurately adjust the blade pitch, further influencing performance outcomes.
-
Gearbox oil change and hydraulic oil change. These are both maintenance categories that would not be expected to have an impact on the turbine's performance. This expected result is seen in the case of the former, the gearbox oil change, where the median value is very close to zero, although with a wide variance yet normal spread in results.
Hydraulic oil change shows a reduction in performance, along with a wide variance and normal spread. It can be hypothesised that the thoroughness of the employed maintenance procedures might influence outcomes, particularly regarding the degassing of hydraulic fluid, failing which can lead to a significant loss of performance. Nevertheless, this connection is speculative and also highlights the need for further investigation and refinement of the data and method employed by the study.
The dataset for blade repair contained all blade repairs, including those that were known to have a detrimental impact on the turbine performance. In Fig. 10, this repair is split into two populations, where one is known to be defective LEP and the other is known to be the remaining LEP application and repairs. It should be noted that the latter population is still likely to contain faulty applications of LEP and that this analysis does not account for the uncorrected seasonal bias, discussed earlier regarding blade repairs.
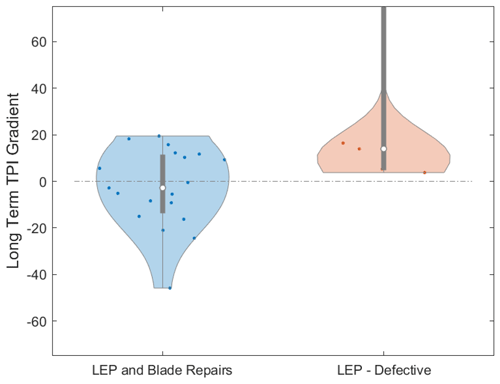
Figure 10Dichotomy between blade repair outcomes: evaluating the performance impact of defective LEP vs. repairs and non-defective LEP applications. Note that the latter category includes potential unaccounted for faulty LEP without correcting for seasonal biases.
-
LEP – defective. From the dataset of blade repairs (all), those of an LEP repair known to have had a detrimental effect on the blade leading edge were extracted. Blade repair technicians reported that this LEP left the blade in a tacky and sticky (poor-quality) condition, gathering contaminants within the first few days and weeks of application, with the strong recommendation to cease all further application of the product. The results of the impact on the performance of the LEP show a strongly positive skew, indicating a detrimental impact on the turbine performance. Note that a single outlier at 279.5, while retained in the data, has been omitted from the plots.
-
LEP and blade repairs (remaining). This is the remainder of the complete blade repair dataset after removal of the known detrimental or defective LEP. A slight negative bias suggests that blade repairs can sometimes lead to an improvement in turbine performance. Nevertheless, the variance is wide, indicating that the impact can be inconsistent. This inconsistency may be attributed to the various practical challenges associated with blade repairs and LEP application, discussed earlier. These factors earlier described can influence the aerodynamic efficiency of the blade post-repair, once it deviates from its intended profile, potentially leading to performance that may be worse than certain levels of erosion.
From Fig. 9 one can observe which event categories tend to have a stronger or weaker impact on turbine performance. A concentration of event data points further away from zero, such as in the case of the positive gradient of blade enhancements, indicates a greater reduction in turbine performance.
Although corrections were made for atmospheric conditions, including air density, temperature and humidity, the analysis does not consider the variability of other atmospheric conditions and factors such as turbulence, wind shear or veer. These factors, despite being excluded, are crucial for a comprehensive understanding as they can significantly influence the power output of wind turbines (Wharton and Lundquist, 2012; Murphy et al., 2020; St Martin et al., 2016; Kim et al., 2021). Variations in these conditions can lead to discrepancies between actual and expected performance, potentially confounding the analysis if they are not correctly taken into account. For instance, the wind profile's alignment with the rotor plane directly influences the efficiency of energy capture (Wan et al., 2015). Yaw misalignment can also lead to performance degradation. A yaw offset can cause uneven loading on the turbine blades, increased mechanical stress and reduced energy capture efficiency (van Dijk et al., 2016). This misalignment may be caused by maintenance issues or sensor inaccuracies and can result in a sustained loss of performance. Moreover, the use of nacelle direction as a surrogate for wind direction introduces additional complexity. This complexity arises from both the potential for dynamic yaw misalignment, influenced by the turbine's control algorithm hysteresis, and the possibility of static yaw misalignment, which could result in a constant offset in wind direction measurements.
The integrity of a turbine's foundational and structural elements, such as its blades and tower, is paramount to its performance. Over time, shifts or deterioration in these structures can subtly influence performance metrics, potentially skewing data analysis if they are not accounted for. Further, it is important to acknowledge the impact of dynamic forces and environmental conditions on turbine blade performance. Centrifugal force, wind loading and the thermal expansion of blades, depending on environmental conditions, can also influence the angle of attack (AoA), twist and prebend of blade profiles, consequently altering the blade polars (Loeven and Bijl, 2008). Additionally, the health of mechanical components such as gearboxes and drivetrain is crucial; wear and tear on these components can lead to performance degradation that maintenance records may not immediately reflect. Sensor accuracy and calibration are also critical factors. The drift in the precision and calibration of instruments, including anemometers and power meters, can significantly impact the reliability of the data collected (Pindado et al., 2012). Considering these aspects, it is evident that there may be a myriad of other influential events and factors that have not been captured in the analysis, which could affect the results. The omission of such details underscores the complexity of turbine performance analysis and the necessity for comprehensive data integration and meticulous scrutiny to inform accurate interpretations.
The analysis of turbine performance was further complicated by the imprecise temporal recording of O&M events and the notable absence of crucial event records. The investigation was hindered by the discrepancies between the financial accounting SAP database and the repair reports; the SAP database logged several critical events regarding major components, such as pitch ram replacements, yaw faults, generator bearing faults (CMS Comms) and a wind anemometer replacement, which were absent in the repair documentation. This discrepancy likely arose because the basis of the data is SAP accounting reports, where dates often correspond to billing dates rather than the actual repair dates. Consequently, there are likely other significant O&M events affecting the 12 turbines that were crucial to the analysis yet were not recorded. This gap between event occurrence and its documentation leads to inconclusive results, as the analysis may have overlooked key incidents that substantially impacted turbine performance, skewing the understanding of cause-and-effect relationships within the operational data and having tangible implications for the accuracy of interpretations of trends seen in Fig. 9.
Nevertheless, the inherent date lag, together with the fixed buffer size designated for data smoothing, introduces an element of uncertainty in this alignment. The buffer size, set to process 1000 data points at a time, influences the temporal resolution of the analysis. Given the variability in the lag over time and between turbines in particular, which can span up to several weeks or even months, identifying specific O&M events becomes challenging. For instance, if a turbine exhibits a sudden change in its performance, attributing this decline to a specific event becomes ambiguous when there is a potential delay of an unknown period in the signal. The buffer's role in data processing could inadvertently synchronise disparate events or mask the true temporal sequence, thereby complicating the interpretation of causality within the operational timeline of the turbines. Such delays can lead to misinterpretations, where an O&M activity may be mistakenly attributed to a performance change that actually occurred due to a completely different event or a combination of sequentially occurring events. This is particularly evident in the noise seen in Fig. 8, where the proximity of numerous events potentially distorts the clarity of cause and effect, diminishing the reliability of conclusions drawn from the data.
A salient consequence of the date lag, as elaborated on in Sect. 3.3, is its potential impact on the accuracy and reliability of the long performance trend signal. When assessing the TPI over an extended period, it was attempted to align these observed trends with specific operations and maintenance (O&M) events to derive an understanding of changes in turbine performance.
In light of the errors introduced by the variable lag, it is imperative to account for its influence when interpreting the long-term trend data for an individual turbine, which becomes more challenging when comparing data across different turbines. Potential solutions might involve refining the data collection methodology, employing advanced analytical techniques to correct for the lag or using supplementary data sources to corroborate the observed trends.
Moreover, for wind farm owners and operators, the lack of temporal precision of conclusions has tangible implications. Strategic decisions, such as scheduling maintenance, scheduling outages, allocating resources or forecasting energy outputs, rely heavily on the accuracy of such long-term trend data. Inaccuracies or uncertainties can lead to inefficiencies, increased operational costs and missed opportunities for performance optimisation.
Overcoming these challenges may allow for further work on comparative analysis, where one can also conduct a comparative analysis between turbines in cases such as when a specific event leads to a performance drop in one turbine although not in another. In such examples it would be compelling to investigate the underlying reasons. The reasons may vary from a difference in maintenance history and age to a phenomenon such as a difference in software updates.
A further avenue of investigation may be temporal analysis. Analysing the data over time may provide insights into whether there are specific periods where the impact on turbine performance is more pronounced. This may be achieved by plotting the gradient over time for each event category.
3.6 Statistical analysis
3.6.1 Normality assessment
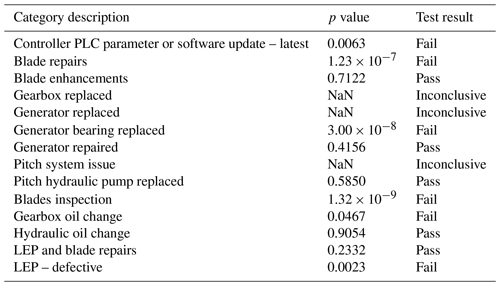
The normality tests were conducted using the “swtest” function available in MATLAB, as implemented by BenSaïda (2024). The Shapiro–Wilk test outcomes, shown in Table 1, indicate varied distribution patterns across categories. Notably, categories such as blade enhancements and generator repaired did not show sufficient evidence of non-normality. In contrast, categories such as blade repairs and generator bearing replaced suggest non-normal distributions. Categories yielding inconclusive results, marked by NaN p values, highlight the need for cautious result interpretation due to insufficient data points. These findings guide subsequent analyses: data that do not show sufficient evidence of non-normality are amenable to parametric tests, while non-normal data require non-parametric methods.
3.6.2 Significance tests
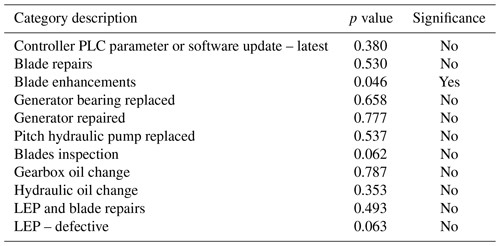
Significance test results are outlined in Table 2. Notably, the category of blade enhancements showed a statistically significant difference from zero, indicating that events in this category have a measurable impact on turbine performance. It is worth considering the potential impact of experiment-wise error – the increased likelihood of false positives when conducting multiple tests. A conservative approach, such as a Bonferroni correction, could be explored to address this, which would significantly lower the threshold for statistical significance. While blade enhancements do show significant changes, this is only if experiment-wise error is not corrected for. Essentially, without correcting for multiple comparisons, the risk of Type I errors (false positives) increases, potentially leading to overstating the significance of some findings. This suggests the need for a larger dataset to reinforce and enhance the reliability of the findings – especially for categories where sample sizes were limited. However, the employed conservative approach is appropriate given the study's assumptions and the exploratory nature of this analysis.
Other categories, such as software update – latest and blade repairs, did not exhibit statistically significant differences, suggesting that events in these categories may not have a distinguishable impact on performance. In the case of software updates it must be acknowledged that only the approximate date of the last update was logged, which likely influenced the outcome.
It is important to acknowledge the limitations inherent in these tests. Certain categories, including gearbox replaced and generator replaced, yielded inconclusive results due to the insufficiency of data, highlighting the necessity for cautious interpretation and potentially more extensive data collection for these specific categories. Additionally, this analysis operates under the assumption that events within each category are mutually exclusive for simplicity. Yet, this assumption does not accurately represent the complex interactions or compounded effects of multiple events. Moreover, as previously discussed, the impact of external factors, such as weather conditions or the ageing of turbine components, although not captured in this data, likely significantly influence turbine performance.
3.6.3 Sample size considerations
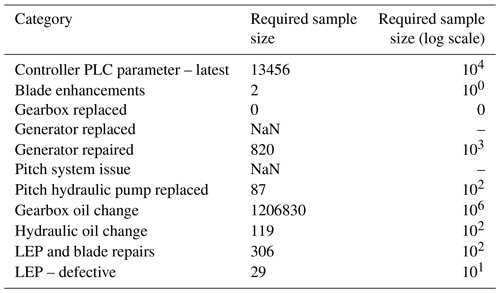
Required sample sizes in Table 3 highlight the disparity across event categories. Notably, the blade enhancement category has a small required sample size due to a larger, easily detected effect, whereas gearbox oil change requires a substantially larger sample size, pointing to either negligible effects or intrinsic high variability within this category, necessitating a large sample for detecting a significant effect. For categories with an NaN result, such as generator replaced, it suggests that the sample size calculation was not feasible, indicating impracticalities in sample size calculation due to no sample standard deviation.
These sample size estimates serve as valuable guidelines, and the sample size estimates should be anticipated as conservative orders of magnitude, indicating the quantity of data required to confidently detect significant effects in each category. Assumptions have been made such as normality for all distributions in the power study whilst there is evidence to the contrary. Collecting data of these sizes shall enhance the power of the statistical tests and bolster the reliability of the results. Despite this, practical considerations, such as logistical feasibility and resource availability, must also be factored into any decisions regarding further data collection efforts.
This study aimed to quantify energy losses in multi-megawatt wind turbines using SCADA data, focusing on the effects of leading edge roughness. Nevertheless, significant uncertainties in the data posed major challenges to accurately quantifying aerodynamic losses, hindering the study's original goal. Despite this, the study successfully highlighted the complexity involved in such analyses and also brought to light the significant challenges in accurately quantifying the aerodynamic efficiency reductions and subsequent AEP losses caused by blade leading edge roughness. A paramount challenge revealed is the accurate quantification of these losses, hindered by the dynamic nature of wind and compounded by operational constraints such as limited data availability, especially in documenting operations and maintenance events, and the quality of the available data.
In response, a methodological framework was developed, integrating SCADA data with detailed O&M records to assess the impact of blade aerodynamic modifications. This approach aims to isolate the effects of these modifications amidst a multitude of factors influencing turbine performance. A key contribution of this work is the development of a controller-informed turbine performance integral (TPI) method for the investigated turbine. Furthermore, STL is employed to further isolate long-term trends and seasonal variations in performance.
The proposed methodology focuses on isolating the individual contributions of various factors to performance deviations. Notably, the efficacy of the TPI method is demonstrated by its ability to detect distinct seasonal variations in individual turbine performance without relying on direct wind speed measurements, comparison to other turbines or the use of combined data sources.
Future research may explore TPI as a real-time monitoring tool for tracking turbine behavioural changes, potentially serving as an alternative to conventional power curve determination methods, although further refinement and validation is required.
The study confronted significant hurdles in accessing comprehensive, high-quality data, a persistent challenge in wind turbine performance analysis. OEMs often restrict data access to safeguard intellectual property, thus limiting in-depth analytical possibilities. Moreover, the opaque nature of turbine control systems further complicates the understanding of turbine behaviour under diverse conditions. Additionally, the investigation uncovered distinct seasonal trends with performance reductions during warmer months and improvements in colder months, demonstrated through overlaid seasonal trend signals. This trend, confirmed by the overlaid seasonal trend signals of all 12 turbines, validates the viability of the suggested TPI methodological framework. The clear emergence of these seasonal patterns, despite the inherent noise in the data, underscores the crucial influence of atmospheric conditions on turbine efficiency and further highlights that density correction alone (to the extent possible) does not account for all seasonal effects, such as wind shear and direction, wave conditions, and component temperature impacts.
Software updates, particularly in the initial operational phase of the turbine, were found to be a very likely reason for significantly influencing performance, enhancing power output while raising concerns about their long-term impact on the turbine components' operational lifespan. The study also determined that blade repairs and enhancements have variable impacts on turbine performance. Completing repairs closer to the original aerodynamic design typically improved performance, whereas deviations, such as those by faulty LEP repairs or introduction of third party blade enhancements, such as Gurney flaps and vortex generators, when applied without corresponding controller adjustments to the turbine's control system, can lead to decreased turbine performance. This highlights the importance of maintaining aerodynamic integrity in blade maintenance procedures.
Rigorous statistical analysis helped distinguish impacts attributable to specific maintenance activities, such as blade enhancements, on turbine performance. These findings emphasise the necessity of a substantial volume of events to establish confidence in results, highlighting the importance of statistical validation in performance analysis. Correlating O&M events with performance data trends revealed discernible effects on turbine performance, yet challenges in establishing precise cause-and-effect relationships arose due to temporal lags, seasonal biases in the occurrence of certain event categories and data recording inaccuracies, calling for careful data interpretation. Refinements to both pre- and post-event time point selection and the gradient change analysis process could enhance precision in quantifying event-specific impacts. The study thus stresses the critical need for maintaining accurate and comprehensive records.
The diverse long-term performance trends identified among different turbine groups suggest responses to operational, maintenance and environmental factors or, alternatively, may be attributed to data collection inaccuracies. This necessities a customised analytical approach for each turbine or group, tailored to its specific operational context. Future research should emphasise enhanced tracking of O&M events, refinement of data analysis methods, addressing data gaps and advancing analytical techniques. This may include application of machine learning algorithms for more refined insights and longitudinal studies, which are crucial for understanding the effects of ageing and environmental changes on turbine performance. Broader data access negotiations with OEMs, exploration of turbine control systems, integration of comprehensive environmental data and an economic analysis of maintenance strategies are also vital for advancing wind turbine performance optimisation.
The software code used in this study is not publicly accessible due to proprietary restrictions and confidentiality agreements. However, the methodology and algorithms are described in detail within the paper, allowing readers to replicate the results.
For third-party code utilised in this study, we have provided references through GitHub and MathWorks (https://github.com/bastibe/Violinplot-Matlab, Bechtold, 2016; https://www.mathworks.com/matlabcentral/fileexchange/13964-shapiro-wilk-and-shapiro-francia-normality-tests, BenSaïda, 2024).
The datasets analysed in this research are not publicly accessible due to proprietary restrictions and confidentiality agreements. Nonetheless, we have provided a comprehensive description of the data and the categorisation methods within the paper to enable replication by interested researchers.
THM was the primary researcher, responsible for the conception of the study, all experimental work, data collection and analysis, and writing the paper. CB, as the PhD supervisor, provided oversight, theoretical support, and guidance in refining the research methodology and paper.
Tahir H. Malik's PhD was funded by Vattenfall, where he is also employed.
Publisher’s note: Copernicus Publications remains neutral with regard to jurisdictional claims made in the text, published maps, institutional affiliations, or any other geographical representation in this paper. While Copernicus Publications makes every effort to include appropriate place names, the final responsibility lies with the authors.
We extend our gratitude to our countless colleagues at Vattenfall for their invaluable expertise in wind turbine engineering, which significantly enhanced the analytical depth of our study. We also acknowledge Vattenfall's support, particularly for financing this study and providing access to essential wind turbine datasets and resources, enabling a more comprehensive analysis. We acknowledge the use of an AI language model, OpenAI (2023), for refining a previous version of the manuscript. Our thanks go to Reese Wayne Davies, David C. Maniaci and the team at Sandia National Laboratories for their support and constructive feedback.
This paper was edited by Weifei Hu and reviewed by three anonymous referees.
Aho, J., Buckspan, A., Laks, J., Fleming, P., Jeong, Y., Dunne, F., Churchfield, M., Pao, L., and Johnson, K.: A tutorial of wind turbine control for supporting grid frequency through active power control, in: 2012 American Control Conference (ACC), 3120–3131, IEEE, https://doi.org/10.1109/ACC.2012.6315180, 2012. a, b
Albers, A.: Relative and integral wind turbine power performance evaluation, in: Proceedings of the 2012 European Wind Energy Conference & Exhibition, 22–25, https://www.researchgate.net/publication/242780574_Relative_and_Integral_Wind_Turbine_Power_Performance_Evaluation (last access: 1 August 2023), 2012. a
Anderson, T. K., Nelson, M. I., Kitikoon, P., Swenson, S. L., Korslund, J. A., and Vincent, A. L.: Population dynamics of cocirculating swine influenza A viruses in the United States from 2009 to 2012, Influenza Other Resp., 7, 42–51, 2013. a
Astolfi, D., Byrne, R., and Castellani, F.: Analysis of Wind Turbine Aging through Operation Curves, Energies, 13, 5623, https://doi.org/10.3390/en13215623, 2020. a
Badihi, H., Zhang, Y., Jiang, B., Pillay, P., and Rakheja, S.: A comprehensive review on signal-based and model-based condition monitoring of wind turbines: Fault diagnosis and lifetime prognosis, P. IEEE, 110, 754–806, 2022. a, b
Bak, C.: A simple model to predict the energy loss due to leading edge roughness, J. Phys. Conf. Ser., 2265, 032038, https://doi.org/10.1088/1742-6596/2265/3/032038, 2022. a
Bak, C., Forsting, A. M., and Sorensen, N. N.: The influence of leading edge roughness, rotor control and wind climate on the loss in energy production, J. Phys. Conf. Ser., 1618, 052050, https://doi.org/10.1088/1742-6596/1618/5/052050, 2020. a
Bechtold, B.: Violin Plots for Matlab, GitHub [code], https://github.com/bastibe/Violinplot-Matlab (last access: 8 August 2023), 2016. a, b
Bechtold, B., Fletcher, P., seamusholden, and Gorur-Shandilya, S.: bastibe/Violinplot-Matlab: A Good Starting Point, https://api.semanticscholar.org/CorpusID:244971580 (last access: 8 August 2023), 2021. a
BenSaïda, A.: Shapiro-Wilk and Shapiro-Francia normality tests, MATLAB Central File Exchange, https://www.mathworks.com/matlabcentral/fileexchange/13964-shapiro-wilk-and-shapiro-francia-normality-tests (last access: 16 February 2024), 2024. a, b
Bolik, S. M.: Modelling and analysis of variable speed wind turbines with induction generator during grid fault, Institut for Energiteknik, Aalborg Universitet, https://vbn.aau.dk/en/publications/modelling-and-analysis-of-variable-speed-wind-turbines-with-induc (last access: 1 August 2023), 2004. a
Butler, S., Ringwood, J., and O'Connor, F.: Exploiting SCADA system data for wind turbine performance monitoring, in: 2013 Conference on Control and Fault-Tolerant Systems (SysTol), Nice, France, 9–11 October 2013, 389–394, https://doi.org/10.1109/SysTol.2013.6693951, 2013. a, b
Cleveland, R. B., Cleveland, W. S., McRae, J. E., and Terpenning, I.: STL: A seasonal-trend decomposition, J. Off. Stat, 6, 3–73, 1990. a, b
Cohen, J.: Statistical Power Analysis for the Behavioral Sciences, Lawrence Erlbaum Associates, 2 edn., https://doi.org/10.4324/9780203771587, 1988. a
Dao, C., Kazemtabrizi, B., and Crabtree, C.: Wind turbine reliability data review and impacts on levelised cost of energy, Wind Energy, 22, 1848–1871, 2019. a
Dao, P. B.: On Wilcoxon rank sum test for condition monitoring and fault detection of wind turbines, Appl. Energ., 318, 119209, https://doi.org/10.1016/j.apenergy.2022.119209, 2022. a
Ding, Y., Barber, S., and Hammer, F.: Data-Driven wind turbine performance assessment and quantification using SCADA data and field measurements, Frontiers in Energy Research, 10, 1050342, https://doi.org/10.3389/fenrg.2022.1050342, 2022. a, b
EMD International A/S: WindPRO Software for Wind Energy Analysis, https://www.emd.dk/windpro/ (last access: 1 June 2023), 2023. a, b
Ernst, B., Schmitt, H., and Seume, J. R.: Effect of geometric uncertainties on the aerodynamic characteristic of offshore wind turbine blades, J. Phys. Conf. Ser., 555, 012033, https://doi.org/10.1088/1742-6596/555/1/012033, 2014. a
Farkas, Z.: Considering air density in wind power production, arXiv [preprint], https://doi.org/10.48550/arXiv.1103.2198, 2011. a, b
Gaudern, N.: A practical study of the aerodynamic impact of wind turbine blade leading edge erosion, J. Phys. Conf. Ser., 524, 012031, https://doi.org/10.1088/1742-6596/524/1/012031, 2014. a
Gonzalez, E., Stephen, B., Infield, D., and Melero, J. J.: Using high-frequency SCADA data for wind turbine performance monitoring: A sensitivity study, Renew. Energ., 131, 841–853, 2019. a
Hafen, R. P., Anderson, D. E., Cleveland, W. S., Maciejewski, R., Ebert, D. S., Abusalah, A., Yakout, M., Ouzzani, M., and Grannis, S. J.: Syndromic surveillance: STL for modeling, visualizing, and monitoring disease counts, BMC Med. Inform. Decis., 9, 1–11, 2009. a
Han, W., Kim, J., and Kim, B.: Effects of contamination and erosion at the leading edge of blade tip airfoils on the annual energy production of wind turbines, Renew. Energ., 115, 817–823, 2018. a
IEC: IEC 61400-12-1: 2017, Wind Energy Generation Systems – Part, 12, https://webstore.iec.ch/en/publication/26603 (last access: 1 August 2023), 2017. a
Katnam, K., Comer, A., Roy, D., Da Silva, L., and Young, T.: Composite repair in wind turbine blades: an overview, J. Adhesion, 91, 113–139, 2015. a
Kim, D.-Y., Kim, Y.-H., and Kim, B.-S.: Changes in wind turbine power characteristics and annual energy production due to atmospheric stability, turbulence intensity, and wind shear, Energy, 214, 119051, https://doi.org/10.1016/j.energy.2020.119051, 2021. a
Krog Kruse, E., Bak, C., and Olsen, A. S.: Wind tunnel experiments on a NACA 633-418 airfoil with different types of leading edge roughness, Wind Energy, 24, 1263–1274, 2021. a
Leahy, K., Gallagher, C., O’Donovan, P., and O'Sullivan, D. T.: Issues with data quality for wind turbine condition monitoring and reliability analyses, Energies, 12, 201, https://doi.org/10.3390/en12020201, 2019. a, b
Loeven, A. and Bijl, H.: Airfoil analysis with uncertain geometry using the probabilistic collocation method, in: 49th AIAA/ASME/ASCE/AHS/ASC Structures, Structural Dynamics, and Materials Conference, 16th AIAA/ASME/AHS Adaptive Structures Conference, 10th AIAA Non-Deterministic Approaches Conference, 9th AIAA Gossamer Spacecraft Forum, 4th AIAA Multidisciplinary Design Optimization Specialists Conference, 2070, https://doi.org/10.2514/6.2008-2070, 2008. a, b
Maniaci, D. C., White, E. B., Wilcox, B., Langel, C. M., van Dam, C., and Paquette, J. A.: Experimental measurement and CFD model development of thick wind turbine airfoils with leading edge erosion, J. Phys. Conf. Ser., 753, 022013, https://doi.org/10.1088/1742-6596/753/2/022013, 2016. a
Mishnaevsky Jr., L., Hasager, C. B., Bak, C., Tilg, A.-M., Bech, J. I., Rad, S. D., and Fæster, S.: Leading edge erosion of wind turbine blades: Understanding, prevention and protection, Renew. Energ., 169, 953–969, 2021. a
Murphy, P., Lundquist, J. K., and Fleming, P.: How wind speed shear and directional veer affect the power production of a megawatt-scale operational wind turbine, Wind Energ. Sci., 5, 1169–1190, https://doi.org/10.5194/wes-5-1169-2020, 2020. a
OpenAI: ChatGPT: Optimizing Language Models for Dialogue, https://openai.com/chatgpt/ (last access: 1 May 2024), 2023. a
Pandit, R., Astolfi, D., Hong, J., Infield, D., and Santos, M.: SCADA data for wind turbine data-driven condition/performance monitoring: A review on state-of-art, challenges and future trends, Wind Engineering, 47, 422–441, 2023. a, b, c
Pindado, S., Barrero-Gil, A., and Sanz, A.: Cup anemometers’ loss of performance due to ageing processes, and its effect on annual energy production (AEP) estimates, Energies, 5, 1664–1685, 2012. a
Prema, V. and Rao, K. U.: Time series decomposition model for accurate wind speed forecast, Renewables: Wind, Water, and Solar, 2, 1–11, 2015. a
Sanchez-Vazquez, M. J., Nielen, M., Gunn, G. J., and Lewis, F. I.: Using seasonal-trend decomposition based on loess (STL) to explore temporal patterns of pneumonic lesions in finishing pigs slaughtered in England, 2005–2011, Prev. Vet. Med., 104, 65–73, 2012. a
Shapiro, S. S. and Wilk, M. B.: An analysis of variance test for normality (complete samples), Biometrika, 52, 591–611, 1965. a
St. Martin, C. M., Lundquist, J. K., Clifton, A., Poulos, G. S., and Schreck, S. J.: Wind turbine power production and annual energy production depend on atmospheric stability and turbulence, Wind Energ. Sci., 1, 221–236, https://doi.org/10.5194/wes-1-221-2016, 2016. a
Student: The probable error of a mean, Biometrika, 6, 1–25, 1908. a
Tautz-Weinert, J. and Watson, S. J.: Using SCADA data for wind turbine condition monitoring – a review, IET Renew. Power Gen., 11, 382–394, 2017. a
The MathWorks, Inc.: MATLAB: trenddecomp function, mATLAB version 2023b https://uk.mathworks.com/help/matlab/ref/double.trenddecomp.html (last access: September 2023), 2023. a
van Dijk, M. T., van Wingerden, J.-W., Ashuri, T., Li, Y., and Rotea, M. A.: Yaw-misalignment and its impact on wind turbine loads and wind farm power output, J. Phys. Conf. Ser., 753, 062013, https://doi.org/10.1088/1742-6596/753/6/062013, 2016. a
Verbesselt, J., Hyndman, R., Newnham, G., and Culvenor, D.: Detecting trend and seasonal changes in satellite image time series, Remote Sens. Environ., 114, 106–115, 2010. a
Wan, S., Cheng, L., and Sheng, X.: Effects of yaw error on wind turbine running characteristics based on the equivalent wind speed model, Energies, 8, 6286–6301, 2015. a
Wharton, S. and Lundquist, J. K.: Atmospheric stability affects wind turbine power collection, Environ. Res. Lett., 7, 014005, https://doi.org/10.1088/1748-9326/7/1/014005, 2012. a
Wilcoxon, F.: Individual comparisons by ranking methods, Biometrics Bull., 1, 80–83, 1945. a
Xu, L., Ou, Y., Cai, J., Wang, J., Fu, Y., and Bian, X.: Offshore wind speed assessment with statistical and attention-based neural network methods based on STL decomposition, Renew. Energ., 216, 119097, https://doi.org/10.1016/j.renene.2023.119097, 2023. a
Yang, W., Tavner, P. J., Crabtree, C. J., Feng, Y., and Qiu, Y.: Wind turbine condition monitoring: technical and commercial challenges, Wind Energy, 17, 673–693, 2014. a, b, c


