the Creative Commons Attribution 4.0 License.
the Creative Commons Attribution 4.0 License.
 | 22 Jan 2024
Influence of rotor blade flexibility on the near-wake behavior of the NREL 5 MW wind turbine
Leo Höning
Laura J. Lukassen
Bernhard Stoevesandt
Iván Herráez
High-fidelity computational fluid dynamics (CFD) simulations of the National Renewable Energy Laboratory (NREL) 5 MW wind turbine rotor are performed, comparing the aerodynamic behavior of flexible and rigid blades with respect to local blade quantities as well as the wake properties. The main focus has been set on rotational periodic quantities of blade loading and fluid velocity magnitudes in relation with the blade tip vortex trajectories describing the development of those quantities in the near wake. The results show that the turbine loading in a quasi-steady flow field is mainly influenced by blade deflections due to gravitation. Deforming blades change the aerodynamic behavior, which in turn influences the surrounding flow field, leading to non-uniform wake characteristics with respect to speed and shape.
- Article
(2971 KB) - Full-text XML
- BibTeX
- EndNote


Since renewable energies have gained increasing attention in the context of global warming, the wind energy industry has grown considerably over the last decades, even though the growth should be even larger to reach the climate goals (WindEurope, 2022). In this context, the ever-increasing demand of energy, the urgency of replacing fossil resources and the economic demand for low prices in a highly competitive energy market lead to growing rotor sizes (Serrano-González and Lacal-Arántegui, 2016; GWEC, 2021). Larger rotors allow for higher energy output and a reduction of the levelized cost of energy. On the other hand, increasing rotor diameters along with mass restrictions forces the blade structures to become slender, which is accompanied by more flexibility and, thus, larger deformations of the blade due to wind loads. While blade flexibility has little effect on the overall rotor performance for smaller wind turbine rotors, aeroelasticity has significant effects on multi-megawatt turbines with long and slender blades (Rahimi et al., 2016b). Instabilities like vortex-induced vibrations or flutter occur with an increased probability and therefore gained increasing research interest over the last years (Heinz et al., 2016a, b; Horcas et al., 2022; Manolas et al., 2022). These highly unsteady phenomena need to be investigated further to ensure a prevention of unwanted blade vibrations. In this context, this work is intended to contribute to the basic understanding of deforming wind turbine blades.
Most wind turbine design tools are based on computationally efficient engineering tools using low-fidelity blade element momentum (BEM) theory models. Low-fidelity models are often based on smaller, more rigid turbines and need to be corrected towards dynamic flow phenomena like dynamic stall for a rapidly changing angle of attack, 3D effects near the blade root, and tip or skewed wakes for more flexible cases (Rahimi et al., 2018). In order to gain more reliable results, high-fidelity fluid-structure interaction (FSI) tools that couple computational fluid dynamics (CFD) with computational structural dynamics (CSD) models have been recently receiving increasing attention.
Several studies have investigated the difference between rigid and flexible rotors with respect to aerodynamic loads. Yu and Kwon (2014) showed that the aeroelastic deformation of the National Renewable Energy Laboratory (NREL) 5 MW wind turbine, which has a rotor diameter of 126 m, results in a reduction of aerodynamic loads mainly due to torsional deformation. The non-linear Euler–Bernoulli beam, which was used in that study, was coupled to their in-house incompressible fluid solver once per revolution. Similar findings were made by Dose et al. (2018), where the same rotor was simulated with OpenFOAM using a finite element method (FEM) based on a non-linear geometrically exact beam theory (GEBT) implementation including a loose coupling once per time step between the structure and the flow field that is calculated solving the unsteady Reynolds-averaged Navier–Stokes (URANS) equations, neglecting the influence of gravity. This study showed that the averaged aerodynamic power output is reduced due to two reasons. On the one hand, the blades are bending towards a smaller rotor diameter, which results in less area to extract energy from, and on the other hand, due to the twisting of the blades towards lower angles of attack (AoAs), which leads to a lower lift-to-drag ratio. This reduction of AoA due to the torsional deformation was also shown by Liu et al. (2019) for a floating setup under surge motion making use of OpenFOAM coupled to the multi-body dynamic solver MBDyn. Guma et al. (2021) simulated a pre-bent 80 m diameter turbine in turbulent inflow using the CFD code FLOWer, showing an increase in rotor torque for the flexible blades due to the bending resulting in an increasing AoA and a deformation towards a larger rotor disk area. The opposing behavior in these studies can be explained by the different structural models of the underlying turbines. However, these findings have not been related to effects in the respective wind turbine rotor wakes yet.
Besides the aerodynamic loading, wind turbine blades are influenced by gravity and centrifugal forces, which bend the blades independently of the aerodynamic forces. The influence of these forces is expected to be growing with increasing rotor sizes and the naturally accompanying flexibility of the structures. While the centrifugal force is expected to be constant in time for a constant rotational speed of the rotor and tends to straighten the blade in radial direction, the gravity force has a 1P blade passing frequency, with its direction depending on the azimuthal position. This leads to a dynamic blade deformation behavior as a result of the gravitational loading in contrast to the almost constant influence of the centrifugal force. Despite its influence on deformation and loading, Sayed et al. (2019) concluded that the gravitational impact on the total power output of a generic 10 MW wind turbine is negligible. The influence of gravitation on the turbine wake has not been investigated in detail yet, but it is important to understand the influence of blade flexibility in the context of wind farm layouts, where the wake of a turbine in the first row affects the inflow of turbines in the second row.
Comparisons between wakes of rigidly and flexibly modeled rotors have been studied for differently sized rotor blades. Under complex flow situations, i.e., sheared and yawed inflow, Grinderslev et al. (2021) showed that little differences are visible in the wake of a 2.3 MW rotor using URANS in the incompressible Navier–Stokes solver EllipSys3D. Li et al. (2015) simulated the NREL 5 MW rotor coupled to a multi-body dynamics solver and investigated local aerodynamic behavior under turbulent inflow. Under these complex conditions they concluded that on the scale of the turbine diameter, turbulence has a larger influence on the wake of a rotor than the flexibility of blades. However, smaller scales in wake regions closer to the rotor have not been investigated yet. Those are important, since the way the fluid is interacting with a wind turbine determines its characteristics further downstream.
On the other hand, small-scale numerical investigations of the rotor near-wake expansions have been performed making use of Navier–Stokes actuator disk (AD), actuator line (AL) approaches, and 3D vortex panel methods (Micallef et al., 2020) or body fitted rigid Reynolds-averaged Navier–Stokes simulations (RANS) (van Kuik et al., 2014; Herráez et al., 2017). Hodgkin et al. (2022) investigated the stability of a wind turbine tip vortex making use of large eddy simulations (LES) and an AL approach. Whilst AD/AL methods are limited to engineering corrections and small turbine RANS simulations assume the blades to be rigid, a coupled FSI investigation regarding the near-wake expansion has not been performed according to the authors' knowledge.
Based on these findings, the objective of this study is to investigate the effects of blade flexibility and gravitational loading on the blade aerodynamic forces of an averaged-sized MW turbine as well as their impact on the near-wake behavior, i.e., wake velocity deficits and blade tip vortex trajectories. The rotor is investigated under rated operating conditions in uniform inflow perpendicular to the rotor plane. Although this setup is supposed to reflect optimal rotor blade behavior, we will show that in this baseline case already differences can be seen in the flow of rigid and flexible blades resulting in non-uniform wake behavior for flexible blades. It is assumed that these results are superimposed by even more influences under off-rated conditions. The aerodynamic findings in the rotor plane are linked towards near-wake effects, highlighting the differences of the tip vortex trajectories and wake velocity deficits of rigid and flexible blades. In this paper we investigate the characteristic aerodynamic parameters that are necessary for analyzing the near-wake development. This can be of interest for wind farm studies.
In Sect. 2 the numerical setup including the solvers and post-processing methodologies is described. The results of the simulated cases focusing on aerodynamic characterization of rigid and flexible blades and turbine wake behavior are discussed in Sect. 3. Finally, a conclusion is given in Sect. 4, recapitulating the results and giving an outlook for future investigations.
In order to study the impact of structural flexibility on the aerodynamic behavior, simulations of the NREL 5 MW generic reference wind turbine (Jonkman et al., 2009) are performed. With a rotor diameter of 126 m, it can be considered an averaged-sized wind turbine in comparison to currently installed wind turbines (U.S. Department of Energy, 2021). Additionally, several studies of coupled CFD–CSD simulations on that specific turbine were performed (Yu and Kwon, 2014; Li et al., 2015; Liu et al., 2019) that can be taken into account for comparison purposes. This is important, since for a generic wind turbine no measurement campaigns have been conducted that simulations could be compared to.
2.1 Numerical discretization schemes and solver setup
Simulations are performed using open-source software OpenFOAM (2022), where the incompressible, transient flow solver pimpleDyMFoam is coupled to the in-house non-linear structural finite element beam solver BeamFOAM (Dose, 2018). The structural beam implementation makes use of the finite element GEBT formulation that was originally proposed by Reissner (1972) and Simo (1985) and is capable of resolving large deformations of wind turbine blades. Within this study, 49 iso-parametric beam elements per blade are used corresponding to the generic NREL design, each consisting of two nodes with 6 degrees of freedom. Each beam accounts for gyroscopic effects and stiffening due to centrifugal forces. The temporal integration made use of the second-order generalized-α scheme (Arnold and Brüls, 2007). The coupling of fluid and structure is embedded inside the OpenFOAM framework without the necessity of external code communication and operates in a so-called loose coupling manner, which means that information is exchanged once per time step.
The incompressible, transient flow is simulated using the hybrid Spalart–Allmaras delayed detached eddy simulation method (Spalart et al., 2006). To advance the solution in time, a second-order implicit backward method was used. The spatial discretization makes use of a second-order accurate Gauss linear scheme for the gradient terms and a first-order Gauss upwind scheme for the divergence terms. The rotation of the blades is accounted for by using sliding mesh interfaces between the three blade grids, the rotor disk and the farfield grid.
2.2 Case setup
This work focuses on the blade flexibility; therefore the complexity of the setup is reduced. The inflow is uniform and perpendicular to the rotor plane. The rotor is neither coned nor tilted, which leads to symmetric inflow conditions. The tower and nacelle are not modeled either, and the blades are extruded at the blade roots towards the center of rotation to compose a closed hub region of the three cylindrical structures. Rotor operation is set towards rated conditions. All settings are listed in Table 1.
Table 1Overview of the main rotor characteristics of the NREL 5 MW reference turbine and the investigated conditions.
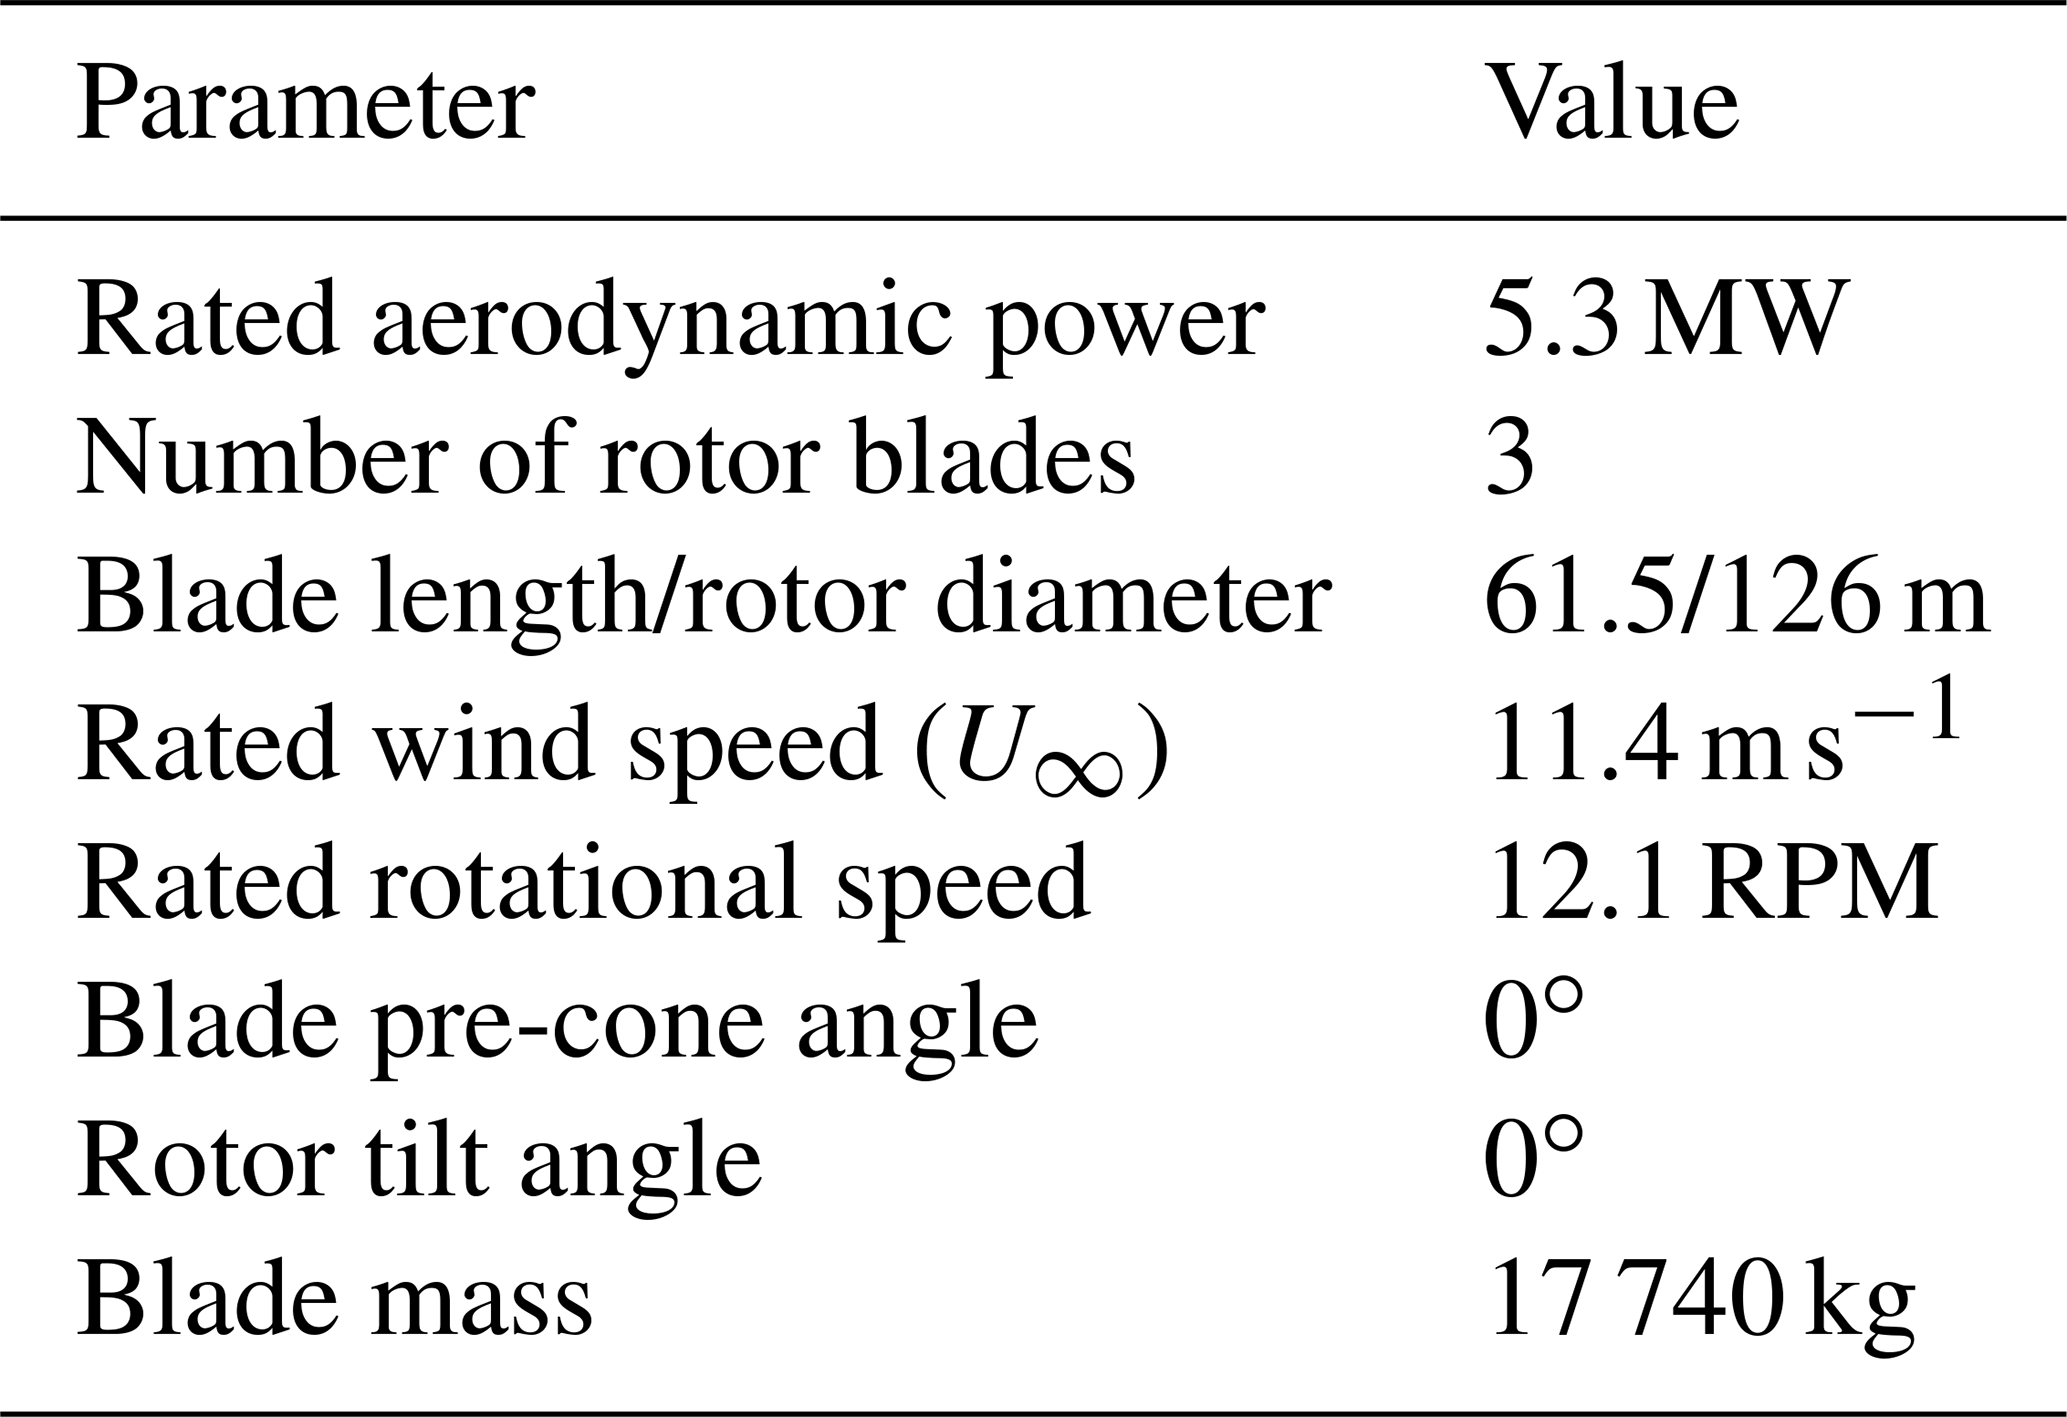
Table 2Overview of the initial and boundary conditions for the inlet, outlet and internal field of all simulated cases.
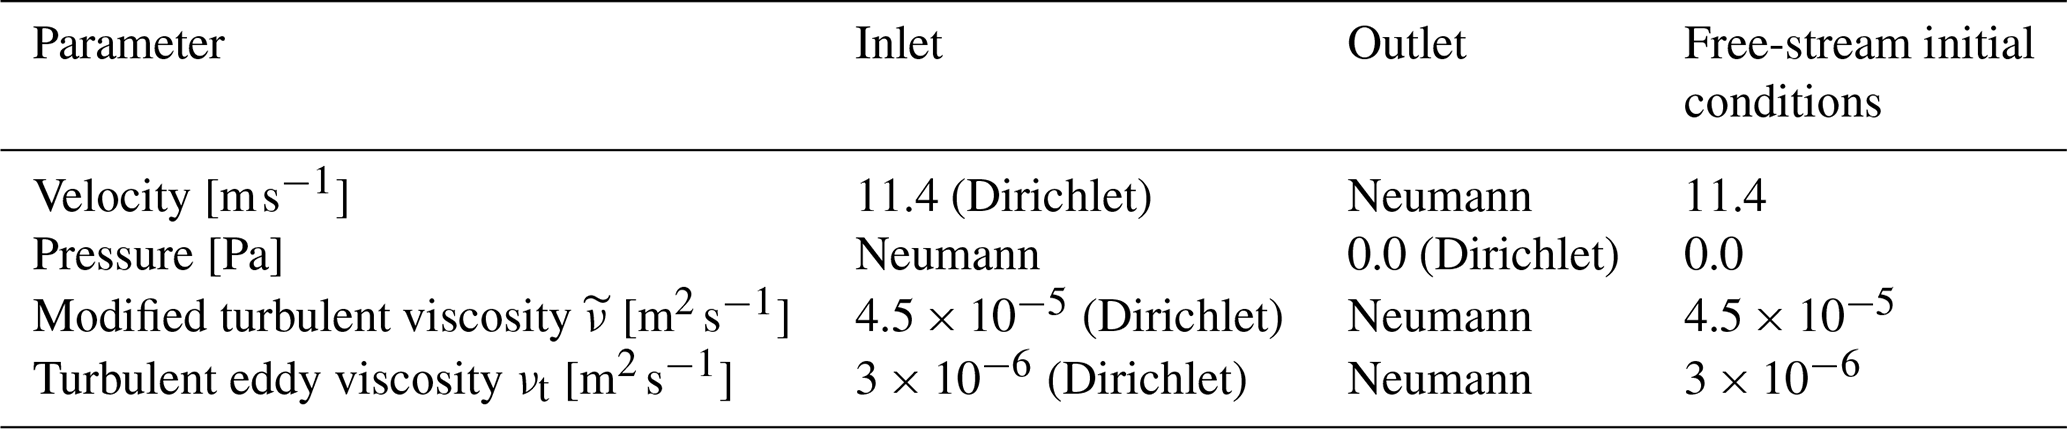
The boundary conditions of the rectangular domain are shown in Table 2. All sides are modeled as slip walls. The values of the turbulent quantities are set for laminar flow at the inlet. Fully turbulent conditions are assumed in the boundary layer on the blade surface.
In order to investigate the influence of flexibility of the blades on the aerodynamic behavior and near-wake effects, three simulations are performed: one with rigid blades (called rigid case in the following), one with flexible blades (called flexible case), and one with flexible blades excluding gravity effects (flexible-noG case).
2.3 Numerical grid
The numerical grid for all simulations is based on the numerical grid used by Dose (2018). They showed that a reasonable convergence for investigating aerodynamic effects taking into account fluid-structure interactions was reached for a mesh consisting of 36.38 million cells. This mesh was called the medium-sized mesh and is composed of five mesh parts, namely three blade meshes, a farfield and a rotor mesh.
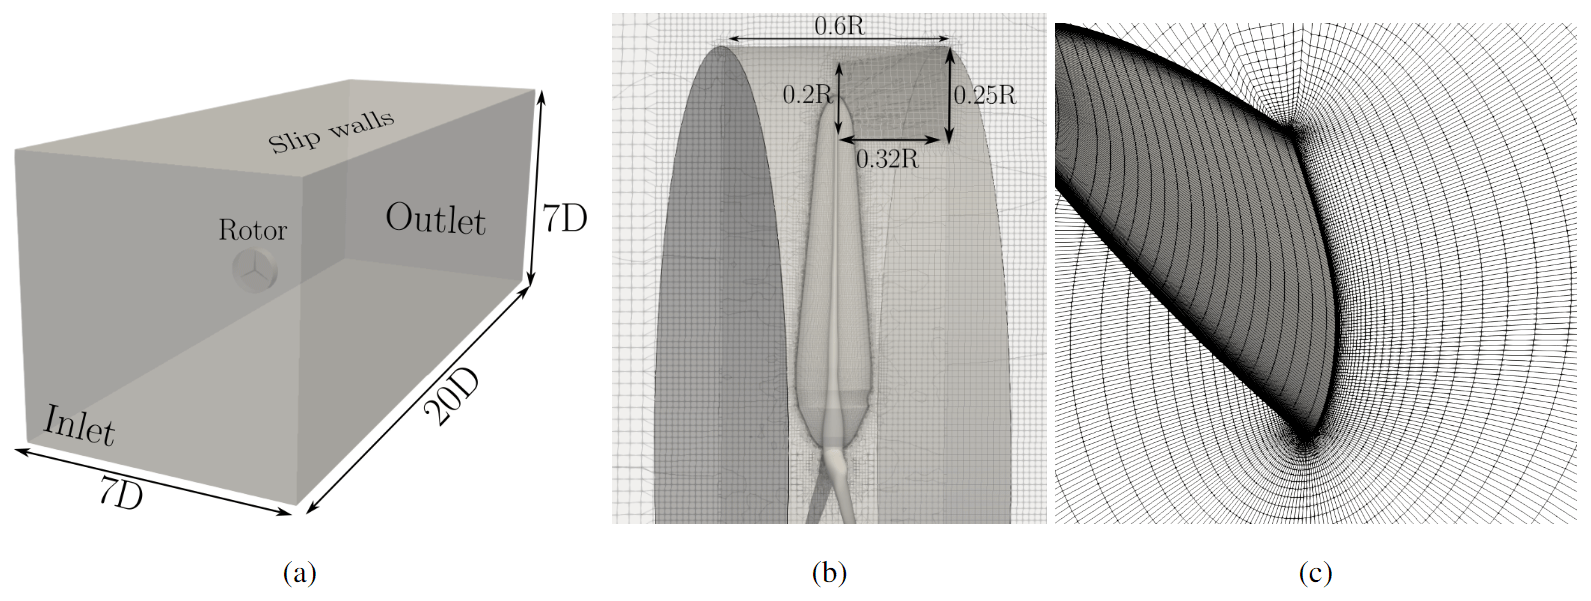
Figure 1Mesh specifications: (a) the overall domain size and shape, (b) blade tip ring refinement zone and size, and (c) mesh resolution in the boundary layer at .
The blade meshes were created using the BladeBlockMesher utility (Rahimi et al., 2016a), which composes 2D sectional meshes into a 3D structured blade volume mesh, consisting only of hexahedral cells. The blade meshes are generated with a resolution of 260 cells in spanwise direction. The chordwise component contains 300 cells, and 40 cells are distributed in blade normal direction. The cells normal to the surface follows a ratio of 1.2, and in order to limit the computational costs and to circumvent high aspect ratio cells inside the boundary layer, an adaptive wall function is applied (Fig. 1c). This wall function is capable of blending automatically between a high-Re and a low-Re approach, depending on the local y+ value. For the majority of the cells inside the first layer, a y+ value between 30 and 70 is applied. Here, the wall function ensures a consistent turbulent viscosity profile for all simulated walls. In situations with low velocities close to the blades and smaller y+ values, the wall function is switched off automatically to increase accuracy for, for example, flow separation.
(Dose et al., 2018)Table 3Number of cells in different mesh regions, comparing the baseline medium mesh of the former study described in Dose et al. (2018) with the tip-refined mesh used within this work.
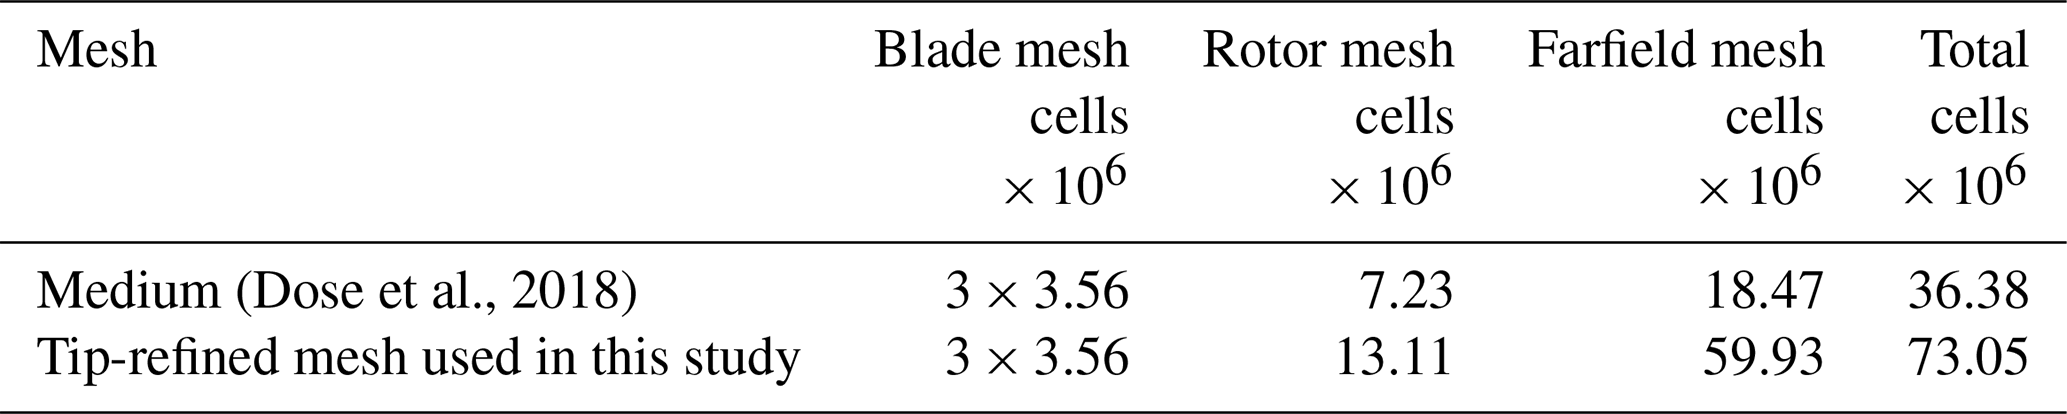
The domain measures 5 rotor diameters (D) upstream and 15 D downstream of the rotor plane. All sides are located 3.5 D from the rotational center (Fig. 1a). The overall domain setup was kept, but as this study highlights the behavior of the tip vortex trajectory, additional mesh refinement was introduced in the wake of the blade tips to ensure a proper resolution of the flow in that region. This refinement is accounted for using a ring-shaped zone downstream of the blade tips, as shown in Fig. 1b. As shown in the literature (van Kuik et al., 2014; Micallef et al., 2016; Herráez et al., 2017; Micallef et al., 2020), the trajectory of the tip vortex is expected to have a characteristic inboard motion on the order of 1 %–2 % of blade length. This movement needs to be captured properly. With the level of refinement used in this study, we ensure a minimum of seven cells within this scale. The highest resolution is located around the blade tip, where the vortex and blade surface are closest. Since the trajectory of the tip vortex is part of both the rotor mesh and the farfield mesh, both grid regions are equipped with an increased number of cells, leading to a total grid size of 73.05 million cells. This already doubles the numerical costs of the medium case mesh. The total number of cells and their distribution after the refinements is shown in Table 3. In contrast to Dose et al. (2018), the setup used here allows very detailed vortex core tracking in the vicinity of the blade tip. An even higher cell refinement would exceed 100 million cells and would not be manageable by the used infrastructure.
2.4 Mesh deformation algorithm
To account for blade deformations inside the CFD domain, a mesh update algorithm developed by Dose (2018) was used. This method aims at providing a cost-efficient and robust algorithm specifically developed for wind turbine simulations in OpenFOAM. Here, new mesh point coordinates are calculated in each time step without the need to solve a set of equations, where the deformation calculation costs are similar to those of a rigid mesh rotation. Within this method, all mesh volume cells surrounding the blade, as well as the blade surface cells, are projected onto the moving blade beam using a Newton algorithm. Each cell is assigned to a specific beam element to account for the respective blade deformation magnitude. All mesh cells are assigned into one of three mesh regions that are differently affected by the blade deformation. The closest region surrounding the blade surface moves rigidly with the blade, making sure no boundary layer cells are deformed during the process. Between the rigidly moved mesh region and the outer fixed zone, a polynomial of selectable order smooths out the blade mesh motion. Within this study, a first-order polynomial is used. All cells outside of this transition region are not affected by any deformation.
2.5 Aerodynamic data extraction
The wake induction is extracted from the CFD simulation using the in-house “3-point” method first introduced by Rahimi et al. (2016c). This method gives the opportunity to account for unsteady blade deformations and non-symmetric inflows for all azimuthal positions. Other aerodynamic quantities, i.e., angle of attack (AoA), lift and drag coefficients, on the rotor blades are derived from the obtained induction factors and the calculated pressure distribution, as well as the viscous forces. This method uses six points, three points on the pressure and three points on the suction side, which are distributed parallel to the chord of each analyzed blade section. The distance of the points towards the local chord is kept constant, to account for blade deformation during the simulation. These points are used to interpolate a representative AoA and local induced velocity while excluding effects of bound circulation as well as reducing the up- and downwash of the blade. This method gives the possibility to account for dynamic effects like yaw misalignment, different azimuth positions and deforming blades also close to the blade root and tip, which is considered important for the investigation of blade tip vortex trajectories. Since the aerodynamic quantities are based on probing locations inside the fluid domain, the results are influenced by vortices trailing from the blade surface. Therefore, the resulting quantities at the tip are to be considered a qualitative estimate to assess the aerodynamic behavior for a relative comparison between different blade setups.
2.6 Simulations framework
Simulations are performed on the EDDY high-performance computing cluster of the University of Oldenburg (HPC, 2022). A total of 480 computing cores are used in each simulation run, computing a total of 220 s, i.e., 44 full rotor rotations. One simulation run took about 25 d, with less than 1 % more computational effort for the flexible case setup in comparison to the rigid calculation. Simulation results were extracted from the last full rotor rotation if not stated differently.
In the following, the three simulation cases, i.e., rigid, flexible and flexible-noG, are investigated in more detail, highlighting their respective impact on the aerodynamic rotor blade behavior, and they connect these findings with the characteristics of the flow in the wake of the rotor. The effect of flexibility and gravitation on the aerodynamic performance at the rotor blades is studied in Sect. 3.1. The resulting effects on the near wake, i.e., velocity induction and tip vortex trajectory, are shown in Sects. 3.2 and 3.3.
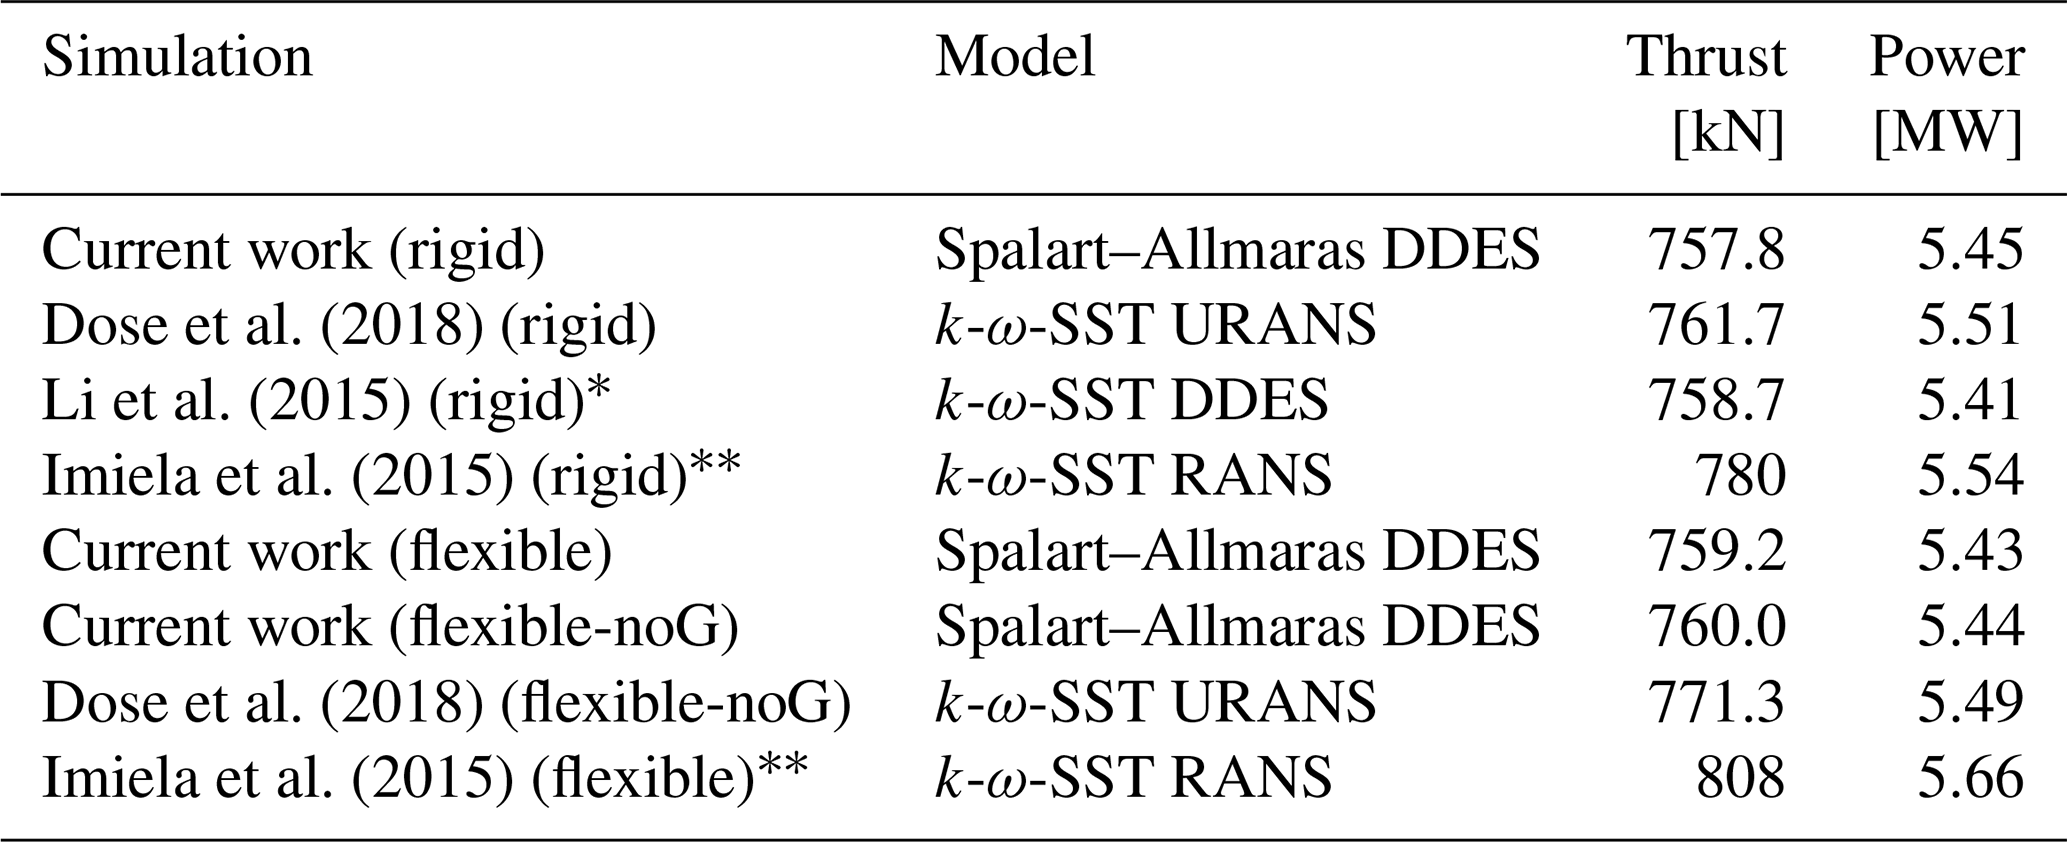
Dose et al. (2018)Li et al. (2015)Imiela et al. (2015)Dose et al. (2018)Imiela et al. (2015)Table 4Rotationally averaged thrust and power results for rigid and flexible setups (∗ simulation contains precone, tilt and tower; simulations contain pre-cone).
3.1 Aerodynamic behavior
Firstly, the overall global thrust T and power P quantities are computed by 〈T(Θ)〉rtn and 〈P(Θ)〉rtn, where Θ describes the azimuth angle and 〈〉rtn denotes the average over the last rotor revolution , which corresponds to a time span of Δt=4.959 s; 0∘ and 360∘ define a blade pointing in upwards direction. The averaged quantities for the three simulation cases are in good agreement with the literature. Table 4 shows a comparison to various sources for rigid and flexible simulations of the NREL5 MW rotor, taking into account slightly different configurations with respect to rotor tilt, pre-cone or tower inclusion. In the current investigation, the total thrust shows slightly higher loads when including blade flexibility compared to the rigid case, while the total aerodynamic power slightly decreases. This is also confirmed in the study by Dose et al. (2018), which uses a similar setup.
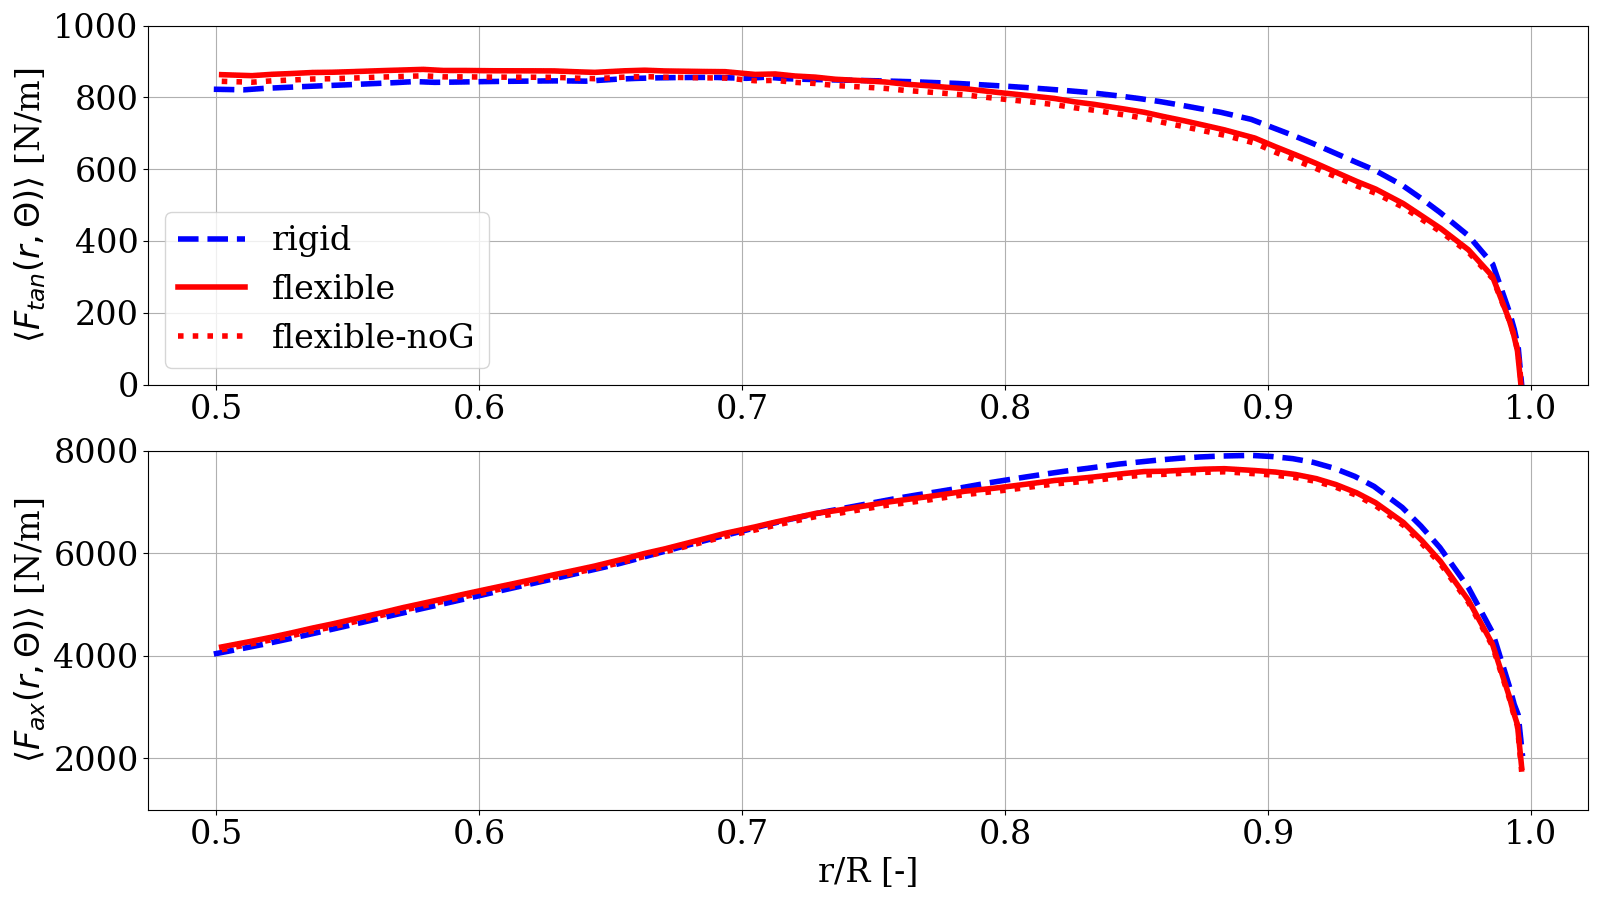
Figure 2Rotationally averaged tangential and axial force distributions 〈Ftan(r,Θ)〉rtn and 〈Fax(r,Θ)〉rtn for rigid and flexible blades over the outer half of blade span related to normalized radial locations. R is the rotor radius, and r defines the radial position on the blade.
In the next step, the rotationally averaged force distributions of axial and tangential forces are investigated, i.e., 〈Fax(r,Θ)〉rtn and 〈Ftan(r,Θ)〉rtn. Under flexible conditions and a uniform wind coming from the front, the blades tend to bend towards lower aerodynamic forces in the outboard region of the rotor, where the largest deformations are apparent. This holds for spanwise positions outboard of ≈ 47 m (≈ 75 % relative span) as shown in Fig. 2, where the rotationally averaged tangential force in the upper graph and the rotationally averaged axial force in the lower graph are smaller for flexible blades, respectively. This is important, since most of the torque, and therefore power of wind turbines, is extracted from the wind in the outer third of the rotor blades due to the corresponding lever arms and the larger swept area. It is also shown that neglecting the gravitational loads barely influences the mean aerodynamic loads, as the corresponding tangential and axial forces are only slightly lower than the loads of the flexible blades including gravity. For spanwise positions between 50 % and 75 % radius, the blade forces including flexibility are slightly larger than for the rigid case, which aligns with the study by Dose et al. (2018). This is due to the fact that the deformation of the blade leads to slightly higher AoAs for the flexible cases throughout the whole span. In the blade region outboard of 75 % the forces are lower for the flexible cases. This can be explained by two counter acting phenomena. On the one hand the higher angle of attack leads to higher loads on the blade. On the other hand, the large flapwise deformation leads to a reduction of the rotor radius and thus in lower a circumferential speed and a change in inflow angle closer to the tip. The contribution of the angle of attack on the loads can be considered approximately linear, whereas the influence of the speed on the blade forces is quadratic and therefore prevails. The resulting forces outboard of 75 % span are therefore smaller for the flexible blades, although a larger AoA is present. Nevertheless, the radial part between 50 % and 75 % of the blade contributes less to the overall power output than the outer part, due to the smaller lever arm. Also a smaller total force difference between the rigid and flexible case than in the most outboard 25 % of blade span makes this region less attractive for this study, which aims at highlighting the differences between these setups. The blade region inboard of 50 % blade span is not shown since the total deformation in all investigated regions is much smaller and the resulting differences in the force distributions are negligible.
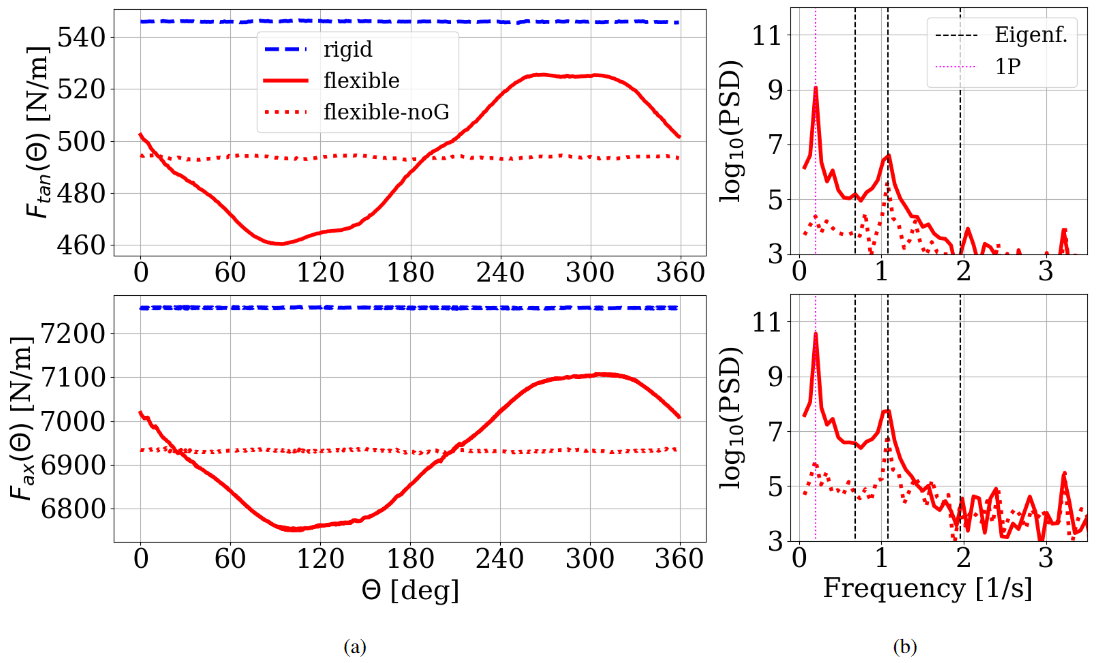
Figure 3(a) Time series of tangential force (Ftan(Θ)) and axial force (Fax(Θ)) for the three cases of rigid and flexible blades over one rotation at 95 % span (i.e., at ), where the flexible blade forces are shown including gravity (solid red line) and without gravity (dotted red line). The rigid blade forces are shown as a dashed blue line. (b) Frequencies of the flexible and flexible-noG forces at 95 % span. Eigenfrequencies are marked as dashed black vertical lines. The 1P frequency is shown as vertical dotted magenta lines.
It is important to note that even though the curves of flexible and flexible-noG in Fig. 2 lie almost on top of each other, a detailed look into the distribution resolved over one rotation shows clear differences. For that purpose, the force development of the 0.95 location from Fig. 2 is plotted against the respective azimuth angle in Fig. 3. As visible in Fig. 3a, the time series of the sectional forces at a spanwise position of 95 % span shows almost constant forces for the rigid blade and the flexible-noG case. While both flexible setups, consistent with the averaged forces of Fig. 2, show lower force values than the rigid case, a sinusoidal behavior within one rotation is clearly dominating the force development of the flexible blade including gravity. The reduction of forces due to blade deformation aligns with the findings of Yu and Kwon (2014). The lowest loads are given at an azimuth angle of around 90∘, while the maximal loads occur around 270∘ azimuth. A frequency analysis of the forces acting on the flexible blades (with gravity, i.e., flexible case, and without gravity, i.e., flexible-noG case) is shown in Fig. 3b. The dominant frequency in the flexible case corresponds to the rotationally periodic 1P frequency (vertical dotted magenta line), which does not exist in the flexible-noG case. However, both cases show a clear impact of the second lowest eigenfrequency, which corresponds to the first edgewise mode (second vertical dashed black line). The larger impact of the edgewise component of blade vibrations, in contrast to the flapwise mode, is based on the fact that for attached flows, the aerodynamic damping in flapwise direction is significantly larger than in edgewise direction (Hansen, 2007) and is therefore also more pronounced in the force frequencies. In Fig. 3b the 1P frequency and the other eigenfrequencies (Eigenf.) are clearly distinguishable.
While this frequency only has the second highest power spectral density in the flexible blade case, it dominates the force time series in the flexible-noG simulation. This clearly shows that the external 1P excitation only arises from the gravitation and therefore is not present in the flexible-noG results.
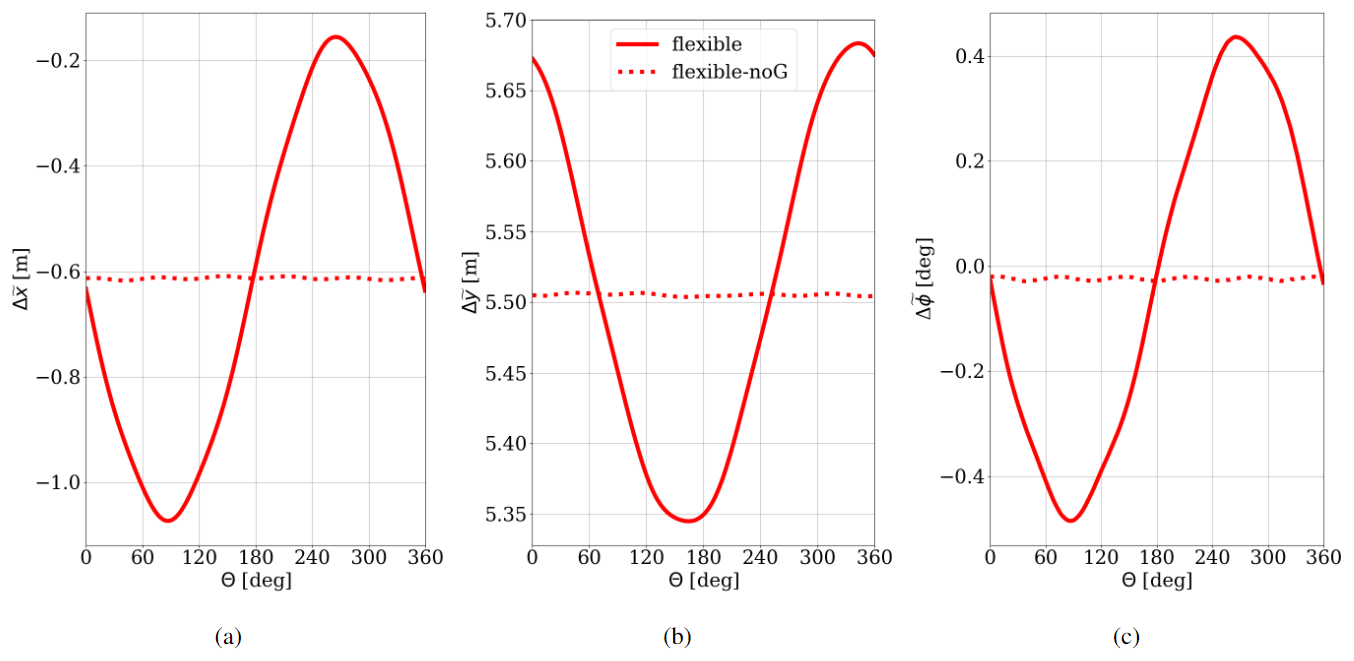
Figure 4(a) Edgewise (), (b) flapwise () and (c) torsional () blade tip deformation over one rotation for the flexible and flexible-noG case at .
In Fig. 4, the blade tip deformation is shown, which also corresponds to the maximal deformation in edgewise, flapwise and torsional direction of the whole blade. Although being slightly further outboard than the section at 95 % span from Fig. 3, it describes an equivalent blade deformation behavior.
The dominating dynamic sinusoidal edgewise deflection component in Fig. 4a can be directly linked to the 1P gravitational load in Fig. 3, since the lever arm of gravitation for a blade in horizontal positions at 90 and 270∘ azimuth is the largest. The main cause of the reduction of power of the flexible blades in comparison to the rigid can on the one hand be traced back to the flapwise deflection (Fig. 4b), which results in a smaller area swept by the turbine blades and therefore less energy that is extracted from the wind. On the other hand, the torsional degree of freedom impacts the loading, since a lower angle of attack is directly linked to a reduction of the local lift and drag components in the “linear region” and therefore impacts the lift-to-drag ratio (Rajakumar and Ravindran, 2010). As shown in Fig. 4c, the torsional component is in phase with the edgewise deformation and has its largest influence at 90 and 270∘ azimuth.
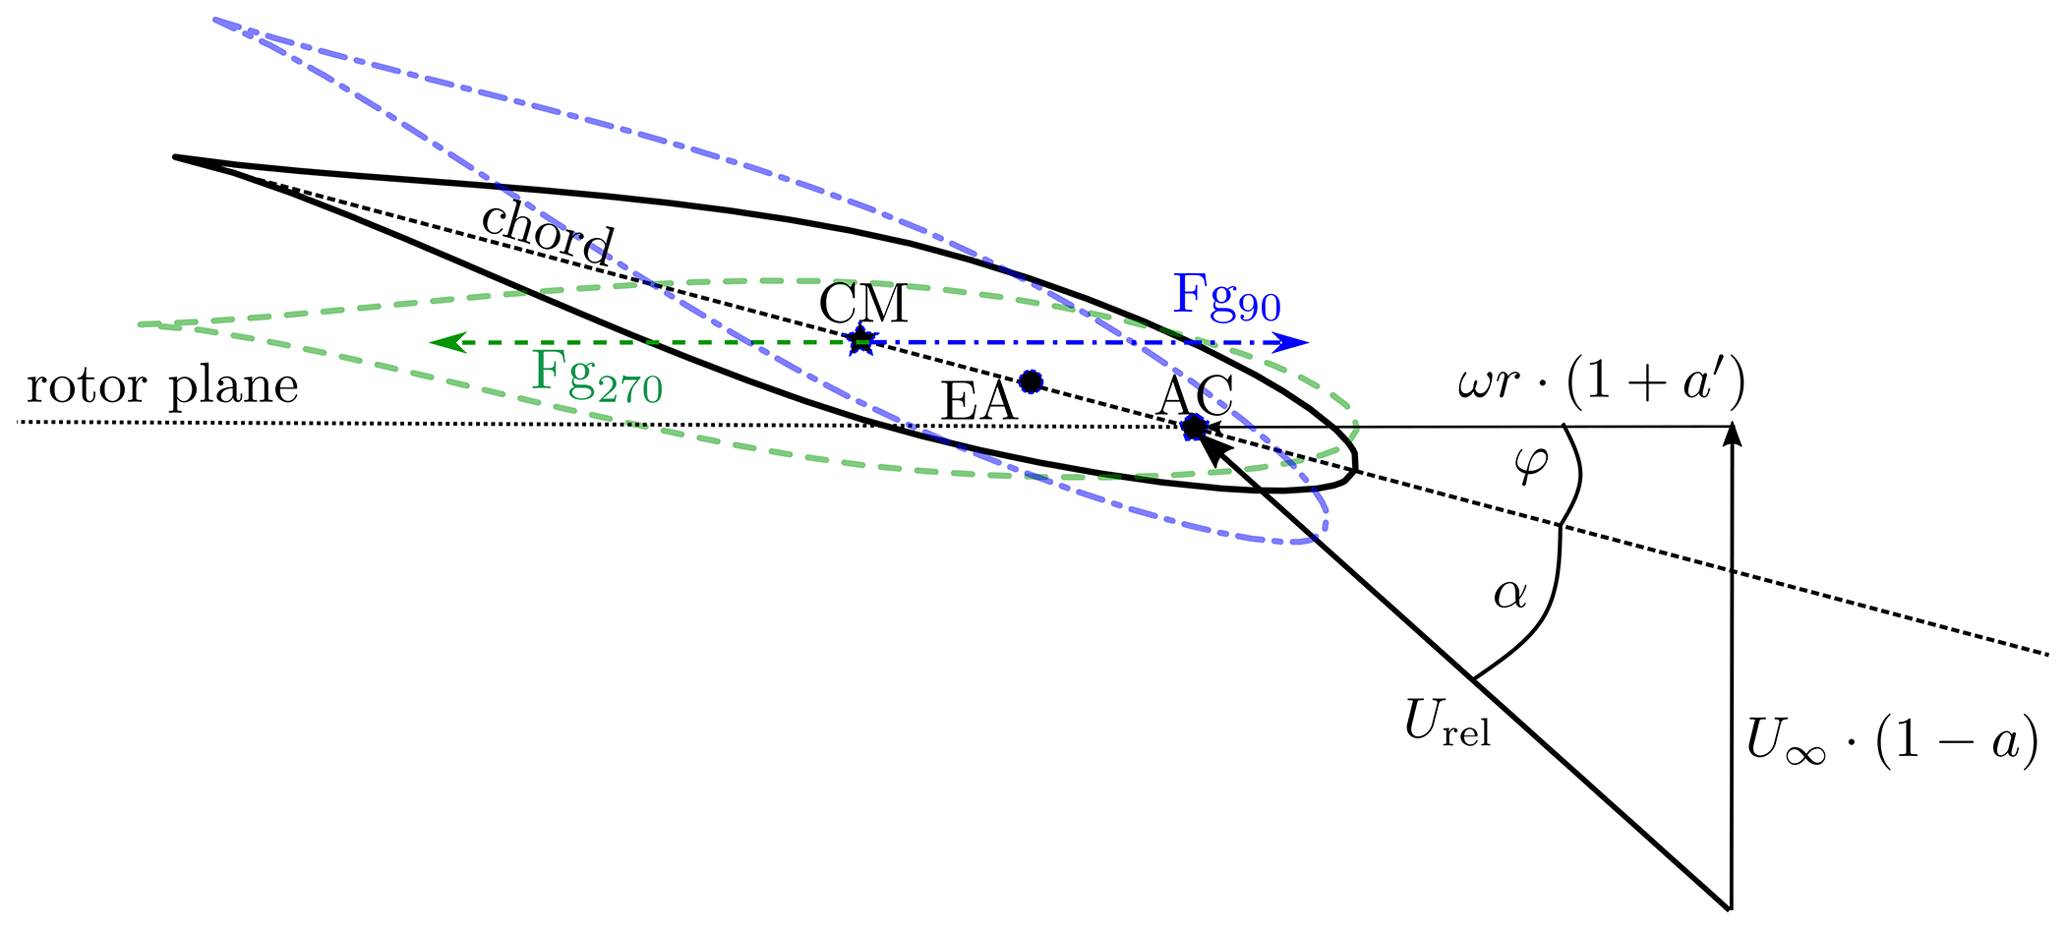
Figure 5Simplified representation of the gravity force acting on a turbine blade section at radial position r. Solid black airfoil: undeformed blade twist condition of rigid blade, dashed–dotted blue airfoil: nose down deformation for azimuth angles of , dashed green airfoil: nose up deformation for azimuth angles of . Fg90 (in blue) and Fg270 (in green) show the direction of gravitation for the respective azimuth angles. The local twist angle and AoA are given by φ and α, respectively. The relative velocity Urel results from the velocity components in the axial direction () and rotational velocity , where a and a′ define the induction factors in axial and tangential directions. U∞ defines the undisturbed freestream velocity and ω the angular velocity. Center of mass (CM), elastic axis (EA) and aerodynamic center (AC) are all located on the chord line.
This shows that a wind turbine rotor operating at rated conditions in a uniform inflow faces its largest influence of a dynamic excitation of structural deformation due to gravitational loads. Here, between 0 and 180∘ azimuth, the blade bends forward towards the leading edge, and during the upward rotation between 180∘ and 360∘ azimuth, it bends backwards in the direction of the trailing edge. Due to the structural nature of this blade, the center of mass (CM) is located downstream of the elastic axis (EA) on the chord line. This holds true for all sections along the blade, exemplarily shown in Fig. 5. In combination with the local twist angles, the gravity force leads to a torsion of the blade. Thus, for a downward-moving blade, the angle of attack is reduced with increasing twist angle, while the AoA is increased for an upward-moving blade, where the twist angle is reduced. This can be explained using the simplified velocity triangle, where the inflow speed and the circumferential speed form the relative velocity Urel. Here, a reflects the local axial induction and a′ the local tangential induction factors. The constant ω gives the rotational speed.
The dynamic torsion of the blade (Fig. 4c) clearly shows the deformation due to the gravitation, forming a sinusoidal shape with a maximal deformation amplitude of . Additionally, higher-frequency components can be found in the time series and superimpose the sinusoidal torsion behavior with oscillations due to the eigenfrequencies of the blade with a much smaller magnitude. Although barely visible in the three investigated deformation components (Fig. 4), it can be observed in the resulting forces acting on the blade especially in the frequency domain (Fig. 3b). In contrast, the flexible-noG case displays nearly constant aerodynamic forces and deformation due to the fact that the gravitational induced loads are completely missing (Fig. 4).
In the subsequent analysis of blade flexibility on different aerodynamic quantities, the focus lies therefore on the comparison of the rigid blades with the flexible blades including gravitational loads.
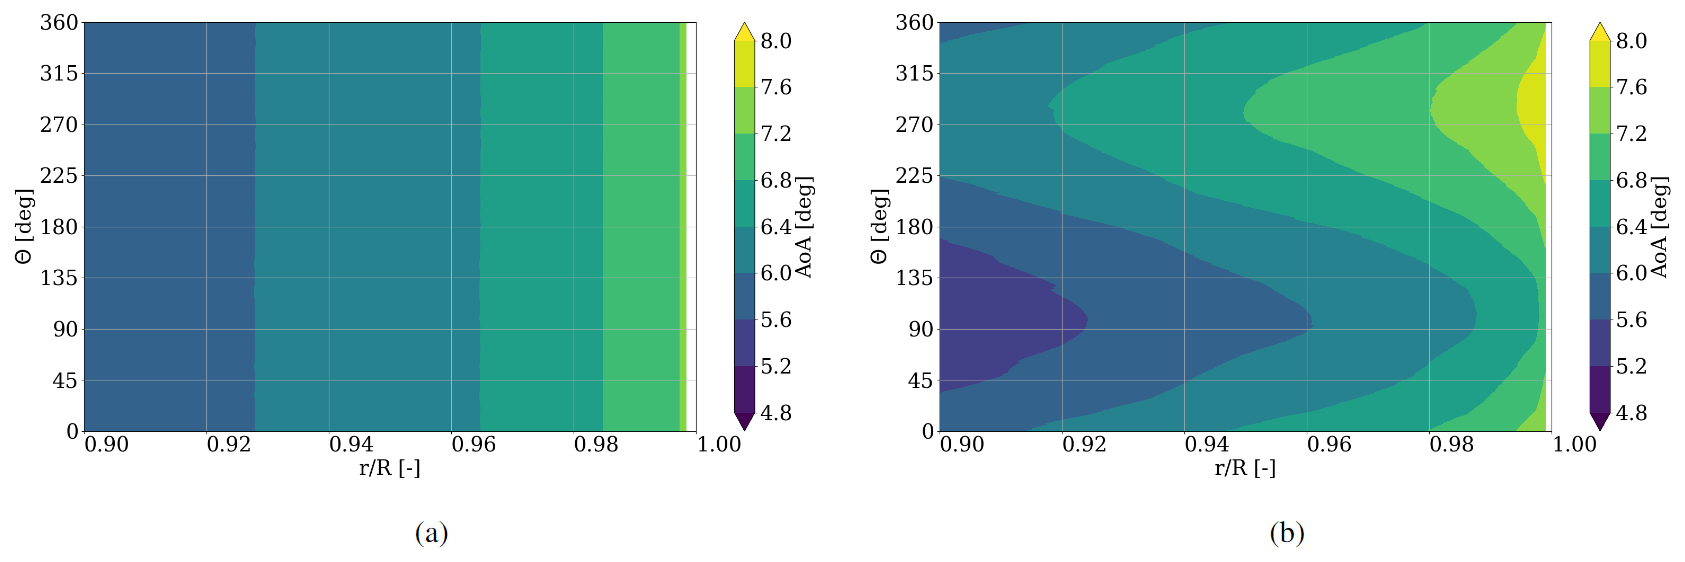
Figure 6Angle of attack distribution for during one rotation for (a) rigid and (b) flexible blades.
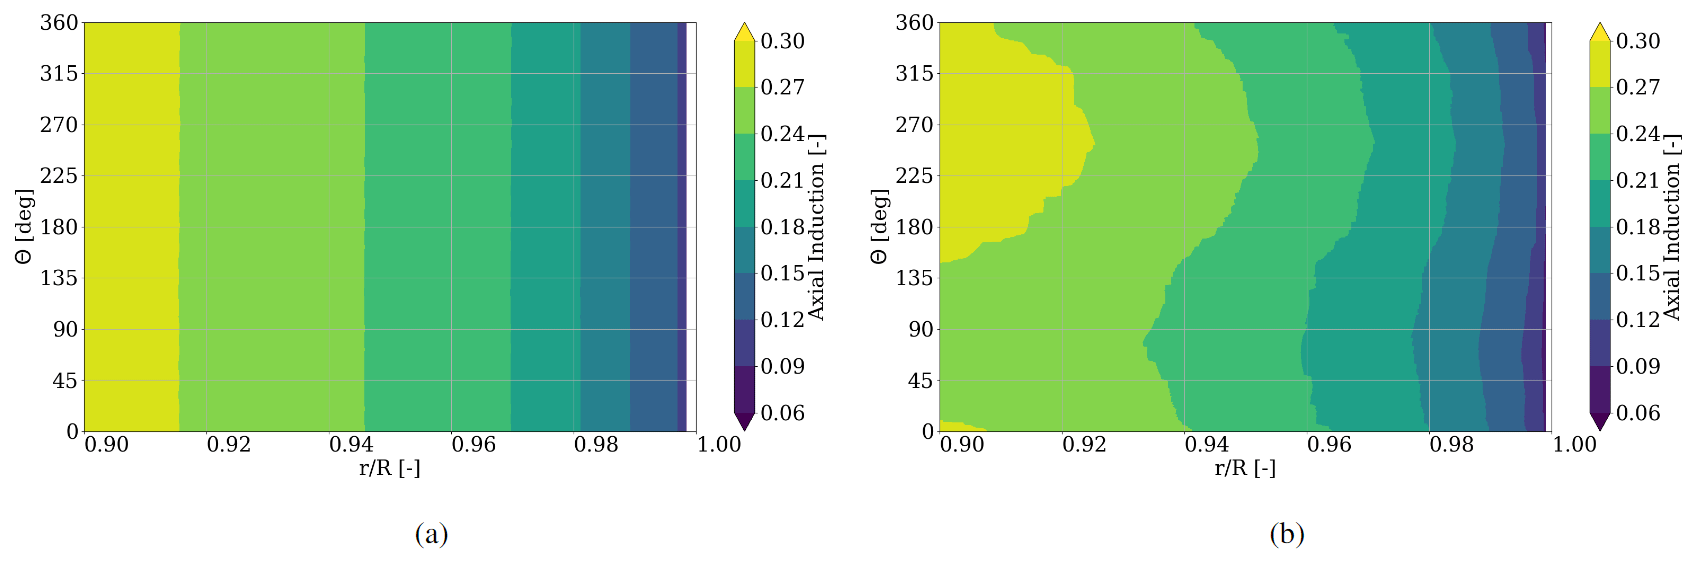
Figure 7Axial induction factor distribution for during one rotation for (a) rigid and (b) flexible blades.
3.1.1 Angle of attack
As stated above, the inflow is constant and homogeneous for all cases, so the effect of the blade flexibility can be best assessed by focusing on the comparison between the rigid blades and the blades subjected to the periodic gravity-induced blade deformation. The flexible-noG simulations, in which no significant deformations occur (Fig. 4), are therefore omitted from the analysis. Therefore, in the following all investigations refer to the rigid and flexible cases. A comparison of the local AoA for the most outboard 10 % of the blade simulations (corresponding to ) is shown in Fig. 6, where the respective azimuthal position is plotted against the radial location on the blade, showing rigid results in Fig. 6a and flexible results in Fig. 6b. The investigated AoA magnitude is accounted for with color bins of 0.4∘.
For the rigid blade case, the AoA becomes larger with increasing radius but stays constant for each section independently of the azimuth angle. The radial increasing effect is also visible for the flexible blade, but in contrast to the rigid case, it deviates over the azimuth angle, showing the expected sinusoidal shape. The smallest AoA for the flexible blades is observed at 90∘ azimuth, whilst for 270∘ azimuth its maximum is present. This phenomenon can directly be linked to the torsional deformation, as shown in Fig. 4c, where the gravitation twists the blade towards lower AoA during a downwards movement of the blade and towards higher AoAs when moving upwards again.
3.1.2 Axial induction
Similar trends are visible in the representation of the axial induction (Fig. 7), where each color bin represents an axial induction portion of 0.03. A general reduction of the axial induction towards the tip is visible for rigid and flexible blades. At the most outboard position it vanishes due to the ever shrinking surface and the blade boundary layers merging between pressure and suction side of the blade.
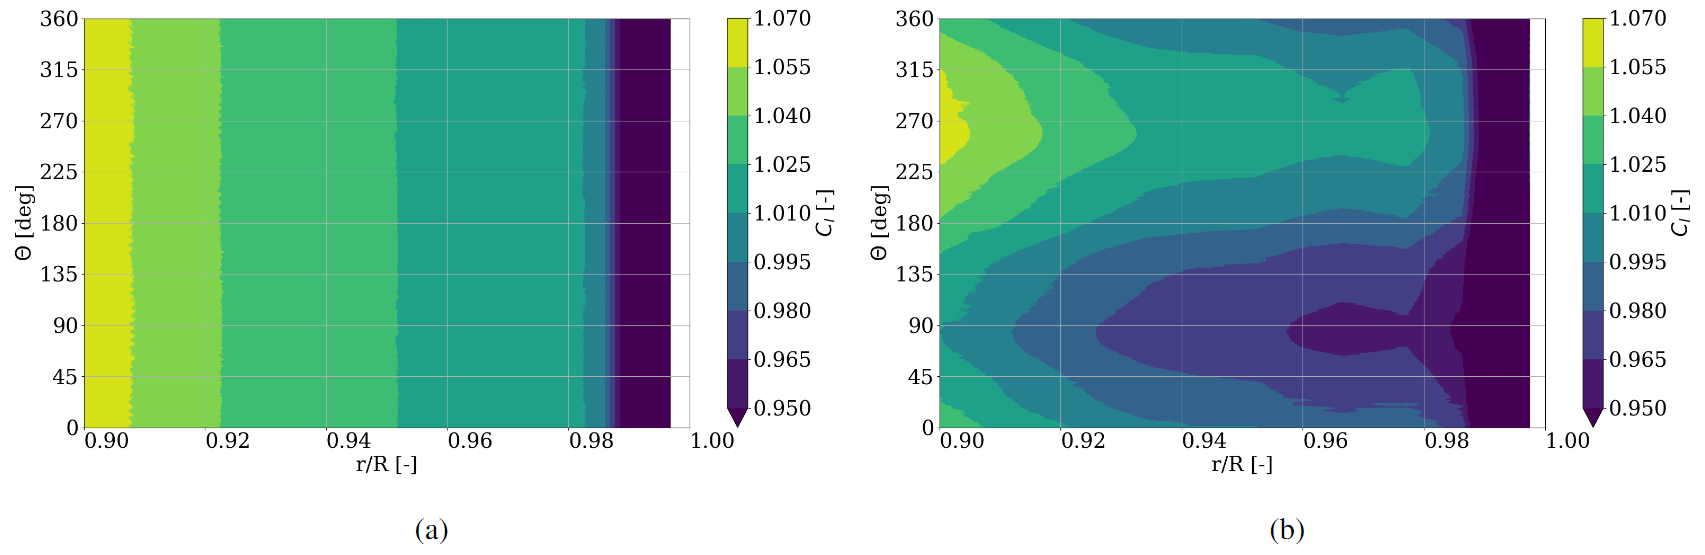
Figure 8Lift coefficient (Cl) distribution for during one rotation for (a) rigid and (b) flexible blades.
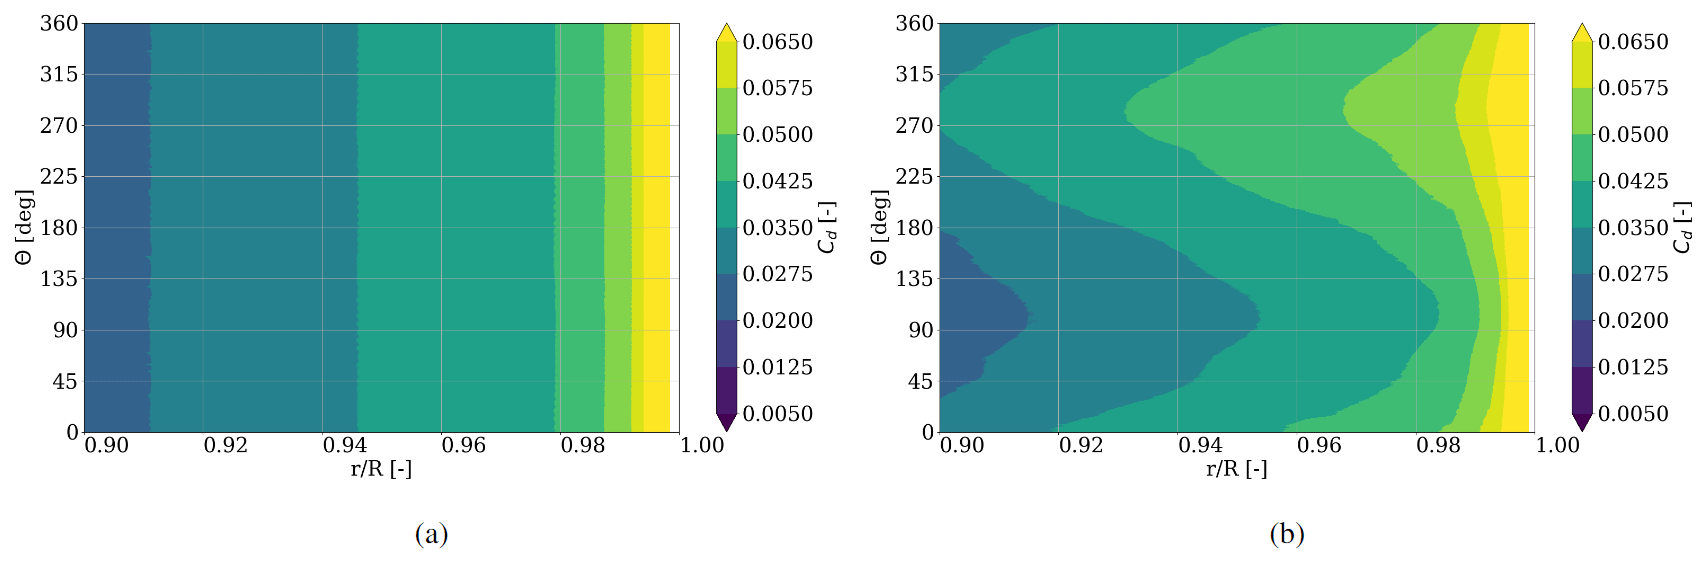
Figure 9Drag coefficient (Cd) distribution for during one rotation for (a) rigid and (b) flexible blades.
Since the axial induction factor describes the amount of velocity reduction of the freestream normal to the rotor plane, it gives an estimate of the amount of energy taken from the fluid. From Fig. 7, it is therefore expected that more energy is extracted with the flexible blade pointing towards 270∘ than at 90∘ azimuth. This matches the findings in Fig. 3, where the maximal axial and tangential force is occurring at ≈ 270∘ and the minimal force is to be found at ≈ 90∘ azimuth, respectively.
3.1.3 Lift, drag and lift-to-drag ratio
Next to the forces described in Sect. 3.1, the lift, drag and lift-to-drag ratio coefficients play an important role, since they represent the loading on the blades and allow for an estimate of whether the blade operates under optimal conditions. Since modern wind turbines are lift driven, a maximal energy extraction from the wind is present, when the lift-to-drag ratio reaches its maximum, which corresponds to the maximal ratio of lift over drag. Lift and drag are also direct inputs to engineering models like the blade element momentum theory, so that a deep understanding of those quantities is vital for the improvement of such design tools (Schepers et al., 2018).
The coefficients for lift and drag are calculated from the simulation results using the local pressure distribution at various sections along the blade, leading to a force vector that is split into lift and drag directions using the angle of attack calculated from the “3-point” method in Sect. 3.1.1. Figure 8 shows the lift coefficient distribution of the rigid and flexible blade cases in bins of 0.015, with consistent reduction of lift towards the tip. The minimal lift at 90∘ and maximal lift at 270∘ azimuth for the flexible blades is as expected since the same behavior is shown in Fig. 3 for the absolute force values in tangential and normal direction.
The drag coefficient in Fig. 9, contrary to the corresponding lift values, increases with radial distance. Since under these operating conditions, the drag values in general are very small, drag bins of 0.0075 are shown. The distribution of minimal and maximal drag coefficient values coincides with the findings of lift and AoA. This is an expected behavior, since most airfoils operate in the so-called ”linear region” when exposed to incoming angles of attack between 4.8 and 8.0∘ (cf. Fig. 6), where the boundary layer is fully attached to the blade surface and the drag force is directly proportional to the angle of attack.
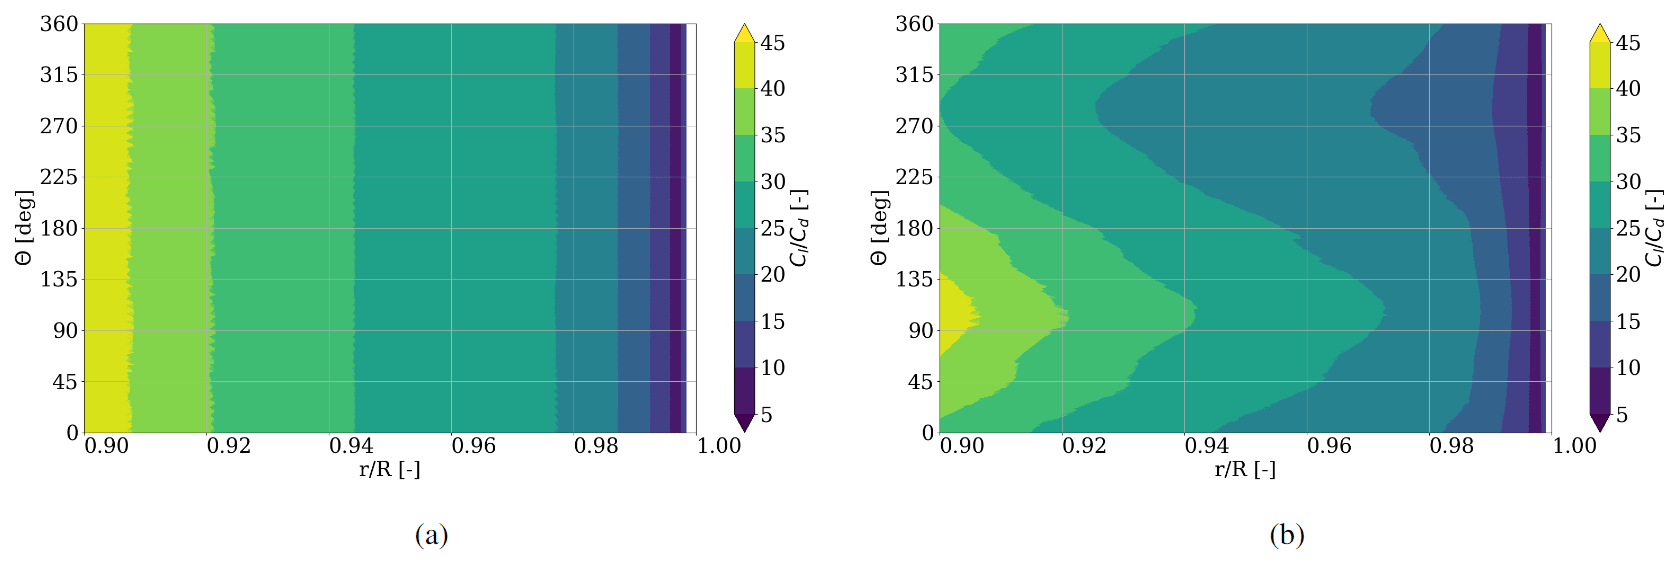
Figure 10Lift-to-drag ratio distribution for during one rotation for (a) rigid and (b) flexible blades.
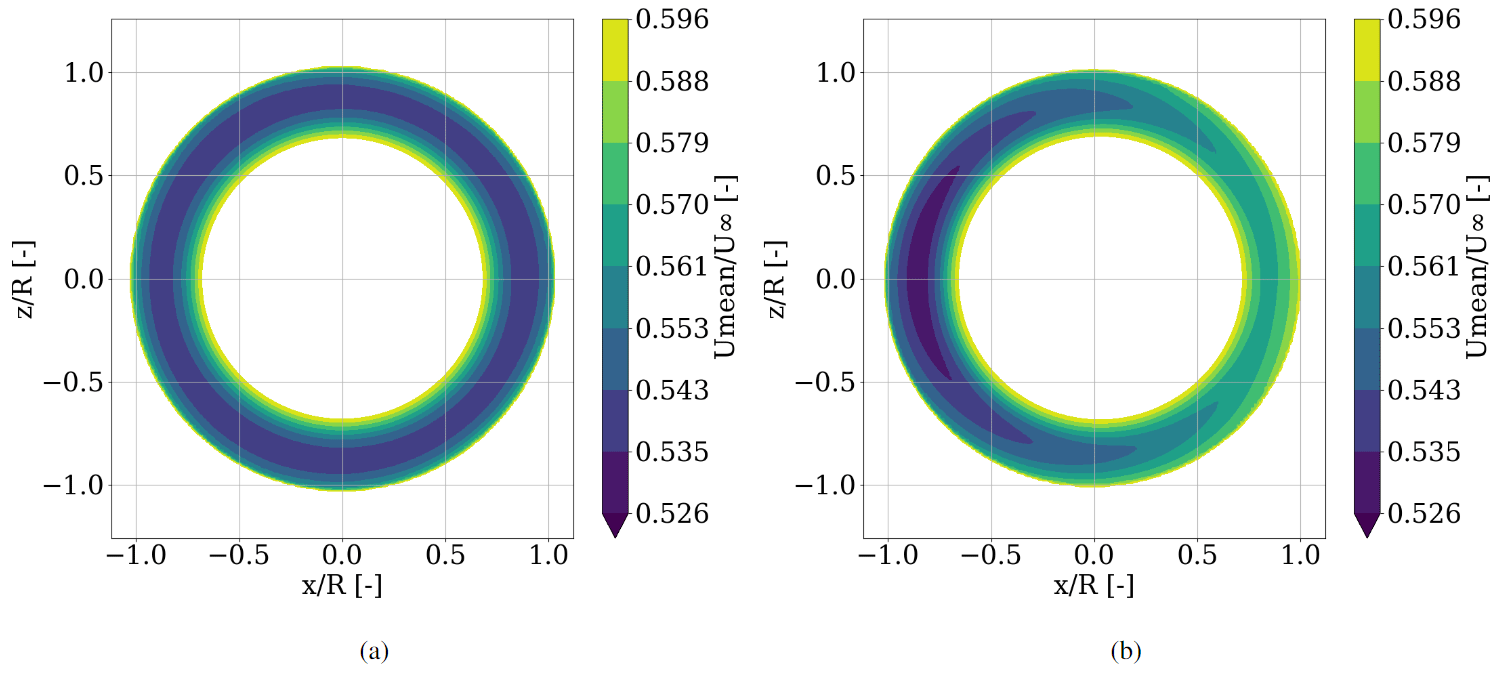
Figure 11Mean velocity magnitude slice in the x–z plane at D downstream of the turbine with incoming flow direction in y direction for (a) rigid and (b) flexible blades. Color coding bounded such that all values of are shown in white, while all values of are marked in dark blue.
Since in the investigated region the drag grows faster with increasing AoA compared to the lift, the lift-to-drag ratio of is not constant but shows sinusoidal behavior for the flexible blade over one rotation with a maximal lift-to-drag ratio for minimal drag at an azimuth of 90∘ (Fig. 10). From an aerodynamic standpoint, the blade airfoils in the investigated region therefore show better performance when the blade is moving downwards, than for an upward-moving blade.
Summarized, the aerodynamic investigation of the most outboard 10 % of the blade (i.e., ) reveals a major difference between rigid and flexible structures. The investigation of AoA, induction, and force coefficients shows a clear dependency of the flexible blades on the azimuth angle. Since the aerodynamic behavior in the rotor plane characterizes the interaction of blades with the surrounding air, differences in the induction due to flexibility are expected to be visible in the wake of the turbine, too. This is studied in the next section.
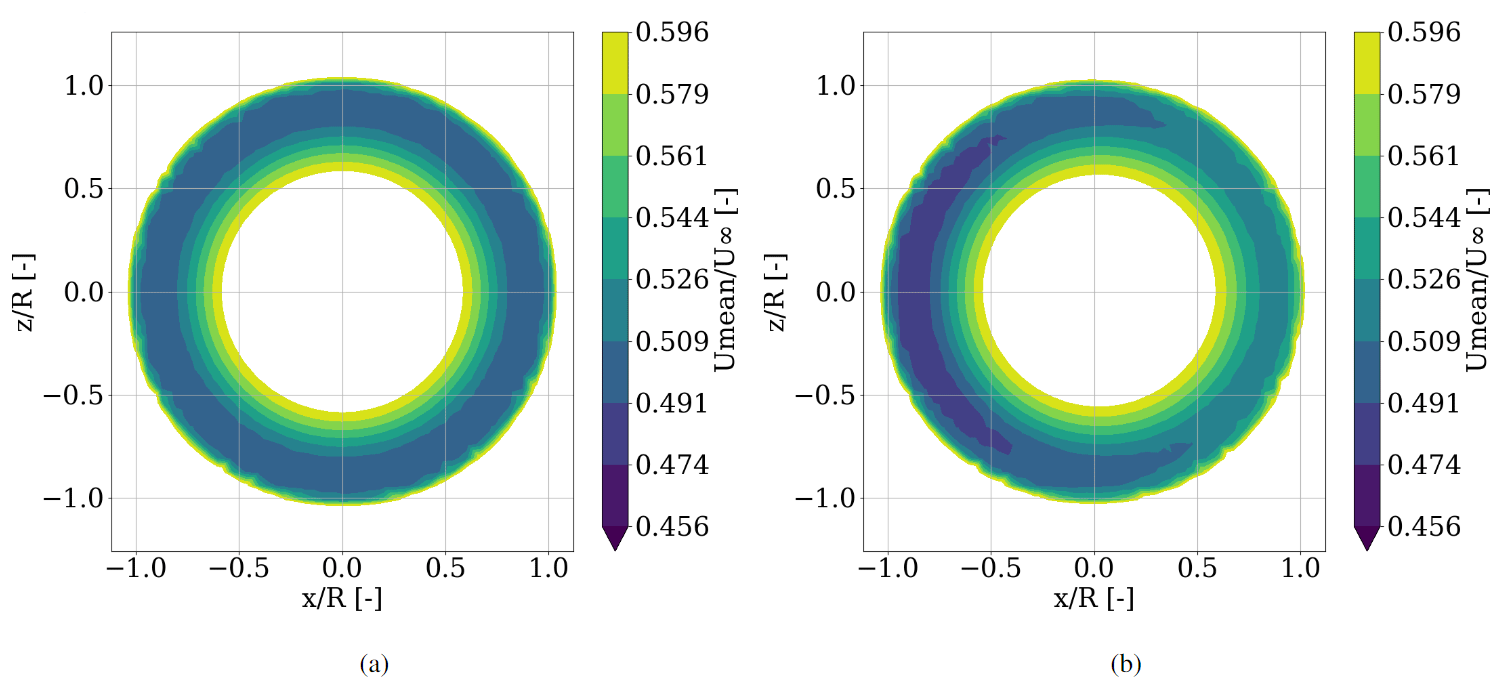
Figure 12Mean velocity magnitude slice in the x–z plane at D downstream of the turbine with incoming flow direction in y direction for (a) rigid and (b) flexible blades. Color coding bounded such that all values of are shown in white, while all values of are marked in dark blue.
3.2 Effects in the wake
To investigate the effect of a sinusoidal aerodynamic behavior within one rotation of the blade, a characterization of the whole wake cross section at different downstream locations is made. Here, slices at D and D in the wake of the turbine normal to the flow direction are investigated with respect to the mean speed magnitude for speed in direction, i.e., . Here, 〈 〉rot denotes the average over the last whole rotation. In Fig. 11, the mean velocity distribution of the wakes of both simulations are compared, with the rigid blade case in Fig. 11a and the results for the flexible blades in Fig. 11b. The velocity magnitude ranges are chosen such that the region of maximal blade deformation becomes apparent. The resulting shape of the visualized speed reduction is forming a uniform ring. The rigid blade case shows a uniform wake velocity deficit over the whole azimuth with minimal wake speed at ≈ 80 % span. This radial location of minimum speed can also be observed in the case of the flexible blades but with a clear shift between left and right, corresponding to 270 and 90∘ azimuth. Here, a velocity difference of ≈ 5 % is visible between the two sides. Also the expansion of the visualized wake speed is larger at 270 than at 90∘ azimuth. This results in a non-uniform thickness of the ring shape, indicating that the wake stream tube expansion itself is deformed in a way that the wake radius is larger at azimuthal positions of lower wake speed and smaller at azimuthal positions with higher wake speed.
Although less significant, similar results are shown for a D downstream location as shown in Fig. 12. The total influenced area seems to expand and smear out. Since mixture of fluid between the outer free stream and the inner wake is not expected within 1 to 2 diameters downstream of the turbine (Ainslie, 1988), this can be explained by increasing turbulent mixture inside the stream tube, that is created by the rotor itself. This effect is more dominant at the D downstream location compared to the D downstream location. The minimal wake speed in the flexible case is shifted slightly towards the ground (dark blue region), which is attributed to the counterclockwise rotation of the wake. Similar rotation is also present in the rigid blade case, but it is not visible here due to the uniform character of the rigid rotor wake. This rotation opposing the clockwise rotation of the turbine is based on the conservation of momentum and has been reported in many studies before (Shen et al., 2007; Zhang et al., 2012; Mühle et al., 2017). Contrary to the uniform ring shape of the rigid wake, again the shape of the wake of the flexible simulation is deformed, trending towards an oval contour.
This is consistent with the results from the aerodynamic investigation in Sect. 3.1, where lower speeds in the wake of azimuthal positions of larger induction or higher angles of attack were observed. Thus, the impact of flexible rotor blades on the aerodynamic behavior of the wind turbine is as well transported into the wake and still visible at least D downstream of the turbine.
3.3 Tip vortex trajectory in the near wake
From the findings of the aerodynamic behavior in Sect. 3.1 and the mean wind speeds analyzed in Sect. 3.2, a clear difference between azimuth positions of 90 and 270∘ is evident for flexible blades in contrast to the rigid blade representation. Apart from the difference in mean wind speeds, also the shape of the wake stream tube deviates. To quantify these variations, a deeper investigation of the blade tip vortex trajectories is made in the following.
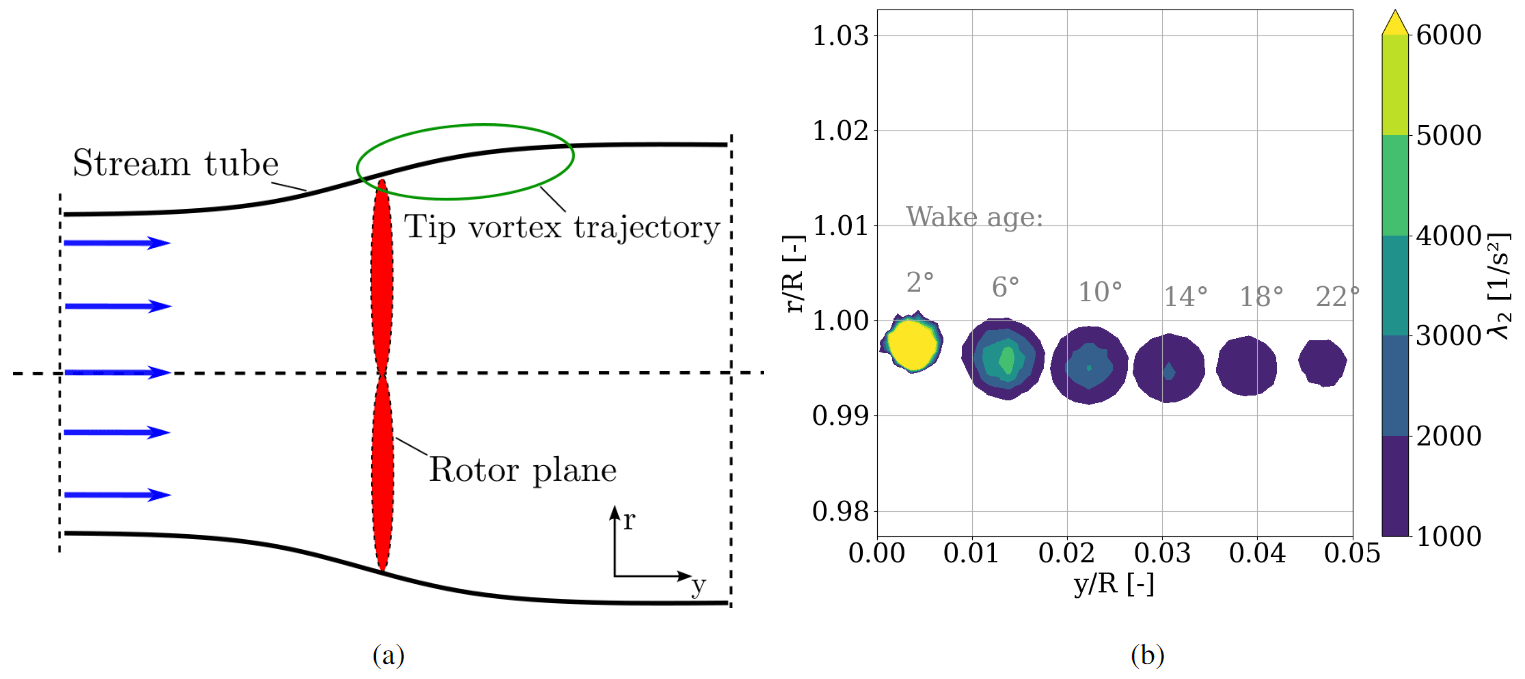
Figure 13Stream tube extraction from the λ2 field: (a) general representation of a stream tube through a rotor plane. (b) Tip vortex cores at different instants in time. Color coding bounded such that all values of λ2<1000 are shown in white, while all values of λ2≥6000 are marked in yellow.
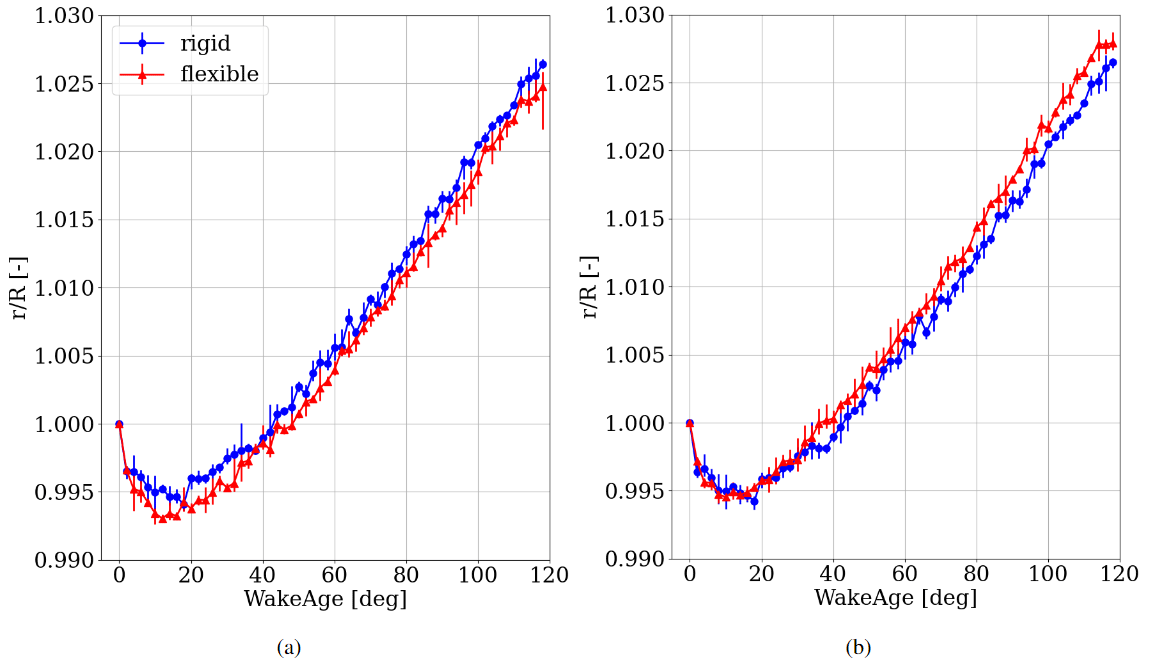
Figure 14Tip vortex trajectory for rigid blades (blue) and flexible blades (red) at (a) 90∘ azimuth and (b) 270∘ azimuth (averaged over five blade vortex trajectories), including asymmetric error bars for the maximal and minimal values of all trajectories.
In general, the stream tube, being formed by all particles of the fluid moving through the rotor plane, has a smaller diameter upstream of the turbine, where the speed is higher, than downstream of the rotor disk where the speed is smaller (Fig. 13a). The larger the reduction of wind velocity, the wider the stream tube is to be expected further downstream as a consequence of the mass conservation. A representative structure, that describes the behavior of the stream tube at the blade tip, is the trajectory of the tip vortex of the blades, since it reflects the most outboard part of the fluid moving through the rotor plane. Based on the comparison of the rigid and flexible blades in Sect. 3.2, different behavior for the wake expansion has to be visible at different azimuth positions. For that purpose, the tip vortex trajectories are extracted from the flow field in horizontal planes parallel to the inflow direction making use of the λ2 criterion described in Jeong and Hussain (1995). Figure 13b shows a representative λ2 field extracted from the rigid blade CFD simulation at different time instants orthogonal to the rotor plane. Here, defines the radial and the axial position normalized by the blade length. The wake age is defined such that at 0∘ the blade tip is located at and . During rotation, the blade passes through the slice, forming a tip vortex that is transported downstream in time, following a characteristic path. For the uniform conditions of the rigid setup, this path is independent of the blade position and can be extracted in any plane perpendicular to the rotor plane. The largest deviations of the aerodynamic quantities (Sect. 3.1) and the wake velocity reductions (Sect.3.2) are present for the azimuth angles, where the blade is positioned horizontally, i.e., 90 and 270∘. Therefore, it is also expected that the largest differences in the tip vortex trajectories are visible under these conditions. To quantify these differences and the influence of blade flexibility on the path, the vortex trajectory is analyzed for tip vortices trailed at 90 and 270∘ for the rigid and flexible simulation. This radial location of the vortex trajectory is defined by the position of maximal values of λ2 inside the vortex core.
Figure 14 shows the non-dimensionalized radial location of the tip vortex trajectory averaged over the latest five times the blade is passing through the plane of interest. The wake age is limited to 120∘, since this corresponds to the instant the next blade is slicing through the plane, forming a new vortex trajectory heading downstream normal to the rotor plane. The radial position r of the vortex core is normalized by the blade radius R. Vortex core locations are tracked at each 2∘ of the wake age, making sure that the near-wake expansion is properly resolved. A characteristic inboard tip vortex motion is visible for all cases for the first 20∘ wake age before expanding the stream tube and exceeding the actual radius of the rotor blades between 35 and 50∘ wake age. This characteristic trajectory aligns with the findings of van Kuik et al. (2014) and Herráez et al. (2017) for their investigation for rigid blades, but a comparison between rigid and flexible blades is displayed for the first time in this work.
It is visible that the radial location of the tip vortex of the rigid blade case exceeds the trajectory of the flexible blades at 90∘ azimuth in the whole investigated region (Fig. 14a), whereas opposing behavior is shown at 270∘ azimuth (Fig. 14b). A larger stream tube expansion corresponds to a higher velocity reduction and vice versa. This is supported by the findings made in Sect. 3.1, where the investigation of axial induction factors in Fig. 7 showed that the flexible blades induce a higher velocity reduction at 270∘ and induce a lower velocity reduction in the axial component at 90∘ azimuth compared to the rigid blade case. Apart from the impact on the wake flow, this affects the loading of the rotor as well. Non-uniform blade root bending moments are the consequence of each of the three blades, leading to an additional 3P main shaft and tower top excitation in the case of a full wind turbine setup. Consequently, this needs to be considered in the design process of large flexible rotors.
In the current study, three different simulations of the NREL5 MW turbine were performed using a uniform inflow velocity at rated conditions. A rigid blade setup is compared to a setup with flexible blades with gravity and flexible blades without gravity. Aerodynamic quantities have been extracted from the flow field using the “3-point” method. As with any other method, uncertainties in the obtained results are unavoidable. However, the uncertainties apply in the same manner to the rigid and flexible blade cases. Since the focus of this investigation lies in a relative comparison between the rigid and flexible cases, and not on the absolute value of the aerodynamic quantities, the possible influence of the uncertainties is considered not to be critical for our analysis.
It was shown that the aerodynamic forces of flexible rotor blades vary with the azimuth angle of each blade. This effect becomes stronger in outer parts of the blades, which contribute most to the global power output due to larger lever arms, as a consequence of the deformations induced by the gravitational loads. In uniform inflow, this effect is dominated by gravitational loading, which especially increases torsional deformations and, therefore, leads to a dynamic change in induction and AoA. Since the direction of gravitation strictly follows a 1P frequency, the resulting excitation of the blades shows a rotationally periodic sinusoidal behavior in all investigated aerodynamic quantities. With this turbine setup, the investigation reveals a much larger lift-to-drag ratio for a blade moving downwards than for an upward-moving blade, which leads to the conclusion that the investigated blade region performs better when the blade is descending.
Furthermore, it was shown that in contrast to the uniform wake of a rigid rotor, this varying aerodynamic behavior of the flexible setup is also transported into the wake, visible in rotationally periodic wake speed deficits. This deficit rotates opposing the turbine in the counterclockwise direction, leading to an asymmetry in the speed distribution varying with downstream distance. A 5 % speed difference was observed for the flexible simulation case within one rotation at D and D downstream locations. This asymmetry, visible in the deformation of the wake shape, can be quantified by the tip vortex trajectory at 90 and 270∘ azimuth within the first 120∘ of wake age. This led to the conclusion that the radial near-wake expansion downstream of the downward-moving blades is smaller for the flexible blades than for the rigid blade setup. Opposing behavior was observed in the near wake of the blades moving upward. To the authors' knowledge this effect has not been addressed before, and it can serve as a basis for the analysis of more complex operating conditions.
With wind turbines becoming larger and larger, the described influences are expected to be more pronounced, since larger diameters are directly accompanied with more flexible structures. It is therefore worth studying these effects in more detail. Thus, these effects should be taken into account for future investigations and designs of large, flexible rotor blades, since the sinusoidal varying aerodynamic forces increase the impact of alternating blade loads on various turbine components. Also during conditions, where blades operate close to stall, the deformation due to gravitational loading could potentially cause unwanted flow separation and lead to highly dynamic phenomena, e.g., dynamic stall. Additionally, the decay of the wake further downstream and the impact of blade-flexibility-driven skewed wakes on a following turbine, for example in a wind farm, should be investigated.
The raw data of the simulation results can be provided by contacting the corresponding author.
LH performed the simulations, post-processing and analysis. LJL and IH provided assistance and guidance of the underlying methods. LH wrote the paper with corrections from LJL, BS and IH.
The contact author has declared that none of the authors has any competing interests.
Publisher's note: Copernicus Publications remains neutral with regard to jurisdictional claims made in the text, published maps, institutional affiliations, or any other geographical representation in this paper. While Copernicus Publications makes every effort to include appropriate place names, the final responsibility lies with the authors.
The computations were performed on the high-performance computing system EDDY of the University of Oldenburg.
This research has been supported by the project WIMS-Cluster by the Federal Ministry of Economic Affairs and Climate Action (grant no. 0324005).
This paper was edited by Alessandro Bianchini and reviewed by two anonymous referees.
Ainslie, J. F.: Calculating the flowfield in the wake of wind turbines, J. Wind Eng. Ind. Aerod., 27, 213–224, 1988. a
Arnold, M. and Brüls, O.: Convergence of the generelized-α scheme for constrained mechanical systems, Multibody Syst. Dyn., 18, 185–202, 2007. a
Dose, B.: Fluid-structure coupled computations of wind turbine rotors by means of CFD, PhD thesis, University of Oldenburg, https://plus.orbis-oldenburg.de/permalink/f/jd1i1v/49GBVUOB_ALMA21255067610003501 (last access: 20 January 2023), 2018. a, b, c
Dose, B., Rahimi, H., Herráez, I, Stoevesandt, B., and Peinke, J.: Fluid-structure coupled computations of the NREL 5 MW wind turbine by means of CFD, Renew. Energ., 129, 591–605, https://doi.org/10.1016/j.renene.2018.05.064, 2018. a, b, c, d, e, f, g, h
Global Wind Energy Council: Global Wind Report, , https://gwec.net/global-wind-report-2021/, (last access: April 2022), 2021. a
Grinderslev, C., González Horcas, S., and Sørensen, N. M.: Fluid-structure interaction simulations of a wind turbine rotor in complex flows, valicated through field experiments, Wind Energy, 24, 1–17, https://doi.org/10.1002/we.2639, 2021. a
Guma, G., Bangga, G., Lutz, T., and Krämer, E.: Aeroelastic analysis of wind turbines under turbulent inflow conditions, Wind Energ. Sci., 6, 93–110, https://doi.org/10.5194/wes-6-93-2021, 2021. a
Hansen, M.: Aeroelastic instability problems for wind turbines, Wind Energy, 10, 551–577, 2007. a
Heinz, J. C., Sørensen, N. N., and Zahle, F.: Fluid-structure interaction computations for geometrically resolved rotor simulations using CFD, Wind Energy, 19, 2205–2221, 2016a. a
Heinz, J. C., Sørensen, N. N., Zahle, F., and Skrzypiński, W.: Vortex-induced vibrations on a modern wind turbine blade, Wind Energy, 19, 2041–2051, 2016b. a
Herráez, I., Micallef D., and van Kuik, G. A. M.: Influence of the conservative rotor loads on the near wake of a wind turbine, J. Phys Conf. Ser., 854, 012022, https://doi.org/10.1088/1742-6596/854/1/012022, 2017. a, b, c
Hodgkin, A., Laizet, S., and Deskos, G.: Numerical investigation of the influence of shear and thermal stratification on the wind turbine tip-vortex stability, Wind Energy, 25, 1–20, https://doi.org/10.1002/we.2728, 2022. a
Horcas, S. G., Sørensen, N. N., Zahle, F., Pirrung, G. R., and Barlas, T.: Vibrations of wind turbine blades in standstill: Mapping the influence of the inflow angles, Phys. Fluids, 34, 054105, https://doi.org/10.1063/5.0088036, 2022. a
HPC: EDDY, High Performance Cluster, University of Oldenburg, https://uol.de/fk5/wr/hochleistungsrechnen/hpc-facilities/eddy (last access: March 2022). a
Imiela, M., Wienke, F., Rautmann, C., Willberg, C., Hilmer, P., and Krumme, A.: Towards multidisciplinary wind turbine design using high-fidelity methods, AIAA Scitech, 33rd Wind Energy Symposium, Kissimmee, Florida, 5–9 January 2015, Conference Proceedings, 1462, https://doi.org/10.2514/6.2015-1462, 2015. a, b
Jeong, J. and Hussain, F.: On the identification of a vortex, J. Fluid Mech., 285, 69–94, 1995. a
Jonkman, J., Butterfield, S., Musial, W., and Scott, G.: Definition of a 5-MW reference wind turbine for offshore system development, NREL/TP-500-38060, https://www.nrel.gov/docs/fy09osti/38060.pdf (last access: 1 March 2023), 2009. a
Li, Y., Castro, A. M., Sinokrot, T., Prescott, W., and Carrica, P. M.: Coupled multi-body dynamics and CFD for wind turbine simulation including explicit wind turbulence, Renew. Energ., 76, 338–361, 2015. a, b, c
Liu, Y., Xiao, Q., Incecik, A., and Peyrard, C.: Aeroelastic analysis of a floating offshore wind turbine in platform-induced surge motion using a fully coupled CFD-MBD method, Wind Energy, 22, 1–20, 2019. a, b
Manolas, D. I., Chaviaropoulos, P. K., and Riziotis, V. A.: Assessment of Vortex Induced Vibrations on wind turbines, J. Phys. Conf. Ser., 2257, 012011, https://doi.org/10.1088/1742-6596/2257/1/012011, 2022. a
Micallef, D., Ferreira, C. S., Sant, T., and van Bussel, G.: Experimental and numerical investigation of tip vortex generation and evolution on horizontal axis wind turbines, Wind Energy, 19, 1485–1501, https://doi.org/10.1002/we.1932, 2016. a
Micallef, D., Ferreira, C., Herráez, I., Höning, L., Yu, W., and Capdevila, H.: Assessment of actuator disc models in predicting radial flow and wake expansion, J. Wind Eng. Ind. Aerod., 207, 104396, https://doi.org/10.1016/j.jweia.2020.104396, 2020. a, b
Mühle, F., Adaramola, M. S., and Sætran, L.: The effect of rotational direction on the wake of a wind turbine rotor-a comparison study of aligned co-and counter rotating turbine arrays, Energy Procedia, 137, 238–245, 2017. a
OpenFOAM: Open Source Field Operation and Manipulation, https://openfoam.org (last access: January 2022). a
Rahimi, H., Daniele, E., Stoevesandt, B., and Peinke, J.: Development and application of a grid generation tool for aerodynamic simulations of wind turbines, Wind Engineering, 40, 148–172, 2016a. a
Rahimi, H., Dose, B., Stoevesandt, B., and Peinke, J.: Investigation of the validity of BEM for simulation of wind turbines in complex load cases and comparison with experiment and CFD, J. Phys. Conf. Ser., 749, 012015, https://doi.org/10.1088/1742-6596/749/1/012015, 2016b. a
Rahimi, H., Hartvelt, M., Peinke, J., and Schepers, J. G.: Investigation of the current yaw engineering models for simulation of wind turbines in BEM and comparison with CFD and experiment, J. Phys. Conf. Ser., 753, 022016, https://doi.org/10.1088/1742-6596/753/2/022016, 2016c. a
Rahimi, H., Martinez Garcia, A., Stoevesandt, B., Peinke, J., and Schepers, G.: An engineering model for wind turbines under yawed conditions derived from high fidelity models, Wind Energy, 21, 618–633, 2018. a
Rajakumar, S. and Ravindran, D.: Computational fluid dynamics of windturbine blade at various angles of attack and low Reynolds number, International Journal of Engineering Science and Technology, 2, 6474–6484, https://www.ijest.info/docs/IJEST10-02-11-073.pdf (last access: 1 March 2023), 2010. a
Reissner, E.: On one-dimensional finite-strain beam theory: the plane problem, Z. Angew. Math. Phys., 23, 795–804, 1972. a
Sayed, M., Lutz, T., Krämer, E., Shayegan, S., and Wüchner, R.: Aeroelastic analysis of 10 MW wind turbine using CFD-CSF explicit FSI-coupling approach, J. Fluid. Struct., 87, 354–377, 2019. a
Schepers, J. G., Boorsma K., Sørensen, N., Voutsinas, Sieros, G., Rahimi, H., Heisselmann, H., Jost, E., Lutz, T., Maeder, T., Gonzalez, A., Ferreira, C., Stoevesandt, B., Barakos, G., Lampropoulos, N., Croce, A., and Madsen, J.: Final results from the EU project AVATAR: Aerodynamic modelling of 10 MW wind turbines, The Science of Making Torque from Wind, J. Phys. Conf. Ser., 1037, 1–18, 2018. a
Serrano-González, J. and Lacal-Arántegui, R.: Technological evolution of onshore wind turbines - a market-based analysis, Wind Energy, 19, 2171–2187, 2016. a
Shen, W. Z., Zakkam, V. A. K., Sørensen, J. N., and Appa, K.: Analysis of counter-rotating wind turbines, Journal of Physics Conference Series, 75, 2007. a
Simo, J. C.: A finite strain beam formulation. The three-dimensional dynamic problem, Part I, Comput. Meth. Appl. Mech. Eng., 49, 55–70, 1985. a
Spalart, P. R., Deck, S., Shur, M. L., Squires, K. D., Strelets, M. K., and Travin, A.: A New Version of Detached-eddy Simulation, Resistant to Ambiguous Grid Densities, Theor. Comp. Fluid Dyn., 20, 181–195, 2006. a
U.S. Department of Energy: Land-Based Wind Market Report: 2021 Edition, U.S. Department of Energy, Office of Energy Efficiency & Renewable Energy, https://www.energy.gov/sites/default/files/2021-08/Land-Based Wind Market Report 2021 Edition_Full Report_FINAL.pdf (last access: 1 March 2023), 2021. a
van Kuik, G. A. M., Micallef, D., Herráez, I., van Zuijlen, A. H., and Ragni, D.: The role of conservative forces in rotor aerodynamics, J. Fluid Mech., 750, 284–315, 2014. a, b, c
WindEurope Business Intelligence: Wind Energy in Europe. 2021 Statistics and the outlook for 2022–2026, February 2022, https://windeurope.org/intelligence-platform/product/wind-energy-in-europe-2021-statistics-and-the-outlook-for-2022-2026/ (last access: 10 April 2022), 2022. a
Yu, D. O. and Kwon, O. J.: Time-accurate aeroelastic simulations of a wind turbine in yaw and shear using a coupled CFD-CSD method, J. Phys., 22, 1–20, 2014. a, b, c
Zhang, W., Markfort, C. D., and Porté-Agel, F.: Near-wake flow structure downwind of a wind turbine in a turbulent boundary layer, Exp. Fluids, 52, 1219–1235, 2012. a